Genotypic Variation in a Breeding Population of Yellow … of Melilotus, including yellow sweet...
10
ORIGINAL RESEARCH published: 12 July 2016 doi: 10.3389/fpls.2016.00972 Frontiers in Plant Science | www.frontiersin.org 1 July 2016 | Volume 7 | Article 972 Edited by: Nicolas Rispail, Institute for Sustainable Agriculture - CSIC, Spain Reviewed by: Inger Martinussen, Norwegian Institute of Bioeconomy Research, Norway Juan Marcelo Zabala, Universidad Nacional del Litoral, Argentina *Correspondence: Jiyu Zhang [email protected]; Yanrong Wang [email protected] † These authors have contributed equally to this work. Specialty section: This article was submitted to Crop Science and Horticulture, a section of the journal Frontiers in Plant Science Received: 16 December 2015 Accepted: 20 June 2016 Published: 12 July 2016 Citation: Luo K, Jahufer MZZ, Wu F, Di H, Zhang D, Meng X, Zhang J and Wang Y (2016) Genotypic Variation in a Breeding Population of Yellow Sweet Clover (Melilotus officinalis). Front. Plant Sci. 7:972. doi: 10.3389/fpls.2016.00972 Genotypic Variation in a Breeding Population of Yellow Sweet Clover (Melilotus officinalis) Kai Luo 1† , M. Z. Z. Jahufer 2† , Fan Wu 1 , Hongyan Di 1 , Daiyu Zhang 1 , Xuanchen Meng 1 , Jiyu Zhang 1 * and Yanrong Wang 1 * 1 State Key Laborotary of Grassland Agro-Ecosystems, College of Pastoral Agriculture Science and Technology, Lanzhou University, Lanzhou, China, 2 AgResearch Limited, Grasslands Research Centre, Palmerston North, New Zealand Yellow sweet clover is a widely spread legume species that has potential to be used as a forage crop in Western China. However, limited information is available on the genetic variation for herbage yield, key morphological traits, and coumarin content. In this study, 40 half sib (HS) families of M. officinalis were evaluated for genotypic variation and phenotypic and genotypic correlation for the traits: LS (leaf to stem ratio), SV (spring vigor), LA (leaf area), PH (plant height), DW (herbage dry weight), SD (stem diameter), SN (stem number), Cou (coumarin content), SY (seed yield), across two locations, Yuzhong and Linze, in Western China. There was significant (P < 0.05) genotypic variation among the HS families for all traits. There was also significant (P < 0.05) genotype-by-environment interaction for the traits DW, PH, SD, SN, and SV. The estimates of HS family mean repeatability across two locations ranged from 0.32 for SN to 0.89 for LA. Pattern analysis generated four HS family groups where group 3 consisted of families with above average expression for DW and below average expression for Cou. The breeding population developed by polycrossing the selected HS families within group 3 will provide a significant breeding pool for M. officinalis cultivar development in China. Keywords: forage breeding, genotypic variation, genotype-by-environment interactions, correlation coefficient, coumarin INTRODUCTION Yellow sweet clover known as field melilot or yellow melilot, is an annual or biennial herb that belongs to the Fabaceae family. It is native to temperate and tropical Asia, and Europe (GRIN, 2000). Melilotus officinalis is one of the most common species in the Melilotus genus. This species has adaptation to environmental constraints such as drought and cold (Turkington et al., 1978) and salinity (Sherif, 2009). Melilotus is used as a ground cover in depleted soils (Allen and Allen, 1981), especially in moderately saline areas where traditional forage legumes cannot be grown (Maddaloni, 1986). Melilotus officinalis usually occurs in the northern region of China, where it is used as green manure for soil fertility improvement and also as a medicinal plant. Species of Melilotus, including yellow sweet clover, have not been widely used in forage production due to their high coumarin content. Coumarin, a secondary plant metabolite, is associated with dicoumarol production. Dicoumarol is an anticoagulant that can cause a haemorrhagic condition known as sweet clover disease (Evans and Kearney, 2003;
Transcript of Genotypic Variation in a Breeding Population of Yellow … of Melilotus, including yellow sweet...
ORIGINAL RESEARCHpublished: 12 July 2016
doi: 10.3389/fpls.2016.00972
Frontiers in Plant Science | www.frontiersin.org 1 July 2016 | Volume 7 | Article 972
Edited by:
Nicolas Rispail,
Institute for Sustainable
Agriculture - CSIC, Spain
Reviewed by:
Inger Martinussen,
Norwegian Institute of Bioeconomy
Research, Norway
Juan Marcelo Zabala,
Universidad Nacional del Litoral,
Argentina
*Correspondence:
Jiyu Zhang
Yanrong Wang
†These authors have contributed
equally to this work.
Specialty section:
This article was submitted to
Crop Science and Horticulture,
a section of the journal
Frontiers in Plant Science
Received: 16 December 2015
Accepted: 20 June 2016
Published: 12 July 2016
Citation:
Luo K, Jahufer MZZ, Wu F, Di H,
Zhang D, Meng X, Zhang J and
Wang Y (2016) Genotypic Variation in
a Breeding Population of Yellow Sweet
Clover (Melilotus officinalis).
Front. Plant Sci. 7:972.
doi: 10.3389/fpls.2016.00972
Genotypic Variation in a BreedingPopulation of Yellow Sweet Clover(Melilotus officinalis)Kai Luo 1†, M. Z. Z. Jahufer 2†, Fan Wu 1, Hongyan Di 1, Daiyu Zhang 1, Xuanchen Meng 1,
Jiyu Zhang 1* and Yanrong Wang 1*
1 State Key Laborotary of Grassland Agro-Ecosystems, College of Pastoral Agriculture Science and Technology, Lanzhou
University, Lanzhou, China, 2 AgResearch Limited, Grasslands Research Centre, Palmerston North, New Zealand
Yellow sweet clover is a widely spread legume species that has potential to be used
as a forage crop in Western China. However, limited information is available on the
genetic variation for herbage yield, key morphological traits, and coumarin content.
In this study, 40 half sib (HS) families of M. officinalis were evaluated for genotypic
variation and phenotypic and genotypic correlation for the traits: LS (leaf to stem ratio),
SV (spring vigor), LA (leaf area), PH (plant height), DW (herbage dry weight), SD (stem
diameter), SN (stem number), Cou (coumarin content), SY (seed yield), across two
locations, Yuzhong and Linze, in Western China. There was significant (P < 0.05)
genotypic variation among the HS families for all traits. There was also significant
(P < 0.05) genotype-by-environment interaction for the traits DW, PH, SD, SN, and
SV. The estimates of HS family mean repeatability across two locations ranged from
0.32 for SN to 0.89 for LA. Pattern analysis generated four HS family groups where
group 3 consisted of families with above average expression for DW and below average
expression for Cou. The breeding population developed by polycrossing the selected
HS families within group 3 will provide a significant breeding pool forM. officinalis cultivar
development in China.
Keywords: forage breeding, genotypic variation, genotype-by-environment interactions, correlation coefficient,
coumarin
INTRODUCTION
Yellow sweet clover known as field melilot or yellow melilot, is an annual or biennial herb thatbelongs to the Fabaceae family. It is native to temperate and tropical Asia, and Europe (GRIN,2000). Melilotus officinalis is one of the most common species in the Melilotus genus. This specieshas adaptation to environmental constraints such as drought and cold (Turkington et al., 1978) andsalinity (Sherif, 2009).Melilotus is used as a ground cover in depleted soils (Allen and Allen, 1981),especially inmoderately saline areas where traditional forage legumes cannot be grown (Maddaloni,1986).Melilotus officinalis usually occurs in the northern region of China, where it is used as greenmanure for soil fertility improvement and also as a medicinal plant.
Species of Melilotus, including yellow sweet clover, have not been widely used in forageproduction due to their high coumarin content. Coumarin, a secondary plant metabolite,is associated with dicoumarol production. Dicoumarol is an anticoagulant that can causea haemorrhagic condition known as sweet clover disease (Evans and Kearney, 2003;

Luo et al. Genotypic Variation of Melilotus officinalis
Nair et al., 2010). Therefore, the success of forage cultivardevelopment based on any of the Melilotus species will dependon a combination of increasing dry matter production anddecreasing coumarin content. A number of cultivars ofMelilotushave been released to date; Acuma, Cumino, Denta, Polara(Smith and Gorz, 1965; Goplen, 1971) for M. albus and Norgold(Goplen, 1981), N28, N29 (Gorz et al., 1992) for M. officinalis.The Melilotus breeding program at Lanzhou University isspecifically focused on the development of new cultivars withadaptation to the vast temperate grazing environments of China(Luo et al., 2014).
In any plant breeding program, the rate of genetic gaindepends on the genetic diversity for a given trait in the breedingpopulation (Hallauer and Miranda, 1981). Information on themagnitude of genetic variation for key plant attributes inbreeding programs will enhance the development of appropriatebreeding strategies to achieve maximum genetic gain (Moll andStuber, 1974). Jahufer and Casler (2015) evaluated the relativemerit in genetic gain using single trait selection, correlatedresponse to selection and index selection, based on estimatedgenetic variation for a range of morphological and quality traitsin switch grass (Panicum virgatum L.). Genetic variation for keytraits have been reported for some of the important forage grassesand legumes: ryegrass (Breese and Hayward, 1972), tall fescue(Piano et al., 2007), white clover (Jahufer et al., 2002), alfalfa(Riday and Brummer, 2007).
There is a lack of quantitative genetic information forMelilotus. Few studies have been carried out on the geneticvariation for agronomic traits in Melilotus species (Ivanovand Chetvertnykh, 1980; Sagalbekov, 1980). Nair et al. (2010)reported genotypic variation for coumarin content among 149accessions of 15 Melilotus species. This study demonstrated thepresence of potential genetic variation for coumarin contentin Melilotus germplasm useful for breeding. However, breedingMelilotus species as a forage crop needs to focus on not onlycoumarin content but also biomass and associated traits. Thereis also a lack of information on the magnitude of genotype-by-environment interaction effects in Melilotus, which will beimportant for breeding for broad adaptation (Cooper et al.,1993b).
The objective of our study was to conduct a preliminaryassessment of the performance of half sib (HS) families ofMelilotus officinalis across two contrasting locations to: (a)estimate genotypic variation for key traits, and (b) identifyfamilies with a combination of superior agronomic performanceand low coumarin expression in comparison to two commercialcontrols.
MATERIALS AND METHODS
Plant MaterialSix germplasm accessions (PI 552553 and PI 552554, PI 595394,PI 634019, Ames 22891, and Ames 25658) were selected from aset of 51 accessions that were evaluated for biomass production,agronomy and low coumarin, in Yuzhong, Gansu Province,during 2012–2013 (results not presented). Elite genotypesrepresenting each of the germplasm accessions were polycrossed
in isolation, using honey bees, to generate a breeding populationto be used for cultivar development. A total of 40 HS familieswere generated by harvesting each of the genotypes individually.All harvested seeds from the individual genotypes were keptseparately as individual HS families.
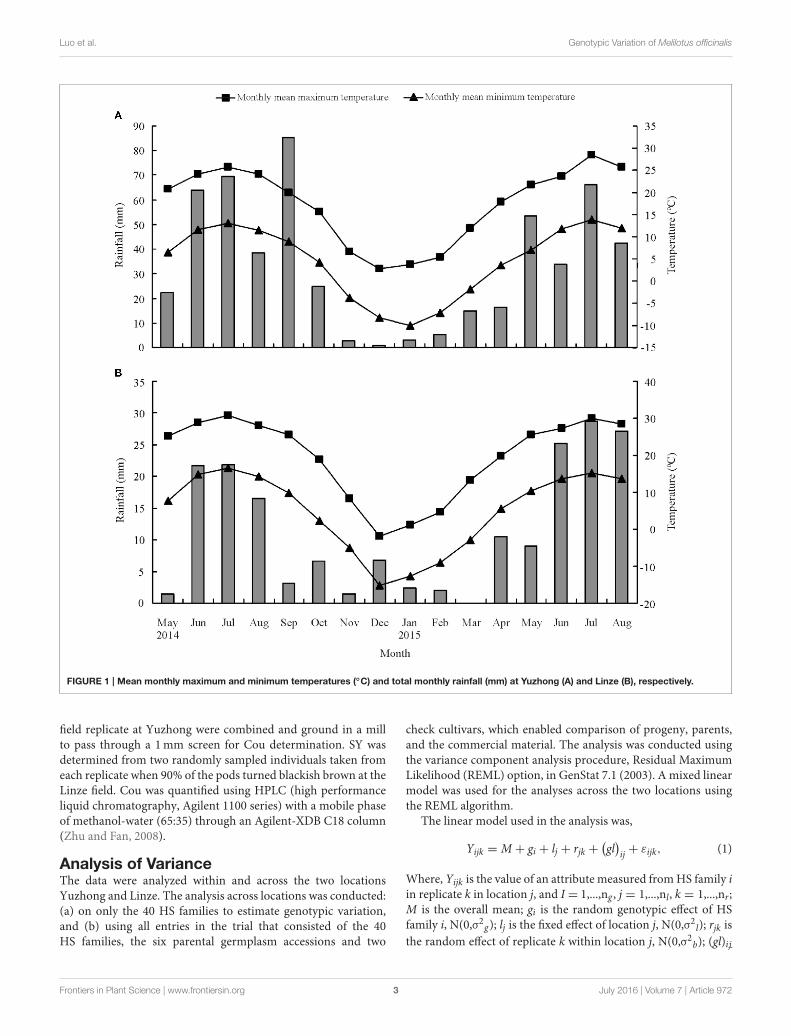
Field TrialsThe M. officinalis HS families were established at two locations:Yuzhong (104◦09′ E, 35◦89′ N, elevation 1 653m a.s.l.) andLinze (100◦02′ E, 39◦15′ N, elevation 1 390m a.s.l.) in GansuProvince, China. There are different climate conditions betweenYuzhong and linze. Yuzhong in Loess Plateau region is a mediumtemperate semi-arid climate, whereas Linze in the Hexi Corridoris typical desert climate and characterized by an arid climate (Suet al., 2007; Hu et al., 2012; Li et al., 2014). The average annualprecipitation in Yuzhong is 295mm and in Linze is only 117mm.The mean monthly minimum and maximum temperatures, andtotal monthly rainfall during the trial period at the two locationsare shown in Figure 1.
The soil type at each location is loessal soil at Yuzhong andmeadow soil at Linze. The saline-alkali degree was much higherin Linze than in Yuzhong, the salinity is 1.8 ppt in Linze and 0.5ppt in Yuzhong. Initial soil conditions in Yuzhong and Linze are:pH 7.0 and 7.5, total N of 0.756 g/kg and 0.803 g/kg, total P of0.752 and 0.708 g/kg, respectively.
At each location, the experimental plots were arranged in arandomized complete block design containing three replicates.Each replicate consisted of the 40 HS families the six parentalgermplasm accessions and two commercial checks. The originsof these entries are provided in Table 1. The two trials were sownin 15–18 June 2014. The experimental plot size for each entry was2.4 m2 (0.8 × 3 m). Within each plot, the seed was planted at aspacing of 30 cmwithin-rows and 60 cm between-rows. The plotswere fertilized with 150 kg (NH4)2HPO4 ha
−1 after sowing.
MeasurementsThe traits measured were: LS, leaf to stem ratio; SV, spring vigor;LA, leaf area (cm2); PH, plant height (cm); DW, herbage dryweight (g/plant); SD, stem diameter (cm); SN, stem number; Cou,coumarin (% of dry matter); SY, seed yield (g/plant). All the traitswere measured in the second year (2015).
Visual scoring for SV was based on a scale of 1 to 5 (1= low; 5 = high). The morphological traits (PH, SN, SD, andLA) were measured at the flowering stage (50% of the plantshad open flowers), resulting in a minimum of three individualsper replicate. LA was measured from three middle leaflets perplant by using a flatbed scanner (EPSON GT-15000) and aWinSEEDLE 2011 image analysis system (Regent InstrumentsInc.). Individual plant was harvested for DWmeasurement at theflowering stage after measuring morphological traits. At harvest,three randomly sampled plants from each replicate were cutoff at 3 cm above the soil, placed in paper bags and dried atroom temperature (about 20–25◦C) with good ventilation untilno change in weight was recorded. After measuring DW, thedried samples were hand separated into leaf blade and stem(including the inflorescence and leaf sheath) components andweighted to determine the LS ratio. Three sub samples from each
Frontiers in Plant Science | www.frontiersin.org 2 July 2016 | Volume 7 | Article 972
Luo et al. Genotypic Variation of Melilotus officinalis
FIGURE 1 | Mean monthly maximum and minimum temperatures (◦C) and total monthly rainfall (mm) at Yuzhong (A) and Linze (B), respectively.
field replicate at Yuzhong were combined and ground in a millto pass through a 1mm screen for Cou determination. SY wasdetermined from two randomly sampled individuals taken fromeach replicate when 90% of the pods turned blackish brown at theLinze field. Cou was quantified using HPLC (high performanceliquid chromatography, Agilent 1100 series) with a mobile phaseof methanol-water (65:35) through an Agilent-XDB C18 column(Zhu and Fan, 2008).
Analysis of VarianceThe data were analyzed within and across the two locationsYuzhong and Linze. The analysis across locations was conducted:(a) on only the 40 HS families to estimate genotypic variation,and (b) using all entries in the trial that consisted of the 40HS families, the six parental germplasm accessions and two
check cultivars, which enabled comparison of progeny, parents,and the commercial material. The analysis was conducted usingthe variance component analysis procedure, Residual MaximumLikelihood (REML) option, in GenStat 7.1 (2003). A mixed linearmodel was used for the analyses across the two locations usingthe REML algorithm.
The linear model used in the analysis was,
Yijk = M + gi + lj + rjk +(
gl)
ij+ εijk, (1)
Where, Yijk is the value of an attribute measured fromHS family iin replicate k in location j, and I = 1,...,ng , j = 1,...,nl, k = 1,...,nr ;M is the overall mean; gi is the random genotypic effect of HSfamily i, N(0,σ2g); lj is the fixed effect of location j, N(0,σ2l); rjk is
the random effect of replicate k within location j, N(0,σ2b); (gl)ij
Frontiers in Plant Science | www.frontiersin.org 3 July 2016 | Volume 7 | Article 972
Luo et al. Genotypic Variation of Melilotus officinalis
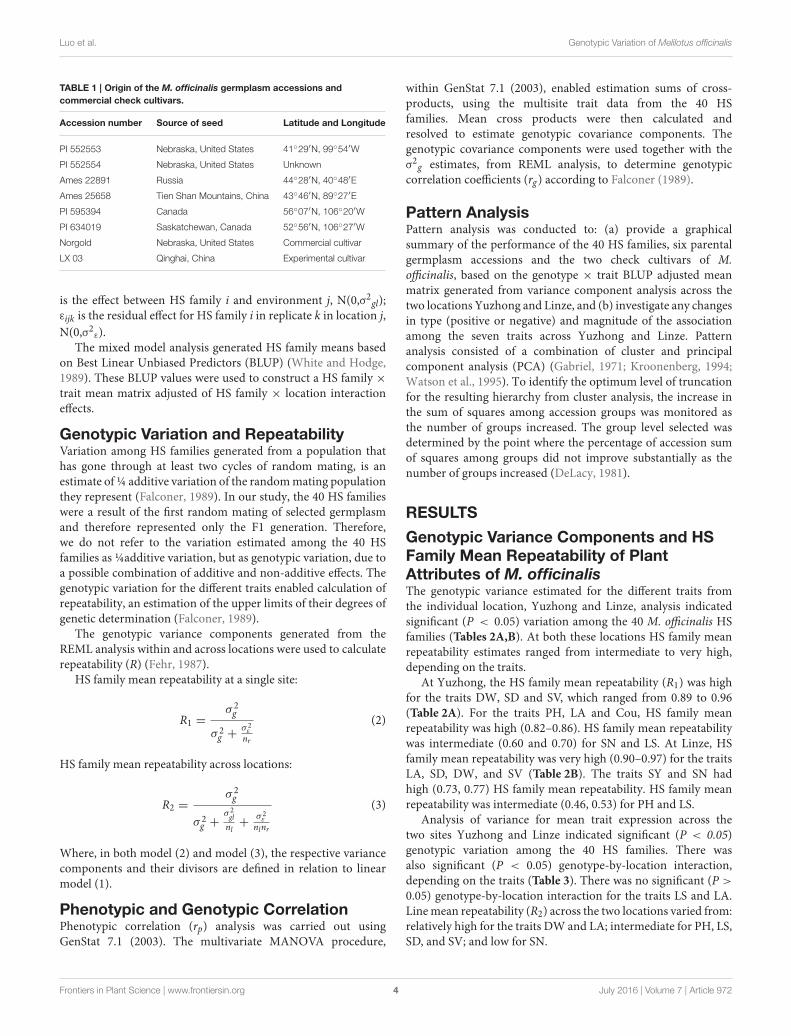
TABLE 1 | Origin of the M. officinalis germplasm accessions and
commercial check cultivars.
Accession number Source of seed Latitude and Longitude
PI 552553 Nebraska, United States 41◦29′N, 99◦54′W
PI 552554 Nebraska, United States Unknown
Ames 22891 Russia 44◦28′N, 40◦48′E
Ames 25658 Tien Shan Mountains, China 43◦46′N, 89◦27′E
PI 595394 Canada 56◦07′N, 106◦20′W
PI 634019 Saskatchewan, Canada 52◦56′N, 106◦27′W
Norgold Nebraska, United States Commercial cultivar
LX 03 Qinghai, China Experimental cultivar
is the effect between HS family i and environment j, N(0,σ2gl);εijk is the residual effect for HS family i in replicate k in location j,
N(0,σ2ε).The mixed model analysis generated HS family means based
on Best Linear Unbiased Predictors (BLUP) (White and Hodge,1989). These BLUP values were used to construct a HS family ×trait mean matrix adjusted of HS family × location interactioneffects.
Genotypic Variation and RepeatabilityVariation among HS families generated from a population thathas gone through at least two cycles of random mating, is anestimate of ¼ additive variation of the randommating populationthey represent (Falconer, 1989). In our study, the 40 HS familieswere a result of the first random mating of selected germplasmand therefore represented only the F1 generation. Therefore,we do not refer to the variation estimated among the 40 HSfamilies as ¼additive variation, but as genotypic variation, due toa possible combination of additive and non-additive effects. Thegenotypic variation for the different traits enabled calculation ofrepeatability, an estimation of the upper limits of their degrees ofgenetic determination (Falconer, 1989).
The genotypic variance components generated from theREML analysis within and across locations were used to calculaterepeatability (R) (Fehr, 1987).
HS family mean repeatability at a single site:
R1 =σ2g
σ 2g +
σ 2ε
nr
(2)
HS family mean repeatability across locations:
R2 =σ2g
σ 2g +
σ2gl
nl+
σ 2ε
nlnr
(3)
Where, in both model (2) and model (3), the respective variancecomponents and their divisors are defined in relation to linearmodel (1).
Phenotypic and Genotypic CorrelationPhenotypic correlation (rp) analysis was carried out usingGenStat 7.1 (2003). The multivariate MANOVA procedure,
within GenStat 7.1 (2003), enabled estimation sums of cross-products, using the multisite trait data from the 40 HSfamilies. Mean cross products were then calculated andresolved to estimate genotypic covariance components. Thegenotypic covariance components were used together with theσ2g estimates, from REML analysis, to determine genotypic
correlation coefficients (rg) according to Falconer (1989).
Pattern AnalysisPattern analysis was conducted to: (a) provide a graphicalsummary of the performance of the 40 HS families, six parentalgermplasm accessions and the two check cultivars of M.officinalis, based on the genotype × trait BLUP adjusted meanmatrix generated from variance component analysis across thetwo locations Yuzhong and Linze, and (b) investigate any changesin type (positive or negative) and magnitude of the associationamong the seven traits across Yuzhong and Linze. Patternanalysis consisted of a combination of cluster and principalcomponent analysis (PCA) (Gabriel, 1971; Kroonenberg, 1994;Watson et al., 1995). To identify the optimum level of truncationfor the resulting hierarchy from cluster analysis, the increase inthe sum of squares among accession groups was monitored asthe number of groups increased. The group level selected wasdetermined by the point where the percentage of accession sumof squares among groups did not improve substantially as thenumber of groups increased (DeLacy, 1981).
RESULTS
Genotypic Variance Components and HSFamily Mean Repeatability of PlantAttributes of M. officinalisThe genotypic variance estimated for the different traits fromthe individual location, Yuzhong and Linze, analysis indicatedsignificant (P < 0.05) variation among the 40 M. officinalis HSfamilies (Tables 2A,B). At both these locations HS family meanrepeatability estimates ranged from intermediate to very high,depending on the traits.
At Yuzhong, the HS family mean repeatability (R1) was highfor the traits DW, SD and SV, which ranged from 0.89 to 0.96(Table 2A). For the traits PH, LA and Cou, HS family meanrepeatability was high (0.82–0.86). HS family mean repeatabilitywas intermediate (0.60 and 0.70) for SN and LS. At Linze, HSfamily mean repeatability was very high (0.90–0.97) for the traitsLA, SD, DW, and SV (Table 2B). The traits SY and SN hadhigh (0.73, 0.77) HS family mean repeatability. HS family meanrepeatability was intermediate (0.46, 0.53) for PH and LS.
Analysis of variance for mean trait expression across thetwo sites Yuzhong and Linze indicated significant (P < 0.05)genotypic variation among the 40 HS families. There wasalso significant (P < 0.05) genotype-by-location interaction,depending on the traits (Table 3). There was no significant (P >
0.05) genotype-by-location interaction for the traits LS and LA.Linemean repeatability (R2) across the two locations varied from:relatively high for the traits DW and LA; intermediate for PH, LS,SD, and SV; and low for SN.
Frontiers in Plant Science | www.frontiersin.org 4 July 2016 | Volume 7 | Article 972
Luo et al. Genotypic Variation of Melilotus officinalis
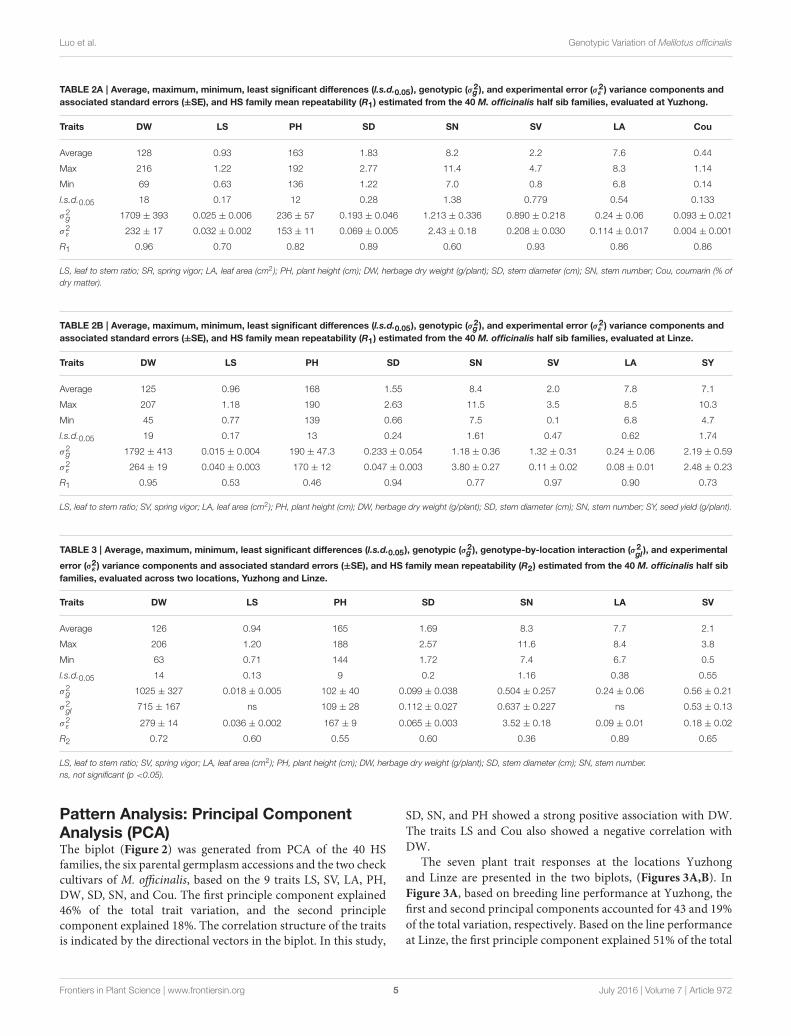
TABLE 2A | Average, maximum, minimum, least significant differences (l.s.d.0.05), genotypic (σ2g ), and experimental error (σ2
ε) variance components and
associated standard errors (±SE), and HS family mean repeatability (R1) estimated from the 40 M. officinalis half sib families, evaluated at Yuzhong.
Traits DW LS PH SD SN SV LA Cou
Average 128 0.93 163 1.83 8.2 2.2 7.6 0.44
Max 216 1.22 192 2.77 11.4 4.7 8.3 1.14
Min 69 0.63 136 1.22 7.0 0.8 6.8 0.14
l.s.d.0.05 18 0.17 12 0.28 1.38 0.779 0.54 0.133
σ2g 1709 ± 393 0.025 ± 0.006 236 ± 57 0.193 ± 0.046 1.213 ± 0.336 0.890 ± 0.218 0.24 ± 0.06 0.093 ± 0.021
σ2ε
232 ± 17 0.032 ± 0.002 153 ± 11 0.069 ± 0.005 2.43 ± 0.18 0.208 ± 0.030 0.114 ± 0.017 0.004 ± 0.001
R1 0.96 0.70 0.82 0.89 0.60 0.93 0.86 0.86
LS, leaf to stem ratio; SR, spring vigor; LA, leaf area (cm2 ); PH, plant height (cm); DW, herbage dry weight (g/plant); SD, stem diameter (cm); SN, stem number; Cou, coumarin (% of
dry matter).
TABLE 2B | Average, maximum, minimum, least significant differences (l.s.d.0.05), genotypic (σ2g ), and experimental error (σ2
ε) variance components and
associated standard errors (±SE), and HS family mean repeatability (R1) estimated from the 40 M. officinalis half sib families, evaluated at Linze.
Traits DW LS PH SD SN SV LA SY
Average 125 0.96 168 1.55 8.4 2.0 7.8 7.1
Max 207 1.18 190 2.63 11.5 3.5 8.5 10.3
Min 45 0.77 139 0.66 7.5 0.1 6.8 4.7
l.s.d.0.05 19 0.17 13 0.24 1.61 0.47 0.62 1.74
σ2g 1792 ± 413 0.015 ± 0.004 190 ± 47.3 0.233 ± 0.054 1.18 ± 0.36 1.32 ± 0.31 0.24 ± 0.06 2.19 ± 0.59
σ2ε
264 ± 19 0.040 ± 0.003 170 ± 12 0.047 ± 0.003 3.80 ± 0.27 0.11 ± 0.02 0.08 ± 0.01 2.48 ± 0.23
R1 0.95 0.53 0.46 0.94 0.77 0.97 0.90 0.73
LS, leaf to stem ratio; SV, spring vigor; LA, leaf area (cm2 ); PH, plant height (cm); DW, herbage dry weight (g/plant); SD, stem diameter (cm); SN, stem number; SY, seed yield (g/plant).
TABLE 3 | Average, maximum, minimum, least significant differences (l.s.d.0.05), genotypic (σ2g ), genotype-by-location interaction (σ2
gl), and experimental
error (σ2ε) variance components and associated standard errors (±SE), and HS family mean repeatability (R2) estimated from the 40 M. officinalis half sib
families, evaluated across two locations, Yuzhong and Linze.
Traits DW LS PH SD SN LA SV
Average 126 0.94 165 1.69 8.3 7.7 2.1
Max 206 1.20 188 2.57 11.6 8.4 3.8
Min 63 0.71 144 1.72 7.4 6.7 0.5
l.s.d.0.05 14 0.13 9 0.2 1.16 0.38 0.55
σ2g 1025 ± 327 0.018 ± 0.005 102 ± 40 0.099 ± 0.038 0.504 ± 0.257 0.24 ± 0.06 0.56 ± 0.21
σ2gl
715 ± 167 ns 109 ± 28 0.112 ± 0.027 0.637 ± 0.227 ns 0.53 ± 0.13
σ2ε
279 ± 14 0.036 ± 0.002 167 ± 9 0.065 ± 0.003 3.52 ± 0.18 0.09 ± 0.01 0.18 ± 0.02
R2 0.72 0.60 0.55 0.60 0.36 0.89 0.65
LS, leaf to stem ratio; SV, spring vigor; LA, leaf area (cm2 ); PH, plant height (cm); DW, herbage dry weight (g/plant); SD, stem diameter (cm); SN, stem number.
ns, not significant (p <0.05).
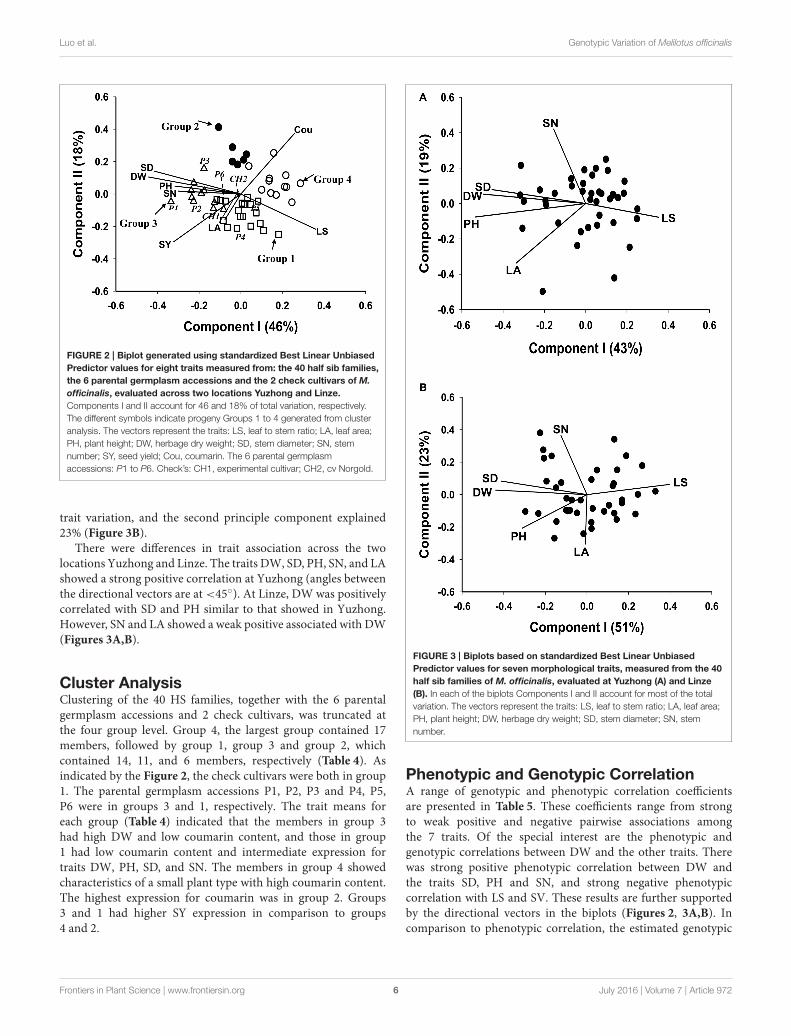
Pattern Analysis: Principal ComponentAnalysis (PCA)The biplot (Figure 2) was generated from PCA of the 40 HSfamilies, the six parental germplasm accessions and the two checkcultivars of M. officinalis, based on the 9 traits LS, SV, LA, PH,DW, SD, SN, and Cou. The first principle component explained46% of the total trait variation, and the second principlecomponent explained 18%. The correlation structure of the traitsis indicated by the directional vectors in the biplot. In this study,
SD, SN, and PH showed a strong positive association with DW.
The traits LS and Cou also showed a negative correlation with
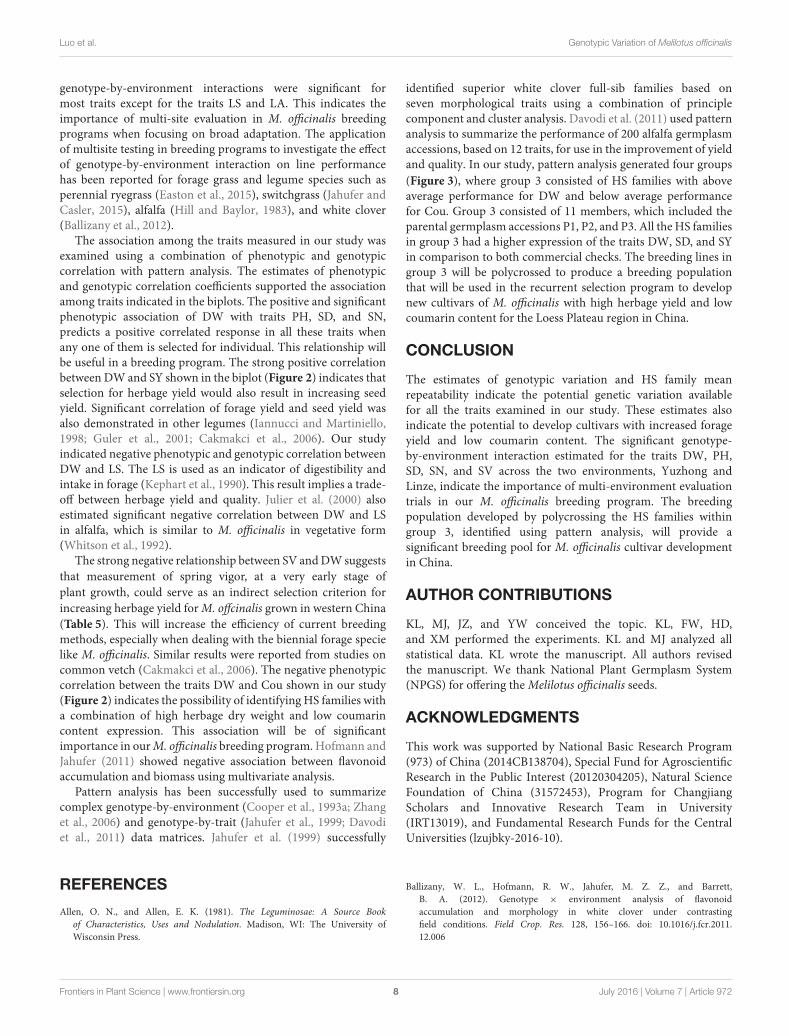
DW.The seven plant trait responses at the locations Yuzhong
and Linze are presented in the two biplots, (Figures 3A,B). In
Figure 3A, based on breeding line performance at Yuzhong, the
first and second principal components accounted for 43 and 19%
of the total variation, respectively. Based on the line performance
at Linze, the first principle component explained 51% of the total
Frontiers in Plant Science | www.frontiersin.org 5 July 2016 | Volume 7 | Article 972
Luo et al. Genotypic Variation of Melilotus officinalis
FIGURE 2 | Biplot generated using standardized Best Linear Unbiased
Predictor values for eight traits measured from: the 40 half sib families,
the 6 parental germplasm accessions and the 2 check cultivars of M.
officinalis, evaluated across two locations Yuzhong and Linze.
Components I and II account for 46 and 18% of total variation, respectively.
The different symbols indicate progeny Groups 1 to 4 generated from cluster
analysis. The vectors represent the traits: LS, leaf to stem ratio; LA, leaf area;
PH, plant height; DW, herbage dry weight; SD, stem diameter; SN, stem
number; SY, seed yield; Cou, coumarin. The 6 parental germplasm
accessions: P1 to P6. Check’s: CH1, experimental cultivar; CH2, cv Norgold.
trait variation, and the second principle component explained23% (Figure 3B).
There were differences in trait association across the twolocations Yuzhong and Linze. The traits DW, SD, PH, SN, and LAshowed a strong positive correlation at Yuzhong (angles betweenthe directional vectors are at <45◦). At Linze, DW was positivelycorrelated with SD and PH similar to that showed in Yuzhong.However, SN and LA showed a weak positive associated with DW(Figures 3A,B).
Cluster AnalysisClustering of the 40 HS families, together with the 6 parentalgermplasm accessions and 2 check cultivars, was truncated atthe four group level. Group 4, the largest group contained 17members, followed by group 1, group 3 and group 2, whichcontained 14, 11, and 6 members, respectively (Table 4). Asindicated by the Figure 2, the check cultivars were both in group1. The parental germplasm accessions P1, P2, P3 and P4, P5,P6 were in groups 3 and 1, respectively. The trait means foreach group (Table 4) indicated that the members in group 3had high DW and low coumarin content, and those in group1 had low coumarin content and intermediate expression fortraits DW, PH, SD, and SN. The members in group 4 showedcharacteristics of a small plant type with high coumarin content.The highest expression for coumarin was in group 2. Groups3 and 1 had higher SY expression in comparison to groups4 and 2.
FIGURE 3 | Biplots based on standardized Best Linear Unbiased
Predictor values for seven morphological traits, measured from the 40
half sib families of M. officinalis, evaluated at Yuzhong (A) and Linze
(B). In each of the biplots Components I and II account for most of the total
variation. The vectors represent the traits: LS, leaf to stem ratio; LA, leaf area;
PH, plant height; DW, herbage dry weight; SD, stem diameter; SN, stem
number.
Phenotypic and Genotypic CorrelationA range of genotypic and phenotypic correlation coefficientsare presented in Table 5. These coefficients range from strongto weak positive and negative pairwise associations amongthe 7 traits. Of the special interest are the phenotypic andgenotypic correlations between DW and the other traits. Therewas strong positive phenotypic correlation between DW andthe traits SD, PH and SN, and strong negative phenotypiccorrelation with LS and SV. These results are further supportedby the directional vectors in the biplots (Figures 2, 3A,B). Incomparison to phenotypic correlation, the estimated genotypic
Frontiers in Plant Science | www.frontiersin.org 6 July 2016 | Volume 7 | Article 972

Luo et al. Genotypic Variation of Melilotus officinalis
TABLE 4 | Trait means for each of the 4 half sib family groups generated from pattern analysis.
Group No. members DW LS PH SD SN LA SV Cou SY
1 14 104 0.995 162 1.45 7.50 7.74 2.52 0.365 6.07
2 6 123 0.849 164 1.80 7.75 7.58 2.41 1.986 1.99
3 11 157 0.905 168 2.00 8.73 7.87 1.65 0.405 6.54
4 17 73 1.125 150 1.20 7.49 7.58 3.47 1.561 3.00
LS, leaf to stem ratio; SR, spring vigor; LA, leaf area (cm2 ); PH, plant height (cm); DW, herbage dry weight (g/plant); SD, stem diameter (cm); SN, stem number; Cou, coumarin (% of
dry matter); SY, seed yield (g/plant).
TABLE 5 | Genotypic (rg) (lower triangle) and phenotypic (rP) (upper triangle) correlation coefficients, between traits base on the 40 M. officinalis half sib
families, the six parental germplasm accessions and the two check cultivars, evaluated across two locations, Yuzhong and Linze.
DW LA L_S PH SD SN SV
DW 0.086 −0.371** 0.477** 0.658** 0.336** −0.835**
LA 0.021 −0.023 0.116 0.166* −0.070 −0.121
L_S −0.129 −0.003 −0.227 −0.303 −0.037 0.330**
PH 0.082 0.037 −0.131 0.130* 0.127* −0.510**
SD 0.051 0.011 −0.042 0.029 0.264** −0.528**
SN 0.116 −0.045 −0.047 0.019 0.035 −0.361**
SR −0.187 −0.029 0.139 −0.119 −0.057 −0.129
LS, leaf to stem ratio; SV, spring vigor; LA, leaf area (cm2 ); PH, plant height (cm); DW, herbage dry weight (g/plant); SD, stem diameter (cm); SN, stem number. *, ** Significant at p <
0.05 and p < 0.01.
correlation coefficients for all 7 traits showed similar types ofpairwise association (Table 5).
DISCUSSION
Previous studies on genotypic variation within Melilotus spp.have mainly focused on interspecific comparisons for traits suchas coumarin content (Nair et al., 2010), salinity, waterloggingtolerance (Rogers et al., 2008), and also on phylogenicrelationships (Di et al., 2015) and genetic diversity (Di et al., 2014;Wu et al., 2016). The significant (P < 0.05) genotypic variationand high to moderate line mean repeatability reported from ourstudy, indicates the potential for genetic improvement of the ninetraits examined. There are no reported studies in M. officinalissimilar to ours that estimate themagnitude of genotypic variationfor key traits such as DW, Cou, PH, and SY.
Phenotypic variation, expressed as ranges, has been reportedfor some morphological traits. Klebesadel (1992) reported 2year means of PH of M. officinalis ecotypes ranging from112 to 145 cm. Second year mean plant height (PH) measuredin our study ranged from 144 to 188 cm. Martino et al.(2006) reported a range of coumarin content between 0.12 and0.39% based on different extraction methods. Nair et al. (2010)reported coumarin content measured from 27 M. officinalisaccessions ranging from 0.09 to 0.61% of dry matter. Ourstudy indicated a coumarin content that ranged from 0.04 to0.91% of dry matter. Herbage dry matter from single plants hasbeen reported from experiments conducted under glasshouseconditions (Rogers et al., 2008). There is a lack of information
on morphological traits measured under field conditions. Resultsfrom our study on the genotypic variation for the traits LS,SD, SN, LA, SV and SY, measured under field conditions,will be valuable to Melilotus breeders. Information on themagnitude and significance of the genotypic and environmentalcomponents of phenotypic variation for important traits willprovide a basis for the development of efficient breeding methodsfor their improvement (Moll and Stuber, 1974). Results fromthe present study showed that there was significant genotypicvariation among the 40 HS families at each location, Yuzhongand Linz, and also across these two locations for all the traitsmeasured. High genotypic variation was present for DW, SV,and SD at Yuzhong and LA, SD, DW, and SV at Linze.These results, together with the relatively high HS family meanrepeatabilities estimated, indicate the potential genetic variationavailable, within the new M. officinalis breeding population, forimprovement of these traits through selection and breeding.
Forage plants are utilized across a wide range of environments,which include different climates, soil types and grazing systems(Breese, 1969). The presence of genotype-by-environmentinteractions complicates selection of material for broadadaptation due to unreliable performance across environments(Comstock andMoll, 1963; Cooper and Byth, 1996). Quantifyingthe magnitude and understanding the causes of genotype-by-environment interaction can be helpful when planningbreeding strategies (Milligan et al., 1990; Basford and Cooper,1998). Caradus (1993) reported that a range of traits inwhite clover, especially yield-related traits, were sensitive togenotype-by-environment interactions. A similar result in whiteclover was reported by Jahufer et al. (1999). In our study, the
Frontiers in Plant Science | www.frontiersin.org 7 July 2016 | Volume 7 | Article 972
Luo et al. Genotypic Variation of Melilotus officinalis
genotype-by-environment interactions were significant formost traits except for the traits LS and LA. This indicates theimportance of multi-site evaluation in M. officinalis breedingprograms when focusing on broad adaptation. The applicationof multisite testing in breeding programs to investigate the effectof genotype-by-environment interaction on line performancehas been reported for forage grass and legume species such asperennial ryegrass (Easton et al., 2015), switchgrass (Jahufer andCasler, 2015), alfalfa (Hill and Baylor, 1983), and white clover(Ballizany et al., 2012).
The association among the traits measured in our study wasexamined using a combination of phenotypic and genotypiccorrelation with pattern analysis. The estimates of phenotypicand genotypic correlation coefficients supported the associationamong traits indicated in the biplots. The positive and significantphenotypic association of DW with traits PH, SD, and SN,predicts a positive correlated response in all these traits whenany one of them is selected for individual. This relationship willbe useful in a breeding program. The strong positive correlationbetween DW and SY shown in the biplot (Figure 2) indicates thatselection for herbage yield would also result in increasing seedyield. Significant correlation of forage yield and seed yield wasalso demonstrated in other legumes (Iannucci and Martiniello,1998; Guler et al., 2001; Cakmakci et al., 2006). Our studyindicated negative phenotypic and genotypic correlation betweenDW and LS. The LS is used as an indicator of digestibility andintake in forage (Kephart et al., 1990). This result implies a trade-off between herbage yield and quality. Julier et al. (2000) alsoestimated significant negative correlation between DW and LSin alfalfa, which is similar to M. officinalis in vegetative form(Whitson et al., 1992).
The strong negative relationship between SV andDWsuggests
that measurement of spring vigor, at a very early stage of
plant growth, could serve as an indirect selection criterion for
increasing herbage yield forM. offcinalis grown in western China
(Table 5). This will increase the efficiency of current breedingmethods, especially when dealing with the biennial forage specielike M. officinalis. Similar results were reported from studies oncommon vetch (Cakmakci et al., 2006). The negative phenotypiccorrelation between the traits DW and Cou shown in our study(Figure 2) indicates the possibility of identifying HS families witha combination of high herbage dry weight and low coumarincontent expression. This association will be of significantimportance in ourM. officinalis breeding program. Hofmann andJahufer (2011) showed negative association between flavonoidaccumulation and biomass using multivariate analysis.
Pattern analysis has been successfully used to summarizecomplex genotype-by-environment (Cooper et al., 1993a; Zhanget al., 2006) and genotype-by-trait (Jahufer et al., 1999; Davodiet al., 2011) data matrices. Jahufer et al. (1999) successfully
identified superior white clover full-sib families based onseven morphological traits using a combination of principlecomponent and cluster analysis. Davodi et al. (2011) used patternanalysis to summarize the performance of 200 alfalfa germplasmaccessions, based on 12 traits, for use in the improvement of yieldand quality. In our study, pattern analysis generated four groups
(Figure 3), where group 3 consisted of HS families with aboveaverage performance for DW and below average performancefor Cou. Group 3 consisted of 11 members, which included theparental germplasm accessions P1, P2, and P3. All the HS familiesin group 3 had a higher expression of the traits DW, SD, and SYin comparison to both commercial checks. The breeding lines ingroup 3 will be polycrossed to produce a breeding populationthat will be used in the recurrent selection program to developnew cultivars of M. officinalis with high herbage yield and lowcoumarin content for the Loess Plateau region in China.
CONCLUSION
The estimates of genotypic variation and HS family meanrepeatability indicate the potential genetic variation availablefor all the traits examined in our study. These estimates alsoindicate the potential to develop cultivars with increased forageyield and low coumarin content. The significant genotype-by-environment interaction estimated for the traits DW, PH,SD, SN, and SV across the two environments, Yuzhong andLinze, indicate the importance of multi-environment evaluationtrials in our M. officinalis breeding program. The breedingpopulation developed by polycrossing the HS families withingroup 3, identified using pattern analysis, will provide asignificant breeding pool for M. officinalis cultivar developmentin China.
AUTHOR CONTRIBUTIONS
KL, MJ, JZ, and YW conceived the topic. KL, FW, HD,and XM performed the experiments. KL and MJ analyzed allstatistical data. KL wrote the manuscript. All authors revisedthe manuscript. We thank National Plant Germplasm System(NPGS) for offering theMelilotus officinalis seeds.
ACKNOWLEDGMENTS
This work was supported by National Basic Research Program(973) of China (2014CB138704), Special Fund for AgroscientificResearch in the Public Interest (20120304205), Natural ScienceFoundation of China (31572453), Program for ChangjiangScholars and Innovative Research Team in University(IRT13019), and Fundamental Research Funds for the CentralUniversities (lzujbky-2016-10).
REFERENCES
Allen, O. N., and Allen, E. K. (1981). The Leguminosae: A Source Book
of Characteristics, Uses and Nodulation. Madison, WI: The University of
Wisconsin Press.
Ballizany, W. L., Hofmann, R. W., Jahufer, M. Z. Z., and Barrett,
B. A. (2012). Genotype × environment analysis of flavonoid
accumulation and morphology in white clover under contrasting
field conditions. Field Crop. Res. 128, 156–166. doi: 10.1016/j.fcr.2011.
12.006
Frontiers in Plant Science | www.frontiersin.org 8 July 2016 | Volume 7 | Article 972
Luo et al. Genotypic Variation of Melilotus officinalis
Basford, K. E., and Cooper, M. (1998). Genotype × environment interactions and
some considerations of their implications for wheat breeding in Australia.Aust.
J. Agr. Res. 49, 153–174. doi: 10.1071/A97035
Breese, E. L. (1969). The measurement and significance of genotype – environment
interactions in grasses. Heredity 24, 27–44. doi: 10.1038/hdy.1969.3
Breese, E. L., and Hayward, M. D. (1972). The genetic basis of present breeding
methods in forage crops. Euphytica 21, 324–336.
Cakmakci, S., Aydinoglu, B., Karaca,M., and Bilgen,M. (2006). Heritability of yield
components in common vetch (Vicia sativa L.). Acta Agric. Scand. B Soil Plant.
56, 54–59. doi: 10.1080/09064710510008531
Caradus, J. R. (1993). “White clover breeding line performance under sheep and
cattle grazing,” in Proceedings of the 10th Australian Plant Breeding Conference,
Vol. 2 (Gold Coast, QLD), 35–36.
Comstock, R. E., and Moll, R. H. (1963). “Genotype-environment interactions,” in
Statistical Genetics and Plant Breeding, Vol. 982, eds W. D. Hanson and H. F.
Robinson (Washington, DC: Nat Acad Sci Natl Res Publ), 164–196.
Cooper, M., and Byth, D. E. (1996). “Understanding plant adaptation to achieve
systematic applied crop improvement - A fundamental challenge,” in Plant
Adaptation and Crop Improvement, eds M. Cooper and G. L. Hammer
(Wallingford, CT: CAB International), 5–23.
Cooper, M., Delacy, I. H., Byth, D. E., and Woodruff, D. R. (1993a).
Predicting grain-yield in Australian environments using data from CIMMYT
international wheat performance trials. 2. The application of classification
to identify environmental relationships which exploit correlated response to
selection. Field Crop. Res. 32, 323–342.
Cooper, M., DeLacy, I. H., and Eisemann, R. L. (1993b). “Recent advances in the
study of genotype × environment interactions and their application to plant
breeding,” in Proceedings of the 10th Australian Plant Breeding Conference, Vol.
1 (Gold Coast, QLD), 16–31.
Davodi, M., Jafari, A. A., Assadian, G., and Ariapour, A. (2011). Assessment of
relationships among yield and quality traits in alfalfa (Medicago sativa) under
dryland farming system, Hamadan, Iran. J. Rangeland Sci. 1, 1247–1254.
DeLacy, I. H. (1981). “Cluster analysis for the interpretation of genotype by
environment interaction,” in Interpretation of Plant Response and Adaptation
to Agricultural Environments, eds D. E. Byth and V. E. Mungomery (Brisbane,
QLD: Australian Institute of Agricultural Science), 277–292.
Di, H. Y., Duan, Z., Luo, K., Zhang, D. Y., Wu, F., Zhang, J. Y.,
et al. (2015). Interspecific phylogenic relationships within genus Melilotus
based on nuclear and chloroplast DNA. PLoS ONE 10:e0132596. doi:
10.1371/journal.pone.0132596
Di, H. Y., Luo, K., Zhang, J. Y., Duan, Z., Huo, Y. X., and Wang, Y. R.
(2014). Genetic diversity analysis of Melilotus populations based on ITS and
trnL-trnF Sequences. Acta Bot. Boreal. Occident. Sin. 34, 0265–0269. doi:
10.7606/j.issn.1000-4025.2014.02.0265
Easton, H. S., Jahufer, M. Z. Z., Flay, C., Schmidt, J., Rolston, M. P., Trethewey, J. A.
K., et al. (2015). Environment and ryegrass genetics –multisite trial of advanced
breeding populations. J. N.Z. Grasslands 77, 233–238.
Evans, P. M., and Kearney, G. A. (2003).Melilotus albus (Medik) is productive and
persistent on saline soils of neutral to alkaline reaction in the high rainfall zone
of south-west Victoria. Aust. J. Exp. Agric. 43, 349–355. doi: 10.1071/EA02079
Falconer, D. S. (1989). Introduction to Quantitative Genentics. New York, NY:
Longman Scientific and Technical.
Fehr, W. R. (1987). Principles of Cultivar Development, Vol. 1. New York, NY:
Collier Macmillan Publishers.
Gabriel, K. R. (1971). The biplot graphical display of matrices with
application to principal component analysis. Biometrika 58, 453–467.
doi: 10.1093/biomet/58.3.453
Goplen, B. P. (1971). Polara, a low coumarin cultivar of sweetclover. Can. J. Plant
Sci. 51, 249–251. doi: 10.4141/cjps71-050
Goplen, B. P. (1981). NORGOLD - A low coumarin yellow blossom sweetclover.
Can. J. Plant Sci. 61, 1019–1021. doi: 10.4141/cjps81-154
Gorz, H. J., Haskins, F. A., Manglitz, G. R., Smith, R. R., and Vogel, K. P. (1992).
Registration of N28 and N29 sweetclover germplasms. Crop Sci. 32, 510.
GRIN (2000). Grin Taxonomy. United States Department of Agriculture,
Agricultural, Agricultural Research Service. Baltimore, MD: The Germplasm
Resources Information Network (GRIN).
Guler, M., Adak, M. S., and Ulukan, H. (2001). Determining relationships
among yield and some yield components using path coefficient analysis in
chickpea (Cicer arietinum L.). Eur. J. Agric. 14, 161–166. doi: 10.1016/S1161-
0301(00)00086-1
Hallauer, A. R., and Miranda, J. B. (1981).Quantitative Genetics in Maize Breeding.
Ames: IA State University Press.
Hill, R. R., and Baylor, J. E. (1983). Genotype × environment
interaction analysis for yield in alfalfal. Crop Sci. 23, 811–815. doi:
10.2135/cropsci1983.0011183X002300050002x
Hofmann, R. W., and Jahufer, M. Z. Z. (2011). Tradeoff between biomass and
flavonoid accumulation in white clover reflects contrasting plant strategies.
PLoS ONE 6:e18949. doi: 10.1371/journal.pone.0018949
Hu, B., Yu, J., Zhao, Z. H., Li, F. M., and Siddique, K. H. M. (2012). Soil
P availability, inorganic P fractions and yield effect in a calcareous soil
with plastic-film-mulched spring wheat. Field Crop. Res. 137, 221–229. doi:
10.1016/j.fcr.2012.08.014
Iannucci, A., and Martiniello, P. (1998). Analysis of seed yield components in four
mediterranean annual clovers. Field Crop. Res. 55, 235–243. doi: 10.1016/S0378-
4290(97)00091-9
Ivanov, A. I., and Chetvertnykh, L. M. (1980). Evaluation of a collection of
Melilotus species and varieties, and variation in their characters. Vestn.
Selskokhozyaistvennoi Nauki 5, 117–122.
Jahufer, M. Z. Z., and Casler, M. (2015). Application of the smith-hazel selection
index for improving biomass yield and quality of switchgrass. Crop Sci. 55,
1212–1222. doi: 10.2135/cropsci2014.08.0575
Jahufer, M. Z. Z., and Cooper, M., Ayres, J. F., and Bray, R. A. (2002). Identification
of future research to improve the efficiency of conventional white clover
breeding strategies in Australia – a review. Aust. J. Agric. Res. 53, 239–256. doi:
10.1071/AR01110
Jahufer, M. Z. Z., Cooper, M., Bray, R. A., and Ayres, J. F. (1999). Evaluation
of white clover (Trifolium repens L.) populations for summer moisture
stress adaptation in Australia. Aust. J. Agric. Res. 50, 561–574. doi: 10.10
71/A98141
Julier, B., Christian, H., and Christian, E. (2000). Within- and among-cultivar
genetic variation in alfalfa: forage quality, morphology, and yield. Crop Sci. 40,
365–369. doi: 10.2135/cropsci2000.402365x
Kephart, K. D., Buxton, D. R., and Hill, R. R. (1990). Digestibility
and cell-wall components of alfalfa following selection for
divergent herbage lignin concentration. Crop Sci. 30, 207–212. doi:
10.2135/cropsci1990.0011183X003000010045x
Klebesadel, L. J. (1992). Morphological, Physiological, and Winterhardiness
Comparisons among Latitudinal Ecotypes of Biennial Sweetclover (Melilotus
Species) in Subarctic Alaska. Fairbanks, AK: School of Agriculture and Land
Resources Management Agricultural and Forestry Experiment Station.
Kroonenberg, P. M. K. (1994). The TUCKALS line: a suite of programs for three-
way data analysis. Comput. Stat. Data Anal. 18, 73–96. doi: 10.1016/0167-
9473(94)90133-3
Li, X. Y., Wang, Y. R., Wei, X., Tai, J. H., Jia, C. Z., Hu, X. W., et al. (2014).
Planting density and irrigation timing affects Cleistogenes songorica seed yield
sustainability. Agron. J. 106, 1690–1696. doi: 10.2134/agronj14.0111
Luo, K., Di, H.-Y., Zhang, J.-Y., Wang, Y.-R., and Li, Z.-Q. (2014). Preliminary
evaluation of agronomy and quality traits of nineteen Melilotus accessions.
Pratacultural Sci. 31, 2125–2134. doi: 10.11829/j.issn.1001-0629.2013-0455
Maddaloni, J. (1986). Forage production on saline and alkaline soils in the humid
region of Argentina. Reclam. Reveg. Res. 5, 11–16.
Martino, E., Ramaiola, I., Urbano, M., Bracco, F., and Collina, S. (2006).
Microwave-assisted extraction of coumarin and related compounds
from Melilotus officinalis (L.) pallas as an alternative to soxhlet and
ultrasound-assisted extraction. J. Chromatogr. A. 1125,147–151. doi:
10.1016/j.chroma.2006.05.032
Milligan, S. B., Gravois, K. A., Bischoff, K. P., and Martin, F. A.
(1990). Crop effects on broad-sense heritabilities and genetic
variances of sugarcane yield components. Crop Sci. 30, 344–349. doi:
10.2135/cropsci1990.0011183X003000020020x
Moll, R. H., and Stuber, C. W. (1974). Quantitative genetics-empirical results
relevant to plant breeding. Advn. Agron. 26, 277–313. doi: 10.1016/S0065-
2113(08)60874-3
Nair, R. M., Whittall, A., Hughes, S. J., Craig, A. D., Revell, D. K., Miller, S. M.,
et al. (2010). Variation in coumarin content ofMelilotus species grown in South
Australia. N.Z. J. Agr. Res. 53, 201–213. doi: 10.1080/00288233.2010.495743
Frontiers in Plant Science | www.frontiersin.org 9 July 2016 | Volume 7 | Article 972
Luo et al. Genotypic Variation of Melilotus officinalis
Piano, E., Annicchiarico, P., Romani, M., and Pecetti, L. (2007). Effect of the
number of parents and their combining ability on the performance of synthetic
varieties in tall fescue. Aust. J. Agr. Res. 58, 1100–1105. doi: 10.1071/AR
06424
Riday, H., and Brummer, C. (2007). Narrow sense heritability and additive genetic
correlations in alfalfa subsp. falcata. J. Iowa Acad. Sci. 114, 28–34.
Rogers, M. E., Colmer, T. D., Frost, K., Henry, D., Cornwall, D., Hulm, E.,
et al. (2008). Diversity in the genus Melilotus for tolerance to salinity and
waterlogging. Plant Soil 304, 89–101. doi: 10.1007/s11104-007-9523-y
Sagalbekov, U. M. (1980). Evaluation of a collection of sweet clover in the southern
forest steppe of omsk province. Nauch.Tekhn. Byul. Sib. NII S. Kh. 3–6.
Sherif, E. A. (2009).Melilotus indicus (L.) all, a salt-tolerant wild leguminous herb
with high potential for use as a forage crop in salt-affected soils. Flora 204,
737–746. doi: 10.1016/j.flora.2008.10.004
Smith, W. K., and Gorz, H. J. (1965). Sweetclover improvement. Adv. Agron. 17,
163–231. doi: 10.1016/S0065-2113(08)60414-9
Su, Y. Z., Zhao, W. Z., Su, P. X., Zhang, Z. H., Wang, T., and Ram,
R. (2007). Ecological effects of desertification control and desertified land
reclamation in an oasis-desert ecotone in an arid region: a case study in Hexi
Corridor, northwest China. Ecol. Eng. 29, 117–124. doi: 10.1016/j.ecoleng.2005.
10.015
Turkington, R. A., Cavers, P. B., and Rempel, E. (1978). The biology of Canadian
weeds. 29.Melilotus albaDesr. andM. officinalis (L.) Lam. Can. J. Plant Sci. 58,
523–537. doi: 10.4141/cjps78-078
Watson, S. L., DeLacy, I. H., Podlich, D. W., and Basford, K. E. (1995). GEBEIL:
An Analysis Package Using Agglomerative Hierarchical Classificatory and Svd
Ordination Procedures for Genotype × Environment Data. Brisbane, QLA:
Centre for Statistics Research Report; Department of Agriculture, University
of Queensland.
White, T. L., and Hodge, G. R. (1989). “Predicting breeding values with
applications in forest tree improvement,” in Forestry Sciences 33, ed P. K. R.
Nair (Boston, MA: Kluwer Academic), 367.
Whitson, T. D., Burrill, L. C., Dewey, S. A., Cudney, D. W., Nelson, B. E., Lee,
R. D., et al. (1992). Weeds of the West (Edited by T. D. Whitson). Laramie:
The Western Society of Weed Science in cooperation with the Western
United States Land Grant Universities Cooperative Extension Services and the
University of Wyoming.
Wu, F., Zhang, D. Y., Ma, J. X., Luo, K., Di, H. Y., Liu, Z. P., et al. (2016). Analysis of
genetic diversity and population structure in accessions of the genusMelilotus.
Ind. Crop. Prod. 85, 84–92. doi: 10.1016/j.indcrop.2016.02.055
Zhang, Y., He, Z. H., Zhang, A. M., Ginkel, M. V., Pena, R. J., and Ye, G. Y. (2006).
Pattern analysis on protein properties of Chinese and CIMMYT spring wheat
cultivars sown in China and CIMMYT. Aust. J. Agric. Res. 57, 811–822. doi:
10.1071/AR05372
Zhu, H., and Fan, J. (2008). HPLC determination of coumarin in Melilotus. Chin.
J. Pharm. Anal. 28, 2111–2113. doi: 10.16155/j.0254-1793.2008.12.024
Conflict of Interest Statement: The authors declare that the research was
conducted in the absence of any commercial or financial relationships that could
be construed as a potential conflict of interest.
Copyright © 2016 Luo, Jahufer, Wu, Di, Zhang, Meng, Zhang and Wang. This
is an open-access article distributed under the terms of the Creative Commons
Attribution License (CC BY). The use, distribution or reproduction in other forums
is permitted, provided the original author(s) or licensor are credited and that the
original publication in this journal is cited, in accordance with accepted academic
practice. No use, distribution or reproduction is permitted which does not comply
with these terms.
Frontiers in Plant Science | www.frontiersin.org 10 July 2016 | Volume 7 | Article 972


![3D Coumarin Systems Based on [2.2]Paracyclophane Synthesis ...](https://static.fdocuments.net/doc/165x107/617bd62db04f62341e536942/3d-coumarin-systems-based-on-22paracyclophane-synthesis-.jpg)