GENOMIC APPROACHES TO CHARACTERIZATION OF THE …
179
GENOMIC APPROACHES TO CHARACTERIZATION OF THE INNATE IMMUNE RESPONSE OF CATFISH TO BACTERIAL INFECTION Except where reference is made to the work of others, the work described in this dissertation is my own or was done in collaboration with my advisory committee. This dissertation does not include proprietary or classified information. _____________________________ Eric James Peatman Certificate of Approval: _____________________________ _____________________________ Jeffery Terhune Zhanjiang Liu, Chair Assistant Professor Alumni Professor Fisheries and Allied Aquacultures Fisheries and Allied Aquacultures _____________________________ _____________________________ Nannan Liu Covadonga Arias Associate Professor Assistant Professor Plant Pathology and Entomology Fisheries and Allied Aquacultures _____________________________ George T. Flowers Interim Dean Graduate School
Transcript of GENOMIC APPROACHES TO CHARACTERIZATION OF THE …

GENOMIC APPROACHES TO CHARACTERIZATION OF THE INNATE IMMUNE
RESPONSE OF CATFISH TO BACTERIAL INFECTION
Except where reference is made to the work of others, the work described in this dissertation is my own or was done in collaboration with my advisory committee. This
dissertation does not include proprietary or classified information.
_____________________________ Eric James Peatman
Certificate of Approval:
_____________________________ _____________________________ Jeffery Terhune Zhanjiang Liu, Chair Assistant Professor Alumni Professor Fisheries and Allied Aquacultures Fisheries and Allied Aquacultures _____________________________ _____________________________ Nannan Liu Covadonga Arias Associate Professor Assistant Professor Plant Pathology and Entomology Fisheries and Allied Aquacultures
_____________________________ George T. Flowers Interim Dean Graduate School

GENOMIC APPROACHES TO CHARACTERIZATION OF THE INNATE IMMUNE
RESPONSE OF CATFISH TO BACTERIAL INFECTION
Eric James Peatman
A Dissertation
Submitted to
the Graduate Faculty of
Auburn University
in Partial Fulfillment of the
Requirements for the
Degree of
Doctor of Philosophy
Auburn, Alabama May 10, 2007

iii
GENOMIC APPROACHES TO CHARACTERIZATION OF THE INNATE IMMUNE
RESPONSE OF CATFISH TO BACTERIAL INFECTION
Eric James Peatman
Permission is granted to Auburn University to make copies of this dissertation at its discretion, upon request of individuals or institutions and at their expense.
The author reserves all publication rights.
_________________________ Signature of Author _________________________ Date of Graduation

iv
VITA
Eric James Peatman, son of James Bruce and Susan Elaine Peatman, was born
August 21, 1981, in Panorama City, California. He graduated from William S. Hart High
School, Newhall, California, in 1999. He attended Auburn University, Auburn, Alabama
from September 1999 to December 2002, graduating summa cum laude with a Bachelor
of Science degree in Fisheries and Allied Aquacultures. In August 2004, he obtained a
Masters of Science degree in Fisheries and Allied Aquacultures. He continued his
studies, entering the Cell and Molecular Biosciences/Fisheries and Allied Aquacultures
program to pursue a Doctor of Philosophy degree in August 2004.

v
DISSERTATION ABSTRACT
GENOMIC APPROACHES TO CHARACTERIZATION OF THE INNATE IMMUNE
RESPONSE OF CATFISH TO BACTERIAL INFECTION
Eric James Peatman
Doctor of Philosophy, May 10, 2007 (M. Sc., Auburn University 2004) (B. Sc., Auburn University 2002)
177 Typed Pages
Directed by Zhanjiang (John) Liu
Genetic selection for disease resistance encoded in the genomes of blue catfish
and channel catfish continues to hold the greatest potential for long-term solutions to
aquaculture-based disease outbreaks. Progress towards this goal requires the
development of genomic resources for catfish, including expressed sequence tags (ESTs).
In the context of catfish immune research, ESTs provide a foundation for both research
on individual immune-related genes and microarray-based transcriptome analysis
following infection. Both approaches are needed to advance our knowledge of teleost
immunity and move closer to identification of genetic sources of disease resistance. My
research, as presented here, encompasses these two complementary approaches to EST
research with in-depth studies of the catfish CC chemokine family and development and

vi
utilization of a high-density oligonucleotide microarray for expression analysis following
E. ictaluri infection.
Twenty-six CC chemokines from catfish were mapped to BAC clones. Through a
combination of hybridization and fluorescent fingerprinting, 18 fingerprinted contigs
were assembled from BACs containing catfish CC chemokine genes. The catfish CC
chemokine genes were found to be not only highly clustered in the catfish genome, but
also extensively duplicated at various levels. The catfish CC chemokine family is the
largest characterized CC chemokine family to-date, and it serves as a reference for
chemokine studies in teleost fish as well as for studies of gene duplication patterns in
catfish.
ESTs were also utilized in the development of a 28K in situ oligonucleotide
microarray composed of blue catfish (Ictalurus furcatus) and channel catfish (Ictalurus
punctatus) transcripts. Initial microarray analyses in channel catfish and blue catfish
liver following an infection with E. ictaluri captured a high number of unique,
differentially expressed transcripts and indicated the strong upregulation of several
pathways involved in the inflammatory immune response. The construction and
utilization of high-density oligonucleotide microarrays from channel catfish and blue
catfish ESTs represent a strong foundation for future, widespread use of microarrays in
catfish research.

vii
ACKNOWLEDGEMENTS
The author would like to thank Dr. John Liu for his invaluable advice and
assistance in all stages of this work. He is grateful for time and expertise offered to him
by his committee members, Dr. Jeffery Terhune, Dr. Cova Arias, and Dr. Nannan Liu.
Furthermore, the author greatly appreciates the technical assistance and support of all
those in the Fish Molecular Genetics and Biotechnology Laboratory, especially Dr.
Huseyin Kucuktas, Ping Li, Chongbo He, Dr. Puttharat Baoprasertkul, and Dr. Baolong
Bao. Above all, he thanks his wife, Allison, for her encouragement and her tireless
support of his efforts.

viii
Style manual or journal used Immunogenetics
Computer software used Microsoft Word, Microsoft Excel, Adobe Photoshop 6.0,
DNASTAR, PAUP, MEGA 3.0, RMA, SAM, OvergoMaker, Vector NTI, FPC,
ClustalW, PriFi, Fast PCR, Blast2GO, Spidey, UniProt, and REST v. 384b

ix
TABLE OF CONTENTS
LIST OF TABLES………………………………………………………………... x
LIST OF FIGURES...…...…………..……………………………….…………… xi
I. INTRODUCTION………………………………………………………….. 1
II. CATFISH CC CHEMOKINES: GENOMIC CLUSTERING,
DUPLICATIONS, AND EXPRESSION AFTER BACTERIAL
INFECTION WITH EDWARDSIELLA ICTALURI.……………………...... 14
Abstract…………………………………………………………………. 15 Introduction……………………………………………………………... 16 Materials and methods………………………………………………….. 18 Results…………………………………………………………………... 27 Discussion………………………………………………………………. 40
III. MICROARRAY-BASED GENE PROFILING OF THE ACUTE PHASE
RESPONSE IN CHANNEL CATFISH (ICTALURUS PUNCTATUS)
AFTER INFECTION WITH A GRAM NEGATIVE BACTERIUM............ 48
Abstract…………………………………………………………………. 49 Introduction……………………………………………………………... 50 Materials and methods………………………………………………….. 52 Results…………………………………………………………………... 61 Discussion………………………………………………………………. 68
IV. TRANSCRIPTOMIC PROFILING OF THE LIVERS OF BLUE
CATFISH (ICTALURUS FURCATUS) FOLLOWING INFECTION WITH
EDWARDSIELLA ICTALURI......................................................................... 78
Abstract…………………………………………………………………. 79 Introduction……………………………………………………………... 80 Materials and methods………………………………………………….. 83 Results…………………………………………………………………... 92 Discussion………………………………………………………………. 102
V. CONCLUSIONS……………………………………………………………. 113
CUMULATIVE BIBLIOGRAPHY………………………………………............ 119
APPENDICES……………………………………………………………………. 147

x
LIST OF TABLES
1. Previously reported fish CC chemokines ………………………………...... 8
2. A comparison of in situ and spotted array platforms ……………………… 10
3. Microarray studies in aquaculture species and their pathogens…………….. 12
4. Overgo probes for BAC hybridization……………………………………... 20
5. Primers for CC chemokine PCR and RT-PCR……………………………... 26
6. Mapping of catfish CC chemokine genes to BACs ………………………... 29
7. Contigs and singletons produced by fluorescent fingerprinting……………. 31
8. Up-regulated CC chemokines ….................................................................... 38
9. Down-regulated CC chemokines…………………………………………… 38
10. Primers used for qRT-PCR confirmation (5’-3’)…………………………… 61
11. Profile of significant, differentially-expressed genes in channel catfish…… 63
12. Channel catfish genes upregulated 5-fold or greater in the liver…………… 64
13. Unique, significantly downregulated channel catfish transcripts…………... 67
14. Confirmation of microarray results by qRT-PCR…………………………... 68
15. Primers used for real-time RT-PCR validation (5’-3’)……………………... 92
16. Catfish transcripts upregulated in the blue catfish liver……………………. 95
17. Unique, significantly downregulated catfish transcripts in blue catfish liver. 101
18. Validation of microarray results by QRT-PCR……………………………... 102

xi
LIST OF FIGURES
1. Example of fingerprinted BAC contigs .……………………………………... 32
2. Phylogenetic tree of catfish CC chemokines ………………………………… 34
3. Expression analysis of the 26 catfish CC chemokines ………………………. 37
4. Human-catfish CC chemokine comparative analysis………………………… 44
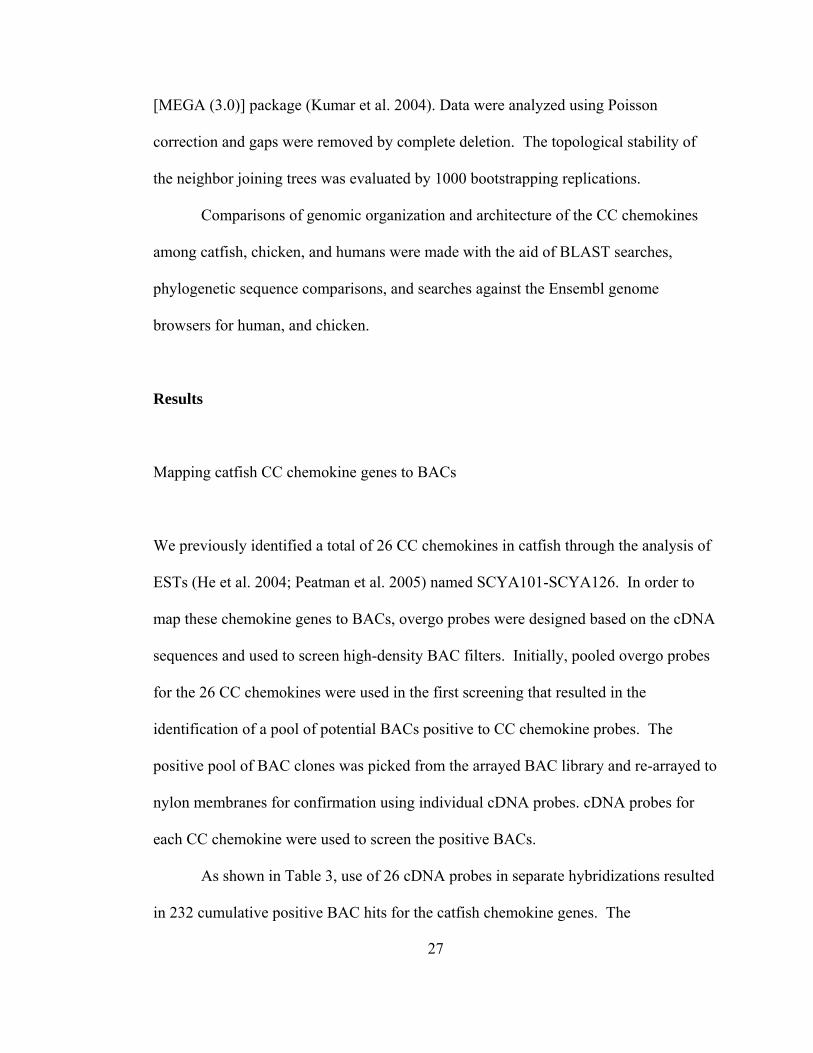
5. APP genes upregulated two-fold or greater in channel catfish……………….. 70
6. Iron homeostasis diagram…………………………………………………….. 74
7. Analysis and Gene Ontology (GO) annotation of 98 unique, significantly
upregulated transcripts in blue catfish………………………………………... 97
8. Significantly upregulated transcripts in blue catfish assigned to lower level
(>6) GO biological process categories ………………………………………. 98

1
I. INTRODUCTION
Overview
Channel catfish (Ictalurus punctatus) is the most important freshwater aquacultured
species in the United States. In 2003, 660 million pounds of pond-reared catfish,
representing two billion dollars in economic value, were harvested in the U.S. (USDA,
2003). Aquaculture has grown rapidly in the last three decades to become an important
alternative food source to collapsing natural fisheries. Catfish producers, like those of
more traditional livestock, desire improvement in important production and
performance traits such as disease resistance, growth rate, feed conversion efficiency,
body conformation and fillet yield. Of those traits, disease resistance remains the most
important and the most elusive. Fast-acting bacterial pathogens (predominantly
Edwardsiella ictaluri and Flavobacterium columnare) continue to cause widespread
losses to the industry. While several vaccines have been recently developed,
implementation and rigorous field testing have been slow, and their long term efficacy
is still in question. Antibiotic use is limited by regulation, cost, and growing bacterial
resistance. Direct selection for disease resistance has proven to be very difficult and is
beyond the capacity of most catfish breeding companies (Dunham et al. 1993; Dunham
and Liu 2003).

2
While channel catfish has been the species traditionally cultured in the U.S.,
small numbers of the closely-related (~98% nucleotide similarity) species blue catfish
(Ictalurus furcatus) have been raised. Blue catfish exhibit markedly higher resistance
to enteric septicemia of catfish (ESC, caused by E. ictaluri), but are inferior to channel
catfish in resistance to columnaris disease (caused by F. columnare, Dunham et al.
1993; Wolters et al. 1994; 1996). Under artificial challenge, heavy mortalities occur as
early as four days after onset of infection with either disease, before the adaptive
immune response can be established (Wolters et al. 1994).
Genetic selection for disease resistance encoded in the genomes of blue catfish
and channel catfish continues to hold the greatest potential for long-term solutions to
aquaculture-based disease outbreaks. Efficient identification of genes contributing to
resistance and susceptibility to disease, however, is a multi-stage process necessitating
the implemenation of a genome-based research program. Genome research requires the
development of a number of resources that facilitate the organization of large amounts
of genetic information into units that can be easily captured, mapped, and characterized.
These resources include linkage maps, physical maps, bacterial artificial chromosome
(BAC) libraries, and expressed sequence tags (ESTs). The integration of these tools
produces a genome framework upon which the researcher can pinpoint the genotypic
origins of phenotypic trait differences.
Expressed sequence tags, as a component of genome research, serve several
functions. They are effective tools for gene discovery, rich sources of molecular
markers for mapping, and the raw material for the development of microarrays (Liu
2006). In the context of catfish immune research, ESTs provide a foundation for both

3
research on individual immune-related genes and microarray-based transcriptome
analysis following infection. Both approaches are needed to advance our knowledge of
teleost immunity and move closer to identification of genetic sources of disease
resistance. The two approaches are complementary, in that gene-based research makes
microarray results more informative while microarray research provides a broader
context for the study of immune genes.
Historically, studies of the catfish immune system have focused on antibody-
based defenses (see Bengten et al. 2006 for a summary). More recently, a consensus
has grown that the teleost innate immune response is crucial in determining survival to
acute pathogen infections (Ellis 2001). However, few of the innate immune
components known from mammalian systems had been identified in fish until recently.
Utilizing new catfish EST resources produced in part from the RNA of catfish infected
with E. ictaluri (Liu et al. 2007) we have, therefore, isolated and characterized several
components of the innate immune response in blue and channel catfish to search for the
molecular underpinnings of these differences in disease resistance (He et al. 2004; Xu et
al. 2005; Bao et al. 2005; 2006a; Wang et al. 2006a; 2006b; 2006c; Peatman et al. 2005;
Peatman et al. 2006; Bao et al. 2006b). One objective of my research focused
particularly on CC chemokines, a superfamily of chemotactic cytokines with over 26
members in catfish (He et al. 2004; Peatman et al. 2005; Peatman et al. 2006; Bao et al.
2006a).
Expressed sequence tags can also be utilized for microarray-based research.
Microarray experiments, when properly conducted, offer an accurate, global assessment
of gene expression under a given treatment condition. The high-density capacity of

4
microarrays allows the analysis of expression patterns under infection of a large set of
all existing, unique blue catfish and channel catfish ESTs, rather than only the handful
of genes previously identified as being involved in the teleost innate immune response.
Transcriptome analysis is essential to identify catfish genes involved in immune
responses which may not play similar roles in mammalian systems. Additionally,
microarray technology allows faster functional screening of large EST datasets than is
possible by traditional methods. This allows the researcher to narrow his focus from a
large set of genes to a manageable subset of expression candidates for mapping and
further functional characterization.
My research, as presented here, encompasses the two complementary
approaches to EST research described above with in-depth studies of the catfish CC
chemokine family and development and utilization of a high-density oligonucleotide
microarray for expression analysis following E. ictaluri infection. Separate literature
reviews of CC chemokines and microarray technology, below, are followed by a
publication-based presentation of my findings. Following the three chapters of results,
an overall conclusion serves to summarize the work, suggests implications of the
research, and provides directions for future research in the field.
Chemokines
Inflammation, the attempt to localize cellular injury caused by an infectious agent, is an
important part of inducible innate immunity and can be seen within 1-2 days of
infection. Chemokines are a family of structurally related chemotactic cytokines that
regulate the migration of leukocytes, under both physiological and inflammatory

5
conditions (Neville et al. 1997; Laing and Secombes 2004a; Liu and Peatman 2006).
They are structurally-related small peptides, with the majority containing four
conserved cysteine residues. Based on the arrangement of these conserved cysteine
residues (Ahuja and Murphy 1996; Murphy et al. 2000), chemokines were divided into
four subfamilies: CXC (α), CC (β), C, and CX3C. Corresponding to these subfamilies
of chemokine proteins, their encoding genes were designated by SCY (for small
inducible cytokines) followed by a letter A, B, C, or D (for CC, CXC, C, and CX3C,
respectively). CXC and CC are the two major subfamilies. To date, 16 CXC
chemokines, 28 CC chemokines, two C chemokines, and one CX3C chemokine have
been identified from mammalian species (Bacon et al. 2003).
The identification of members of the largest family of chemokines, CC
chemokines, in non-mammalian species has been slow, due in part to the rapid
divergence rate of CC chemokines. In addition, most CC chemokines are small in size
with fewer than 100 amino acids. As a result, molecular cloning based on hybridization
or PCR using heterologous probes or primers designed from sequences of different
species are not very effective. Similarly, low sequence conservation hinders sequence
analysis using bioinformatic approaches at the nucleotide level. Nevertheless, a number
of important single gene discoveries have aided our understanding of fish CC
chemokines (Table 1; He et al. 2004).
The CK1 gene of rainbow trout (Oncorhynchus mykiss) was the first fish CC
chemokine described (Dixon et al. 1998). It contains six cysteine residues and has the
highest similarity to mammalian CCL20. The second fish CC chemokine, CC
chemokine 1, was identified from common carp (Cyprinus carpio) (Fujiki et al. 1999).

6
Carp CC chemokine 1 shares highest similarity to the allergenic/MCP subgroup of
mammalian CC chemokines. The third fish CC chemokine, CK2, was also identified
from trout (Liu et al. 2002). These early efforts provided the first indication of the
difficulty of establishing orthologies with mammalian sequences. All these proteins
share only low levels of identity (<40%) with any potential mammalian counterparts.
The early scarcity of fish CC chemokine discoveries led to speculation that fish
may have few orthologues for the chemokines existing in mammals (Laing and
Secombes 2004a; Huising et al. 2003a). With a foundation of small discoveries, the
expectation was that only a handful of distinct CC chemokines would be found in a
given species. The high numbers of mammalian CC chemokines appeared unique in the
phylogenetic spectrum. Therefore, the recent rapid discovery of fish chemokines using
genomic approaches has come as a surprise to some. Seven new chemokines from two
cichlid fish, Paralabidochromis chilotes and Melanochromis auratus, and catshark
Scyliorhinus canicula were reported recently (Kuroda et al. 2003), followed by
sequencing and analysis of 14 CC chemokines from catfish (He et al. 2004), and 15
trout CC chemokines (Laing and Secombes 2004b) (Table 1). The in silico
identification of these last two large sets of CC chemokines, in particular, challenged
notions of the fish immune system and prompted the further investigation of the catfish
CC chemokine family. Analysis and further sequencing of new EST resources from
catfish identified 12 additional CC chemokine cDNAs (Peatman et al. 2005),
representing the largest CC chemokine family identified to-date. This work was
followed up with isolation and sequencing of 23 of the 26 catfish CC chemokine genes
corresponding to the identified transcripts (Bao et al. 2006a). Tissue expression

7
analysis was also carried out at this time, in an attempt to classify the chemokines by
expression patterns. However, both gene structure and tissue expression provided few
clues as the orthologies between catfish CC chemokines and their mammalian
counterparts. It was known that chemokines were tightly clustered within the genomes
of mammals and chicken (Nomiyama et al. 2001; Wang et al. 2005) and that
correlations existed between their genomic architecture and the inducibility of their
expression. Therefore, analysis of genomic clustering of the CC chemokines in catfish
could reveal important information regarding their identities and help to explain the
modes of duplication and divergence that resulted in the present repertoire of vertebrate
CC chemokines. Chapter II describes the methodology used and results obtained in
research on catfish CC chemokine genomic clustering, duplications, and expression
after bacterial infection.

8
Table 1 Previously reported fish CC chemokines
Species CC chemokine Accession Number
References
CK1 AF093802 Dixon et al. 1998 CK2 AF418561 Liu et al. 2002 CK3 AJ315149 Sangrador-Vegas et al.
unpublished CK4A CA371157 CK4B CA352593 CK5A CA383670 CK5B CA374135 CK6 CA355962 CK7A CA355962 CK7B CA346976 CK8A CB494647 CK8B CA353159 CK9 CA378686 CK10 CA361535 CK11 BX072681 CK12A CA358073
Rainbow trout
CK12B CA346383
Laing and Secombes, 2004b
Carp CC chemokine 1 AB010469 Fujiki et al. 1999 CC chemokine AU090535 Kono et al. 2003 Japanese flounder Paol-SCYA104 AB117523 Khattiya et al. 2004 Meau-SCYA101 AY178962 Meau-SCYA102 AY178963 Pach-SCYA101 AY178964 Pach-SCYA103 AY178965 Pach-SCYA104 AY178966 Pach-SCYA105 AY178967
Cichlids
Pach-SCYA106 AY178968
Kuroda et al. 2003
Trsc-SCYA107 AB174767 MIP3α1 AB174768
Dogfish
MIP3α2 AB174766
Inoue et al. 2005
Catshark Scca-SCYA107 AY178970 Kuroda et al. 2003 Icfu-SCYA101 AY555498 Icpu-SCYA102 AY555499 Icfu-SCYA103 AY555500 Icfu-SCYA104 AY555501 Icpu-SCYA105 AY555502 Icfu-SCYA106 AY555503 Icfu-SCYA107 AY555504 Icpu-SCYA108 AY555505 Icfu-SCYA109 AY555506 Icfu-SCYA110 AY555507 Icpu-SCYA111 AY555508 Icpu-SCYA112 AY555509 Icpu-SCYA113 AY555510
Catfish
Icfu-SCYA114 AY555511
He et al. 2004

9
Microarrays
Researchers have long harnessed the basic molecular principle of nucleic acid
hybridization to study the expression patterns of cell transcripts. Transcript studies
allow a valuable assessment of the genetic response to environmental changes (i.e.
infection, temperature, feeding rates). Incremental progress over the last two decades
has been made from radioactively-labeled probing of one gene to tens of genes to
nylon-filter-based macro-arrays containing hundreds of genes. In early years, progress
in transcript detection techniques largely corresponded to strides in gene sequencing
and discovery. However, as gene sequencing grew exponentially in the early 1990s and
genomic approaches such as PCR revolutionized molecular biology, a similarly radical
leap forward was needed to bring transcript studies into the “–omics” era. This leap
was provided by microarrays. While microarrays utilize several recent technological
innovations, they are, at their core, simply a high density dot blot. In both cases, DNA
is anchored or spotted onto a surface and then probed with labeled molecules.
Hybridization and subsequent signal detection depends on the presence of
complementary nucleotide sequences between the probes and the spotted sample.
Microarrays achieve higher gene feature densities and, therefore, greater power for
expression analysis by applying new tools to this old process. High-density spotting
robots and photolithography allow each feature to be placed accurately within
nanometers of the next feature on a glass slide, clearly an impossible task with the
human hand. Furthermore, fluorescence-based probe labeling provides a cleaner and
clearer signal than the radiation traditionally used in blotting. Finally, laser scanners

10
facilitate the resolution of such tremendous feature densities and provide accurate
fluorescent signal quantification (Peatman and Liu 2007).
There are two primary approaches to microarrays, differing in both their
construction and their sample labeling. Spotted arrays are constructed by spotting long
oligos or cDNAs using a printing robot (Schena et al. 1995), whereas in situ arrays are
constructed by synthesizing short or long oligos directly onto the slide by
photolithography (Fodor et al. 1991; see Table 2 for a comparison of the two platforms).
A decade of refinements of both spotted and in situ microarray technologies
have resulted in further capacity increases and widened array applications without
altering the fundamentals of either approach. Microarray technology is now widely
accessible in biomedical and agricultural genetics research.
Table 2 A comparison of several important aspects of in situ and spotted array platforms. *Cost/slide can vary significantly from these figures depending on design, quantities ordered, core facility discounts, etc.
In situ arrays Spotted arrays Starting material DNA sequences DNA sequences or cDNA Array fabrication In situ synthesis by photolithography Robotic spotting
Features >400,000 <50,000 Spot quality High Variable Oligo length 23-25mer, 60-70mer Usually 70mer
Labeling Single dye label- e.g., biotin-streptavidin- phycoerithryn
Two dye label-Cy3, Cy5
Cost/slide >$500* <$100* Probe/slide One Two
Dye swapping? No Yes Controls PM/MM, +/- Duplicates, +/- Providers Affymetrix, Nimblegen, etc. Species groups, core facilities,
biotech
Only within the last several years, however, have researchers in aquaculture species
generated sufficient expressed sequence tags (EST) to justify using transcriptomic
approaches for expression analysis. The field is still in its infancy and distribution of
resources remains uneven. Concerted effort by researchers working on salmonid

11
species has resulted in the generation of several arrays that are now available to the
general research community. These arrays have been rapidly integrated into salmonid
research, as seen in Table 3. The largest salmonid microarray generated to-date
contains 16,006 cDNAs with 13,421 coming from Atlantic salmon and 2,576 from
rainbow trout (von Schalburg et al. 2005a). Table 3 lists additional microarray studies
conducted on aquaculture species or aquaculture-associated pathogens. With the
exception of salmonids, other microarray studies have, for the most part, been small-
scale, non-collaborative efforts. A forthcoming microarray from oyster should also be
widely distributed. To-date, the vast majority of published microarray studies has used
PCR-amplified spotted cDNA clones to fabricate the array. However, as microarray
research typically takes several years from its inception to reach publication, the recent
trends toward spotted oligos and in situ microarrays may not be reflected in the
aquaculture literature for several years. A well-designed microarray can be a valuable
asset to an aquaculture species group, especially if the cost per slide can be minimized
to the extent that researchers can integrate transcriptomic approaches into their already
established research. Microarray studies are most successful when they are just one of
several approaches used to answer biological questions. For example, salmonid
researchers have implemented array technology in their study of reproductive
development, toxicology, physiology, and repeat structures (von Schalburg et al. 2006;
Tilton et al. 2005; Vornanen et al. 2005; Krasnov et al. 2005a). While species with
completed genome sequences have expanded microarray research into such fields as
comparative genomic hybridization (CGH), SNP analysis, methylation analysis,
12
proteomics, and metabolomics in recent years, research on aquaculture species has been
confined to expression analysis.
Table 3 Microarray studies in aquaculture species and their pathogens
Species Common name References Cyprinus carpio Common carp Gracey et al. 2004 Ictalurus punctatus Channel catfish Ju et al. 2002
Li and Waldbieser 2006 Ameiurus catus White catfish Kocabas et al. 2004 Paralicthys olivaceous Japanese flounder Kurobe et al. 2005;
Byon et al. 2005; 2006 Platichthys flesus European flounder Williams et al. 2003 Salmo salar Atlantic salmon Morrison et al. 2006;
Martin et al. 2006 ; Jordal et al. 2005; von Schalburg et al. 2005a; Aubin-Horth et al. 2005; Ewart et al. 2005; Rise et al. 2004a; 2004b
Oncorhynchus mykiss Rainbow trout Purcell et al. 2006; MacKenzie et al. 2006; von Schalburg et al. 2006;2005b Tilton et al. 2005; Krasnov et al. 2005a;2005b;2005c Vornanen et al. 2005; Koskinen et al. 2004a;2004b
Oncorhynchus keta Chum salmon Moriya et al. 2004 Astatotilapia burtoni African cichlid Renn et al. 2004 WSSV and Penaeus sp. White spot syndrome
virus and shrimp species Lan et al. 2006; Marks et al. 2005; Tsai et al. 2004; Dhar et al. 2003; Khadijah et al. 2003
Sparus auratus Gilthead seabream Sarropoulou et al. 2005 Aeromonas salmonicida Furunculosis Nash et al. 2006 Crassostrea sp. Oyster Submitted
In catfish, a priority was placed on establishing a high quality EST resource with a large
number of unique genes before constructing microarrays. An initial in situ
oligonucleotide microarray was constructed utilizing only ESTs from channel catfish
and validated with LPS-injected fish (Li and Waldbieser 2006). However, this array did

13
not include ESTs from blue catfish, important for additional, unique genes contained in
their sequences as well as for analysis of differential expression between the two
species. Additionally, the original array design did not contain several hundred
immune-related genes recently generated in our lab from both blue and channel catfish.
Construction of a more comprehensive catfish oligonucleotide microarray and its
validation for capturing the expression profiles of channel catfish and blue catfish after
E. ictaluri infection are described in Chapters III and IV of the dissertation.

14
II. CATFISH CC CHEMOKINES: GENOMIC CLUSTERING, DUPLICATIONS,
AND EXPRESSION AFTER BACTERIAL INFECTION WITH EDWARDSIELLA
ICTALURI

15
Abstract Chemokines are a family of structurally related chemotactic cytokines that
regulate the migration of leukocytes under both physiological and inflammatory
conditions. CC chemokines represent the largest subfamily of chemokines with 28
genes in mammals. Sequence conservation of chemokines between teleost fish and
higher vertebrates is low and duplication and divergence may have occurred at a
significantly faster rate than in other genes. One feature of CC chemokine genes known
to be conserved is genomic clustering. CC chemokines are highly clustered within the
genomes of human, mouse, and chicken. To exploit knowledge from comparative
genome analysis between catfish and higher vertebrates, here we mapped to BAC
clones 26 previously identified catfish (Ictalurus sp.) chemokine cDNAs. Through a
combination of hybridization and fluorescent fingerprinting, 18 fingerprinted contigs
were assembled from BACs containing catfish CC chemokine genes. The catfish CC
chemokine genes were found to be not only highly clustered in the catfish genome, but
also extensively duplicated at various levels. Comparisons of the syntenic relationships
of CC chemokines may help to explain the modes of duplication and divergence that
resulted in the present repertoire of vertebrate CC chemokines. Here we have also
analyzed the expression of the transcripts of the 26 catfish CC chemokines in head
kidney and spleen in response to bacterial infection of Edwardsiella ictaluri, an
economically devastating catfish pathogen. Such information should pinpoint research
efforts on the CC chemokines most likely involved in inflammatory responses.

16
Introduction
Chemokines are a superfamily of chemotactic cytokines in mammals and a crucial part
of the innate immune response of higher vertebrates. They play roles in
immunosurveillance under homeostasis as well as stimulating the recruitment,
activation, and adhesion of cells to sites of infection or injury (Neville et al.1997; Moser
and Loetscher 2001; Laing and Secombes 2004a). Recent research has found that some
chemokine genes have important roles during normal development and growth (e.g.,
David et al. 2002; Molyneaux et al. 2003; Baoprasertkul et al. 2005). Chemokines are
structurally related small peptides, with the majority containing four conserved cysteine
residues. Based on the arrangement of these conserved cysteine residues (Murphy et al.
2000), chemokines were divided into four subfamilies:CXC (α), CC (β), C, and CX3C.
CC chemokines constitute the largest subfamily of chemokines with 28 CC chemokines
identified from mammalian species (Bacon et al. 2003). The largest number of CC
chemokines found in a single species is 24 from humans, missing orthologues to the
murine CCL6, CCL9/CCL10, and CCL12.
The majority of human, murine, and chicken CC chemokine genes are organized
in gene clusters within their genomes. The largest clusters are found on human
chromosome 17, mouse chromosome 11, and chicken chromosome 19 (Nomiyama et al.
2001; Wang et al. 2005). There are correlations between genomic architecture and the
inducibility of their expression, with inflammatory CC chemokines constituting the
large clusters, and a few homeostatic CC chemokines distributed among several
chromosomes. Additionally, orthologies across species are relatively high between the

17
non-clustered CC chemokines, but low when comparing the clustered CC chemokines
of several species (Wang et al. 2005; Peatman et al. 2005).
Establishing orthology between fish and mammalian CC chemokines has been
problematic. Sequence conservation of chemokines is low and duplication and
divergence may have occurred at a significantly faster rate than in other genes.
Concrete orthologues cannot be identified for the majority of CC chemokine transcripts
found from catfish or trout based on either sequence identities or phylogenetics (Laing
and Secombes 2004b; He et al. 2004; Peatman et al. 2005). Even gene organization
(exon/intron) has been found to differ between evident orthologous chemokines in
human, chicken and catfish (Wang et al. 2005; Bao et al. 2006a). Genomic location of
CC chemokines is important, therefore, in attempting to trace the origins of CC
chemokines in teleosts and higher vertebrates. Comparisons of syntenic relationships of
CC chemokines may help to explain the modes of duplication and divergence that
resulted in the present repertoire of vertebrate CC chemokines.
Progress on identifying immune molecules in teleost fish has not traditionally
come from the genome-enabled model species (Danio rerio, Takifugu rubripes). Rather
it has been generated more slowly in several aquaculture species (catfish, salmonids,
carps, flounders) where disease problems are a serious economic issue. The lack of
even a draft genomic sequence in catfish makes cross-species comparisons of genomic
neighborhoods much more difficult. We have used, therefore, a novel approach of
overgo and cDNA hybridizations and bacterial artificial chromosome (BAC)
fingerprinting and clustering to determine the architecture of the catfish CC chemokines
without a draft genome sequence. Here we report the genomic architecture of

18
previously sequenced catfish CC chemokine genes as well as their expression patterns
after bacterial infection. Comparisons of CC chemokine arrangements and duplication
between catfish, chickens, and humans reveal rapid multiplication of some chemokine
genes.
.
Materials and methods
BAC library screening and BAC isolation
High-density filters of the channel catfish BAC library were purchased from Children’s
Hospital of the Oakland Research Institute (CHORI, Oakland, CA), and screened using
overgo hybridization probes (Cai et al.1998; Bao et al. 2005; Xu et al. 2005). Each set
of filters contained a 10X genome coverage of the channel catfish BAC clones from
BAC library CHORI 212 (http://bacpac.chori.org/library.php?id=103). The catfish
BAC library was screened using a two-step procedure. First, pooled overgo probes of
catfish CC chemokines were used to identify BAC clones with inserts likely containing
chemokine genes. These positive BACs were then manually re-arrayed onto nylon
filters and screened individually using labeled cDNA probes.
Overgo primers were designed based on the coding sequence of the 26
chemokine cDNAs (Table 1). The overgo hybridization method was adapted from a
web protocol (http://www.tree.caltech.edu/) with modifications (Bao et al. 2005; Xu et
al. 2005). Briefly, overgos were selected following a BLAST search against GenBank
to screen out repeated sequences and then purchased from Sigma Genosys (Woodlands,

19
Texas). Twenty-six overgos were pooled together, initially. Overgos were labeled with
32P-dATP and 32P-dCTP (Amersham, Piscataway, NJ) in overgo labeling buffer (Ross
et al. 1999) at room temperature for 1 h. After removal of unincorporated nucleotides
using a Sephadex G50 spin column, probes were denatured at 95°C for 10 min and
added to the hybridization tubes. Hybridization was performed at 54°C for 18 hr in
hybridization solution (50 ml of 1% BSA, 1 mM EDTA at pH 8.0, 7% SDS, 0.5 mM
sodium phosphate, pH 7.2). Filters were washed and exposed to X-ray film at -80°C for
two days.

20
Table 1 Overgo probes for BAC hybridization
Gene Upper primer (5’-3’) Lower primer (5’-3’)
SCYA101 GCGTTGCTATTTCGCTGGCAAATC CACACAGTCTCTCTCTGATTTGCC SCYA102 GTGCTGCTTGCACTTTTTGGATGC CAGGTGCAGTAGTGATGCATCCAA SCYA103 GTCCTCTGTTTTCTCCTGCTTCTG TTGGGTACATGCATGCCAGAAGCA SCYA104 CCTGTCTTCAGTCCTTCACAATGG CCGTTTGCATTCTGTGCCATTGTG SCYA105 ACAAACGTCGTGTGTGTGCAAACC ACCCACTCATCCTTGGGGTTTGCA SCYA106 AACAGCGGCATCTGATATTGGCAC CACACGTCCTGTTTCTGTGCCAAT SCYA107 AGGCTTCCACCAAAGAAATCACCG AATCCTGTGATGGGCACGGTGATT SCYA108 GTAAACACCAGTGTGGAAACGCTG AGAGGAAAGACCTGAGCAGCGTTT SCYA109 CAACCGTAATGGCAAGAGCAAAGG GGTCTTTCACTGAGCTCCTTTGCT SCYA110 GAAACAGCACTGTGTGGATCCAAC GTTGACCCAAACAGCTGTTGGATC SCYA111 GCTCATGTTGTTCCTCCTACTTCC GGGGGAATTTTCCCATGGAAGTAG SCYA112 CCTCCACAAATGTGTGAACACCTC GACATAGCCACGTGAAGAGGTGTT SCYA113 CAAAGCCTGGTGGAATCCTACTAC TCTCTGGAGTCTGAACGTAGTAGG SCYA114 CCATCTGGACTGTAACAGATGCAG CAGGGGCTCACTTTTTCTGCATCT
SCYA115 TTCACTGAAGGGATGCGTTTCACG AGACGTTTTTGGTGCCCGTGAAAC
SCYA116 CATGGCCTTTTTGGACCACAGAGG ATTCCCTGGTGGCATGCCTCTGTT SCYA117 TCTACTCAGACGCTCAGCCTTTTG TCAGGATGTGCAGGAGCAAAAGGC SCYA118 TCCTAAGCAAGTCCGTGTGACAAG CCAGTAGCTCACAATGCTTGTCAC SCYA119 CTGCTCTATCCACTCTTCTTCTGC AGAGGCAGAACACCATGCAGAAGA SCYA120 cDNA probe cDNA probe SCYA121 AGATGAATCGTGTGGTTTTGGTCC ATCAGGAAGAAGCCCAGGACCAAA
SCYA122 CAGCAAGGCTTCATTGTTACGACG GGTTAGGGAACTTAGGCGTCGTAA
SCYA123 AACGTAGTGTGTGTGCAAACCCCA TGCACCCACTTATCCTTGGGGTTT SCYA124 CTCGACCTAACCTCAAACGTGTGT TGGCCAGAGGATTTAAACACACGT SCYA125 TTGACTCAGAGAGACCTCACCTTG ACTGAATCGCATGGCTCAAGGTGA SCYA126 CTCGTGCTGCTTATTCGTGGAAAG TTGGTGCGCACAATCTCTTTCCAC
Positive clones were identified according to the clone distribution instructions
from CHORI and picked from the channel catfish BAC library. Approximately 200
positive BAC clones were identified through the hybridization of overgos for the 26
catfish CC chemokines. These 200 BAC clones were picked, cultured in 2X YT media
overnight, and manually arrayed on Immobilon nylon membranes (Millipore, Bedford,
MA). Briefly, 4 μL of each overnight culture well was spotted in duplicate on the

21
membrane and allowed to dry. The membranes were placed in a dish containing 3M
Whatman paper saturated with 10% SDS for 3 min, transferred to a second tray
containing 0.5 N NaOH, 1.5 M NaCl for eight minutes without agitation, before being
transferred to another dish containing 1.5 M NaCl, 0.5 M Tris-HCl, pH 7.2, 1 mM
EDTA and immersed for 3 minutes with agitation. This second wash was repeated in a
new dish with fresh solution. The membrane was air-dried at room temperature and
DNA was fixed to the membrane by UV cross linking using a UV Stratalinker 2400
(Stratagene, La Jolla, CA) with the auto crosslink function.
Probes based on catfish CC chemokine cDNAs were prepared from previously
cloned plasmids. Probes were prepared using the random primer labeling method
(Sambrook et al. 1989) with a labeling kit from Roche Diagnostics (Indianapolis,
Indiana). The membranes were pre-hybridized in 50% formamide, 5X SSC, 0.1% SDS
(w/v), 5X Denhardt’s and 100 μg/ml sonicated and denatured Atlantic salmon sperm
DNA for 2 h. Hybridization was conducted for at least 16 h at 42°C in 50% formamide,
5X SSC, 0.1% SDS (w/v), and 100 μg/ml sonicated and denatured Atlantic salmon
sperm DNA with probes added. The nylon membranes were washed first in 500 ml of
2X SSC for 10 min, followed by three washes in 0.2X SSC with SDS at 0.2% (w/v) at
45°C for 15 min each. The membranes were then wrapped in Saran wrap and exposed
to Kodak BioMax MS film for autoradiography. Positive BAC clones were identified
for each catfish CC chemokine and BAC DNA was isolated with the Qiagen R.E.A.L
Prep 96 BAC DNA isolation kit (Qiagen, Valencia, CA) following the manufacturer’s
protocol.

22
Fluorescent fingerprinting and BAC contig construction
Positive BAC clones were fingerprinted and assembled, where possible, using the
protocol described by Luo et al. (2003) with modifications. Briefly, BAC DNA was
simultaneously digested with four 6-base pair (bp) recognizing restriction
endonucleases (EcoRI, BamHI, XbaI, XhoI) generating 3' recessed ends and one 4-bp
recognizing restriction endonuclease (HaeIII) generating a blunt end. Each of the four
recessed 3' ends of restriction fragments was filled in using DNA polymerase with
different fluorescent dyes using the SNaPshot kit (Applied Biosystems). Such labeling
reactions allowed labeling of four sets of restriction fragments, providing a high level of
confidence for contig assembly. Restriction fragments ranging from 50 bp to 500 bp
were sized by an ABI PRISM 3130 XL automated sequencer producing *.fsa files.
Genoprofiler (You et al. 2003) converts *.fsa files to *.sizes files which can be utilized
by FPC (Soderlund, et al. 1997; 2000) for contig assembly. A 0.2 to 0.4 bp tolerance
range was used in FPC, keeping the probability of coincidence (Sulston score, Sulston
et al. 1988; 1989) low to avoid false assembly. A p-value of 10-10 was used for contig
assembly. The results of BAC fingerprinting from FPC are image files of each BAC
contig. Data from contig assembly were used with previous hybridization data to obtain
the patterns of CC chemokine genes. Fingerprinting does not allow the user to discern
the order of genes within each contig, therefore the order of genes was arbitrarily
assigned. Each fingerprint contig or singleton should represent a different genomic
region based on its restriction pattern. In order to assess the reliability of the BAC
contigs, we conducted two types of analyses. First, overgo hybridization and cDNA

23
hybridization data was carefully analyzed to match the contigs assembled from
fingerprinting; second, cut off p-values were varied, using a range of p-values from 10-
10, 10-8, 10-6, and 10-2, in order to see how that would affect the contig assembly. Only
by increasing the p-value for assembly to 10-2, an unacceptably low standard for
assembly, are any of the contigs or singletons merged together. In cases where the
combination of contig assembly and hybridization suggested the presence of multiple
gene copies, the letters of A-F were assigned to differentiate between distinct genomic
copies of the catfish CC chemokines.
Fish rearing, bacterial challenge and sampling
Channel catfish were reared at the hatchery of the Auburn University Fish Genetics
Research Unit. Challenge experiments were conducted as previously described
(Dunham et al. 1993) with modifications. Briefly, catfish were challenged in a
rectangular tank by immersion exposure for 2 h with freshly prepared culture of ESC
bacteria, E. ictaluri. One single colony of E. ictaluri was isolated from a natural
outbreak in Alabama (outbreak number ALG-02-414) and inoculated into brain heart
infusion (BHI) medium and incubated in a shaker incubator at 28°C overnight. The
bacterial concentration was determined using colony forming unit (CFU) per ml by
plating 10 μl of 10-fold serial dilutions onto BHI agar plates. At the time of challenge,
the bacterial culture was added to the tank to a concentration of 3 x10⁷ CFU/ml. During
challenge, an oxygen tank was used to ensure a dissolved oxygen concentration above 5
mg/L. After 2 h of immersion exposure, 15 fish were randomly taken and placed into a

24
rectangular trough containing pond water with constant water flow through. Replicates
of troughs were used to provide one trough for each sampling time point. For the
control fish, 15 fish were incubated in a separate rectangular tank with the same fish
density as the challenge tanks. The only difference was that ESC bacteria were not
added. After 2 h, these control fish were incubated in a separate trough at the same
density as the challenged fish.
After challenge, head kidney and spleen samples were collected at 4 h, 24 h, and
3 days. At each time point, 10 fish were sacrificed for sampling. The fish were
euthanized with tricaine methanesulfonate (MS 222) at 300 mg/L before tissues were
collected. Tissues were kept in a –80 °C ultra-low freezer until preparation of RNA.
Samples of each tissue from 10 fish were pooled. The pooled tissues were rapidly
frozen with liquid nitrogen. In order to obtain samples representing the average of the
10 fish, the pooled tissue samples were ground with a mortar/pestle to fine powders and
were thoroughly mixed. A fraction of the mixed tissue samples was used for RNA
isolation.
RNA isolation and RT-PCR
RNA was isolated following the guanidium thiocyanate method (Chomczynski and
Sacchi 1987) using the Trizol reagents kit from Invitrogen (Carlsbad, CA) following
manufacturer’s instructions. Extracted RNA was stored in a -70°C freezer until used as
template for reverse transcriptase PCR (RT-PCR). The RT-PCR reaction was
conducted using a two-step approach with M-MuLV reverse transcriptase (New

25
England Biolabs, Ipswich, MA) with the primers listed in Table 2. Detailed procedures
followed the manufacturer’s instructions (Wang et al. 2006a). Briefly, 1 µg of total
RNA was used in each first-strand reaction. PCR reactions were carried out as described
above with two modifications. The primers of β-actin (Table 2) were added to serve as
an internal control. Challenge tissue RNA samples were amplified for 32 cycles. RT-
PCR reactions were conducted for one gene at a time, and the images of agarose gels
were compiled together into a single figure and, therefore, expression levels can only be
analyzed separately for each gene.

26
Table 2 Primers for PCR and RT-PCR
Gene Upper primer (5’ to 3’) Lower primer (5’ to 3’)
SCYA101 TGTGTGCTGTAAGGAGGTTTCC TTCTGTGGCACGATTGTGGTCG SCYA102 CTGCACCTGGTAACTACCGTCG GTTTCTTTGGGATCCAGCGTGC SCYA103 TGCATGTACCCAAGTTTGGCAC TTCATCAGTTCTTGCACCCAGG SCYA104 TCTCTCCTGCTGGTTCTGCTGG TAATTTGTCGCCGGAGTCTTGG SCYA105 AGATACCAGACACAACCGATCC GCTGATCAGTTGTTTGCTTGCT SCYA106 GTCTCTTGGAGAGCAAGCACTG CATCAGCTCTCTGACCCAGTCG SCYA107 CAGCCAGAAGATCCGAAGCCTC TGGAAGTGGAGCCGGTTGTCTG SCYA108 TGCAAACGAACCAGAACCATGC TCGGTTGAGGTTGGATCACGTC SCYA109 ACCAGCGACACTTTCGTTCCAC GCTCTTGCCATTACGGTTGTCC SCYA110 ATGAGGAACCTGACGGCTCTGC AGCTGTTGGATCCACACAGTGC SCYA111 AGACGCTACCTATCAAGCGCTC CAGTTGCGTGAAAGCTGCAGTG SCYA112 TCGCTGGATGCTGGCTTCTGTG TGACCTTGTTATGAGGTTGCTG SCYA113 TCCACAAAGCCTGGTGGAATCC AGTTGTTCTTTGTCGCACGAGG SCYA114 ATGAGGAGCCTGGCTGCCATAG GATGCAGGGAGGCAGTGGTTGG
SCYA115 TGGTGCTGCTGAGTGCAGTCAC ACCCAGGCGTCAGTGGGTTTGG
SCYA116 ACTCCACTTCTCAGCTGCCCTG CAAGGTGAGGACGGGTCCAAGC SCYA117 TCCTGCACATCCTGAGGATTGC TCTCAGTAGCCGGGACTTCACG SCYA118 CACCACTGCAGTGTTCTCCAGC TCTCCTTTGGAGCATCTGGTGC SCYA119 TGGTGTTCTGCCTCTGTGCCAG TGTTCTGTGGAATGGTCACCTC SCYA120 CTGCTGGTTCTGCTGGGTCTCG TGCGGTCTGCACACGCCTTACG SCYA121 TCTGCATCCATCTGCTGAGAAC GTGCGTACGTGTTGCGTCTCAG
SCYA122 TGAGCTTCACACACCTGCTGAG AGCCTTGCTGTTCACACTGTGC
SCYA123 TCCTTCACAGCGGCTCAGAGTG TGGGGTTTGCACACACACTACG SCYA124 GCCTTCAGTCCTTCACAACAGC TGACATCAGGGTCTGCACACAC SCYA125 CTTCAGCCTGGCACAAGGTTCG CTAGCGCAAATGAGCCGACCTC SCYA126 TTCTACAGCGCCACTGAGTCGA AGTTAGGTCTCAGAAACGTTGC Actin AGAGAGAAATTGTCCGTGACATC CTCCGATCCAGACAGAGTATTTG
Phylogenetic analyses and comparative genomics
Phylogenetic trees were drawn from ClustalW (Thompson et al. 1994) generated
multiple sequence alignments of amino acid sequences using the neighbor-joining
method (Saitou and Nei 1987) within the Molecular Evolutionary Genetics Analysis
27
[MEGA (3.0)] package (Kumar et al. 2004). Data were analyzed using Poisson
correction and gaps were removed by complete deletion. The topological stability of
the neighbor joining trees was evaluated by 1000 bootstrapping replications.
Comparisons of genomic organization and architecture of the CC chemokines
among catfish, chicken, and humans were made with the aid of BLAST searches,
phylogenetic sequence comparisons, and searches against the Ensembl genome
browsers for human, and chicken.
Results
Mapping catfish CC chemokine genes to BACs
We previously identified a total of 26 CC chemokines in catfish through the analysis of
ESTs (He et al. 2004; Peatman et al. 2005) named SCYA101-SCYA126. In order to
map these chemokine genes to BACs, overgo probes were designed based on the cDNA
sequences and used to screen high-density BAC filters. Initially, pooled overgo probes
for the 26 CC chemokines were used in the first screening that resulted in the
identification of a pool of potential BACs positive to CC chemokine probes. The
positive pool of BAC clones was picked from the arrayed BAC library and re-arrayed to
nylon membranes for confirmation using individual cDNA probes. cDNA probes for
each CC chemokine were used to screen the positive BACs.
As shown in Table 3, use of 26 cDNA probes in separate hybridizations resulted
in 232 cumulative positive BAC hits for the catfish chemokine genes. The

28
hybridization pattern, however, indicated that many of the chemokine probes had
positive results on the same BAC clones. Considering these overlaps, only 92 distinct
BAC clones were represented in the positive set. This pattern of distinct cDNA probes
hybridizing to the same BAC clones strongly suggested the presence of clusters of
catfish CC chemokine genes in the genome context.

29
Table 3 Mapping of catfish CC chemokine genes to BACs through cDNA hybridization. A total of 92 unique BACs are represented in a cumulative total of 232 positive clones
Genes Positive BAC clones
SCYA101 105_D15, 006_I13, 028_G4, 025_A20, 067_J3, 026_K13, 050_J5, 051_D5, 115_I22, 167_G22, 090_M4, 007_C11, 003_N13
SCYA102 104_A3,088_M10, 164_N20, 044_A24, 069_N2,108_I9, 126_K10, 117_D24, 149_M19, 011_N1, 125_O17
SCYA103 039_K13 SCYA104 152_F2, 122_C9, 147_M12, 062_A9, 141_G12, 015_J14, 069_A16, 066_B19, 082_A13,
091_H12, 159_B7
SCYA105 50_J5 SCYA106 029_L5, 080_O10, 143_I8, 097_I13, 161_K1, 103_L4, 189_G23, 129_N10, 098_H1 SCYA107 006_I13, 067_J3, 050_J5, 090_M4, 007_C11, 003_N13, 184_M14, 071_C6 SCYA108 042_A8, 052_C23, 149_I8 SCYA109 029_L5, 080_O10, 143_I8, 097_I13, 161_K1, 103_L4, 189_G23, 129_N10, 098_H1 SCYA110 030_D8, 099_C4, 149_D11, 003_P23, 041_O13, 142_A8, 045_L17, 105_B8, 144_H14,
119_E18, 179_H22 SCYA111 030_D8, 099_C4, 149_D11, 003_P23, 041_O13, 142_A8, 045_L17, 105_B8, 144_H14,
121_I22, 129_P14, 119_E18 SCYA112 105_D15, 006_I13, 067_J3, 026_K13, 167_G22, 090_M4, 007_C11 SCYA113 037_D15, 052_F9 SCYA114 090_M4, 164_N20, 044_A24, 069_N2, 126_K10, 117_D24, 009_P8
SCYA115 105_D15, 099_C4, 179_H22, 006_I13, 028_G4, 025_A20, 067_J3, 026_K13, 050_J5, 051_D5, 115_I22, 167_G22, 090_M4, 007_C11, 003_N13
SCYA116 006_I13, 067_J3, 050_J5, 003_N13, 184_M14 SCYA117 105_D15, 030_D8, 099_C4, 149_D11, 003_P23, 041_O13, 045_L17, 105_B8, 144_H14,
107_K11, 102_J7, 153_I24, 154_F9, 163_F4, 072_K10, 125_D4, 073_P7, 121_I22, 065_H1, 061_G20, 129_P14, 059_H18, 119_E18, 062_I3, 167_E6, 045_09
SCYA118 067_J3, 090_M4, 003_N13, 184_M14 SCYA119 104_A3, 088_M10, 164_N20, 044_A24, 069_N2, 108_I9, 126_K10, 117_D24, 149_M19,
009_P8, 049_P12
SCYA120 152_F2, 122_C9 SCYA121 105_D15, 030_D8, 099_C4, 149_D11, 003_P23, 041_O13, 142_A8, 045_L17, 105_B8,
144_H14, 107_K11, 102_J7, 153_I24, 154_F9, 163_F4, 072_K10, 125_D4, 073_P7, 121_I22, 065_H1, 061_G20, 129_P14, 059_H18
SCYA122 030_D8, 099_C4, 149_D11, 003_P23, 041_O13, 142_A8, 045_L17, 105_B8, 144_H14, 102_J7, 129_P14, 119_E18, 062_I3
SCYA123 042_A8, 152_F2, 122_C9, 029_N24, 147_M12, 052_C23, 149_I8, 143_P9, 139_D5 SCYA124 152_F2 SCYA125 031_N17, 042_B8, 188_D18, 192_L24, 163_G22, 158_L9 SCYA126 099_C4, 142_A8, 045_L17, 105_B8, 144_H14, 102_J7, 121_I22, 129_P14, 119_E18,
062_I3 047_K12

30
Genomic clustering and duplication of catfish CC chemokine genes
Given the likelihood of genomic clustering of CC chemokine genes within the channel
catfish genome, we utilized our pool of positive BAC clones for analysis using
fluorescent fingerprinting to determine genomic copy numbers and cluster membership.
The fingerprinted contigs and singletons (those BAC clones that did not
assemble with others) are listed in Table 4. A total of 18 contigs were constructed after
BAC fingerprinting, and an example of the contigs is shown in Fig. 1. Eight BAC
clones for which we had hybridization data were not assembled into contigs and are
listed as singletons at the bottom of the table. A pattern of gene duplication and
clustering was immediately obvious from the merged data from fingerprinting and
hybridization. Only five CC chemokines, SCYA103, SCYA105, SCYA108,
SCYA113, and SCYA124, were present in a single copy. Five CC chemokines have at
least two copies in the catfish genome—SCYA110, SCYA111, SCYA116, SCYA118,
and SCYA125. Three genomic copies were found for eight of the catfish CC
chemokines including SCYA102, SCYA104, SCYA106, SCYA109, SCYA119,
SCYA120, SCYA122, and SCYA126. Four copies were found for five of the catfish
CC chemokines including SCYA101, SCYA112, SCYA114, SCYA115, and
SCYA126. Two CC chemokines, SCYA121 and SCYA123, had five genomic copies.
Lastly, six distinct genomic copies were found for SCYA117 (Table 4).

31
Table 4 Contigs and singletons produced by fluorescent fingerprinting of catfish BAC clones. BAC contigs were constructed using fluorescent fingerprinting with a cut off p-value of 10-10. BAC clones containing CC chemokine genes were initially selected for fingerprinting by pooled overgo probes, and, in most cases, also confirmed by using individual cDNA probes. Assignment of letters A-F to chemokine genes was arbitrary to differentiate between distinct copies of chemokines in different genomic regions. “*” indicates two distinct copies as determined by direct sequencing
Contigs Chemokines together based on fingerprinting and/or cDNA
hybridization
BAC clones in each contig/singleton
1 125A 163_G22, 055_F15, 135_J15, 045_I14, 003_B23, 015_L09, 013_M08, 190_O24, 186_O14, 103_I22, 163_G22, 136_B14, 080_J22, 139_A20, 082_G20, 176_O19
2 103 039_K13, 183_K11, 151_B13, 064_C5, 068_K21, 127_B21, 182_I19, I82_K19, 120_O3, 071_O4, 110_J16, 176_K21
3 113 037_D15, 052_F9, 146_N23, 093_C8, 025_C1
4 102A-114C-119A 104_A3, 088_M10, 009_P8 5 102B-114A,B*-119B-107A 164_N20, 044_A24, 069_N2,108_I9,
126_K10, 117_D24, 149_M19, 011_N1, 071_C6
6 107B-101A-112A-115A-116A-118A 006_I13, 028_G4, 067_J3, 003_N13, 184_M14
7 107C-101B-112B-115B-116B-118B-114D-105
050_J5, 090_M4
8 101C-112C-115C 025_A20, 026_K13, 051_D5, 115_I22, 167_G22, 007_C11
9 101D-112D-115D-117A-121A 105_D15, 154_F9, 073_P7, 065_H1 10 117B-121B 153_I24, 072_K10, 125_D4, 061_G20,
059_H18, 167_E6, 045_09 11 117C-121C-110A-111A-122A-126A 030_D8, 003_P23, 041_O13, 142_A8,
121_I22, 129_P14, 102_J7, 163_F4 12 117D-121D-110B-111B-122B-126B-115E 099_C4, 149_D11, 045_L17, 105_B8,
144_H14, 119_E18, 179_H22 13 126C 047_K12, 108_F9, 103_G10 14 106A-109A 097_I13, 161_K1, 129_N10 15 106B-109B 029_L5, 080_O10, 143_I8, 103_L4 16 106C-109C 189_G23, 182_C23, 050_E23 17 108-123A 042_A8, 052_C23, 149_I8, 029_N24,
143_P9, 139_C13 18 104A-123B 147_M12, 062_A9, 141_G12, 015_J14,
069_A16, 066_B19, 082_A13, 091_H12, 159_B7
Singletons 1 104B-120A,B*-123C 122_C9 2 104C-120C-123D-124 152_F2 3 123E 139_D5 4 117E-121E 107_K11 5 117F-122C-126D 062_I3

6 119C 049_P12 7 125B 158_L9 8 102C 125_O17
Fig. 1 Example of fingerprinted BAC contigs--contig 12 containing 117D-121D-110B-
111B-122B-126B-115E. Identifiers on each line are BAC clone names. Note that the
contigs do not allow the determination of CC chemokine gene arrangement order.
Eighteen of the fingerprinted BAC contigs or singletons contained more than
one catfish CC chemokine gene, illustrating extensive and repetitive genomic
clustering. Clusters of genes ranged in size from containing eight genes (Contig 7) to
containing only two (numerous contigs). Membership within the different contigs was
often highly similar or identical, suggesting that segmental gene duplication was likely
responsible for the genesis of many of these clusters. For example, there are three
contigs containing SCYA106 and SCYA109, each in a different contig. Likewise,
contigs 11 and 12 share identical members with the exception of SCYA115. Several of
the catfish CC chemokines, such as SCYA117 and SCYA121, are present in both the
smaller contigs (i.e. Contig 10) and the larger clusters (i.e. Contigs 9,11), indicating
possible genomic rearrangements.
32

33
Genomic architecture and phylogenetic analysis
Genomic sequencing allowed us to previously obtain the encoding genes for 23 of the
26 catfish CC chemokine cDNAs (Bao et al. 2006a). When the deduced amino acid
sequences of the coding regions of the 23 genes and the three cDNAs were subjected to
phylogenetic analysis, and sequence similarity compared with genomic location, several
interesting patterns emerged (Fig. 2). In several instances there was a high correlation
between sequence similarity and genomic architecture. For instance, SCYA123,
SCYA108, SCYA124, SCYA120A, and SCYA120B are located together in the
genome, and they also share a branch of the phylogenetic tree as analyzed by sequence
similarities. A very strong clade containing SCYA111, SCYA121, SCYA117, and
SCYA122 is present on the tree, and the four CC chemokines also are found together in
Contigs 11-12. Two additional and similar correlations between tree position and
genomic architecture can be seen for SCYA106-SCYA109 and for SCYA116-
SCYA118-SCYA102-SCYA101-SCYA107-SCYA114A-SCYA114B (Fig. 2). Such
correlations provide additional support for the theory that tandem and/or segmental
gene duplications were involved in the evolution of the catfish CC chemokine genes.

SCYA105
SCYA123
SCYA108
SCYA124
SCYA120A
SCYA120B
SCYA111
SCYA121
SCYA117
SCYA122
34
SCYA104
SCYA115
SCYA103
SCYA125
SCYA126
SCYA106
SCYA109
SCYA113
SCYA112
SCYA119
SCYA110
SCYA116
SCYA118
SCYA102
SCYA101
SCYA107
SCYA114A
SCYA114B99
97
7587
99
87
63
6565
57
76
72
55
87
60
50
35
2032
41
35
27
12
8
18
0 .2
Fig. 2 The phylogenetic tree was drawn from ClustalW generated multiple sequence
alignment of amino acid sequences using the neighbor-joining method within the MEGA

35
(3.0) package. Data were analyzed using Poisson correction and gaps were removed by
complete deletion. The topological stability of the neighbor joining trees was evaluated
by 1000 bootstrapping replications, and the bootstrapping values are indicated by
numbers at the nodes. Circles indicate chemokines sharing both sequence similarity and
genomic architecture as described in the text. GenBank accession numbers of the
sequences used are: DQ173276 (SCYA101), DQ173277 (SCYA102),
DQ173278(SCYA103), DQ173279(SCYA104), AY555502(SCYA105),
DQ173280(SCYA106), DQ173281(SCYA107), DQ173282(SCYA108),
DQ173283(SCYA109), DQ173284(SCYA110), DQ173285(SCYA111),
DQ173286(SCYA112), DQ173287(SCYA113), DQ173288(SCYA114A),
DQ173289(SCYA115), DQ173290(SCYA116), DQ173291(SCYA117),
DQ173292(SCYA118), DQ173293(SCYA119), DQ173294(SCYA120A),
DQ173295(SCYA121), DQ173296(SCYA122), CB937548(SCYA123),
DQ173297(SCYA124), BM028237(SCYA125), and DQ173298(SCYA126).
Expression analysis of catfish CC chemokine genes
We previously reported the expression of 12 catfish CC chemokine (SCYA115-
SCYA126) after challenge with Edwardsiella ictaluri (Peatman et al. 2005). To
determine expression patterns of all known catfish CC chemokines, here we conducted
expression analysis of the remaining 14 known catfish CC chemokines (SCYA101-
SCYA114) using RT-PCR in the head kidney and spleen tissues from both healthy fish
and fish challenged with the bacterial pathogen Edwardsiella ictaluri. In order to be

36
able to compare information on expression of all 26 known catfish CC chemokines, we
present here the novel expression data combined with previously published expression
data on SCYA115-126. As shown in Fig. 3, and summarized in Tables 5 and 6, four
main expression patterns were observed. The majority (16) of the 26 CC chemokines
were, on the whole, constitutively expressed with no effect observed after bacterial
infection (Fig. 3). These included SCYA102, SCYA104, SCYA107, SCYA110,
SCYA111, SCYA119, SCYA120, SCYA122, SCYA123, SCYA124, SCYA126,
SCYA101, SCYA106, SCYA108, SCYA114, and SCYA103. Of these, SCYA101,
SCYA106, SCYA108, and SCYA114 may be slightly up-regulated, and SCYA103 may
be slightly down-regulated, but the extent of up- or down-regulation was minor, and for
the purpose of discussion here, we categorized them into the constitutively expressed
group.

Fig. 3. Expression analysis of the 26 catfish CC chemokines using RT-PCR. RT-PCR
reactions were conducted as described in the Materials and Methods. RT-PCR products
were analyzed by agarose gel electrophoresis. Two tissues, spleen and head kidney (Hd
kidney), were used in the study, as indicated at the top of the figure. The names of the
37

38
catfish CC chemokines were indicated on the left margins of each panel of the gels.
Samples from healthy fish (0) and infected fish at 4h (4), 24h (24), and 72h (72) were
used. Molecular marker (M) was 1-kb ladder purchased from Invitrogen. Arrows
indicate the expected positions of the catfish CC chemokine RT-PCR products. The
RT-PCR product of the internal control, beta-actin, was not indicated, but in all cases, it
was the upper band on the gel. Note that RT-PCR reactions were conducted for one
gene at a time, and the images of agarose gels were compiled together into a single
figure and, therefore, expression levels can only be analyzed separately for each gene.
Note also that 32 PCR cycles were used for SCYA119 and SCYA121, whereas 29
cycles were used for the remaining chemokines.
Table 5 Up-regulated CC chemokines. NC denotes no change in expression; 0 indicated no expression detected; “+” indicates slightly up, “++” indicates intermediately up; and “+++” indicates greatly up. All comparisons of expression levels are within each individual gene and not among the other genes Spleen Head kidney
4h 24h 72h 4h 24h 72h SCYA105 ++ +++ NC ++ +++ NC SCYA117 ++ +++ + ++ +++ + SCYA109 + + +++ 0 0 0 SCYA112 NC NC ++ NC NC ++ SCYA113 NC NC NC + ++ +++ SCYA115 NC NC NC NC + ++ SCYA125 NC ++ + NC ++ +
Table 6 Down-regulated CC chemokines. The asterisk (*) indicated the presence of additional PCR bands for SCYA116. All comparisons of expression levels are within each individual gene and not among the other genes Spleen Head kidney
4h 24h 72h 4h 24h 72h SCYA116 NC NC NC NC NC -* SCYA121 NC NC - - - -

39
Seven of the 26 CC chemokines were up-regulated upon bacterial infection (Fig.
3 and Table 5). These included SCYA105, SCYA109, SCYA112, SCYA113,
SCYA115, SCYA117, and SCYA125. Of these up-regulated CC chemokines, the most
interesting were SCYA105, SCYA109, and SCYA117, which were expressed at very
low levels before infection, but their expression was dramatically induced after
challenge (Fig. 3, Peatman et al. 2005).
SCYA116 and SCYA121 were down-regulated upon bacterial infection (Fig. 3
and Table 6). The down-regulation was more evident with SCYA121, which showed a
significant reduction of RT-PCR products in both the head kidney and spleen, but the
response was more rapid in head kidney than in spleen (Fig. 3). SCYA116 expression
was lower three days after infection; extra bands were detected using RT-PCR, possibly
from unspliced products. With SCYA118 and SCYA126, no expression was detected at
any time point of the analysis. In order to confirm the lack of expression for SCYA118
and SCYA126, PCR amplification was repeated with extended cycles, but no products
were observed.
Differences were observed in the time points and tissues involving up-regulation
and down-regulation. For instance, SCYA105, SCYA117 and SCYA125 were rapidly
and highly induced after bacterial infection in both the spleen and the head kidney
tissues, whereas SCYA109 was only induced in spleen, but no expression was detected
from head kidney. In contrast, SCYA115 was moderately upregulated only in the head
kidney, but not in the spleen. SCYA121 expression was down-regulated in both spleen
and head kidney tissues, but more rapidly in head kidney (Fig. 3).

40
Discussion
In this study, all 26 previously identified catfish CC chemokine cDNAs were mapped to
BAC clones, setting the foundation for comparative genome analysis in the genomic
regions containing chemokine genes. Through a combination of cDNA probe
hybridizations and fluorescent fingerprinting, 18 fingerprinted contigs were assembled
from BACs containing catfish CC chemokine genes. The catfish CC chemokine genes
were found to be not only extensively clustered in the catfish genome, but also highly
duplicated at various levels. As many as six copies of a single catfish chemokine were
found from separate genomic regions. Although a draft genome is not available for
catfish, our approach allowed us to study the local genomic architecture of the catfish
CC chemokines in order to better understand the origins and orthologies of these
important immune molecules. With genome-enablement still years away in many
economically important species, our methods may serve as an important model for
researchers working with other similar species who want to harness genome
information on a limited budget. Here we have also analyzed the expression of the
transcripts of the 26 catfish CC chemokines in head kidney and spleen in response to
bacterial infection of Edwardsiella ictaluri, an economically devastating catfish
pathogen. Such analysis will allow us to concentrate research efforts on the CC
chemokines most likely involved in inflammatory responses.
The clustering of CC chemokine genes on chromosomes was previously
revealed in human, mouse, and chicken (Nomiyama et al. 2001, Wang et al. 2005). In
humans, the largest group of CC chemokine genes is located on chromosome 17, and

41
several clusters of CC chemokines genes are also found on chromosomes 7, 9, and 16.
Chicken has a large cluster of CC chemokines on chromosome 19, with member genes
orthologous to CC chemokines on human chromosome 17. A segment of mouse
chromosome 11 additionally corresponds to human chromosome 17. In the case of both
chicken and mouse, however, syntenies are only partially conserved with humans. For
example, chicken has three genes on chromosome 19 corresponding to a single gene,
CCL13, on human chromosome 17. Likewise, mouse has two genes CCL9 and CCL6
on Chromosome 11 that lack orthologues in human despite conservation of the genomic
neighborhood. This phenomenon, coupled with the high sequence similarity between
the non-orthologous CC chemokines of a given species, is highly suggestive of a pattern
of species-specific gene duplications and changes after species divergence. An
expectation of distinct expansions of the CC chemokine family within each species
means that the identification of orthologues by phylogenetic analysis will be largely
unsuccessful. Identification of a smaller ancestral set of CC chemokines and
comparisons of genomic organization and architecture across species, therefore, may be
more realistic aims for those describing novel sets of chemokines in lower vertebrates.
Duplication of CC chemokines within the human genome, before largely
unanalyzed or ignored, has become an important matter for research only lately. The
discovery that CC chemokine receptor 5 (CCR5) is an entry point for infection of cells
by HIV-1 (Alkhatib et al. 1996), and that CCL3 and CCL4, by binding to CCR5, limit
infection by HIV-1 (Nibbs et al. 1999), increased interest in understanding the
chemokine repertoire and their functions. More recently, researchers have focused on
CCL3 and CCL4 duplications and their correlation in disease severity (Townson et al.

42
2002). CCL3L1 and CCL4L1 have been discovered in segmental duplications on
chromosome 17 (Modi 2004). Of greatest note has been a recent study strongly
correlating copy number of a segmental duplication encompassing the gene encoding
CCL3L1 with HIV/AIDS susceptibility. Possession of a copy number of CCL3L1
lower than the population average markedly enhances susceptibility (Gonzalez et al.
2005; reviewed by Julg and Goebel, 2005). Additional correlations have been made
between copy numbers or chemokine loci and other diseases such as tuberculosis
(Jamieson et al. 2004). Chemokine architecture and duplication, therefore, is an
important matter for investigation in studies of the innate immune components of lower
vertebrates. Comparison of the major CC chemokine clusters across vertebrate species
may reveal important patterns of divergence or conservation and help to pinpoint
similar disease quantitative trait loci (QTL) in agricultural species.
Sequence and phylogenetic analyses are currently not capable of establishing
orthologies between the majority of mammalian CC chemokines and fish CC
chemokines (He et al. 2004; Laing and Secombes 2004b; Peatman et al. 2005), probably
because of the pattern of duplication and divergence described above. Nonetheless, we
attempted to match the genomic segments containing catfish CC chemokine genes we
obtained through fingerprinting with the largest of the human chromosome cluster of
CC chemokines (Fig. 4). It must be noted that we are still missing the larger genomic
context of these chemokine-containing contigs. Since only BAC clones positive for CC
probes were included in the fingerprinting, we lack the surrounding genomic regions. A
physical map of the catfish genome, currently under construction, when linked with
available linkage maps, will tell us whether these contigs are distinct contigs on the

43
same chromosome or on entirely different chromosomes. Based on our current
knowledge, therefore, we aligned the larger of the catfish clusters with the human
chromosomal segments using their top BLASTX identities. Some of the genomic
segments of catfish appeared loosely conserved, in that all chemokine gene members
shared highest identities with CC chemokines on the same chromosomal stretch in
humans (i.e. SCYA108, SCYA123, SCYA120, SCYA124, and SCYA104). Other
segments, such as the one containing SCYA107, SCYA101, SCYA112, SCYA105,
SCYA116, SCYA118 and SCYA115, showed no discernible pattern of conservation.
From this contig, SCYA101 and SCYA107 appear to be fish specific CC chemokines
(He et al. 2004) while SCYA112 shares clear orthology with human CCL20 which is
localized on Chromosome 2. Other chemokines from this contig share highest identities
with CC chemokines on human chromosome 17 (Fig. 4). One notable feature of this
“comparative map” was that many of the catfish CC chemokines share highest identity
with CCL3 or CCL14. These CC chemokines may represent part of the ancestral
repertoire before species-specific duplications and divergence.

44
17q12
17q11.2
SCYA121 SCYA110 SCYA117 SCYA111 SCYA122 SCYA126
CCL22
CCL17 50 kb16q13
9p13.3 CCL27 CCL19 28 kb
CCL21 20 kb
SCYA107 SCYA101 SCYA112 SCYA105 SCYA116 SCYA118 SCYA115
SCYA102 SCYA119 SCYA114
SCYA109 SCYA106
CCL2 CCL7 CCL11 CCL8
CCL13
CCL1
CCL5 CCL16
CCL14/15 CCL23 CCL18 CCL3 CCL4 CCL3L1
15 kb
15 kb
34 kb
37 kb
30 kb
4 kb
1.5 Mb
6 kb
51 kb
25 kb
105 kb
15 kb
198 kb
SCYA108 SCYA123 SCYA120 SCYA124 SCYA104
CCL26
CCL24 42 kb7q11.23

45
Fig. 4. A comparison of genomic contigs containing catfish CC chemokines with
clusters of human CC chemokines on several human chromosomal segments.
Chromosomal segment names for human are given on the left. Distances between the
human CC chemokines are noted in kilo-bases (kb) or mega-bases (Mb). Orientation of
the catfish contigs is unknown, and was arranged based on BLASTX identities as
described in the text. Dashed lines between the catfish and human CC chemokines
indicate especially low BLASTX identity. Boxes indicate catfish genomic contigs.
Dashed lines within the catfish contigs surround SCYA105 and SCYA108, whose
genomic contigs were merged with those shown to avoid showing duplicate copies in
the figure. Note that the order and orientation of individual catfish CC chemokine
genes were not determined and their relative positions shown in the contig (box) were
arbitrary.
Sequence similarities between the catfish CC chemokines correlated strongly
with genomic architecture (Table 4, Fig. 2) strongly suggesting tandem and segmental
gene duplications as the evolutionary mechanism responsible for the diversity of these
molecules presently in catfish. The 26 CC chemokine cDNAs with the additional
genomic copies revealed by fingerprinting leaves us with a tentative total of at least 75
genes. However, due to the relatively small pool of catfish ESTs in the GenBank, it is
not possible yet to provide solid EST evidence for these genes. Using the 26 genes as
queries against catfish ESTs allowed the identification of 186 catfish CC chemokine-
related ESTs. Cluster analysis using relatively stringent overlapping (90 bp) allowed us

46
to identify 18 additional CC chemokines with protein sequences different from the
queries. Thus, at the molecular level, it appeared that EST evidence as available now
supports the presence of additional genes in channel catfish, consistent with our
conclusions made from the BAC-based contig analysis. It is noteworthy that BAC-
based physical analysis is accurate in answering whether sequences similar to CC
chemokine genes physically exist in the catfish genome. Whether such sequences are
transcribed requires further analysis using transcriptome approaches. Future work,
including BAC sequencing and FISH, will help resolve questions related to the
ontogeny of this large catfish gene family.
Most of the inducible/inflammatory human CC chemokines are highly clustered
on chromosome 17, while the constitutive/homeostatic CC chemokines are on other
chromosomes (Moser et al. 2004). Despite the extensive clustering of the catfish CC
chemokines, a similar correlation between inducible expression and genomic
architecture was not observed after infection with Edwardsiella ictaluri in head kidney
and spleen tissues. Patterns of expression of genes within the same genomic clusters
often differed (i.e. SCYA117, SCYA121, SCYA122, SCYA126). It is possible that the
highly duplicated nature of the catfish CC chemokine genes has allowed division of
roles that may be manifested in spatial, temporal, or functional differences. Further
functional studies are needed to pinpoint the catfish CC chemokines integral to
successful innate immune responses against bacterial and viral pathogens, particularly
with regard to their function in directing leukocyte traffic after infection.

47
Acknowledgements This project was supported by a grant from USDA NRI Animal
Genome Basic Genome Reagents and Tools Program (USDA/NRICGP 2003-35205-
12827), in part by E-Institute of Shanghai Municipal Education Commission, Project
number E03009, and in part by a Specific Cooperative Agreement with USDA ARS
Aquatic Animal Health Laboratory under the Contract Number 58-6420-5-030.
Baolong Bao, Peng Xu, Puttharat Baoprasertkul, Yolanda Brady, and Zhanjiang Liu
were coauthors on the manuscript. We thank Renee Beam, Karen Veverica, Esau Arana,
and Randell Goodman for their excellence in the production and maintenance of fish
used in this study and their assistance during challenge experiments.

48
III. MICROARRAY-BASED GENE PROFILING OF THE ACUTE PHASE
RESPONSE IN CHANNEL CATFISH (ICTALURUS PUNCTATUS) AFTER
INFECTION WITH A GRAM NEGATIVE BACTERIUM

49
Abstract
The acute phase response (APR) is a set of metabolic and physiological reactions
occurring in the host in response to tissue infection or injury and is a crucial component
of the larger innate immune response. The APR is best characterized by dramatic
changes in the concentration of a group of plasma proteins known as acute phase
proteins (APP) which are synthesized in the liver and function in a wide range of
immunity-related activities. Utilizing a new high-density in situ oligonucleotide
microarray, we have evaluated the APR in channel catfish liver following infection with
Edwardsiella ictaluri, a bacterial pathogen that causes enteric septicemia of catfish.
Our catfish microarray design (28K) builds upon a previous 19K channel catfish array
by adding recently sequenced immune transcripts from channel catfish along with 7159
unique sequences from closely-related blue catfish. Analysis of microarray results using
a traditional two-fold change in gene expression cutoff and a 10% false discovery rate
revealed a well-developed APR in catfish, with particularly high up-regulation (>50-
fold) of genes involved in iron homeostasis (i.e. intelectin, hemopexin, haptoglobin,
ferritin, and transferrin). Other classical APP genes upregulated greater than two-fold
included coagulation factors, proteinase inhibitors, transport proteins, and complement
components. Up-regulation of the majority of the complement cascade was observed
including the membrane attack complex components and complement inhibitors. A
number of pathogen recognition receptors (PRRs) and chemokines were also
differentially expressed in the liver following infection. Independent testing of a
selection of up-regulated genes with real-time RT-PCR confirmed microarray results.

50
1. Introduction
The acute phase response (APR) is a group of rapid physiological responses to
infection or injury (Bayne and Gerwick et al. 2001; Gabay and Kushner 1999) and is
one of several components which comprise the innate immune system. The molecular
signals leading to the induction of the APR following infection, best characterized in
mammals, can now be traced from initial recognition of pathogen associated molecular
patterns (PAMPs) such as lipopolysaccharide (LPS) by host Toll-like receptors (TLRs),
through a resulting signaling cascade, to the ultimate activation of target genes
encoding pro-inflammatory cytokines such as IL-1, IL-6, and TNF-α (Pandey and
Agrawal 2006). The release of these cytokines has long been known to stimulate the
APR and rapidly alter rates of synthesis of a group of plasma proteins known as acute
phase proteins (APP) Fey and Gauldie 1990). As the site of synthesis of the majority of
plasma proteins, the liver is commonly considered the center of the APR. APPs are an
established diagnostic tool as early indicators of inflammation and disease (Schillaci
and Pirro 2006), but many are now known to play beneficial roles in mediating the
complex inflammatory response and seeking to restore homeostasis(Gabay and Kushner
1999).
Research on the APR and the larger innate immune response of teleost fish has
received more attention only recently as a growing worldwide aquaculture industry
faces disease outbreaks resulting in devastating losses (Meyer 1991). The acute nature
of these infections has drawn attention to the importance of the innate immune response
in fish. The APR has been best characterized previously in rainbow trout,

51
Oncorhynchus mykiss, using gene and protein-based techniques (Bayne et al. 2001;
Gerwick et al. 2002; Russell et al. 2006) and recently using a small oligo-based
microarray (Gerwick et al. 2007). Expression of a number of acute phase reactants has
also recently been measured in zebrafish Danio rerio using real-time PCR (Lin et al.
2007).
No information is known, however, about the nature of the APR in channel
catfish (Ictalurus punctatus), the predominant aquaculture species in the United States
and one of the best characterized teleost immune models to-date (Bengten et al. 2006).
Catfish production suffers heavy losses due to enteric septicemia of catfish (ESC),
caused by the Gram-negative, intracellular bacterium Edwardsiella ictaluri (USDA
2003; Hawke et al. 1981). ESC in its acute form is characterized by gastroenteric
septicemia and, under artificial challenge, often results in heavy mortalities as early as
four days after onset of infection (Newton et al. 1989; Wolters et al. 1994). To better
understand the crucial innate immune response of catfish in the context of ESC, we
have previously identified and characterized a large number of cytokines, chemokines,
antimicrobial peptides, and Toll-like receptors from catfish (He et al. 2004;
Baoprasertkul et al. 2004; Chen et al. 2005a; Baoprasertkul et al. 2005; Peatman et al.
2005; Bao et al. 2006a; 2006b; Peatman et al. 2006; Wang et al. 2006a; 2006b; 2006c;
Bao et al. 2005; Xu et al. 2005; Baoprasertkul et al. 2006; 2007) and identified
additional immune-related genes through EST sequencing (Ju et al. 2000; Cao et al.
2001; Karsi et al. 2002; Kocabas et al. 2002). To study the expression of these
important immune components in the larger context of the catfish transcriptome
following ESC infection, we have developed a high-density in situ oligonucleotide

52
microarray for catfish based upon a previous 19K channel catfish array (Li and
Waldbieser 2006). By adding 7,159 additional transcripts from blue catfish (Ictalurus
furcatus), a closely-related species to channel catfish sharing greater than 98%
nucleotide similarity within cDNA transcripts (He et al. 2003), along with additional
immune and non-immune transcripts from channel catfish, the new 28K microarray
design should capture a large proportion of the catfish transcriptome. Here we describe
the utilization of this 28K microarray for gene profiling of the acute phase response of
channel catfish following infection with E. ictaluri.
2. Materials and Methods
2.1. Experimental fish, disease challenge and sampling
All procedures involving the handling and treatment of fish used during this
study were approved by the Auburn University Institutional Animal Care and Use
Committee (AU-IACUC) prior to initiation. Blue (D&B strain) and channel catfish
(Kansas Random strain) fry were artificially spawned at the hatchery of the Auburn
University Fish Genetics Research Unit. At one week post-hatch, they were transferred
to troughs or aquaria at the USDA ARS Aquatic Animal Health Unit in Auburn, AL or
the Auburn University Fish Pathology wet lab. In both locations, the use of
recirculating systems and municipal or well water sources ensured that the catfish
fingerlings remained naïve to E. ictaluri during grow-out.

53
Catfish fingerlings were grown out for 4 months to approximately 15 cm before
artificial bacterial challenges. Challenges followed established detailed protocols for
ESC (Dunham et al. 1993; Baoprasertkul et al. 2004) with modifications. Water
temperature before challenge was gradually (over the course of 1 week) brought from
18°C to 27°C by mixing in heated water. Fish were challenged in 30-L aquaria with 6
control and 8 treatment aquaria used. Sixty fish were placed in each aquaria, 30 channel
and 30 blue catfish each. Aquaria were divided randomly into replicates of sampling
timepoints—24 h control (3 aquaria), 24 h treatment (3 aquaria), 3 d control (3 aquaria),
3 d treatment (3 aquaria), and moribund (2 aquaria). E. ictaluri bacteria were cultured
from a single isolate (MS-S97-773) and used in a small test infection of several channel
catfish. Bacteria were re-isolated from a single symptomatic fish and biochemically
confirmed to be E. ictaluri, before being inoculated into brain heart infusion (BHI)
medium and incubated in a shaker incubator at 28°C overnight. The bacterial
concentration was determined using colony forming unit (CFU) per ml by plating 10 μl
of 10-fold serial dilutions onto BHI agar plates. At the time of challenge, the bacterial
culture was added to the aquaria to a concentration of 4X10⁸ CFU/ml. Water was
turned off in the aquaria for 2 h of immersion exposure, and then continuous water
flow-through resumed for the duration of the challenge experiment. Control aquaria
were treated similarly with an identical volume of sterile BHI. Fish were fed lightly
during challenge. At 24 h and 3 d post-infection, 25 fish from each species were
collected from each of the appropriate control and treatment aquaria, euthanized with
MS-222 (300 mg/L), and their tissues and organs were collected and pooled. Pooling
was carried out due to tissue constraints in the juvenile fish and to reduce variability

54
between arrays to allow assessment of broad expression changes (see discussion).
Collected tissues and organs included head kidney, spleen, trunk kidney, liver, gill, and
skin. Samples were flash frozen in liquid nitrogen during collection and stored at -80
°C until RNA extraction. Procedures were the same for moribund fish except that they
were collected over the course of the challenge as they lost equilibrium in the water.
During the challenge, symptomatic treatment fish and control fish of each species were
collected and confirmed to be infected with E. ictaluri and pathogen-free, respectively,
at the Fish Disease Diagnostic Laboratory, Auburn University.
2.2. RNA extraction and labeling
Due to financial constraints, only channel catfish liver control and treatment
replicates at the 3 d time point were used for initial microarray analysis. Accordingly,
the pooled livers (n=25) from each replicate (3 control replicates, 3 treatment replicates)
were ground in liquid nitrogen by mortar and pestle to a fine powder and thoroughly
mixed. Approximately 30 mg of tissue powder was homogenized in Buffer RLT Plus
by passing the lysate several times through a 20-gauge needle fitted to a syringe
according to the protocol of the RNeasy Plus Mini Kit (Qiagen, Valencia, CA).
Samples were filtered through a genomic DNA elimination column included in the
RNeasy Plus kit. Following the manufacturer’s instructions, approximately 35 μg of
total RNA was obtained from each extraction. RNA quality and concentration was
checked by spectrophotometer analysis and gel electrophoresis. All extracted samples
had an A260/280 ratio of greater than 1.8, and were diluted to 1 μg/μL. RNA labeling,

55
array hybridization, washing, and scanning were carried out by NimbleGen Systems,
Inc. (Madison, WI).
Briefly, total RNA was converted to double-stranded cDNA using a SuperScript
II cDNA synthesis kit (Invitrogen) and an oligo-dT primer containing the T7 RNA
polymerase promoter. In vitro transcription (IVT) was carried out to produce biotin-
labeled cRNA from cDNA using the MEGAscript T7 kit (Ambion, Austin, TX).
Briefly, 3 μL double-stranded cDNA was incubated with 7.5 mM ATP and GTP, 5.6
mM UTP and CTP, 1.875 mM bio-11-CTP and bio-16 UTP (Enzo) and 1x T7 enzyme
mix in 1x reaction buffer for 16 h at 37˚C. The cRNA was then purified using an
RNeasy mini kit (Qiagen, Valencia, CA). Before hybridization, cRNA was fragmented
to an average size of 50 to 200 bp by incubation in a buffer of 100 mM potassium
acetate, 30 mM magnesium acetate, and 40 mM tris-acetate for 35 min at 94˚C.
Fragmentation was measured using a Bioanalyzer 1000 (Agilent Technologies, Palo
Alto, CA).
2.3. Microarray fabrication, hybridization and image acquisition
A high-density in situ oligonucleotide microarray was constructed, building on a
previously-published 19K catfish design (Li and Waldbieser 2006). Newly sequenced
transcripts including many ESTs related to immune functions from channel catfish were
added bringing the number of sequences from that species to 21,359. Additionally,
7,159 unique ESTs from the closely-related species blue catfish (Ictalurus furcatus)
were added to the microarray to increase the number of informative genes on the array

56
in cases where blue catfish ESTs contained a gene not present in the channel catfish
ESTs or to allow better eventual comparisons between the species in cases where
putative orthologues are present. To obtain a unique set of blue catfish ESTs, all
sequences available in the NCBI GenBank for the species as of March 2005 were
downloaded in FASTA format, added into the ContigExpress program of the Vector
NTI software suite (Invitrogen, Carlsbad, CA) and assembled. Singletons (non-
clustering sequences) and representative clones from contigs were selected and
reassembled in ContigExpress to ensure a unique gene set as described previously by
Peatman et al. (2004). A total of 28,518 sequences were used, therefore, to construct
the new catfish microarray. The added channel catfish and blue catfish sequences were
compared by BLASTX against the non-redundant (nr) protein database at NCBI, with a
cutoff E-value=0.00001 for annotation. A record of all sequences contained on the 28K
catfish microarray, their putative identities, expression values on each slide, and other
experimental data have been deposited in the NCBI Gene Expression Omnibus (GE0;
http://www.ncbi.nlm.nih.gov/geo/) accessible through the GEO series accession number
GSE6105.
Nimblegen Systems produced the physical microarrays utilizing an in situ
maskless array synthesis technology to synthesize 24 base pair (24mer) oligos on the
surface of the microarray slides (Singh-Gasson et al. 1999; Nuwaysir et al. 2002). At
least twelve 24-mer oligonucleotides were designed for each EST present on the
microarray. Half of these were perfect-match (PM) oligos selected along the length of
the sequence, while the other half were duplicates of the first but with two mismatched
(MM) bases at the #6 and #12 positions.

57
The microarrays were prehybridized with a solution of 2x MES hybridization
buffer (100 mM 2-morpholinoethanesulfonic acid, 1.0 M Na+, 20 mM EDTA, 0.01%
Tween 20), 50 µg of herring sperm DNA, and 250 µg of acetylated bovine serum
albumin (BSA) at 45°C for 15 min followed by hybridization with 10 µg of denatured
and fragmented cRNA per microarray, 3.5 µl of CPK6 control oligo, 35 µg of herring
sperm DNA, 175 µg of acetylated BSA, and 2X MES buffer at 45°C for 16 h with
constant rotation in a hybridization oven. After hybridization, the microarrays were
washed twice with nonstringent buffer (6x SSPE, 0.01% Tween 20) at room
temperature followed by two stringent washes (0.1 M Na+, 0.01% Tween 20) at 45°C
for 15 min each. After a final one minute rinse with nonstringent buffer, the arrays were
placed into a 1x stain solution (100 mM MES, 1 M Na+, 0.05% Tween 20, 50 mg/ml
BSA, and 1 µg/µl Cy3-streptavidin) at room temperature for 15 min, agitating every few
minutes. The microarrays were removed from the stain solution and placed in fresh
nonstringent wash buffer for one minute. They were then placed into Nimblegen’s
proprietary final wash buffer for 30 s, and then immediately dried under a stream of
argon gas and scanned using an Axon GenePix 4000B scanner (Molecular Devices,
Union City, CA) at 5-µm resolution. Six microarrays were used in the experiment,
corresponding to the 3 control pools and 3 treatment pools of RNA isolated three days
after infection.

58
2.4. Microarray data analysis
After extraction of data from raw images using the NimbleScan software
(Nimblegen, Inc.), gene calls (a single expression intensity value based on the multiple
probes for each gene) were generated using the Robust Multichip Average (RMA)
algorithm (Irizarry et al. 2003) which takes into account only the perfect match oligos.
RMA takes a background adjustment on the raw intensity scale, carries out quantile
normalization (Bolstad et al. 2003), takes the log2 of the normalized background
adjusted PM values, and then uses a linear model to estimate expression values on the
log scale. Both programs are available in the affy package of the Bioconductor project
(http://www.bioconductor.org). The normalized intensity values from the three control
sample microarrays and the three E. ictaluri-infected sample microarrays were then
analyzed using the Significance Analysis of Microarrays method (Tusher et al. 2001) in
the two-class unpaired mode (SAM version 2.23A:http://www-
stat.stanford.edu/~tibs/SAM/). SAM assigns each gene a relative difference score
based on its change in gene expression relative to the standard deviation of replicate
measurements for that gene. For genes falling above an adjustable threshold,
permutations of repeated measurements are used to determine a percentage of genes
identified by chance, the false discovery rate (FDR) (Benjamini and Hochberg 1995),
which is presented as a q-value for each gene in the final list of significant genes
(Tusher et al. 2001; Pawitan et al. 2005; Larsson et al. 2005). The q-value, therefore,
reflects the variability present in the data set for a given gene. A list of differentially
expressed genes with at least 2-fold expression changes between treatment and control

59
and a global false discovery rate of <10% was produced, and sorted according to fold-
change. BLASTX searches were conducted for each sequence on the list. In order to
provide insight into the potential identities of the differentially expressed genes, a less
stringent cutoff E-value (0.0001) was used, and the hit with the most negative E-value
was noted. Those sequences possessing no significant similarity to peptide sequences
within the nr database were assembled in ContigExpress to identify and remove any
redundant sequences. When a putative gene identity was shared by multiple sequences,
further sequence analysis was carried out to remove redundancies. In cases where
channel catfish and blue catfish putative orthologues of the same gene were
differentially expressed, the channel catfish transcript was selected to represent this
gene. If multiple channel catfish transcripts were determined to be derived from the
same gene, the transcript with the lowest q-value was chosen. In cases where two
differentially-expressed transcripts shared the same putative gene identity but likely
represented paralogues, both transcripts were kept on the unique list. A list of all
sequences (including redundancies) meeting the threshold parameters can be found as
Supplementary Tables S1 and S2.
2.5. Real-time RT-PCR analysis
The RNA prepared for microarray analysis was also used for confirmation of the
expression pattern of selected genes of interest by quantitative real-time reverse-
transcription polymerase chain reaction (qRT-PCR). The three control pools and three
treatment pools of RNA, each representing 25 fish, were utilized for each tested gene.

60
One-step qRT-PCR was carried out using a LightCycler 1.0 instrument (Roche Applied
Science, Indianapolis, IN) and the Fast Start RNA Master SYBR Green I reagents kit
(Roche Applied Science) following manufacturer's instructions with modifications.
Briefly, all qRT-PCR reactions were performed in a 10 μl total reaction volume (9 μl
master mix and 1 μl (100 ng) RNA template). The master mix contained 4.3 μl H2O,
0.6 μl Mn[OAc]2, 0.3 μl of each primer (0.1 μg/ μl), and 3.5 μl of the SYBR Green mix.
The same cycling parameters were used for all tested genes: (i) reverse transcription, 20
min at 61 °C; (ii) denaturation, 30 s at 95 °C; (iii) amplification repeated 50 times, 5 s at
95 °C, 5 s at 58 °C, 20 s at 72 °C; (iv) melting curve analysis, 5 s at 95 °C, 15 s at 65
°C, then up to 95 °C at a rate of 0.1 °C per second; (v) cooling, 30 s at 40 °C. Primers
were designed using either the FastPCR program
(http://www.biocenter.helsinki.fi/bi/Programs/fastpcr.htm) or the PriFi sequence
alignment and primer design program (Fredslund et al. 2005; http://cgi-
www.daimi.au.dk/cgi-chili/PriFi/main). Primer names, accession numbers, and
sequences are listed in Table 1. The 18S ribosomal RNA gene was selected for
normalization of expression levels due to its stable expression levels over a variety of
tissues and treatment conditions in catfish (Murdock et al. 2006). The triplicate
(biological) fluorescence intensities of the control and treatment products for each gene,
as measured by crossing-point (Ct) values, were compared and converted to fold
differences by the relative quantification method (Pfaffl, 2001) using the Relative
Expression Software Tool 384 v. 1 (REST) and assuming 100% efficiencies.
Expression differences between control and treatment groups were assessed for
statistical significance using a randomization test in the REST software. The mRNA

61
expression levels of all samples were normalized to the levels of 18S ribosomal RNA
gene in the same samples. Expression levels of 18S were constant between all samples
(<0.35 change in Ct). Each primer set amplified a single product as indicated by a
single peak present for each gene during melting curve analysis.
Table 1 Primers used for qRT-PCR confirmation (5’-3’) Gene Accession Forward Reverse
TLR5 CV993724 ATTAGCACGCCTTCCACAGC AGAGGTTCTGCAAGCCGGTC Intelectin TC6845 TCGGAGCTGCCGGGACATCAA
GGAG CCCTGCTCGCTTGACCAGCGATCAC
Hemopexin TC8425 TGACCGCTGTGAGGGCATCGAG
TGTGCATGCGGAAGGCTGCATCCA
SCYA113 AY555510 TCCACAAAGCCTGGTGGAATCC
AGTTGTTCTTTGTCGCACGAGG
Ferritin CK404798 CAGAGCGTGACGAGTGGGGCAG
AGGCGCTCCCATACGGCGCAGG
18S BE469353 TGCGCTTAATTTGACTCAACAC CGATCGAGACTCACTAACATCG
3. Results
3.1. Bacterial challenge, microarray sample selection and hybridization
The artificial challenge with virulent E. ictaluri resulted in widespread mortality of
infected fish at day 5 after exposure. No control fish manifested symptoms of ESC, and
randomly-selected control fish were confirmed to be negative for E. ictaluri by standard
diagnosis procedures. Dying fish manifested behavior and external signs associated
with ESC infection including hanging in the water column with head up and tail down
and petechial hemorrhages along their ventral surface. E. ictaluri bacteria were
successfully isolated from randomly-selected treatment fish. While two timepoints (24
h and 3 d) were selected for sampling, only the 3 d time point was chosen for

62
microarray analysis, due to financial restraints and a desire to include sufficient
biological replicates to allow robust statistical analysis. As liver is central to the APR
and is an important organ to innate immunity, it was selected for microarray analysis.
Six RNA samples were successfully extracted from the livers of the three control
replicate pools (n=25) and the three treatment replicate pools (n=25), labeled, and
hybridized to six high-density in situ oligonucleotide microarrays for catfish. The
catfish microarray contains 28,518 expressed sequences from channel catfish and blue
catfish, each represented by at least six probe pairs of 24 oligonucleotides each.
3.2. Analysis of catfish gene expression profiles after ESC infection
The expression levels of the 28,518 catfish transcripts in liver three days after
infection with E. ictaluri were compared with the levels seen in uninfected catfish.
After data normalization and gene expression calculation in the Robust Multichip
Average program (Irizarry et al. 2003), the resulting expression intensity values were
analyzed in SAM (Significance Analysis of Microarrays) (Tusher et al. 2001). The
criteria of a two-fold or greater change in expression and a global false discovery rate
(FDR) of 10% were chosen to determine upregulated or downregulated genes in the
infected replicates. Using these criteria, 301 transcripts were significantly upregulated,
and 6 were significantly downregulated (Supplemental Tables 1 and 2—see
appendices). Of the 301 upregulated catfish transcripts, 207 of these are believed to
represent unique genes, and 5 of the 6 significantly downregulated transcripts were
unique. The redundant transcripts resulted either from blue and channel putative

63
orthologues of the same gene or multiple transcripts from non-overlapping regions of a
large cDNA being included on the microarray. A wide range of levels of gene
upregulation was observed. Fourteen genes were upregulated from 10-85 fold
following infection; 16 genes were upregulated from 5-10 fold; 27 genes were
upregulated from 3-5 fold; and 150 genes were upregulated from 2-3 fold (Table 2).
Table 2 Profile of significant, differentially-expressed genes in catfish following E. ictaluri infection. Transcripts on the array 28,518 Number of upregulated transcripts 301 Number of unique upregulated genes 207 Number of unique genes upregulated >10 fold 14 Number of unique genes upregulated 5-10 fold 16 Number of unique genes upregulated 3-5 fold 27 Number of unique genes upregulated 2-3 fold 150 Number of downregulated transcripts 6 Number of unique downregulated genes 5
3.3. Putative identities of differentially expressed genes after infection with
Edwardsiella ictaluri
Of the 207 unique, significantly upregulated transcripts after infection, 127
could be annotated based on sequence similarity by BLASTX searches while 80 had no
significant similarity to protein sequences in the nr database (cutoff E-value=0.0001;
see Supplemental Tables 3 and 4 for unique upregulated transcripts with and without
annotation). Thirty catfish genes were upregulated 5-fold or greater, and their putative
functions, as obtained by PubMed and UniProt (http://www.pir.uniprot.org/) searches,
are listed in Table 3.

64
Table 3 Catfish genes upregulated 5-fold or greater in the liver following E. ictaluri infection. Accession refers to the GenBank accession number or TIGR consensus number of the sequence on the microarray. Putative Id is the hit with the most negative E-value. q-value is the false-discovery rate for the particular gene. Function is putative function of top BLAST hit Accession Putative identity Fold
Change q-value
Function
CF970955 Intelectin 85.4 1.25 Pathogen recognition Iron metabolism
CK408483 Haptoglobin precursor 34.3 0.00 Binds hemoglobin; APP
BM438750 Microfibrillar-associated protein 4 32.9 1.25 Unknown; lectin similar to ficolin and tachylectin—initiates complement?
TC6845 Intelectin 28.0 2.36 Same as above—putative paralogues
BM438689 Microfibrillar-associated protein 4 25.6 0.00 Same as above—putative paralogues
TC8425 Warm-temperature-acclimation-related-65kda-protein-like-protein
23.4 0.00 Similar to hemopexin—sequesters heme
TC7475 CC chemokine SCYA113 21.5 3.27 Unknown; putative catfish orthologue of human CCL19/ MIP-3-beta
CK406396 Neurotoxin/C59/Ly-6-like protein 21.3 1.25 Unknown; possible phospholipase inhibitor or complement membrane attack complex inhibitor
CV994031 Catechol-O-methyltransferase domain containing 1
14.8 0.00 Unknown; putative O-methyltransferase
TC9205 Hypothetical protein XP_683888 14.4 1.25 Unknown TC8426 Hemopexin precursor 13.6 2.36 Sequesters heme to
liver CV996638 Apolipoprotein Apoa4 protein 13.0 2.36 Lipid binding and
transport CV993724 Toll-like receptor 5 11.8 0.00 Pathogen recognition
receptor--flagellin CV987901 Complement C3-H1 10.0 1.71 Complement pathway;
inflammation EE993362 Complement protein component C7-1 9.7 0.00 Membrane attack
complex component TC9637 Fibrinogen alpha chain 9.6 0.00 Coagulation factor;
APP TC9194 Complement regulatory plasma protein 8.9 3.27 Factor H; complement
inhibition CV992853 Ceruloplasmin 8.5 0.00 Iron transport; APP TC9833 Microfibrillar-associated protein 4 8.4 1.25 Same as above—
putative paralogues TC8765 Transferrin 7.7 0.00 Transports iron—APP

65
TC8306 Fibrinogen gamma polypeptide 6.1 0.00 Coagulation factor; APP
CV989503 CXCL14 5.7 0.00 Chemokine—stimulates monocytes, NK cells
CV997126 Complement C3 5.6 0.00 Complement pathway; inflammation
TC7892 Ceruloplasmin 5.4 0.00 Same as above—putative paralogues
CV992447 Complement component C8 beta 5.4 3.27 Membrane attack complex component
TC7741 Complement factor B/C2-A3 5.4 3.74 Complement pathway BM494620 Serum/glucocorticoid regulated kinase 5.3 1.25 Cellular stress
response CV995884 Solute carrier family 31 (copper
transporters), member 1 5.3 0.00 Copper ion transport
TC8490 Fibrinogen, B beta polypeptide 5.2 1.71 Coagulation factor; APP
EE993545 Erythroblast membrane-associated protein
5.0 3.74 Cell adhesion or receptor molecule of erythroid cells; Ig superfamily member
3.4. Profiling of the APR in catfish
A conserved APR was evident in the significantly upregulated catfish transcripts
following infection. At least 35 of the 127 unique, annotated transcripts (Supplemental
Table 3) represented APPs (Bayne et al. 2001), including coagulation factors, proteinase
inhibitors, transport proteins, and complement components. Many of the APPs were
upregulated greater than 5-fold (Table 3).
Two subgroups of APP, iron transport/homeostasis proteins and complement
components, were represented by particularly high numbers of upregulated transcripts.
Transcripts representing at least 15 unique complement components or inhibitors were
upregulated 2-fold or greater following infection. These included: a short transcript
likely representing C1q (CV996365) upregulated 15.3-fold (Supplemental Table 1);

66
ficolin-like genes upregulated as much as 32-fold (BM438750); complement C2/Bf;
several C3 isoforms; complement component C4; complement component C5;
complement components C7, C8, and C9 active in the membrane attack complex; and
several complement regulatory proteins including MAC inhibitor CD59, C1 inhibitor,
and Factor H.
The most highly-upregulated group of functionally-related catfish genes was
composed of genes involved in iron homeostasis. These included intelectin, the most
highly-upregulated gene observed at >85-fold, haptoglobin (>34 fold), hemopexin (>25-
fold), ceruloplasmin (8.5-fold), transferrin (>7-fold), and ferritin (>2-fold).
3.5. Additional upregulated genes with putative immune functions
A number of additional genes believed to play important roles in the innate
immune response, inflammation, and/or cellular responses to infection were upregulated
after infection. These included Toll-like receptor 5, CC chemokine SCYA113, CXC
chemokine CXCL14, selenoprotein Pa, selenoprotein X, selenium binding protein,
chemotaxin, and several lectins (Table 3; Supplementary table S3).
3.6. Downregulated genes
A much smaller number of catfish transcripts were significantly downregulated
following infection with a narrow range of suppression (Table 4). These included liver-
expressed antimicrobial peptide-2, which is believed to be involved in the defense

67
response to bacteria (Bao et al. 2006b), and thioredoxin-interacting protein which
functions in the oxidative stress response in mammals.
Table 4 Unique, significantly downregulated catfish transcripts in liver after E. ictaluri infection. Accession refers to the GenBank accession number or TIGR consensus number of the sequence on the microarray. Putative Id is the hit with the most negative E-value. q-value is the false-discovery rate for the particular gene. Function is putative function of top BLAST hit
Accession Putative identity Fold Change
q-value
Function
TC7457 Eukaryotic translation initiation factor 3, subunit 6 interacting protein
0.42 6.5 Translation regulation
CK404061 No significant similarity 0.44 5.2 NA AY845143 Liver-expressed antimicrobial peptide 2 0.45 6.5 Defense
response to bacteria
CK403219 No significant similarity 0.47 7.5 NA TC6758 Thioredoxin interacting protein 0.49 1.7 Oxidative stress
mediator
3.7. Real-time RT-PCR confirmation of microarray results
Expression patterns of five genes identified by microarray analysis as
differentially expressed following infection were selected for confirmation using qRT-
PCR. Genes upregulated ranging from 2-fold to 85-fold in the microarray experiment
were selected and primers designed (Table 1). qRT-PCR results (Table 5) generally
confirmed the microarray results, with all tested genes showing statistically significant
upregulation greater than 2-fold (P<0.05). Fold changes measured by qRT-PCR were
larger than those measured by microarray likely due to the more specific binding
conditions of the PCR reaction (Table 5), and perhaps also due to the greater accuracy
in quantitation by qRT-PCR than by microarrays.

68
Table 5 Confirmation of microarray results by qRT-PCR Gene Accession Microarray Fold Change qRT-PCR Fold Change
Intelectin TC6845 +85.4 +545 (p=0.001)
Hemopexin TC8425 +23.4 +65 (p=0.001)
SCYA113 AY555510 +21.5 +235 (p=0.001)
TLR5 CV993724 +11.8 +71 (p=0.013)
Ferritin CK404798 +2.3 +10 (p=0.03)
4. Discussion
Utilization of a new catfish microarray led to the identification of 212 unique,
differentially expressed transcripts in the liver of channel catfish following infection
with Gram negative bacterium E. ictaluri. The challenge inherent to microarray
expression analysis is to move inward from large sets of raw data to a smaller set of
significant results and, finally, to answers to biological questions. Our aims in the
present experiment were to: a) validate a new catfish in situ oligonucleotide microarray
design which included larger numbers of immune transcripts; b) capture and quantify
the APR of catfish and compare it with previously described classical mammalian and
fish APRs; and c) identify further immune-relevant transcripts from catfish as potential
biomarkers for stress and disease (Rise et al. 2004b; Meijer et al. 2005; Kurobe et al.
2005; Mancia et al. 2006) and for future functional characterization, genetic mapping,
and QTL analysis (Xu et al. 2006). Our results will allow us to fulfill these aims and
move towards the long-term goal of improving disease resistance in catfish broodstocks.
Microarray-based transcriptomic profiling of the liver in teleost fish has been
utilized for measuring gene responses to a wide range of stimulants, in addition to

69
disease, including environmental toxicants, growth hormone transgenesis, and hypoxia
(Lam et al. 2006; Krasnov et al. 2005c; Williams et al. 2006; Rise et al. 2006; Ju et al.
2006) making it an ideal tissue for comparison of conserved expression patterns. The
catfish APR as measured in liver three days after infection included many of the genetic
components of the classical mammalian APR and also had overlapping results with a
recent APR study in rainbow trout liver (Gerwick et al. 2007) and other previous
salmonid and carp microarray experiments measuring expression in liver after
application of a variety of stressors (Tilton et al. 2005; Ewart et al. 2005; Martin et al.
2006; Reynders et al. 2006). A number of informative transcripts were shared between
the compared experiments and a potentially conserved set of both mammalian and
teleost acute phase reactants could be identified. Among the mammalian APP (Gabay
and Kushner 1999) upregulated greater than 2-fold in catfish were haptoglobin,
hemopexin, ferritin, transferrin, ceruloplasmin, fibrinogen, thrombin, alpha-2-
macroglobulin, trypsin inhibitor, plasmin inhibitor, plasminogen, and angiotensinogen,
and a large number of complement components and inhibitors (Fig. 1). Smaller subsets
of APP were reported to be differentially expressed in rainbow trout (Gerwick et al.
2007) and as measured by real-time PCR in zebrafish (Lin et al. 2006), indicating the
likely conservation of function of the vast majority of APP between mammals and
teleost fish. Comparative expression analysis under specific conditions could provide
fish biologists with important shortcuts towards a better understanding of function of
genes related to immunity and inflammatory responses.
0 5 10 15 20 25 30 35 40Haptoglobin
Hemopexin
Complement C3-H1
Complement C7-1
Fibrinogen
Complement factor H
Ceruloplasmin
Transferrin
Complement C8 beta
Complement B/C2-A3
Angiotensinogen
Complement C5-1
Complement C4-2
Complement C3-H2
Complement C9
Complement C3-S
Alpha-2-macroglobulin
Complement C3-Q1
C1 inhibitor
Thrombin
Plasmin inhibitor
Ferritin
Complement B/C2B
Trypsin inhibitor
CD59
Plasminogen
Acu
te phase protein
Fold Upregulation
Fig. 1 APP genes upregulated two-fold or greater in channel catfish following infection
with E. ictaluri.
70
A number of genes not classically considered acute phase reactants were also
observed to be shared between our results from catfish and several of the other

71
microa
ar-
; Lin
microarray
were up -
d
errin
in
nd was also identified to be highly upregulated in carp
liver af ing
rray experiments involving teleost liver, and some of these warrant further
comment as they may represent novel immunoregulators in fish. They included
intelectin (also reported by Reynders et al. 2006; Gerwick et al. 2007), microfibrill
associated protein 4 (Reynders et al. 2006), Toll-like receptor 5 (Ewart et al. 2005
et al. 2007), neurotoxin/differentially regulated trout protein (Tilton et al. 2005;
Gerwick et al. 2007; Martin et al. 2006; Ewart et al. 2005), SEC31/high affinity copper
uptake protein (Martin et al. 2006), and SEC61 (Gerwick et al. 2007).
Intelectin was the most highly upregulated catfish transcript in liver following
infection (Table 3). Five transcripts representing intelectin on the catfish
regulated greater than 5-fold (Supplemental Table 1). qRT-PCR showed a 545
fold upregulation in gene expression following infection (Table 5). In mammals,
intelectin is believed to be involved in pathogen defense mechanisms, recognizing
galactofuranose in carbohydrate chains of bacterial cell walls (Tsuji et al. 2001) an
may function as a receptor for lactoferrin, an iron sequestering homologue of transf
(Suzuki et al. 2001). We are currently investigating the function of catfish intelectins
the context of iron and disease.
Microfibrillar-associated protein 4 (mfap4) was also highly upregulated in
catfish following ESC infection a
ter cadmium exposure (Reynders et al. 2006). Multiple transcripts represent
several mfap4 genes are on the catfish microarray. Mfap4 is represented by a multi-gene
family in zebrafish and has strong similarity to ficolin and tachylectin. It may be
functioning in pathogen recognition and initiation of the lectin complement pathway
(Boshra et al. 2006).

72
th
wirtz et al. 2001; Tsujita et al. 2004). TLR5 has been well-
charact
was
this
s carp
ntially regulated trout protein was upregulated greater than 20-fold following
ty with
table. This result, though dissimilar to
ur
ased
Toll-like receptor 5 is a well-characterized pathogen recognition receptor in bo
mammals and fish (Ge
erized in catfish previously and was shown to be upregulated in the liver
following ESC infection (Bilodeau and Waldbieser 2005; Bilodeau et al. 2006) and
upregulated in the spleen after LPS exposure (Li and Waldbieser et al. 2006). In
study, TLR5 was observed to be upregulated greater than 11-fold by microarray
analysis.
A catfish transcript similar to neurotoxin/C59/Ly-6-like protein from gras
and differe
infection. The upregulation of this gene has been reported in several salmonid
microarray experiments on liver to-date and has been tentatively suggested to be an
APP (Bayne et al. 2001). While its function is unknown, it shares some similari
membrane attack complex inhibitor CD59.
The absence of the iron regulatory hormone hepcidin (Park et al. 2001) from the
transcriptomic profile of catfish liver was no
what was found in several other teleost expression studies in liver (Gerwick et al. 2007;
Tilton et al. 2005; Ewart et al. 2005; Martin et al. 2006; Lin et al. 2007), confirmed o
previous expression studies which showed that hepcidin was not upregulated three days
after infection (Bao et al. 2005). In mammals, an inflammatory stimulus (IL-6) induces
production of hepcidin in the liver. Hepcidin then blocks the release of iron from
macrophages, hepatocytes, and enterocytes by internalizing and degrading ferroportin,
the site of cellular iron export (Nemeth et al. 2004a). This leads to drastically decre
plasma iron levels during infection, a potential host defense mechanism to deny bacteria

73
tfish
ogical explanations can be suggested to explain the high
in
genes
gical
gh the
tion
Fe
access to the critical metal (Schaible et al. 2002). As plasma iron levels decrease, a
feedback mechanism is believed to downregulate hepcidin production in the liver
(Nemeth et al. 2004b).
Regulation of iron homeostasis was a key aspect of the APR observed in ca
(Fig. 2). Several physiol
upregulation of a large group of iron regulatory genes following infection. Liver iron
stores are known to be significantly increased by hepcidin, even as plasma iron
concentrations decline (Rivera et al. 2005). One would expect, therefore, an increase
iron storage, binding, and transport proteins such as haptoglobin, hemopexin,
transferrin, ceruloplasmin, and ferritin as seen in the results. Hepatocytes, which
account for 80% of the liver mass, are the primary site of synthesis for all these
(Anderson and Frazer 2005). In mammals many of these genes are active in
sequestering iron to restrict its availability to invading bacteria, and several are now
known to possess immunoregulatory and antioxidant properties under patholo
conditions which may supersede the importance of their roles in normal iron
metabolism (Melamed-Frank et al. 2001; Gueye et al. 2006; Tolosano et al. 2002;
Legrand et al. 2005; Giurgea et al. 2005; Anderson and Frazer 2005). Althou
exact mechanisms of gene upregulation in catfish are unknown at present, upregula
of a large number of genes involved in iron homeostasis suggests conservation of the
homeostasis pathway in dealing with infectious bacteria. Further investigation of this
important group of upregulated catfish transcripts is currently underway in our lab to
elucidate their functions and place them on catfish physical and linkage maps.

Fig. 2 Putative relationships of a set of upregulated catfish genes involved in iron
regulation highlighted on a diagram of pathways of iron homeostasis in mammalian
hepatocytes [adapted from Anderson and Frazer (2005)]. Upregulated catfish genes are
of
indicated in larger text with arrows and fold-upregulation nearby. The conservation
these pathways in catfish is currently unknown. DMT1, divalent metal transporter 1;
FPN1, ferriportin 1; SFT, stimulator of Fe transport; TfR1, transferrin receptor 1; TfR2,
transferrin receptor 2; HO-1, heme oxygenase 1; LRP, low density lipoprotein receptor-
related protein.
74

75
Peatman et al. 2006; Bao et al. 2006a; Baoprasertkul et al. 2005).
atfish
).
ser
itial
icroa
sing
et
only
a 10%
Two chemokines from catfish previously characterized in our laboratory,
SCYA113 and CXCL14, were upregulated greater than 5-fold after infection in liver
(He et al. 2004;
SCYA113 is a catfish CC chemokine most similar to mammalian CCL19, while c
CXCL14 is the putative orthologue of mammalian CXCL14 (Baoprasertkul et al. 2005
Upregulation of CCL19-like genes after infection has also been recently reported in
rainbow trout and Atlantic salmon (Morrison et al. 2006; Martin et al. 2006).
Interestingly, both chemokines are among a small handful of CC and CXC chemokines
traditionally considered to have homeostatic rather than inflammatory functions (Mo
et al. 2004). Their roles in the catfish immune response are still unclear.
The desire to capture genes that are involved in disease response at the species
level rather than inter-individual variations, financial cost, and small tissue sample sizes
were all factors that entered into our decision to create replicate pools for in
m rray analysis. The debate over pooling of biological samples for microarray
analysis has been contentious (Kendziorski et al. 2005; Jolly et al. 2005). However, a
consensus has emerged recently recognizing the advantages of pooling for decrea
variability between arrays and cost, if multiple pools are analyzed per group (Allison
al. 2006). We utilized RNA samples from three distinct treatment pools and three
distinct control pools for microarray analysis and were able to identify a large,
reproducible set of differentially expressed transcripts. We did observe that variability
between pools was noticeably larger among downregulated transcripts, resulting in
a small number of transcripts being declared significantly downregulated using
FDR cutoff. A similarly small number of transcripts were reported to be significantly

76
he infection
d
l
ted
the innate immune response of primitive teleost fish.
he ma
downregulated in the head kidney, spleen, and liver of Atlantic salmon following a
Gram negative bacterial infection (Ewart et al. 2005). This may reflect the nature of the
late-stage inflammatory response and/or be the result of the more transitory
downregulation of genes being masked in the pooled samples. Genes that are
differentially expressed in a sustained manner were more likely to be identified as
significant, given that the pooled fish were potentially at different stages of t
(Ewart et al. 2005). Analysis of the 3 d rather than 24 h timepoint likely favore
identification of upregulated genes, as the fish were likely in the process of termina
infection. We hope to conduct more comprehensive expression analysis in the future to
better understand this phenomenon. The larger set of non-significant downregula
genes, while not allowing global conclusions, will still yield candidates for further
genome mapping and analysis.
In summary, microarray analysis of transcriptomic changes in channel catfish
liver following an infection with Gram negative bacterium E. ictaluri indicated a
conserved APR occurs as part of
T jority of classical APPs were strongly upregulated in catfish along with a set of
putative “teleost” acute phase reactants. Several transcripts involved in iron
homeostasis were highly induced, suggesting that catfish may attempt to limit free iron
availability to inhibit bacterial growth and avoid metal-induced cellular damage. Strong
upregulation of the complement cascade, pathogen recognition receptors and
chemokines indicated that the catfish liver plays an integral role in pathogen recognition
and defense as well as inflammatory signaling. Ongoing functional characterization,

77
as supported by a grant from USDA NRI Animal Genome Tools
nd Resources Program (award # 2006-35616-16685), and in part by a seed grant from
the AA
ing Li,
re coauthors
r
ase
genetic mapping, and QTL analysis of many of these immune-related genes from
catfish will add to our understanding of the teleost immune system.
Acknowledgments
This project w
a
ES Foundation. We are grateful for an equipment grant from the National
Research Initiative Competitive Grant no. 2005-35206-15274 from the USDA
Cooperative State Research, Education, and Extension Service. Puttharat
Baoprasertkul, Jeffery Terhune, Peng Xu, Samiran Nandi, Huseyin Kucuktas, P
Shaolin Wang, Benjaporn Somridhivej, Rex Dunham, and Zhanjiang Liu a
on the manuscript. We thank Renee Beam, Esau Arana, and Randell Goodman for thei
excellence in the production and maintenance of fish used in this study and their
assistance during challenge experiments. We are grateful to Karl Hayden of the Fish
Disease Diagnostic Laboratory for his assistance in the diagnosis of the ESC dise
and the identification of the bacterial pathogen.

78
IV. TRANSCRIPTOMIC PROFILING OF THE LIVERS OF BLUE CATFISH
(ICTALURUS FURCATUS) FOLLOWING INFECTION WITH
EDWARDSIELLA ICTALURI

79
Abstract
The acute nature of disease outbreaks in aquaculture settings has emphasized the
importance of the innate immune response of fish for survival and led to the recent
identification and characterization of many of its components. Catfish, the predominant
aquaculture species in the United States, serves as an important model for the study of
the teleost immune system. However, tr
gene expression in catfish have only recently been initiated, and understanding of
immune responses to pathogen infections is limited. Here, we have developed and
utilized a 28K in situ oligonucleotide microarray composed of blue catfish (Ictalurus
furcatus) and channel catfish (Ictalurus punctatus) transcripts. While channel catfish
accounts for the majority of commercial production, the closely related blue catfish
possesses several economically important phenotypic traits. Microarray analysis of
gene expression changes in blue catfish liver after infection with Gram negative
bacterium Edwardsiella ictaluri indicated the strong upregulation of several pathways
involved in the inflammatory immune response and potentially in innate disease
resistance. A multifaceted response to infection could be observed, encompassing the
complement cascade, iron regulation, inflammatory cell signaling, and antigen
processing and presentation. The induction of several components of the MHC class I-
related pathway following infection with an intracellular bacterium is reported here for
the first time in fish. Our results add to the understanding of the teleost immune
responses and provide a solid foundation for future functional characterization, genetic
mapping, and QTL analysis of immunity-related genes from catfish.
anscriptomic-level studies of disease-related

80
ction
Studies of acute inflammation in mammals have often focused on the liver, a
major target for proinflammatory cytokines and the center of the acute phase response
(APR) component of innate immunity (Olivier et al. 1999; Gabay and Kushner 1999).
The APR in mammals is characterized by rapid, dramatic changes in the concentrations
of a set of plasma proteins termed the acute phase proteins (APP). Acute phase proteins
are an established diagnostic tool as early indicators of inflammation and disease
(Schillaci and Pirro 2006), and many are now known to play beneficial roles in
mediating the complex inflammatory response and seeking to restore homeostasis
following infection or injury (Gabay and Kushner 1999).
Recent studies using genomic approaches in teleost fish have indicated that the
liver is an important source of immune transcripts (Martin et al. 2006; Ewart et al.
2005) and mediates a powerful, conserved APR (Bayne et al. 2001; Bayne and Gerwick
2001; Gerwick et al. 2007; Lin et al. 2007). Research on the APR and the larger innate
immune response of teleost fish has taken on new importance as a growing worldwide
aquaculture industry faces disease outbreaks resulting in devastating losses (Meyer,
1991). The outcome of these acute infections in fish appears to depend heavily on non-
specific immune responses (Camp et al. 2000). Characterization of the gene
components and pathways of the teleost innate immune system, therefore, has become
an area of particular focus in fish immunology, and has resulted in the identification of
large numbers of cytokines, complement components, pathogen recognition receptors
(PRR), and antimicrobial peptides from several aquaculture species (reviewed by
1. Introdu

81
6). Genome-wide comparative studies of immune components and
their expression after infection provide basic assessment and understanding of disease
resistance relevant to both basic research and practical applications.
The advent of microarray technology has allowed fish researchers to conduct
simultaneous expression analysis on tens of thousands of gene transcripts in organisms
subjected to a variety of diseases and environmental conditions (Rise et al. 2004b;
Ewart et al. 2005; Meijer et al. 2005; Martin et al. 2006; MacKenzie et al. 2006; Purcell
et al. 2006; Morrison et al. 2006; Matsuyama et al. 2006; Li and Waldbieser, 2006;
Roberge et al. 2007; Gerwick et al. 2007). Microarray studies provide important
context for the study of the immune response, connecting known immune components
to a broader set of genes with similar expression patterns. As more microarray studies
have been conducted using a variety of pathogens, host response profiles have begun to
highlight a number of genes with conserved expression patterns following infection
(Roberge et al. 2007), many of which like play important yet unknown roles in teleost
immunity. These genes serve as natural targets for further functional characterization,
development as molecular biomarkers for disease progression, and genetic mapping.
Catfish (Ictalurus spp.), the predominant aquaculture species in the United
States, serves as an important model for the study of the teleost immune system (Bao et
al. 2006a; Bengten et al. 2006). While channel catfish (I. punctatus) accounts for the
majority of commercial production, the closely related blue catfish (I. furcatus)
possesses several economically important phenotypic traits that have led to the
production of an interspecific hybrid (channel female x blue male) recently available for
commercial use (He et al. 2003; Chatakondi et al. 2005). Catfish production suffers
Magnadottir, 200
82
,
artificial
challen
s (Liu
large p d
heavy losses due to enteric septicemia of catfish (ESC), caused by the Gram-negative
intracellular bacterium Edwardsiella ictaluri (USDA 2003; Hawke et al. 1981). ESC in
its acute form is characterized by gastroenteric septicemia and, under
ge, often results in heavy mortalities as early as four days after infection
(Newton et al. 1989; Wolters and Johnson 1994). In trials, blue catfish had significantly
higher resistance to ESC than either channel catfish or hybrid catfish (Wolters et al.
1996). To move toward the goal of eventually identifying molecular contributors to this
increased resistance in blue catfish, we have previously developed extensive EST
resources for both catfish species and have developed interspecific mapping panel
et al. 2003b, He et al. 2003). In order to study the transcriptomic responses of blue
catfish following infection with E. ictaluri and develop important immune-related
markers for characterization and genetic mapping, we have developed a 28K in situ
oligonucleotide microarray composed of blue catfish and channel catfish transcripts
based upon a previous 19K channel catfish array (Li and Waldbieser 2006). By adding
7,159 additional transcripts from blue catfish, along with additional immune and non-
immune transcripts from channel catfish, the new 28K microarray design represents a
roportion of the catfish transcriptome. Here we describe the microarray-base
transcriptomic profiling of the livers of blue catfish following infection with E. ictaluri.

83
e
and 8 treatment aquaria used. Sixty fish were placed in each aquaria, 30 channel and 30
blue catfish each. Aquaria were divided randomly into replicates of sampling
timepoints—24 hr control (3 aquaria), 24 hr treatment (3 aquaria), 3 d control (3
aquaria), 3 d treatment (3 aquaria), and moribund (2 aquaria). E. ictaluri bacteria were
cultured from a single isolate (MS-S97-773) and used in a small test infection of several
2. Materials and methods
2.1. Disease challenge
All procedures involving the handling and treatment of fish used during this
study were approved by the Auburn University Institutional Animal Care and Use
Committee (AU-IACUC) prior to initiation. Blue catfish (D&B strain) and channel
catfish (Kansas Random strain) fry were artificially spawned at the hatchery of the
Auburn University Fish Genetics Research Unit. At one week post-hatch, they were
transferred to troughs or aquaria at the USDA ARS Aquatic Animal Health Unit in
Auburn, AL or the Auburn University Fish Pathology wet lab. In both locations, th
use of recirculating systems and municipal or well water sources ensured that the catfish
fingerlings remained naïve to E. ictaluri during grow-out.
Catfish fingerlings were grown out for 4 months to approximately 15 cm before
artificial bacterial challenges. Challenges followed established detailed protocols for
ESC (Dunham et al. 1993; Baoprasertkul et al. 2004) with modifications. Water
temperature before challenge was gradually (over the course of 1 week) brought to
27°C by mixing in heated water. Fish were challenged in 30-L aquaria with 6 control

84
lated from a single symptomatic fish and biochemically
onfirmed to be E. ictaluri, before being inoculated into brain heart infusion (BHI)
n a shaker incubator at 28 °C overnight. The bacterial
oncentration was determined using colony forming unit (CFU) per ml by plating 10 μl
of 10- l
nd to reduce variability
h
ion.
catfish. Bacteria were re-iso
c
medium and incubated i
c
fold serial dilutions onto BHI agar plates. At the time of challenge, the bacteria
culture was added to the aquaria to a concentration of 4X10⁸ CFU/ml. Water was
turned off in the aquaria for 2 h of immersion exposure, and then continuous water
flow-through resumed for the duration of the challenge experiment. Control aquaria
were treated similarly with an identical volume of sterile BHI. Fish were fed lightly
during challenge. At 24 hr and 3 d post-infection, 25 fish from each species were
collected from each of the appropriate control and treatment aquaria, euthanized with
MS-222 (300 mg/L), and their tissues and organs were collected and pooled. Pooling
was carried out due to tissue constraints in the juvenile fish a
between arrays to allow assessment of global expression changes. For the studies
described here, liver tissues were collected at day 3 after infection. Samples were flas
frozen in liquid nitrogen during collection and stored at -80 °C until RNA extract
Procedures were the same for moribund fish except that they were collected over the
course of the challenge as they lost equilibrium in the water. During the challenge,
symptomatic treatment fish and control fish were collected and confirmed to be infected
with E. ictaluri and pathogen-free, respectively, at the Fish Disease Diagnostic
Laboratory, Auburn University.

85
ding on a
e
ay
To
ase
ues on
data have been deposited in the NCBI Gene
xpression Omnibus (GE0; http://www.ncbi.nlm.nih.gov/geo/) accessible through the
EO series accession number GSE6350
2.2. Oligonucleotide microarray construction
A high-density in situ oligonucleotide microarray was constructed, buil
previously-published 19K catfish design (Li and Waldbieser, 2006). Newly sequenced
transcripts including many ESTs related to immune functions from channel catfish wer
added bringing the number of sequences from that species to 21,359. Additionally,
7,159 unique ESTs from blue catfish (Ictalurus furcatus) were added to the microarr
to increase the number of informative genes on the array in cases where blue catfish
ESTs contained a gene not present in the channel catfish ESTs or to allow better
eventual comparisons between the species in cases where orthologues are present.
obtain a unique set of blue catfish ESTs, all sequences available in the NCBI GenBank
for the species as of March 2005 were downloaded in FASTA format, added into the
ContigExpress program of the Vector NTI software suite (Invitrogen, Carlsbad, CA)
and clustered. Singletons (non-clustering sequences) and representative clones from
contigs were selected and reclustered to ensure a unique gene set as described
previously by Peatman et al. (2004). A total of 28,518 sequences were used, therefore,
to construct the new catfish microarray. The added channel catfish and blue catfish
sequences were compared by BLASTX against the non-redundant (nr) protein datab
at NCBI, with a cutoff e-value=0.00001 for annotation. A record of all sequences
contained on the 28K catfish microarray, their putative identities, expression val
each slide, and other experimental
E
G .

86
cal microarrays utilizing an in situ
askless array synthesis technology to synthesize 24 base pair (24mer) oligos on the
surface
ed
y
ral times
sis.
out by
Nimblegen Systems produced the physi
m
of the microarray slides (Singh-Gasson et al. 1999; Nuwaysir et al. 2002). At
least twelve 24-mer oligonucleotides were designed for each EST present on the
microarray. Half of these were perfect-match (PM) oligos selected along the length of
the sequence, while the other half were duplicates of the first but with two mismatch
(MM) bases at the #6 and #12 positions.
2.3. RNA extraction and labeling
Blue catfish liver control and treatment replicates at the 3 d time point were used
for initial microarray analysis. Accordingly, the pooled livers (n=25) from each
replicate (3 control replicates, 3 treatment replicates) were ground in liquid nitrogen b
mortar and pestle to a fine powder and thoroughly mixed. Approximately 30 mg of
tissue powder was homogenized in Buffer RLT Plus by passing the lysate seve
through a 20-gauge needle fitted to a syringe according to the protocol of the RNeasy
Plus Mini Kit (Qiagen, Valencia, CA). Following the manufacturer’s instructions,
approximately 35 μg of total RNA was obtained from each extraction. RNA quality
and concentration was checked by spectrophotometer analysis and gel electrophore
All extracted samples had an A260/280 ratio of greater than 1.8, and were diluted to 1
μg/μL. RNA labeling, array hybridization, washing, and scanning were carried
NimbleGen Systems, Inc. (Madison, WI).

87
cript
The cRNA was then purified using an
RNeasy mini kit (Qiagen, Valencia, CA). Before hybridization, cRNA was fragmented
by incubation in a buffer of 100 mM potassium
cetate, 30 mM magnesium acetate, and 40mM tris-acetate for 35 min at 94˚C.
Fragme
g
tion, the microarrays were washed twice
with nonstringent buffer (6x SSPE, 0.01% Tween 20) at room temperature followed by
Briefly, total RNA was converted to double-stranded cDNA using a SuperS
II cDNA synthesis kit (Invitrogen) and an oligo-dT primer containing the T7 RNA
polymerase promoter. In vitro transcription (IVT) was carried out to produce biotin-
labeled cRNA from cDNA using the MEGAscript T7 kit (Ambion, Austin, TX).
Briefly, 3 μL double-stranded cDNA was incubated with 7.5 mM ATP and GTP, 5.6
mM UTP and CTP, 1.875 mM bio-11-CTP and bio-16 UTP (Enzo) and 1x T7 enzyme
mix in 1x reaction buffer for 16 h at 37˚C.
to an average size of 50 to 200 bp
a
ntation was measured using a Bioanalyzer 1000 (Agilent Technologies, Palo
Alto, CA).
2.4. Hybridization and image acquisition
The oligonucleotide microarrays were prehybridized with a solution of 2x MES
hybridization buffer (100 mM 2-morpholinoethanesulfonic acid, 1.0 M Na+, 20 mM
EDTA, 0.01% Tween 20), 50 µg of herring sperm DNA, and 250 µg of acetylated
bovine serum albumin (BSA) at 45°C for 15 min followed by hybridization with 10 µg
of denatured and fragmented cRNA per microarray, 3.5 µl of CPK6 control oligo, 35 µ
of herring sperm DNA, 175 µg of acetylated BSA, and 2X MES buffer at 45°C for 16–
20 h with constant rotation. After hybridiza

88
two str
15
ly
ed in
A.
ray and bioinformatic data analysis
images using the NimbleScan software
imblegen, Inc.), gene calls (a single expression intensity value based on the multiple
probes
s.
ingent washes (100 mM MES salt and free acid solution, 0.1 M Na+, 0.01%
Tween 20) at 45°C for 15 min each. After a final one minute rinse with nonstringent
buffer, the arrays were placed into a 1x stain solution (100 mM MES, 1 M Na+, 0.05%
Tween 20, 50 mg/ml BSA, and 1 µg/µl Cy3-streptavidin) at room temperature for
min, agitating every few minutes. The microarrays were removed from the stain
solution and placed in fresh nonstringent wash buffer for one minute. They were then
placed into Nimblegen’s proprietary final wash buffer for 30 s, and then immediate
dried under a stream of argon gas and scanned using an Axon GenePix 4000B scanner
(Molecular Devices, Union City, CA) at 5-µm resolution. Six microarrays were us
the experiment, corresponding to the 3 control pools and 3 treatment pools of RN
2.5. Microar
After extraction of data from raw
(N
for each gene) were generated using the Robust Multichip Average (RMA)
algorithm (Irizarry et al. 2003) which takes into account only the perfect match oligo
RMA takes a background adjustment on the raw intensity scale, carries out quantile
normalization (Bolstad et al. 2003), takes the log2 of the normalized background
adjusted PM values, and then uses a linear model to estimate expression values on the
log scale. Both programs are available in the affy package of the Bioconductor project
(http://www.bioconductor.org). The normalized intensity values from the three contr
sample microarrays and the three ESC-infected sample microarrays were then analyzed
ol

89
o-using the Significance Analysis of Microarrays method (Tusher et al. 2001) in the tw
class unpaired mode (SAM version 2.23A:http://www-stat.stanford.edu/~tibs/SAM/).
SAM assigns each gene a relative difference score based on its change in gene
expression relative to the standard deviation of replicate measurements for that gene.
For genes falling above an adjustable threshold, permutations of repeated measur
are used to determine a percentage of genes identified by chance, the false discovery
rate (FDR; Benjamini and Hochberg, 1995), which is presented as a q-value for each
gene in the final list of significant genes (Tusher et al. 2001; Pawitan et al. 2005;
Larsson et al. 2005). The q-value, therefore, reflects the variability present in the data
set for a given gene. A list of significant genes with at least 2-fold expression changes
ements
between treatment and control and a global false discovery rate of <10% was produced,
quence on the list. In order to provide insight into the potential identities of the
differen d the
s.
and sorted according to fold-change. BLASTX searches were conducted for each
se
tially expressed genes, a less stringent cutoff E-value (0.0001) was used, an
top informative hit was noted. Those sequences possessing no significant similarity to
peptide sequences within the nr database were clustered to identify and remove any
redundant (blue-channel) sequences. When a putative gene identity was shared by
multiple sequences, further sequence analysis was carried out to remove redundancie
In cases where blue catfish and channel catfish orthologues of the same gene were
differentially expressed, the blue catfish transcript was selected to represent this gene.
If multiple blue catfish transcripts were found to be derived from the same gene, the
transcript with the lowest q-value was chosen. In cases where two

90
a et al.
m
y
odes
differentially-expressed transcripts shared the same putative gene identity but likely
represented paralogues, both transcripts were kept on the unique list.
Gene annotation was carried out using the BLAST2GO program (Cones
2005), a Java application which enables Gene Ontology (GO) based data mining on
sequences for which no GO annotation is currently available. FASTA-formatted
sequences representing the unique upregulated transcripts were uploaded to the progra
and BLASTX searches carried out. GO terms associated with the hits were retrieved b
the program and queries were annotated based on hit similarity and GO evidence c
(EC). Some query sequences were not annotated by the BLAST2GO process due to
uninformative top BLAST hits. These sequences were therefore searched against the
UniProt database (http://www.pir.uniprot.org/) and manually annotated in the
BLAST2GO program where appropriate.
2.6. Real-time RT-PCR analysis
The RNA prepared for microarray analysis was also used for validation of
selected genes of interest by real-time RT-PCR. The three control pools and three
treatment pools of RNA, each representing 25 fish, were utilized for each tested gene.
One-step quantitative RT-PCR was carried out using a LightCycler 1.0 instrument
(Roche Applied Science, Indianapolis, IN) and the Fast Start RNA Master SYBR Green
I reagents kit (Roche Applied Science) following manufacturer's instructions with
modifications. Briefly, all real time RT-PCR reactions were perform
ed in a 10 μl total
reaction volume (9 μl master mix and 1 μl (100 ng) RNA template). The master mix

91
of
ested genes: (i)
reverse
s, 5
g, 30
contained 4.3 μl H2O, 0.6 μl Mn[OAc]2, 0.3 μl of each primer (0.1 μg/μl), and 3.5 μl
the SYBR Green mix. The same cycling parameters were used for all t
transcription, 20 min at 61 °C; (ii) denaturation, 30 s at 95 °C; (iii) amplification
repeated 50 times, 5 s at 95 °C, 5 s at 58 °C, 20 s at 72 °C; (iv) melting curve analysi
s at 95 °C, 15 s at 65 °C, then up to 95 °C at a rate of 0.1 °C per second; (v) coolin
s at 40 °C. Primers were designed using either the FastPCR program
(http://www.biocenter.helsinki.fi/bi/Programs/fastpcr.htm) or the PriFi sequence
alignment and primer design program (Fredslund et al. 2005; http://cgi-
www.daimi.au.dk/cgi-chili/PriFi/main). Primer names, accession numbers, and
sequences are listed in Table 1. The 18S ribosomal RNA gene was selected for
normalization of expression levels due to its stable expression levels over a var
tissues and treatment conditions in catfish (M
iety of
urdock et al. 2006). The triplicate
uorescence intensities of the control and treatment products for each gene, as
values, were compared and converted to fold
differences by the relative quantification method (Pfaffl, 2001) using the Relative
Expres
A
fl
measured by crossing-point (Ct)
sion Software Tool 384 v. 1 (REST) and assuming 100% efficiencies.
Expression differences between control and treatment groups were assessed for
statistical significance using a randomization test in the REST software. The mRNA
expression levels of all samples were normalized to the levels of 18S ribosomal RN
gene in the same samples. Expression levels of 18S were constant between all samples
(<0.30 change in Ct). Each primer set amplified a single product as indicated by a
single peak present for each gene during melting curve analysis.

92
chemokine SCYA106; LAMP3, Lysosomal-associated membrane protein 3; MMP13,
Gene Accession Forward Reverse
Table 1 Primers used for real-time RT-PCR validation (5’-3’). SCYA106, CC
matrix metalloproteinase 13; LY6E2, lymphocyte antigen 6 complex, E2
SCYA106 AY555503 GTCTCTTGGAGAGCAAGCACT
G
CATCAGCTCTCTGACCCAGTC
G
Intelectin CF970955 TCGGAGCTGCCGGGACATCAA
GGAG
CCCTGCTCGCTTGACCAGCGA
TCAC
LAMP3 TC7925 TCTGAGGTGTTTCTGAACCAG
G
CCATGCCGAACCTGGC
C
Hemopexin CK406564 TGACCGCTGTGAGGGCATCGAG
TGTGCATGCGGAAGGCCCA
MMP13 CF972078 GCTGGCATCGGTGGAGACGCTC
ACGTTGGAATGCG
G C 18S BE469353 TGCGCTTAATTTGACTCAACA
C CGATCGAGACTCACTAACATCG
CATCA
TGCAT
TCAAGGCCT
LY6E2 CK404046 GGACACGTCATGACGAGCTCT CCTTCAGGCACAGGCAGATGA
3. Results
3.1. Bacterial challenge and microarray hybridization
The artificial challenge with virulent E. ictaluri resulted in mortality of infe
fish beginning at day 5 after exposure. No control fish manifested symptoms o
and randomly-selected control fish were confirmed to be negative for E. ictaluri by
standard diagnostic procedures. Dying fish manifested behavior and external signs
associated with ESC infection including hanging in the water column with head up and
tail down and petechial hemorrhages along their ventral surface. E. ictaluri bacteria
were successfully isolated from randomly-selected treatment fish. While two time
points (24 hr and 3 d) were selected for sampling, only the 3 d time point was chosen
cted
f ESC
for microarray analysis, due to financial restraints and a desire to include sufficient

93
nt organ
ples were
e rom o ol
treatment replicate pools (n=25), labeled, and hybridized to six high-density in situ
oligonucleotide microarrays for catfish. The catfish microarray contains 28,518
expressed sequences from channel catfish and blue catfish, each represented by at least
s i go
3.2. Microarray analysis of blue catfish expression following challenge
expression profile of blue catfish liver three days after infection with E.
taluri were compared with the levels seen in uninfected blue catfish. After data
Irizarry et al. 2003), the
resulting expression intensity values were analyzed in SAM (Tusher et al. 2001). The
criteria
ed,
nel
f a
biological replicates to allow robust statistical analysis. As liver is an importa
to innate immunity, it was selected for microarray analysis. Six RNA sam
xtracted f the livers f the three control replicate po s (n=25) and the three
ix probe pa rs of 24 oli nucleotides each.
The
ic
normalization and gene expression calculation in RMA (
of a two-fold or greater change in expression and a global false discovery rate
(FDR) of 10% were chosen to determine upregulated or downregulated genes in the
infected replicates. Using these criteria, 126 transcripts were significantly upregulat
and 5 were significantly downregulated (Supplemental Tables 5 and 6—see
appendices). Of the 126 upregulated catfish transcripts, 98 of these are believed to
represent unique genes. The redundant transcripts resulted either from blue and chan
orthologues of the same gene or multiple transcripts from non-overlapping regions o
large gene being included on the microarray.

94
ould
01;
and by searches against the UniProt
databas . Annotation results are summarized in Fig. 1. GO terms were ultimately
iological
rocesses assigned to the upregulated transcripts revealed that many shared putative
functio
76
al
n,
3.3. Bioinformatic analysis of induced transcripts following infection
Of the 98 unique, significantly upregulated transcripts after infection, 76 c
be annotated based on sequence similarity by BLASTX searches while 22 had no
significant similarity to protein sequences in the nr database (cutoff E-value=0.00
Table 2 and Supplemental Table 7). Gene ontology annotation was carried out using
the BLAST2GO program (Conesa et al. 2005)
e
assigned to 70 sequences. Analysis of specific (>level 6) GO terms for b
p
ns related to ion homeostasis and immune responses. Other large categories
included those related to protein modification, folding, and transport (Fig. 2). The
sequences with significant BLASTX hits were divided into similar broad function
categories in Table 2. The majority of the upregulated transcripts were grouped into six
categories each with at least 5 members—acute phase response; complement activation;
metal ion binding/transport; immune/defense response; protein processing, localizatio
folding; and protein degradation.

95
ng ESC infection. Accession, GenBank accession number or TIGR consensus number of the sequence on
e microarray; Putative Id, top informative BLASTX hit; q-value, false-discovery rate for the particular gene; Functional Classification, putative functions assigned based on gene onresponse encompasses bold transcripts included in other categories. Transcripts were
transcripts could be classified into multiple categories but are listed under the most .
Genes were sorted by fold change within functional categories
Classification Change )
Table 2 Catfish transcripts upregulated in the blue catfish liver followi
th
tology annotations and Uniprot entries of top BLAST hits. *Acute phase
grouped into broad functional categories of at least 5 unique transcripts. Some
specific category. Gene names appearing more than once should represent paralogues
Functional Accession Putative Id Fold q-value (%
Acute phase response*
CK407841 Fibrinogen gamma polypeptide 5.7 5.63
CF971953 Fibrinogen, beta chain isoform 4 5.6 9.82 TC8490 Fibrinogen, B beta polypeptide 4.2 7.00 CK408173 Pentraxin (Serum amyloid P-like) 4.1 8.70 CF971852 Fibrinogen alpha chain 3.8 9.82 BM438634 Angiotensinogen 2.4 9.82 Complement activation
EE993177 Complement factor H precursor 14.5 0.00
EE993354 Complement component 7 precursor
10.1 9.18
CV997126 Complement C3 6.1 8.97
EE993343 Complement C4 3.9 5.63 CV987901 Complement C3-H1 3.2 5.63 CK406493 Complement C3-Q1 3.1 5.63 Metal ion binding/transport
CF970955 Intelectin 48.6 9.82
CK408483 Haptoglobin precursor 20.4 9.82 CF971550 Warm
relat
TC7660 Complement component C9 5.2 8.70
CF971897 Intelectin 2 37.7 5.63
-temperature-acclimation-ed-65kDa (Hemopexin-like)
12.3 8.70
CK406564 Hemopexin precursor 9.7 5.63 CK408512 Solute carrier family 31 (copper
transporters), member 1 7.1 8.70
CF971219 Ceruloplasmin 4.7 9.18 CK408666 Transferrin 4.1 9.82 CK418197 Cytochrome P450 3A 3.6 7.00 Immune/defense response
AY555503 CC chemokine SCYA106 105.1 9.18
TC7475 CC chemokine SCYA113 12.5 8.97 TC7925 Lysosomal-associated membrane
protein 3 (CD208) 5.7 9.82
TC9859 MHC class I alpha chain 4.7 8.70 CF972295 Thioredoxin 3.8 9.82

96
9.82
T Lectin, galac g, soluble, 9 (galectin 9)-like 1
rocessing, calization, lding
TC9330 ER-resident chaperone calreticulin 4.8 5.63
(IRL685) )
CK405569 beta 2.8 9.82
BM438439 nce receptor, alpha 2.6 8.70
se) 94)
osaccharide-ase (48kDa) )
activator PA28 subunit,
)
iscellaneous ociated protein 4 enosyltransferase II
tein 4
7 nsporting lysosomal
BM438717 Tumor necrosis factor, alpha-induced protein 9 isoform 2
3.4 7.00
CF971576 Tumor necrosis factor, alpha-induced protein 9
3.1 9.18
EE993326 CD63 2.6 9.82 TC7043 CCAAT/enhancer binding protein
(C/EBP), beta 2.6 7.00
CK404046 Lymphocyte antigen 6 complex, locus E ligand isoform 2
2.5
CK401855 MHC class I alpha chain 2.5 5.63 TC6716 Beta-2 microglobulin precursor 2.3 9.82
C8645 toside-bindin 2.3 9.82
Protein
CV989503 CXCL14 2.2 9.82
plofo CK407547 Protein disulfide isomerase
associated 4 (Erp72) 4.7 5.63
TC7345 Fetuin-B precursor 3.3 9.18
CK411755 Integral membrane protein 1 (STT3 3.0 5.63 Translocon-associated protein (SSR2) Signal seque(SSR1)
TC8981 FK506 binding protein 2 (PPIa 2.6 5.63 CK415655 Endoplasmin (GRP 2.4 9.82 TC9170 Dolichyl-diphosphoolig
protein glycosyltransferDnajb11 protein (ERdj3
2.3 9.82
CK406459 2.1 9.18 Protein
egradation d
CK409611 Proteasome alpha Proteasome (p
3.2 9.82
TC9755 rosome, macropain) subunit, alpha type, 3
3.1 9.18
CF972078 Matrix metalloproteinase 13 Proteasome activator PA28 subunit,
2.8 5.63 TC6963
beta 2.3 9.82
TC7388 Proteasome (prosome, macropainsubunit, beta type, 6
2.2 9.82
M CK406362 Microfibrillar-ass 27.1 5.63 CK405246 Methionine ad
alpha subunit 8.3 9.82
CK
407588 Catechol-O-methyltransferase domain containing 1
7.9 8.70
BM438689 Microfibrillar-associated pro 7.5 8.97 CK
CK408412408535
Apolipoprotein Apoa4 protein Microfibrillar-associated protein 4
4.1 4.1
8.70 5.63
CK40531 Beta-actin 4.0 5.63 TC6790 Atpase H+ tra 3.0 5.63

97
e family, member V,
6 se 1
TC9648 sor protein- 2
2.4 9.82
9 e 5
CV995433 ent-binding EBP-2)
2.2 9.82
2 CK407421 Glutaredoxin (thioltransferase) 2.0 9.82 CF971597 Hypothetical protein XP_683888 20.6 9.82
CK407596 3.7 9.82
TC9161 tical protein LOC641319 2.0 5.63
vacuolar proton pump Armet protein TC
7903
CK406132 2.9 2.9
9.18 9.82 Alpha-1-tubulin
CK404348 H2A histonisoform 1 WW domain binding protein 2
2.7 8.97
CK40168 2.5 9.82 CK424035 Neuronal myosin light chain kina
Amyloid beta (A4) precur2.5 8.97
binding, family B, member CV98794 Fructose-1,6-bisphosphatase 1, lik 2.3 8.70 CV99099 Coactosin-like 1
Sterol regulatory elem2.3 9.82
protein 2 (SR Unknown
CV99516 Alcohol dehydrogenase 5 2.2 9.82
CK401799 MGC68649 protein LOC407646 protein
3.8 5.63
TC6930 LR8 protein 2.3 9.18 CK406492 Similar to family with sequence
similarity 46, member A isoform 1 Hypothe
2.3 0.00
22%
6%
41%
31%
No BLASTX identity BLASTX identity, no GO a tionnnotaBLASTX identity, BLAST2GO annotated BLASTX identity, manually annotated
F g. 1. Analysis a t ique, ificantl
u regulated transc e
i nd Gene On ology (GO) annotation of 98 un sign y
p ripts in blu catfish.
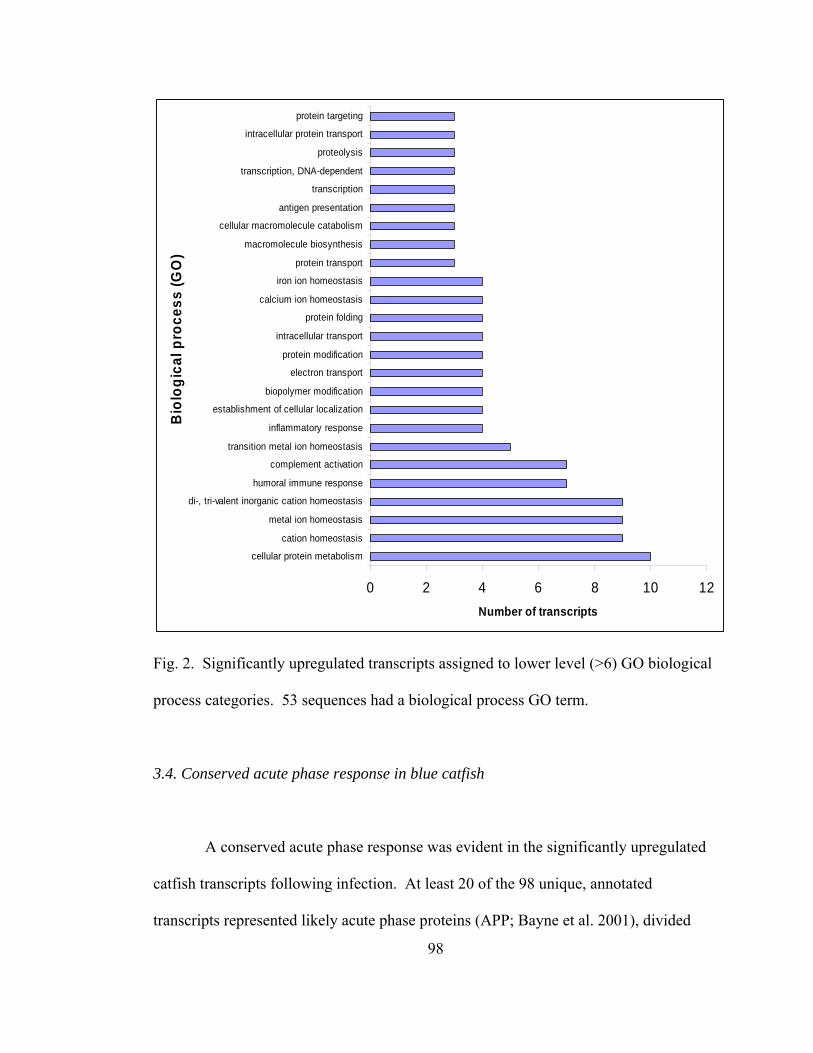
0 2 4 6 8 10 1
cellular protein metabolism
cation homeostasis
metal ion homeostasis
di-, tri-valent inorganic cation homeostasis
humor
2
respon
c ivati
transition sta
i respon
establishment zati
bi cati
p
cati
nsp
protein foldi
cal sta
sta
nsp
macrom ynthes
cellular mac i
tati
ripti
transcri nd
y
intracel por
argeti
Bio
lal
pro
cess
(GO
)
Number of transcripts
al immune se
omplement act
metal ion homeo
on
sis
nflammatory se
of cellular locali on
opolymer modifi on
electron trans ort
protein modifi on
intracellular tra ort
ng
siscium ion homeo
iron ion homeo sis
protein tra ort
olecule bios
romolecule c
is
smatabol
antigen presen on
transc on
ption, DNA-depe ent
proteol
lular protein trans
sis
t
protein t ng
ogic
Fig. 2. Significantly upregulated transcripts assigned to lower level (>6) GO biological
process categories. 53 sequences had a biological process GO term.
3.4. Conserved acute phase response in blue catfish
lated
t least 20 of the 98 unique, annotated
transcripts represented likely acute phase proteins (APP; Bayne et al. 2001), divided
A conserved acute phase response was evident in the significantly upregu
catfish transcripts following infection. A
98

99
among the acute phase response, complement activation and metal ion binding/transport
categories in Table 2 (bold names). Transcripts falling within these categories were
among the most highly upregulated following ESC infection. An active complement
response to infection was observed, with three forms of complement C3 upregulated
along with C4 and members of the membrane attack complex (C7, C9). The
complement regulatory protein factor H was also strongly upregulated (>14 fold).
Genes involved in iron binding and transport in mammals were strongly induced
following infection. These included intelectin, haptoglobin, hemopexin/warm-
temperature-acclimation- related, ceruloplasmin, and transferrin. Other upregulated
APP included pentraxin (serum amyloid P-like), fibrinogen, and angiotensinogen (Table
2).
3.5. Protein processing, localization, folding and degradation after ESC infection
A large number of transcripts with likely functions in protein modifications and
rotein response (UPR) which upregulates chaperones and genes for protein
ins during stress (Szegezdi et al.
006), or to the degradation and processing of antigens for the MHC class I molecule.
At leas
degradation were upregulated in the liver following infection. Members of these two
groups of genes were likely connected to the endoplasmic reticulum’s (ER) unfolded
p
degradation upon the accumulation of unfolded prote
2
t 15 unique transcripts were upregulated in these two categories including
chaperones, proteasome activators, and proteasome subunits (Table 2).
100
e
fish liver.
C
, among
Downregulated transcripts following ESC infection
ion with E. ictaluri (Table 3). Interestingly, two of the three transcripts
3.6. Induction of immune/defense response related transcripts
Upregulated transcripts with established roles in immune responses comprised
another large functional category, indicating that active immunosurveillance, immun
signaling, and immune cell activation were occurring in the infected blue cat
These included the most highly upregulated transcript observed, CC chemokine
SCYA106, at 105-fold. Other induced immune genes included two types of MH
class I alpha chain, CD63, CC chemokine SCYA113, CXCL14, and galectin 9
others (Table 2).
3.7.
A smaller number of catfish transcripts were significantly downregulated
following infect
with known identities were catfish selenoproteins P1b and selenoprotein H which may
possess antioxidant properties (Steinbrenner et al. 2006). A cell cycle gene, anaphase
promoting complex subunit 13, was also downregulated.

101
Table 3 Unique, significantly downregulated catfish transcripts in blue catfish liver after SC infection. Accession refers to the GenBank accession number or TIGR consensus
number of the sequence on the microarray. Putative Id is the top informative BLASTX hit. q-vfunction of top BLAST hit
Change value
E
alue is the false-discovery rate for the particular gene. Function is putative
Accession Putative identity Fold q- Function
CK417600
No significant similarity 0.4 9.57 NA
TC9079 Anaphase promoting complex subunit 13 0.5 9.57 Cell cyCB94079 Selenoprotein H 0.5 9.57 Stress o
response
CF971521 Selenoprotein P, plasma, 1b 0.5 9.57 Stress or
cle
0 r
defense
TC9060 No significant similarity 0.5 9.57 NA
defense response
ll tested genes except
intelectin showing statistically significant upregulation greater than 2-fold (P<0.05). A
strong upregulation of intelectin following infection was confirmed, despite the p-value
falling slightly above the set threshold due to greater variations among the biological
plicates. Fold changes measured by real time RT-PCR were larger than those
easured by microarray likely due to the more specific binding conditions of the PCR
3.8. Real-time RT-PCR confirmation of microarray results
Expression patterns of six genes identified by microarray analysis as
differentially expressed following infection were selected for validation using real-time
RT-PCR. Genes upregulated ranging from 2.5-fold to 105-fold in the microarray
experiment were selected and primers designed (Table 1). Real-time RT-PCR results
(Table 4) generally confirmed the microarray results, with a
re
m

102
action, and perhaps also due to the greater accuracy in quantitation by real-time PCR
Table 4 Validation of microarray results by QRT-PCR. SCYA106, CC chemoSCYA106; LAMP3 embrane pro M mm ote phocyte antigen 6 comp E2
ene ld Change RT-PC ld
re
than by microarrays.
kine , Lysosomal-associated m
inase 13; LY6E2, lymtein 3; M P13, atrix
etallopr lex, G Accession Microarray Fo Q R Fo Change
SCYA106 3 +105 +74 0.0AY55550 1 (p= 47)
Intelectin CF970955 +48 +455 (p=0.0
+5.7 +90.9 0.0
+9.7 +39 .0
MMP13 CF972078 +2.8 +2.6 (p=0.0
LY6E2 CK404046 +2.5 +4.3 (p=0.047)
55)
LAMP3 TC7925 (p= 47)
Hemopexin CK406564 (p=0 47)
47)
n
luri
et al. 2005; Peatman et al. 2005; Bao et al. 2006a; Peatman et al. 2006;Wang et al.
4. Discussio
We have utilized a high-density oligonucleotide microarray for catfish in order
to study the transcriptomic responses of blue catfish following infection with E. icta
and to identify and develop important immune-related markers for future
characterization and genetic mapping. Microarray analysis of the transcriptome profile
of the blue catfish liver following infection with the Gram negative bacterium led to the
identification of 103 differentially expressed transcripts.
The generation of a large set of catfish ESTs has aided the rapid identification
and characterization of many innate immune components including cytokines and
chemokines (He et al. 2004; Baoprasertkul et al. 2004; Chen et al. 2005a; Baoprasertkul

103
ke receptors (Baoprasertkul et al. 2006; 2007). To better utilize
atfish EST resources and to analyze the expression of these important immune
on, a
tfish array provides a
reasonably comprehensive platform from w o study express t tissues
and organs of catfish species.
liver was s the center acute phase res likely
contributor to the acute inflammatory reaction observed in the catfish response to
irulent E. ictaluri. The catfish APR as measured three days after infection included
any of the components of the mammalian APR and also contained commonalities
PR study in rainbow trout liver (Gerwick et al. 2007) and other previous
lmonid and carp microarray experiments measuring expression in liver after
ay and
s of APP were reported to be
-
n of
2006c), antimicrobial peptides (Bao et al. 2005; 2006b; Wang et al. 2006a; 2006b; Xu
et al. 2005), and Toll-li
c
components in the larger context of the catfish transcriptome following ESC infecti
28K in situ oligonucleotide microarray was designed. The 28K ca
hich t ion in importan
The targeted a of the ponse and as a
v
m
with a recent A
sa
application of a variety of stressors (Tilton et al. 2005; Ewart et al. 2005; Martin et al.
2006; Reynders et al. 2006). Acute phase proteins composed a significant percentage of
upregulated transcripts in blue catfish. Among the mammalian APP (Gab
Kushner, 1999) upregulated greater than 2-fold in blue catfish were haptoglobin,
hemopexin, transferrin, ceruloplasmin, fibrinogen, angiotensinogen, pentraxin and
several complement components (Table 2). Similar subset
differentially expressed in rainbow trout (Gerwick et al. 2007) and as measured by real
time PCR in zebrafish (Lin et al. 2007), indicating the likely conservation of functio
the vast majority of APP between mammals and teleost fish.

104
n multiple forms in fish, possibly serving as an
eost
d
the
.
lved
rmation that could
amplify all the differentially expressed transcripts.
Many of APP observed to be upregulated in blue catfish liver were likely
serving important functions in host defense. Pentraxin, upregulated 4.1-fold in the
current study, has recently been shown to be capable of initiating the complement
cascade and possesses opsonizing activity in the snapper Pagrus auratus (Cook et al.
2003; 2005). The complement system of teleost fish plays conserved roles in sensing
and clearing pathogens (Boshra et al. 2006). C3, as the central component of the
complement system, is present i
expanded pathogen recognition mechanism (Sunyer et al. 1998). We detected three
upregulated forms of C3 in blue catfish liver, emphasizing its importance in the tel
innate immune response. Complement C4, important for the activation of the lectin an
classical complement pathways, was also upregulated strongly. Two components of
membrane attack complex which carries out cell lysis, C7 and C9, were both
upregulated greater than 5-fold. Interestingly, the highest upregulation among
complement-related factors (14.5-fold) was seen for complement factor H which may
inactivate C3b in the alternative complement pathway (Boshra et al. 2006), suggesting
that the host fish were attempting to modulate the complement response (Table 2)
Intelectin was the most highly upregulated gene among several likely invo
in iron homeostasis, binding, and transport (Table 2). Induction of intelectin was
previously reported in carp (Reynders et al. 2006) and rainbow trout (Gerwick et al.
2007). Four transcripts representing intelectin on the catfish microarray were highly
upregulated (Supplemental Table 5) and these transcripts appear to represent at least
two genes. Primers were designed for real-time RT-PCR confi

105
ial
plasma
a access
ns
seen in
f
may
metabolism
Real-time RT-PCR showed a 455-fold upregulation in gene expression following
infection (Table 4). In mammals, intelectin is believed to be involved in pathogen
defense mechanisms, recognizing galactofuranose in carbohydrate chains of bacter
cell walls (Tsuji et al. 2001) and may function as a receptor for lactoferrin, an iron
sequestering homologue of transferrin (Suzuki et al. 2001). We are currently
investigating the function of catfish intelectins in the context of iron and disease.
Regulation of iron homeostasis was a key component of the acute phase
response observed in blue catfish. Iron regulation also plays an important role in the
mammalian host response to pathogens. In mammals, interleukin-6 induces production
of hepcidin in the liver. Hepcidin then blocks the release of iron from macrophages,
hepatocytes, and enterocytes by internalizing and degrading ferroportin, the site of
cellular iron export (Nemeth et al. 2004a). This leads to drastically decreased
iron levels during infection, a potential host defense mechanism to deny bacteri
to the critical metal (Schaible et al. 2002). Liver iron stores are known to be
significantly increased by hepcidin, even as plasma iron concentrations decline (Rivera
et al. 2005). The increase in expression of iron storage, binding, and transport protei
the results (Table 2) may be the result of increasing iron concentrations in the
liver. Hepatocytes, which account for 80% of the liver mass, are the primary site o
synthesis for haptoglobin, hemopexin, transferrin, and ceruloplasmin (Anderson and
Frazer, 2005). In mammals many of these genes are active in sequestering iron to
restrict its availability to invading bacteria, and several are known to possess
immunoregulatory and antioxidant properties under pathological conditions which
supersede the importance of their roles in normal iron

106
and et
ed to
the
rved to
7;
in is
late
infection
ns
een
Martin et
als, CXCL14 is
(Melamed-Frank et al. 2001; Gueye et al. 2006; Tolosano and Altruda, 2002; Legr
al. 2005; Giurgea et al. 2005; Anderson and Frazer, 2005). Further efforts are need
elucidate the role iron regulation plays in the catfish defense response.
The absence of the iron regulatory hormone hepcidin (Park et al. 2001) from
set of upregulated genes in blue catfish liver was notable given that it was obse
be highly upregulated in other teleost expression studies in liver (Gerwick et al. 200
Tilton et al. 2005; Ewart et al. 2005; Martin et al. 2006; Lin et al. 2007). Hepcid
represented by at least three transcripts on the microarray, none of which showed
significant upregulation. This result, however, agrees with our previous investigation of
hepcidin expression in channel catfish (Bao et al. 2005) which showed that hepcidin
expression was minimally upregulated in liver at 3 d post ESC infection. We specu
that by the 3 d time point after infection in blue catfish, hepcidin may have returned to
basal levels after an earlier induction.
A large group of transcripts with putative roles in immune responses to
were upregulated (Table 2). Two CC chemokines, SCYA106 and SCYA113,
previously identified from catfish were highly induced (He et al. 2004; Peatman et al.
2006; Bao et al. 2006a). SCYA106 was the most highly upregulated transcript in this
study (>105-fold). Both SCYA106 and SCYA113 are most similar to mammalian
CCL19 (MIP-3β), a regulator of dendritic cell trafficking to secondary lymphoid orga
(Humrich et al. 2006). Upregulation of CCL19-like genes after infection has also b
recently reported in rainbow trout and Atlantic salmon (Morrison et al. 2006;
al. 2006). A catfish orthologue of CXCL14 chemokine (Baoprasertkul et al. 2005) also
showed heightened expression in the liver after infection. In mamm

107
induced in
t-
roles
proliferation of catfish B cells (Khayat et al.
2001),
hocyte
.
known as a chemoattractant for activated monocytes, immature dendritic cells, and NK
cells (Starnes et al. 2006).
Two lesser known immune transcripts observed in catfish were also
zebrafish following infection with Mycobacterium marinum (Meijer et al. 2005).
Lysosomal-associated membrane protein 3 (DC-LAMP) was upregulated strongly both
in the microarray analysis and in real-time RT-PCR confirmation and is associated with
the endosomal/lysosomal MHC II compartments of dendritic cells in humans (de Sain
Vis et al. 1998; Arruda et al. 2006). Galectin-9 has recently been reported to play
in both innate and adaptive immunity--it possesses eosinophil chemoattractant activity,
induces superoxide production, induces dendritic cell maturation, and promotes Th1
immune responses (Dai et al. 2005).
Thioredoxin, upregulated 3.8-fold in this study, has been reported previously to
have important roles in the activation and
and may be also protecting the catfish liver against oxidative stress-induced
damage (Isoda et al. 2006). A catfish transcript with highest similarity to lymp
antigen 6 complex, locus E (LY6E) was also induced. Interestingly, this gene in
chicken has been identified as a putative disease resistance gene for Marek’s disease
virus by protein binding assays, linkage analysis, and microarrays (Liu et al. 2003a)
The upregulation of CCAAT/enhancer binding protein beta (C/EBP) was likely linked
to the active acute phase response observed (Table 2). This transcription factor is
induced by pro-inflammatory cytokines, and in turn regulates the expression of many
acute phase reactants (Poli, 1998).

108
d active antigen processing and presentation were likely
occurri
t
atterns following pathogen infections. Similarly,
minima
as
ays
The upregulation of two different MHC class I alpha chains and beta-2-
microglobulin (β2m) indicate
ng in the catfish liver 3 days after infection as part of a cell-mediated immune
response. E. ictaluri, as an intracellular bacterium, has been observed by electron
microscopy in vacuoles within liver macrophages 48 hr post infection and within the
vacuoles of hepatocytes 72 hr post infection. The bacterium was also observed to
survive and replicate within phagocytic cells (Baldwin and Newton, 1993). A MHC
class I and CD8+ cytotoxic T lymphocyte (CTL)-mediated response, therefore, would be
an expected response to E. ictaluri-infected cell types in the liver. The MHC class I
genes from catfish have been extensively characterized (Antao et al., 1999; 2001), bu
little is known about their expression p
l expression analysis of MHC class I-related genes has been conducted in teleost
species following infection with intracellular bacteria. In mammalian systems, Listeria
monocytogenes is an intracellular bacterial pathogen that has been well characterized
a model organism for the study of cell-mediated immunity. Several recently described
characteristics of the host response to L. monocytogenes may help to explain the
expression patterns observed in blue catfish. After exposure to L. monocytogenes,
hepatocytes upregulate MHC class I heavy chain and β2m, producing a rapid influx of
newly generated peptides into the endoplasmic reticulum (Chen et al. 2005b). CD8+ T
cells have been found to serve an important role in the innate immune response 3 d
after infection by L. monocytogenes by rapidly secreting IFN- in response to IL-12 an
IL-18 (Berg et al. 2003). This rapid
d
CD8+ T cell IFN- response has been associated

109
ith host
s
with lower bacterial burdens in the liver 3 days post infection and is correlated w
resistance in mice (D’Orazio et al. 2006).
In mammals, antigenic peptides presented on MHC class I molecules to CTL
are generated in the cytosol by degradation in the proteasome, translocated into the
endoplasmic reticulum, and loaded onto the MHC molecule with the help of several
protein components. Genes associated with the generation of peptides and peptide-
loading for the MHC class I molecules were also observed to be upregulated in blue
catfish liver (Table 2). Studies of intracellular bacterium L. monocytogenes again
provide insights into these expression patterns. Khan et al. (2001) reported the
replacement of constitutive proteasomes with immunoproteasomes in mice livers
starting two days after infection with L. monocytogenes. Immunoproteasomes support
the generation of MHC class I epiptopes and shape immunodominance hierarchies of
CD8 T cells (Chen et al. 2001). This switch in mice is marked by the upregulation of
proteasome activator PA28α and PA28β subunits (Khan et al. 2001)
+
, which alter the
fragmentation of polypeptides through the proteasome and are inducible by IFN- (Ahn
et al. 1995; Groettrup et al. 1996). Both PA28
nits
ng
cells.
α and β proteasome activator subu
were observed to be upregulated in blue catfish (Table 2), suggesting a shift toward
MHC class I antigen processing. This pathway has recently been reported to be
particularly important for protection against L. monocytogenes in hepatocytes, where
infection triggers expression of immunoproteasomes and eventual generation of CD8+
T-cell epitopes needed for bacterial clearance (Strehl et al. 2006). The author’s data
supported the view that, during infection, hepatocytes act as effective antigen presenti

110
urther evidence of an active MHC class I-
ediated
lpha
cea)
rt of
,
ol
f
d per group. Most of the catfish transcripts differentially expressed greater than
Two ER chaperones, calreticulin and endoplasmin (GRP94), were also
induced in the blue catfish liver, providing f
m response (Table 2). Among ER chaperones, GRP94 and calreticulin are
apparently unique in their ability to bind peptides suitable for assembly on to MHC
class I molecules (Nicchitta and Reed, 2000). We also noted that tapasin, another
molecule involved in MHC class I antigen loading, was upregulated 2.3-fold on the
microarray, but, with a q-value of 11%, was excluded from the set of genes declared
significantly upregulated. Recently, the coordinated upregulation of MHC class I a
chain, β m, and PA28-β was reported in large yellow croaker (Pseudosciana cro
following poly I:C injection (Liu et al. 2007). Our findings represent the first repo
the coordinated upregulation of these and several other MHC class I-related
components following a bacterial infection in fish. Further gene and cellular-based
studies are needed in catfish to understand the importance of MHC class I/CTL-
mediated responses to ESC infection.
Pooling and variation, in relation in microarray analysis, have been subjects of
vigorous debate (Kendziorski et al. 2005; Jolly et al. 2005). In the present experiment
we utilized RNA samples from three distinct treatment pools and three distinct contr
pools for microarray analysis and were able to identify a large, reproducible set o
differentially expressed transcripts. Our interest in primary transcriptome analysis lies
more with global expression patterns rather than inter-individual variations. In a recent
review article in Nature Genetics, Allison et al. (2006) recognized the advantages of
pooling for decreasing both variability between arrays and cost, if multiple pools were
analyze
2

111
ed
bles
far
response
ned
ed as significant, given that the pooled fish were
tion
two-fold had q-values of 5% or greater, indicating a certain level of variation exist
even between the replicate pools. Real time RT-PCR, however, confirmed that
transcripts approaching the 10% FDR cutoff were still significantly upregulated (Ta
2 and 4). In addition, the induction of multiple components belonging to the same
pathways and biological processes (described above) provided validation of the new
catfish microarray as a powerful tool for immune-related transcriptomic analysis. A
smaller number of transcripts were declared significantly downregulated than
significantly upregulated, a seemingly characteristic result of transcriptomic analyses of
bacterial infections. A similarly small number of transcripts were reported to be
significantly downregulated in Atlantic salmon following a Gram negative bacterial
infection (Ewart et al. 2005). This may reflect the nature of the inflammatory
in liver and/or be the result of the more transitory downregulation of genes being
masked in the pooled samples. Genes that are differentially expressed in a sustai
manner were more likely to be identifi
potentially at different stages of the infection. The larger set of non-significant
downregulated genes may still yield candidates for further mapping and analysis.
In conclusion, microarray analysis of gene expression changes in blue catfish
liver after infection with Gram negative bacterium E. ictaluri indicated the upregula
of several pathways likely involved in the inflammatory immune response. A
multifaceted response to infection could be observed, encompassing the complement
cascade, iron regulation, inflammatory cell signaling, and antigen processing and
presentation. The induction of several components of the MHC class I-related pathway
following infection with an intracellular bacterium is reported here for the first time in

112
ols
m
oodm
osis of
fish. Taken together, the microarray results add to our understanding of the teleost
immune responses and will provide a solid foundation for future functional
characterization, genetic mapping, and QTL analysis of immunity-related genes from
catfish.
Acknowledgments
This project was supported by a grant from USDA NRI Animal Genome To
and Resources Program (award # 2006-35616-16685), and in part by a seed grant fro
the AAES Foundation. We are grateful for an equipment grant from the National
Research Initiative Competitive Grant no. 2005-35206-15274 from the USDA
Cooperative State Research, Education, and Extension Service. Jeffery Terhune,
Puttharat Baoprasertkul, Peng Xu, Samiran Nandi, Shaolin Wang, Benjaporn
Somridhivej, Huseyin Kucuktas, Ping Li, Rex Dunham, and Zhanjiang Liu were
coauthors on the manuscript. We thank Renee Beam, Esau Arana, and Randell
G an for their excellence in the production and maintenance of fish used in this
study and their assistance during challenge experiments. We are grateful to Karl
Hayden of the Fish Disease Diagnostic Laboratory for his assistance in the diagn
the ESC disease and the identification of the bacterial pathogen.

113
V. CONCLUSIONS
he development of genetically-superior catfish brood stocks resistant to major diseases
nificant, lasting economic stimulus to the U.S. catfish industry.
rogress toward this goal will be made more rapidly as genomic tools and reagents are
develop
ork
ome
s
rtant
rinted
stered in the catfish
enome, but also extensively duplicated at various levels. Additionally, the expression
atterns of the transcripts of the 26 catfish CC chemokines were analyzed in head
idney and spleen in response to bacterial infection of E. ictaluri.
T
would represent a sig
P
ed and implemented for catfish. These tools will automate and simplify once
overwhelming tasks and serve to connect phenotypic differences with their genotypic
origins. Expressed sequence tags (ESTs) are one such genomic tool. Additional w
is required, however, to utilize effectively the short transcript sequences for gen
research. This may take the form of: development of markers from microsatellite
contained within ESTs; sequencing, expression analysis, and mapping of impo
genes or gene families identified from ESTs; or construction of microarrays for
transcriptome analysis based on the EST sequences.
In this work, 26 CC chemokines from catfish were mapped to BAC clones.
Through a combination of hybridization and fluorescent fingerprinting, 18 fingerp
contigs were assembled from BACs containing catfish CC chemokine genes. The
catfish CC chemokine genes were found to be not only highly clu
g
p
k

114
ESTs were also utilized in the development of a 28K in situ oligonucleotide
microarray composed of blue catfish (Ictalurus furcatus) and channel catfish (Ictalurus
punctatus) transcripts. Initial microarray analysis in channel catfish liver following an
fection with E. ictaluri captured 212 unique, differentially expressed transcripts, and
indicated a conserved acute phase response occurs as part of the innate immune
ique,
strong upregulation of several
pathwa to
n of
r description of
in
response of primitive teleost fish. The majority of classical acute phase proteins were
strongly upregulated in catfish along with a set of putative “teleost” acute phase
reactants. Several transcripts involved in iron homeostasis were highly induced,
suggesting that catfish may attempt to limit free iron availability to inhibit bacterial
growth and avoid metal-induced cellular damage. Strong upregulation of the
complement cascade, pathogen recognition receptors and chemokines indicated that the
catfish liver plays an integral role in pathogen recognition and defense as well as
inflammatory signaling.
In a parallel study to validate the microarray for blue catfish, analysis of gene
expression changes in blue catfish liver after E. ictaluri infection captured 103 un
differentially expressed transcripts, and indicated the
ys involved in the inflammatory immune response. A multifaceted response
infection could be observed, encompassing the complement cascade, iron regulation,
inflammatory cell signaling, and antigen processing and presentation. The inductio
several components of the MHC class I-related pathway following infection with an
intracellular bacterium was reported for the first time in fish.
The CC chemokine family from catfish, as the largest chemokine family
characterized from fish to-date, has served as a reference source fo

115
hemok ).
ides a
2007).
n
s family
ith resistance or susceptibility to ESC. The investigation of the
ave
cleotide microarrays
from ch re,
c ines from other fish species (i.e. Gonzalez et al. 2007; Peatman and Liu 2006
More concrete comparisons can be made between catfish and other fish chemokines
than with mammalian chemokines. Additional functional information will be gained as
orthologues of catfish CC chemokines are identified in other fish species during the
course of infection studies. The mapping of the CC chemokine gene family prov
useful dataset for the study of gene duplication and divergence in catfish. A database-
searchable, BAC-based physical map for catfish will soon be available (Xu et al.
This will allow further analysis of the extent of clustering of the CC chemokines i
catfish. Additionally, microsatellites identified from sequencing of the 26 CC
chemokine genes (Bao et al. 2006) are currently being utilized for mapping thi
to the catfish linkage map. This will provide information as to the chromosomal
arrangement of the chemokines and will serve to integrate the two maps as well as
testing for correlations w
catfish CC chemokines also led to the subsequent identification of a large number of
unannotated CC chemokine genes in zebrafish (Peatman and Liu 2006). Analysis of the
CC chemokines of catfish and zebrafish confirmed that lower teleost fish appear to h
a large number of species-specific tandem and segmental duplications of CC chemokine
loci. Further investigation of this phenomenon is needed given that similar genomic
regions in humans are increasingly recognized as hot spots for gene copy number
variation and are often linked to disease (Redon et al. 2006).
The construction and utilization of high-density oligonu
annel catfish and blue catfish ESTs represent a strong foundation for futu
widespread use of microarrays in catfish research. As technological breakthroughs

116
he
h.
,
, the
re
ish
oth species manifested
high in
continue to increase gene spotting densities and detection sensitivity and decrease
cost/array, microarrays will become a more practical tool for agricultural research. T
initial studies presented here produced informative, reproducible results. They also
helped to identify areas for improvement for future array designs and studies in catfis
The microarray results demonstrated the importance of a multifaceted,
integrated approach to genome research. A number of chemokines, Toll-like receptors
and antimicrobial peptides previously characterized in our lab were differentially
expressed on the microarrays. This made results more informative and facilitates
integrating expression candidates into mapping and QTL analysis. Additionally
current studies revealed a number of genes which may play important, but previously
undescribed, roles in catfish innate immune responses. A number of these genes a
currently being mapped to the BAC-based physical map, analyzed for expression
patterns in additional tissues, and sequenced to identify microsatellites for linkage
mapping. Besides making the catfish genome maps more informative, this will allow
QTL analysis of these genes in regards to ESC resistance. The entire set of
differentially expressed transcripts is also currently being searched for SNPs that would
allow them to be genetically mapped. These projects will lend greater biological
relevance to the data obtained by microarray analysis.
Comparison of sets of differentially expressed transcripts from channel catf
and blue catfish revealed more similiarities than differences. B
duced expression of acute phase proteins, complement components, and genes
involved in iron homeostasis. A MHC class I-related response was evident in blue
catfish but not in channel catfish. Overall, however, expression patterns may differ

117
tain
conduc ture a
issues
nate
ed
nce
ray
s for
be significantly higher than the
situ a
es
more between the two species in their timing than in the presence or absence of cer
gene components. Studies are underway to examine and compare expression patterns
of a subset of genes at the 24 hr timepoint in both species using quantitative real time
RT-PCR. Obviously, future studies could improve on the ones described here by
ting microarray analysis over several timepoints. This would likely cap
larger set of genes, and earlier timepoints would probably include more downregulated
genes than were seen at the 3 d timepoint. In the same vein, studies of additional t
would capture different sections of the transcriptome that are contributing to the in
immune response. While liver is fairly homogenous with regards to cell types it
contains, isolation of individual cell populations from various tissues may be more
informative than whole tissue analysis.
Additional changes in the future may lend greater power to microarray-bas
expression profiling in catfish. An ongoing Joint Genome Institute project to seque
300,000 ESTs from blue catfish and channel catfish will provide a significantly larger
set of unique transcripts. This will necessitate construction of a new microar
incorporating these transcripts. Since the vast majority of catfish genes should then be
included in the transcript set, it may prove feasible to construct spotted oligo array
catfish. While initial start-up costs for these arrays will
in rrays used here, long-term cost/array will be less, allowing more in-depth
microarray studies in catfish. Further work is also needed on developing infection
challenge models that more closely imitate disease conditions catfish experience in the
pond. Challenges utilizing lower bacterial concentrations and cohabitation challeng
may provide more realistic expression profiles. Finally, the ability to correlate gene

118
expression patterns with the ultimate survival or death of a fish is crucial in ultimately
identifying the genetic origins of phenotypic differences in disease resistance and
susceptibility.

119
CUMULATIVE BIBLIOGRAPHY
hn JY, Tanahashi N, Akiyama K, Hisamatsu H, Noda C, Tanaka K, Chung CH,
Shibmara N, Willy PJ, Mott JD, et al. (1995) Primary structures of two homologous
subunits of PA28, a gamma-interferon-inducible protein activator of the 20S
proteasome. FEBS Lett 366:37-42
huja SK, Murphy PM (1996) The CXC chemokines growth-regulated oncogene
(GRO) alpha, GRObeta, GROgamma, neutrophil-activating peptide-2, and epithelial
cell-derived neutrophil-activating peptide-78 are potent agonists for the type B, but
not the type A, human interleukin-8 receptor. J Biol Chem 271:20545–20550
lkhatib G, Combadiere C, Broder CC, Feng Y, Kennedy PE, Murphy PM, Berger EA
(1996) CC CKR5: A RANTES, MIP 1a, MIP-1b receptor as a fusion cofactor for
macrophage-tropic HIV1. Science 272:1955–1958
llison DB, Cui X, Page GP, Sabripour M (2006) Microarray data analysis: from
disarray to consolidation and consensus. Nat Rev Genet 7:55-65
nderson GJ, Frazer DM (2005) Hepatic iron metabolism. Semin Liver Dis 25:420-432
ntao AB, Chinchar VG, McConnell TJ, Miller NW, Clem LW, Wilson MR (1999)
MHC class I genes of the channel catfish: sequence analysis and expression.
Immunogenetics 49:303-311
A
A
A
A
A
A

120
Antao AB, Wilson M, Wang J, Bengten E, Miller NW, Clem LW, Chinchar VG (2001)
Genomic organization and differential expression of channel catfish MHC class I
genes. Dev Comp Immunol 25:579-595
Arruda LB, Sim D, Chikhlikar PR, Maciel M Jr, Akasaki K, August JT, Marques ET
(2006) Dendritic cell-lysosomal-associated membrane protein (LAMP) and LAMP-
and B
Aub stories
in males of the same population. Proc Biol Sci
Bac
Bal
ight and electron microscopic
Bao is expressed in a
Bao ation
d analysis of their expression in channel catfish
(Ictalurus punctatus). Dev Comp Immunol 30:783-796
1-HIV-1 gag chimeras have distinct cellular trafficking pathways and prime T
cell responses to a diverse repertoire of epitopes. J Immunol 177:2265-2275
in-Horth N, Landry CR, Letcher BH, Hofmann HA (2005) Alternative life hi
shape brain gene expression profiles
272:1655-1662
on K, Baggiolini M, Broxmeyer H, Horuk R, Lindley I, Mantovani A, Matsushima
K, Murphy P, Nomiyama H, Oppenheim J, Rot A, Schall T, Tsang M, Thorpe R,
Van Damme J, Wadhwa M, Yoshie O, Zlotnik A, Zoon K (2003)
Chemokine/chemokine receptor nomenclature. Cytokine 21:48–49
dwin TJ, Newton JC (1993) Pathogenesis of enteric septicemia of channel catfish,
caused by Edwardsiella ictaluri: Bacteriologic and l
findings. J Aquat Anim Health 5:189–198
B, Peatman E, Li P, He C, Liu ZJ (2005) Catfish hepcidin gene
wide range of tissues and exhibits tissue-specific upregulation after bacterial
infection. Dev Comp Immunol 29:939-950
B, Peatman E, Peng X, Baoprasertkul P, Wang G, Liu Z (2006a) Characteriz
of 23 CC chemokine genes an

121
ol Immunol 43:367-377
n
Bao n and
Baoprasertkul P, Peatman E, He C, Kucuktas H, Li P, Chen L, Simmons M, Liu Z
Bao ptor 3 and
Bax gt D (2005) Microarray-based detection
Bay uding
rainbow trout, Oncorhynchus mykiss,
Bay .
Bao B, Peatman E, Xu P, Li P, Zeng H, He C, Liu ZJ (2006b) The catfish liver-
expressed antimicrobial peptide 2 (LEAP-2) gene is expressed in a wide range of
tissues and developmentally regulated. M
Baoprasertkul P, He C, Peatman E, Zhang S, Li P, Liu Z (2005) Constitutive expressio
of three novel catfish CXC chemokines; homeostatic chemokines in teleost fish.
Mol Immunol 42:1355-1366
prasertkul P, Peatman E, Abernathy J, Liu Z (2007) Structural characterizatio
expression analysis of Toll-like receptor 2 gene from catfish. Fish Shellfish
Immunol, in press
(2004) Sequence analysis and expression of a CXC chemokine in resistant and
susceptible catfish after infection of Edwardsiella ictaluri. Dev Comp Immunol
28:769-780
prasertkul P, Peatman E, Somridhivej B, Liu Z (2006) Toll-like rece
TICAM genes in catfish (Ictalurus sp.): species-specific expression profiles
following infection with Edwardsiella ictaluri. Immunogenetics 58:817-830
i MK, Baxi S, Clavijo A, Burton KM, Dere
and typing of foot-and-mouth disease virus. Vet J 172:473-481
ne CJ, Gerwick L, Fujiki K, Nakao M, Yano T (2001) Immune-relevant (incl
acute phase) genes identified in the livers of
by means of suppression subtractive hybridization. Dev Comp Immunol 25:205-217
ne CJ, Gerwick L (2001) The acute phase response and innate immunity of fish
Dev Comp Immunol 25:725-743

122
Ben a practical and
Ber te
teria monocytogenes in the absence of cognate
Bilo ,
I in back-cross hybrid (F1 male (blue x channel) x female
Bilo h
irulent Edwardsiella ictaluri. Dev Comp Immunol29:713-721
ion
as.
Bengten E, Clem LW, Miller NW, Warr GW, Wilson M (2006) Channel catfish
immunoglobulins: repertoire and expression. Dev Comp Immunol 30:77-92
jamini Y, Hochberg Y (1995) Controlling the false discovery rate—
powerful approach to multiple testing. J R Stat Soc Ser B 57:289-300
g RE, Crossley E, Murray S, Forman J (2003) Memory CD8+ T cells provide inna
immune protection against Lis
antigen. J Exp Med 198:1583-1593
deau AL, Peterson BC, Bosworth BG (2006) Response of toll-like receptors
lysozyme, and IGF-
channel) catfish challenged with virulent Edwardsiella ictaluri. Fish Shellfish
Immunol 20:29-39
deau AL, Waldbieser GC (2005) Activation of TLR3 and TLR5 in channel catfis
exposed to v
Bolstad BM, Irizarry RA, Astrand M, Speed TP (2003) A comparison of normalizat
methods for high density oligonucleotide array data based on variance and bi
Bioinformatics 19:185-193
Boshra H, Li J, Sunyer JO (2006) Recent advances on the complement system of teleost
fish. Fish Shellfish Immunol 20:239-262
Byon JY, Ohira T, Hirono I, Aoki T (2005) Use of a cDNA microarray to study
immunity against viral hemorrhagic septicemia (VHS) in Japanese flounder
(Paralichthys olivaceus) following DNA vaccination. Fish Shellfish Immunol
18:135-147

123
panese
ics 54:387–397
r
nnel
Cao , Karsi A, Li P, Patterson A, Liu Z (2001) Transcriptome of
le F-1 hybrids. Aquaculture 247:1-4
bling interleukin-8: cDNA cloning, gene
p
Che
xpress abundant surface class I MHC and efficiently use transporter
associated with antigen processing, tapasin, and low molecular weight polypeptide
Byon JY, Ohira T, Hirono I, Aoki T (2006) Comparative immune responses in Ja
flounder, Paralichthys olivaceus after vaccination with viral hemorrhagic
septicemia virus (VHSV) recombinant glycoprotein and DNA vaccine using a
microarray analysis. Vaccine 24:921-930
Cai WW, Reneker J, Chow CW, Vaishnav M, Bradley A (1998) An anchored
framework BAC map of mouse chromosome 11 assembled using multiplex
oligonucleotide hybridization. Genom
Camp KL, Wolters WR, Rice CD (2000) Survivability and immune responses afte
challenge with Edwardsiella ictaluri in susceptible and resistant families of cha
catfish, Ictalurus punctatus. Fish Shellfish Immunol 10:475-487
D, Kocabas A, Ju Z
channel catfish (Ictalurus punctatus): initial analysis of genes and expression
profiles of the head kidney. Anim Genet 32:169-188
Chatakondi NG, Yant DR, Dunham RA (2005) Commercial production and
performance evaluation of channel catfish, Ictalurus punctatus female X blue
catfish, Ictalurus furcatus ma
Chen L, He C, Baoprasertkul P, Xu P, Li P, Serapion J, Waldbieser G, Wolters W, Liu
ZJ (2005a) Analysis of a catfish gene resem
structure, and expression after infection with Edwardsiella ictaluri. Dev Com
Immunol 29:135-142
n M, Tabaczewski P, Truscott SM, Van Kaer L, Stroynowski I (2005b)
Hepatocytes e

124
Che es
tiviral CD8(+) T cells at the levels of T
26
Cho
. Anal Biochem 162:156-159
: a
n
m. Dev Comp Immunol
Coo
idae) serum. Dev
Cre
Dai A, Murakami H, Kashio Y, Abe H, Katoh S, Kontani K,
005)
proteasome subunit components of antigen processing and presentation pathway. J
Immunol 175:1047-1055
n W, Norbury CC, Cho Y, Yewdell JW, Bennink JR (2001) Immunoproteasom
shape immunodominance hierarchies of an
cell repertoire and presentation of viral antigens. J. Exp. Med. 193:1319-13
mczynski P, Sacchi N (1987) Single-step method of RNA isolation by acid
guanidinium thiocyanate-phenol-chloroform extraction
Conesa A, Gotz S, Garcia-Gomez JM, Terol J, Talon M, Robles M (2005) Blast2GO
universal tool for annotation, visualization and analysis in functional genomics
research. Bioinformatics 21:3674-3676
Cook MT, Hayball PJ, Birdseye L, Bagley C, Nowak BF, Hayball JD (2003) Isolatio
and partial characterization of a pentraxin-like protein with complement-fixing
activity from snapper (Pagrus auratus, Sparidae) seru
27:579-588
k MT, Hayball PJ, Nowak BF, Hayball JD (2005) The opsonising activity of a
pentraxin-like protein isolated from snapper (Pagrus auratus, Spar
Comp Immunol 29:703-712
tich M, Damin F, Pirri G, Chiari M (2006) Protein and peptide arrays: Recent trends
and new directions. Biomol Eng 23:77-88
SY, Nakagawa R, Itoh
Kihara M, Zhang SL, Hata T, Nakamura T, Yamauchi A, Hirashima M (2
Galectin-9 induces maturation of human monocyte-derived dendritic cells. J
Immunol 175:2974-2981

125
Dav
ecular basis of cell migration in the fish lateral line: role
de S el S,
8) A
Dha , Read B (2003) Identification of
Dix CK-
hemokine of rainbow trout (Oncorhynchus mykiss). Immunol Rev
D'O
rly IFN-{gamma}response by CD8+ T Cells that
Dun (1993) Response to challenge with
nce
Dun
uture Genomics, Springer-Verlag, New York pp. 45-60
id NB, Sapede D, Saint-Etienne L, Thisse C, Thisse B, Dambly-Chaudiere C, Rosa
FM, Ghysen A (2002) Mol
of the chemokine receptor CXCR4 and of its ligand, SDF1. Proc Natl Acad Sci U S
A 99:16297-16302
aint-Vis B, Vincent J, Vandenabeele S, Vanbervliet B, Pin JJ, Ait-Yahia S, Pat
Mattei MG, Banchereau J, Zurawski S, Davoust J, Caux C, Lebecque S (199
novel lysosome-associated membrane glycoprotein, DC-LAMP, induced upon DC
maturation, is transiently expressed in MHC class II compartment. Immunity 9:325-
336
r AK, Dettori A, Roux MM, Klimpel KR
differentially expressed genes in shrimp (Penaeus stylirostris) infected with White
spot syndrome virus by cDNA microarrays. Arch Virol 148:2381-2396
on B, Shum B, Adams EJ, Magor KE, Hedrick RP, Muir DG, Parham P (1998)
1, a putative c
166:341–348
razio SE, Troese MJ, Starnbach MN (2006) Cytosolic localization of Listeria
monocytogenes triggers an ea
correlates with innate resistance to infection. J Immunol 177:7146-7154
ham RA, Brady Y, Vinitnantharat S
Edwardsiella ictaluri by channel catfish, Ictalurus punctatus, selected for resista
to E. ictaluri. J Appl Aquaculture 3:211-222
ham RA, Liu Z (2003) Gene mapping, isolation and genetic improvement in
catfish. In Aoki (ed) Aquac

126
Ew
dentification of genes differentially expressed in Atlantic
Fey
Fodor SP, Read JL, Pirrung MC, Stryer L, Lu AT, Solas D (1991) Light-directed,
Fre
of
Fuj
mokine, CXC chemokine receptors, allograft inflammatory factor-1,
Gab es to
Ger
stimulus. Fish Shellfish Immunol in
Ellis AE (2001) Innate host defense mechanisms of fish against viruses and bacteria.
Dev Comp Immunol 25:827-839
art KV, Belanger JC, Williams J, Karakach T, Penny S, Tsoi SC, Richards RC,
Douglas SE (2005) I
salmon (Salmo salar) in response to infection by Aeromonas salmonicida using
cDNA microarray technology. Dev Comp Immunol 29:333-347
GH, Gauldie J (1990) The acute phase response of the liver in inflammation. Prog
Liver Dis 9:89-116
spatially addressable parallel chemical synthesis. Science 251:767-773
dslund J, Schauser L, Madsen LH, Sandal N, Stougaard J (2005) PriFi: using a
multiple alignment of related sequences to find primers for amplification
homologs. Nucleic Acids Res 33:W516-520
iki K, Shin DH, Nakao M, Yano T (1999) Molecular cloning of carp (Cyprinus
carpio) CC che
and natural killer cell enhancing factor by use of suppression subtractive
hybridization. Immunogenetics 49:909–914
ay C, Kushner I (1999) Acute-phase proteins and other systemic respons
inflammation. N Engl J Med 340:448-454
wick L, Corley-Smith G, Bayne CJ (2007) Gene transcript changes in individual
rainbow trout livers following an inflammatory
press

127
J
f rainbow trout (Oncorhynchus mykiss) plasma
nol
Gew
e epithelial
Giurgea N, Constantinescu MI, Stanciu R, Suciu S, Muresan A (2005) Ceruloplasmin -
ease.
using
0
en L,
CCL3L1 gene-containing segmental
Gra R, Rogers J, Brass A, Cossins AR
Gerwick L, Steinhauer R, Lapatra S, Sandell T, Ortuno J, Hajiseyedjavadi N, Bayne C
(2002) The acute phase response o
proteins to viral, bacterial and fungal inflammatory agents. Fish Shellfish Immu
12:229-242
irtz AT, Navas TA, Lyons S, Godowski PJ, Madara JL (2001) Cutting edge:
bacterial flagellin activates basolaterally expressed TLR5 to induc
proinflammatory gene expression. J Immunol 167:1882-1885
acute-phase reactant or endogenous antioxidant? The case of cardiovascular dis
Med Sci Monit 11:RA48-51
Gonzalez SF, Chatziandreou N, Nielsen ME, Li W, Rogers J, Taylor R, Santos Y,
Cossins A (2007) Cutaneous immune responses in the common carp detected
transcript analysis. Mol Immunol 44:1675-169
Gonzalez E, Kulkarni H, Bolivar H, Mangano A, Sanchez R, Catano G, Nibbs RJ,
Freedman BI, Quinones MP, Bamshad MJ, Murthy KK, Rovin BH, Bradley W,
Clark RA, Anderson SA, O'connell RJ, Agan BK, Ahuja SS, Bologna R, S
Dolan MJ, Ahuja SK (2005) The influence of
duplications on HIV-1/AIDS susceptibility. Science 307:1434-1440
cey AY, Fraser EJ, Li W, Fang Y, Taylor R
(2004) Coping with cold: An integrative, multitissue analysis of the transcriptome of
a poikilothermic vertebrate. Proc Natl Acad Sci U S A 101:16970-16975
128
Gueye PM, Glasser N, Ferard G, Lessinger JM (2006) Influence of human haptoglobin
ls.
Haw wardsiella ictaluri
He , Kim S, Liu ZJ (2003) Putative SNP discovery in
5-
He Z (2004) Multiple CC chemokines
e
Hum er
mmunology
Ino
(Triakis
scyllia) CC chemokine cDNAs by use of suppression subtractive hybridization.
Immunogenetics 56:722-734
Groettrup M, Soza A, Eggers M, Kuehn L, Dick TP, Schild H, Rammensee HG,
Koszinowski UH, Kloetzel PM (1996) A role for the proteasome regulator
PA28alpha in antigen presentation. Nature 381:166-168
polymorphism on oxidative stress induced by free hemoglobin on red blood cel
Clin Chem Lab Med 44:542-547
ke JP, McWhorter AC, Steigerwalt AG, Brenner DJ (1981) Ed
sp. nov., the causative agent of enteric septicemia of catfish. Int J Syst Bacteriol
31:396–400
C, Chen L, Simmons M, Li P
interspecific hybrids of catfish by comparative EST analysis. Anim Genet 34:44
448
C, Peatman E, Baoprasertkul P, Kucuktas H, Liu
in channel catfish and blue catfish as revealed by analysis of expressed sequenc
tags. Immunogenetics 56:379-387
rich JY, Humrich JH, Averbeck M, Thumann P, Termeer C, Kampgen E, Schul
G, Jenne L (2006) Mature monocyte-derived dendritic cells respond more strongly
to CCL19 than to CXCL12: consequences for directional migration. I
117:238-247
ue Y, Saito T, Endo M, Haruta C, Nakai T, Moritomo T, Nakanishi T (2005)
Molecular cloning and preliminary expression analysis of banded dogfish

129
eed TP
leotide
in gene. Biochem Biophys Res Commun 350:157-
Jam ,
u W, Lins-Lainson Z, Shaw JJ, Ramos F, Silveira F, Blackwell JM
Jolly RA, Goldstein KM, Wei T, Gao H, Chen P, Huang S, Colet JM, Ryan TP, Thomas
Ju Z, Dunham RA, Liu Z (2002) Differential gene expression in the brain of channel
mics
Irizarry RA, Hobbs B, Collin F, Beazer-Barclay YD, Antonellis KJ, Scherf U, Sp
(2003) Exploration, normalization, and summaries of high density oligonuc
array probe level data. Biostatistics 4:249-264
Isoda K, Arita E, Kojima M, Ikkaku M, Tashiro F, Yamato E, Miyazaki J, Kawase M,
Kondoh M, Yagi K (2006) Protection against CCl4-induced injury in liver by
adenovirally introduced thioredox
161
ieson SE, Miller EN, Black GF, Peacock CS, Cordell HJ, Howson JM, Shaw MA
Burgner D, X
(2004) Evidence for a cluster of genes on chromosome 17q11-q21 controlling
susceptibility to tuberculosis and leprosy in Brazilians. Genes Immun 5:46-57
CE, Estrem ST (2005) Pooling samples within microarray studies: a comparative
analysis of rat liver transcription response to prototypical toxicants. Physiol
Genomics 22:346-355
Jordal AE, Torstensen BE, Tsoi S, Tocher DR, Lall SP, Douglas SE (2005) Dietary
rapeseed oil affects the expression of genes involved in hepatic lipid metabolism in
Atlantic salmon (Salmo salar L.). J Nutr 135:2355-2361
catfish (Ictalurus punctatus) in response to cold acclimation. Mol Genet Geno
268:87-95

130
-382
iol C
Julg B, Goebel FD (2005) Susceptibility to HIV/AIDS: an individual characteristic we
Kar )
of
-
Ken
SA
0162-10167
terial immune response in the liver. J Immunol 167:6859-6868
Ju Z, Karsi A, Kocabas A, Patterson A, Li P, Cao D, Dunham R, Liu Z (2000)
Transcriptome analysis of channel catfish (Ictalurus punctatus): genes and
expression profile from the brain. Gene 261:373
Ju Z, Wells MC, Heater SJ, Walter RB (2006) Multiple tissue gene expression analyses
in Japanese medaka (Oryzias latipes) exposed to hypoxia. Comp Biochem Phys
Toxicol Pharmacol, in press
can measure? Infection 33:160-162
si A, Cao D, Li P, Patterson A, Kocabas A, Feng J, Ju Z, Mickett KD, Liu Z (2002
Transcriptome analysis of channel catfish (Ictalurus punctatus): initial analysis
gene expression and microsatellite-containing cDNAs in the skin. Gene 285:157
168
dziorski C, Irizarry RA, Chen KS, Haag JD, Gould MN (2005) On the utility of
pooling biological samples in microarray experiments. Proc Natl Acad Sci U
102:4252-4257
Khadijah S, Neo SY, Hossain MS, Miller LD, Mathavan S, Kwang J (2003)
Identification of white spot syndrome virus latency-related genes in specific-
pathogen-free shrimps by use of a microarray. J Virol 77:1
Khan S, van den Broek M, Schwarz K, de Giuli R, Diener PA, Groettrup M (2001)
Immunoproteasomes largely replace constitutive proteasomes during an antiviral
and antibac

131
Koc 004) Alterations in gene expression in the brain of
Kono T, Kusada R, Kawahara E, Sakai M (2003) The analysis of immune responses of
Koskinen H, Krasnov A, Rexroad C, Gorodilov Y, Afanasyev S, Molsa H (2004a) The
Exp Biol
Kos S, Molsa
l
Kra
transposons in salmonid fish. BMC Genomics 6:107
Khattiya R, Ohira T, Hirono I, Aoki T (2004) Identification of a novel Japanese
flounder (Paralichthys olivaceus) CC chemokine gene and an analysis of its
function. Immunogenetics 55:763–769
Khayat M, Stuge TB, Wilson M, Bengten E, Miller NW, Clem LW (2001) Thioredoxin
acts as a B cell growth factor in channel catfish. J Immunol 166:2937-2943
abas A, Dunham R, Liu ZJ (2
white catfish (Ameirus catus) in response to cold acclimation. Marine
Biotechnology 6:S431-S438
Kocabas AM, Li P, Cao D, Karsi A, He C, Patterson A, Ju Z, Dunham RA, Liu Z
(2002) Expression profile of the channel catfish spleen: analysis of genes involved
in immune functions. Mar Biotechnol 4:526-536
a novel CC-chemokine gene from Japanese flounder Paralichthys olivaceus.
Vaccine, 21:446–457
14-3-3 proteins in the teleost fish rainbow trout (Oncorhynchus mykiss). J
207:3361-3368
kinen H, Pehkonen P, Vehniainen E, Krasnov A, Rexroad C, Afanasyev
H, Oikari A (2004b) Response of rainbow trout transcriptome to model chemica
contaminants. Biochem Biophys Res Commun 320:745-753
snov A, Koskinen H, Afanasyev S, Molsa H (2005a) Transcribed Tc1-like

132
005b)
ling
liver
Kum cular
is and sequence alignment. Briefings in
Kur
ralichthys olivaceus kidney cells
Kur 003)
kines and a chemokine receptor in cichlid fish, shark, and
Lai
tterns. Mol Immunol 41:793-808
Lam ,
arsenic-induced
Lan ofile of shrimp white spot
syndrome virus (WSSV) genes with DNA microarray. Arch Virol 151:1723-1733
Krasnov A, Koskinen H, Pehkonen P, Rexroad CE 3rd, Afanasyev S, Molsa H (2
Gene expression in the brain and kidney of rainbow trout in response to hand
stress. BMC Genomics 6:3
Krasnov A, Koskinen H, Rexroad C, Afanasyev S, Molsa H, Oikari A (2005c)
Transcriptome responses to carbon tetrachloride and pyrene in the kidney and
of juvenile rainbow trout (Oncorhynchus mykiss). Aquat Toxicol 74:70-81
ar S, Tamura K, Nei M (2004) MEGA3: Integrated software for Mole
Evolutionary Genetics Analys
Bioinformatics 5:150-163
obe T, Yasuike M, Kimura T, Hirono I, Aoki T (2005) Expression profiling of
immune-related genes from Japanese flounder Pa
using cDNA microarrays. Dev Comp Immunol 29:515-523
oda N, Uinuk-ool TS, Sato A, Samonte IE, Figueroa F, Mayer WE, Klein J (2
Identification of chemo
lamprey. Immunogenetics 54:884-895
ng KJ, Secombes CJ (2004b) Trout CC chemokines: comparison of their sequences
and expression pa
Laing KJ, Secombes CJ (2004a) Chemokines. Dev Comp Immunol 28:443–460
SH, Winata CL, Tong Y, Korzh S, Lim WS, Korzh V, Spitsbergen J, Mathavan S
Miller LD, Liu ET, Gong Z (2006) Transcriptome kinetics of
adaptive response in zebrafish liver. Physiol Genomics 27:351-361
Y, Xu X, Yang F, Zhang X (2006) Transcriptional pr

133
9
Legrand D, Elass E, Carpentier M, Mazurier J (2005) Lactoferrin: a modulator of
Li J
C Genomics
S,
ptome: development of
Lin
Aeromonas salmonicida and
s of
Liu oire. Chapter
Larsson O, Wahlestedt C, Timmons JA (2005) Considerations when using the
significance analysis of microarrays (SAM) algorithm. BMC Bioinformatics 6:12
immune and inflammatory responses. Cell Mol Life Sci 62:2549-2559
, Burmeister M (2005) Genetical genomics: combining genetics with gene
expression analysis. Hum Mol Genet 2:R163-R169
Li RW, Waldbieser GC (2006) Production and utilization of a high-density
oligonucleotide microarray in channel catfish, Ictalurus punctatus. BM
7:134
Li P, Peatman E, Wang S, Feng J, He C, Baoprasertkul P, Xu P, Kucuktas H, Nandi
Somridhivej B, Serapion J, Simmons M, Turan C, Liu L, Muir W, Dunham R,
Brady Y, Grizzle J, Liu Z (2007) Towards the catfish transcri
molecular tools from 31,215 catfish ESTs. BMC Genomics, under review
B, Chen S, Cao Z, Lin Y, Mo D, Zhang H, Gu J, Dong M, Liu Z, Xu A (2007)
Acute phase response in zebrafish upon
Staphylococcus aureus infection: Striking similarities and obvious differences with
mammals. Mol Immunol 44:295-301
Liu ZJ (2006) Transcriptome characterization through the generation and analysi
expressed sequence tags: Factors to consider for a successful EST project. Israel J
Aquaculture 58:328-341
Z, Peatman E (2006) Chemokines in fish: a rapidly expanding repert
in: Focus on Immunology Research, B.A. Veskler ed., Nova Science Publishers,
NY. pp. 121-144

134
28-beta
-
phocyte
putative Marek's disease
ome Res
Liu L, Fujiki K, Dixon B, Sundick RS (2002) Cloning of a novel rainbow trout
Liu ge map
brid
Luo
igh-throughput fingerprinting of bacterial
Ma C, Koskinen H, Planas JV, Goetz FW, Molsa H, Krasnov
h
Liu G, Zheng W, Chen X (2007) Molecular cloning of proteasome activator PA
subunit of large yellow croaker (Pseudosciana crocea) and its coordinated up-
regulation with MHC class I alpha-chain and beta(2)-microglobulin in poly I:C
treated fish. Mol Immunol 44:1190-1197
Liu HC, Niikura M, Fulton JE, Cheng HH (2003a) Identification of chicken lym
antigen 6 complex, locus E (LY6E, alias SCA2) as a
resistance gene via a virus-host protein interaction screen. Cytogenet Gen
102:304-308
(Oncorhynchus mykiss) CC chemokine with a fractalkine-like stalk and a TNF
decoy receptor using cDNA fragments containing Au-rich elements. Cytokine
17:71–81
Z, Karsi A, Li P, Cao D, Dunham R (2003b) An AFLP-based genetic linka
of channel catfish (Ictalurus punctatus) constructed by using an interspecific hy
resource family. Genetics 165:687-694
, MC, Thomas C, You FM, Hsiao J, Ouyang S, Buell CR, Malandro M, McGuire
PE, Anderson OD, Dvorak J (2003) H
artificial chromosomes using the SNaPshot labeling kit and sizing of restriction
fragments by capillary electrophoresis. Genomics 82:378-389
cKenzie S, Iliev D, Liarte
A, Tort L (2006) Transcriptional analysis of LPS-stimulated activation of trout
(Oncorhynchus mykiss) monocyte/macrophage cells in primary culture treated wit
cortisol. Mol Immunol 43:1340-1348

135
Ma is
F, Ann Chen Y, Almeida JS, Gross PS,
unol
Marks H, Vorst O, van Houwelingen AM, van Hulten MC, Vlak JM (2005) Gene-
81-
Ma
dministration of a live bacterial vaccine in Atlantic salmon (Salmo
Ma
ted Japanese flounder (Paralichthys
Me r
filing of adult
Magnadottir B (2006) Innate immunity of fish (overview). Fish Shellfish Immunol
20:137-151
ncia A, Lundqvist ML, Romano TA, Peden-Adams MM, Fair PA, Kindy MS, Ell
BC, Gattoni-Celli S, McKillen DJ, Trent H
Chapman RW, Warr GW (2006) A dolphin peripheral blood leukocyte cDNA
microarray for studies of immune function and stress reactions. Dev Comp Imm
2006, in press
expression profiling of White spot syndrome virus in vivo. J Gen Virol 86:20
2100
rtin SA, Blaney SC, Houlihan DF, Secombes CJ (2006) Transcriptome response
following a
salar). Mol Immunol 43:1900-1911
tsuyama T, Fujiwara A, Nakayasu C, Kamaishi T, Oseko N, Hirono I, Aoki T (2006)
Gene expression of leucocytes in vaccina
olivaceus) during the course of experimental infection with Edwardsiella tarda.
Fish Shellfish Immunol, in press
ijer AH, Verbeek FJ, Salas-Vidal E, Corredor-Adamez M, Bussman J, van der Sa
AM, Otto GW, Geisler R, Spaink HP (2005) Transcriptome pro
zebrafish at the late stage of chronic tuberculosis due to Mycobacterium marinum
infection. Mol Immunol 42:1185-1203

136
ture function analysis of the antioxidant properties of haptoglobin.
Me
Mo
romosome17q12. Genomics 83:735-738
ien
12
receptor CXCR4 regulate mouse germ cell migration and survival.
Mo
otypes of chum salmon. Mar Biotechnol (NY)
Mo F
A role for tumor suppressor p53 in AGD-
Mo unol
Mo 04) Chemokines: multiple levels of
leukocyte migration control. Trends Immunol 25:75-85
Melamed-Frank M, Lache O, Enav BI, Szafranek T, Levy NS, Ricklis RM, Levy AP
(2001) Struc
Blood 98:3693–3698
yer FP (1991) Aquaculture disease and health management. J Anim Sci 69:4201-
4208
di WS (2004) CCL3L1 and CCL4L1 chemokine genes are located in a segmental
duplication at ch
Molyneaux KA, Zinszner H, Kunwar PS, Schaible K, Stebler J, Sunshine MJ, O'Br
W, Raz E, Littman D, Wylie C, Lehmann R (2003) The chemokine SDF1/CXCL
and its
Development 130:4279-4286
riya S, Urawa S, Suzuki O, Urano A, Abe S (2004) DNA microarray for rapid
detection of mitochondrial DNA hapl
6:430-434
rrison RN, Cooper GA, Koop BF, Rise ML, Bridle AR, Adams MB, Nowak B
(2006) Transcriptome profiling the gills of amoebic gill disease (AGD)-affected
Atlantic salmon (Salmo salar L.) -
pathogenesis? Physiol Genomics 26:15-34
ser B, Loetscher P (2001) Lymphocyte traffic control by chemokines. Nat Imm
2:123-128
ser B, Wolf M, Walz A, Loetscher P (20

137
nt
ns in channel catfish. Abstract, Aquaculture America 2006.
Murphy PM, Baggiolini M, Charo IF, Hebert CA, Horuk R, Matsushima K, Miller LH,
:145–176
rrays.
b)
ormone hepcidin. J Clin Invest 113:1271-1276
x
Nev ma
iotropic member of the C-X-C
Newton JC, Wolfe LG, Grizzle JM, Plumb JA (1989) Pathology of experimental enteric
2:335–347
Murdock CA, Small BC, Bilodeau AL, Peterson BC, Waldbieser GC (2006)
Comparative analysis of the expression of reference genes in response to differe
physiological conditio
Las Vegas, NV 2006; p. 232.
Oppenheim JJ, Power CA (2000) International union of pharmacology. XXII.
Nomenclature for chemokine receptors. Pharmacol Rev 52
Nash JH, Findlay WA, Luebbert CC, Mykytczuk OL, Foote SJ, Taboada EN, Carrillo
CD, Boyd JM, Colquhoun DJ, Reith ME, Brown LL (2006) Comparative genomics
profiling of clinical isolates of Aeromonas salmonicida using DNA microa
BMC Genomics 7:43
Nemeth E, Rivera S, Gabayan V, Keller C, Taudorf S, Pedersen BK, Ganz T (2004
IL-6 mediates hypoferremia of inflammation by inducing the synthesis of the iron
regulatory h
Nemeth E, Tuttle MS, Powelson J, et al (2004a) Hepcidin regulates cellular iron efflu
by binding to ferroportin and inducing its internalization. Science 306:2090–2093
ille LF, Mathiak G, Bagasra O (1997) The immunobiology of interferon-gam
inducible protein 10 kD (IP-10): a novel, ple
chemokine superfamily. Cytokine Growth Factor Rev 8:207–219
septicaemia in channel catfish, Ictalurus punctatus (Rafinesque), following
immersion-exposure to Edwardsiella ictaluri. J Fish Dis 1

138
allelic
Nic e immunological properties of endoplasmic reticulum
Nom n of
nd CXC
Nuw
ll C, Blattner F, Sussman MR, Wallace RL, Cerrina F, Green
Oli Jouzeau JY, Fey GH,
-
Pan trends.
Paw iscovery rate,
sensitivity and sample size for microarray studies. Bioinformatics 21:3017-3024
Nibbs RJ, Yang J, Landau NR, Mao JH, Graham GJ (1999) LD78beta, a non-
variant of human MIP-1alpha (LD78alpha),has enhanced receptor interactions and
potent HIV suppressive activity. J Biol Chem 274:17478-17483
chitta CV, Reed RC (2000) Th
chaperones: a conflict of interest? Essays Biochem 36:15-25
iyama H, Mera A, Ohneda O, Miura R, Suda T, Yoshie O (2001) Organizatio
the chemokine genes in the human and mouse major clusters of CC a
chemokines: diversification between the two species. 2:110-113
aysir EF, Huang W, Albert TJ, Singh J, Nuwaysir K, Pitas A, Richmond T, Gorski
T, Berg JP, Ballin J, McCormick M, Norton J, Pollock T, Sumwalt T, Butcher L,
Porter D, Molla M, Ha
RD (2002) Gene expression analysis using oligonucleotide arrays produced by
maskless photolithography. Genome Res 12:1749-1755
vier E, Soury E, Risler JL, Smih F, Schneider K, Lochner K,
Salier JP (1999) A novel set of hepatic mRNAs preferentially expressed during an
acute inflammation in rat represents mostly intracellular proteins. Genomics 57:352
364
dey S, Agrawal DK (2006) Immunobiology of Toll-like receptors: emerging
Immunol Cell Biol 84:333-341
Park CH, Valore EV, Waring AJ, et al (2001) Hepcidin, a urinary antimicrobial peptide
synthesized in the liver. J Biol Chem 276:7806–7810
itan Y, Michiels S, Koscielny S, Gusnanto A, Ploner A (2005) False d

139
Pea es and
309
Pea
ence tags from Eastern
Pfa
CR. Nucleic Acids Res 29:e45
273:29279-29282
ression profiling following
Peatman E and Liu Z (2006) CC chemokines in zebrafish: evidence of extensive
intrachromosomal gene duplications. Genomics 88:381-385
tman E and Liu Z (2007) Microarray fundamentals: Basic principl
applications in aquaculture. Chapter in Aquaculture Genome Technology, Z. Liu
ed., Blackwell Scientific (in press)
Peatman E, Bao B, Xu P, Baoprasertkul P, Brady Y, Liu Z (2006) Catfish CC
chemokines: genomic clustering, duplications, and expression after bacterial
infection with Edwardsiella ictaluri. Mol Genet Genom 275:297-
Peatman E, Baoprasertkul P, He C, Li P, Kucuktas H, Liu Z (2005) In silico
identification and expression analysis of 12 novel CC chemokines in catfish.
Immunogenetics 57:409-419
tman EJ, Wei X, Feng J, Liu L, Kucuktas H, Li P, He C, Rouse D, Wallace R,
Dunham R, Liu Z (2004) Development of expressed sequ
oyster (Crassostrea virginica): lessons learned from previous efforts. Proc Mar
Biotech 6:S491-496
ffl MW (2001) A new mathematical model for relative quantification in real-time
RT-P
Poli V (1998) The role of C/EBP isoforms in the control of inflammatory and native
immunity functions. J Biol Chem
Purcell MK, Nichols KM, Winton JR, Kurath G, Thorgaard GH, Wheeler P, Hansen JD,
Herwig RP, Park LK (2006) Comprehensive gene exp
DNA vaccination of rainbow trout against infectious hematopoietic necrosis virus.
Mol Immunol 43:2089-2106

140
ero
onzalez JR, Gratacos
enome.
Renn SC, Aubin-Horth N, Hofmann HA (2004) Biologically meaningful expression
rray.
Rey lust R (2006)
terborne
s
Rise ML, Douglas SE, Sakhrani D, Williams J, Ewart KV, Rise M, Davidson WS,
gene
Rise ML, Jones SR, Brown GD, von Schalburg KR, Davidson WS, Koop BF (2004b)
Piscirickettsia salmonis infection. Physiol
Ris evlin RH, Kuipers N, Busby
Redon R, Ishikawa S, Fitch KR, Feuk L, Perry GH, Andrews TD, Fiegler H, Shap
MH, Carson AR, Chen W, Cho EK, Dallaire S, Freeman JL, G
M, Huang J, et al. (2006) Global variation in copy number in the human g
Nature 444:444-454
profiling across species using heterologous hybridization to a cDNA microa
BMC Genomics 5:42
nders H, van der Ven K, Moens LN, van Remortel P, De Coen WM, B
Patterns of gene expression in carp liver after exposure to a mixture of wa
and dietary cadmium using a custom-made microarray. Aquat Toxicol, in pres
Koop BF, Devlin RH (2006) Multiple microarray platforms utilized for hepatic
expression profiling of GH transgenic coho salmon with and without ration
restriction. J Mol Endocrinol 37:259-282
Microarray analyses identify molecular biomarkers of Atlantic salmon macrophage
and hematopoietic kidney response to
Genomics 20:21-35
e ML, von Schalburg KR, Brown GD, Mawer MA, D
M, Beetz-Sargent M, Alberto R, Gibbs AR, Hunt P, Shukin R, Zeznik JA, Nelson C,
Jones SR, Smailus DE, Jones SJ, Schein JE, Marra MA, Butterfield YS, Stott JM,
Ng SH, Davidson WS, Koop BF (2004a) Development and application of a

141
Riv s
tion of iron and exacerbates tumor-associated anemia. Blood
Rob
f the gene expression response to saprolegniasis in Atlantic
Ros
Rus
eal
p Immunol 30:393-406
Sam
aboratory Press, Cold Spring Harbor
salmonid EST database and cDNA microarray: data mining and interspecific
hybridization characteristics. Genome Res 14:478-490
era S, Liu L, Nemeth E, Gabayan V, Sorensen OE, Ganz T (2005) Hepcidin exces
induces the sequestra
105:1797-1802
erge C, Paez DJ, Rossignol O, Guderley H, Dodson J, Bernatchez L (2007)
Genome-wide survey o
salmon. Mol. Immunol 44:1374-1383
s MT, LaBrie S, McPherson J, Stanton VP (1999) Screening large-insert libraries by
hybridization. In: Boyl A, ed Current protocols in human genetics. Wiley, New
York, pp 5.6.1–52
sell S, Hayes MA, Simko E, Lumsden JS (2006) Plasma proteomic analysis of the
acute phase response of rainbow trout (Oncorhynchus mykiss) to intraperiton
inflammation and LPS injection. Dev Com
Saitou N, Nei M (1987) The neighbor-joining method: a new method for reconstructing
phylogenetic trees. Mol Biol Evol 4:406–425
brook J, Frisch EF, Maniatis T (1989) Molecular cloning: a laboratory manual,
Cold Spring Harbor L
Sarropoulou E, Kotoulas G, Power DM, Geisler R (2005) Gene expression profiling of
gilthead sea bream during early development and detection of stress-related genes
by the application of cDNA microarray technology. Physiol Genomics 23:182-191

142
Sch
by lactoferrin abolishes their
Sch
ns with a complementary DNA microarray. Science 270:467-470
ce and
Sch tools for animal diseases. Rev Sci Tech.
Sin
brication of light-directed oligonucleotide microarrays using a
Sod
Biosci 13:523-535
R
ed NK cell migration:
Ste
endothelial cells from oxidative damage by stimulation of glutathione peroxidase
expression and activity. Free Radic Res 40:936-943
aible UE, Collins HL, Priem F, Kaufmann SH (2002) Correction of the iron
overload defect in beta-2-microglobulin knockout mice
increased susceptibility to tuberculosis. J Exp Med 196:1507–1513
ena M, Shalon D, Davis RW, Brown PO (1995) Quantitative monitoring of gene
expression patter
Schillaci G, Pirro M (2006) C-reactive protein in hypertension: clinical significan
predictive value. Nutr Metab Cardiovasc Dis 16:500-508
mitt B, Henderson L (2005) Diagnostic
24:243-250
gh-Gasson S, Green RD, Yue Y, Nelson C, Blattner F, Sussman MR, Cerrina F
(1999) Maskless fa
digital micromirror array. Nat Biotechnol 17: 974-978
erlund, C, Humphray S, Dunham A, French L (2000) Contigs built with
fingerprints, markers, and FPC V4.7. Genome Res 10:1772-1787
Soderlund, C, Longden I, Mott R (1997) FPC: a system for building contigs from
restriction fingerprinted clones. Comput Appl
Starnes T, Rasila KK, Robertson MJ, Brahmi Z, Dahl R, Christopherson K, Hromas
(2006) The chemokine CXCL14 (BRAK) stimulates activat
implications for the downregulation of CXCL14 in malignancy. Exp Hematol
34:1101-1105
inbrenner H, Bilgic E, Alili L, Sies H, Brenneisen P (2006) Selenoprotein P protects

143
oetzel
for induction of
Sul
Sul ysis of restriction enzyme
Sunyer JO, Zarkadis IK, Lambris JD (1998) Complement diversity: a mechanism for
Suz
40:15771-15779
mic
of
ing, position-
Tilt
termine transcriptional patterns in aflatoxin B1-induced
Tol
Strehl B, Joeris T, Rieger M, Visekruna A, Textoris-Taube K, Kaufmann SH, Kl
PM, Kuckelkorn U, Steinhoff U (2006) Immunoproteasomes are essential for
clearance of Listeria monocytogenes in nonlymphoid tissues but not
bacteria-specific CD8+ T cells. J Immunol 177:6238-6244
ston, et al. (1988) Software for genome mapping by fingerprint techniques. Comput
Appl Biosci 4:125-132
ston, J, Mallett F, Durbin R, Horsnell T (1989) Image anal
fingerprint autoradiograms. Comput Appl Biosci 5:101-106
generating immune diversity? Immunol Today 19:519-523
uki YA, Shin K, Lonnerdal B (2001) Molecular cloning and functional expression
of a human intestinal lactoferrin receptor. Biochemistry
Szegezdi E, Logue SE, Gorman AM, Samali A (2006) Mediators of endoplas
reticulum stress-induced apoptosis. EMBO Rep 7:880-885
Thompson JD, Higgins DG, Gibson TJ (1994) ClustalW: Improving the sensitivity
progressive multiple sequence alignment through sequence weight
specific gap penalties and weight matrix choice. Nucleic Acids Res 22:4673-4680
on SC, Gerwick LG, Hendricks JD, Rosato CS, Corley-Smith G, Givan SA, Bailey
GS, Bayne CJ, Williams DE (2005) Use of a rainbow trout oligonucleotide
microarray to de
hepatocellular carcinoma compared to adjacent liver. Toxicol Sci 88:319-330
osano E, Altruda F (2002) Hemopexin: structure, function, and regulation. DNA
Cell Biol 21:297-306

144
Tsa
rimp white spot
Tsuji S, Uehori J, Matsumoto M, Suzuki Y, Matsuhisa A, Toyoshima K, Seya T (2001)
3456-23463
l-like receptor 5 in
Tus pplied to
US A Economic Research
US s in
von (2006)
: potential
Townson JR, Barcellos LF, Nibbs RJ (2002) Gene copy number regulates the
production of the human chemokine CCL3-L1. Eur J Immunol 32:3016-3026
i JM, Wang HC, Leu JH, Hsiao HH, Wang AH, Kou GH, Lo CF (2004) Genomic
and proteomic analysis of thirty-nine structural proteins of sh
syndrome virus. J Virol 78:11360-11370
Human intelectin is a novel soluble lectin that recognizes galactofuranose in
carbohydrate chains of bacterial cell wall. J Biol Chem 276:2
Tsujita T, Tsukada H, Nakao M, Oshiumi H, Matsumoto M, Seya T (2004) Sensing
bacterial flagellin by membrane and soluble orthologs of Tol
rainbow trout (Onchorhynchus mikiss). J Biol Chem 279:48588-48597
her VG, Tibshirani R, Chu G (2001) Significance analysis of microarrays a
the ionizing radiation response. Proc Natl Acad Sci USA 98:5116-5121
DA, 2000. Aquaculture Outlook, March 13, 2000. USD
Service Publication #LDP-AQS-11
DA, 2003. Part II: Reference of Foodsize Catfish Health and Production Practice
the United States, 2003, USDA:APHIS:VS,CEAH, National Animal Health
Monitoring System, Fort Collins, CO, pp. 56–70.
Schalburg KR, McCarthy SP, Rise ML, Hutson JC, Davidson WS, Koop BF
Expression of morphogenic genes in mature ovarian and testicular tissues
stem-cell niche markers and patterning factors. Mol Reprod Dev 73:142-152

145
the
von idson
ous methodologies demonstrate utility of
Vor
m J
Wa d
emokine
Wa iu Z (2006a) Characterization of a NK-lysin
Wa hannel catfish: gene triplication,
Wa
h
(Ictalurus punctatus). Mol Immunol 43:1653-1664
von Schalburg KR, Rise ML, Brown GD, Davidson WS, Koop BF (2005b) A
comprehensive survey of the genes involved in maturation and development of
rainbow trout ovary. Biol Reprod 72:687-699
Schalburg KR, Rise ML, Cooper GA, Brown GD, Gibbs AR, Nelson CC, Dav
WS, Koop BF (2005a) Fish and chips: vari
a 16,006-gene salmonid microarray. BMC Genomics 6:126
nanen M, Hassinen M, Koskinen H, Krasnov A (2005) Steady-state effects of
temperature acclimation on the transcriptome of the rainbow trout heart. A
Physiol Regul Integr Comp Physiol 289:R1177-1184
lsh B, Henderson D (2004) Microarrays and beyond: what potential do current an
future genomics tools have for breeders? J Anim Sci E-Suppl:E292-299
Wang J, Adelson DL, Yilmaz A, Sze SH, Jin Y, Zhu JJ (2005) Genomic organization,
annotation, and ligand-receptor inferences of chicken chemokines and ch
receptor genes based on comparative genomics. BMC Genomics 6:45
ng Q, Bao B, Wang Y, Peatman E, L
antimicrobial peptide gene from channel catfish. Fish Shellfish Immunol 20:419-
426
ng Q, Wang Y, Xu P, Liu Z (2006b) NK-lysin of c
sequence variation, and expression analysis. Mol Immunol 43:1676-1686
ng Y, Wang Q, Baoprasertkul P, Peatman E, Liu Z (2006c) Genomic organization,
gene duplication, and expression analysis of interleukin-1beta in channel catfis

146
in SD,
on of temporal transcriptional
Wil
s flesus). Aquat
Wo and
6:329-334
l
J Aquatic
Xu
)
Xu ang S, Liu L, Peatman E, Somridhivej B, Thimmapuram J, Gong G, Liu Z
t
You
http://wheat.pw.usda.gov/PhysicalMapping/tools/genoprofiler/manual/
Williams TD, Diab AM, George SG, Godfrey RE, Sabine V, Conesa A, Minch
Watts PC, Chipman JK (2006) Development of the GENIPOL European flounder
(Platichthys flesus) microarray and determinati
responses to cadmium at low dose. Environ Sci Technol 40:6479-6488
liams TD, Gensberg K, Minchin SD, Chipman JK (2003) A DNA expression array
to detect toxic stress response in European flounder (Platichthy
Toxicol 65:141-157
lters WR, Johnson MR (1994) Enteric septicemia resistance in blue catfish
three channel catfish strains. J Aquatic Animal Health
Wolters WR, Wise DJ, Klesius PH (1996) Survival and antibody response of channe
catfish, blue catfish, and catfish hybrids after exposure to E. ictaluri.
Animal Health 8:249-254
P, Bao B, Zhang S, Peatman E, He C, Liu ZJ (2005) Characterization and
expression analysis of bactericidal permeability-increasing protein (BPI
antimicrobial peptide gene from channel catfish Ictalurus punctatus. Dev Comp
Immunol 29:865-878
P, W
(2006) Channel catfish BAC-end sequences for marker development and assessmen
of syntenic conservation with other fish species. Anim Genet 37:321-326
Xu P, Wang S, Liu L, Thorsen J, Liu ZJ (2007) A BAC-based physical map of the
channel catfish genome. Genetics, in press
FM, Luo MC (2003) GenoProfiler User's Manual.
.

147
APPENDICES

148
Supplemental Table 1 All significantly upregulated catfish transcripts in liver after E. ictaluri infection. Accession refers to the GenBank accession number or TIGR consensus number of the sequence on the microarray. Putative Id is the hit with the most negative E-value along with the E-value of that hit. q-value is the false-discovery rate for the particular gene
Accession Putative Id E-value Fold Change
q-value(%)
CF970955 Intelectin [Ctenopharyngodon idella] 7.00E-32 85.4 1.25 CF971897 Intelectin 2 [Danio rerio] 3.00E-117 40.0 3.27 CK407451 Intelectin 2 [Danio rerio] 8.00E-120 36.0 1.25 BM439193 No significant similarity 35.5 3.27 CK408483 Haptoglobin precursor [Danio rerio] 1.00E-56 34.3 0.00 CK409144 No significant similarity 33.3 3.27 BM438750 Microfibrillar-associated protein 4 [Danio
rerio] 1.00E-35 32.9 1.25
CF970863 Microfibrillar-associated protein 4 [Danio rerio]
1.00E-57 30.0 1.25
TC6845 Intelectin [Ctenopharyngodon idella] 4.00E-128 28.0 2.36 BM438689 Microfibrillar-associated protein 4 [Rattus
norvegicus] 3.00E-68 25.6 0.00
TC8425 Warm-temperature-acclimation-related-65kda- protein-like-protein [Oryzias latipes]
2.00E-118 23.4 0.00
CK406362 Microfibrillar-associated protein 4 [Danio rerio]
2.00E-75 23.2 0.00
AY555510 CC chemokine SCYA113 [Ictalurus punctatus]
4.00E-37 22.7 3.27
TC7475 CC chemokine SCYA113 [Ictalurus punctatus]
5.00E-43 21.5 3.27
CK406396 Neurotoxin/C59/Ly-6-like protein [Ctenopharyngodon idella]
6.00E-21 21.3 1.25
CV995517 CC chemokine SCYA113 [Ictalurus punctatus]
2.00E-39 17.7 3.27
CV996365 No significant similarity 15.3 1.25 CV994031
Catechol-O-methyltransferase domain containing 1 [Danio rerio]
3.00E-76 14.8 0.00
TC9205 Hypothetical protein XP_683888 [Danio rerio]
7.00E-48 14.4 1.25
CK406832 No significant similarity 14.2 0.00 CF971597 Hypothetical protein XP_683888 [Danio
rerio] 4.00E-44 14.0 1.25
TC8426 Hemopexin precursor [Danio rerio] 5.00E-75 13.6 2.36 CV996638 Apoa4 protein [Danio rerio] 1.00E-93 13.0 2.36 CK406564 Hemopexin precursor [Danio rerio] 1.00E-90 12.9 6.47 CF971550 Warm-temperature-acclimation-related-
65 [Oryzias latipes] 7.00E-104 12.4 0.00
CV993724 Toll-like receptor 5 [Ictalurus punctatus] 2.00E-118 11.8 0.00 EE993358 Complement C3 [Ctenopharyngodon 8.00E-85 11.3 1.25

149
Complement C io] 3 10 1.7EE9 Complement prot nent C7- 6. 0.00
asma protein
lasma protein .00E-27
5
0
CK407588 -O-methyltransferase domain 2.00E-87 7.5 0.00
CK407841 en gamma polypeptide [Danio 5.00E-109 7.3 3.27
CV996644 omponent factor H [Rattus 7.00E-05 7.3 3.27
CK406972 nt similarity 7.2 1.71
CF971378 beta polypeptide [Danio 1.00E-21 6.4 1.71
9
ide [Danio .00E-162
2
BM439121 rity 5.6 5.24
idella] EE993177 Complement factor H precursor [Danio
rerio] 2.00E-26 10.9 1.25
CF971448 Catechol-O-methyltransferase domain containing 1 [Danio rerio]
9.00E-48 10.5 0.00
EE993360 Toll-like receptor 5 [Ictalurus punctatus] 1.00E-84 10.0 0.00 CV987901
93362 3-H1 [Cyprinus carp
ein compo.00E-59 00E-104
.0 9.7
1
1[Danio rerio] Fibrinogen alpha chain [Danio rerio] TC9637 2.00E-95 9.6 0.00
CK407984 Complement regulatory pl[Paralabrax nebulifer]
1.00E-14 8.9 3.27
TC9194
Complement regulatory p[Paralabrax nebulifer]
io]
7 8.9 3.27
CV992853 Ceruloplasmin [Danio rer 8.00E-98 8.5 0.00 TC9833 Microfibrillar-associated protein 4 [Danio
rerio] 1.00E-57 8.4 1.25
TC8307 Fibrinogen gamma polypeptide [Danio rerio]
6.00E-162 8.4 1.25
CK40735 Complement regulatory plasma protein[Paralabrax nebulifer]
2.00E-41 8.1 3.27
CF970899 No significant similarity 7.9 3.27 BM43904TC8765
No significant similarity Transferrin [Salvelinus fontinalis] Catechol
1.00E-160
7.8 7.7
3.27 0.00
containing 1 [Danio rerio] Fibrinogrerio] Complement cnorvegicus] No significa
BM438893 No significant similarity 6.9 0.00 CK406644 Apoa4 protein [Danio rerio]
Fibrinogen, B2.00E-19 6.9 6.47
rerio] CV989967 Complement C3 [Ctenopharyngodon
idella] 4.00E-100 6.3 1.25
CK40660 Fibrinogen gamma polypeptide [Ictalurus punctatus]
2.00E-63 6.2 6.47
TC8306 Fibrinogen gamma polypeptrerio] No significant similarity
6 6.1 0.00
CF971612 6.0 3.74 CK40814 No significant similarity 5.9 1.71 CV997096 Apoa4 protein [Danio rerio] 5.00E-55 5.9 5.24 CV996287 No significant similarity 5.7 3.27 CV989503 CXCL14 [Ictalurus punctatus]
No significant simila2.00E-52 5.7 0.00
CV997126 Complement C3 [Ctenopharyngodon idella]
3.00E-44 5.6 0.00

150
CF971852 gen alpha chain [Danio rerio] 7.00E-68 5.5 0.00
4
ursor
ociated 00E-16 5.
rters), member 1 [Danio rerio]
ntinalis] .00E-83 atus] .00E-52
o]
BM438634 sinogen [Danio rerio] 6.00E-57 4.5 1.25
2 CF971024 ificant similarity 4.4 3.27
8 beta .00E-67
[Cyprinus
io] 2 [Danio rerio] .00E-12
o]
FibrinoBM438459 Fibrinogen gamma polypeptide [Danio
rerio] 5.00E-28 5.4 1.71
TC7741 Complement factor B/C2-A3 [Cyprinuscarpio]
2.00E-114 5.4 3.74
CV992447
Complement component C8 beta [Oncorhynchus mykiss]
ss]
4.00E-38 5.4 3.27
BM425349TC7892
Complement C4 [Oncorhynchus mykiCeruloplasmin [Danio rerio]
2.00E-18 2.00E-104
5.4 5.4
3.27 0.00
CV99588 Solute carrier family 31 (copper transporters), member 1 [Danio rerio] Serum/glucocorticoid regulated kinase
4.00E-67 5.3 0.00
BM494620 [Danio rerio] LOC407646 protein [Danio rerio]
5.00E-73 5.3 1.25
CK407596 3.00E-67 5.3 3.74 EE993354 Complement component 7 prec
[Danio rerio] Transferrin [Oncorhynchus tshawytscha]
5.00E-105 5.3 0.00
CF971561 3.00E-35 5.2 5.24 TC8490 Fibrinogen, B beta polypeptide [Danio
rerio] 0 5.2 1.71
BM438919 Intelectin [Ctenopharyngodon idella] Erythroblast membrane
2.00E-11 5.0 0.00 EE993545
-assprotein [Danio rerio]
8. 0 3.74
TC7498 No significant similarity 4.9 1.25 TC7249 LOC407646 protein [Danio rerio] 2.00E-84 4.9 0.00 BM438712 Tryptophan 2,3-dioxygenase [Danio
rerio] 1.00E-13 4.8 0.00
CK408512 Solute carrier family 31 (copper transpo
8.00E-77 4.8 1.25
CK406912 Complement C4 [Oncorhynchus mykiss] Transferrin [S
6.00E-57 4.8 3.27 CK408638 AY836756
alvelinus foCXCL14 [Ictalurus punct
82
4.7 4.7
1.71 3.27
CK406849 Angiotensinogen [Danio reriNo significant similarity
4.00E-90
4.7 3.74 TC9712 4.6 3.27 BM438818 No significant similarity 4.5 0.00 CF971802 LOC407646 protein [Danio rerio]
Angioten1.00E-24 4.5 0.00
CK420078 Selenoprotein P, plasma, 1a [Danio rerio] 5.00E-67 4.4 7.53 BM02794 Selenoprotein P, plasma, 1a [Danio rerio]
No sign4.00E-55 4.4 6.47
EE993162 Complement component C[Oncorhynchus mykiss]
9 4.4 3.27
BM438200 Complement component C5-1carpio] No significant similarity
1.00E-43 4.4 1.25
CF971526 4.2 3.74 TC9358 Complement C4-2 [Cyprinus carp 1.00E-87 4.2 0.00 BM438717 TNFAIP9 protein isoform 2 4.1 1.25 CK407254 Complement component 9 [Danio reri 7.00E-75 4.1 3.27

151
4
rpio]
2 sociated 4
] o
8 r E-13
16 0
us
us
ember 2 .00E-12
4
ykiss]
e associated 4 .00E-122
BM438848 No significant similarity 4.0 1.25 BQ097411 No significant similarity
Fibrino 4.0 3.27
CF971664 BM43865
gen alpha chain [Danio rerio] Complement factor H precursor
5.00E-46 3.00E-21
4.0 4.0
1.25 3.27
[Oncorhynchus mykiss] Complement C3-H2 [Cyprinus caEE993174 5.00E-84 4.0 1.25
CK408253 Uridine phosphorylase, like [Danio rerio] 2.00E-63 3.9 3.74 CB93968 Protein disulfide isomerase-as
[Danio rerio] No significant similarity
8.00E-76 3.9 1.71
BM438858 3.9 3.27 CK407775 Fibrinogen, B beta polypeptide [Danio
rerio] 2.00E-25 3.9 1.71
CK409245 Fibrinogen alpha chain [Danio rerio 2.00E-32 3.8 3.27 CK407193 Complement factor H-related 1 [Hom
sapiens] 9.00E-23 3.8 3.27
TC7660 CK40732
Complement component C9 [Ctenopharyngodon idella] Coagulation factor XIII B chain precurso
1.00E-19 1.00
3.8 1.71
[Canis familiaris] Tumor necrosis factor, alpha-induced
3.8 6.47
TC7576 protein 9 No significant similari
4.00E-74 3.7 0.00
BM4391CK41727
ty Cytochrome b5 [Danio re
1
3.7 3.7
3.27 1.71 rio]
Protein disulfide-isomerase [Cricet.00E-36
0 TC10030 ulgriseus] No sign
3.6 7.53
CF971645 BM438615
ificant similarity Complement C3-S [Danio rerio]
4.00E-69
3.6 3.6
3.27 3.74
TC8237 Protein disulfide isomerase associated 4 [Danio rerio] No significant similarity
6.00E-108 3.5 1.71
CK407075 3.5 3.27 TC9113 No significant similarity 3.5 3.74 BQ097150 SSR alpha subunit [Oncorhynch
mykiss] 1.00E-83 3.4 0.00
CK405481 Solute carrier family 38, m[Xenopus tropicalis]
4 3.4 3.27
CF970857 Protein disulfide isomerase associated [Danio rerio]
1.00E-57 3.4 6.47
CK406974 No significant similarity 3.4 1.71 BM438944 No significant similarity 3.4 3.27 CK423432 No significant similarity 3.4 3.27 EE993343 Complement C4 [Oncorhynchus m
Chemotaxin [Oncorhynch3.00E-80 3.4 1.71
TC8567 TC7903
us mykiss] Armet protein [Xenopus laevis]
2.00E-46 3.00E-60
3.4 3.4
1.71 7.53
CK407547 Protein disulfide isomeras[Danio rerio]
1 3.3 6.47
CF972223 No significant similarity
3.3 1.71 TC6684 CV988633
Jun B proto-oncogene, like [Danio rerio]Apoa4 protein [Danio rerio]
3.00E-14 2.00E-65
3.3 3.3
3.27 5.24

152
[Cyprinus .00E-63
nio
anio rerio] 00E-92
2
CV992516 B/C2B [Danio rerio] 3.00E-25 3.1 6.47 ed
ursor (TRAP-ykiss]
a E-88
anio rerio] .00E-11 io rerio]
7 niloticus]
.00E-68 4
rio] 00E-82 io rerio] .00E-100
2
protein 4 [Danio .00E-17
BM438229 Alpha-2-macroglobulin-2carpio]
3 3.3 3.74
CV988413 Alpha-2-macroglobulin-2 [Cyprinus carpio]
1.00E-92 3.3 1.71
BM438317 Tryptophan 2,3-dioxygenase [Darerio]
4.00E-77 3.2 2.36
CK406955 No significant similarity 3.2 3.27 CV996636 No significant similarity 3.2 5.24 CK407024 Complement C3-S [Cyprinus carpio]
Coagulation fa7.00E-05 3.2 3.74
BM438664 ctor 10 [D 4. 3.2 2.36 CK421169 CanCK414114
opy1 [Danio rerio] Solute carrier family 38, member 2
1.00E-69 5.00E-112 3.
3.2 1
3.27 0.00
SLC38A2 [Danio rerio] CV989134 Calumenin isoform 2 isoform 3 [Canis
familiaris] No signif
3.00E-75 3.1 3.74
CF97086K407645
icant similarity No significant similarity
3.1 3.1
7.53 2.36 C
CK409512 No significant similarity Complement factor
3.1 3.74
TC7895 SSR alpha subunit/Translocon-associatprotein subunit alpha precalpha) [Oncorhynchus m
3.00E-75 3.0 3.74
TC7025 No significant similarity 3.0 0.00 CF971953 Fibrinogen, beta chain isoform 4 [Macac
mulatta] 5.00 3.0 3.27
CK406847 Fibrinogen alpha chain [D 9 3.0 3.74 CV994441 Complement C3-Q1, partial [Dan 4.00E-09 3.0 0.00 CK40750 Type III iodothyronine deiodinase
[Oreochromis 2.00E-90 2.9 3.74
CK408666 Transferrin [Salmo trutta] 2 2.9 3.74 CF97139 No significant similarity 2.9 3.27 EE993209 No significant similarity
No signif 2.9 3.27
TC8545 CF971799
icant similarity No significant similarity
2.9 2.9
1.71 3.74
CK409240 Coagulation factor 10 [Danio rerio] Ceruloplasmin [Da
1.00E-73 2.9 3.27 CF971219 CV987559
nio reSEC61, alpha subunit [Dan
7.5
2.9 2.8
5.24 3.27
TC7371 No significant similarity 2.8 5.24 CK407648 No significant similarity 2.8 5.24 CK406724 No significant similarity 2.8 7.53 CK41336 No significant similarity 2.8 3.27 CV994570 CK425818
No significant similarity 2.8 1.71 No significant similarity 2.8 1.71
CK408535 Microfibrillar-associated rerio] Apolipoprotein B-100 precursor [Danio
2 2.8 1.71
CV995270 rerio]
1.00E-76 2.8 6.47

153
aryngodon idella]
protein 10 [Danio rerio]
ng protein 10 [Danio rerio]
.00E-76 .00E-141
sor [Danio 00E-19 2.
nio rerio] .00E-87 1 (NADP+), .00E-20
BM438622 1.00E-43 2.6 3.74 nctatus] .00E-51
C8843 2.5 3.74
9
ulus]
8 rerio] .00E-106 anio rerio] .00E-79 olivaceus] .00E-44
[Canis .00E-21
ember 14/Oatp .00E-121
CK406836 Alpha-2-macroglobulin [Ctenoph
1.00E-76 2.8 3.27
CK406859 Transmembrane emp24 domain-containing
3.00E-91 2.7 0.00
CK410283 Transmembrane emp24 domain-containi
9.00E-101 2.7 1.71
CV996617 Transferrin [Salmo trutta] 1 2.7 3.27 TC12946 Transferrin [Salmo trutta] 3 2.7 3.74 EE993484 Selenium binding protein 1 isoform 4
[Danio rerio]
2.00E-76 2.7 7.53
CK406562 No significant similarity 2.7 3.74 CK406432 NCV989409
o significant similarity Dnajb11 protein [Danio rerio]
2.00E-65
2.7 2.7
1.71 1.71
TC9511 Calreticulin [Ictalurus punctatus] Alpha-2-an
0 2.7 0.00 CK407198 tiplasmin precur
rerio] 7. 7 3.27
TC8542 SEC11-like 1/SPC18 [Da 2 2.6 3.74 CV990480 Isocitrate dehydrogenase
soluble [Danio rerio] 7 2.6 1.25
TC8074 Deleted in malignant brain tumors 1 [Danio rerio] C1 inhibitor [Oncorhynchus mykiss]
9.00E-28 2.6 3.74
TC6883 Thioredoxin [Ictalurus pu 2 2.6 3.74 CV993716 SAR1a-like protein 2 [Ictalurus
punctatus]4.00E-27 2.5 0.00
CK407814 Plasminogen [Danio rerio] 1.00E-149 2.5 5.24 CB939893 No significant similarity 2.5 6.47 BM029249 No significant similarity
No significant similarity 2.5 0.00
TCK409289 No significant similarity 2.5 3.27 CV994205 No significant similarity 2.5 5.24 CV993853 No significant similarity 2.5 5.24 CK40910 No significant similarity 2.5 3.27 CK404043 No significant similarity 2.5 1.71 TC8981 FK506 binding protein 2 [Mus musc 9.00E-56 2.5 3.74 CB937094 Eif4e1a protein [Danio rerio] 8.00E-99 2.5 1.25 TC7047 DC2 protein [Xenopus tropicalis] 3.00E-76 2.5 0.00 CV99034 Calreticulin, like 2 [Danio 5 2.5 3.74 CV995732 Asparagine synthetase [D 3 2.5 0.00 CF971399 Transferrin [Paralichthys 4 2.4 7.53 CK410712 Sorting nexin-17 isoform 7
familiaris] 1 2.4 1.71
TC9317 Solute carrier family 21, m[Danio rerio] No significant similarity
4 2.4 3.27
CK408024 2.4 5.24 CK422256 No significant similarity 2.4 3.74

154
CV995916 2.4 3.74
protein
CV993838 drogenase 1 (NADP+), 1e-109 2.4 6.47
ide [Danio .00E-162
hain
anio
anio rerio] [Danio 00E-52 2.
4 , member E .00E-43
e-related io rerio]
.00E-64
ylocentrotus .00E-78
tatus] 1 (NADP+), .00E-146
anio rerio] .00E-77
CK407036 No significant similarity No significant similarity
2.4 0.00 CV992084 BM424895
2.4 2.4
1.25 2.36 No significant similarity
CV990387 No significant similarity No significant similarity
2.4 5.24
CF970874 No significant similarity 2.4 3.74 CK407673 Leucine-rich alpha-2-glyco
[Ctenopharyngodon idella] Isocitrate dehy
3.00E-91 2.4 1.71
soluble [Danio rerio] TC8308 Fibrinogen gamma polypept
rerio] Complement C3 precursor alpha
6 2.4 1.71
EE993353 c[Danio rerio]
6.00E-27 2.4 1.25
BM438581 Colipase preproprotein [Homo sapiens]Coagul
2.00E-23 2.4 6.47 CK409467 ation factor II (thrombin) [D
rerio] 4.00E-12 2.4 7.53
TC8712 Bsg protein [Danio rerio] Alpha-2-antiplasmin p
3.00E-06 2.4 3.74 CV994347 recursor [Danio
rerio] Unnamed prot
2.00E-17 2.4 3.27
CV987909 ein product [Tetraodonnigroviridis]
3.00E-12 2.3 3.27
TC7791 Asparagine-linked glycosylation 5 homolog [Xenopus tropicalis] Tumor necrosis factor, alpha-induced
6.00E-46 2.3 7.53
CF971576 protein 9 [Homo sapiens]
5.00E-53 2.3 1.25
CV992736 Integral membrane protein 1 [D 8.00E-140 2.3 0.00 CK405052 SEC11-like 1 (S. Cerevisiae)
rerio] 5. 3 1.71
CK40915 Ras homolog gene family[Danio rerio]
5 2.3 5.24
CV991869 Protein disulfide isomerasprotein P5 precursor [Dan
9 2.3 0.00
CK411358 Phosphoethanolamine N-methyltransferase [Strongpurpuratus] No significant similarity
3 2.3 1.25
CK418743 2.3 2.36 CK421480 CK407038
No significant similarity 2.3 0.00 No significant similarity 2.3 1.25
CK410384 TC9282
No significant similarity 2.3 5.24 No significant similarity 2.3 3.74
CK402366 No significant similarity 2.3 3.27 CK412705 No significant similarity 2.3 1.71 CK425589 No significant similarity 2.3 5.24 TC6827 NADH dehydrogenase subunit 1
[Ictalurus punc7.00E-124 2.3 0.00
CK401667 Isocitrate dehydrogenase soluble [Danio rerio] Glucose transporter 1A [D
8 2.3 1.25
BM027884 4 2.3 5.24

155
talurus .00E-95
, subfamily B 00E-71 2.
[Cyprinus .00E-76
omo sapiens] .00E-21 us
s] s
2
e [Danio rerio] CK415655 3.00E-42 2.2 7.53
s] .00E-58 soform 3 [Danio .00E-48
eus] .00E-64 s .00E-82
mma gamma)
e-86
n 1 [Danio rerio] .00E-24 io rerio] .00E-98
CK404798 Ferritin heavy subunit [Icpunctatus]
1 2.3 6.47
CK407169 Cytochrome P450, family 8[Gallus gallus]
4. 3 2.36
CV991514 Complement factor B/C2B carpio]
6 2.3 3.74
CF971843 Colipase preproprotein [H 3 2.3 7.53 CV988651 Coated vesicle membrane protein [M
musculus] 3.00E-91 2.3 0.00
CF971415 V994492
Canopy1 [Danio rerio] Apoa4 protein [Danio rerio]
2.00E-231.00E-54
2.3 2.3
3.27 3.74 C
TC9203 Inter-alpha trypsin inhibitor [Fundulus heteroclitu
1.00E-54 2.2 5.24
TC8465 WW domain binding protein 2 [Ictalurupunctatus]
4.00E-95 2.2 3.74
CK425032 Translocon-associated protein beta/SSR beta [Danio rerio] Translocon-associated protein beta/SSR
2.00E-89 2.2 0.00
CF972062 beta [Danio rerio]
1.00E-40 2.2 3.27
TC7124 Stress-associated endoplasmic reticulumprotein 1 [Homo sapiens]
5.00E-27 2.2 5.24
TC7513 CK407263
Sec61 gamma subunit [Homo sapiens]No significant similarity
1.00E-13
2.2 2.2
5.24 6.47
CV99471 No significant similarity No significant similarity
2.2 3.74 CK404612 CK418449
2.2 2.2
3.74 7.53 No significant similarity
CK403577 No significant similarity 2.2 3.27 CK425361 No significant similarity
No sig 2.2 3.74
BM424296 CB939641
nificant similarity No significant similarity
2.2 2.2
3.74 3.27
TC8290 NADH dehydrogenase subunit 5 [Ictalurus punctatus]
0.00 2.2 1.71
TC6955 Jun B proto-oncogene, likEndoplasmin [Aedes aegypti]
1.00E-54 2.2 0.00
TC9110 CD59 [Ictalurus punctatu 6 2.2 0.00 TC8069 C type lectin receptor A i
rerio] 2 2.2 5.24
CV992060 Transposase [Bacillus cer 2 2.1 6.47 TC6893 Signal sequence receptor delta [Ictaluru
punctatus] 4 2.1 3.74
TC7064 Signal sequence receptor, ga(translocon-associated protein Integral membrane protei
2 2.1 6.47
CK411755 4 2.1 1.71 BM438221 SEC61, beta subunit [Dan 4 2.1 0.00 TC7429 SEC22 vesicle trafficking protein
homolog B [Danio rerio] Ribosomal protein L23a [Ictalurus punctatus]
9.00E-98 2.1 3.74
TC8540 2.00E-69 2.1 6.47
CV987930 Plasminogen [Danio rerio] 3.00E-111 2.1 7.53

156
CF972234 ficant similarity 2.1 3.74
] CK408501 r transport protein 20 [Danio 9.00E-55 2.1 1.71
norvegicus]
rcatus]
BM438646 nio rerio] 1.00E-22 2.1 3.74
5
3 n 1 [Danio rerio] .00E-171 rerio] .00E-48 ae) [Danio .00E-08
like [Danio .00E-96
o] .00E-51 hus mykiss] .00E-11
philin B 113
8 8
6 BQ096912 lated protein 58kd [Bos 8.00E-45 2.0 3.74
CK404833 6.00E-54 2.0 7.53
ily A,
4 s]
CV994121 Nucleobindin 2a [Danio rerio] No significa
2.00E-75 2.1 0.00 BM438887 CK417505
nt similarity No significant similarity
2.1 2.1
3.74 3.27
CK407464 No significant similarity No signi
2.1 3.27
CB936516 Low density lipoprotein receptor-related protein associated protein 1 [Danio rerioIntraflagella
7.00E-98 2.1 0.00
rerio] TC8637 Hypothetical protein [Rattus 9.00E-16 2.1 1.25 TC10083 Glucose regulated protein 58kd [Bos
taurus] 0 2.1 6.47
TC9827 Cytochrome c oxidase subunit 1 [Ictalurus fu
0 2.1 0.00
TC8986 Cytochrome b5 [Danio rerio] Ceruloplasmin [Da
2.00E-42 2.1 3.27
EE993184 C type lectin receptor A isoform 3 [Daniorerio] Cathepsin L preproprotein [Cyprinus
1.00E-72 2.1 3.27
CK40653carpio] Transducer of ERBB2, 1a [Danio rerio]
1.00E-144 2.1 1.71
BM43815 2.00E-32 2.0 6.47 TC9714 Integral membrane protei 3 2.0 0.00 EE993544 Selenoprotein X, 1 [Danio 6 2.0 3.74 CF971017 SEC13-like 1 (S. Cerevisi
rerio] 5 2.0 3.74
CK402358 Retinol dehydrogenase 1,rerio] Profilin 2 like [Danio reri
9 2.0 7.53
TC8057 2 2.0 3.74 CF971814 Plasminogen [Oncorhync 2 2.0 6.47 TC9540 Peptidylprolyl isomerase B/cyclo
[Ictalurus punctatus] No significant similar
9.00E- 2.0 3.74
CK421111CV99169
ity No significant similarity
2.0 2.0
7.53 3.27 6
CK406865 No significant similarity 2.0 3.74 CV99134 No significant similarity 2.0 3.27 CK40693 No significant similarity 2.0 3.27 CK407170 No significant similarity 2.0 5.24 CK40515 No significant similarity
Glucose regu 2.0 1.71
taurus] Ferritin heavy subunit [Ictalurus punctatus]
CK408710 Cytochrome P450, family 3, subfampolypeptide 65 [Danio rerio] Calpain-like protease [Gallus gallu
4.00E-90 2.0 5.24
CK42212 1.00E-100 2.0 3.74

157
tacan fish transcripts in liver afte ictalu ection. ref cession number r TIGR c nsus er of the on ive Id is the hit with the most negative E-value along -va discovery rate the pa lar gene
value
FChange
q-value
Supplemen l Table 2 All signifi tly downregulated cat r E. ri infAccession ers to the GenBank ac o onse numbsequence the microarray. Putatwith the E
lue of that hit. q-value is the false- for rticu
Accession Putative identity E- old
TC7457 Eukaryotic translation initiation factor 3, sub 1.074
0.42 6.5 unit 6 interacting protein [Danio rerio]
0e-
CK404061 0.44 5.2 ide 2 [Icta us 5.0
29 0.45 6.5
9 0.47 7.5 n [Danio rerio 0.0 0.49 1.7
o 0.0 0.50 1.7
No significant similarity AY845143 Liver-expressed antimicrobial pept
punctatus] lur 0e-
CK40321 No significant similarity TC6758 Thioredoxin interacting protei ] TC6756 Thioredoxin interacting protein [Danio reri ]

158
upplemental Table 3 p-regulated catfish transcripts in liver after E. ictaluri infection
F Chan al
SUnique, significantly uthat could be annotated by sequence similarity. Accession refers to the GenBank accession number or TIGR consensus number of the sequence on the microarray. Putative Id is the hit with the most negative E-value. q-value is the false-discovery rate for the particular gene Accession Putative identity old ge q-v ue
CF970955 Intelectin [Ctenopharyngodon idella] 85.4 1.25 CK408483 H 0.00
M Danio rerio] 32 9 1.25 I 2.36
BM438689 M -associated protein 4 [Rattus norvegicus] 25.6 0.00 W ion-related-65kda- protein-l
23.4 0.00
C 3.27 K406396 Neurotoxin/C59/Ly-6-like protein [Ctenopharyngodon
idella] 21.3 1.25
V994031 Catechol-O-methyltransferase domain containing 1 [Danio rerio]
14.8 0.00
C9205 Hypothetical protein XP_683888 [Danio rerio] 14.4 1.25 C8426 Hemopexin precursor [Danio rerio] 13.6 2.36 V996638 Apolipoprotein Apoa4 protein [Danio rerio] 13.0 2.36 V993724 Toll-like receptor 5 [Ictalurus punctatus] 11.8 0.00 V987901 Complement C3-H1 [Cyprinus carpio] 10.0 1.71 E993362 Complement protein component C7-1[Danio rerio] 9.7 0.00 C9637 Fibrinogen alpha chain [Danio rerio] 9.6 0.00 C9194 Complement regulatory plasma protein [Paralabrax
nebulifer] 8.9 3.27
V992853 Ceruloplasmin [Danio rerio] 8.5 0.00 C9833 Microfibrillar-associated protein 4 [Danio rerio] 8.4 1.25 C8765 Transferrin [Salvelinus fontinalis] 7.7 0.00 C8306 Fibrinogen gamma polypeptide [Danio rerio] 6.1 0.00 V989503 CXCL14 [Ictalurus punctatus] 5.7 0.00 V997126 Complement C3 [Ctenopharyngodon idella] 5.6 0.00 C7892 Ceruloplasmin [Danio rerio] 5.4 0.00 V992447 Complement component C8 beta [Oncorhynchus
mykiss] 5.4 3.27
C7741 Complement factor B/C2-A3 [Cyprinus carpio] 5.4 3.74 M494620 Serum/glucocorticoid regulated kinase [Danio rerio] 5.3 1.25 V995884 Solute carrier family 31 (copper transporters), member
1 [Danio rerio] 5.3 0.00
C8490 Fibrinogen, B beta polypeptide [Danio rerio] 5.2 1.71 E993545 Erythroblast membrane-associated protein [Danio
rerio] 5.0 3.74
C7249 LOC407646 protein [Danio rerio] 4.9 0.00
aptoglobin precursor [Danio rerio] otein 4 [
34.3 .BM438750 icrofibrillar-associated pr
TC6845 ntelectin [Ctenopharyngodon idella] icrofibrillar
28.0
TC8425 arm-temperature-acclimatike-protein [Oryzias latipes]
TC7475 C chemokine SCYA113 [Ictalurus punctatus] 21.5 C
C
TTCCCETT
CTTTCCTC
TBC
TE
T
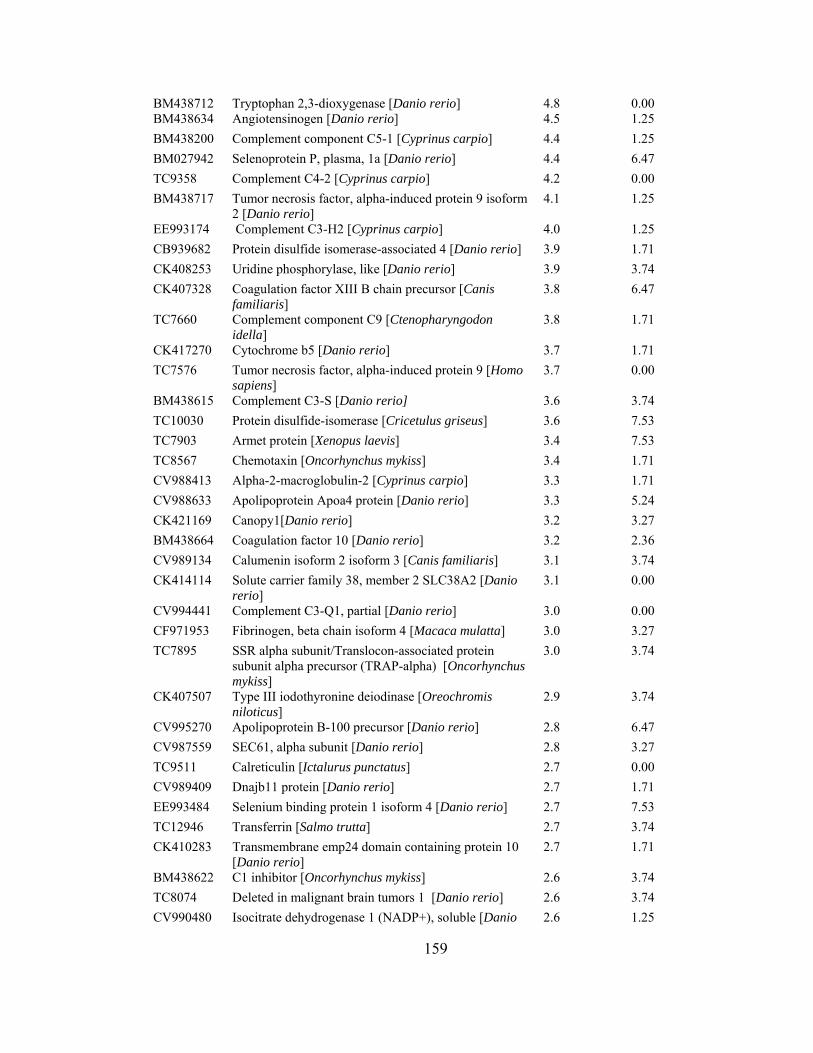
159
-dioxygenase [Danio rerio] 4.8 0.00
sis factor, alpha-induced protein 9 isoform 2 [Danio rerio]
4.1 1.25
Complement C3-H ] 4 [Danio rerio]
rio]
0 Homo
3 carpio]
4 C38A2 [Danio
[Macaca mulatta]
a) [Oncorhynchus
7 is
] 9 erio]
CV989409 protein [Danio rerio] 2.7 1.71 4 io]
2
0 ), soluble [Danio
BM438712 Tryptophan 2,3BM438634 Angiotensinogen [Danio rerio] 4.5 1.25 BM438200 Complement component C5-1 [Cyprinus carpio] 4.4 1.25 BM027942 Selenoprotein P, plasma, 1a [Danio rerio] 4.4 6.47 TC9358 Complement C4-2 [Cyprinus carpio] 4.2 0.00 BM438717 Tumor necro
EE993174 2 [Cyprinus carpio 4.0 1.25 CB939682 Protein disulfide isomerase-associated 3.9 1.71 CK408253 Uridine phosphorylase, like [Danio re 3.9 3.74 CK407328 Coagulation factor XIII B chain precursor [Canis
familiaris] 3.8 6.47
TC7660 Complement component C9 [Ctenopharyngodon idella]
3.8 1.71
CK41727 Cytochrome b5 [Danio rerio] Tumor necrosis factor, alpha-in
3.7 1.71 TC7576 duced protein 9 [
sapiens] 3.7 0.00
BM438615 Complement C3-S [Danio rerio] Protein
3.6 3.74 TC10030 TC7903
disulfide-isomerase [Cricetulus griseus] 3.Armet protein [Xenopus laevis] 3.
6 4
7.53 7.53
TC8567 Chemotaxin [Oncorhynchus mykiss] 3.4 1.71 CV98841 Alpha-2-macroglobulin-2 [Cyprinus 3.3 1.71 CV988633 Apolipoprotein Apoa4 protein [Danio rerio] 3.3 5.24 CK421169 Canopy1[Danio rerio] 3.2 3.27 BM438664 Coagulation factor 10 [Danio rerio] 3.2 2.36 CV989134 Calumenin isoform 2 isoform 3 [Canis familiaris] 3.1 3.74 CK41411 Solute carrier family 38, member 2 SL
rerio] Complement C3-Q1, partial [Danio rerio] 3.
3.1 0.00
CV994441 0 0.00 CF971953 Fibrinogen, beta chain isoform 4 3.0 3.27 TC7895 SSR alpha subunit/Translocon-associated protein
subunit alpha precursor (TRAP-alphmykiss] Type III iodothyronine deiodinase [Oreochrom
3.0 3.74
CK40750niloticus]
2.9 3.74
CV995270 Apolipoprotein B-100 precursor [Danio rerio 2.8 6.47 CV98755 SEC61, alpha subunit [Danio r 2.8 3.27 TC9511 Calreticulin [Ictalurus punctatus]
Dnajb112.7 0.00
EE99348 Selenium binding protein 1 isoform 4 [Danio rer 2.7 7.53 TC12946 Transferrin [Salmo trutta] 2.7 3.74 CK410283 Transmembrane emp24 domain containing protein 10
[Danio rerio] 2.7 1.71
BM43862 C1 inhibitor [Oncorhynchus mykiss] 2.6 3.74 TC8074 Deleted in malignant brain tumors 1 [Danio rerio] 2.6 3.74 CV99048 Isocitrate dehydrogenase 1 (NADP+ 2.6 1.25

160
io]
8
TC8712 [Danio rerio] 2.4 3.74 7
piens] 3
4/Oatp [Danio
5 homolog [Xenopus
us]
, subfamily B [Gallus
ctatus]
CK409154 2.3 5.24 ] 2.
ulus heteroclitus] io rerio]
] omo sapiens]
] R beta [Danio
rerio] TC8542 SEC11-like 1/SPC18 [Danio rer 2.6 3.74 TC6883 Thioredoxin [Ictalurus punctatus] 2.6 3.74 CV995732 Asparagine synthetase [Danio rerio] 2.5 0.00 CV99034 Calreticulin, like 2 [Danio rerio] 2.5 3.74 TC7047 DC2 protein [Xenopus tropicalis] 2.5 0.00 CB937094 Eif4e1a protein [Danio rerio] 2.5 1.25 TC8981 FK506 binding protein 2 [Mus musculus] 2.5 3.74 CV993716 SAR1a-like protein 2 [Ictalurus punctatus] 2.5 0.00 CV994347 Alpha-2-antiplasmin precursor [Danio rerio]
Bsg protein2.4 3.27
CK40946 Coagulation factor II (thrombin) [Danio rerio] 2.4 7.53 BM438581 Colipase preproprotein [Homo sa 2.4 6.47 CK40767 Leucine-rich alpha-2-glycoprotein [Ctenopharyngodon
idella] 2.4 1.71
TC9317 Solute carrier family 21, member 1rerio]
2.4 3.27
CK410712 Sorting nexin-17 isoform 7 [Canis familiaris] 2.4 1.71 TC7791 Asparagine-linked glycosylation
tropicalis] 2.3 7.53
CV988651 Coated vesicle membrane protein [Mus muscul 2.3 0.00 CV991514 Complement factor B/C2B [Cyprinus carpio] 2.3 3.74 CK407169 Cytochrome P450, family 8
gallus] Ferritin heavy subunit [Ictalurus pun
2.3 2.36
CK404798 2.3 6.47 BM027884 Glucose transporter 1A [Danio rerio] 2.3 5.24 TC6827 NADH dehydrogenase subunit 1 [Ictalurus punctatus] 2.3 0.00 CK411358 Phosphoethanolamine N-methyltransferase
[Strongylocentrotus purpuratus] Protein disulfide isomerase-related protein P5
2.3 1.25
CV991869 precursor [Danio rerio] Ras homolog gene family, member E [Danio rerio] Unnamed
2.3 0.00
CV987909 TC8069
protein product [Tetraodon nigroviridisC type lectin receptor A isoform 3 [Danio rerio]
3 2.2
3.27 5.24
TC9110 CD59 [Ictalurus punctatus] 2.2 0.00 CK415655 Endoplasmin [Aedes aegypti] 2.2 7.53 TC9203 Inter-alpha trypsin inhibitor [Fund 2.2 5.24 TC6955 Jun B proto-oncogene, like [Dan 2.2 0.00 TC8290 NADH dehydrogenase subunit 5 [Ictalurus punctatus 2.2 1.71 TC7513 SEC61, gamma subunit [H 2.2 5.24 TC7124 Stress-associated endoplasmic reticulum protein 1
[Homo sapiens2.2 5.24
CK425032 Translocon-associated protein beta/SSrerio] WW domain binding protein 2 [Ictalurus punctatus]
2.2 0.00
TC8465 Cathepsin L preproprotein [Cyprinus carpio]
2.2 3.74 CK406535 2.1 1.71

161
TC9827 rome c oxidase subunit 1 [Ictalurus furcatus] 2.1 0.00 aurus]
icus] nio rerio]
elated protein
] 2.[Danio
1 o rerio] tus]
ocon-
4 eptide
s
CytochTC10083 Glucose regulated protein 58kd [Bos t 2.1 6.47 TC8637 Hypothetical protein [Rattus norveg 2.1 1.25 CK408501 Intraflagellar transport protein 20 [Da 2.1 1.71 CB936516 Low density lipoprotein receptor-r
associated protein 1 [Danio rerio] 2.1 0.00
CV994121 Nucleobindin 2a [Danio rerio] 2.1 0.00 CV987930 Plasminogen [Danio rerio] 2.1 7.53 TC8540 Ribosomal protein L23a [Ictalurus punctatus 1 6.47 TC7429 SEC22 vesicle trafficking protein homolog B
rerio] 2.1 3.74
BM43822 SEC61, beta subunit [Dani 2.1 0.00 TC6893 Signal sequence receptor delta [Ictalurus puncta 2.1 3.74 TC7064 Signal sequence receptor, gamma (transl
associated protein gamma) [Danio rerio] Transposase [Bacillus cereus] 2.
2.1 6.47
CV992060 1 6.47 CK42212 Calpain-like protease [Gallus gallus]
Cytoch2.0 3.74
CK408710 rome P450, family 3, subfamily A, polyp65 [Danio rerio]
2.0 5.24
TC9714 Integral membrane protein 1 [Danio rerio] Peptidylpro
2.0 0.00 TC9540 lyl isomerase B/cyclophilin B [Ictaluru
punctatus] 2.0 3.74
TC8057 Profilin 2 like [Danio rerio] 2.0 3.74 CK402358 Retinol dehydrogenase 1, like [Danio rerio]
SEC13-2.0 7.53
CF971017 like 1 (S. Cerevisiae) [Danio rerio] 2.0 3.74 EE993544
Selenoprotein X, 1 [Danio rerio] 2.0 3.74
BM438153 Transducer of ERBB2, 1a [Danio rerio] 2.0 6.47

162
entign r r E. ictalu ection
ld n ity. Accessio fers to the Bank nu sequenc the microarray. q-value he false-d ery rate
for the parti
n tity Fold Chan q-value
Supplem al Table 4 Unique, s ificantly up-regulated catfish transcripts in live afte ri infthat cou ot be annotated by sequence similar n re Genaccession mber or TIGR consensus number of the e onPutative Id is the hit with the most negative E-value.
cular gene is t iscov
Accessio Putative iden ge
BM439193 .5 3.27 No significant similarity 35CV996365 1.25 CK406832 significant similarity 14.2 0.00
7.9 3.27 0 3.27 3 9 0.00
6.0 3.74 5.9 1.71
3.27 BM439121 t similarity 5.6 5.24
4.9 1.25 3.27
8 4.5 0.00 4.2 3.74 4.0 1.25 4.0 3.27 3.9 3.27
M439116 No significant similarity 3.7 3.27 F971645 No significant similarity 3.6 3.27 K407075 No significant similarity 3.5 3.27 C9113 No significant similarity 3.5 3.74 M438944 No significant similarity 3.4 3.27 K423432 No significant similarity 3.4 3.27 F972223 No significant similarity 3.3 1.71 K406955 No significant similarity 3.2 3.27 V996636 No significant similarity 3.2 5.24 F970862 No significant similarity 3.1 7.53 K409512 No significant similarity 3.1 3.74 C7025 No significant similarity 3.0 0.00 F971394 No significant similarity 2.9 3.27 E993209 No significant similarity 2.9 3.27 C8545 No significant similarity 2.9 1.71 F971799 No significant similarity 2.9 3.74 C7371 No significant similarity 2.8 5.24 K407648 No significant similarity 2.8 5.24
No significant similarity 15.3 No
CF970899 No significant similarity BM43904 No significant similarity 7.8 BM43889 No significant similarity 6.CF971612 No significant similarity CK408142 No significant similarity CV996287 No significant similarity 5.7
No significanTC7498 No significant similarity TC9712 No significant similarity 4.6 BM43881 No significant similarity CF971526 No significant similarity BM438848 No significant similarity BQ097411 No significant similarity BM438858 No significant similarity BCCTBCCCCCCTCETCTC

163
icant similarity 2.8 7.53
ficant similarity 2.5 6.47 M significant
7 6
2
5
1
5
CK406724 No signifCK413362 No significant similarity 2.8 3.27 CV994570 No significant similarity 2.8 1.71 CK425818 No significant similarity 2.8 1.71 CK406432 No significant similarity 2.7 1.71 CB939893 No signiB 029249 No similarity 2.5 0.00 TC8843 No significant similarity 2.5 3.74 CK409289 No significant similarity 2.5 3.27 CV994205 No significant similarity 2.5 5.24 CV993853 No significant similarity 2.5 5.24 CK409109 No significant similarity 2.5 3.27 CK404043 No significant similarity 2.5 1.71 CK422256 No significant similarity 2.4 3.74 CK407036 No significant similarity 2.4 0.00 CV992084 No significant similarity 2.4 1.25 BM424895 No significant similarity 2.4 2.36 CV99038 No significant similarity 2.4 5.24 CV99591 No significant similarity 2.4 3.74 CF970874 No significant similarity 2.4 3.74 CK418743 No significant similarity 2.3 2.36 CK421480 No significant similarity 2.3 0.00 CK410384 No significant similarity 2.3 5.24 TC9282 No significant similarity 2.3 3.74 CK402366 No significant similarity 2.3 3.27 CK412705 No significant similarity 2.3 1.71 CK425589 No significant similarity 2.3 5.24 CV99471 No significant similarity 2.2 3.74 CK404612 No significant similarity 2.2 3.74 CK418449 No significant similarity 2.2 7.53 CK403577 No significant similarity 2.2 3.27 CK425361 No significant similarity 2.2 3.74 BM424296 No significant similarity 2.2 3.74 CB939641 No significant similarity 2.2 3.27 BM438887 No significant similarity 2.1 3.74 CK41750 No significant similarity 2.1 3.27 CK407464 No significant similarity 2.1 3.27 CF972234 No significant similarity 2.1 3.74 CK42111 No significant similarity 2.0 7.53 CV991696 No significant similarity 2.0 3.27 CK40686 No significant similarity 2.0 3.74 CV991348 No significant similarity 2.0 3.27

164
CK406938 No significant similarity 2.0 3.27 CK407170 No significant similarity 2.0 5.24 CK405156 No significant similarity 2.0 1.71
Supplemental T y upregulated transcripts in blue catfish liver.
refers ssion number IGR cons number of the is the top inf rmative BLASTX hit. q-value is
iscov lar gene eId E-value Fold
Change q-
value (%)
able 5 All significantlAccession to the GenBank acce or T ensussequence on the mthe false-d
icroarray. Putative Idery rate for the particu
o
Accession Putativ
AY555503 C alurus furcat 2.00E-5 105.1 9.18 C chemokine SCYA106 [Ict us] 9 CF970955 I on idella] 7.00E-32 48.6 9.82
I 3.00E-1 37.7 5.63 H 83888 [Danio re 7.00E-4 30.9 5.63 I on idella] 4.00E-1 30.0 9.82 I 8.00E-1 28.4 9.18 M otein 4 [Danio 2.00E-7 27.1 5.63 M otein 4 [Danio 1.00E-5 22.9 5.63 H 83888 [Danio re 4.00E-4 20.6 9.82
3 H nio rerio] 1.00E-5 20.4 9.82 C rsor [Danio reri 2.00E-2 14.5 0.00 C alurus puncta 5.00E-4 12.5 8.97 W n-related-65 [
7.00E-1 12.3 8.70
W n-related-65kp atipes]
2.00E-1 11.9 9.82
C 2.00E-1 11.4 5.63 N 11.2 5.63 C recursor [Danirerio]
5.00E-1 10.1 9.18
H io rerio] 1.00E-9 9.7 5.63 M ase II alpha su [
8.00E-66 8.3 9.82
C ase domain cont g 1
2.00E-87 7.9 8.70
H io rerio] 5.00E-7 7.5 5.63 M otein 4 [Rattus n
3.00E-68 7.5 8.97
N 7.4 9.82 S pper transporterm
8.00E-77 7.1 8.70
ntelectin [CtenopharyngodCF971897 ntelectin 2 [Danio rerio] 17 TC9205 ypothetical protein XP_6 rio] 8 TC6845 ntelectin [Ctenopharyngod 28 CK407451 ntelectin 2 [Danio rerio] 20 CK406362 icrofibrillar-associated pr rerio] 5 CF970863 icrofibrillar-associated pr rerio] 7 CF971597 ypothetical protein XP_6 rio] 4 CK40848 aptoglobin precursor [Da 6 EE993177 omplement factor H precu o] 6 TC7475 C chemokine SCYA113 [Ict tus] 3 CF971550 arm-temperature-acclimatio
Oryzias latipes] 04
TC8425 arm-temperature-acclimatio da- rotein-like-protein [Oryzias l
18
TC7892 eruloplasmin [Danio rerio] 04 CK406832 o significant similarity EE993354 omplement component 7 p o
emopexin precursor [Dan
05
CK406564 0 CK405246 ethionine adenosyltransfer bunit
Mus musculus] CK407588 atechol-O-methyltransfer ainin
[Danio rerio] emopexin precursor [DanTC8426 5
BM438689 icrofibrillar-associated prorvegicus]
CK407645 o significant similarity CK408512 olute carrier family 31 (co s),
ember 1 [Danio rerio]

165
C ma protein [
7.00E-27 6.8 8.97
C ase domain cont 1
3.00E-76 6.7 8.70
V992853 Ceruloplasmin [Danio rerio] 8.00E-98 6.2 5.63 V997126 Complement C3 [Ctenopharyngodon idella] 3.00E-44 6.1 8.97 K407841 Fibrinogen gamma polypeptide [Danio rerio] 5.00E-109 5.7 5.63 C7925 Lysosomal-associated membrane protein 3
[Canis familiaris] 5.00E-24 5.7 9.82
82
C Complement inhib [Rattus norvegicus]
3.0 9
alurus
9 nctatus]
1 rerio]
io] .00E-61 io]
BQ096774 nificant similarity 4.1 9.18
6
anio rerio] 00E-68
TC9194 omplement regulatory plasParalabrax nebulifer]
CV994031
atechol-O-methyltransfer [Danio rerio]
aining
CCCT
CF971953 Fibrinogen, beta chain isoform 4 [Macaca mulatta]
5.00E-88 5.6 9.
CF972223 No significant similarity 5.5 7.00 TC7660 Complement component C9 [Ctenopharyngodon
idella] 1.00E-19 5.2 8.70
K407260 itory factor H 0E-24 5.2 .18
82 CK407984 Complement regulatory plasma protein [Paralabrax nebulifer]
1.00E-14 5.0 9.
TC9330 ER-resident chaperone calreticulin [Ictpunctatus]
0 4.8 5.63
TC8545 No significant similarity 4.8 0.00 CF97121 Ceruloplasmin [Danio rerio]
alurus pu7.00E-82 4.7 9.18
TC9859 MHC class I alpha chain [Ict 1.00E-130
4.7 8.70 CK407547 Protein disulfide isomerase associated 4 [Danio
rerio] 1.00E-122 4.7 5.63
CV995884 Solute carrier family 31 (copper transporters), member 1 [Danio rerio]
4.00E-67 4.7 7.00
CF971394 No significant similarity 4.5 8.97 CB939682 Protein disulfide isomerase-associated 4 [Danio
rerio] 8.00E-76 4.5 5.63
TC8306 Fibrinogen gamma polypeptide [Danio rerio] 6.00E-162 4.4 7.00 CK406609 Fibrinogen gamma polypeptide [Ictalurus
punctatus] 2.00E-63 4.4 9.82
BM43912 No significant similarity e [Danio
4.3 9.18 TC8490 Fibrinogen, B beta polypeptid 0 4.2 7.00 CK408412 Apoa4 protein [Danio rer 9 4.1 8.70 CK408535 Microfibrillar-associated protein 4 [Danio rer
No sig2.00E-17 4.1 5.63
CK408173 Pentraxin [Salmo salar] 5.00E-42 4.1 8.70 CK408666 Transferrin [Salmo trutta] 2.00E-68 4.1 9.82 CK405317 EE993343
Beta-actin [Tigriopus japonicus] Complement C4 [Oncorhynchus mykiss]
7.00E-90 3.00E-80
4.0 3.9
5.63 5.63
BM43911 No significant similarity 3.9 5.63 CK403482 No significant similarity
Fibrinogen al 3.9 8.70
CF971852 pha chain [D 7. 3.8 9.82 CK401799 CF972295
MGC68649 protein [Danio rerio] Thioredoxin [Ictalurus punctatus]
7.00E-67 1.00E-25
3.8 3.8
5.63 9.82

166
ein 9
7 TC7345 (IRL685) [Danio rerio] 1.00E-50 3.3 9.18
rinus carpio] .00E-59 1
CF972140 t similarity 3.1 9.18 t, alpha
6 E-53
sosomal vacuolar .00E-57
5
TC7903 ein [Xenopus laevis] 3.00E-60 2.9 9.18
CK405569 con-associated protein beta [Danio rerio] 3.00E-89 2.8 9.82 8
TC12946 Salmo trutta] 3.00E-141 2.7 9.82 [Ictalurus furcatus] .00E-07
eta E-82
us musculus] .00E-56
lpha [Danio rerio] cus E ligand
tus] ain kinase 1 [Danio .00E-77
us
in-binding,
TC7576 Tumor necrosis factor, alpha-induced protLOC407646 protein [D
4.00E-74 3.8 8.70 CK407596
K418197 anio rerio]
Cytochrome P450 3A [Ctenopharyngodon idella] 3.00E-67 5.00E-79
3.7 3.6
9.82 7.00 C
CF972133 No significant similarity 3.6 5.63 CK414572 No significant similarity 3.5 9.82 TC6882 Thioredoxin [Ictalurus punctatus] 5.00E-51 3.4 9.18 BM43871 TNFAIP9 protein isoform 2 [Danio rerio]
Fetuin-B precursor 2.00E-12 3.4 7.00
CV993853 No significant similarity 3.3 9.82 CV987901 Complement C3-H1 [Cyp 3 3.2 5.63 CK40961 Proteasome activator PA28 subunit [Cyprinus
carpio] 7.00E-98 3.2 9.82
CK406493 Complement C3-Q1 [Cyprinus carpio] No significan
6.00E-54 3.1 5.63
TC9755 Proteasome (prosome, macropain) subunitype, 3 [Xenopus tropicalis] Tumor necrosis factor, alpha-induced protein 9
1.00E-126 3.1 9.18
CF97157[Homo sapiens] Atpase H+ transporting ly
5.00 3.1 9.18
TC6790 proton pump [Pagrus major]
5 3.0 5.63
CK41175 Integral membrane protein 1 [Danio rerio] 4.00E-24 3.0 5.63 CK406132 Alpha-1-tubulin [Gecarcinus lateralis]
Armet prot3.00E-24 2.9 9.82
CK405386 No significant similarity 2.9 9.82 CF971092 No significant similarity 2.9 9.82 CF972078 Matrix metalloproteinase 13 [Danio rerio]
Translo5.00E-80 2.8 5.63
CK40434 H2A histone family, member V, isoform 1 [Homo sapiens] Transferrin [
7.00E-55 2.7 8.97
TC7398 CC chemokine SCYA106 1 2.6 8.97 TC7043 CCAAT/enhancer binding protein (C/EBP), b
[Danio rerio] 2.00 2.6 7.00
EE993326 CD63 [Oncorhynchus mykiss] 2.00E-62 2.6 9.82 TC8981 FK506 binding protein 2 [M 9 2.6 5.63 CF972066 No significant similarity 2.6 9.82 BM438439 Signal sequence receptor, a 3.00E-68 2.6 8.70 CK404046 Lymphocyte antigen 6 complex, lo
isoform 2 [Danio rerio] MHC class I alpha chain [Ictalurus puncta
1.00E-12 2.5 9.82
CK401855 2.00E-27 2.5 5.63 CK424035 Neuronal myosin light ch
rerio] 2 2.5 8.97
CV995916 No significant similarity 2.5 9.82 CK401686 WW domain binding protein 2 [Ictalur
punctatus] Amyloid beta (A4) precursor prote
1.00E-93 2.5 9.82
TC9648 7.00E-107 2.4 9.82

167
pti] .00E-42 t 1 [Danio rerio] .00E-100
talurus
rerio]
nio rerio]
[Danio rerio]
nit, beta
-binding protein 2 iseus]
.00E-48
9
1 ]
family B, member 2, partial [Danio rerio] BM438634 Angiotensinogen [Danio rerio] 6.00E-57 2.4 9.82 CV989409 Dnajb11 protein [Danio rerio] 2.00E-65 2.4 9.18 CK415655 Endoplasmin [Aedes aegy 3 2.4 9.82 TC8526 Proteasome activator subuni 7 2.4 5.63 TC6716 Beta-2 microglobulin precursor [Ic
punctatus] 3.00E-52 2.3 9.82
CV990995 Coactosin-like 1 [Danio rerio] saccharide-protein
1.00E-59 00E-61 2.
2.3 9.82 TC9170 Dolichyl-diphosphooligo
glycosyltransferase [Danio 2. 3 9.82
CV987949 Fructose-1,6-bisphosphatase 1, like [Da 3.00E-85 2.3 8.70 TC8645 Lectin, galactoside-binding, soluble, 9 (galectin
9)-like 11.00E-108 2.3 9.82
TC6930 LR8 protein [Danio rerio] 1.00E-52 2.3 9.18 CK423344 No significant similarity 2.3 9.82 TC6963 Proteasome activator subunit 2 [Danio rerio]
Similar to family with sequence similar1.00E-87 2.3 9.82
CK406492 ity 46, member A isoform 1 [Danio rerio] WW domain bind
1.00E-92 2.3 0.00
TC8465 ing protein 2 [Ictalurus punctatus] Alcohol dehydrogenase 5 [Dan
4.00E-95 2.3 9.82
CV995162 io rerio] 8.00E-93 2.2 9.82 CV989503 CXCL14 [Ictalurus punctatus]
ubu2.00E-52 2.2 9.82
TC7388 Proteasome (prosome, macropain) stype, 6 [Xenopus tropicalis]
2.00E-89 2.2 9.82
CV995433
Sterol regulatory element(SREBP-2) [Cricetulus gr
5 2.2 9.82
CK406459 Dnajb11 protein [Danio rerio] 1.00E-26 2.1 9.18 CK404782 Methionine adenosyltransferase II alpha subunit
[Mus musculus] 2.00E-80 2.1 5.63
CK410925 No significant similarity 2.1 9.18 CV994277
6No significant similarity 2.1 9.82
CV99663 No significant similarity 2.1 8.70 CK40898CK424843
No significant similarity No significant similarity
2.1 2.1
9.18 8.70
BM425334 No significant similarity 2.1 9.82 CK40742 Glutaredoxin (thioltransferase) [Danio rerio 2.00E-40 2.0 9.82 CV997128 No significant similarity 2.0 9.18 CK403934 No significant similarity 2.0 8.70 TC9161 hypothetical protein LOC641319 [Danio rerio] 4.00E-62 2.0 5.63

168
Supplemental d transcripts in blue catfish liver. refe n number or TIG sus n er of tn th the top informative BLASTX hit. q-valisco gene
n Fold Cha
q-va
Table 6 All significant, downregulateAccession rs to the GenBank accessio R consen umb he sequence o e microarray. Putative Id is ue is the false-d very rate for the particularAccessio Putative Identity E-value
nge lue
CK417600 No 0.4 9.57 significant similarity TC9079 An unit 13 [Danio
rerio] 0.5 9.57
0 Sel 0.5 9.57No 0.5 9.57
1 Sel 0.5 9.57
aphase promoting complex sub
enoprotein H [Danio rerio]
2.00E-35
CB94079 4.00E-29 TC9060 significant similarity CF97152 enoprotein P, plasma, 1b [Danio rerio] 2.00E-60
ntal ficantly up-regulated blue catfish transcripts in liver C infe uenc ity. A sion r
Ban num e sequ e on tP X hi is th lse-
y rate Accession Putative Id Fold
Chanq-value
(%
Suppleme Table 7 Unique, signiafter ES ction that could not be annotated by seq e similar cces efersto the Genmicroarray.
k accession number or TIGR consensusutative Id is the top informative BLAST
ber of tht. q-value
ence fa
he
discover for the particular gene
ge ) CK406832 No significant similarity 11.2 5.63 CF972223 5.5 7.00 CF971394 4.5 8.97
4.3 9.18 3.9 5.63 3.6 5.63
CK414572 ilarity 3.5 9.82 3.3 9.82 3.1 9.18 2.9 9.82 2.9 9.82 2.6 9.82 2.5 9.82 2.3 9.82 2.1 9.18 2.1 9.82
6 2.1 8.70 K408989 No significant similarity 2.1 9.18 K424843 No significant similarity 2.1 8.70 M425334 No significant similarity 2.1 9.82 V997128 No significant similarity 2.0 9.18 K403934 No significant similarity 2.0 8.70
No significant similarity No significant similarity
BM439121 No significant similarity BM439116 No significant similarity CF972133 No significant similarity
No significant simCV993853 No significant similarity CF972140 No significant similarity CK405386 No significant similarity CF971092 No significant similarity CF972066 No significant similarity CV995916 No significant similarity CK423344 No significant similarity CK410925 No significant similarity CV994277 No significant similarity CV99663 No significant similarity CCBCC