Genome‐wide copy number variation analysis in early onset ...
179
Genome‐wide Copy Number Variation Analysis in Early Onset Alzheimer’s disease A thesis Submitted to the Faculty of Drexel University by Basavaraj V. Hooli in partial fulfillment of the requirements for the degree of Doctorate of Philosophy August 2011
Transcript of Genome‐wide copy number variation analysis in early onset ...

Genome‐wide Copy Number Variation Analysis
in Early Onset Alzheimer’s disease
A thesis
Submitted to the Faculty
of
Drexel University
by
Basavaraj V. Hooli
in partial fulfillment of the
requirements for the degree
of
Doctorate of Philosophy
August 2011

© Copyright 2011
Basavaraj Hooli. All Rights Reserved.

iii
Dedication
To my family, mentors and friends for their enduring encouragement, love and support.
iv
Acknowledgements
Thankful acknowledgments are owed to some really awesome people.
First and foremost, to my incredible mentors over the past years – Drs. Rudy
Tanzi, Lars Bertram and Aleister Saunders. I would like to express sincere
gratitude to Rudy for the opportunity to pursue PhD in his illustrious lab, for
being an inspiring mentor, all the support, patience and guidance over the years.
I will be always indebted to Lars for all the knowledge and training in
Alzheimer’s genetics and conducting methodical and systematic research – it is
an absolute priceless experience. I cannot thank Aleister enough for introducing
me to the field of scientific research, for providing a strong foundation in basics
of biological research in such a short duration of time, and for the continued
advice and counsel. I will always be grateful for the contribution of my mentors
to my intellectual and professional development – I feel privileged to have them
as my mentors.
My sincere thanks to the committee members Drs. Guillermo Alexander,
Jacob Russell and Daniel Marenda for their support and valuable input towards
successful and timely completion of the project.
I appreciate meeting some of the smartest minds and nicest people during
these past years ‐ Sara Ansaloni, Neha Patel, Ranjita Mukherjee, Preeti

v
Khandelwal, Trinna Cuellar in Aleisterʹs lab. I would also not have completed
my project without the help and support of my colleagues in Rudyʹs unit:
Michele Parkinson, Donna Romano, Meghan Hogan, Kelly Goodwin, Taryn
Hargrove, Lucille Gotta, Rachael Blair, Jacqueline Greb, Dipal Savla, Rob Moir,
Stephanie Tucker, Mikko Hiltunen, Can (Martin) Zhang, Antonio Parrado, Brit‐
Maren Schjeide, Se Hoon Choi, Jaehong Suh, Graham Huesmann and Ana
Gricuic. We have had many ʺcivilianʺ and scientific discourses, solved
mysterious, took journeys together and partied until wee hours ‐ I hope we cross
our paths in future to re‐live those moments. Special thanks to Kristina Mullin
and Susanna Cortese for being there for me 24/7!
I owe many thanks to my fellow Cricketers and mates at Colonial
Cavaliers Cricket Club for all the laughs and camaraderie ‐ Gary Paul, James Fry,
Paddy Cashin, Stig Bjornbye, Donovan Hudson, Ben Loomes, Mark
Montgomery, Paul Whitelam, Mark Tutton, Jim Andrew, Mukund Ravipathy,
Rob Cooper and Lee Hewitt – cheers for victory and friendship!
My heartfelt thanks to Isabella Palazzolo, Katie Caruana, Shawn Mullet,
Marietta Kukuyan, Paul and Claudia Gard et al, Holger Droessler, Thomas
Geroge, Samir Varma, Lalit Bansal, Kumar Anabalagan, Vasil Atanasov, Simona

vi
Coborzan, Alina Constantinescu, Manuel Gersbacher and Johanna Bosse for their
companionship during these years.
Most importantly, my family mama‐Hooli, Anagha, Namita, Shiva and
Shan ‐ for their faith, love and support.

vii
TABLE OF CONTENTS
LIST OF TABLES ............................................................................................................. xi
LIST OF FIGURES .......................................................................................................... xii
ABSTRACT ....................................................................................................................xiii
1. INTRODUCTION ............................................................................................... 1
1.1 Alzheimerʹs Disease ................................................................................ 1
1.2 Genetics of Alzheimerʹs Disease ........................................................... 2
1.3 Current Status of AD Genetics .............................................................. 3
1.4 Structural Variations in the Genome .................................................... 4
1.5 Copy Number Variations ....................................................................... 5
1.6 Genomic effects of CNVs ....................................................................... 6
1.7 Functional Effects of CNVs .................................................................... 7
1.8 Prevalence of CNVs ................................................................................ 9
1.9 CNP Studies ............................................................................................ 11
1.10 CNV Analysis Strategy ......................................................................... 13
1.11 Ongoing Functional Studies ................................................................. 15
1.12 Summary ................................................................................................. 16
2. A CURRENT VIEW OF ALZHEIMER’S DISEASE ....................................... 24
2.1 Abstract .....................................................................................................24
2.2 Introduction .............................................................................................24
2.3 Genetics of AD .........................................................................................25
2.4 Molecular Pathology of AD ...................................................................25
2.5 Therapeutics in AD .................................................................................26
2.6 Major recent advances ............................................................................27
2.6.1 Genetics ....................................................................................................27
2.6.2 Beta‐amyloid toxicity ..............................................................................28

viii
2.7 Future directions .....................................................................................30
3. THE ROLE OF COMMON AND RARE APP DNA SEQUENCE
VARIANTS IN ALZHEIMR’S DISEASELIST OF TABLES................................ 35
3.1 Abstract .................................................................................................... 35
3.1.1 Objectives ................................................................................................ 35
3.1.2 Methods ................................................................................................... 35
3.1.3 Results ...................................................................................................... 35
3.1.4 Conclusion .............................................................................................. 36
3.2 Introduction ............................................................................................ 37
3.3 Results ...................................................................................................... 39
3.4 Discussion ............................................................................................... 42
3.5 Materials and Methods ......................................................................... 47
3.5.1 Participants ............................................................................................. 47
3.5.1.1 NIMH families ........................................................................................ 47
3.5.1.2 NCRAD and additional independent family samples ..................... 48
3.5.2 Experimental procedures ...................................................................... 48
3.5.2.1 Sequencing .............................................................................................. 48
3.5.2.2 Semi‐Quantitative Multiplex PCR (sQM‐PCR) ................................. 49
3.5.2.3 Fluorescent in situ hybridization (FISH) ............................................ 49
3.5.2.4 SNP‐Genotyping .................................................................................... 49
3.5.2.5 CNV Analysis ......................................................................................... 50
3.5.2.6 Fluidigm Digital Array protocol .......................................................... 51
3.5.2.7 Statistical Analyses ................................................................................ 51
4. RARE AUTOSOMAL COPY NUMBER VARIATIONS IN EARLY ONSET
ALZHEIMER’S DISEASE ....................................................................................... 62
4.1 Abstract .................................................................................................... 62
4.2 Introduction ............................................................................................ 63
4.3 Results ...................................................................................................... 66

ix
4.4 Discussion ............................................................................................... 68
4.5 Methods .................................................................................................. 74
4.5.1 Family sample‐sets ................................................................................. 74
4.5.2 Genotyping ............................................................................................. 74
4.5.3 Confirmation of CNVs ......................................................................... 75
5. SUMMARY ......................................................................................................... 94
5.1 Discussion ............................................................................................... 94
5.2 Functional Implications of CNVs on Alzheimer’s disease ............. 97
5.3 CNVs in families with APOE‐ε4 risk allele genotype ..................... 98
5.3.1 Role of deletion in CHMP2B and POU1F1 on neuronal autophagy
leading to AD .......................................................................................... 98
5.3.2 Role of Loss in KANK1 and DMRT genes leading to AD ............ 101
5.3.3 Role of VLDLR deletion on AD via disruption of Reelin related
neuronal clearance and degradation pathways ............................. 103
5.3.4 Role of gain in CDH2 gene on Cadherin signaling, neurogenesis
and AD .................................................................................................. 105
5.3.5 Implication of CNV in ADHD and dopaminergic system associated
loci in AD .............................................................................................. 108
5.3.6 Role of CNV in Ephrin receptor gene EPHA6 on synaptogenesis
and AD .................................................................................................. 111
5.4 CNVs in families negative for APOE‐ε4 genotype ........................ 113
5.4.1 Role of deletion in Ataxin related neurodegeneration loci and AD
pathogenesis ........................................................................................ 113
5.4.2 Role of deletion spanning an uncharacterized metallopeptidase in
EOAD .................................................................................................... 116
5.4.3 Role of CRMP1 CNV on Semaphorin‐3A associated neuronal
assembly and migration in EOAD .................................................... 117
5.5 Final Remarks ...................................................................................... 120
5.2 Future direction .................................................................................... 121

x
LIST OF REFERENCES ................................................................................................125
APPENDICES ................................................................................................................143
Abbreviations ................................................................................................................144
Supplementary Table 1: Additional CNV confirmation in probands using TERT
house‐control gene instead of the RNaseP ...............................................................149
Supplementary 2: Image Results from FISH Confirmation experiments in NIMH
families ...........................................................................................................................151
Family 52106 .....................................................................................................151
Family 51278 .....................................................................................................152
Family 50152 .....................................................................................................153
Family 50354 .....................................................................................................154
Family 50985 .....................................................................................................155
Family 50996 .....................................................................................................156
Family 50368 .....................................................................................................157
Family 51146 .....................................................................................................158
Family 51223 .....................................................................................................159
Family 52256 .....................................................................................................160
Family 51192 .....................................................................................................161
Family 50722 .....................................................................................................162
VITA ................................................................................................................................163
xi
LIST OF TABLES
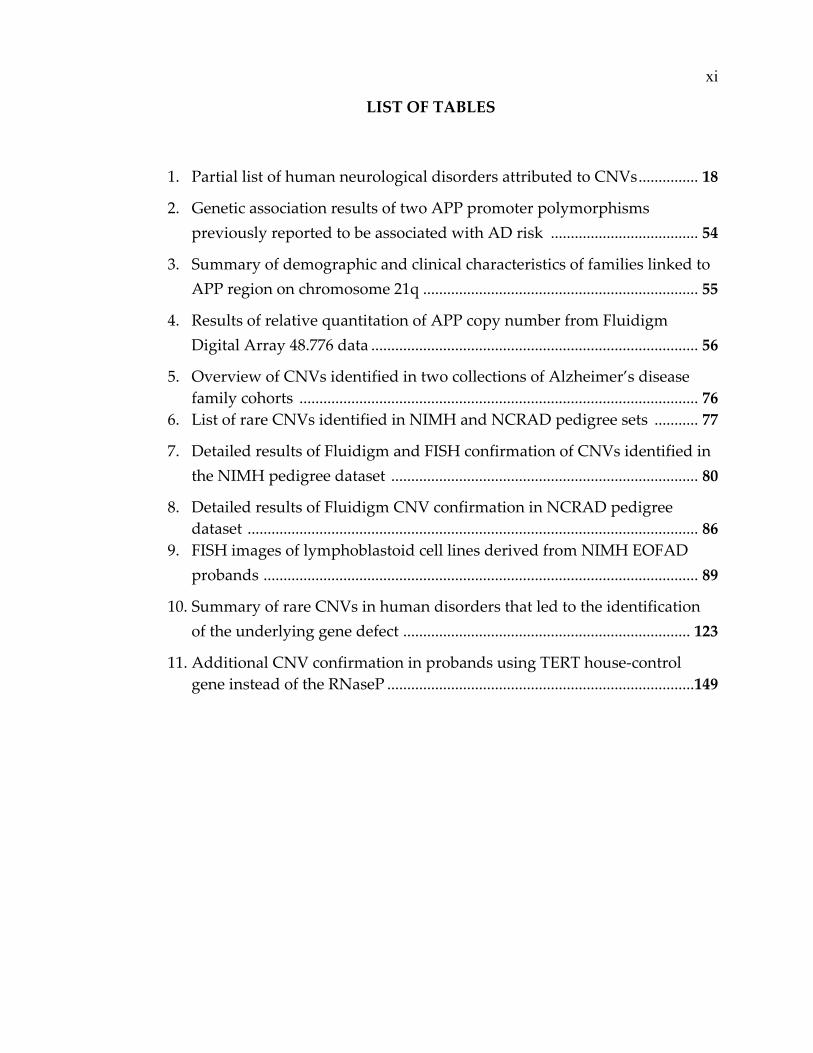
1. Partial list of human neurological disorders attributed to CNVs ............... 18
2. Genetic association results of two APP promoter polymorphisms
previously reported to be associated with AD risk ..................................... 54
3. Summary of demographic and clinical characteristics of families linked to
APP region on chromosome 21q ..................................................................... 55
4. Results of relative quantitation of APP copy number from Fluidigm
Digital Array 48.776 data .................................................................................. 56
5. Overview of CNVs identified in two collections of Alzheimer’s disease
family cohorts .................................................................................................... 76
6. List of rare CNVs identified in NIMH and NCRAD pedigree sets ........... 77
7. Detailed results of Fluidigm and FISH confirmation of CNVs identified in
the NIMH pedigree dataset ............................................................................. 80
8. Detailed results of Fluidigm CNV confirmation in NCRAD pedigree
dataset ................................................................................................................. 86
9. FISH images of lymphoblastoid cell lines derived from NIMH EOFAD
probands ............................................................................................................. 89
10. Summary of rare CNVs in human disorders that led to the identification
of the underlying gene defect ........................................................................ 123
11. Additional CNV confirmation in probands using TERT house‐control
gene instead of the RNaseP .............................................................................149
xii
LIST OF FIGURES
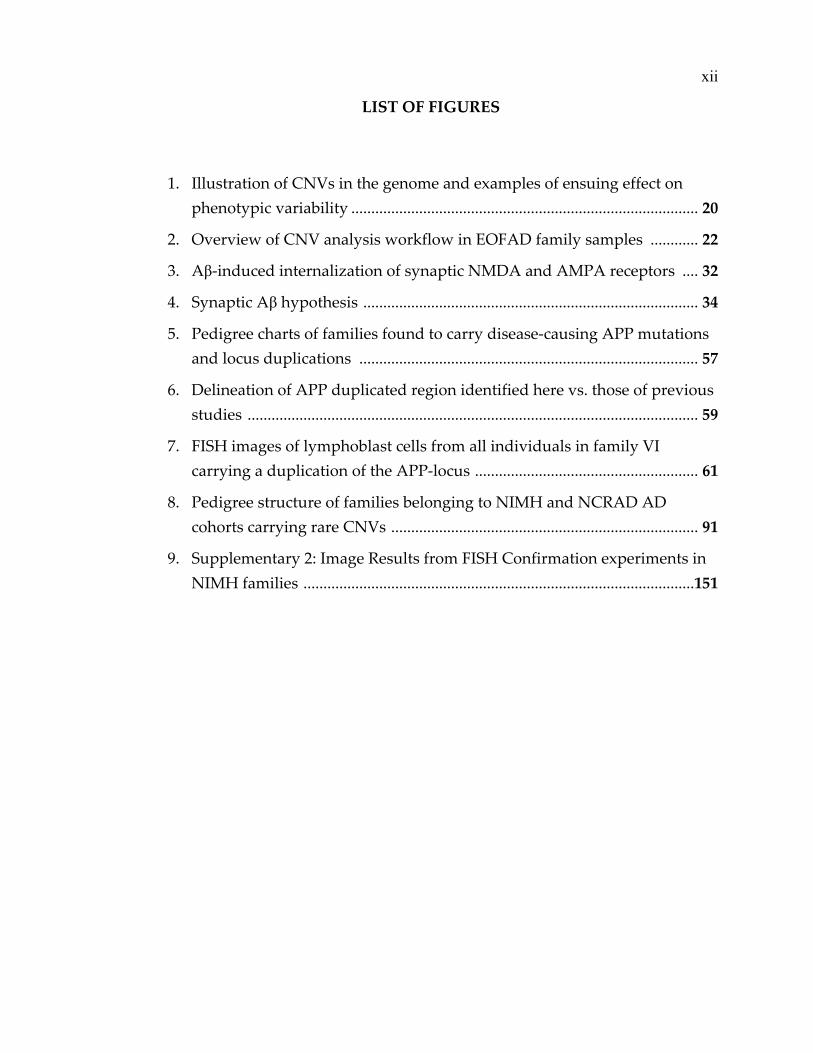
1. Illustration of CNVs in the genome and examples of ensuing effect on
phenotypic variability ....................................................................................... 20
2. Overview of CNV analysis workflow in EOFAD family samples ............ 22
3. Aβ‐induced internalization of synaptic NMDA and AMPA receptors .... 32
4. Synaptic Aβ hypothesis .................................................................................... 34
5. Pedigree charts of families found to carry disease‐causing APP mutations
and locus duplications ..................................................................................... 57
6. Delineation of APP duplicated region identified here vs. those of previous
studies ................................................................................................................. 59
7. FISH images of lymphoblast cells from all individuals in family VI
carrying a duplication of the APP‐locus ........................................................ 61
8. Pedigree structure of families belonging to NIMH and NCRAD AD
cohorts carrying rare CNVs ............................................................................. 91
9. Supplementary 2: Image Results from FISH Confirmation experiments in
NIMH families ..................................................................................................151

xiii
Abstract
Genome‐wide Copy Number Variation Analysis
in Early Onset Alzheimer’s disease
Basavaraj Hooli, MS
Rudolph E. Tanzi, PhD, Lars Bertram, MD and Aleister Saunders, PhD
Background: Alzheimer’s disease (AD) is a progressive neurodegenerative
disorder and the leading cause of senile dementia. By the year 2050, AD
prevalence is projected to affect a staggering 15 million in the US and 80 million
worldwide, making discovery of therapeutic interventions imperative. Family
history is the second major risk factor in AD following age. Although close to 700
different genes have been investigated in AD to date, fully penetrant mutations
in three genes: APP, PSEN1 and PSEN2 known to cause early‐onset familial AD
(EOFAD), and a common e4 allele in APOE increasing risk in sporadic or late
onset form of AD (LOAD), remain the only established AD genetic factors;
altogether explaining just about 50% of the variance.
Rationale and Aim: A Majority of the published reports in AD genetics are based
on nucleotide level changes, while role of large genomic structural re‐
arrangements such as, copy number variations (CNVs), are not comprehensively
investigated ‐ APP locus duplication remains the only pathogenic CNV reported
to date. With an estimated genomic coverage of over ten times that of single
nucleotide polymorphisms (SNPs), CNVs make significant contribution to

xiv
genotypic and phenotypic variation, consequently underlying pathogenesis of
various diseases. The specific aim of the project is to perform genome‐wide CNV
analysis in AD afflicted families to identify presence of pathogenic CNVs, if any.
Approach: Genetic studies in EOFAD pedigrees have been most fruitful in
revealing rare mutations, which also contributed significantly to the current
understanding of AD pathogenesis. On the other hand, the complex and
heterogeneous nature of genetics of LOAD have been hard to unravel. Therefore,
this study is limited to analysis of large (>100 Kb), rare and fully penetrant CNVs
in early‐onset pedigree samples (261 families and 1015 subjects).
Results: In addition to confirming APP duplication in two previously known
families, our results revealed nine rare and novel CNVs segregating with
EOFAD. The CNVs encompass genes, ERMP1, CRMP1, CHMP2B, VLDLR,
A2BP1, and EPHA6, to name a few, associated with various neuronal pathways
and brain disorders. To our knowledge, this is the first study reporting rare gene‐
rich CNVs in EOFAD.


1
CHAPTER 1: INTRODUCTION
1.1 Alzheimer’s disease
Alzheimer’s disease makes up for 60‐80% of dementia diagnosed in the
elderly. In 2010, the numbers of reported dementia cases were estimated to be 5.5
million in US and more than 36 million people worldwide. This number of
patients is projected to nearly double every 20 years resulting in more than 15
million AD cases in US and more than 100 million patients globally (Alzheimerʹs,
2009, 2010; Ferri et al., 2005; Leon & Neumann, 1999). Clinically, AD is
characterized by progressive neurodegeneration and impairment of memory and
cognitive functions (McKhann et al., 1984), due to loss of synapses of the affected
brain regions, mainly hippocampus and cerebral cortex. The Neuropathological
hallmark of post‐mortem AD brains are extracellular plaques composed of
amyloid‐beta (Aβ) peptides and intraneuronal neurofibrillary tangles consisting
of hyperphosphorylated tau protein ‐ although other lesions such as TDP‐43
immunoreactivity, cerebral amyloid angiopathy (CAA) and ischaemia are also
reported in many cases (Braak & Braak, 1991).
1.2 Genetics of Alzheimer’s disease
AD is caused by several complex and heterogeneous factors. The definite
causative factors of AD are not known in most cases but there are several risk

2
factors that contribute to the onset of the disease. Age and family history are the
greatest risk factors in AD. The risk for disease doubles with every decade in
individuals older than 65 years of age. Based on age of onset, AD is classified as
early‐onset (EOAD, onset age <65 years of age) and late‐onset (LOAD, onset age
>65 years). Although most patients (>90% of diagnosis) develop LOAD, it is
mainly the research performed on the rare autosomal dominant familial
(EOFAD, <10% of the cases) that provided valuable insights into disease
pathogenesis (Tanzi & Bertram, 2005). More than 225 fully penetrant (causal)
mutations causing EOFAD were identified within three genes; the amyloid
precursor protein gene (APP) and the two presenilin genes (PSEN1 and PSEN2).
APP encodes amyloid‐β precursor protein, precursor to Aβ plaques, while PSEN1
and PSEN2 encode the enzymes that are involved in APP proteolysis. All these
mutations follow a common pathway of altering Aβ production leading to a
relative overabundance of the neurotoxic Aβ42 species that lead to neuronal cell
death and dementia (Reviewed in Tanzi & Bertram, 2005, and Scheuner et al.,
1996). While the heritability for the more common late‐onset form of AD is
predicted to be as high as 80% based on twin studies (Gatz et al., 2006), over the
last decades only the apolipoprotein E gene (APOE) has been unequivocally
recognized as a major risk factor for late‐onset AD (Tanzi & Bertram, 2005).
Nonetheless, variations in these four genes account for about 50% genetic
3
variation in AD, and the rest remain to determined (Bertram, McQueen, Mullin,
Blacker, & Tanzi, 2007; Tanzi, 1999).
1.3 Current Status of AD Genetics
Efforts to map additional disease genes using linkage analysis have found
evidence for multiple loci on more than ten different chromosomes (Bertram,
2008; Blacker et al., 2003). To date, more than three dozen genes have been
implicated from studies of >2900 SNPs in about 700 genes, but almost none of
them have been unambiguously confirmed (Bertram, et al., 2007). An up to date
status on the genetics of LOAD can be found at http://www.alzgene.org
(Bertram, 2008), and a list of EOFAD mutations can be found in the AD & FTD
Mutation Database (Cruts, 2009). Importantly, all these reported genetic studies
interrogated nucleotide substitutions (e.g. Single nucleotide polymorphisms i.e.
SNPs, short insertions/deletions) and association with AD with one exception ‐
duplication in the APP locus was identified to cause EOAD (segment length – 0.4
to 6.5 Mb) in numerous independent families (Rovelet‐Lecrux et al., 2006).
Replication of the APP duplication assay in our family samples confirmed the
presence of the rare APP locus duplications in two EOAD pedigrees (<1% of the
cases), but with incomplete penetrance (Hooli et al., manuscript submitted).

4
1.4 Structural variations in the genome
It has been more than 50 years since the first case of trisomy 21 was
reported, caused by a pathogenic microscopic structural variation (duplication of
entire chromosome 21) in the affecteds (Lejeune, Gautier, & Turpin, 1959). In
2004, increased availability of genome‐wide DNA array technology led to full
scale recognition and characterization of genomic structural alteration (Iafrate et
al., 2004; Sebat et al., 2004) causing a drastic change in the perspective on the
fluidity of the genome. Prior to these findings, the human genome was
considered largely diploid with small repeat variations and base substitutions.
The term Structural Variations (SVs) is used in a wide context to refer to a
microscopic to sub‐microscopic alterations involving long segments of genomic
DNA. SVs encompass quantitative variations, such as, deletions and
duplications, translocational variations, and orientational alterations in the
genomic segment i.e. inversions (Freeman et al., 2006). Database of Genomic
Variants (version Nov. 2010, (DGV, 2011)) lists more than 100K SVs reported in
humans, from more than 40 population genetic studies. Recent reports have
provided large amounts of data on the frequency of SVs, functional relevance
and other descriptions, but further information is needed to form a clear
consensus on the characteristics of SVs. Nonetheless, previous estimates on

5
99.9% genetic similarity between two individuals are clearly seen as inaccurate,
and it is fully apparent that SVs not only cause of rare ‘genomic disorders’
(Lupski, 1998) but are ubiquitous in normal individuals.
1.5 Copy Number Variations
Copy Number Variations (CNVs) are the quantitative and unbalanced
alterations in normally diploid genomic loci. Feuk et al (Feuk, Carson, & Scherer,
2006) defined copy number variations somewhat arbitrarily to segments larger
than 1 Kb to eliminate smaller variations, such as, segmental duplications (SDs),
Variable Number Tandem repeats (VNTRs), micro‐ and mini‐satellite repeats etc.
CNVs are either deletions, or tandem or insertional duplications compared to a
ʹreferenceʹ genome, which results in perturbation of “normal” biological balance
of the diploid state (Fig. 1‐1). CNVs occur rarely in highly conserved regions, but
gene rich regions have been found to have higher frequencies of CNVs indicating
that structural variation is a property of the functional genome (Lupski, 2007).
1.6 Genomic effects of CNVs
CNVs are often found to be flanked by nearly identical blocks of sequence,
such as, SDs, low‐copy repeats (LCRs), Alu and LINE repetitive elements etc.,
and hence are abundant in the centromeric and telomeric regions in most
organisms (Cooper, Nickerson, & Eichler, 2007). The repeat sequences facilitate
6
CNV generation (Gu, Zhang, & Lupski, 2008) by nonallelic homologous
recombination (NAHR) due to unequal crossing over and misalignment in the
DNA strands. Non‐homologous end joining (NHEJ) is another recombination‐
based mechanism of CNV formation. NHEJ does not require LCRs and occurs
when broken DNA strands are bridged, modified, and ligated incorrectly. The
third mechanism recently reported is termed, Fork Stalling and Template
Switching (FoSTeS). FoSTeS is attributed to the complexity in the genomic
architecture characterized by unusual symmetry, and is found to facilitate an
error‐prone DNA replication mechanism resulting in CNVs (Stankiewicz &
Lupski, 2010). CNVs are a key source of genetic variation key to phenotypic
diversity and evolution, conversely also lead to disease pathogenesis, as
observed in strikingly high number of CNVs per genome in cancer‐prone
individuals in Li–Fraumeni syndrome (Shlien et al., 2008) and neuroblastoma
(Diskin et al., 2009). These observations, in addition to pathogenic deletions and
duplications, have prompted investigations into occurrence of copy number
polymorphism (CNPs) as an indication of genomic instability leading to disease
pathogenesis. For example, extreme frequencies (too high and too low), de novo
or change during transmission between generations (C. Lee & Scherer, 2010) etc.
have been implicated in Autism spectrum disorders ASD (Sanders et al., 2011).
7
1.7 Functional Effects of CNVs
A recent study on gene expression level in lymphoblasts derived from
HAPMAP individuals attributed 18% of the detected variation in expression
levels of over 15,000 genes to overlapping CNVs (Stranger et al., 2007).
Investigations of the roles of CNVs during evolution and their biological
significance in health and diseases are rapidly progressing but still rudimentary
(Beckmann, Estivill, & Antonarakis, 2007; N. P. Carter, 2007) and controversial
(Gardiner, 2004).
In trisomy 21 cases, it is hypothesized that the chromosome 21 critical
region containing a subset of dosage‐sensitive genes determine the disease
phenotype. Trisomy 21 patients show AD with cerebral amyloid angiopathy
phenotype, also seen in few EOFAD families, prompting the identification of
APP duplications as a potential cause of EOFAD (Rovelet‐Lecrux, et al., 2006).
The most common ways CNVs affect phenotypic variability is by alteration in
transcription of genes that are sensitive to dosage affects. CNVs are also shown
to have positional effects on genes 2 to 5 Mb (Weterman et al., 2010) away from
the breakpoint, which also correlates with changes in the abundance of
corresponding transcripts. Excess of a protein produced due to an increase in
gene dosage may have various consequences, including (Cooper, et al., 2007;

8
Lupski & Stankiewicz, 2005; Stankiewicz & Lupski, 2010): protein misfolding in
an age‐dependent manner, overload in intracellular protein transport pathways,
and proteosome degradation and recycling (commonly seen in
neurodegeneration (Figure 1‐1). Intracellular aggregation of proteins and
inclusions could lead to dysregulation of pathways associated with the protein,
enhance free radical formation, cause mitochondrial damage and dysfunction,
and initiate apoptosis (J. A. Lee & Lupski, 2006). Absence or excess of the protein
product of a dosage sensitive gene is another functional consequence of CNVs
frequently investigated for influence on cell differentiation or migration, tissue
formation etc., thus leading to various disorders. In addition to affecting
transcript levels CNVs can alter phenotype by unmasking of recessive mutations
of the remaining allele when deletion occurs (Figure 1‐1) (J. A. Lee, Carvalho, &
Lupski, 2007). Other complex mechanisms of CNVs induced phenotypes include
(Henrichsen, Chaignat, & Reymond, 2009): gene‐interruption, gene‐fusion,
unmasking of recessive alleles of silenced genes, and interruption of regulatory
gene‐gene and chromosomal interactions etc. (Kalman & Vitale, 2009).
Recent studies also report that CNVs overlapping LCRs include genes
involved mainly in sensory perception and immune response, while CNVs not
overlapping LCRs include genes involved with signaling (neurophysiology),
development, cell growth, proliferation and differentiation (Cooper, et al., 2007).

9
These genes are known to be dosage sensitive and might affect neurocognitive
skills/deficits, personality determinants, behavioral abnormalities, and
psychiatric disorders. In line with this, several psychiatric disorders, including
mood and anxiety disorders, have been associated with CNVs (J. A. Lee &
Lupski, 2006).
In summary, CNVs confer phenotypes through several mechanisms in
genomic disorders (Table 1‐1). These include gene dosage effect at the
transcription and translational levels, gene disruption, gene fusions at the
junction, position effects in which the rearrangement alters the regulation of a
nearby gene, and unmasking of recessive mutations or functional SNPs on the
remaining allele (Lupski & Stankiewicz, 2005). CNV analysis could hence reveal
novel genes and pathways of functional significance that may not have been
obvious from studies of nucleotide level alterations.
1.8 Prevalence of CNVs
The Database of Genomic Variants (DGV) lists SVs in humans ascertained
from various published sources. Redon et al (Redon, Ishikawa, Fitch, Feuk,
Perry, Andrews, Fiegler, Shapero, Carson, Chen, Cho, Dallaire, Freeman,
Gonzalez, Gratacos, Huang, Kalaitzopoulos, Komura, MacDonald, Marshall,
Mei, Montgomery, Nishimura, Okamura, Shen, Somerville, Tchinda, Valsesia,
10
Woodwark, Yang, Zhang, Zerjal, Zhang, et al., 2006) reported the earliest
description of more than 1400 CNVs encompassing about 12% of the human
genome. The locus specific mutation rate for genomic rearrangements range
between 10−4 and 10−5, at least 1000‐ to 10,000‐fold more frequent than point
mutations (Korbel et al., 2007; Lupski, 2007; Redon, Ishikawa, Fitch, Feuk, Perry,
Andrews, Fiegler, Shapero, Carson, Chen, Cho, Dallaire, Freeman, Gonzalez,
Gratacos, Huang, Kalaitzopoulos, Komura, MacDonald, Marshall, Mei,
Montgomery, Nishimura, Okamura, Shen, Somerville, Tchinda, Valsesia,
Woodwark, Yang, Zhang, Zerjal, Zhang, et al., 2006). In line with the above
reports, various reports estimate more than 10X coverage of genomic alteration
by CNVs compared to SNPs. In comparison, HAPMAP reports estimate between
3 million to 10 million SNPs, depending on the ethnicity, in humans. However,
because each SNP affects only a single nucleotide, the overall genomic
representation is no more than 0.1% to 0.3% of the coverage in variation. In
addition, numerous studies using whole‐genome sequencing data, attribute
about 1.3% of nucleotide variation was to CNVs (Gautam et al., 2011; Itsara et al.,
2009; Levy et al., 2007) confirming the assessment of the genomic coverage to the
same extent. However, the relative importance and abundance of the two
variations is still debated.

11
In summary, the past five years of research have provided remarkable
insight into the occurrence of CNVs in ‘normal’ subjects. The frequency,
pathogenicity, segment‐size etc. are still being fully characterized owing to the
refinement of the genotyping platforms and availability of whole‐genome
sequencing platforms.
1.9 CNP Studies
Nearly 1400 reports have been published in AD so far in the quest of
finding novel additional genes that would explain the missing heritability. Like
in many other human disorders, the genetic risk factors identified in large scale
genome‐wide association studies (GWAS) using SNPs have shown modest
effects on AD onset. Importantly, recent reports strongly suggest that rare CNVs
show potential in representing an important portion of missing heritability in
complex disorders (Eichler et al., 2010; Manolio et al., 2009; F. Zhang et al., 2010).
The outcome from GWAS of human diseases using CNPs as markers has been
equally unfruitful (Conrad et al., 2010), thus undermining the hypothesis of
common variant – common disease (Maher, 2008). In contrast, genetic studies in
EOFAD have provided the most in‐depth knowledge on the amyloidogenic
pathway leading to AD. Also, in contrary to other neurodegenerative diseases,
genes that cause EOAD have not been found to carry common alleles that alter

12
risk for LOAD (Bertram, 2011). Considering the above facts, the primary focus of
the project is limited to identifying the presence of “rare” pathogenic variants in
EOFAD pedigrees.
The other limitation in utilizing copy number (CN) data as markers comes
from the genotyping platforms (C. J. Carter, 2007). The current platforms that are
cost affective and amenable for large scale genome‐wide analysis for genetic
variants are limited to oligonucleotide based DNA array panels. Paired‐end
whole genome sequencing is expensive, and still in the early stages to be used in
such large number of affected families (Alkan et al., 2009; Bentley et al., 2008;
McKernan et al., 2009). CNVs of 1–50 kb in size still remain under‐ascertained
even though the DNA array technology and CNV‐segmenting software
algorithms have evolved rapidly in the past few years (J. I. Kim et al., 2009; J.
Wang et al., 2008). Additionally, CNVs of pathological consequence are more
likely to be large (encompassing many genes and/or regulatory sequences), and
to involve loss, rather than gain, of genomic material, even though data from
early studies are somewhat biased because of the relative ease of ascertainment
of deletions and larger segments using SNP arrays (Lin et al., 2011).

13
Overall, in order to reduce chances of false positive findings, and to
narrow down on functionally relevant and rare CNVs, we limit the size of the
CNV segments to >100 Kb in the current study.
1.10 CNV Analysis Strategy
Preliminary analyses for CNVs in two previously known AD
susceptibility loci (APP and PSEN1) revealed CN gains spanning APP, but none
were found to involve PSEN1. These results are in line with previous reports
(Domingues‐Montanari et al., 2011; McNaughton et al., 2010), suggesting highly
penetrant CNVs are a rare cause in EOFAD explaining less than 0.1% of the
familial cases (Hooli et al, submitted). Since CNVs contributing to the disease are
not localized to any specific loci (Sebat et al., 2007) and AD linkage studies
indicate numerous loci on multiple chromosomes, we undertook genome‐wide
investigation of rare, large, and highly penetrant CNVs that segregate with
disease in EOFAD pedigrees showing Mendelian patterns of disease inheritance.
Figure 1‐2 gives an overview of CNV analysis strategy of the project. The
discovery of de novo and inherited CNVs causing diseases is fairly new, and is
complicated by the lack of understanding and characterization of CNPs (Alkan,
Coe, & Eichler, 2011). There are few studies that examine contribution of CNVs
to disease risk and a few strategies have only been suggested recently (Sebat, et
14
al., 2007; Weiss et al., 2008). Since the frequency and end‐points of CNPs in
normal population are not fully characterized, distinguishing and eliminating
these from disease related CNVs is a challenge. Using EOAD families, where
genetic contribution to the disease onset is more pronounced, the experimental
design and data analysis strategy are limited to identifying large, and rare
disease‐causing CNVs, hence CNPs reported in DGV were not included in the
study.
A total of 261 families with “early/mixed” onset age were included in the
study: 131 families (517 subjects [316 affecteds, onset age 64.5+9.5]) from the
National Institute of Mental Health (NIMH, (Go et al., 1997)) sample set and 130
families from (498 subjects [332 affecteds, onset age 63.3+9.2]) National Cell
Repository for Alzheimerʹs Disease (NCRAD, (Wijsman et al., 2011)). DNA
samples were processed on Genome‐Wide Human SNP Array 6.0 developed by
Affymetrix Inc., which incorporates about 1.8 million probes (25‐mer nucleotide
sequence), including more than 906,600 targeting known HAPMAP SNPs and
more than 946,000 non‐polymorphic probes for the detection of CNVs in human
genome. The resulting array probe intensity data from all the samples were
normalized using custom ‘reference intensity library’ and CNV segmentation
was performed using PennCNV (K. Wang et al., 2007). CNV segments >100 Kb,
showing <70% overlap with CNPs reported in DGV, and not present in
15
unaffected subjects in the entire NIMH and NCRAD (n=816) were analyzed for
segregation with disease. The 70% cut‐off range was chosen based on previous
reports (DGV, 2011; Iafrate, et al., 2004; J. Zhang, Feuk, Duggan, Khaja, &
Scherer, 2006) and twin studies (Maiti, Kumar, Castellani, OʹReilly, & Singh,
2011) discerning CNVs vs. CNPs. CNVs that passed the three criteria and
segregated with disease status in EOFAD pedigrees were listed for confirmation
using fluorescence in situ hybridization (FISH, (Mohapatra et al., 1997)) and/or
Fluidigm digital arrays (Qin, Jones, & Ramakrishnan, 2008; Weaver et al., 2010).
Highest priority was given to CNVs present in families that overlapped with AD
functional candidate genes and did not carry the APOE‐ε4 risk allele.
1.11 Ongoing functional studies
Considering the phenotypic impact of CNVs from recent reports(Kalman
& Vitale, 2009; C. Lee & Scherer, 2010), we reasoned that investigating mRNA
and protein expression level differences in the genes encompassed by CNVs
could reveal dysregulation of associated molecular pathways leading to EOAD,
if any. However, given the time‐ and resource‐ constraint of a doctoral research
project, determining gene expression by quantitative real‐time (qPCR) and
western blot analysis, in parallel to gene knock‐down and over‐expression
experiments is likely to extend beyond realistic time‐frame. Nevertheless, we are

16
making efforts to perform pilot experiments in collaboration with other groups
with expertise in functional assays and prioritize few ‘top‐hit’ genes for in‐depth
studies on functional consequences leading to AD pathogenesis. In addition,
sequencing analysis for pathogenic mutations in candidate genes (that are
overlapped by the CNVs) are expected to be complete before manuscript
submission.
1.12 Summary
In summary, knowledge about human genetic variation was limited
mainly to the heterochromatin polymorphisms, large enough to be visible in the
light microscope in the last few decades of the twentieth century. The traditional
PCR‐based DNA sequencing helped characterize SNPs and build a complete
human reference genome, providing great insight into genomic variation in
humans. Consequently, similar to numerous other spectrum of human diseases,
the majority of the AD genetics studies published to date are based solely on
nucleotide level changes, such as SNPs and mutations, with three exceptions
(Brouwers et al., 2011; Heinzen et al., 2010; Shaw et al., 2011).
On the other hand, the past five years has seen significant development
and refinement in microarray technologies, including oligonucleotide arrays,
comparative genomic hybridization and SNP genotyping arrays, as well as, next‐
17
generation sequencing with “paired‐end” methods, enabling whole‐genome
analysis with almost unlimited resolution. The discovery of submicroscopic
copy‐number variations (CNVs) revealed in human genome has changed our
perspective dramatically on DNA structural variation and disease pathogenesis.
In view of the new findings, investigation of large, rare and highly penetrant
CNVs that cause EOFAD could hold clues to missing AD heritability, as well as,
provide novel insight into the disease onset. The results hold enormous potential
to further our understanding of AD pathogenesis and to aid in discovery of
therapeutic interventions for this devastating disease.
18
TABLES
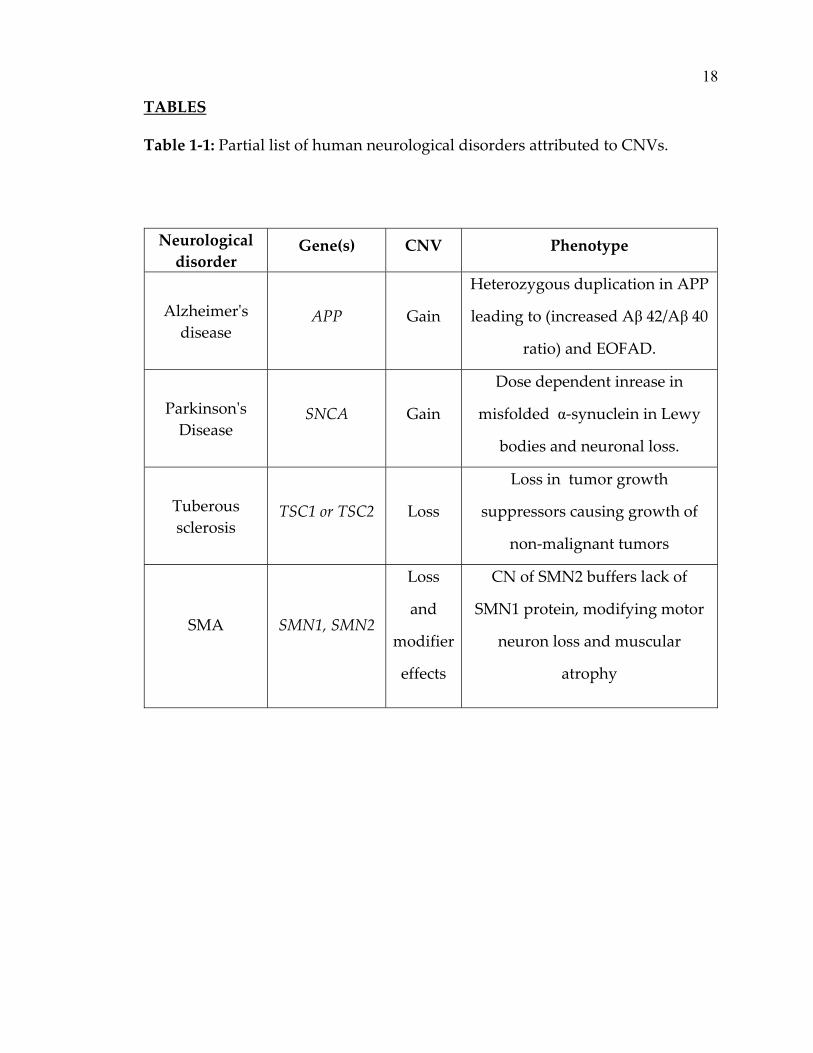
Table 1‐1: Partial list of human neurological disorders attributed to CNVs.
Neurological
disorder Gene(s) CNV Phenotype
Alzheimerʹs
disease APP Gain
Heterozygous duplication in APP
leading to (increased Aβ 42/Aβ 40
ratio) and EOFAD.
Parkinsonʹs
Disease SNCA Gain
Dose dependent inrease in
misfolded α‐synuclein in Lewy
bodies and neuronal loss.
Tuberous
sclerosis TSC1 or TSC2 Loss
Loss in tumor growth
suppressors causing growth of
non‐malignant tumors
SMA SMN1, SMN2
Loss
and
modifier
effects
CN of SMN2 buffers lack of
SMN1 protein, modifying motor
neuron loss and muscular
atrophy

19
Table 1‐1 Continued
HNPP and
CMT1a
PMP22 Loss and Gain
Demyelination leads to
neuropathy or nerve
palsies
ASD Multiple Loss and Gain
Neurodevelopmental
abnormality due to
changes in glutaminergic
synaptogenesis
Schizophrenia Multiple Complex re‐
arrangements
Mental disorder
characterized by a
disintegration of thought
processes and of
emotional responsiveness
Table 1‐1 Legend: The table above lists a few examples of neurological diseases
attributed to CNVs overlapping dosage sensitive genes. The increase or decrease
in the transcribed protein in a dose dependent manner due to changes in gene
copy number leads to pathogenesis of diseases. In case of autism and
schizophrenia, where the phenotypes in the patients are heterogeneous, rare
complex re‐arrangements in multiple genomic loci are reported to lead to disease
manifestation. A more detailed list can be found in Table 5‐1 (page 84) and in
reviews elsewhere (Kalman & Vitale, 2009; C. Lee & Scherer, 2010).

20
FIGURES
Figure 1‐1: Illustration of CNVs in the genome and examples of ensuing effect
on phenotypic variability. Panel A shows a diploid genome, with one copy of
the focal gene being inherited from each parent in the offspring. Panel B shows
loss in the genomic loci. Both heterozygous and homozygous CN loss result in

21
loss of function and disruption of gene expression, and are associated with
various human disorders (Lupski & Stankiewicz, 2005). Panel C shows gain in
CN in the genomic locus causing increase in gene copy numbers and also
dysregulation of gene expression up to 5 Mb away(Weterman, et al., 2010). CNVs
confer phenotypes through other mechanisms in genomic disorders ((Panel D
and E), including transcriptional and translational level alterations, gene
disruption, gene fusions at the junction, position effects in which the
rearrangement alters the regulation of a nearby gene, and unmasking of recessive
mutations or functional SNPs on the remaining allele.

22
Figure 1‐2: Overview of CNV analysis workflow in EOFAD family samples. In
Aim 1 of the project (Steps 1 to 3), CNVs were identified and confirmed in the
EOFAD subjects using the whole genome DNA array data using PennCNV.
2. Quality Assurance and Identification of CNVs using Golden Helix and PennCNV
4. Confirm CNVs using Fluidigm and/or FISH
Novel Alzheimer’s disease CNVs
Gene Knockdown/Overexpression
effects on AD molecular pathways
5. Short‐list genes for in‐depth analysis
1. Affymetrix Genome‐wide DNA Microarray Data
Segregation analysis of ‘rare’ CNVs not reported in public databases
Re‐sequence candidate genes for
mutations in EOAD pedigrees
Novel Alzheimer’s disease gene(s)
3. Large CNV segments (>100 Kb) from PennCNV
CNVs that segregate in EOAD families
23
PennCNV is a well‐established software tool that implements a hidden Markov
model (HMM) integrating multiple sources of information to infer CNV calls for
individual genotyped samples (using raw probe intensity data). It differs from
segmentation‐based algorithm in that it considers SNP allelic ratio distribution as
well as other ’quality’ factors, in addition to signal intensity alone. PennCNV
analysis revealed CNV segments larger than 100 Kb in all the tested samples.
Previously reported copy number polymorphisms (CNPs) from DGV (that are
present in ‘normal’ individuals) were eliminated from further analyses. In Aim 2
(step 4), to confirm presence of CNV regions that segregate with disease in
affecteds were tested for confirmation using FISH and Fluidigm digital arrays. In
Aim 3 (Step 5), candidate genes associated (affected) by the CNVs were short‐
listed for functional studies to assess their role in AD pathogenesis, further
confirming the pathogenic effects of the CNVs. The exons, 5’ and 3’ untranslated
regions in the candidate genes were also re‐sequenced to identify presence of any
pathogenic mutations, which could compromise the gene functionality similar to
the effect of the CNVs.
Highest priority was given to genes that show disease segregation with multiple
families and/or genes that map to the linkage regions and/or loci that harbor
functional candidate genes. CNVs/genes present in pedigrees that did not carry
APOE‐ε4 allele were given the highest priority.

24
CHAPTER 2: A CURRENT VIEW OF ALZHEIMER’S DISEASE
2.1 Abstract
Several genes that influence susceptibility to Alzheimer’s disease (AD)
have been known for over two decades. Recent advances have elucidated novel
candidate genes and the pathogenetic mechanisms underlying
neurodegeneration in AD. Here, we summarize what we have learned from
studies of the known AD genes with regard to the causes of AD and emerging
therapies. We also review key recent discoveries that have enhanced our
understanding of the etiology and pathogenesis of this devastating disease,
based on new investigations into the genes and molecular mechanisms
underlying AD.
2.2 Introduction
Alzheimer’s disease (AD) is a progressive neurodegenerative disorder and
the leading cause of dementia in the elderly. As the incidence and prevalence of
AD rise steadily with increasing longevity, AD threatens to become a
catastrophic burden on health care, particularly in developed countries (General‐
Information, 2009). AD patients typically present with symptoms of global
cognitive decline and loss of memory. Pathologically, the disease is characterized
by excessive deposition of amyloid protein fragments (senile plaques),
neurofibrillary tangles, synapse and neuronal loss, and inflammation in the

25
brain. Among the major risk factors for AD, the strongest is increasing age
followed by family history (Bertram, et al., 2007), gender (females at greater risk
than males), and stroke/head trauma.
2.3 Genetics of AD
To date, more than 200 rare and fully penetrant autosomal‐dominant
mutations in three genes, the amyloid precursor protein (APP) and presenilin
genes (PSEN1 and PSEN2), have been shown to cause the early‐onset (<60 years)
familial form of AD (EO‐FAD), which accounts for <10% of AD cases (Cruts,
2009). On the other hand, a common variant, ε4, in the gene encoding
apolipoprotein E (APOE) is the only confirmed genetic risk factor for the late‐
onset form of AD (LOAD) (>90% of AD cases). Overall, these four genes together
account for less than 50% of the genetic variance in AD, and the quest to identify
the remaining genes has been challenging due to the complex and heterogeneous
nature of the disease (Tanzi & Bertram, 2005). Several genes besides APOE have
yielded significant evidence (based on meta‐analyses) for association with
LOAD, but with only modest effects (Bertram, et al., 2007).
2.4 Molecular pathology of AD
Arguably, the genetic discoveries mentioned above have driven our
current understanding of the underlying molecular basis of AD more than any
other findings. The proteolytic processing of APP and production of the major
26
component of β‐amyloid, Aβ peptide, by two proteases known as β‐ and γ‐
secretase are key events in the pathogenesis of disease. The Aβ peptide has two
major forms, Aβ40, which makes up approximately 90% of Aβ in the brain, and
Aβ42, which comprises approximately 10%. In addition, the hyper‐
phosphorylation and aggregation of the microtubule‐associated tau protein drive
neurofibrillary tangle formation within neurons. Most of the mutations in the
EO‐FAD genes increase the ratio of Aβ42/Aβ40. The longer form of the peptide,
Aβ42, is considered to be the more neurotoxic species as it enhances the
aggregation of Aβ into neurotoxic oligomers and senile plaques. Recent studies
indicate that Aβ42 oligomers and neurofibrillary tangles lead to the disruption of
synaptic neurotransmission, neuronal cell death, and inflammation in the
hippocampus and cerebral cortex, thereby causing loss of memory and global
cognition dysfunction.
2.5 Therapeutics in AD
Currently available drugs for AD, such as cholinesterase inhibitors (for
example, Aricept®) and the glutamate antagonist Namenda®, treat mainly the
symptoms, with no known effects on disease progress. Another drug, dimebolin,
which is currently in clinical trials, is a retired antihistamine that is purported to
be neuroprotective based on stabilizing mitochondria. Given that all four of the
established AD genes lead to enhanced accumulation of Aβ42 in the brain (EO‐

27
FAD genes via increased production of the peptide, while APOE via decreased
clearance), most of the current AD therapies in development are aimed at either
curbing Aβ42 production/aggregation or potentiating its degradation/clearance.
This is being attempted with inhibitors and modulators of the β‐ and γ‐secretases,
compounds that attenuate Aβ aggregation (for example, by preventing
interaction of the peptide with copper and zinc), and anti‐Aβ immunotherapy
aimed at stimulating the degradation of the peptide (Selkoe, 2007).
2.6 Major recent advances
2.6.1 Genetics
Given the strong genetic predisposition of AD, there have been a huge
number of studies testing for genetic association with AD, including over 1,500
polymorphisms in over 500 candidate genes. As with most complex genetic
disorders, the AD genetics field is rife with replications and refutations for
hundreds of candidate genes. Recently, an online database known as ‘AlzGene’
has revolutionized our ability to follow and interpret these findings.
AlzGene (www.alzgene.org) (Bertram, et al., 2007) is a publicly available
database that provides up‐to‐date results of all genetic association reports since
1978. More importantly, it provides systematic meta‐analyses for all
polymorphisms (>200) tested in at least four independent study samples. After
APOE, the gene with the strongest genetic effect reported on AlzGene was
CHRNB2, which encodes the beta‐2 subunit of the nicotinic cholinergic receptor.

28
This is particularly interesting given that several drugs currently in clinical trials
for AD target the nicotinic receptor. The advent of high‐throughput genotyping
arrays has also enabled ‘unbiased’ genome‐wide screening to identify novel AD
genes.
To date, six novel LOAD genes have been reported with genome‐wide
significance (Beecham et al., 2009; Bertram, Lange, et al., 2008; Carrasquillo et al.,
2009; Feulner et al., 2009). One of these, ATXN1 (ataxin 1), is the gene responsible
for another neurodegenerative disorder, spinal cerebellar ataxia 1, and another is
CD33, a lectin involved in the innate immune system (Bertram, Lange, et al.,
2008).
2.6.2 Beta‐amyloid toxicity
It is widely accepted that excessive β‐amyloid deposition in the brain is a
key factor in the pathophysiology of AD(Tanzi & Bertram, 2005). Valuable clues
concerning the mechanism by which Aβ aggregates lead to cognitive dysfunction
have emerged over the last several years. The original amyloid cascade
hypothesis maintained that all AD neuropathology, including neuronal cell loss,
generation of neurofibrillary tangles, and inflammation, occur downstream of
senile plaque formation. However, the amyloid cascade hypothesis fails to
explain the weak correlation between amyloid deposition and the clinical degree
of dementia in AD (Bush & Tanzi, 2008). Moreover, the decline in cognition
29
correlates best with synaptic loss and not plaque counts, implying that synaptic
perturbations cause AD and precede amyloid plaque deposition(Jacobsen et al.,
2006; Selkoe, 2008).
A spate of recent studies has initiated a paradigm shift regarding the
molecular mechanism by which Aβ deposition leads to cognitive dysfunction.
Over the past several years, it has become increasingly apparent that Aβ
oligomers (for example, dimers) exert detrimental effects on synaptic function.
More specifically, soluble Aβ oligomers have been shown to specifically impair
long‐term potentiation (LTP) and promote synaptotoxicity. This has led to the
synaptic Aβ hypothesis (Tanzi, 2005), which maintains that free and soluble Aβ
oligomers, either produced within the synapse or entering from outside, impair
LTP (Figure 2‐1). Furthermore, several reports indicate that Aβ oligomers trigger
the internalization of post‐synaptic AMPA (α‐amino‐3‐hydroxy‐5‐methyl‐4‐
isoxazolepropionic acid receptor)‐ and NMDA (N‐methyl‐D‐aspartic acid)‐type
glutamate receptors (Hsieh et al., 2006; Yamin, 2009), leading to loss of spines
and inhibition of LTP (Figure 2‐2) (Lacor et al., 2007; Shankar et al., 2008; Tanzi,
2005; Venkitaramani et al., 2007; Walsh et al., 2002). More recently, high‐affinity
binding between Aβ and the cellular prion protein PrPc has been reported,
suggesting that PrPc could be an important mediator in Aβ oligomer‐induced
synaptic dysfunction (Lauren, Gimbel, Nygaard, Gilbert, & Strittmatter, 2009).

30
Understanding the interaction between Aβ and other cellular factors could
provide new therapeutic potential in restoring the synaptic plasticity and
possibly reversing AD symptoms.
2.7 Future directions
Recent advances have enabled the identification of novel AD genes as well
as new insights into the causes of memory and cognitive dysfunction in AD.
Genome‐wide association studies are gradually elucidating the genetic basis of
AD, similar to the case for schizophrenia and autism (Stefansson et al., 2008;
Weiss, et al., 2008), by revealing gene defects and affected biological pathways.
Meanwhile, advances in understanding how Aβ impairs cognition at the synaptic
level could provide new therapeutic modalities for treating and preventing AD
based on restoring synaptic plasticity.

31
FIGURES

32
Unknown Aβ42/Receptor
Interaction
Synaptic Vesicles
Synaptic Cleft
APP
Aβ42
NMDA Receptor
AMPA Receptor
Axonal Terminal
Neurotransmitters
Receptor Endocytosis
Aβ42 Oligomers

Figure 2‐1: Aβ‐induced internalization of synaptic NMDA and AMPA
receptors. Soluble Aβ oligomers promote receptor endocytosis, reducing the
density of the receptors at the synapses. Aβ is secreted into the synaptic cleft via
sequential cleavage of presynaptic amyloid precursor protein (APP) (internally
or at the cell surface) by β‐secretase and γ‐secretase or gains entry from outside
the synapse. The accumulation of Aβ oligomers in the synaptic cleft leads to
reduced NMDA and AMPA receptor density in synapses, leading to attenuated
long‐term potentiation (LTP) and neurotransmission. While Aβ oligomers may
play a normal role in controlling LTP, accelerated synaptic accumulation of Aβ
oligomers (for example, due to familial Alzheimer’s disease [AD] gene
mutations) may lead to a toxic gain of function and cognitive decline.

34
Figure 2‐2: Synaptic Aβ hypothesis. Increased accumulation of synaptic Aβ
oligomers promotes endocytosis of NMDA and AMPA receptors, leading to a
reduction in dendritic spines and reduced LTP. Acceleration of this process could
lead to a toxic gain of function in the form of an imbalance in the LTP/long‐term
depression (LTD) ratio. This, in turn, causes synaptic dysfunction, spine loss, and
(potentially) synaptic loss, leading to cognitive decline and AD. Aβ42, amyloid‐β‐
protein 42‐mer; AMPA, α‐amino‐3‐hydroxy‐5‐methyl‐4‐isoxazolepropionic acid
receptor; NMDA, N‐methyl‐D‐aspartic acid.
↑Synaptic Aβ Oligomers
Endocytosis of NMDA & AMPA
receptors leading to ↓LTP and ↑LTD
Synaptic Dysfunction/Loss
Alzheimer’s Disease
↑Brain Aβ accumulation
Dendritic Pruning/Tangles
35
CHAPTER 3: THE ROLE OF COMMON AND RARE APP DNA SEQUENCE
VARIANTS IN ALZHEIMER’S DISEASE
3.1 Abstract
3.1.1 Objectives: Over 30 different rare mutations, including copy number
variants (CNVs), in the gene encoding amyloid precursor protein (APP) cause
early‐onset familial Alzheimer’s disease (EOFAD), while the contribution of
common APP variants to disease remains controversial. In this study we
systematically assessed of the role of both rare and common APP variants in
several collections of well‐characterized Alzheimer’s disease (AD) families.
3.1.2 Methods: Starting with EOFAD families genetically linked to the APP‐
region on chromosome 21q21 we screened for missense mutations and locus
duplications in APP. Next, using genome‐wide DNA array data we examined
APP locus for CNVs in a total of 797 additional early and late onset AD
pedigrees. Finally, 62 SNPs in APP locus, including two promoter
polymorphisms previously reported to modulate AD risk were tested for
association in 1373 independent multiplex AD families.
3.1.3 Results: Analyses of eight 21q21 linked families revealed one family
carrying a non‐synonymous mutation in exon 17 (Val717Leu) and another family
with a partially penetrant 3.5 Mb locus duplication encompassing APP. Analysis
for CNVs in APP locus revealed an additional family carrying a fully penetrant
36
380 Kb duplication, merely spanning APP. Lastly, in contrary to previous
reports, analyses of SNPs in APP failed to show significant effects on AD risk or
onset age.
3.1.4 Conclusion: Our study shows that APP mutations and locus duplications
are a very rare cause of EOFAD, whereas common variants in APP probably
make no large contribution to AD risk or onset age variation. Furthermore, our
results indicate that APP duplications may not be fully penetrant, possibly
indicating the existence of protective factors that can sufficiently offset the
consequences of possessing an additional copy of APP.

37
3.2 Introduction
Highly penetrant mutations in the gene encoding APP (APP, 21q21.2),
were the first reported genetic causes of EOFAD (Goate et al., 1991). Most of the
currently known AD‐causing APP mutations lead to an increase in the ratio of
the Aβ42 to Aβ40 peptide (Tanzi & Bertram, 2005; Wolfe, 2007) and synaptic Aβ
levels (Hooli & Tanzi, 2009). AD pathology together with cerebral amyloid
angiopathy (CAA) is also found in patients with Downʹs syndrome (DS), i.e.,
trisomy of chromosome 21, indicating that extra copies of APP alone may lead to
neurotoxic A� production in the absence of any missense mutations. Along these
lines, several reports have recently shown the presence of APP locus duplications
as a causative factor in EOFAD (Kasuga et al., 2009; McNaughton, et al., 2010;
Rovelet‐Lecrux et al., 2007; Rovelet‐Lecrux, et al., 2006; Sleegers et al., 2006).
Similar to DS the majority of duplication carriers also show pronounced CAA
upon neuropathological examination. Finally, recent candidate‐gene studies have
also implicated the existence of rare (minor allele frequency [MAF] <=0.0093%
(7/750)) variants in the APP promoter to result in EOFAD, presumably by
increasing APP expression (Brouwers et al., 2006; Theuns et al., 2006), although
these findings have been refuted elsewhere (Athan, Lee, Arriaga, Mayeux, &
Tycko, 2002; Bettens et al., 2009; Guyant‐Marechal et al., 2007; Hebert et al., 2009;
Kocerha, Kauppinen, & Wahlestedt, 2009; Maes, Chertkow, Wang, & Schipper,

38
2009; W. X. Wang et al., 2008). In contrast, the contribution of common APP
variants to AD risk – similar to most other proposed AD susceptibility genes –
remains controversial (see the AlzGene database maintained by our group for an
up‐to‐date overview; URL: http://www.alzgene.org (Bertram, et al., 2007)).
In this study, we set out to thoroughly investigate the role of both rare and
common APP DNA sequence variants in several large collections of both EOFAD
as well as late onset AD (LOAD) families. Using microsatellite marker data
generated in the context of a genome‐wide linkage study in families of the
National Institute of Mental Health (NIMH) AD Genetics Initiative study sample
(Blacker, et al., 2003), we began by sequencing exons 16 and 17 in eight EOFAD
families (Table 3‐2), which individually showed evidence for genetic linkage to
the chromosomal region encompassing APP. We then tested these linkage
families for presence of APP locus duplications using Semi‐Quantitative
Multiplex PCR (sQM‐PCR). Owing to the availability of the recently generated
genome‐wide DNA microarray data, we investigated the remaining families in
NIMH sampleset, in addition to 368 pedigrees from an independent collection of
AD families (National Cell Repository for AD, NCRAD) for APP locus
duplications. Finally, we tested all SNPs within a 400 kb window encompassing
APP for association with AD risk or onset‐age variation (Bertram, Lange, et al.,
2008). Additionally, we tested two APP promoter SNPs previously reported to be

39
associated with AD risk in candidate gene studies which were not included on
the Affymetrix array (rs463946 [‐3102G/C] and rs459543 [+37C/G] (Athan, et al.,
2002; Guyant‐Marechal, et al., 2007)) in families from the NIMH and NCRAD
data sets as well as two other independent collections totaling nearly 4,200
subjects from 1373 families.
3.3 Results
The eight EOFAD (Table 3‐2) families showing linkage at or near the APP
region were re‐sequenced for mutations in APP exons 16, 17, the promoter region
(‐1 to ‐676 kb), and the 3’ untranslated region (UTR; 1 to 1,221 bp). In addition,
these families were also tested for APP locus duplications using sQM‐PCR, and
subsequently confirmed by fluorescence in situ hybridization (FISH, Figure 3‐3).
One family (VII) carried a previously reported and fully penetrant missense
mutation in exon 17 (Figure 3‐1, Val717Leu, rs63750264 G>C, “Indiana‐2”
(Murrell, Hake, Quaid, Farlow, & Ghetti, 2000)). The onset age of AD in this
family was between the ages of 45 and 58, while the 3 unaffected individuals
were between 62 and 79 years of age at last examination. The clinical diagnosis of
AD was confirmed neuropathologically in two affected individuals of this
pedigree (VII‐II.3, VII‐II.1), while the other two received a diagnosis of
ʺprobableʺ (VII‐II.2 and VII‐II.4) AD. A second chromosome 21 linked family (VI,

40
Figure 3‐1 Family VI, and Figure 3‐2) was found to carry APP locus duplication
which, in contrast to previous reports, only showed partial penetrance. Using
genome‐wide microarray data we were able to delineate the size of the
duplicated segment to ~3.4 Mb (Figure 3‐2). In this family, the duplication was
present in all three affected individuals (onset ages: 43‐50 years; all AD diagnoses
confirmed by neuropathological examination), but also in one unaffected
individual (last age at examination: 60 years; VI‐II.4, while no duplication was
found in the remaining unaffected sibling (78 years; VI‐II.5; Figure 3‐1). Tests for
expression level differences of APP mRNA and protein, as well as Aβ levels, in
Epstein‐Barr Virus‐transformed lymphoblastoid cell lines of all members of this
family did not show significant differences between carriers and non‐carriers of
the APP duplication, regardless of affection status (data not shown). This is in
line with earlier reports indicating that pathologically relevant increases in
APP/A� expression may be restricted to the brain and is not detectable in
peripheral cells (Theuns, et al., 2006). Unfortunately, brain samples were not
available for any member of this family.
Analysis for CNVs in APP in the microarray data from the remaining 429
NIMH families and 368 NCRAD families, revealed one family in the NCRAD
dataset (Figure 3‐1, BRB) carrying APP locus duplication, subsequently
confirmed using Fluidigm digital array (Table 3‐3). Although fully penetrant, this

41
latter duplication is interesting for two reasons. First, the duplicated segment
extends over just ~0.4 Mb, i.e. approx. 10‐fold smaller than the duplicated
segment identified in the NIMH family. Barely encompassing the entire genomic
interval of APP, this segment represents the shortest APP duplication identified
to date (see Figure 3‐2). Second, the duplication was carried by only two of three
affected siblings in this family (onset ages: 49 and 52 years), while a third affected
individual (onset age: 70) showed a diploid, i.e. normal, copy status in this
region. Similarly, the two unaffected siblings (ages at last examination: 69 and 74)
also showed no evidence for a duplication of the APP region. Thus, this family
coalesces the sort of genetic heterogeneity that is typical of AD (and several other
neurodegenerative disorders), i.e. the presence of likely disease‐causing and
susceptibility‐increasing factors.
Finally, association analyses of 62 common SNPs located within a 400 kb
interval encompassing APP was undertaken using microarray SNP genotype
data using both a binary (affection status) as well as quantitative (onset age)
phenotype definition (Bertram, Lange, et al., 2008). However, none of these
analyses displayed even a statistical trend towards association with either
phenotype (Data not shown). In addition, we also failed to observe significant
effects on disease risk or onset age with two (Athan, et al., 2002; Guyant‐
Marechal, et al., 2007) SNPs in the APP promoter region (rs459543 [+37c/g],
42
rs463946 [‐3102G/C]) previously reported to be associated with AD risk. Since
these SNPs were not included on the Affymetrix microarray they were manually
genotyped in nearly 4,200 individuals originating from four independent family
data sets with which we had >70% power to detect the previously reported effect
sizes (Table 3‐1). These altogether negative association findings using common
polymorphisms are in line with recent genome‐wide association studies (GWAS)
reporting no evidence of association with markers near the APP region (see the
AlzGene database for a list of all GWAS performed in AD).
3.4 Discussion
We undertook a systematic assessment of the contribution of rare and
common APP DNA sequence variants across large collections of independent
AD family samples. Mutational screening of EOFAD families linked to the APP‐
encompassing region on chromosome 21 revealed one family carrying a
previously reported missense mutation at codon 717 (Val717Leu; ʺIndiana‐2ʺ),
and one family carrying a duplication of the APP locus. While the missense
mutation showed complete penetrance in the affected family, the occurrence of
one unaffected individual in the family VI carrying the APP duplication at > 3
S.D. from the average familial onset age is strongly indicative of incomplete
penetrance, implying existence of yet unidentified ʺprotectiveʺ factors. While it

43
can currently not be definitively excluded that this individual will not also
develop AD at some later time, our findings already suggest that other genetic
and/or non‐genetic factors can mitigate the effects of APP locus duplications and
either confer complete protection against AD, or at least substantially delay its
onset age. In the currently available literature there is one other report in which
an unaffected individual was also found to carry an APP duplication (individual
III.21 in family 1104 reported in Sleegers et al (Sleegers, et al., 2006). However,
the last age of examination of this individual is still within 1 standard deviation
of the average familial onset age, while the difference is greater than 3 standard
deviations in the unaffected sibling in family VI. The second, independent APP
duplication observed in our study (family BRB in the NCRAD data set)
represents the smallest reported duplicated interval on chromosome 21,
effectively reducing the obligate AD‐causing region to less than 0.4 Mb
(chr21:26,122,781‐26,521,135, NCBI36/hg18 assembly). To the best of our
knowledge, it is also the first example of an APP duplication co‐occuring with
another cause of AD within the same pedigree. Aggregating the CNV data across
different studies published to date (see Figure 3‐2) suggests that most (if not all)
instances of locus duplications in this chromosomal interval are not linked to the
same founder individuals, but rather have occurred independently from one
44
another. Overall, these results suggest that APP duplications are a rare cause of
EOFAD, and extremely rare (if not absent) in LOAD.
Contrary to these findings confirming and extending prior evidence, we
were unable to corroborate the presence of sequence variants in the APP
promoter, neither as causative nor as risk factors for AD. This includes variants
534G→A, 479C→T, 369C→G and 118C→A, which have previously been
suggested to cause AD by increasing expression levels of APP (Theuns, et al.,
2006). None of the NIMH chromosome 21‐linked families carried any mutations
in the APP promoter region, including the variants described above. Our failure
to detect mutations at these sites are in agreement with data reported by Guyant
et al. – who actually found a higher frequency of the presumed disease‐causing
alleles in their healthy controls as compared to AD cases. Taken together, these
data suggest that the previously proposed causative role on AD
neuropathogenesis of these promoter sequence variants is unlikely to be real.
Finally, genetic association analyses of more than 60 common variants,
including two common APP promoter polymorphisms previously reported to
show association with LOAD, did not reveal any significant evidence for
association with either risk for AD or onset‐age variation. Our negative
association results are in line with, and substantially extend, a recent study
45
investigating 44 SNPs in almost 1,200 cases and controls from the US (Nowotny
et al., 2007), although that study did not directly test the two previously
associated promoter SNPs (rs459543 and rs463946) that were investigated here.
In addition, none of the currently published GWAS in AD (see www.alzgene.org
for details), reported significant association between risk for AD and common
sequence variants in or near APP, providing further evidence against the notion
that common variants in this gene contribute to risk for LOAD. While this is
similar to the largely negative association findings with common variants in the
other two EOFAD genes, PSEN1 and PSEN2 (presenilin 1 and 2), it is in contrast
to other neurodegenerative disorders for which genes known to contain rare,
disease‐causing variants giving rise to disease forms transmitted in a Mendelian
fashion are also among the lead GWAS findings using common polymorphisms,
e.g. Parkinson’s disease or frontotemporal dementia (Bertram, 2011).
In conclusion, our comprehensive and systematic analyses investigating
the role of APP in AD genetics suggest that missense mutations in APP and locus
duplications are a rare cause of AD, while common variants in APP probably
play no major role, if any, in contributing to risk for AD. In addition, the
incomplete penetrance of APP locus duplication observed in family VI
emphasizes the need to more systematically search for “protective” variables. A
better understanding of these risk‐reducing factors may be essential for

46
developing better and more effective early prevention and treatment strategies
against this devastating disorder.

47
3.5 Materials and Methods
3.5.1 Participants
3.5.1.1 NIMH families: In total, this sample includes 1536 individuals from 457
multiplex AD families (Blacker et al., 1997). Of these, 131 pedigrees (517 subjects
[316 affecteds, onset age 64.5+9.5]) are from families with an “early/mixed” onset
age, i.e., at least one sampled affected showed an onset age <65), while in the
remaining pedigrees all sampled affecteds showed an onset age of 65 or above.
Age of onset for all AD cases was determined by a clinician based on an
interview with a knowledgeable informant and review of any available records.
From our earlier whole‐genome linkage screen on these families (Blacker, et al.,
2003), we identified 8 families in the early/mixed onset‐age stratum that showed
evidence of genetic linkage to the region encompassing APP at ~26 Mb (i.e.,
between markers D21S1437 at ~20 Mb and D21S1440 at ~38 Mb; Table 3‐2).
3.5.1.2 NCRAD and additional independent family samples: In addition to the
NIMH families, we analyzed members of three independent AD family
collections. Two of these were obtained from the National Cell Repository for
Alzheimerʹs Disease (NCRAD), and ascertainment and collection details can be
found at the NCRAD website (http://www.ncrad.org). The collection of families
labeled here as “NIA” comprised 1,111 samples from 351 pedigrees (Caucasian:

48
1,040 samples from 329 pedigrees). The collection of families labeled here as
“NCRAD” comprised 1260 samples from 368 pedigrees (Caucasian: 1,106
samples from 330 pedigrees). Finally, the collection of families labeled “CAG”
originated from multiple NIA‐funded Alzheimer’s Disease Research Centers
(ADRCs) under the auspices of the “Consortium on Alzheimer’s Geneticsʺ.
Probands were included only if they had at least one unaffected living sibling
willing to participate in this study. For all non‐NIMH families we only included
pedigrees in which all sampled affected individuals had onset ages of at least 50
years.
Note that different combinations of these family samples were used in different
parts of our study. APP sequencing was performed in chromosome 21 linked
NIMH families only. APP CNV and common marker association analyses were
performed on all remaining NIMH and all the NCRAD families. Lastly, members
from all four family samples (i.e. 4,180 individuals) were genotyped for the two
previously associated APP promoter SNPs (rs459543 [+37c/g], rs463946 [‐
3102G/C]).
3.5.2 Experimental procedures
3.5.2.1 Sequencing: 30 ng of genomic DNA was amplified with primers targeting
APP exons 16 and 17, and ~600 bp of the promoter region (covering 534G→A,

49
479C→T, 369C→G and 118C→A; all primer sequences available on request) and
run on MegaBACE 1000 capillary electrophoresis system. Base calling was
performed using Mutation Explorer (Softgenetics LLC, State College, PA).
3.5.2.2 Semi‐Quantitative Multiplex PCR (sQM‐PCR): Three FAM labeled primer
sets for the target APP gene and one for the control gene PCBD2 (Chr. 5q31.1)
were designed using Primer3 and a 16 bp rare nucleotide sequence was added 5’
to increase primer specificity. All probe optimization and experimental assay
was performed as described previously (Rovelet‐Lecrux, et al., 2006).
3.5.2.3 Fluorescent in situ hybridization (FISH): Bacterial artificial chromosome
(BAC) clones containing both ends of APP gene ( RP11‐15D13 for the 5’‐end and
RP11‐410J1 for the 3’‐end) and CTB‐63H24 mapping to 21q22.3 (control probe)
were used for FISH. RP11‐15D13 and RP11‐410J1 were labeled with Cy3‐dUTP
and CTB‐63H24 was labeled with FITC‐dUTP by nick translation. FISH was
performed following the protocol described in Mohapatra et al. 1997 (Mohapatra,
et al., 1997).
3.5.2.4 SNP‐Genotyping: GWAS SNPs were generated in a separate project on the
Affymetrixʹ Genome‐Wide Human SNP Array 6.0, using individually optimized
genotyping and allele‐calling procedures. SNPs selected for this project were
located within 25kb of the start‐/stop‐codon of APP, showed no deviation from

50
Hardy‐Weinberg Equilibrium in unaffected individuals, and had minor allele
frequencies of at least 5%. Overall, this yielded 62 SNPs spanning a chromosomal
interval of ~400kb that could be used in the statistical analyses. The two
promoter SNPs (rs459543 [+37c/g], rs463946 [‐3102G/C]) were not included on the
Affymetrix array, and were assayed via high efficiency fluorescence polarization‐
detected single base extension (HEFP‐SBE) on a Criterion Analyst AD high‐
throughput fluorescence detection system (Molecular Devices), using customized
PCR primers and cycling conditions (see ref. (Bertram et al., 2005) for details).
Genotyping efficiency on the two SNPs tested here was >95%, while the error
rate was <1% (based on ~10% duplicated samples).
3.5.2.5 CNV Analysis: This was done for individuals from the NIMH and
NCRAD datasets for whom we used the Affymetrixʹ Genome‐Wide Human SNP
Array 6.0 as part of an ongoing GWAS. Raw probe intensities from each sample
were normalized against HapMap CEU reference intensity data set. For the
purpose of CNV analysis, we excluded samples showing chromosomal
abnormalities and high CNV count. All included samples were subject to
waviness factor adjustment (Diskin et al., 2008; K. Wang, et al., 2007). CNV
calling and segmentation were performed using PennCNV
(http://www.openbioinformatics.org/penncnv/ (K. Wang, et al., 2007)) using
default criteria.

51
3.5.2.6 Fluidigm Digital Array protocol: We used this method as validation
experiment for the APP duplication observed in the NCRAD family. In brief, 16
ng of DNA from all subjects was mixed with 1X TaqMan gene expression master
mix (Applied Biosystems, Foster City, CA), 1X FAM‐labeled APP copy‐number
probe (Hs05532959_cn, Applied Biosystems, Foster City, CA), 1X VIC‐labeled
RNAseP TaqMan assay and 1X sample loading reagent (Fluidigm Inc., South San
Francisco, CA). DNA samples from individuals of NIMH family VI carrying an
APP duplication were used as positive controls, and all samples were run on a
48.776 array. The experimental protocol and data analysis procedures are
described in detail elsewhere (Qin, et al., 2008; Weaver, et al., 2010).
3.5.2.7 Statistical Analyses: To test for association between SNPs and disease risk
and onset‐age we used PBAT (v3.6) with an additive transmission model. All
analyses were first restricted to families of self‐reported “Caucasian” ancestry,
and then repeated using families of all ancestries (with no change in results; data
not shown). To combine statistical evidence across the association analyses from
each independent dataset, we used Fisher’s combined probability test. Since the
hypothesis of this study was to test for direction of effect as observed in the
original reports (Athan, et al., 2002; Guyant‐Marechal, et al., 2007), all P‐values
used in this calculation are 1‐tailed. P‐values were inversed (1‐P) for samples
where over‐transmission to affecteds was observed with the opposite allele as
52
compared to the original finding. Power calculations (performed in PBAT)
suggested that we had good (i.e. 70% and above) power in the combined sample
to detect the genetic effect sizes estimated in the original study (i.e. and OR of
~1.5 for rs459543 [+37c/g], and an OR of 0.5 for rs463946 [‐3102G/C]) at p<0.05
and a disease prevalence of 10%. To correct for multiple comparisons we used a
Bonferroni correction for 27 tests, which is the number of independent proxies
(or ʺtag SNPsʺ) within the investigated 400 kb interval when applying an r2
threshold of 0.5.

53
TABLES

54
Table 3‐1: Genetic association results of two APP promoter polymorphisms previously reported to be associated with
AD risk.
All Analyses are restricted to Caucasian‐only families. ʺFamsʺ = number of informative families. All P‐values are one‐
sided, as described in the methods. Combined analyses based on Fisherʹs combined probability test of the results in each
of the four individual samples.

55
Table 3‐2: Summary of demographic and clinical characteristics of families linked to APP region on chromosome 21q.
Family P‐value† cM # Affecteds
(onset ages)
# Unaffecteds
(ages)
AD diagnosis‡ APP mutation
I 0.06 22 3 (60‐66 years) 3 (66‐80 years) Definite none
II 0.13 22 3 (52‐67 years) 4 (66‐86 years) Definite none
III 0.06 37 3 (60‐73 years) 1 (67 years) Probable none
IV 0.03 22 4 (63‐78 years) none Definite none
V 0.015 34 4 (64‐71 years) 3 (64‐81 years) Definite none
VI 0.06 20 3 (43‐50 years) 2 (60‐78 years) Definite duplication
VII 0.015 22 4 (45‐58 years) 3 (62‐79 years) Definite Val717Leu
VIII 0.06 22 3 (56‐71 years) none Probable none
†Derived from multipoint analyses of data in ref.(Blacker, et al., 2003).
‡Best degree of diagnostic certainty in affecteds per family.

56
Table 3‐3: Results of relative quantitation of APP copy number from Fluidigm Digital Array 48.776 data (Reference or
house‐keeping gene: RNAseP).
Family ID Subject ID Affection APOE‐ε4 APP vs. RNAseP
Quantitative ratio
APP Copy
Number
BRB ND01 EOAD Heterozygous 1.558 3
BRB ND02 Unaffected Negative 1.023 2
BRB ND03 EOAD Negative 1.558 3
BRB ND04 LOAD Heterozygous 1.055 2
BRB ND05 Unaffected Negative 0.915 2

FIGURES

58
Figure 3‐1: Pedigree charts of families found to carry disease‐causing APP
mutations and locus duplications.
Information for each individual is (from top to bottom): age at onset (in affected
individuals), or age at last examination (unaffected individuals); APOE genotype;
APP mutation finding (ʺdupʺ = carriers of APP duplication; ʺmutʺ = carriers of
Val717Leu mutation). Probands are indicated by arrows. No DNA or clinical
information was available from the founders (“?”)

Figure 3‐2: Delineation of APP duplicated region identified here vs. those of previous studies

60
Delineation of APP duplicated region identified here vs. those of previous
studies: Approximate locations of the duplicated intervals across studies. Solid
arrows indicate minimal size of the duplicated interval; dotted lines indicate
maximal boundaries. Note that our study is the only to use high‐density GWAS
data, allowing a much more precise delineation of the duplicated interval than
the lower‐resolution microsatellite‐based mapping. Physical location of
duplicated segment from Affymetrix Genome‐wide SNP 6.0 array mapped to
hg18 assembly are Family VI ‐ Chr21: 23984747‐27466529 and Family BRB ‐
Chr21: 26125668‐26505191

61
Figure 3‐3: FISH images of lymphoblast cells from all individuals in family VI
carrying a duplication of the APP‐locus.
Interphase FISH analysis of APP duplication. RP11‐15D13 containing the 5’‐end
of the APP gene was labeled in Cy3‐dUTP (red) and CTB‐63H24 containing the
telomere of chromosome 21 was labeled in FITC‐dUTP (green). With the
exception of #118 (VI‐II.5) all subjects show evidence for an APP duplication.
#116 (VI‐II.4) represents the individual carrying three copies of APP but without
clinical evidence for AD at last examination (see Figure. 3‐1).

62
CHAPTER 4: RARE AUTOSOMAL COPY NUMBER VARIATIONS IN
EARLY ONSET ALZHEIMER’S DISEASE
4.1 Abstract
Over 200 rare and highly penetrant pathogenic mutations in APP, PSEN1
and PSEN2 are identified in early‐onset familial form of AD (EOFAD). Of these,
17 EOFAD families carrying duplication in APP locus, breakpoints unique to
every family, remain the only copy number variations (CNVs) known to cause
EOFAD. Using high‐density DNA microarray data we performed a
comprehensive genome‐wide analysis for presence of rare CNVs in 261
early/mixed Alzheimer’s disease pedigrees. In addition to confirming two
families previously known to carry copy number (CN) gain in APP, our analyses
revealed nine rare CNVs unique to the AD families that harbor them. These
novel CNVs encompass genes related to various neuronal pathways, as well as,
pathogenetic factors of other brain disorders, such as: CHMP2B, VLDLR, A2BP1,
ERMP1 and EPHA6. To our knowledge, this is the first study reporting rare
gene‐rich CNVs in EOFAD, which are likely to further our understanding on AD
pathogenesis.
63
4.2 Introduction
Alzheimerʹs disease (AD) is a genetically complex and heterogeneous
disorder. Family history is the second biggest risk factor in AD following age;
AD risk doubles with every decade of age (Hooli & Tanzi, 2009). Highly
penetrant single base‐pair mutations in APP, PSEN1 and PSEN2 are known to
cause EOFAD (Cruts & Brouwers, 1998). While APOE is the only established
major risk factor in late‐onset sporadic form of AD (LOAD), where individuals
carrying ε4 allele are at 4~10 fold higher risk of LOAD affliction (Bertram, Lill, &
Tanzi, 2010). These genetic findings were crucial to understanding the
underlying molecular neuropathology of AD but explain just about 50% of AD
heritability. Currently there are no reports on identification of novel EOAD
genes, while numerous studies have associated and replicated multiple genes
that show modest effects in LOAD (Bertram, 2011) (10‐15%, www.alzgene.org).
The majority of the reported AD genetic studies are based on the effects of
sequence variants (mutations and single nucleotide polymorphisms, SNPs) on
AD susceptibility with few exceptions (Brouwers, et al., 2006; Shaw, et al., 2011).
However, recent studies estimate that structural variations (SVs) in the genome,
including copy number variation (CNVs) (Feuk, et al., 2006) make significant
contributions to genetic and phenotypic variation (Stranger, et al., 2007; Varki,
64
Geschwind, & Eichler, 2008). CNVs vary from a few kilobases (kb) to several
megabases (mb), but in most instances arbitrarily refers to DNA segment >1 kb.
Covering about 12% of the human genome CNVs overlay more nucleotide
content per genome than the SNPs identified to date (Jakobsson et al., 2008;
Redon, Ishikawa, Fitch, Feuk, Perry, Andrews, Fiegler, Shapero, Carson, Chen,
Cho, Dallaire, Freeman, Gonzalez, Gratacos, Huang, Kalaitzopoulos, Komura,
MacDonald, Marshall, Mei, Montgomery, Nishimura, Okamura, Shen,
Somerville, Tchinda, Valsesia, Woodwark, Yang, Zhang, Zerjal, Armengol, et al.,
2006). The majority of the CNVs occur adjacent to repeating DNA sequences,
such as, segmental duplications (SDs), low‐copy repeats (LCRs), and
interspersed repeat elements (Alu and LINE). The repeat elements influence
generation of CNVs by two mechanisms (Gu, et al., 2008): nonallelic homologous
recombination (NAHR) and nonhomologous end joining (NHEJ), occurring both
during meiosis or mitosis (Maiti, et al., 2011). Recent studies also report several
CNVs shown to underlie pathogenesis of complex diseases such as autism
(Sebat, et al., 2007), schizophrenia (Bassett, Scherer, & Brzustowicz, 2010; Vacic et
al., 2011), and HIV (Gonzalez et al., 2005; Townson, Barcellos, & Nibbs, 2002).
Considering the modest success of recent genome‐wide association studies
(GWAS) (Manolio, et al., 2009) CNVs could hold immense potential to
explaining missing heritability in human disorders, and in our case AD.

65
On the other hand, CNVs are highly complex; penetrance, frequency and
functional implications are in the early stages of understanding (Girirajan &
Eichler, 2010; C. Lee & Scherer, 2010). The influence of larger, rare and gene‐rich
CNVs on phenotype is thought to be clinically significant (C. Lee & Scherer,
2010), but the lack of in‐depth understanding of CNVs complicates performing
association studies (Ionita‐Laza, Rogers, Lange, Raby, & Lee, 2009). Moreover,
identification of large rare CNVs influence on diseases have proven to be more
successful than association studies of copy number polymorphisms (CNPs,
(Chartier‐Harlin et al., 2004; Pagnamenta et al., 2011; Rovelet‐Lecrux, et al., 2006).
Based on the above facts, we set out to investigate rare CNVs not reported in
DGV, that are large (limiting to CNVs >100 kb) and segregating with disease in
our EOFAD pedigrees – emphasizing APP duplication (Hooli et al) as a model.

66
4.3 Results
DNA microarray data from 131 NIMH early/mixed pedigrees and 132
NCRAD families were analyzed for CNVs using PennCNV (2010May01 version)
and Golden Helix SVS 7.4, applying the default calling criteria (Diskin, et al.,
2008; GoldenHelix, 2011b; K. Wang, et al., 2007). The total number of CNVs, copy
number (CN) gain, CN loss and CNV burden did not show any significant
differences between affecteds vs. unaffecteds, in both NIMH and NCRAD data‐
sets (Table 4‐1). CNV segments that showed <= 70% overlap with CNPs reported
on Database of Genomic Variants (hg18, build 36) were excluded from further
analysis in order to enrich for rare CNVs. The 70% cutoff range to differentiate
CNPs was chosen arbitrarily based on DGV (DGV, 2011; Iafrate, et al., 2004; J.
Zhang, et al., 2006) and twin studies (Maiti, et al., 2011). Preliminary CNV
analysis confirmed two EOAD families carrying APP locus duplication (Hooli et
al, 2011). These APP locus duplication families were subsequently used as
positive controls in Fluidigm and FISH CNV confirmational assays. Further
analyses revealed twelve CNVs in NIMH dataset and seven CNVs in NCRAD
dataset that showed segregation with AD (Table4‐2). Finally, in addition to
comparing with CNPs in DGV, the 19 CNVs identified were checked for
presence in the CNV data from the entire collection of NIMH and NCRAD
subjects (total of 2796 samples from 825 families). None of these CNVs were
67
detected in such large collections of AD families, indicating that these CNVs are
rare, no‐recurrent and unique to the pedigrees harboring them.
Twelve unique CNVs identified in NIMH pedigrees (four deletion CNVs
and eight duplications) were confirmed using FISH and Fluidigm (Table 4‐3 and
Table 4‐5); three out of four deletions were confirmed using these techniques,
while all eight duplications were false positive calls. In NCRAD samples (Table
4‐4), seven unique CNVs (three loss CNVs and four gains) were shortlisted for
follow‐up confirmation on Fluidigm. All but one deletion CNV were confirmed
to be true. Affymetrix 6.0 call‐rate and quality depends largely on hybridization
specificity and signal intensity (Hao, Schadt, & Storey, 2008; McCarroll et al.,
2008), and NIMH samples showed higher false‐positive calls since the samples
were processed in two different labs using different batches of chips. In total, five
of the nine CNVs identified were heterozygous deletions. In these families, the
average familial onset age was 60.5 years and average CNV size was 224 Kb.
These CNVs encompassed the genes CHMP2B, POU1F1, KANK1, DMRT1,
DMRT3, FLJ35024, VLDLR and A2BP1. The four gain CNVs showed average
familial onset age of 58.75 years and average CNV size of 501Kb, and associated
with the genes: CDH2, ERMP1, EVC, EVC2, CRMP1 and EPHA6. In six out of
nine cases, the CNVs and APOE‐ε4 alleles segregated with AD, suggesting the
possibility of these genes acting as genetic modifiers. (Table 4‐2, Figure 4‐1)

68
4.4 Discussion
APP duplication remains the only established CNV in early‐onset AD.
Our comprehensive and systematic genome‐wide analyses of CNVs in EOAD
family samples yielded multiple rare and unique CNVs segregating with the
disease, spanning close to a dozen genes (Table 4‐2, Figure 4‐1).
Family NH1: Two of the four affected individuals (Onset age: 61 and 72) showed
a 331 KB deletion overlapping genes chromatin modifying protein 2B (CHMP2B)
and POU class 1 homeobox 1 (POU1F1). Both the affected individuals are
homozygous for APOE‐ε4 allele, while the two unaffected siblings were
heterozygous for APOE‐ε4 allele with current age of 75 and 83. CHMP2B has
been previously shown to harbor multiple, rare pathogenic mutations leading to
Frontotemporal dementia (FTD, OMIM: OMIM: 609512) and Amyotrophic lateral
sclerosis (ALS, OMIM: 600795), possibly due to endosomal trafficking disruption
(Urwin et al., 2010). CHMP2B is expressed in all neuronal populations and co‐
localizes with Granulovacuolar degeneration (GVD) ‐ one of the pathological
hallmarks in AD (Funk, Mrak, & Kuret, 2011; Yamazaki et al., 2010). The adjacent
gene POU1F1 (OMIM: 173110) is reported to cause pituitary hormone deficiency
and is associated with mental retardation (Y. Sun et al., 2006; Turton et al., 2005),
implying role of the deleted loci with susceptibility to neurodegenerative
disorders.

69
Family NH2: The 400 KB deletion showed a partial overlap (59%) with a CNP,
and spanning KN motif and ankyrin repeat domains 1 (KANK1) and doublesex
and mab‐3 related transcription factor genes (DMRT1 and DMRT3) in two
affected subjects (Onset ages: 64 and 65, carrying APOE‐e3,4). The deletion CNV
and APOE‐ε4 do not segregate with the disease individually, but the combination
of both APOE‐ε4 and the CNV segregate in both affecteds. The last age at
examination of subject‐894 (Unaffected, APOE‐ε4 negative, carrying deletion)
was 85, subject‐893 (Unaffected, APOE‐ε4 negative, diploid CN in the locus) was
87, and subject‐385 (unaffected, APOE‐e3,4, diploid CN in the locus) was 71. This
CNV maps 9p24.3 locus, which is reported to cause Chromosome 9p deletion
syndrome (Hayashi et al., 2011) (OMIM: 158170), suggesting involvement of the
loci with neuronal functioning and disorders.
Family NH3: Affected subjects (AAO: 62 and 75, APOE‐ε4 positive) in family
NH3 carry a 151 KB deletion overlapping an uncharacterized gene FLJ35024,
located 46 KB 5’ of Very low density lipoprotein receptor gene (VLDLR).
FLJ65024 gene is not described in public databases, while VLDLR has been
previously studied as a candidate gene in AD without any strongly positive
outcome (www.alzgene.org). Studies suggest CNVs can alter expression levels of
genes in close proximity (up to 2 mb away) (C. Lee & Scherer, 2010; Weterman, et
al., 2010), and VLDLR dysregulation could hold clues to AD pathogenesis due its
70
role in MAPT phosphorylation (C. J. Carter, 2007), interaction with RELN(Forster
et al., 2010) etc. Further, numerous pathogenic mutations in VLDLR have also
been reported to cause cerebral ataxia and mental retardation (OMIM: 224050),
indicating that VLDLR plays an important role in nervous system functioning,
particularly pathways associated with cognition and dementia.
Family ND1: Both of the affected individuals in this family (Onset age: 56 and 68,
APOE‐ε4 negative, no unaffecteds) carry a 110 Kb deletion in an intergenic region
of 16p13.2. The closest genes to the CNV are: ataxin 2‐binding protein 1 (A2BP1)
located 0.3 Mb telomeric and 4‐aminobutyrate aminotransferase (ABAT) located
0.57 Mb centromeric to the CNV breakpoint. Both A2BP1 and ABAT are
associated with various neuronal pathways and associated with
neurodegenerative diseases, however the CNV does not reveal any obvious clues
to functional implications leading to AD.
Family ND2: Two of the three affected subjects (onset age 64 and 65, APOE‐ε4
positive) showed presence of a gain in the locus copy number, while the third
affected (unknown current age and onset age, APOE‐ε4 negative) is diploid. The
488 Kb gain in the genomic loci encompasses CDH2, a cadherin family gene
expressed in brain, skeletal and cardiac muscles, and with a role in synaptic
adhesion (OMIM: 114020). Studies indicate CDH2 plays an important role in

71
synaptic adhesion, dendritic morphology and neuritic growth (Aiga, Levinson, &
Bamji, 2011; Lefort, Wojciechowski, & Hocking, 2011; Malinverno et al., 2010;
Rieger, Senghaas, Walch, & Koster, 2009; Tan, Peng, Song, Zheng, & Yu, 2010),
and could possibly affect AD directly via interaction with γ‐secretase complex
(Kopan & Ilagan, 2004).
Family ND3: Two affected individuals (Onset age: 37 and 63, APOE‐ε4 positive,
no unaffected subjects) show presence of a 550 Kb duplication segment. The CN
gain segment overlaps and extends beyond CNPs reported in DGV and harbors
multiple small segments of CNPs around the breakpoint indicating susceptibility
of the locus to CN changes. The CNV is located in the intergenic region with
LPHN3 (0.65 Mb centromeric), SRD5A2L2 (1.1 Mb telomeric) and EPHA5 (2.1 Mb
telomeric) in close proximity, and fails to reveal any direct clues to pathogenic
effects.
Family ND4: Two affected subjects showing onset age of 40 and 42 years (APOE‐
ε4 negative, no unaffecteds) show presence of a 124 Kb deletion overlapping
ERMP1 and CIP150 (KIAA1432). CIP150 and ERMP1 are not characterized to
great extent but a recent study of proteome alterations in transgenic AD mouse
model showed decrease in ERMP1 expression (Martin et al., 2008), while slightly

72
higher expression is reported in epilepsy mouse models (Bergren, Rutter, &
Kearney, 2009).
Family ND5: Both affected individuals (Onset age: 52 and 56, APOE‐ε4 negative)
carry 240 Kb gain, overlapping EVC, EVC2 and CRMP1. This loci is implicated in
Ellis‐Van Creveld syndrome (OMIM: 225500) and Weyers acrofacial dysostosis
(OMIM: 193530) – caused by different mutations in EVC and EVC2. On the other
hand, CRMP1, highly expressed in the brain (Schmidt & Strittmatter, 2007),
interacts with SEMA3A and shown to have an important role in neural growth
and axonal guidance (Fukada et al., 2000; Kurnellas et al., 2010; Mukherjee et al.,
2009; Yamashita et al., 2006), and seems like a promising candidate gene for
investigation of pathogenic effects leading to AD.
Family ND6: Two affected APOE‐ε4 positive subjects in family ND6 (onset age:
64 and 69) carry a 0.73 Mb intergenic gain CN. EPHA6, located 0.33 Mb telomeric
is the only gene in close proximity. EPHA6 is highly expressed in the brain and
play an important role in forming neuronal networks (Orioli & Klein, 1997).
Several GWAS report association of the loci with a variety of phenotypes,
including: longevity (Sebastiani et al., 2010), risperidone response in
schizophrenic subjects (Ikeda et al., 2010), obesity (Glessner et al., 2010) and male
infertility (Aston & Carrell, 2009). However, contradicting the CN gain seen in
73
the affecteds, learning and memory impairment has been observed in EPHA6
knock‐out mice (Savelieva et al., 2008).
In summary, the CNVs identified in our study are consistent with reports
suggesting occurrence of CNVs in higher frequency in region harboring genes
associated with brain functions (Cooper, et al., 2007; Henrichsen, et al., 2009; J. A.
Lee & Lupski, 2006). Similar to many of the CNV studies in the recent
publications (Conrad, et al., 2010; C. Lee & Scherer, 2010), the strongly suggestive
functional role of genes underlying these rare CNVs justify further in‐depth
functional studies to unravel their roles in AD pathogenesis. However, owing to
the limited understanding of the complexities of functional implication of CNVs
in the genome, elucidating the role of these rare CNVs and underlying genes will
require creative solutions in unraveling their role in the disease onset. In
addition, further CNV analysis in larger cohorts (Cook & Scherer, 2008;
Stankiewicz & Lupski, 2010; Vassos et al., 2010) could identify the minimal
pathogenic segment and further our their role in modifying susceptibility to AD.
Lastly, GWAS using CNPs could reveal loci that also carry highly penetrant and
rare CNVs that cause EOFAD.
74
4.5 Methods
4.5.1 Family sample‐sets: Two large family‐based AD sample‐sets were used in
the study. The National Cell Repository for Alzheimerʹs Disease (NCRAD)
samples consist of 1108 samples from 331 pedigrees, including 132 early‐mixed
families (age of onset<65) with 498 individuals. The National Institute of Mental
Health Alzheimerʹs Disease Genetics Initiative Study (NIMH) dataset consists
1439 individuals from 436 families, including 131 early‐mixed families and 510
subjects. Both the families are described in detail elsewhere (Bertram, Schjeide, et
al., 2008).
4.5.2 Genotyping: DNA samples obtained from the respective repositories were
processed on Affymetrix Human Genome Wide SNP Array 6.0 panel using
standard protocol. CNVs were inferred from probe intensity data using two
different algorithms: Hidden Markov Model (HMM) using PennCNV (K. Wang,
et al., 2007), as well as, Copy Number Analysis Module (univariate segmentation
mode) using Golden Helix SNP & Variation Suite (SVS 7.4) (GoldenHelix, 2011b).
Samples that failed to pass quality criteria (GoldenHelix, 2011a), such as gender
validation, cQC, and MAPD were excluded from the study. CNV segments
larger than 100 Kb in size, showing less than <70% overlap with CNPs reported
in Database of genomic variants (DGV) were visually analyzed for segregation
with affection status in all the 261 pedigrees.

75
4.5.3 Confirmation of CNVs: CNVs were confirmed using Fluidigm Digital
48.776 array and TaqMan copy number probes (Qin, et al., 2008; Weaver, et al.,
2010). Depending on the availability and relevance to AD, several CNVs were
further confirmed using fluorescence in‐situ hybridization (FISH) as described
previously (Mohapatra, et al., 1997) using lymphoblast cells derived from the
subjects.
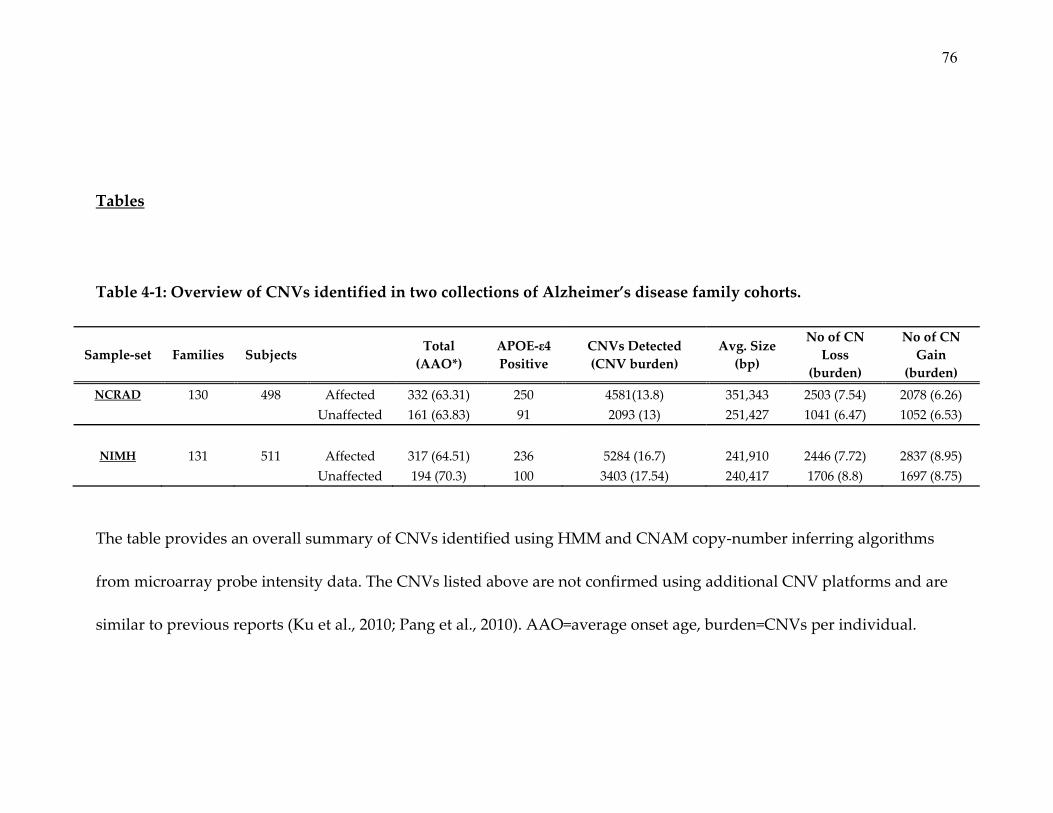
76
Tables
Table 4‐1: Overview of CNVs identified in two collections of Alzheimer’s disease family cohorts.
Sample‐set Families Subjects Total
(AAO*)
APOE‐ε4 Positive
CNVs Detected
(CNV burden)
Avg. Size
(bp)
No of CN
Loss
(burden)
No of CN
Gain
(burden)
NCRAD 130 498 Affected 332 (63.31) 250 4581(13.8) 351,343 2503 (7.54) 2078 (6.26)
Unaffected 161 (63.83) 91 2093 (13) 251,427 1041 (6.47) 1052 (6.53)
NIMH 131 511 Affected 317 (64.51) 236 5284 (16.7) 241,910 2446 (7.72) 2837 (8.95)
Unaffected 194 (70.3) 100 3403 (17.54) 240,417 1706 (8.8) 1697 (8.75)
The table provides an overall summary of CNVs identified using HMM and CNAM copy‐number inferring algorithms
from microarray probe intensity data. The CNVs listed above are not confirmed using additional CNV platforms and are
similar to previous reports (Ku et al., 2010; Pang et al., 2010). AAO=average onset age, burden=CNVs per individual.

77
Table 4‐2: List of rare CNVs identified in NIMH and NCRAD pedigree sets.
CNV ID Gene(s) in the loci Subject IDs Diagnosis APOE Onset Age Array CN CN State CNV Region (hg18) Size (KB)
FADCNV1 ERMP1 Fam. 62493‐ND1
05AD7725 Affected 0 40 1 Loss Chr9: 5744105‐5867748 124
93M0806 Affected 0 42 1 Loss Chr9: 5744105‐5867748 124
FADCNV2
EVC2, EVC,
CRMP1 Fam. 62613‐ND2
95M2194 Affected 0 52 3 Gain Chr4: 5602184‐5837823 236
01AD4175 Affected 0 56 3 Gain Chr4: 5602184‐5845805 244
FADCNV3 A2BP1, ABAT FAM. 62090‐ND3
90M0526 Affected 0 56 1 Loss Chr16: 7991014‐8100555 110
90M0525 Affected 0 68 1 Loss Chr16: 7994156‐8100555 106
FADCNV4 CNP overlap Fam. 62329‐ND4
92M0524 Affected 1 37 3 Gain Chr4: 63268479‐63813833 545
92M0570 Affected 1 63 3 Gain Chr4: 63268479‐63809059 541
FADCNV5 CDH2 Fam. 62135‐ND5
93M0784 Affected 1 64 3 Gain Chr18: 23693824‐24181680 488
93M0872 Affected 1 65 3 Gain Chr18: 23693824‐24180173 486
93M0973 Affected 0 ‐‐ 2 Diploid ‐‐ ‐‐
FADCNV6 EPHA6 Fam. 62863‐ND6
04AD7150 Affected 1 64 3 Gain Chr3: 96949558‐97684405 735
04AD6981 Affected 1 69 3 Gain Chr3: 96937158‐97678067 741

78
Table 4‐2: (Continued)
CNV ID Gene(s) in the loci Subject IDs Diagnosis APOE Onset Age Array CN CN State CNV Region (hg18) Size (KB)
FADCNV7 KANK1, DMRT1 Fam. 50354‐NH1
90C00132 AC 3,4 64 1 Loss Chr9: 587476‐992280 405
90C00385 ND 3,4 ‐‐ 2 Diploid ‐‐ ‐‐
90C00386 PR 3,4 65 1 Loss Chr9: 666266‐992280 326
90C00893 ND 3,3 ‐‐ 2 Diploid ‐‐ ‐‐
90C00894 ND 3,3 ‐‐ 1 Loss Chr9: 589612‐992280 403
FADCNV8 CHMP2B, POU1F1 Fam. 50152‐NH2
90C00006 AC 4,4 61 1 Loss Chr3: 87319231‐87650334 331
90C00045 PR 4,4 72 1 Loss Chr3: 87319617‐87650334 331
90C00070 ND 3,4 ‐‐ 2 Diploid ‐‐ ‐‐
90C00090 ND 3,4 ‐‐ 2 Diploid ‐‐ ‐‐
FADCNV9 FLJ35024, VLDLR Fam. 51278‐NH3
90C04456 PR 4,4 62 1 Loss Chr9: 2414322‐2565408 151
90C04457 AC 3,4 75 1 Loss Chr9: 2414322‐2565408 151
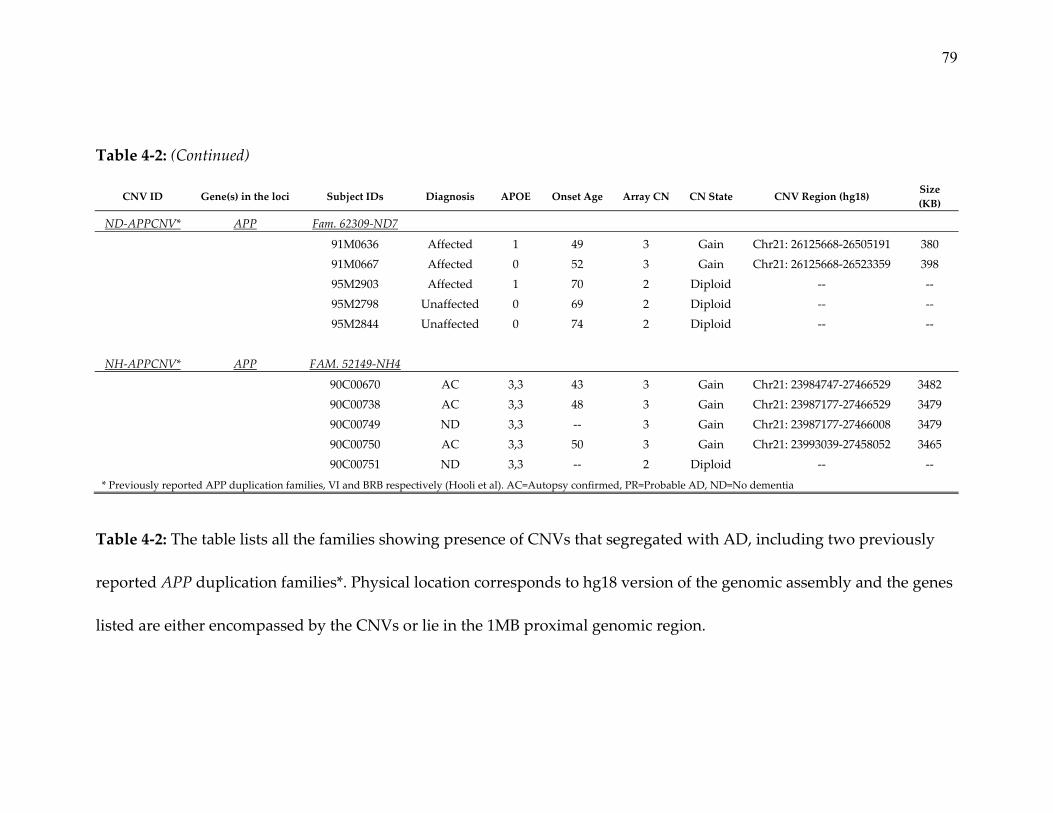
79
Table 4‐2: (Continued)
CNV ID Gene(s) in the loci Subject IDs Diagnosis APOE Onset Age Array CN CN State CNV Region (hg18) Size
(KB)
ND‐APPCNV* APP Fam. 62309‐ND7
91M0636 Affected 1 49 3 Gain Chr21: 26125668‐26505191 380
91M0667 Affected 0 52 3 Gain Chr21: 26125668‐26523359 398
95M2903 Affected 1 70 2 Diploid ‐‐ ‐‐
95M2798 Unaffected 0 69 2 Diploid ‐‐ ‐‐
95M2844 Unaffected 0 74 2 Diploid ‐‐ ‐‐
NH‐APPCNV* APP FAM. 52149‐NH4
90C00670 AC 3,3 43 3 Gain Chr21: 23984747‐27466529 3482
90C00738 AC 3,3 48 3 Gain Chr21: 23987177‐27466529 3479
90C00749 ND 3,3 ‐‐ 3 Gain Chr21: 23987177‐27466008 3479
90C00750 AC 3,3 50 3 Gain Chr21: 23993039‐27458052 3465
90C00751 ND 3,3 ‐‐ 2 Diploid ‐‐ ‐‐
* Previously reported APP duplication families, VI and BRB respectively (Hooli et al). AC=Autopsy confirmed, PR=Probable AD, ND=No dementia
Table 4‐2: The table lists all the families showing presence of CNVs that segregated with AD, including two previously
reported APP duplication families*. Physical location corresponds to hg18 version of the genomic assembly and the genes
listed are either encompassed by the CNVs or lie in the 1MB proximal genomic region.

80
Table 4‐3: Detailed results from Fluidigm and FISH confirmation of CNVs identified in the NIMH pedigree dataset.
FamID IndID Phen. APOE
Target
Gene
Rx.
Count
Control
Gene
Rx.
Count
Rx.
Union
Rx.
Inters.
Gene
Quant.
Fluidigm
CN
Chip
CN
Fluidigm
Results
FISH
Probes
FISH
Results
50152 POU1F1 RNAseP Het. del.
RP11‐ 479F13/
RP11‐71J24 Del.
90C00006 1 4,4 332 579 648 263 0.405 1 Loss
RP11‐17D23/
RP11‐71J24 Del.
90C00045 2 4,4 223 421 514 130 0.431 1 Loss
90C00070 9 3,4 617 655 743 529 0.849 2 Normal
90C00090 9 3,4 586 626 716 496 0.854 2 Normal
50354 DMRT1 RNAseP Het. del.
RP11‐31F19/
RP11‐295G24 Del.
90C00894 9 3,3 226 356 395 187 0.561 1 Loss
RP11‐130C19/
RP11‐295G24 Del.
90C00132 1 3,4 393 615 686 322 0.445 1 Loss
RP11‐143M15/
RP11‐295G24 Del.
90C00385 9 3,4 478 642 710 378 0.988 2 Normal
90C00386 2 3,4 486 668 729 425 0.493 1 Loss
90C00893 9 3,3 726 746 770 702 0.823 2 Normal
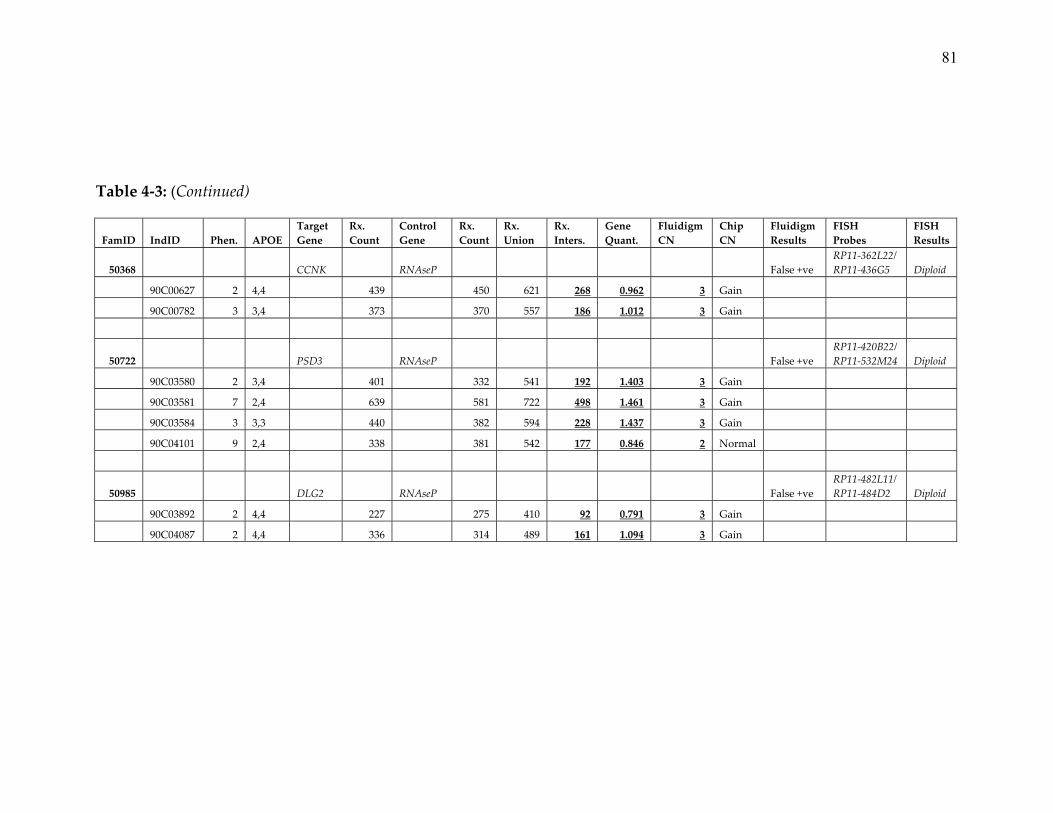
81
Table 4‐3: (Continued)
FamID IndID Phen. APOE
Target
Gene
Rx.
Count
Control
Gene
Rx.
Count
Rx.
Union
Rx.
Inters.
Gene
Quant.
Fluidigm
CN
Chip
CN
Fluidigm
Results
FISH
Probes
FISH
Results
50368 CCNK RNAseP False +ve
RP11‐362L22/
RP11‐436G5 Diploid
90C00627 2 4,4 439 450 621 268 0.962 3 Gain
90C00782 3 3,4 373 370 557 186 1.012 3 Gain
50722 PSD3 RNAseP False +ve
RP11‐420B22/
RP11‐532M24 Diploid
90C03580 2 3,4 401 332 541 192 1.403 3 Gain
90C03581 7 2,4 639 581 722 498 1.461 3 Gain
90C03584 3 3,3 440 382 594 228 1.437 3 Gain
90C04101 9 2,4 338 381 542 177 0.846 2 Normal
50985 DLG2 RNAseP False +ve
RP11‐482L11/
RP11‐484D2 Diploid
90C03892 2 4,4 227 275 410 92 0.791 3 Gain
90C04087 2 4,4 336 314 489 161 1.094 3 Gain
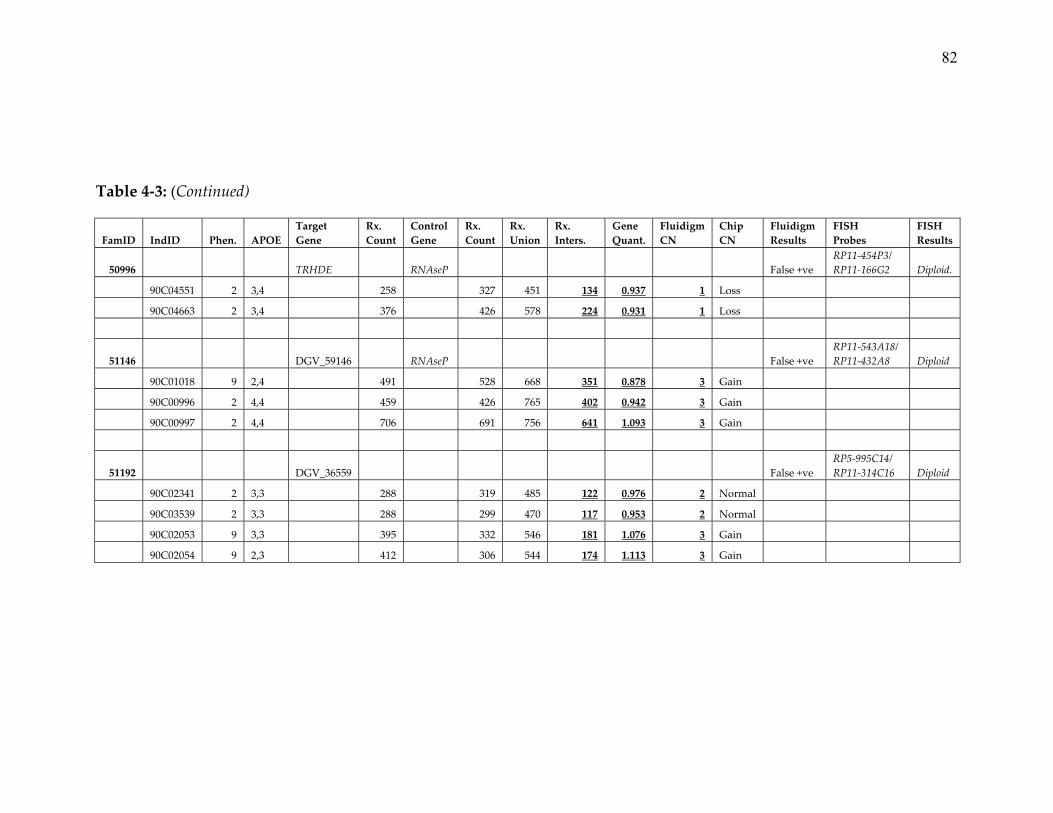
82
Table 4‐3: (Continued)
FamID IndID Phen. APOE
Target
Gene
Rx.
Count
Control
Gene
Rx.
Count
Rx.
Union
Rx.
Inters.
Gene
Quant.
Fluidigm
CN
Chip
CN
Fluidigm
Results
FISH
Probes
FISH
Results
50996 TRHDE RNAseP False +ve
RP11‐454P3/
RP11‐166G2 Diploid.
90C04551 2 3,4 258 327 451 134 0.937 1 Loss
90C04663 2 3,4 376 426 578 224 0.931 1 Loss
51146 DGV_59146 RNAseP False +ve
RP11‐543A18/
RP11‐432A8 Diploid
90C01018 9 2,4 491 528 668 351 0.878 3 Gain
90C00996 2 4,4 459 426 765 402 0.942 3 Gain
90C00997 2 4,4 706 691 756 641 1.093 3 Gain
51192 DGV_36559 False +ve
RP5‐995C14/
RP11‐314C16 Diploid
90C02341 2 3,3 288 319 485 122 0.976 2 Normal
90C03539 2 3,3 288 299 470 117 0.953 2 Normal
90C02053 9 3,3 395 332 546 181 1.076 3 Gain
90C02054 9 2,3 412 306 544 174 1.113 3 Gain

83
Table 4‐3: (Continued)
FamID IndID Phen. APOE
Target
Gene
Rx.
Count
Control
Gene
Rx.
Count
Rx.
Union
Rx.
Inters.
Gene
Quant.
Fluidigm
CN
Chip
CN
Fluidigm
Results
FISH
Probes
FISH
Results
51223 ANKRD17 RNAseP False +ve
RP11‐433K16/
RP11‐326O23 Diploid
90C02497 9 3,4 374 386 567 193 0.957 2 Normal
90C02483 2 4,4 378 387 555 210 0.967 3 Gain
90C02561 7 4,4 336 352 518 170 0.938 3 Gain
90C02526 2 4,4 396 420 574 242 0.916 3 Gain
51278 FLJ35024 RNAseP Het. del.
RP11‐91N2/
RP11‐295G24 Del.
90C04456 2 4,4 353 565 650 268 0.464 1 Loss
90C04457 1 3,4 308 522 610 220 0.451 1 Loss
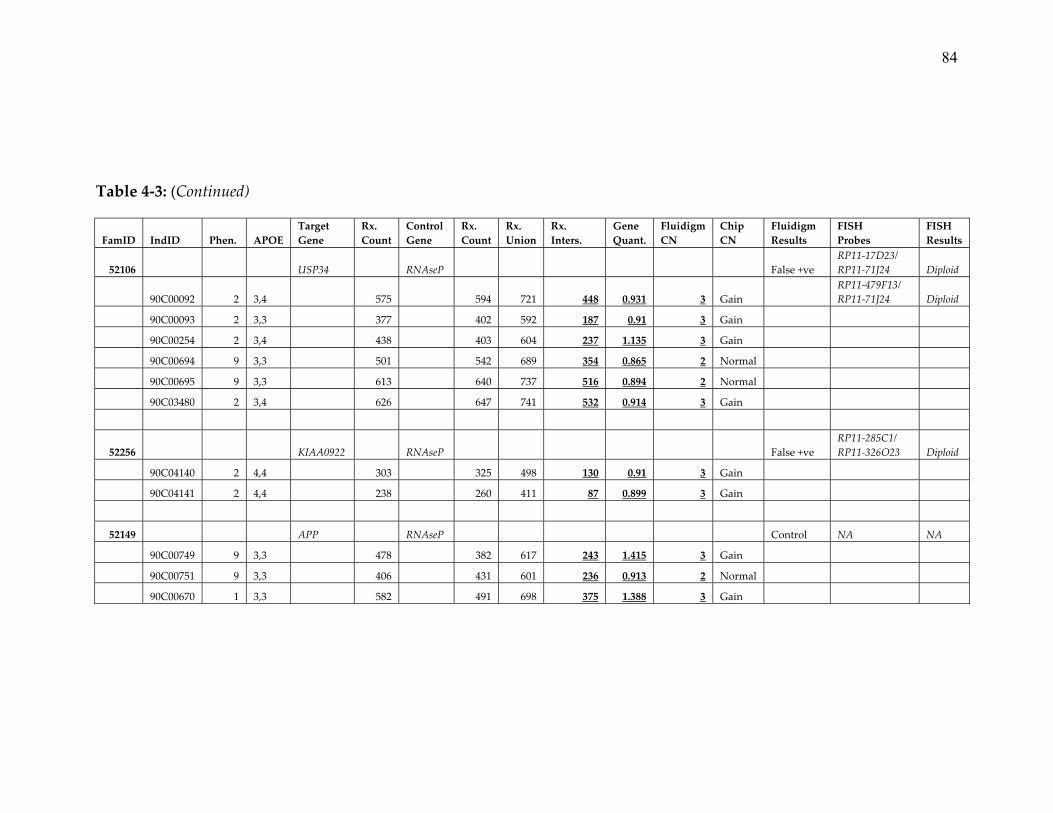
84
Table 4‐3: (Continued)
FamID IndID Phen. APOE
Target
Gene
Rx.
Count
Control
Gene
Rx.
Count
Rx.
Union
Rx.
Inters.
Gene
Quant.
Fluidigm
CN
Chip
CN
Fluidigm
Results
FISH
Probes
FISH
Results
52106 USP34 RNAseP False +ve
RP11‐17D23/
RP11‐71J24 Diploid
90C00092 2 3,4 575 594 721 448 0.931 3 Gain
RP11‐479F13/
RP11‐71J24 Diploid
90C00093 2 3,3 377 402 592 187 0.91 3 Gain
90C00254 2 3,4 438 403 604 237 1.135 3 Gain
90C00694 9 3,3 501 542 689 354 0.865 2 Normal
90C00695 9 3,3 613 640 737 516 0.894 2 Normal
90C03480 2 3,4 626 647 741 532 0.914 3 Gain
52256 KIAA0922 RNAseP False +ve
RP11‐285C1/
RP11‐326O23 Diploid
90C04140 2 4,4 303 325 498 130 0.91 3 Gain
90C04141 2 4,4 238 260 411 87 0.899 3 Gain
52149 APP RNAseP Control NA NA
90C00749 9 3,3 478 382 617 243 1.415 3 Gain
90C00751 9 3,3 406 431 601 236 0.913 2 Normal
90C00670 1 3,3 582 491 698 375 1.388 3 Gain

85
Table 4‐3: The table shows the results from gene quantitation experiments
performed using TaqMan probes and Fluidigm 770 digital array. The digital
array runs nano‐scale qPCR reactions, and hence runs up‐to 770 replicates of
every reaction. DNA sample from each test subject were run in multiplex using a
Fam labeled target gene and a Vic labeled house‐keeping gene. ‘Rx. Count’
column shows the number of replicate reactions and the ‘Rx. Inters.’ column is
the number of reactions where both target and house‐keeping (RNAseP and/or
TERT) signal were detected. The ‘Gene Quan.’ column shows the ratio of target
gene quantified against the diploid control gene. Ratios in the range of ~0.5
indicate a heterozygous deletion, ~1.0 indicates diploid and any ratio >1.5
indicate increase in gene copy number (duplication, triplication etc.). Column
header description: FamID‐family ID, IndID‐individual ID, Phen.‐AD phenotype
(see description below), APOE‐APOE‐ε4 genotype, Fluidigm CN‐Copy number
inferred from digital quantitation data, Chip CN‐Copy number inferred from
genome‐wide DNA array data, FISH probes‐probes used to identify deletions
and duplications (control probe ID follow “/”), FISH results‐ Del. indicates
deletion, Dip. indicates diploid, Dup. indicates duplication.
AD Phenotype (NINDS Criteria):
1. Definite AD (Autopsy)
2. Probable AD (Consensus)
3. Possible AD
4. Non AD dementia
5. Non AD dementia (Consensus)
6. Suspected dementia, documented
7. Suspected dementia, no documentation
8. Presumed no dementia
9. No dementia (Unaffected)
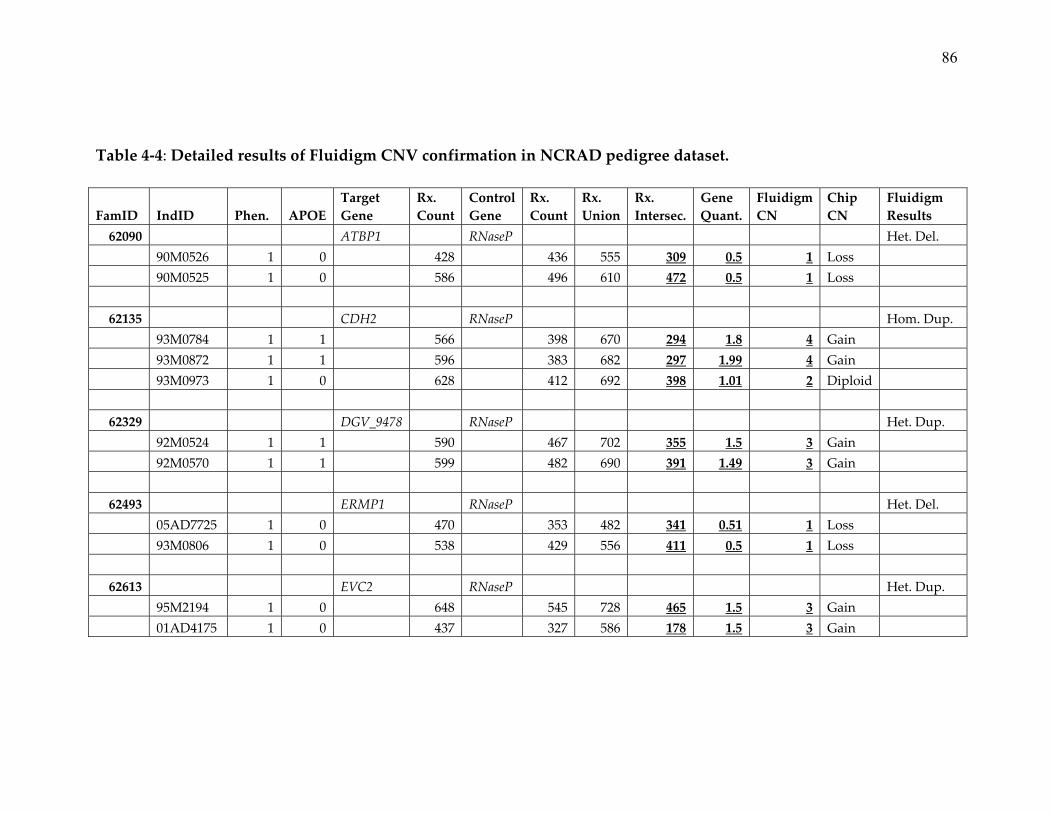
86
Table 4‐4: Detailed results of Fluidigm CNV confirmation in NCRAD pedigree dataset.
FamID IndID Phen. APOE
Target
Gene
Rx.
Count
Control
Gene
Rx.
Count
Rx.
Union
Rx.
Intersec.
Gene
Quant.
Fluidigm
CN
Chip
CN
Fluidigm
Results
62090 ATBP1 RNaseP Het. Del.
90M0526 1 0 428 436 555 309 0.5 1 Loss
90M0525 1 0 586 496 610 472 0.5 1 Loss
62135 CDH2 RNaseP Hom. Dup.
93M0784 1 1 566 398 670 294 1.8 4 Gain
93M0872 1 1 596 383 682 297 1.99 4 Gain
93M0973 1 0 628 412 692 398 1.01 2 Diploid
62329 DGV_9478 RNaseP Het. Dup.
92M0524 1 1 590 467 702 355 1.5 3 Gain
92M0570 1 1 599 482 690 391 1.49 3 Gain
62493 ERMP1 RNaseP Het. Del.
05AD7725 1 0 470 353 482 341 0.51 1 Loss
93M0806 1 0 538 429 556 411 0.5 1 Loss
62613 EVC2 RNaseP Het. Dup.
95M2194 1 0 648 545 728 465 1.5 3 Gain
01AD4175 1 0 437 327 586 178 1.5 3 Gain
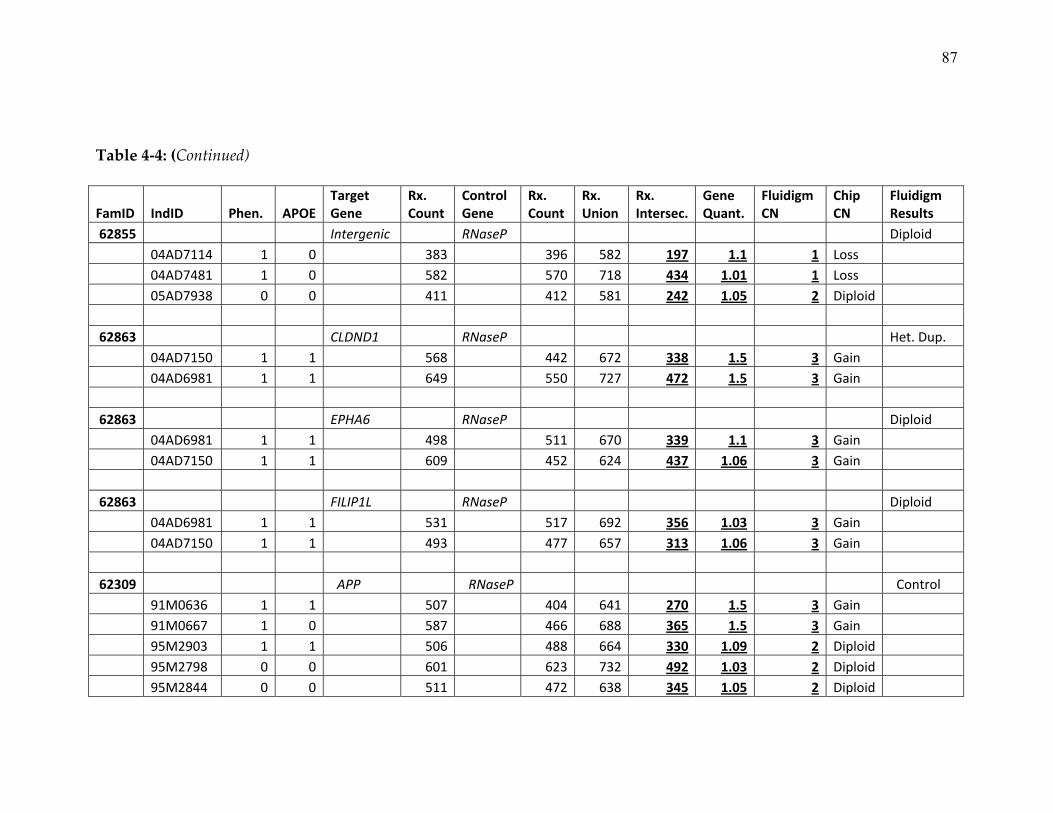
87
Table 4‐4: (Continued)
FamID IndID Phen. APOE Target Gene
Rx. Count
Control Gene
Rx. Count
Rx. Union
Rx. Intersec.
Gene Quant.
Fluidigm CN
Chip CN
Fluidigm Results
62855 Intergenic RNaseP Diploid
04AD7114 1 0 383 396 582 197 1.1 1 Loss
04AD7481 1 0 582 570 718 434 1.01 1 Loss
05AD7938 0 0 411 412 581 242 1.05 2 Diploid
62863 CLDND1 RNaseP Het. Dup.
04AD7150 1 1 568 442 672 338 1.5 3 Gain
04AD6981 1 1 649 550 727 472 1.5 3 Gain
62863 EPHA6 RNaseP Diploid
04AD6981 1 1 498 511 670 339 1.1 3 Gain
04AD7150 1 1 609 452 624 437 1.06 3 Gain
62863 FILIP1L RNaseP Diploid
04AD6981 1 1 531 517 692 356 1.03 3 Gain
04AD7150 1 1 493 477 657 313 1.06 3 Gain
62309 APP RNaseP Control
91M0636 1 1 507 404 641 270 1.5 3 Gain
91M0667 1 0 587 466 688 365 1.5 3 Gain
95M2903 1 1 506 488 664 330 1.09 2 Diploid
95M2798 0 0 601 623 732 492 1.03 2 Diploid
95M2844 0 0 511 472 638 345 1.05 2 Diploid

88
Table 4‐4: The table shows the results from gene quantitation experiments
performed using TaqMan probes and Fluidigm 770 digital array. The digital
array runs nano‐scale qPCR reactions, and hence runs up‐to 770 replicates of
every reaction. DNA sample from each test subject were run in multiplex using a
‘Fam’ labeled target gene and a ‘Vic’ labeled house‐keeping gene. ‘Rx. Count’
column shows the number of replicate reactions and the ‘Rx. Inters.’ column is
the number of reactions where both target and house‐keeping (RNAseP and/or
TERT) signal were detected (replicates). The ‘Gene Quan.’ column shows the
ratio of target gene quantified against the diploid control gene. Ratios in the
range of ~0.5 indicate a heterozygous deletion, ~1.0 indicates diploid and any
ratio >1.5 indicate increase in gene copy number (duplication, triplication etc.).
Column header description: FamID‐family ID, IndID‐individual ID, Proband‐
proband from each family, Phen.‐AD phenotype (see description below), APOE‐
No. of copies of APOE‐ε4, Fluidigm CN‐Copy number inferred from digital
quantitation data, Chip CN‐Copy number inferred from genome‐wide DNA
array data, Del. indicates deletion, Dip. indicates diploid, Dup. indicates
duplication, Het. Indicates heterozygous and Hom. stands for homozygous.

T
F
5
5
5
5
Table 4‐5: FISH
Fluidigm Digi
Family ID
50152‐NH1
50354‐NH2
51278‐NH3
52149‐NH4
H images of ly
ital array ΔCt
Proband FISH
ymphoblastoi
values).
H
Chr. 3 :
Chr. 9: 5
Chr. 9: 2
Chr. 21:
d cell lines de
CNV Locus
87319231 ‐ 87650
587476 ‐ 992280
2414322 ‐ 2565408
: 23984747 ‐ 27466
erived from NI
Targ
(Cy3
0334 RP11‐4
RP11‐4
RP11‐1
RP11‐3
RP11‐1
RP11‐1
8 RP11‐9
6529 RP11‐1
IMH EOFAD
get Probe
3‐dUTP,
red)
Co
(F
431M5
491D12
152L15
RP1
31F19
130C19
143M15
RP1
91N2 RP1
15D13 CTB
probands (an
ontrol Probe
FITC‐dUTP,
green)
1‐432A8
1‐295G24
1‐295G24
B‐63H24
d the correspo
Fluidigm C
(Control gene
Heterozygous d
(Average ΔCt =
Heterozygous d
(Average ΔCt =
Heterozygous d
(Average ΔCt =
Heterozygous d
(Average ΔCt =
89
onding
CN State
e: RNAseP)
deletion
0.415)
deletion
0.51)
deletion
0.459)
duplication
1.42)
90
Table 4‐5: FISH images of lymphoblast cells from probands in NIMH families
carrying CNVs. ΔCt values generated using Fluidigm Digital arrays and RNAseP
as control correlate with the FISH results. Results from Fluidigm assay were in
full agreement with 38 FISH confirmed CNVs in NIMH samples, hence for CNVs
identified in NCRAD families, FISH confirmation was not performed.
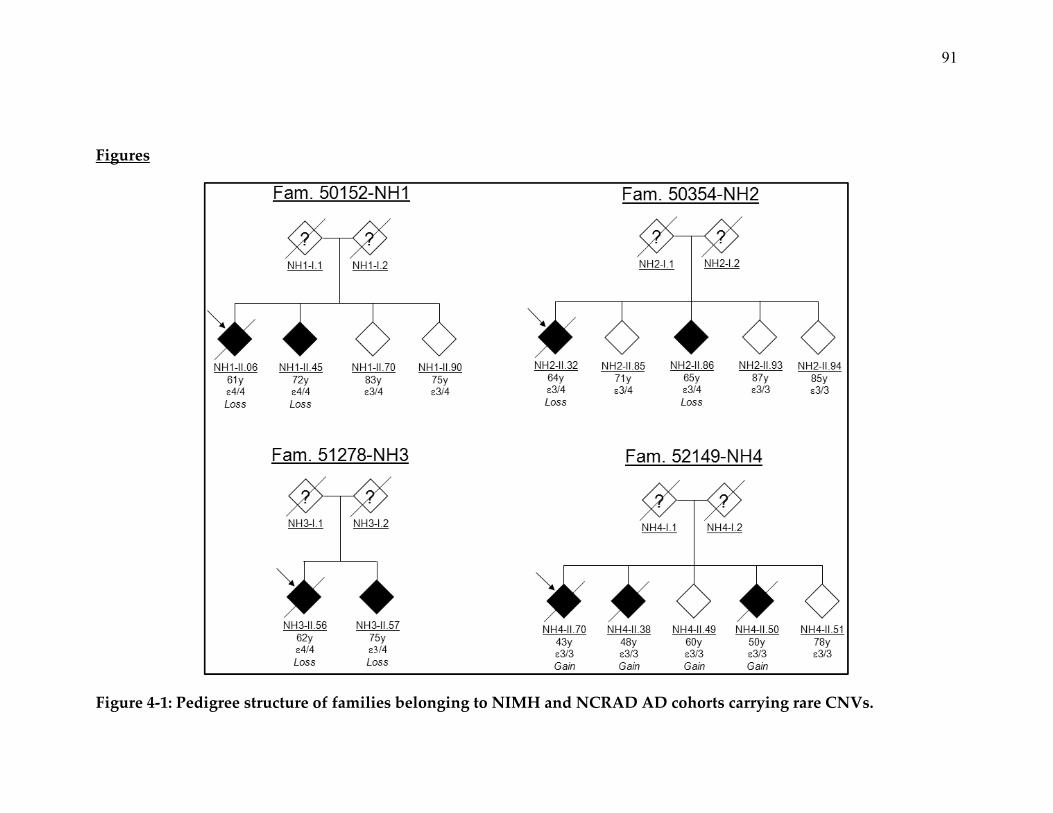
91
Figures
Figure 4‐1: Pedigree structure of families belonging to NIMH and NCRAD AD cohorts carrying rare CNVs.

92
Figure 4‐1: (Continued)
93
Figure 4‐1: Probands are indicated by arrows. Phenotype for each individual from top to bottom are: age at onset (in
affected individuals) or age at last examination (unaffected individuals); APOE genotype and copy number gain or loss.
No DNA or clinical information was available from the founders (“?”).
94
CHAPTER 5: SUMMARY
5.1 Discussion
AlzGene and AD&FTD mutation databases that compile results from AD
genetics reports indicate an under‐representation of CNVs in the published
studies (ADFTD, 2008; Bertram, 2008; Cruts, 2009). In contrast to numerous other
human disorders, most of the studies in AD genetics are based on nucleotide
level variation with the exception of APP loci for disease risk in AD
(McNaughton, et al., 2010; Rovelet‐Lecrux, et al., 2007). The GWAS reports
published to date have utilized small number AD affected subjects (Shaw, et al.,
2011) and fail to perform an in‐depth and comprehensive CNV analyses
(Brouwers, et al., 2011; Heinzen, et al., 2010; Shaw, et al., 2011). Overall,
duplication in APP locus remains the only established CNV causing EOFAD, and
a thorough and systematic CNV analysis hold immense potential in revaling
novel genetic variations causing Alzheimer’s disease.
Analogous to the outcome of genetic studies peformed using SNPs vs.
mutation detection in families showing Mendelian inheritance of diseases,
investigations of larger CNVs have shown more success than studies focused on
risk conferring CNPs (Girirajan & Eichler, 2010; McCarroll & Altshuler, 2007).
Further, recent reports strongly suggest that rare CNVs show potential in
representing an important portion of missing heritability in complex disorders

95
(Eichler, et al., 2010; Manolio, et al., 2009; F. Zhang, et al., 2010). Furthermore,
rare and fully penetrant mutations in EOFAD pedigrees have provided most
valuable insight into the AD pathogenesis, while association studies results for
common risk‐modulating variants in LOAD have been modest (Bertram, et al.,
2010). In contrast to genetic studies in other late onset neurodegenerative
disorders, no common variants in the EOFAD genes have been reported that
modulate LOAD risk (Bertram, 2011). Taking into consideration all the above
facts, the results presented in this doctoral dissertation are the culmination of the
efforts to unravel rare, highly penetrant copy‐number changes in genes that
cause EOFAD.
The size of the CNVs were limited to >100 Kb segments considering the
diminishing reliability of the SNP 6.0 DNA array in accurately identifying
smaller CNVs. Large CNVs are also called with greater accuracy and show better
concordance across different platforms. Moreover, large, rare CNVs currently
show the most robust evidence for association with various diseases (see Table 5‐
1)(Pinto, Marshall, Feuk, & Scherer, 2007). In addition, the majority of the
syndromes associated with submicroscopic chromosomal imbalances described
in the DECIPHER database (Firth et al., 2009) are attributable to large CNVs
segments. This association could be due to one very obvious biological
distinction between small and large CNVs i.e., larger CNVs are much more likely
96
to affect multiple genes, hence influence phenotype and diseases (Guilmatre et
al., 2009).
Our analysis of CNVs in EOFAD pedigrees revealed 0.4 to 1.03% of
genomic variation due to deletion and 0.4–0.7% due to locus amplification per
individual in more than a thousand subjects from NIMH and NCRAD datasets.
This is in range with the estimates of earlier reports on HapMap and other
populations (Itsara, et al., 2009; Pang, et al., 2010) and in CNV analysis reports
using Affymetrix 6.0 array (Ku, et al., 2010). Further analysis for CNVs larger
than 100 Kb showed presence of an average of just over 15 CNVs per subject
with an average CNV size of 270 Kb. Majority of the CNVs were found to
overlap by at least 90% with CNPs reported on DGV. Conversely, most of those
CNVs that did not overlap with CNPs were unique to the harboring pedigrees.
This observation suggests that public CNV databases may not be fully
comprehensive, and in order to capture the entire repertoire of CNVRs more
CNV studies from diverse populations and large samples need to be undertaken.
Although this study addresses only a small fraction of CNVs, it underlines the
untapped genomic variation that could hold clues to novel disease genes.
Rare CNVRs that segregated with the disease in the affecteds from the
EOFAD pedigrees are listed in Table 4‐2 (page 77). Six out of the nine pedigrees
that showed presence of CNVs segregating with disease in the affecteds also
97
carry the risk allele APOE‐ε4, suggesting that these CNVs are unlikely to be the
sole cause of EOFAD and further studies investigating effects of any genetic
interactions in modulating susceptibility to EOFAD are warranted. For example,
genes CHMP2B, VLDLR and CDH2 play an important role in neuronal pathways
in addition to be being implicated in pathogenesis of multiple neurodegenerative
diseases, including AD (C. J. Carter, 2007; Kopan & Ilagan, 2004; Yamazaki, et al.,
2010). On the other hand, deletions in ERMP1, A2BP1/ABAT loci, and gain in
EVC/CRMP1, appear in absence of other AD risk factors, and considering their
functional role in brain, are the most promising candidate genes in our results for
further genetic and functional studies (Hammock & Levitt, 2011; Kurnellas, et al.,
2010; Ma et al., 2010; Martin, et al., 2008; Yamashita, et al., 2006).
5.2 Functional Implications of CNVs on Alzheimer’s disease
Both case‐control and family‐based genetic studies consistently confirm
the commonly occurring allele ‐ ε4 in the gene APOE, as risk factor that increases
AD susceptibility by up to 10 fold. Therefore, in addition to sequencing for
pathogenic mutations in the three genes APP, PSEN1 and PSEN2, the nine
pedigrees identified in the study were also analyzed for their APOE genotype.
Six out of nine families showing a seemingly pathogenic form of inheritance in
the rare CNVs also carried at least one copy of the risk ε4 allele. Hence the
following discussion on the likely impact of the genes underlying the CNVs on
98
AD is sub‐divided into two groups based on their APOE genotype. This strategy
is also utilized in prioritizing the genes for investigation of their functional
implications attributable to the change in their copy number.
5.3 CNVs in families with APOE‐ε4 risk allele genotype
5.3.1 Role of deletion in CHMP2B and POU1F1 on neuronal autophagy leading
to AD
Affected members in family NH1 carry a 331 Kb deletion overlapping
genes chromatin modifying protein 2B (CHMP2B) and POU class 1 homeobox 1
(POU1F1). Both the affected individuals are homozygous for APOE‐ε4 allele,
while the two unaffected siblings were heterozygous for APOE‐ε4.
CHMP2B belongs to the chromatin modifying protein family, and is one
of the key components of the ESCRT‐III complex, and shown to be critical to the
autophagic clearance of proteins in all neuronal populations (Filimonenko et al.,
2007). ESCRT‐III is an endosome‐associated hetero‐oligomeric protein complex
required for sorting of transmembrane proteins (e.g., cell surface receptors) into
the multivesicular body (MVB), an endosomal structure that fuses with the
lysosome to degrade endocytosed proteins (Babst, Katzmann, Estepa‐Sabal,
Meerloo, & Emr, 2002). CHMP2B plays an important role in normal formation
and functioning of MVBs. MVBs enable degradation of a variety of membrane
proteins, such as stimulated growth factor receptors, lysosomal enzymes and
lipids etc. via intraluminal vesicles (ILVs), generated by invagination and

99
scission from the endosomal membrane that results in tiny pockets of protein
targeted for clearance and degradation (Rusten, Filimonenko, Rodahl, Stenmark,
& Simonsen, 2007).
Neuronal autophagy is a cellular process dedicated to the degradation of
cytoplasmic contents, under both normal physiological and pathological
conditions. Disruption in ESCRT‐III mediated auophagy is attributed to toxic
accumulation of protein fragments leading to neurodegeneration (J. A. Lee,
Beigneux, Ahmad, Young, & Gao, 2007), further emphasizing the importance of
the ECSRT‐III pathway to the normal neuronal functioning and maintenance. In
line with these finding, CHMP2B has been previously shown to harbor multiple,
rare pathogenic mutations leading to Frontotemporal dementia (FTD, OMIM:
OMIM: 609512) and Amyotrophic lateral sclerosis (ALS, OMIM: 600795), due to
endosomal trafficking disruption (Urwin, et al., 2010). Further, CHMP2B
mutations in FTD (CHMP2BΔ10 and CHMP2BIntron5) have shown to disrupt the
fusion of endosomes with lysosomes (J. A. Lee & Gao, 2008), leading to
neurodegeneration from perturbation of autophagy (Urwin, Ghazi‐Noori,
Collinge, & Isaacs, 2009). In Alzheimer’s disease, neuronal autophagy seems to
be activated in early stages but is impaired as the disease progresses (Yang et al.,
2011). Overexpression of FTD mutant (CHMP2BIntron5) in neurons trigger a
specific toxic process, leading to dramatic retraction of dendritic trees followed

100
by cell death; this lethality has been linked to excessive accumulation of
autophagosomes, which is similar to the disruption of dendritic spines and
synapsis that occurs in the earliest stages of AD pathogenesis (J. A. Lee,
Beigneux, et al., 2007). Further, CHMP2B co‐localizes with Granulovacuolar
degeneration (GVD) ‐ one of the pathological hallmarks in AD (Funk, et al., 2011;
Yamazaki, et al., 2010).Therefore, excessive accumulation of autophagosomes
due to CHMP2B deletion and subsequent ESCRT‐III dysfunctional could be the
pivotal pathogenic step that eventually causes AD in family NH1. In addition,
unpublished data from our collaborators suggests BACE and γ‐secretase are
present in autophagosome, further supporting the hypothesis that dysregulation
of CHMP2B could play a key role in autophagy disruption and eventually lead
to AD.
The adjacent gene POU1F1 (OMIM: 173110) is reported to cause pituitary
hormone deficiency and is associated with mental retardation (Y. Sun, et al.,
2006; Turton, et al., 2005), further implying role of the deleted loci with
susceptibility to neurodegenerative disorders, as seen in the numerous disorders
associated above with the loci.
101
5.3.2 Role of Loss in KANK1 and DMRT genes leading to AD
The 400 KB deletion showed a partial overlap (59%) with a CNP, and
spanning KN motif and ankyrin repeat domains 1 (KANK1) and doublesex and
mab‐3 related transcription factor genes (DMRT1 and DMRT3) in two affected
subjects (Onset ages: 64 and 65, carrying APOE‐e3,4). The deletion CNV and
APOE‐ε4 do not segregate with the disease individually, but the combination of
both APOE‐ε4 and the CNV segregate in both affecteds. The last age at
examination of subject‐894 (Unaffected, APOE‐ε4 negative, carrying deletion)
was 85, subject‐893 (Unaffected, APOE‐ε4 negative, diploid CN in the locus) was
87, and subject‐385 (unaffected, APOE‐e3,4, diploid CN in the locus) was 71. This
CNV maps to the locus associated with Chromosome 9p deletion syndrome, sex
development and mental retardation ‐ suggesting involvement of the genes in
the loci with neuronal functioning and disorders (Argyriou et al., 2010; Barbaro
et al., 2009). This distal region of chromosome 9p is, and clinical phenotype of
patients with the 9p deletion syndrome (9p24.3 locus, OMIM: 158170)
characterized by mental retardation, trigonocephaly and other dysmorphic
features (Hayashi, et al., 2011).
KANK1 regulates cell migration via inhibition of actin polymerization
(Roy, Kakinuma, & Kiyama, 2009) suggesting a role for KANK1 in tissue
development, although the mechanism of formation of actin stress fibers,
102
especially its signaling cascade, is not fully elucidated. The pathways affected by
loss in KANK1 functionality have been extensively studied in carcinogenesis,
and various neurological disorders including Obsessive‐compulsive disorder
9p24 (Willour et al., 2004), Myeloproliferative disorders (Kralovics et al., 2005),
Cerebral palsy 9p24.3 (Lerer et al., 2005), Monosomy 9p syndrome with Autistic
features (Vinci et al., 2007) etc. The deletion CNV could also influence two other
genes in the 9p24 loci ‐ FOXD4 and DOCK8, could potentially be responsible for
behavioral phenotypes in addition to KANK1 and DMRTs. The DOCK8 gene
was disrupted in two unrelated mental retardation patients (Griggs, Ladd, Saul,
DuPont, & Srivastava, 2008). The DOCK‐family proteins regulate the cytoskeletal
reorganization of the actin filament system (Ruusala & Aspenstrom, 2004).
KANK1 also plays a potential role in cytoskeletal reorganization and neurite
outgrowth (Kakinuma, Roy, Zhu, Wang, & Kiyama, 2008; Roy, et al., 2009).
DMRTs are widely studied for genes and the sexual regulation of the nervous
system and behavior (Matsuda, 2005; Smith & Sinclair, 2004). Although de novo
CNVs and other genetic factors are strongly associated with human disorders of
sexual development (Tannour‐Louet et al., 2010), studies seem to indicate that
the DMRTs influence are not limited to sex differentiation and gonadal
development (Hong, Park, & Saint‐Jeannet, 2007) but also in regulation of
neuronal processes (Yao & Capel, 2005). Overall, there are not enough studies
103
elucidating the genotypic and phenotypic contribution of the DMRT genes in
sexual development and behavior (Calvari et al., 2000; Lerer, et al., 2005),
however there is clear evidence that pathogenic variants influence behavioral
disorders.
In summary, based on the involvement of KANK1 (Kakinuma, Zhu,
Wang, Roy, & Kiyama, 2009) in neurological pathways/disorders, and influence
of DMRT genes on behavior, it is reasonable to speculate that the deletion CNV
in family NH2 spanning the 9p24.3 loci might likely be involved in onset of AD
in the affected subjects.
5.3.3 Role of VLDLR deletion on AD via disruption of Reelin related neuronal
clearance and degradation pathways
Affected subjects (AAO: 62 and 75, APOE‐ε4 positive) in family NH3
carry a 151 KB deletion overlapping an uncharacterized gene FLJ35024, located
46 KB 5’ of Very low density lipoprotein receptor gene (VLDLR), but in close
proximity to affect VLDLR activity (C. Lee & Scherer, 2010; Weterman, et al.,
2010). FLJ35024 gene is not described in public databases, while VLDLR has been
widely studied as a candidate gene in AD (www.alzgene.org), implicated in
various human disorders, and crucial to normal neuronal functioning.
VLDLR belongs to the low density lipoprotein receptor (LDLR) gene
family of cell surface proteins involved in receptor‐mediated endocytosis of
specific ligands. VLDLR is highly homologous to apolipoprotein E receptor 2

104
(ApoER2), another AD associated gene with similar role in normal neuronal
functioning (Beffert, Stolt, & Herz, 2004). Functionaly, VLDLR is also associated
with VLDL‐triglyceride metabolism and Reelin (RELN) signaling pathways
(Forster, et al., 2010). Pathogenic mutations in VLDLR have been reported to
cause VLDLR‐associated cerebellar hypoplasia (Boycott & Parboosingh, 1993),
further emphasizing its importance in pathways associated with cognition and
dementia. VLDLR activity is suggested to directly affect coordinated migration
of neurons, critical in the developing and adult brain for healthy functioning of
the nervous system (Reddy, Connor, Weeber, & Rebeck, 2011). VLDLR has also
been shown to interact with various genes, including numerous other AD
associated genes ‐ for example, APOE, CD36, CLU, DAB1, LPL, LRPAP1, RELN,
SNX17 (C. J. Carter, 2007; Forster, et al., 2010; Jaeger & Pietrzik, 2008; Spalice et
al., 2009), and proposed as one of the functional candidate in AD with important
role in disease pathogenesis.
Importantly, VLDLR and ApoER2 via their interaction with bind to
cytosolic adaptor protein Dab1 and secreted glycoprotein RELN, are critical to
neuronal migration (Bar, Lambert de Rouvroit, & Goffinet, 2000). Loss of RELN
function in humans is shown to cause severe developmental disorder,
lissencephaly and also implicated in many neurological disorders such as
epilepsy, schizophrenia and Alzheimerʹs disease (Senturk, Pfennig, Weiss, Burk,

105
& Acker‐Palmer, 2011). The VLDLR/reelin pathways are shown to affect
hippocampal dendrite development and maturation, memory formation,
autophagy, to name a few (Niu, Renfro, Quattrocchi, Sheldon, & DʹArcangelo,
2004). In addition, dysregulation of VLDLR has been shown to impact neuronal
plasticity in AD mouse models (Herz & Chen, 2006), and modulate tau
phosphorylation C. J. Carter, 2007(Ohkubo et al., 2003) further highlighting the
role of VLDLR in AD pathogenesis.
In summary, based on the reports on genetic and functional studies in
VLDLR, and the novel deletion CNV in family NH3, further studies to elucidate
the effects of CNVs in VLDLR leading to AD could unravel novel AD
pathogenesis pathways.
5.3.4 Role of gain in CDH2 gene on Cadherin signaling, neurogenesis and AD
Two of the three affected subjects (onset age 64 and 65, APOE‐ε4 positive)
in family ND2 show gain in Cadherin‐2 (CDH2) copy number. CDH2 belongs to
the cadherin family genes that encode proteins mediating calcium‐ion‐dependent
cell adhesion. CDH2, also called N‐cadherin or neuronal‐cadherin, is shown to
play an important role in synaptic adhesion, dendritic morphology and neuritic
growth (Aiga, et al., 2011; Lefort, et al., 2011; Malinverno, et al., 2010; Rieger, et
al., 2009; Tan, et al., 2010).

106
Numerous studies report that cadherin family proteins have a critical role
in formation of proper brain structure and connectivity during early
development (Fannon & Colman, 1996; N. Uchida, Honjo, Johnson, Wheelock, &
Takeichi, 1996). In‐vivo and in‐vitro experiments have revealed that cadherins
regulate dendritic spine morphogenesis and related synaptic functions (Togashi
et al., 2002). Cadherins have also been implicated in the induction of long‐term
potentiation (LTP) of hippocampal synaptic strength in a cellular model for
learning and memory (T. C. Wang et al., 2011), which is also implicated in the
early stages of AD. Moreover, NMDA receptor activation, which is critically
required for synaptic plasticity is suggested to provide a signal that regulates the
molecular configuration of synaptic CDH2, and therefore regulate strength of
adhesion across the synaptic cleft (Huntley, Gil, & Bozdagi, 2002; Jungling et al.,
2006). Additionally, there exists at the synapse a pool of surface cadherins that is
untethered to the actin cytoskeleton and capable of a rapid and reversible
dispersion along the plasmalemma under conditions of strong activity (Nose,
Nagafuchi, & Takeichi, 1987). Recent reports also indicate that CDH2 activity is
sensitive to gene dosage (Jossin & Cooper, 2011). The authors report that CDH2
was required for neuronal migration, and partial knockdown or over‐expression
of CDH2 transcript disrupted in neurons whose endocytosis of CDH2 was
blocked, suggesting that excessively high or low levels of surface CDH2

107
dysregulates neuronal migration. Another report from the same group also
suggests involvement of reelin signaling pathway as an extracellular signal that
regulates CDH2 surface localization (Kawauchi et al., 2010), further stressing the
pivotal role that CDH2 might play in neurogenesis.
In addition to its wide‐ranging functional role in neuronal functioning,
previous studies also indicate that gain in CDH2 could have a direct impact on
pathways leading to AD. Altered metabolism of CDH2 results in synaptic
dysfunction, a primary feature of Alzheimerʹs disease (Restituito et al., 2011). It
has also been suggested elsewhere that variation in CDH2 interaction with γ‐
secretase complex (Kopan & Ilagan, 2004) could possibly affect AD onset.
Further, the proteolytic machinery comprising metalloproteases and γ‐secretase,
the key intramembrane aspartyl protease involved in amyloidogenic APP
cleavage and Alzheimerʹs disease, also cleaves several other substrates. Activity‐
dependent substrate cleavage by synaptic metalloproteases and γ‐secretase of
CDH2 is suggested to modify synaptic transmission (Gong et al., 2010). A
number of reports have shown that dimerization of APP modulates Aß
production, and CDH2‐based synaptic contact is tightly linked to Aß production
(Asada‐Utsugi et al., 2011). A recent report also suggests that CDH2 expression
levels affect APP dimerization and metabolism‐ linking synaptic contact and Aß
production (Vunnam & Pedigo, 2011). In neurons, Presenilin 1(PS1)/gamma‐

108
secretase is located at the synapses bound to CDH2 (Uemura et al., 2009),
indicating that CDH2‐mediated synaptic adhesion might also directly modulate
Aβ secretion as well as the Aβ‐42/40 ratio via PS1/CDH2 interactions. The
authors suggest that CDH2 might regulate the adhesive force that mediates and
stabilizes the attraction between neuritis (Giagtzoglou, Ly, & Bellen, 2009).
Abnormal expression of CDH2 is also associated to invasiveness and metastasis
in cancer cells by affecting cell motility (Vunnam & Pedigo, 2011).
Overall, Neural cadherin or CDH2 plays a crucial role in modeling
synaptic architecture, and modifying the strength of the synaptic signal, playing
a crucial role in modulating synaptic structure, function, and plasticity, which
extends beyond initial growth and development. To our knowledge, this is the
first risk variant in CDH2 reported to date, and considering the vital involvement
of CDH2 with neuronal pathways associated with AD, the effects of gain in
CDH2 copy number should be further studied for the precise mechanism leading
to EOAD.
5.3.5 Implication of CNV in ADHD and dopaminergic system associated loci
in AD
Two affected individuals (Onset age: 37 and 63, APOE‐ε4 positive, no
unaffected subjects) in family ND3 show presence of a 550 Kb duplication. The
CN gain segment overlaps and extends beyond CNPs reported in DGV and

109
harbors multiple small segments of CNPs around the breakpoint indicating
susceptibility of the locus to CN changes. The CNV is located in the intergenic
region with LPHN3 (0.65 Mb centromeric), SRD5A2L2 (1.1 Mb telomeric) and
EPHA5 (2.1 Mb telomeric) in close proximity.
LPHN3 belongs to the gene family Latrophilins, which were initially
discovered for their role as receptors for a‐latrotoxin (a‐LTX), a potent neurotoxin
isolated from black widow spider venom (Davletov, Shamotienko, Lelianova,
Grishin, & Ushkaryov, 1996; Lelianova et al., 1997). Latrophilins are a relatively
new family of G protein‐coupled receptors of unknown native physiological
function, but extensive research has been done on their participation in inducing
secretion of neurotransmitters and hormones in their target cells via stimulating
exocytosis (Davletov et al., 1998; Rahman et al., 1999; Silva, Liu‐Gentry, Dickey,
Barnett, & Misler, 2005). Although functionally LPHN3 is not fully understood,
other than its role as receptor involved in inducing release of neurotransmitters,
it is widely implicated in ADHD onset, characterized by hyper‐functioning
dopamine system. One study reports that LPHN3 is expressed in regions of the
brain most affected in ADHD – the amygdala, caudate nucleus, pontine nucleus,
putamen, hippocampus, cerebral cortex, and cerebellar Purkinje cells (Jain et al.,
2007; Krain & Castellanos, 2006). It is hypothesized that ADHD could occur due
to the dysregulation of neurotransmission in these brain structures, which
110
participate in three of the four main dopaminergic systems in the brain(Russell,
Sagvolden, & Johansen, 2005). In line with the previous study, another recent
report also suggests that genes in 11q loci are involved in a cooperative
interaction with LPHN3 doubling the risk for ADHD (Jain et al., 2011).
Dopaminergic systems have been implicated previously in AD
pathogenesis and progression (Martorana, Esposito, & Koch, 2010), and changes
in LPHN3 activity on synaptic activity could provide further evidence for its role
in AD onset, if any. In addition, LPHN3 dysregulation increasing susceptibility
to ischemia (especially in hippocampus), which has been linked to increase in
vulnerability to neurodegeneration (Bin Sun, Ruan, Xu, & Yokota, 2002). In
summary, the reports we found in our literature survey suggest that gain in the
LPHN3 locus could affect neurotransmission in AD affected brain regions, and
further functional evidence could elucidate if the CNV triggers a pathogenic
mechanism leading to AD.
For literature review on functional implications of EPHA5, please refer to
the discussion on EPHA6 gain in family ND6. SRD5A2L2 also termed as TECRL
and synaptic 2‐like protein is not fully characterized, however we will continue
to investigate possible effects of the gain in the locus in the gene in leading to AD
pathogenesis.

111
5.3.6 Role of CNV in Ephrin receptor gene EPHA6 on synaptogenesis and AD
The two affected APOE‐ε4 positive subjects in family ND6 (onset age: 64
and 69) carry a 0.73 Mb intergenic gain CNV. Eph receptor A6 (EPHA6) gene is
located 0.33 Mb telomeric and the only gene in close proximity. Ephrins or Eph
receptors are a family of receptor protein‐tyrosine kinases that are implicated in
regulating neuronal axon guidance and in patterning of the developing nervous
system, in addition to serving towards a patterning and compartmentalization
role outside of the nervous system (Wilkinson, 2000). Eph receptors and ephrins
mediate cell‐contact‐dependent repulsion, and modulate the cellular response
via activation of actin cytoskeleton (Lai & Ip, 2009). Eph receptors and ephrins
have thus emerged as key regulators of the repulsion and adhesion of cells that
underlie the establishment, maintenance, and remodeling of patterns of cellular
organization ‐ including synaptogenesis and spine morphogenesis (Mellitzer, Xu,
& Wilkinson, 1999). Hence Eph ligands and their cognate Eph receptors have
been studied in great detail for their role in axonal guiding during neural
development and later participate in activity‐dependent structural plasticity and
in long‐term changes in synaptic strength ‐ which are the cellular basis for
learning and memory (Klein, 2009). Specifically, EPHA6 is highly expressed in
the brain and shown to play a crucial role in forming such neuronal networks
(Orioli & Klein, 1997). Contradicting the CN gain seen in the affecteds, learning

112
and memory impairment has been observed in EPHA6 knock‐out mice
(Savelieva, et al., 2008), however it does not exclude the possibility of CNV
induced EPHA6 dysregulation.
In AD, early changes in hippocampal Eph receptors have been shown to
precede the onset of memory decline in mouse models of Alzheimerʹs disease
(Simon et al., 2009). Alterations in the Eph receptors in aging AD mice were
suggested to play a role in synaptic dysfunction in the hippocampus leading to
cognitive impairment, indicating that Eph receptors could influence cognitive
impairment. In addition, another cell‐adhesion associated gene, disintegrin and
metalloproteinase domain‐containing protein 10 (ADAM‐10), is a principal
player in signalling via the Notch and Eph/ephrin pathways. Mutations in the
gene were shown to increase α‐secretase activity that lead to AD (M. Kim et al.,
2009). The functional ADAM metalloproteinases are involved in ʺectodomain
sheddingʺ of diverse growth factors, cytokines, receptors and adhesion
molecules (Edwards, Handsley, & Pennington, 2008), and EPHA6 involvement
with ADAM10 activity further highlights the importance of Eph receptor activity
in synapses.
In addition, several GWAS report association of the loci with a variety of
phenotypes, including: longevity (Sebastiani, et al., 2010), risperidone response in
schizophrenic subjects (Ikeda, et al., 2010), obesity (Glessner, et al., 2010) and

113
male infertility (Aston & Carrell, 2009). These reports indicate that the genes in
the locus might have a range of phenotypic contributions, and a large CNV could
likely confer a phenotypic effect. Based on the above studies, studies of
perturbation in Eph pathways leading to synaptic dysfunction and AD could
further confirm or refute any pathogenic effects of a CNV in EPHA6.
5.4 CNVs in families negative for APOE‐ε4 genotype
5.4.1 Role of deletion in Ataxin related neurodegeneration loci and AD
pathogenesis
Both of the affected individuals in this family (Onset age: 56 and 68,
APOE‐ε4 negative, no unaffecteds) carry a 110 Kb deletion in an intergenic
region of 16p13.2. The CNV does not encompass genes but ataxin 2‐binding
protein 1 (A2BP1) is located 0.3 Mb telomeric and 4‐aminobutyrate
aminotransferase (ABAT) is located 0.57 Mb centromeric to the CNV breakpoint
identified using the array data. Both A2BP1 and ABAT are associated with
various neuronal pathways and associated with aging and neurodegenerative
diseases.
A2BP1 is a RNA‐binding protein (Ma, et al., 2010) involved in regulating
tissue‐specific alternative splicing by binding the RNA cis‐regulatory element
UGCAUG (Kuroyanagi, 2009). A2BP1 regulates alternative splicing of tissue‐
specific exons by binding to the hexanucleotide UGCAUG through its RNA
114
recognition motif, and is shown to have an important role in neuron‐specific
splicing (C. Zhang et al., 2008). In addition to binding the UGCAUG splicing
motif, A2BP1 is a binding partner for the ATXN2 protein (Lastres‐Becker, Rub, &
Auburger, 2008; Lessing & Bonini, 2008), implicated in spinocerebellar ataxia
type 2 (SCA2), which also contains predicted RNA binding and RNA splicing
motifs, further affirming the role of the gene family in mRNA degradation and
regulating translation (van de Loo, Eich, Nonis, Auburger, & Nowock, 2009).
Studies also suggest a role for A2BP1 in embryogenesis as well as in the adult
nervous system, possibly mediated by a function in RNA distribution or
processing (Kiehl, Shibata, Vo, Huynh, & Pulst, 2001). A2BP1 is predominantly
expressed brain, transcripts were found in various regions of the CNS including
cerebellum, cerebral cortex, brain stem, and thalamus/hypothalamus, specifically
in the cytoplasm of Purkinje cells and dentate neurons in a punctate pattern
(Shibata, Huynh, & Pulst, 2000; Underwood, Boutz, Dougherty, Stoilov, & Black,
2005), further highlighting its ubiquitous role in neuronal transcript‐splicing.
ATXN2, the A2BP1 ligand, is also implicated as an important risk factor
for ALS and progressive supranuclear palsy (Ross et al., 2011), indicating that
ATXN2 may predispose to other neurodegenerative diseases. Similarly, A2BP1
has been implicated in numerous neuronal disorders, and hypothesized to have
an important role in a hypothesized ‘ataxin‐1‐induced neurodegenerative
115
diseases’ (Fernandez‐Funez et al., 2000). It is postulated that by protein folding
and protein clearance pathways are dysregulated, and with aging lead to
neurodegeneration. A2BP1 is also proposed as a plausible candidate gene in
Autism (Bauman & Kemper, 2005) as well. Postmortem studies of brains from
individuals with autism have shown neuroanatomic abnormalities of the
cerebellum and limbic system, including the hippocampus.
ATXN1 was identified in our study as a risk factor in AD onset (C. Zhang
et al., 2010) by increasing beta‐secretase processing of beta‐amyloid precursor
protein. Data also suggests that the interaction between AD candidate gene APP
like protein 2 (APLP2) and ataxin‐7, and proteolytic processing of APLP2 may
contribute to the pathogenesis of SCA7 (Takahashi‐Fujigasaki et al., 2011). These
findings suggest the possibility of hitherto unknown role of A2BP1 (and possibly
ATXN2) could modulate AD susceptibility. Reduced A2BP1expression also
results in impaired long‐term potentiation (Huynh, Maalouf, Silva, Schweizer, &
Pulst, 2009), and thus could have an important role in triggering the synaptic
cascade of AD related pathways.
The other gene in close proximity to the CNV ‐ ABAT, is responsible for
catabolism of gamma‐aminobutyric acid (GABA), an important, mostly
inhibitory neurotransmitter in the central nervous system, into succinic
semialdehyde. GABA is ubiquitously detected in brain and estimated to be

116
present in nearly one‐third of human synapses. ABAT deficiency phenotype
includes psychomotor retardation, hypotonia, hyperreflexia, lethargy, refractory
seizures, and EEG abnormalities (Dickstein et al., 2007). ABAT mediated
inhibitory responses and action potential firing rates are also significantly
increased with age, suggesting that age‐related neuronal dysfunction, which
must underlie observed decline in cognitive function, could include alterations in
receptors, loss of dendrites, and spines and myelin dystrophy, as well as the
alterations in synaptic transmission. These alterations in the brain are suggested
to constitute the substrate for age‐related loss of cognitive function. The
balancing effects on excitatory (glutamate) and inhibitory (GABA) transmission‐‐
in a synapse‐specific manner could be altered due to the CNV in ABAT, affecting
LTP and memory processes. Moreover, the roles of neurotransmitter systems are
considered important in neurogenesis and could implicate ABAT dysregulation
leading to AD pathogenesis (Young, Taylor, & Bordey, 2011).
5.4.2 Role of deletion spanning an uncharacterized metallopeptidase in EOAD
The two affected members in family ND4 showing onset ages of 40 and 42
years (APOE‐ε4 negative, no unaffecteds) carry a 124 Kb deletion overlapping
endoplasmic reticulum metallopeptidase (ERMP1) and predicted transcript
CIP150 (KIAA1432). ERMP1 (Fxna in mice) was identified recently (Garcia‐
Rudaz et al., 2007) and is not characterized to a great extent. However, two

117
studies available on pubmed suggest that ERMP1 activity is detected in brain.
One study on proteome alterations in transgenic AD mouse model showed
decrease in ERMP1 expression (Martin, et al., 2008) without any further
information on functional implications. Another study reported a slightly higher
expression in epilepsy mouse models (Bergren, et al., 2009). Nevertheless, based
on the ages of onset in affected individuals, and without any other known
pathogenetic factors to explain the early‐onset form of AD in the family, we have
undertaken in‐vitro and in‐vivo studies to elucidate the role of ERMP1 deletion
on APP processing pathways to identify any pathogenic effects leading to AD.
5.4.3 Role of CRMP1 CNV on Semaphorin‐3A associated neuronal assembly
and migration in EOAD
Both affected individuals (Onset age: 52 and 56, APOE‐ε4 negative) in
family ND5 carry 240 Kb gain, overlapping two genes that cause Ellis‐Van
Creveld syndrome (OMIM: 225500) – EVC, EVC2, and another gene collapsin
response mediator protein‐1 (CRMP1). Mutations in EVCs cause Ellis‐Van
Creveld syndrome (EvC, OMIM: 225500) and Weyers acrofacial dysostosis
(WAD, OMIM: 193530) – by different mutations in EVC and EVC2. EvC
syndrome is an autosomal recessive skeletal dysplasia characterized by short
limbs, short ribs, postaxial polydactyly, and dysplastic nails and teeth, with
congenital cardiac defects, while WAD shows autosomal dominant inhertiance of

118
pathogenic alleles, prompting the authors to conclude that these disorders are
allelic conditions (Baujat & Le Merrer, 2007; Ruiz‐Perez et al., 2000). Studies
revealed that cilia‐mediated Hedgehog (Hh) signaling defects in the absence of
EvC (Valencia et al., 2009) leads to the phenotypic abnormality, thus arriving to a
conclusion that EvC and WAD result from tissue specific disruption of the
response to Hh ligands (Ruiz‐Perez & Goodship, 2009).
On the other hand CRMP1 shows closer involvement in functional
pathways that are associated with AD. CRMP1 is highly expressed in the brain
(Schmidt & Strittmatter, 2007), and is widely studied for its interaction with
semaphorin‐3A (SEMA3A). SEMA3A is a secreted protein member belonging to
the semaphorin family and is involved with and its role in neural growth and
axonal guidance (Fukada, et al., 2000; Kurnellas, et al., 2010; Mukherjee, et al.,
2009; Yamashita, et al., 2006). SEMA3A functions both, as either a chemo‐
repulsive agent, inhibiting axonal outgrowth; or as a chemo‐attractive agent
stimulating the growth of apical dendrites and vital for normal neuronal pattern
development (Schmidt & Strittmatter, 2007).
Studies show that CRMP1 regulates neuronal migration and patterning by
mediating Reelin signaling pathway (Yamashita, et al., 2006). Reelin signaling
pathways seem to appear in a functionally related manner (three put of nine
CNVs) in our analysis, suggesting that disruption of a common pathway

119
involved in synaptogenesis could be the underlying cause of EOAD.
Importantly, CRMP1 knockout mice showed defects in neuronal migration that
were not compensated by other CRMP family genes (Buel, Rush, & Ballif, 2010),
further emphasizing their key role in synaptogenesis.
Moreover, knock‐down in CRMP1 promoted death of spinal cord neurons
(Kurnellas, et al., 2010) and overall neuronal loss (Deo et al., 2004) suggesting
that CRMP1 might play an important role in neuronal regeneration. CRMPs are
also reported to modulate microtubule assembly (Kieran & Greensmith, 2004)
and reorganization of actin filaments and axonal protein trafficking (Yuasa‐
Kawada et al., 2003) indicating that CRMP1 dysregulation could also cause
degeneration in healthy neurons. CRMP1 involvement in sema 3A‐induced spine
development in the cerebral cortex was shown to be regulated by
phosphorylation of CRMP1 by Cdk5 (Yamashita et al., 2007). In Alzheimer’s
mouse models, disruption of sequential phosphorylation of CRMPs, an
important process of SEMA3A signaling, was postulated to cause the
pathological aggregation of the microtubule‐associated proteins (Y. Uchida et al.,
2005). Further, CRMP2 hyperphosphorylation is reported to be characteristic of
Alzheimerʹs Disease but not a common feature in other neurodegenerative
diseases (Williamson et al., 2011). Furthermore, abnormal phosphorylation of
CRMPs specific to AD and independent of the APP processing and Aβ
120
neurotoxicity could also indicate that dysregulation in CRMPs is an early event
in AD pathogenesis, possibly caused by disruption in neuritic growth (Good et
al., 2004).
In summary, based on our background research, CRMP1 seems to be
highly plausible candidate gene for further studies to unravel its role in
perturbances in neuronal development via disruption of axonal growth and
guidance. Further studies are required to understand the functional implication
of CNV in leading to AD, possibly by neurodegeneration induced by neuronal
collapse, or indirectly by abrogating the recovery capabilities of the aging
neurons.
5.5 Final Remarks
In summary, the CNVs identified in our study are consistent with reports
suggesting occurrence of CNVs in higher frequency in region harboring genes
associated with brain functions (Cooper, et al., 2007; Henrichsen, et al., 2009; J. A.
Lee & Lupski, 2006). Similar to many of the CNV studies in the recent
publications (Conrad, et al., 2010; C. Lee & Scherer, 2010), the strongly suggestive
functional role of genes underlying these rare CNVs justify further in‐depth
functional studies to unravel their roles in AD pathogenesis. However, owing to
the limited understanding of the complexities of functional implication of CNVs
in the genome, elucidating the role of these rare CNVs and underlying genes will

121
require creative solutions in unraveling their role in the disease onset. In
addition, further CNV analysis in larger cohorts (Cook & Scherer, 2008;
Stankiewicz & Lupski, 2010; Vassos, et al., 2010) could identify the minimal
pathogenic segment that modifying susceptibility to AD.
5.6 Future directions
In humans, CNVs are reported to occur in higher frequency in genes/loci
associated with brain functions (Cooper, et al., 2007; Henrichsen, et al., 2009; J. A.
Lee & Lupski, 2006); thus, our results are in concordance with these observations.
Nonetheless, significant enrichment of genes specific to certain processes and
pathways, such as, olfactory receptors, signal transduction, immune functions
are also commonly reported in various populations (Fanciulli et al., 2007;
Gonzalez, et al., 2005; Hasin‐Brumshtein, Lancet, & Olender, 2009; Hasin et al.,
2008; McKinney et al., 2010). Therefore, further in‐depth CNV analysis using
higher‐resolution data to further our understanding on the genomic re‐
arrangements holds a vast potential in revealing hitherto unknown AD genetic
factors. In addition to extending CNV analysis to larger AD cohorts, using newer
high‐resolution genotyping/sequencing platforms to investigate smaller CNV
segments should be taken into consideration. Expanding the study to include
smaller CNV segments hold potential to unraveling complex re‐arrangemnts in
the CNV loci (Frazer, Murray, Schork, & Topol, 2009). However the downside of
122
the strategy similar to other high‐throughput assays is the large number of ‘hits’
that will need confirmation and validation (Conrad, et al., 2010; Gautam, et al.,
2011; Klopocki & Mundlos, 2011; C. Lee & Scherer, 2010).
In summary, the CNV analyses reported in this study represent the first
comprehensive and systematic investigation for presence of pathogenic CNVs in
AD. Similar to many of the recent CNV studies, additional studies are required
to confirm the pathogenic role of the novel CNVs identified here. Considering
the low prevalence of the CNVs, functional evidence to unravel the consequences
of CNVs on gene expression and associated pathways are essential to further
corroborate our findings. Lastly, these results highlight the importance of the role
of rare CNVs in explaining the missing heritability of widely prevalent complex
disorders like AD.

123
Tables
Table 5‐1: Summary of rare CNVs in human disorders that led to the
identification of the underlying gene defect
Locus CNV Target gene Disorder References
1q21.3 Dosage effect LCE3C, LCE3B Psoriasis (de Cid et al., 2009)
2q31‐q32 Dup HOXD Mesomelic dysplasia (Kantaputra et al., 2010)
2q35 Dup IHH Syndactyly type 1 (Klopocki et al., 2011)
4q21 Dup, Trip SNCA Parkinson disease (Polymeropoulos et al.,
1996)
5q13 Del, Dup SMN1,SMN2 Spinal muscular
atrophy (Lefebvre et al., 1995)
5q23.2 Dup LMNB1 Autosomal dominant
leukodystrophy (Padiath et al., 2006)
5q35.3 Dominant del. NSD1 Sotos syndrome (Visser et al., 2005)
7q11.23 Del Multiple Williams‐Beuren
syndrome. (Peoples et al., 2000)
7q36 Dup SHH Polysyndactyly
syndrome (Wieczorek et al., 2010)
8q12.1 Dominant del. CHD7 CHARGE syndrome (Vissers et al., 2004)
15q11.q12 Del (Mat.) UPD15 Angelman syndrome; (Matsuura et al., 1997)
15q11.q12 Del (Pat.) Multiple Prader‐Willi syndrome; (Amos‐Landgraf et al., 1999)
16p13.3 Dominant del. TSC1, TSC2 Tuberous sclerosis (Kozlowski et al., 2007)
17p11.2 Del RAI1 Smith‐Magenis
syndrome (K. S. Chen et al., 1997)
17p11.2 Dup Multiple Post Tubal Ligation
Syndrome (Potocki et al., 2007)
17p12 Dup PMP22 Charcot‐Marie‐Tooth (Chance et al., 1994)
17p12 Del PMP22 Hereditary neuropathy (Reiter et al., 1996)
17p13.3 Del LIS1 Miller‐Dieker
syndrome; (Cardoso et al., 2003)
17q11.2 Dominant del NF1 Neurofibromatosis 1 (De Luca et al., 2007)
17q12 Multiallelic
effects CCL3L1
HIV/AIDS susceptibility
and multiple diseases
(Burns et al., 2005; Gonzalez,
et al., 2005)
17q24.2 Dup Intergenic Hypertrichosis
terminalis (M. Sun et al., 2009)
17q24.3 Dup Intergenic Female‐to‐male sex
reversal
(Cox, Willatt, Homfray, &
Woods, 2011)
17q24.3 Del, Dup SOX9 Cooks syndrome (Kurth et al., 2009)
20p12 Dup BMP2 Brachydactyly type A2 (Dathe et al., 2009)
21q21 Dup APP Alzheimer disease (McNaughton, et al., 2010)
22q11.2 Del TBX1 DiGeorge syndrome (Edelmann et al., 1999)

124
Table 1: Contd.
Locus CNV Target gene Disorder References
Multiple Complex Multiple Bipolar disorder (Alaerts & Del‐Favero,
2009)
Multiple Complex Multiple Autism (Sanders, et al., 2011)
Multiple Complex Multiple Schizophrenia (Vacic, et al., 2011)
Multiple Complex Multiple ADHD (Williams et al., 2010)
Xp Del SHOX L´eri–Weill
dyschondrosteosis (J. Chen et al., 2009)
Xp21.1 Recessive del. DMD Duchenne/Becker
muscular dystrophy
(Stockley, Akber,
Bulgin, & Ray, 2006)
Xp21.2 Del DAX1 Sex reversal (Smyk et al., 2007)
Xq22.2 Dup, Del PLP1 Pelizaeus‐Merzbacher
syndrome (J. A. Lee et al., 2006)
Xq28 Del MECP2 Rett syndrome (Amir et al., 1999)
Abbreviations: Dup, duplication or gain in copy number (CN); del, deletion or loss in CN; trip, triplication
gain CN with four copies of gene/loci; Complex, complex re‐arrangements; mat, maternal; pat, paternal.

125
LIST OF REFERENCES
ADFTD. (2008). Alzheimer Disease & Frontotemporal Dementia Mutation Database ADFTD. Retrieved 02/13/2008: http://www.molgen.ua.ac.be/ADMutations/default.cfm?MT=1&ML=0&Page=ADMDB
Aiga, M., Levinson, J. N., & Bamji, S. X. (2011). N‐cadherin and neuroligins cooperate to regulate synapse formation in hippocampal cultures. J Biol Chem, 286(1), 851‐858.
Alaerts, M., & Del‐Favero, J. (2009). Searching genetic risk factors for schizophrenia and bipolar disorder: learn from the past and back to the future. Hum Mutat, 30(8), 1139‐1152.
Alkan, C., Coe, B. P., & Eichler, E. E. (2011). Genome structural variation discovery and genotyping. Nat Rev Genet, 12(5), 363‐376.
Alkan, C., Kidd, J. M., Marques‐Bonet, T., Aksay, G., Antonacci, F., Hormozdiari, F., et al. (2009). Personalized copy number and segmental duplication maps using next‐generation sequencing. Nat Genet, 41(10), 1061‐1067.
Alzheimer's. (2009). AD International, World Alzheimer Report., from Alzheimer’s disease International, London: http://www.alz.co.uk/
Alzheimer's. (2010). Alzheimer’s Association ‐ Facts and Figures. http://www.alz.org/ Amir, R. E., Van den Veyver, I. B., Wan, M., Tran, C. Q., Francke, U., & Zoghbi, H. Y. (1999). Rett
syndrome is caused by mutations in X‐linked MECP2, encoding methyl‐CpG‐binding protein 2. Nat Genet, 23(2), 185‐188.
Amos‐Landgraf, J. M., Ji, Y., Gottlieb, W., Depinet, T., Wandstrat, A. E., Cassidy, S. B., et al. (1999). Chromosome breakage in the Prader‐Willi and Angelman syndromes involves recombination between large, transcribed repeats at proximal and distal breakpoints. Am J Hum Genet, 65(2), 370‐386.
Argyriou, L., Hiort, O., Meinecke, P., Wunsch, L., Volleth, M., Hinrichs, F., et al. (2010). A de novo unbalanced translocation leading to partial monosomy 9p23‐pter and partial trisomy 15q25.3‐qter associated with 46,XY complete gonadal dysgenesis, tall stature and mental retardation. Clin Dysmorphol, 19(4), 190‐194.
Asada‐Utsugi, M., Uemura, K., Noda, Y., Kuzuya, A., Maesako, M., Ando, K., et al. (2011). N‐cadherin enhances APP dimerization at the extracellular domain and modulates Abeta production. J Neurochem.
Aston, K. I., & Carrell, D. T. (2009). Genome‐wide study of single‐nucleotide polymorphisms associated with azoospermia and severe oligozoospermia. J Androl, 30(6), 711‐725.
Athan, E. S., Lee, J. H., Arriaga, A., Mayeux, R. P., & Tycko, B. (2002). Polymorphisms in the promoter of the human APP gene: functional evaluation and allele frequencies in Alzheimer disease. Arch Neurol, 59(11), 1793‐1799.
Babst, M., Katzmann, D. J., Estepa‐Sabal, E. J., Meerloo, T., & Emr, S. D. (2002). Escrt‐III: an endosome‐associated heterooligomeric protein complex required for mvb sorting. Dev Cell, 3(2), 271‐282.
Bar, I., Lambert de Rouvroit, C., & Goffinet, A. M. (2000). The Reelin signaling pathway in mouse cortical development. Eur J Morphol, 38(5), 321‐325.
Barbaro, M., Balsamo, A., Anderlid, B. M., Myhre, A. G., Gennari, M., Nicoletti, A., et al. (2009). Characterization of deletions at 9p affecting the candidate regions for sex reversal and deletion 9p syndrome by MLPA. Eur J Hum Genet, 17(11), 1439‐1447.

126
Bassett, A. S., Scherer, S. W., & Brzustowicz, L. M. (2010). Copy number variations in schizophrenia: critical review and new perspectives on concepts of genetics and disease. Am J Psychiatry, 167(8), 899‐914.
Baujat, G., & Le Merrer, M. (2007). Ellis‐van Creveld syndrome. Orphanet J Rare Dis, 2, 27. Bauman, M. L., & Kemper, T. L. (2005). Neuroanatomic observations of the brain in autism: a
review and future directions. Int J Dev Neurosci, 23(2‐3), 183‐187. Beckmann, J. S., Estivill, X., & Antonarakis, S. E. (2007). Copy number variants and genetic
traits: closer to the resolution of phenotypic to genotypic variability. Nat Rev Genet, 8(8), 639‐646.
Beecham, G. W., Martin, E. R., Li, Y. J., Slifer, M. A., Gilbert, J. R., Haines, J. L., et al. (2009). Genome‐wide association study implicates a chromosome 12 risk locus for late‐onset Alzheimer disease. Am J Hum Genet, 84(1), 35‐43.
Beffert, U., Stolt, P. C., & Herz, J. (2004). Functions of lipoprotein receptors in neurons. J Lipid Res, 45(3), 403‐409.
Bentley, D. R., Balasubramanian, S., Swerdlow, H. P., Smith, G. P., Milton, J., Brown, C. G., et al. (2008). Accurate whole human genome sequencing using reversible terminator chemistry. Nature, 456(7218), 53‐59.
Bergren, S. K., Rutter, E. D., & Kearney, J. A. (2009). Fine mapping of an epilepsy modifier gene on mouse Chromosome 19. Mamm Genome, 20(6), 359‐366.
Bertram, L. (2008). AlzGene ‐ Published AD Candidate Genes. Retrieved 02/13/2008: http://www.AlzGene.org
Bertram, L. (2011). Alzheimer's Genetics in the GWAS Era: A Continuing Story of 'Replications and Refutations'. Curr Neurol Neurosci Rep, 11(3), 246‐253.
Bertram, L., Hiltunen, M., Parkinson, M., Ingelsson, M., Lange, C., Ramasamy, K., et al. (2005). Family‐based association between Alzheimer's disease and variants in UBQLN1. N Engl J Med, 352(9), 884‐894.
Bertram, L., Lange, C., Mullin, K., Parkinson, M., Hsiao, M., Hogan, M. F., et al. (2008). Genome‐wide association analysis reveals putative Alzheimer's disease susceptibility loci in addition to APOE. Am J Hum Genet, 83(5), 623‐632.
Bertram, L., Lill, C. M., & Tanzi, R. E. (2010). The genetics of Alzheimer disease: back to the future. Neuron, 68(2), 270‐281.
Bertram, L., McQueen, M. B., Mullin, K., Blacker, D., & Tanzi, R. E. (2007). Systematic meta‐analyses of Alzheimer disease genetic association studies: the AlzGene database. Nat Genet, 39(1), 17‐23.
Bertram, L., Schjeide, B. M., Hooli, B., Mullin, K., Hiltunen, M., Soininen, H., et al. (2008). No association between CALHM1 and Alzheimer's disease risk. Cell, 135(6), 993‐994; author reply 994‐996.
Bettens, K., Brouwers, N., Engelborghs, S., Van Miegroet, H., De Deyn, P. P., Theuns, J., et al. (2009). APP and BACE1 miRNA genetic variability has no major role in risk for Alzheimer disease. Hum Mutat, 30(8), 1207‐1213.
Bin Sun, H., Ruan, Y., Xu, Z. C., & Yokota, H. (2002). Involvement of the calcium‐independent receptor for alpha‐latrotoxin in brain ischemia. Brain Res Mol Brain Res, 104(2), 246‐249.
Blacker, D., Bertram, L., Saunders, A. J., Moscarillo, T. J., Albert, M. S., Wiener, H., et al. (2003). Results of a high‐resolution genome screen of 437 Alzheimer's disease families. Hum Mol Genet, 12(1), 23‐32.

127
Blacker, D., Haines, J. L., Rodes, L., Terwedow, H., Go, R. C., Harrell, L. E., et al. (1997). ApoE‐4 and age at onset of Alzheimer's disease: the NIMH genetics initiative. Neurology, 48(1), 139‐147.
Boycott, K. M., & Parboosingh, J. S. (1993). Braak, H., & Braak, E. (1991). Neuropathological stageing of Alzheimer‐related changes. Acta
Neuropathol, 82(4), 239‐259. Brouwers, N., Sleegers, K., Engelborghs, S., Bogaerts, V., Serneels, S., Kamali, K., et al. (2006).
Genetic risk and transcriptional variability of amyloid precursor protein in Alzheimer's disease. Brain, 129(Pt 11), 2984‐2991.
Brouwers, N., Van Cauwenberghe, C., Engelborghs, S., Lambert, J. C., Bettens, K., Le Bastard, N., et al. (2011). Alzheimer risk associated with a copy number variation in the complement receptor 1 increasing C3b/C4b binding sites. Mol Psychiatry.
Buel, G. R., Rush, J., & Ballif, B. A. (2010). Fyn promotes phosphorylation of collapsin response mediator protein 1 at tyrosine 504, a novel, isoform‐specific regulatory site. J Cell Biochem, 111(1), 20‐28.
Burns, J. C., Shimizu, C., Gonzalez, E., Kulkarni, H., Patel, S., Shike, H., et al. (2005). Genetic variations in the receptor‐ligand pair CCR5 and CCL3L1 are important determinants of susceptibility to Kawasaki disease. J Infect Dis, 192(2), 344‐349.
Bush, A. I., & Tanzi, R. E. (2008). Therapeutics for Alzheimer's disease based on the metal hypothesis. Neurotherapeutics, 5(3), 421‐432.
Calvari, V., Bertini, V., De Grandi, A., Peverali, G., Zuffardi, O., Ferguson‐Smith, M., et al. (2000). A new submicroscopic deletion that refines the 9p region for sex reversal. Genomics, 65(3), 203‐212.
Cardoso, C., Leventer, R. J., Ward, H. L., Toyo‐Oka, K., Chung, J., Gross, A., et al. (2003). Refinement of a 400‐kb critical region allows genotypic differentiation between isolated lissencephaly, Miller‐Dieker syndrome, and other phenotypes secondary to deletions of 17p13.3. Am J Hum Genet, 72(4), 918‐930.
Carrasquillo, M. M., Zou, F., Pankratz, V. S., Wilcox, S. L., Ma, L., Walker, L. P., et al. (2009). Genetic variation in PCDH11X is associated with susceptibility to late‐onset Alzheimer's disease. Nat Genet, 41(2), 192‐198.
Carter, C. J. (2007). Convergence of genes implicated in Alzheimer's disease on the cerebral cholesterol shuttle: APP, cholesterol, lipoproteins, and atherosclerosis. Neurochem Int, 50(1), 12‐38.
Carter, N. P. (2007). Methods and strategies for analyzing copy number variation using DNA microarrays. Nat Genet, 39(7 Suppl), S16‐21.
Chance, P. F., Abbas, N., Lensch, M. W., Pentao, L., Roa, B. B., Patel, P. I., et al. (1994). Two autosomal dominant neuropathies result from reciprocal DNA duplication/deletion of a region on chromosome 17. Hum Mol Genet, 3(2), 223‐228.
Chartier‐Harlin, M. C., Kachergus, J., Roumier, C., Mouroux, V., Douay, X., Lincoln, S., et al. (2004). Alpha‐synuclein locus duplication as a cause of familial Parkinson's disease. Lancet, 364(9440), 1167‐1169.
Chen, J., Wildhardt, G., Zhong, Z., Roth, R., Weiss, B., Steinberger, D., et al. (2009). Enhancer deletions of the SHOX gene as a frequent cause of short stature: the essential role of a 250 kb downstream regulatory domain. J Med Genet, 46(12), 834‐839.
Chen, K. S., Manian, P., Koeuth, T., Potocki, L., Zhao, Q., Chinault, A. C., et al. (1997). Homologous recombination of a flanking repeat gene cluster is a mechanism for a common contiguous gene deletion syndrome. Nat Genet, 17(2), 154‐163.

128
Conrad, D. F., Pinto, D., Redon, R., Feuk, L., Gokcumen, O., Zhang, Y., et al. (2010). Origins and functional impact of copy number variation in the human genome. Nature, 464(7289), 704‐712.
Cook, E. H., Jr., & Scherer, S. W. (2008). Copy‐number variations associated with neuropsychiatric conditions. Nature, 455(7215), 919‐923.
Cooper, G. M., Nickerson, D. A., & Eichler, E. E. (2007). Mutational and selective effects on copy‐number variants in the human genome. Nat Genet, 39(7 Suppl), S22‐29.
Cox, J. J., Willatt, L., Homfray, T., & Woods, C. G. (2011). A SOX9 duplication and familial 46,XX developmental testicular disorder. N Engl J Med, 364(1), 91‐93.
Cruts, M. (2009). Alzheimer Disease & Frontotemporal Dementia Mutation Database. http://www.molgen.ua.ac.be/ADMutations/
Cruts, M., & Brouwers, N. (1998). Alzheimer Disease & Frontotemporal Dementia Mutation Database. Retrieved 03.21.2011:
Dathe, K., Kjaer, K. W., Brehm, A., Meinecke, P., Nurnberg, P., Neto, J. C., et al. (2009). Duplications involving a conserved regulatory element downstream of BMP2 are associated with brachydactyly type A2. Am J Hum Genet, 84(4), 483‐492.
Davletov, B. A., Meunier, F. A., Ashton, A. C., Matsushita, H., Hirst, W. D., Lelianova, V. G., et al. (1998). Vesicle exocytosis stimulated by alpha‐latrotoxin is mediated by latrophilin and requires both external and stored Ca2+. EMBO J, 17(14), 3909‐3920.
Davletov, B. A., Shamotienko, O. G., Lelianova, V. G., Grishin, E. V., & Ushkaryov, Y. A. (1996). Isolation and biochemical characterization of a Ca2+‐independent alpha‐latrotoxin‐binding protein. J Biol Chem, 271(38), 23239‐23245.
de Cid, R., Riveira‐Munoz, E., Zeeuwen, P. L., Robarge, J., Liao, W., Dannhauser, E. N., et al. (2009). Deletion of the late cornified envelope LCE3B and LCE3C genes as a susceptibility factor for psoriasis. Nat Genet, 41(2), 211‐215.
De Luca, A., Bottillo, I., Dasdia, M. C., Morella, A., Lanari, V., Bernardini, L., et al. (2007). Deletions of NF1 gene and exons detected by multiplex ligation‐dependent probe amplification. J Med Genet, 44(12), 800‐808.
Deo, R. C., Schmidt, E. F., Elhabazi, A., Togashi, H., Burley, S. K., & Strittmatter, S. M. (2004). Structural bases for CRMP function in plexin‐dependent semaphorin3A signaling. EMBO J, 23(1), 9‐22.
DGV. (2011). Database of Genomic Variants. http://projects.tcag.ca/variation/project.html Dickstein, D. L., Kabaso, D., Rocher, A. B., Luebke, J. I., Wearne, S. L., & Hof, P. R. (2007).
Changes in the structural complexity of the aged brain. Aging Cell, 6(3), 275‐284. Diskin, S. J., Hou, C., Glessner, J. T., Attiyeh, E. F., Laudenslager, M., Bosse, K., et al. (2009).
Copy number variation at 1q21.1 associated with neuroblastoma. Nature, 459(7249), 987‐991.
Diskin, S. J., Li, M., Hou, C., Yang, S., Glessner, J., Hakonarson, H., et al. (2008). Adjustment of genomic waves in signal intensities from whole‐genome SNP genotyping platforms. Nucleic Acids Res, 36(19), e126.
Domingues‐Montanari, S., Pares, M., Hernandez‐Guillamon, M., Fernandez‐Cadenas, I., Mendioroz, M., Ortega, G., et al. (2011). No evidence of APP point mutation and locus duplication in individuals with cerebral amyloid angiopathy. Eur J Neurol.
Edelmann, L., Pandita, R. K., Spiteri, E., Funke, B., Goldberg, R., Palanisamy, N., et al. (1999). A common molecular basis for rearrangement disorders on chromosome 22q11. Hum Mol Genet, 8(7), 1157‐1167.
Edwards, D. R., Handsley, M. M., & Pennington, C. J. (2008). The ADAM metalloproteinases. Mol Aspects Med, 29(5), 258‐289.
129
Eichler, E. E., Flint, J., Gibson, G., Kong, A., Leal, S. M., Moore, J. H., et al. (2010). Missing heritability and strategies for finding the underlying causes of complex disease. Nat Rev Genet, 11(6), 446‐450.
Fanciulli, M., Norsworthy, P. J., Petretto, E., Dong, R., Harper, L., Kamesh, L., et al. (2007). FCGR3B copy number variation is associated with susceptibility to systemic, but not organ‐specific, autoimmunity. Nat Genet, 39(6), 721‐723.
Fannon, A. M., & Colman, D. R. (1996). A model for central synaptic junctional complex formation based on the differential adhesive specificities of the cadherins. Neuron, 17(3), 423‐434.
Fernandez‐Funez, P., Nino‐Rosales, M. L., de Gouyon, B., She, W. C., Luchak, J. M., Martinez, P., et al. (2000). Identification of genes that modify ataxin‐1‐induced neurodegeneration. Nature, 408(6808), 101‐106.
Ferri, C. P., Prince, M., Brayne, C., Brodaty, H., Fratiglioni, L., Ganguli, M., et al. (2005). Global prevalence of dementia: a Delphi consensus study. Lancet, 366(9503), 2112‐2117.
Feuk, L., Carson, A. R., & Scherer, S. W. (2006). Structural variation in the human genome. Nat Rev Genet, 7(2), 85‐97.
Feulner, T. M., Laws, S. M., Friedrich, P., Wagenpfeil, S., Wurst, S. H., Riehle, C., et al. (2009). Examination of the current top candidate genes for AD in a genome‐wide association study. Mol Psychiatry.
Filimonenko, M., Stuffers, S., Raiborg, C., Yamamoto, A., Malerod, L., Fisher, E. M., et al. (2007). Functional multivesicular bodies are required for autophagic clearance of protein aggregates associated with neurodegenerative disease. J Cell Biol, 179(3), 485‐500.
Firth, H. V., Richards, S. M., Bevan, A. P., Clayton, S., Corpas, M., Rajan, D., et al. (2009). DECIPHER: Database of Chromosomal Imbalance and Phenotype in Humans Using Ensembl Resources http://decipher.sanger.ac.uk/. Am J Hum Genet, 84(4), 524‐533.
Forster, E., Bock, H. H., Herz, J., Chai, X., Frotscher, M., & Zhao, S. (2010). Emerging topics in Reelin function. Eur J Neurosci, 31(9), 1511‐1518.
Frazer, K. A., Murray, S. S., Schork, N. J., & Topol, E. J. (2009). Human genetic variation and its contribution to complex traits. Nat Rev Genet, 10(4), 241‐251.
Freeman, J. L., Perry, G. H., Feuk, L., Redon, R., McCarroll, S. A., Altshuler, D. M., et al. (2006). Copy number variation: new insights in genome diversity. Genome Res, 16(8), 949‐961.
Fukada, M., Watakabe, I., Yuasa‐Kawada, J., Kawachi, H., Kuroiwa, A., Matsuda, Y., et al. (2000). Molecular characterization of CRMP5, a novel member of the collapsin response mediator protein family. J Biol Chem, 275(48), 37957‐37965.
Funk, K. E., Mrak, R. E., & Kuret, J. (2011). Granulovacuolar degeneration (GVD) bodies of Alzheimer's disease (AD) resemble late‐stage autophagic organelles. Neuropathol Appl Neurobiol, 37(3), 295‐306.
Garcia‐Rudaz, C., Luna, F., Tapia, V., Kerr, B., Colgin, L., Galimi, F., et al. (2007). Fxna, a novel gene differentially expressed in the rat ovary at the time of folliculogenesis, is required for normal ovarian histogenesis. Development, 134(5), 945‐957.
Gardiner, K. (2004). Gene‐dosage effects in Down syndrome and trisomic mouse models. Genome Biol, 5(10), 244.
Gatz, M., Reynolds, C. A., Fratiglioni, L., Johansson, B., Mortimer, J. A., Berg, S., et al. (2006). Role of genes and environments for explaining Alzheimer disease. Arch Gen Psychiatry, 63(2), 168‐174.
130
Gautam, P., Jha, P., Kumar, D., Tyagi, S., Varma, B., Dash, D., et al. (2011). Spectrum of large copy number variations in 26 diverse Indian populations: potential involvement in phenotypic diversity. Hum Genet.
General‐Information. (2009). http://www.nia.nih.gov/Alzheimers/AlzheimersInformation/GeneralInfo/. Retrieved Apr 14, 2009, from National Institute of Aging: http://www.nia.nih.gov/Alzheimers/AlzheimersInformation/GeneralInfo/
Giagtzoglou, N., Ly, C. V., & Bellen, H. J. (2009). Cell adhesion, the backbone of the synapse: "vertebrate" and "invertebrate" perspectives. Cold Spring Harb Perspect Biol, 1(4), a003079.
Girirajan, S., & Eichler, E. E. (2010). Phenotypic variability and genetic susceptibility to genomic disorders. Hum Mol Genet, 19(R2), R176‐187.
Glessner, J. T., Bradfield, J. P., Wang, K., Takahashi, N., Zhang, H., Sleiman, P. M., et al. (2010). A genome‐wide study reveals copy number variants exclusive to childhood obesity cases. Am J Hum Genet, 87(5), 661‐666.
Go, R. C., Duke, L. W., Harrell, L. E., Cody, H., Bassett, S. S., Folstein, M. F., et al. (1997). Development and validation of a Structured Telephone Interview for Dementia Assessment (STIDA): the NIMH Genetics Initiative. J Geriatr Psychiatry Neurol, 10(4), 161‐167.
Goate, A., Chartier‐Harlin, M. C., Mullan, M., Brown, J., Crawford, F., Fidani, L., et al. (1991). Segregation of a missense mutation in the amyloid precursor protein gene with familial Alzheimer's disease. Nature, 349(6311), 704‐706.
GoldenHelix. (2011a). Tutorial: CNV ‐ Quality Assurance. Retrieved from http://www.goldenhelix.com/SNP_Variation/tutorials/cnv‐quality‐assurance/introduction.html
GoldenHelix. (2011b). Tutorial: Copy Number Variation (CNV) Analysis. 2011, from http://www.goldenhelix.com/SNP_Variation/tutorials/cnv/introduction.html
Gong, P., Vetrivel, K. S., Nguyen, P. D., Meckler, X., Cheng, H., Kounnas, M. Z., et al. (2010). Mutation analysis of the presenilin 1 N‐terminal domain reveals a broad spectrum of gamma‐secretase activity toward amyloid precursor protein and other substrates. J Biol Chem, 285(49), 38042‐38052.
Gonzalez, E., Kulkarni, H., Bolivar, H., Mangano, A., Sanchez, R., Catano, G., et al. (2005). The influence of CCL3L1 gene‐containing segmental duplications on HIV‐1/AIDS susceptibility. Science, 307(5714), 1434‐1440.
Good, P. F., Alapat, D., Hsu, A., Chu, C., Perl, D., Wen, X., et al. (2004). A role for semaphorin 3A signaling in the degeneration of hippocampal neurons during Alzheimer's disease. J Neurochem, 91(3), 716‐736.
Griggs, B. L., Ladd, S., Saul, R. A., DuPont, B. R., & Srivastava, A. K. (2008). Dedicator of cytokinesis 8 is disrupted in two patients with mental retardation and developmental disabilities. Genomics, 91(2), 195‐202.
Gu, W., Zhang, F., & Lupski, J. R. (2008). Mechanisms for human genomic rearrangements. Pathogenetics, 1(1), 4.
Guilmatre, A., Dubourg, C., Mosca, A. L., Legallic, S., Goldenberg, A., Drouin‐Garraud, V., et al. (2009). Recurrent rearrangements in synaptic and neurodevelopmental genes and shared biologic pathways in schizophrenia, autism, and mental retardation. Arch Gen Psychiatry, 66(9), 947‐956.

131
Guyant‐Marechal, L., Rovelet‐Lecrux, A., Goumidi, L., Cousin, E., Hannequin, D., Raux, G., et al. (2007). Variations in the APP gene promoter region and risk of Alzheimer disease. Neurology, 68(9), 684‐687.
Hammock, E. A., & Levitt, P. (2011). Developmental expression mapping of a gene implicated in multiple neurodevelopmental disorders, a2bp1 (fox1). Dev Neurosci, 33(1), 64‐74.
Hao, K., Schadt, E. E., & Storey, J. D. (2008). Calibrating the performance of SNP arrays for whole‐genome association studies. PLoS Genet, 4(6), e1000109.
Hasin‐Brumshtein, Y., Lancet, D., & Olender, T. (2009). Human olfaction: from genomic variation to phenotypic diversity. Trends Genet, 25(4), 178‐184.
Hasin, Y., Olender, T., Khen, M., Gonzaga‐Jauregui, C., Kim, P. M., Urban, A. E., et al. (2008). High‐resolution copy‐number variation map reflects human olfactory receptor diversity and evolution. PLoS Genet, 4(11), e1000249.
Hayashi, S., Imoto, I., Aizu, Y., Okamoto, N., Mizuno, S., Kurosawa, K., et al. (2011). Clinical application of array‐based comparative genomic hybridization by two‐stage screening for 536 patients with mental retardation and multiple congenital anomalies. J Hum Genet, 56(2), 110‐124.
Hebert, S. S., Horre, K., Nicolai, L., Bergmans, B., Papadopoulou, A. S., Delacourte, A., et al. (2009). MicroRNA regulation of Alzheimer's Amyloid precursor protein expression. Neurobiol Dis, 33(3), 422‐428.
Heinzen, E. L., Need, A. C., Hayden, K. M., Chiba‐Falek, O., Roses, A. D., Strittmatter, W. J., et al. (2010). Genome‐wide scan of copy number variation in late‐onset Alzheimer's disease. J Alzheimers Dis, 19(1), 69‐77.
Henrichsen, C. N., Chaignat, E., & Reymond, A. (2009). Copy number variants, diseases and gene expression. Hum Mol Genet, 18(R1), R1‐8.
Herz, J., & Chen, Y. (2006). Reelin, lipoprotein receptors and synaptic plasticity. Nat Rev Neurosci, 7(11), 850‐859.
Hong, C. S., Park, B. Y., & Saint‐Jeannet, J. P. (2007). The function of Dmrt genes in vertebrate development: it is not just about sex. Dev Biol, 310(1), 1‐9.
Hooli, B. V., & Tanzi, R. E. (2009). A current view of Alzheimer's disease. F1000 Biol Rep, 1. Hsieh, H., Boehm, J., Sato, C., Iwatsubo, T., Tomita, T., Sisodia, S., et al. (2006). AMPAR
removal underlies Abeta‐induced synaptic depression and dendritic spine loss. Neuron, 52(5), 831‐843.
Huntley, G. W., Gil, O., & Bozdagi, O. (2002). The cadherin family of cell adhesion molecules: multiple roles in synaptic plasticity. Neuroscientist, 8(3), 221‐233.
Huynh, D. P., Maalouf, M., Silva, A. J., Schweizer, F. E., & Pulst, S. M. (2009). Dissociated fear and spatial learning in mice with deficiency of ataxin‐2. PLoS One, 4(7), e6235.
Iafrate, A. J., Feuk, L., Rivera, M. N., Listewnik, M. L., Donahoe, P. K., Qi, Y., et al. (2004). Detection of large‐scale variation in the human genome. Nat Genet, 36(9), 949‐951.
Ikeda, M., Tomita, Y., Mouri, A., Koga, M., Okochi, T., Yoshimura, R., et al. (2010). Identification of novel candidate genes for treatment response to risperidone and susceptibility for schizophrenia: integrated analysis among pharmacogenomics, mouse expression, and genetic case‐control association approaches. Biol Psychiatry, 67(3), 263‐269.
Ionita‐Laza, I., Rogers, A. J., Lange, C., Raby, B. A., & Lee, C. (2009). Genetic association analysis of copy‐number variation (CNV) in human disease pathogenesis. Genomics, 93(1), 22‐26.

132
Itsara, A., Cooper, G. M., Baker, C., Girirajan, S., Li, J., Absher, D., et al. (2009). Population analysis of large copy number variants and hotspots of human genetic disease. Am J Hum Genet, 84(2), 148‐161.
Jacobsen, J. S., Wu, C. C., Redwine, J. M., Comery, T. A., Arias, R., Bowlby, M., et al. (2006). Early‐onset behavioral and synaptic deficits in a mouse model of Alzheimer's disease. Proc Natl Acad Sci U S A, 103(13), 5161‐5166.
Jaeger, S., & Pietrzik, C. U. (2008). Functional role of lipoprotein receptors in Alzheimer's disease. Curr Alzheimer Res, 5(1), 15‐25.
Jain, M., Palacio, L. G., Castellanos, F. X., Palacio, J. D., Pineda, D., Restrepo, M. I., et al. (2007). Attention‐deficit/hyperactivity disorder and comorbid disruptive behavior disorders: evidence of pleiotropy and new susceptibility loci. Biol Psychiatry, 61(12), 1329‐1339.
Jain, M., Velez, J. I., Acosta, M. T., Palacio, L. G., Balog, J., Roessler, E., et al. (2011). A cooperative interaction between LPHN3 and 11q doubles the risk for ADHD. Mol Psychiatry.
Jakobsson, M., Scholz, S. W., Scheet, P., Gibbs, J. R., VanLiere, J. M., Fung, H. C., et al. (2008). Genotype, haplotype and copy‐number variation in worldwide human populations. Nature, 451(7181), 998‐1003.
Jossin, Y., & Cooper, J. A. (2011). Reelin, Rap1 and N‐cadherin orient the migration of multipolar neurons in the developing neocortex. Nat Neurosci, 14(6), 697‐703.
Jungling, K., Eulenburg, V., Moore, R., Kemler, R., Lessmann, V., & Gottmann, K. (2006). N‐cadherin transsynaptically regulates short‐term plasticity at glutamatergic synapses in embryonic stem cell‐derived neurons. J Neurosci, 26(26), 6968‐6978.
Kakinuma, N., Roy, B. C., Zhu, Y., Wang, Y., & Kiyama, R. (2008). Kank regulates RhoA‐dependent formation of actin stress fibers and cell migration via 14‐3‐3 in PI3K‐Akt signaling. J Cell Biol, 181(3), 537‐549.
Kakinuma, N., Zhu, Y., Wang, Y., Roy, B. C., & Kiyama, R. (2009). Kank proteins: structure, functions and diseases. Cell Mol Life Sci, 66(16), 2651‐2659.
Kalman, B., & Vitale, E. (2009). Structural chromosomal variations in neurological diseases. Neurologist, 15(5), 245‐253.
Kantaputra, P. N., Klopocki, E., Hennig, B. P., Praphanphoj, V., Le Caignec, C., Isidor, B., et al. (2010). Mesomelic dysplasia Kantaputra type is associated with duplications of the HOXD locus on chromosome 2q. Eur J Hum Genet, 18(12), 1310‐1314.
Kasuga, K., Shimohata, T., Nishimura, A., Shiga, A., Mizuguchi, T., Tokunaga, J., et al. (2009). Identification of independent APP locus duplication in Japanese patients with early‐onset Alzheimer disease. J Neurol Neurosurg Psychiatry, 80(9), 1050‐1052.
Kawauchi, T., Sekine, K., Shikanai, M., Chihama, K., Tomita, K., Kubo, K., et al. (2010). Rab GTPases‐dependent endocytic pathways regulate neuronal migration and maturation through N‐cadherin trafficking. Neuron, 67(4), 588‐602.
Kiehl, T. R., Shibata, H., Vo, T., Huynh, D. P., & Pulst, S. M. (2001). Identification and expression of a mouse ortholog of A2BP1. Mamm Genome, 12(8), 595‐601.
Kieran, D., & Greensmith, L. (2004). Inhibition of calpains, by treatment with leupeptin, improves motoneuron survival and muscle function in models of motoneuron degeneration. Neuroscience, 125(2), 427‐439.
Kim, J. I., Ju, Y. S., Park, H., Kim, S., Lee, S., Yi, J. H., et al. (2009). A highly annotated whole‐genome sequence of a Korean individual. Nature, 460(7258), 1011‐1015.
Kim, M., Suh, J., Romano, D., Truong, M. H., Mullin, K., Hooli, B., et al. (2009). Potential late‐onset Alzheimer's disease‐associated mutations in the ADAM10 gene attenuate {alpha}‐secretase activity. Hum Mol Genet, 18(20), 3987‐3996.

133
Klein, R. (2009). Bidirectional modulation of synaptic functions by Eph/ephrin signaling. Nat Neurosci, 12(1), 15‐20.
Klopocki, E., Lohan, S., Brancati, F., Koll, R., Brehm, A., Seemann, P., et al. (2011). Copy‐number variations involving the IHH locus are associated with syndactyly and craniosynostosis. Am J Hum Genet, 88(1), 70‐75.
Klopocki, E., & Mundlos, S. (2011). Copy‐Number Variations, Noncoding Sequences, and Human Phenotypes. Annu Rev Genomics Hum Genet.
Kocerha, J., Kauppinen, S., & Wahlestedt, C. (2009). microRNAs in CNS disorders. Neuromolecular Med, 11(3), 162‐172.
Kopan, R., & Ilagan, M. X. (2004). Gamma‐secretase: proteasome of the membrane? Nat Rev Mol Cell Biol, 5(6), 499‐504.
Korbel, J. O., Urban, A. E., Grubert, F., Du, J., Royce, T. E., Starr, P., et al. (2007). Systematic prediction and validation of breakpoints associated with copy‐number variants in the human genome. Proc Natl Acad Sci U S A, 104(24), 10110‐10115.
Kozlowski, P., Roberts, P., Dabora, S., Franz, D., Bissler, J., Northrup, H., et al. (2007). Identification of 54 large deletions/duplications in TSC1 and TSC2 using MLPA, and genotype‐phenotype correlations. Hum Genet, 121(3‐4), 389‐400.
Krain, A. L., & Castellanos, F. X. (2006). Brain development and ADHD. Clin Psychol Rev, 26(4), 433‐444.
Kralovics, R., Teo, S. S., Buser, A. S., Brutsche, M., Tiedt, R., Tichelli, A., et al. (2005). Altered gene expression in myeloproliferative disorders correlates with activation of signaling by the V617F mutation of Jak2. Blood, 106(10), 3374‐3376.
Ku, C. S., Pawitan, Y., Sim, X., Ong, R. T., Seielstad, M., Lee, E. J., et al. (2010). Genomic copy number variations in three Southeast Asian populations. Hum Mutat, 31(7), 851‐857.
Kurnellas, M. P., Li, H., Jain, M. R., Giraud, S. N., Nicot, A. B., Ratnayake, A., et al. (2010). Reduced expression of plasma membrane calcium ATPase 2 and collapsin response mediator protein 1 promotes death of spinal cord neurons. Cell Death Differ, 17(9), 1501‐1510.
Kuroyanagi, H. (2009). Fox‐1 family of RNA‐binding proteins. Cell Mol Life Sci, 66(24), 3895‐3907.
Kurth, I., Klopocki, E., Stricker, S., van Oosterwijk, J., Vanek, S., Altmann, J., et al. (2009). Duplications of noncoding elements 5' of SOX9 are associated with brachydactyly‐anonychia. Nat Genet, 41(8), 862‐863.
Lacor, P. N., Buniel, M. C., Furlow, P. W., Clemente, A. S., Velasco, P. T., Wood, M., et al. (2007). Abeta oligomer‐induced aberrations in synapse composition, shape, and density provide a molecular basis for loss of connectivity in Alzheimer's disease. J Neurosci, 27(4), 796‐807.
Lai, K. O., & Ip, N. Y. (2009). Synapse development and plasticity: roles of ephrin/Eph receptor signaling. Curr Opin Neurobiol, 19(3), 275‐283.
Lastres‐Becker, I., Rub, U., & Auburger, G. (2008). Spinocerebellar ataxia 2 (SCA2). Cerebellum, 7(2), 115‐124.
Lauren, J., Gimbel, D. A., Nygaard, H. B., Gilbert, J. W., & Strittmatter, S. M. (2009). Cellular prion protein mediates impairment of synaptic plasticity by amyloid‐beta oligomers. Nature, 457(7233), 1128‐1132.
Lee, C., & Scherer, S. W. (2010). The clinical context of copy number variation in the human genome. Expert Rev Mol Med, 12, e8.

134
Lee, J. A., Beigneux, A., Ahmad, S. T., Young, S. G., & Gao, F. B. (2007). ESCRT‐III dysfunction causes autophagosome accumulation and neurodegeneration. Curr Biol, 17(18), 1561‐1567.
Lee, J. A., Carvalho, C. M., & Lupski, J. R. (2007). A DNA replication mechanism for generating nonrecurrent rearrangements associated with genomic disorders. Cell, 131(7), 1235‐1247.
Lee, J. A., & Gao, F. B. (2008). ESCRT, autophagy, and frontotemporal dementia. BMB Rep, 41(12), 827‐832.
Lee, J. A., Inoue, K., Cheung, S. W., Shaw, C. A., Stankiewicz, P., & Lupski, J. R. (2006). Role of genomic architecture in PLP1 duplication causing Pelizaeus‐Merzbacher disease. Hum Mol Genet, 15(14), 2250‐2265.
Lee, J. A., & Lupski, J. R. (2006). Genomic rearrangements and gene copy‐number alterations as a cause of nervous system disorders. Neuron, 52(1), 103‐121.
Lefebvre, S., Burglen, L., Reboullet, S., Clermont, O., Burlet, P., Viollet, L., et al. (1995). Identification and characterization of a spinal muscular atrophy‐determining gene. Cell, 80(1), 155‐165.
Lefort, C. T., Wojciechowski, K., & Hocking, D. C. (2011). N‐cadherin cell‐cell adhesion complexes are regulated by fibronectin matrix assembly. J Biol Chem, 286(4), 3149‐3160.
Lejeune, J., Gautier, M., & Turpin, R. (1959). [Study of somatic chromosomes from 9 mongoloid children]. C R Hebd Seances Acad Sci, 248(11), 1721‐1722.
Lelianova, V. G., Davletov, B. A., Sterling, A., Rahman, M. A., Grishin, E. V., Totty, N. F., et al. (1997). Alpha‐latrotoxin receptor, latrophilin, is a novel member of the secretin family of G protein‐coupled receptors. J Biol Chem, 272(34), 21504‐21508.
Leon, J., & Neumann, P. J. (1999). The cost of Alzheimer's disease in managed care: a cross‐sectional study. Am J Manag Care, 5(7), 867‐877.
Lerer, I., Sagi, M., Meiner, V., Cohen, T., Zlotogora, J., & Abeliovich, D. (2005). Deletion of the ANKRD15 gene at 9p24.3 causes parent‐of‐origin‐dependent inheritance of familial cerebral palsy. Hum Mol Genet, 14(24), 3911‐3920.
Lessing, D., & Bonini, N. M. (2008). Polyglutamine genes interact to modulate the severity and progression of neurodegeneration in Drosophila. PLoS Biol, 6(2), e29.
Levy, S., Sutton, G., Ng, P. C., Feuk, L., Halpern, A. L., Walenz, B. P., et al. (2007). The diploid genome sequence of an individual human. PLoS Biol, 5(10), e254.
Lin, P., Hartz, S. M., Wang, J. C., Krueger, R. F., Foroud, T. M., Edenberg, H. J., et al. (2011). Copy number variation accuracy in genome‐wide association studies. Hum Hered, 71(3), 141‐147.
Lupski, J. R. (1998). Genomic disorders: structural features of the genome can lead to DNA rearrangements and human disease traits. Trends Genet, 14(10), 417‐422.
Lupski, J. R. (2007). Genomic rearrangements and sporadic disease. Nat Genet, 39(7 Suppl), S43‐47.
Lupski, J. R., & Stankiewicz, P. (2005). Genomic disorders: molecular mechanisms for rearrangements and conveyed phenotypes. PLoS Genet, 1(6), e49.
Ma, L., Hanson, R. L., Traurig, M. T., Muller, Y. L., Kaur, B. P., Perez, J. M., et al. (2010). Evaluation of A2BP1 as an obesity gene. Diabetes, 59(11), 2837‐2845.
Maes, O. C., Chertkow, H. M., Wang, E., & Schipper, H. M. (2009). MicroRNA: Implications for Alzheimer Disease and other Human CNS Disorders. Curr Genomics, 10(3), 154‐168.
Maher, B. (2008). Personal genomes: The case of the missing heritability. Nature, 456(7218), 18‐21.

135
Maiti, S., Kumar, K. H., Castellani, C. A., O'Reilly, R., & Singh, S. M. (2011). Ontogenetic de novo copy number variations (CNVs) as a source of genetic individuality: studies on two families with MZD twins for schizophrenia. PLoS One, 6(3), e17125.
Malinverno, M., Carta, M., Epis, R., Marcello, E., Verpelli, C., Cattabeni, F., et al. (2010). Synaptic localization and activity of ADAM10 regulate excitatory synapses through N‐cadherin cleavage. J Neurosci, 30(48), 16343‐16355.
Manolio, T. A., Collins, F. S., Cox, N. J., Goldstein, D. B., Hindorff, L. A., Hunter, D. J., et al. (2009). Finding the missing heritability of complex diseases. Nature, 461(7265), 747‐753.
Martin, B., Brenneman, R., Becker, K. G., Gucek, M., Cole, R. N., & Maudsley, S. (2008). iTRAQ analysis of complex proteome alterations in 3xTgAD Alzheimer's mice: understanding the interface between physiology and disease. PLoS One, 3(7), e2750.
Martorana, A., Esposito, Z., & Koch, G. (2010). Beyond the cholinergic hypothesis: do current drugs work in Alzheimer's disease? CNS Neurosci Ther, 16(4), 235‐245.
Matsuda, M. (2005). Sex determination in the teleost medaka, Oryzias latipes. Annu Rev Genet, 39, 293‐307.
Matsuura, T., Sutcliffe, J. S., Fang, P., Galjaard, R. J., Jiang, Y. H., Benton, C. S., et al. (1997). De novo truncating mutations in E6‐AP ubiquitin‐protein ligase gene (UBE3A) in Angelman syndrome. Nat Genet, 15(1), 74‐77.
McCarroll, S. A., & Altshuler, D. M. (2007). Copy‐number variation and association studies of human disease. Nat Genet, 39(7 Suppl), S37‐42.
McCarroll, S. A., Kuruvilla, F. G., Korn, J. M., Cawley, S., Nemesh, J., Wysoker, A., et al. (2008). Integrated detection and population‐genetic analysis of SNPs and copy number variation. Nat Genet, 40(10), 1166‐1174.
McKernan, K. J., Peckham, H. E., Costa, G. L., McLaughlin, S. F., Fu, Y., Tsung, E. F., et al. (2009). Sequence and structural variation in a human genome uncovered by short‐read, massively parallel ligation sequencing using two‐base encoding. Genome Res, 19(9), 1527‐1541.
McKhann, G., Drachman, D., Folstein, M., Katzman, R., Price, D., & Stadlan, E. M. (1984). Clinical diagnosis of Alzheimer's disease: report of the NINCDS‐ADRDA Work Group under the auspices of Department of Health and Human Services Task Force on Alzheimer's Disease. Neurology, 34(7), 939‐944.
McKinney, C., Fanciulli, M., Merriman, M. E., Phipps‐Green, A., Alizadeh, B. Z., Koeleman, B. P., et al. (2010). Association of variation in Fcgamma receptor 3B gene copy number with rheumatoid arthritis in Caucasian samples. Ann Rheum Dis, 69(9), 1711‐1716.
McNaughton, D., Knight, W., Guerreiro, R., Ryan, N., Lowe, J., Poulter, M., et al. (2010). Duplication of amyloid precursor protein (APP), but not prion protein (PRNP) gene is a significant cause of early onset dementia in a large UK series. Neurobiol Aging.
Mellitzer, G., Xu, Q., & Wilkinson, D. G. (1999). Eph receptors and ephrins restrict cell intermingling and communication. Nature, 400(6739), 77‐81.
Mohapatra, G., Moore, D. H., Kim, D. H., Grewal, L., Hyun, W. C., Waldman, F. M., et al. (1997). Analyses of brain tumor cell lines confirm a simple model of relationships among fluorescence in situ hybridization, DNA index, and comparative genomic hybridization. Genes Chromosomes Cancer, 20(4), 311‐319.
Mukherjee, J., DeSouza, L. V., Micallef, J., Karim, Z., Croul, S., Siu, K. W., et al. (2009). Loss of collapsin response mediator Protein1, as detected by iTRAQ analysis, promotes invasion of human gliomas expressing mutant EGFRvIII. Cancer Res, 69(22), 8545‐8554.
136
Murrell, J. R., Hake, A. M., Quaid, K. A., Farlow, M. R., & Ghetti, B. (2000). Early‐onset Alzheimer disease caused by a new mutation (V717L) in the amyloid precursor protein gene. Arch Neurol, 57(6), 885‐887.
Niu, S., Renfro, A., Quattrocchi, C. C., Sheldon, M., & D'Arcangelo, G. (2004). Reelin promotes hippocampal dendrite development through the VLDLR/ApoER2‐Dab1 pathway. Neuron, 41(1), 71‐84.
Nose, A., Nagafuchi, A., & Takeichi, M. (1987). Isolation of placental cadherin cDNA: identification of a novel gene family of cell‐cell adhesion molecules. EMBO J, 6(12), 3655‐3661.
Nowotny, P., Simcock, X., Bertelsen, S., Hinrichs, A. L., Kauwe, J. S., Mayo, K., et al. (2007). Association studies testing for risk for late‐onset Alzheimer's disease with common variants in the beta‐amyloid precursor protein (APP). Am J Med Genet B Neuropsychiatr Genet, 144B(4), 469‐474.
Ohkubo, N., Lee, Y. D., Morishima, A., Terashima, T., Kikkawa, S., Tohyama, M., et al. (2003). Apolipoprotein E and Reelin ligands modulate tau phosphorylation through an apolipoprotein E receptor/disabled‐1/glycogen synthase kinase‐3beta cascade. FASEB J, 17(2), 295‐297.
Orioli, D., & Klein, R. (1997). The Eph receptor family: axonal guidance by contact repulsion. Trends Genet, 13(9), 354‐359.
Padiath, Q. S., Saigoh, K., Schiffmann, R., Asahara, H., Yamada, T., Koeppen, A., et al. (2006). Lamin B1 duplications cause autosomal dominant leukodystrophy. Nat Genet, 38(10), 1114‐1123.
Pagnamenta, A. T., Holt, R., Yusuf, M., Pinto, D., Wing, K., Betancur, C., et al. (2011). A family with autism and rare copy number variants disrupting the Duchenne/Becker muscular dystrophy gene DMD and TRPM3. J Neurodev Disord.
Pang, A. W., MacDonald, J. R., Pinto, D., Wei, J., Rafiq, M. A., Conrad, D. F., et al. (2010). Towards a comprehensive structural variation map of an individual human genome. Genome Biol, 11(5), R52.
Peoples, R., Franke, Y., Wang, Y. K., Perez‐Jurado, L., Paperna, T., Cisco, M., et al. (2000). A physical map, including a BAC/PAC clone contig, of the Williams‐Beuren syndrome‐‐deletion region at 7q11.23. Am J Hum Genet, 66(1), 47‐68.
Pinto, D., Marshall, C., Feuk, L., & Scherer, S. W. (2007). Copy‐number variation in control population cohorts. Hum Mol Genet, 16 Spec No. 2, R168‐173.
Polymeropoulos, M. H., Higgins, J. J., Golbe, L. I., Johnson, W. G., Ide, S. E., Di Iorio, G., et al. (1996). Mapping of a gene for Parkinson's disease to chromosome 4q21‐q23. Science, 274(5290), 1197‐1199.
Potocki, L., Bi, W., Treadwell‐Deering, D., Carvalho, C. M., Eifert, A., Friedman, E. M., et al. (2007). Characterization of Potocki‐Lupski syndrome (dup(17)(p11.2p11.2)) and delineation of a dosage‐sensitive critical interval that can convey an autism phenotype. Am J Hum Genet, 80(4), 633‐649.
Qin, J., Jones, R. C., & Ramakrishnan, R. (2008). Studying copy number variations using a nanofluidic platform. Nucleic Acids Res, 36(18), e116.
Rahman, M. A., Ashton, A. C., Meunier, F. A., Davletov, B. A., Dolly, J. O., & Ushkaryov, Y. A. (1999). Norepinephrine exocytosis stimulated by alpha‐latrotoxin requires both external and stored Ca2+ and is mediated by latrophilin, G proteins and phospholipase C. Philos Trans R Soc Lond B Biol Sci, 354(1381), 379‐386.
Reddy, S. S., Connor, T. E., Weeber, E. J., & Rebeck, W. (2011). Similarities and differences in structure, expression, and functions of VLDLR and ApoER2. Mol Neurodegener, 6, 30.

137
Redon, R., Ishikawa, S., Fitch, K. R., Feuk, L., Perry, G. H., Andrews, T. D., et al. (2006). Global variation in copy number in the human genome. Nature, 444(7118), 444‐454.
Redon, R., Ishikawa, S., Fitch, K. R., Feuk, L., Perry, G. H., Andrews, T. D., et al. (2006). Global variation in copy number in the human genome. Nature, 444(7118), 444‐454.
Reiter, L. T., Murakami, T., Koeuth, T., Pentao, L., Muzny, D. M., Gibbs, R. A., et al. (1996). A recombination hotspot responsible for two inherited peripheral neuropathies is located near a mariner transposon‐like element. Nat Genet, 12(3), 288‐297.
Restituito, S., Khatri, L., Ninan, I., Mathews, P. M., Liu, X., Weinberg, R. J., et al. (2011). Synaptic Autoregulation by Metalloproteases and {gamma}‐Secretase. J Neurosci, 31(34), 12083‐12093.
Rieger, S., Senghaas, N., Walch, A., & Koster, R. W. (2009). Cadherin‐2 controls directional chain migration of cerebellar granule neurons. PLoS Biol, 7(11), e1000240.
Ross, O. A., Rutherford, N. J., Baker, M., Soto‐Ortolaza, A. I., Carrasquillo, M. M., Dejesus‐Hernandez, M., et al. (2011). Ataxin‐2 repeat‐length variation and neurodegeneration. Hum Mol Genet, 20(16), 3207‐3212.
Rovelet‐Lecrux, A., Frebourg, T., Tuominen, H., Majamaa, K., Campion, D., & Remes, A. M. (2007). APP locus duplication in a Finnish family with dementia and intracerebral haemorrhage. J Neurol Neurosurg Psychiatry, 78(10), 1158‐1159.
Rovelet‐Lecrux, A., Hannequin, D., Raux, G., Le Meur, N., Laquerriere, A., Vital, A., et al. (2006). APP locus duplication causes autosomal dominant early‐onset Alzheimer disease with cerebral amyloid angiopathy. Nat Genet, 38(1), 24‐26.
Roy, B. C., Kakinuma, N., & Kiyama, R. (2009). Kank attenuates actin remodeling by preventing interaction between IRSp53 and Rac1. J Cell Biol, 184(2), 253‐267.
Ruiz‐Perez, V. L., & Goodship, J. A. (2009). Ellis‐van Creveld syndrome and Weyers acrodental dysostosis are caused by cilia‐mediated diminished response to hedgehog ligands. Am J Med Genet C Semin Med Genet, 151C(4), 341‐351.
Ruiz‐Perez, V. L., Ide, S. E., Strom, T. M., Lorenz, B., Wilson, D., Woods, K., et al. (2000). Mutations in a new gene in Ellis‐van Creveld syndrome and Weyers acrodental dysostosis. Nat Genet, 24(3), 283‐286.
Russell, V. A., Sagvolden, T., & Johansen, E. B. (2005). Animal models of attention‐deficit hyperactivity disorder. Behav Brain Funct, 1, 9.
Rusten, T. E., Filimonenko, M., Rodahl, L. M., Stenmark, H., & Simonsen, A. (2007). ESCRTing autophagic clearance of aggregating proteins. Autophagy, 4(2).
Ruusala, A., & Aspenstrom, P. (2004). Isolation and characterisation of DOCK8, a member of the DOCK180‐related regulators of cell morphology. FEBS Lett, 572(1‐3), 159‐166.
Sanders, S. J., Ercan‐Sencicek, A. G., Hus, V., Luo, R., Murtha, M. T., Moreno‐De‐Luca, D., et al. (2011). Multiple Recurrent De Novo CNVs, Including Duplications of the 7q11.23 Williams Syndrome Region, Are Strongly Associated with Autism. Neuron, 70(5), 863‐885.
Savelieva, K. V., Rajan, I., Baker, K. B., Vogel, P., Jarman, W., Allen, M., et al. (2008). Learning and memory impairment in Eph receptor A6 knockout mice. Neurosci Lett, 438(2), 205‐209.
Schmidt, E. F., & Strittmatter, S. M. (2007). The CRMP family of proteins and their role in Sema3A signaling. Adv Exp Med Biol, 600, 1‐11.
Sebastiani, P., Solovieff, N., Puca, A., Hartley, S. W., Melista, E., Andersen, S., et al. (2010). Genetic Signatures of Exceptional Longevity in Humans. Science.
138
Sebat, J., Lakshmi, B., Malhotra, D., Troge, J., Lese‐Martin, C., Walsh, T., et al. (2007). Strong association of de novo copy number mutations with autism. Science, 316(5823), 445‐449.
Sebat, J., Lakshmi, B., Troge, J., Alexander, J., Young, J., Lundin, P., et al. (2004). Large‐scale copy number polymorphism in the human genome. Science, 305(5683), 525‐528.
Selkoe, D. J. (2007). Developing preventive therapies for chronic diseases: lessons learned from Alzheimer's disease. Nutr Rev, 65(12 Pt 2), S239‐243.
Selkoe, D. J. (2008). Soluble oligomers of the amyloid beta‐protein impair synaptic plasticity and behavior. Behav Brain Res, 192(1), 106‐113.
Senturk, A., Pfennig, S., Weiss, A., Burk, K., & Acker‐Palmer, A. (2011). Ephrin Bs are essential components of the Reelin pathway to regulate neuronal migration. Nature, 472(7343), 356‐360.
Shankar, G. M., Li, S., Mehta, T. H., Garcia‐Munoz, A., Shepardson, N. E., Smith, I., et al. (2008). Amyloid‐beta protein dimers isolated directly from Alzheimer's brains impair synaptic plasticity and memory. Nat Med, 14(8), 837‐842.
Shaw, C. A., Li, Y., Wiszniewska, J., Chasse, S., Zaidi, S. N., Jin, W., et al. (2011). Olfactory copy number association with age at onset of Alzheimer disease. Neurology, 76(15), 1302‐1309.
Shibata, H., Huynh, D. P., & Pulst, S. M. (2000). A novel protein with RNA‐binding motifs interacts with ataxin‐2. Hum Mol Genet, 9(9), 1303‐1313.
Shlien, A., Tabori, U., Marshall, C. R., Pienkowska, M., Feuk, L., Novokmet, A., et al. (2008). Excessive genomic DNA copy number variation in the Li‐Fraumeni cancer predisposition syndrome. Proc Natl Acad Sci U S A, 105(32), 11264‐11269.
Silva, A. M., Liu‐Gentry, J., Dickey, A. S., Barnett, D. W., & Misler, S. (2005). alpha‐Latrotoxin increases spontaneous and depolarization‐evoked exocytosis from pancreatic islet beta‐cells. J Physiol, 565(Pt 3), 783‐799.
Simon, A. M., de Maturana, R. L., Ricobaraza, A., Escribano, L., Schiapparelli, L., Cuadrado‐Tejedor, M., et al. (2009). Early changes in hippocampal Eph receptors precede the onset of memory decline in mouse models of Alzheimer's disease. J Alzheimers Dis, 17(4), 773‐786.
Sleegers, K., Brouwers, N., Gijselinck, I., Theuns, J., Goossens, D., Wauters, J., et al. (2006). APP duplication is sufficient to cause early onset Alzheimer's dementia with cerebral amyloid angiopathy. Brain, 129(Pt 11), 2977‐2983.
Smith, C. A., & Sinclair, A. H. (2004). Sex determination: insights from the chicken. Bioessays, 26(2), 120‐132.
Smyk, M., Berg, J. S., Pursley, A., Curtis, F. K., Fernandez, B. A., Bien‐Willner, G. A., et al. (2007). Male‐to‐female sex reversal associated with an approximately 250 kb deletion upstream of NR0B1 (DAX1). Hum Genet, 122(1), 63‐70.
Spalice, A., Parisi, P., Nicita, F., Pizzardi, G., Del Balzo, F., & Iannetti, P. (2009). Neuronal migration disorders: clinical, neuroradiologic and genetics aspects. Acta Paediatr, 98(3), 421‐433.
Stankiewicz, P., & Lupski, J. R. (2010). Structural variation in the human genome and its role in disease. Annu Rev Med, 61, 437‐455.
Stefansson, H., Rujescu, D., Cichon, S., Pietilainen, O. P., Ingason, A., Steinberg, S., et al. (2008). Large recurrent microdeletions associated with schizophrenia. Nature, 455(7210), 232‐236.
Stockley, T. L., Akber, S., Bulgin, N., & Ray, P. N. (2006). Strategy for comprehensive molecular testing for Duchenne and Becker muscular dystrophies. Genet Test, 10(4), 229‐243.

139
Stranger, B. E., Forrest, M. S., Dunning, M., Ingle, C. E., Beazley, C., Thorne, N., et al. (2007). Relative impact of nucleotide and copy number variation on gene expression phenotypes. Science, 315(5813), 848‐853.
Sun, M., Li, N., Dong, W., Chen, Z., Liu, Q., Xu, Y., et al. (2009). Copy‐number mutations on chromosome 17q24.2‐q24.3 in congenital generalized hypertrichosis terminalis with or without gingival hyperplasia. Am J Hum Genet, 84(6), 807‐813.
Sun, Y., Zhang, F., Gao, J., Gao, X., Guo, T., Zhang, K., et al. (2006). Positive association between POU1F1 and mental retardation in young females in the Chinese Han population. Hum Mol Genet, 15(7), 1237‐1243.
Takahashi‐Fujigasaki, J., Breidert, T., Fujigasaki, H., Duyckaerts, C., Camonis, J. H., Brice, A., et al. (2011). Amyloid precursor‐like protein 2 cleavage contributes to neuronal intranuclear inclusions and cytotoxicity in spinocerebellar ataxia‐7 (SCA7). Neurobiol Dis, 41(1), 33‐42.
Tan, Z. J., Peng, Y., Song, H. L., Zheng, J. J., & Yu, X. (2010). N‐cadherin‐dependent neuron‐neuron interaction is required for the maintenance of activity‐induced dendrite growth. Proc Natl Acad Sci U S A, 107(21), 9873‐9878.
Tannour‐Louet, M., Han, S., Corbett, S. T., Louet, J. F., Yatsenko, S., Meyers, L., et al. (2010). Identification of de novo copy number variants associated with human disorders of sexual development. PLoS One, 5(10), e15392.
Tanzi, R. E. (1999). A genetic dichotomy model for the inheritance of Alzheimer's disease and common age‐related disorders. J Clin Invest, 104(9), 1175‐1179.
Tanzi, R. E. (2005). The synaptic Abeta hypothesis of Alzheimer disease. Nat Neurosci, 8(8), 977‐979.
Tanzi, R. E., & Bertram, L. (2005). Twenty years of the Alzheimer's disease amyloid hypothesis: a genetic perspective. Cell, 120(4), 545‐555.
Theuns, J., Brouwers, N., Engelborghs, S., Sleegers, K., Bogaerts, V., Corsmit, E., et al. (2006). Promoter mutations that increase amyloid precursor‐protein expression are associated with Alzheimer disease. Am J Hum Genet, 78(6), 936‐946.
Togashi, H., Abe, K., Mizoguchi, A., Takaoka, K., Chisaka, O., & Takeichi, M. (2002). Cadherin regulates dendritic spine morphogenesis. Neuron, 35(1), 77‐89.
Townson, J. R., Barcellos, L. F., & Nibbs, R. J. (2002). Gene copy number regulates the production of the human chemokine CCL3‐L1. Eur J Immunol, 32(10), 3016‐3026.
Turton, J. P., Reynaud, R., Mehta, A., Torpiano, J., Saveanu, A., Woods, K. S., et al. (2005). Novel mutations within the POU1F1 gene associated with variable combined pituitary hormone deficiency. J Clin Endocrinol Metab, 90(8), 4762‐4770.
Uchida, N., Honjo, Y., Johnson, K. R., Wheelock, M. J., & Takeichi, M. (1996). The catenin/cadherin adhesion system is localized in synaptic junctions bordering transmitter release zones. J Cell Biol, 135(3), 767‐779.
Uchida, Y., Ohshima, T., Sasaki, Y., Suzuki, H., Yanai, S., Yamashita, N., et al. (2005). Semaphorin3A signalling is mediated via sequential Cdk5 and GSK3beta phosphorylation of CRMP2: implication of common phosphorylating mechanism underlying axon guidance and Alzheimer's disease. Genes Cells, 10(2), 165‐179.
Uemura, K., Lill, C. M., Banks, M., Asada, M., Aoyagi, N., Ando, K., et al. (2009). N‐cadherin‐based adhesion enhances Abeta release and decreases Abeta42/40 ratio. J Neurochem, 108(2), 350‐360.
Underwood, J. G., Boutz, P. L., Dougherty, J. D., Stoilov, P., & Black, D. L. (2005). Homologues of the Caenorhabditis elegans Fox‐1 protein are neuronal splicing regulators in mammals. Mol Cell Biol, 25(22), 10005‐10016.
140
Urwin, H., Authier, A., Nielsen, J. E., Metcalf, D., Powell, C., Froud, K., et al. (2010). Disruption of endocytic trafficking in frontotemporal dementia with CHMP2B mutations. Hum Mol Genet, 19(11), 2228‐2238.
Urwin, H., Ghazi‐Noori, S., Collinge, J., & Isaacs, A. (2009). The role of CHMP2B in frontotemporal dementia. Biochem Soc Trans, 37(Pt 1), 208‐212.
Vacic, V., McCarthy, S., Malhotra, D., Murray, F., Chou, H. H., Peoples, A., et al. (2011). Duplications of the neuropeptide receptor gene VIPR2 confer significant risk for schizophrenia. Nature, 471(7339), 499‐503.
Valencia, M., Lapunzina, P., Lim, D., Zannolli, R., Bartholdi, D., Wollnik, B., et al. (2009). Widening the mutation spectrum of EVC and EVC2: ectopic expression of Weyer variants in NIH 3T3 fibroblasts disrupts Hedgehog signaling. Hum Mutat, 30(12), 1667‐1675.
van de Loo, S., Eich, F., Nonis, D., Auburger, G., & Nowock, J. (2009). Ataxin‐2 associates with rough endoplasmic reticulum. Exp Neurol, 215(1), 110‐118.
Varki, A., Geschwind, D. H., & Eichler, E. E. (2008). Explaining human uniqueness: genome interactions with environment, behaviour and culture. Nat Rev Genet, 9(10), 749‐763.
Vassos, E., Collier, D. A., Holden, S., Patch, C., Rujescu, D., St Clair, D., et al. (2010). Penetrance for copy number variants associated with schizophrenia. Hum Mol Genet, 19(17), 3477‐3481.
Venkitaramani, D. V., Chin, J., Netzer, W. J., Gouras, G. K., Lesne, S., Malinow, R., et al. (2007). Beta‐amyloid modulation of synaptic transmission and plasticity. J Neurosci, 27(44), 11832‐11837.
Vinci, G., Chantot‐Bastaraud, S., El Houate, B., Lortat‐Jacob, S., Brauner, R., & McElreavey, K. (2007). Association of deletion 9p, 46,XY gonadal dysgenesis and autistic spectrum disorder. Mol Hum Reprod, 13(9), 685‐689.
Visser, R., Shimokawa, O., Harada, N., Kinoshita, A., Ohta, T., Niikawa, N., et al. (2005). Identification of a 3.0‐kb major recombination hotspot in patients with Sotos syndrome who carry a common 1.9‐Mb microdeletion. Am J Hum Genet, 76(1), 52‐67.
Vissers, L. E., van Ravenswaaij, C. M., Admiraal, R., Hurst, J. A., de Vries, B. B., Janssen, I. M., et al. (2004). Mutations in a new member of the chromodomain gene family cause CHARGE syndrome. Nat Genet, 36(9), 955‐957.
Vunnam, N., & Pedigo, S. (2011). Sequential binding of calcium leads to dimerization in neural cadherin. Biochemistry, 50(14), 2973‐2982.
Walsh, D. M., Klyubin, I., Fadeeva, J. V., Cullen, W. K., Anwyl, R., Wolfe, M. S., et al. (2002). Naturally secreted oligomers of amyloid beta protein potently inhibit hippocampal long‐term potentiation in vivo. Nature, 416(6880), 535‐539.
Wang, J., Wang, W., Li, R., Li, Y., Tian, G., Goodman, L., et al. (2008). The diploid genome sequence of an Asian individual. Nature, 456(7218), 60‐65.
Wang, K., Li, M., Hadley, D., Liu, R., Glessner, J., Grant, S. F., et al. (2007). PennCNV: an integrated hidden Markov model designed for high‐resolution copy number variation detection in whole‐genome SNP genotyping data. Genome Res, 17(11), 1665‐1674.
Wang, T. C., Li, Y. H., Chen, K. W., Chen, C. J., Wu, C. L., Teng, N. Y., et al. (2011). SH2B1beta regulates N‐cadherin levels, cell‐cell adhesion and nerve growth factor‐induced neurite initiation. J Cell Physiol, 226(8), 2063‐2074.
Wang, W. X., Rajeev, B. W., Stromberg, A. J., Ren, N., Tang, G., Huang, Q., et al. (2008). The expression of microRNA miR‐107 decreases early in Alzheimer's disease and may accelerate disease progression through regulation of beta‐site amyloid precursor protein‐cleaving enzyme 1. J Neurosci, 28(5), 1213‐1223.

141
Weaver, S., Dube, S., Mir, A., Qin, J., Sun, G., Ramakrishnan, R., et al. (2010). Taking qPCR to a higher level: Analysis of CNV reveals the power of high throughput qPCR to enhance quantitative resolution. Methods, 50(4), 271‐276.
Weiss, L. A., Shen, Y., Korn, J. M., Arking, D. E., Miller, D. T., Fossdal, R., et al. (2008). Association between microdeletion and microduplication at 16p11.2 and autism. N Engl J Med, 358(7), 667‐675.
Weterman, M. A., van Ruissen, F., de Wissel, M., Bordewijk, L., Samijn, J. P., van der Pol, W. L., et al. (2010). Copy number variation upstream of PMP22 in Charcot‐Marie‐Tooth disease. Eur J Hum Genet, 18(4), 421‐428.
Wieczorek, D., Pawlik, B., Li, Y., Akarsu, N. A., Caliebe, A., May, K. J., et al. (2010). A specific mutation in the distant sonic hedgehog (SHH) cis‐regulator (ZRS) causes Werner mesomelic syndrome (WMS) while complete ZRS duplications underlie Haas type polysyndactyly and preaxial polydactyly (PPD) with or without triphalangeal thumb. Hum Mutat, 31(1), 81‐89.
Wijsman, E. M., Pankratz, N. D., Choi, Y., Rothstein, J. H., Faber, K. M., Cheng, R., et al. (2011). Genome‐wide association of familial late‐onset Alzheimer's disease replicates BIN1 and CLU and nominates CUGBP2 in interaction with APOE. PLoS Genet, 7(2), e1001308.
Wilkinson, D. G. (2000). Eph receptors and ephrins: regulators of guidance and assembly. Int Rev Cytol, 196, 177‐244.
Williams, N. M., Zaharieva, I., Martin, A., Langley, K., Mantripragada, K., Fossdal, R., et al. (2010). Rare chromosomal deletions and duplications in attention‐deficit hyperactivity disorder: a genome‐wide analysis. Lancet, 376(9750), 1401‐1408.
Williamson, R., van Aalten, L., Mann, D. M., Platt, B., Plattner, F., Bedford, L., et al. (2011). CRMP2 Hyperphosphorylation is Characteristic of Alzheimer's Disease and Not a Feature Common to Other Neurodegenerative Diseases. J Alzheimers Dis.
Willour, V. L., Yao Shugart, Y., Samuels, J., Grados, M., Cullen, B., Bienvenu, O. J., 3rd, et al. (2004). Replication study supports evidence for linkage to 9p24 in obsessive‐compulsive disorder. Am J Hum Genet, 75(3), 508‐513.
Wolfe, M. S. (2007). When loss is gain: reduced presenilin proteolytic function leads to increased Abeta42/Abeta40. Talking Point on the role of presenilin mutations in Alzheimer disease. EMBO Rep, 8(2), 136‐140.
Yamashita, N., Morita, A., Uchida, Y., Nakamura, F., Usui, H., Ohshima, T., et al. (2007). Regulation of spine development by semaphorin3A through cyclin‐dependent kinase 5 phosphorylation of collapsin response mediator protein 1. J Neurosci, 27(46), 12546‐12554.
Yamashita, N., Uchida, Y., Ohshima, T., Hirai, S., Nakamura, F., Taniguchi, M., et al. (2006). Collapsin response mediator protein 1 mediates reelin signaling in cortical neuronal migration. J Neurosci, 26(51), 13357‐13362.
Yamazaki, Y., Takahashi, T., Hiji, M., Kurashige, T., Izumi, Y., Yamawaki, T., et al. (2010). Immunopositivity for ESCRT‐III subunit CHMP2B in granulovacuolar degeneration of neurons in the Alzheimer's disease hippocampus. Neurosci Lett, 477(2), 86‐90.
Yamin, G. (2009). NMDA receptor‐dependent signaling pathways that underlie amyloid beta‐protein disruption of LTP in the hippocampus. J Neurosci Res, 87(8), 1729‐1736.
Yang, D. S., Stavrides, P., Mohan, P. S., Kaushik, S., Kumar, A., Ohno, M., et al. (2011). Reversal of autophagy dysfunction in the TgCRND8 mouse model of Alzheimer's disease ameliorates amyloid pathologies and memory deficits. Brain, 134(Pt 1), 258‐277.
Yao, H. H., & Capel, B. (2005). Temperature, genes, and sex: a comparative view of sex determination in Trachemys scripta and Mus musculus. J Biochem, 138(1), 5‐12.

142
Young, S. Z., Taylor, M. M., & Bordey, A. (2011). Neurotransmitters couple brain activity to subventricular zone neurogenesis. Eur J Neurosci, 33(6), 1123‐1132.
Yuasa‐Kawada, J., Suzuki, R., Kano, F., Ohkawara, T., Murata, M., & Noda, M. (2003). Axonal morphogenesis controlled by antagonistic roles of two CRMP subtypes in microtubule organization. Eur J Neurosci, 17(11), 2329‐2343.
Zhang, C., Browne, A., Child, D., Divito, J. R., Stevenson, J. A., & Tanzi, R. E. (2010). Loss of function of ATXN1 increases amyloid beta‐protein levels by potentiating beta‐secretase processing of beta‐amyloid precursor protein. J Biol Chem, 285(12), 8515‐8526.
Zhang, C., Zhang, Z., Castle, J., Sun, S., Johnson, J., Krainer, A. R., et al. (2008). Defining the regulatory network of the tissue‐specific splicing factors Fox‐1 and Fox‐2. Genes Dev, 22(18), 2550‐2563.
Zhang, F., Seeman, P., Liu, P., Weterman, M. A., Gonzaga‐Jauregui, C., Towne, C. F., et al. (2010). Mechanisms for nonrecurrent genomic rearrangements associated with CMT1A or HNPP: rare CNVs as a cause for missing heritability. Am J Hum Genet, 86(6), 892‐903.
Zhang, J., Feuk, L., Duggan, G. E., Khaja, R., & Scherer, S. W. (2006). Development of bioinformatics resources for display and analysis of copy number and other structural variants in the human genome. Cytogenet Genome Res, 115(3‐4), 205‐214.

143
Appendix

144
Abbreviations
A2BP1: Ataxin‐2 binding protein‐1
AAO: Average onset age
AD: Alzheimer’s disease
ADRCs: Alzheimer’s Disease Research Centers
AlzGene: AlzGene Database of AD genetic studies
AMPA: α‐amino‐3‐hydroxy‐5‐methyl‐4‐isoxazolepropionic acid receptor
APOE: Apolipoprotein E protein
APP: Amyloid precursor protein
ASD: Autism spectrum disorder
Aβ40: amyloid‐β‐protein 40‐mer
Aβ42: amyloid‐β‐protein 42‐mer
BAC: Bacterial artificial chromosome
CAA: Cerebral amyloid angiopathy
CHMP2B: Charged multivesicular body protein 2b protein
CMT1a: Charcot–Marie–Tooth disease type 1a
CN: Copy‐number (gene and/or DNA)
CNAM: Copy number analysis module
CNP: Copy number polymorphism
CNVs: copy number variations
145
CRMP1: Collapsin response mediator protein 1
DECIPHER: Database of chromosomal imbalance
Del.: Deletion in the genomic loci
DGV: Database of Genomic Variants
Dip.: Diploid
DS: Downʹs syndrome i.e., trisomy of chromosome 21
Dup.: Duplication in the genomic loci
EOFAD: Early‐onset familial form of Alzheimer’s disease
EPHA6: Ephrin type‐A receptor 6 protein
ERMP1: Endoplasmic reticulum metallopeptidase 1 protein
FBAT: Family based association tests
FISH: fluorescence in situ hybridization
FoSTeS: Fork Stalling and Template Switching
FTD: Frontotemporal dementia
GVD: Granulovacuolar degeneration
GWAS: Genome‐wide association studies
HEFP‐SBE: high efficiency fluorescence polarization single base extension
Het.: Heterozygous
hg18: Human reference genome build version 18
HMM: hidden Markov model segmentation algorithm
146
HNPP: Hereditary Neuropathy wiith liabiility to Pressure Palsies
Hom.: Homozygous
Kb: kilobases
LCR: Low‐copy repeats
LOAD: Late‐onset form of Alzheimer’s disease
LTD: Long‐term synaptic depression
LTP: Long‐term synaptic potentiation
MAPD: Median absolute pairwise difference metrics in Affymetrix DNA array
Mat.: Maternal
Mb: Megabases
NAHR: Non‐allelic homologous recombination
NCRAD: National Cell Repository for AD
NHEJ: Non‐homologous end joining
NIMH: National Institute of Mental Health
NMDA: (N‐methyl‐D‐aspartic acid)‐type glutamate receptors
OMIM: Online Mendelian Inheritance in Man a database
Pat.: Paternal
PBAT: Pedigree based association tests
Phen.: Phenotype
PMP22: Peripheral myelin protein 22 protein

147
PrPc: Prion protein
PSEN1: presenilin 1 protein
PSEN2: presenilin 2 protein
QC: Quality control metrics
qPCR: Quantitative real‐time
RNAseP: Ribonuclease P protein
Rx.: Replicates of reactions
SD: Segmental duplications
SMA: Spinal muscular atrophy
SMN1: Survival motor neuron protein 1
SMN2: Survival motor neuron protein 2
SNCA: Alpha‐synuclein
SNPs: single nucleotide polymorphisms
sQM‐PCR: Semi‐Quantitative Multiplex PCR
SVS: Golden Helix SNP & Variation Suite
Trip.: Triplication in the genomic loci
TSC1: Tuberous sclerosis protein 1
TSC2: Tuberous sclerosis protein 2
VLDLR: Very low density lipo‐protein receptor
VNTR: Variable Number Tandem repeats

148
Supplementary Tables

149
Supplementary Table 1: Additional CNV confirmation in probands using TERT house‐control gene instead of the
RNaseP.
FamID Proband Phen APOE Target Gene
Rx. Count
Control Gene
Rx. Count
Rx. Union
Rx. Intersec.
Gene Quant.
Fluidigm CN
Chip CN
Fluidigm Results
62090 90M0526 1 0 ATBP1 473 TERT 357 473 357 0.49 1 Loss Het. Del.
62135 93M0784 1 1 CDH2 509 TERT 507 639 377 1.5 3 Gain Hom. Dup.
62329 92M0524 1 1 DGV_9478 592 TERT 421 672 341 1.5 3 Gain Het. Dup.
62493 05AD7725 1 0 ERMP1 393 TERT 299 394 298 0.51 1 Loss Het. Del.
62613 95M2194 1 0 EVC2 638 TERT 544 726 456 1.4 3 Gain Het. Dup.
62855 04AD7114 1 0 Intergenic 498 TERT 517 672 343 0.94 1 Loss Diploid
62863 04AD6981 1 1 CLDND1 553 TERT 446 665 334 1.44 3 Gain Het. Dup.
62863 04AD6981 1 1 EPHA6 662 TERT 511 671 502 1.01 3 Gain Diploid
62863 04AD6981 1 1 FILIP1L 583 TERT 452 650 385 1.1 3 Gain Diploid
62309 91M0636 1 1 APP 551 TERT 504 635 420 1.5 3 Gain Control
62309 95M2903 1 1 APP 600 TERT 513 682 431 1.02 2 Diploid Control

150
Supplementary Table 1: The table shows the results from gene quantitation
experiments performed using TaqMan probes and Fluidigm 770 digital array.
The digital array runs nano‐scale qPCR reactions, and hence runs up‐to 770
replicates of every reaction. DNA sample from each test subject were run in
multiplex using a ‘Fam’ labeled target gene and a ‘Vic’ labeled house‐keeping
gene. ‘Rx. Count’ column shows the number of replicate reactions and the ‘Rx.
Inters.’ column is the number of reactions where both target and house‐keeping
(RNAseP and/or TERT) signal were detected. The ‘Gene Quan.’ column shows the
ratio of target gene quantified against the diploid control gene. Ratios in the
range of ~0.5 indicate a heterozygous deletion, ~1.0 indicates diploid and any
ratio >1.5 indicate increase in gene copy number (duplication, triplication etc.).
Column header description: FamID‐family ID, IndID‐individual ID, Proband‐
proband from each family, Phen.‐AD phenotype (see description below), APOE‐
No. of copies of APOE‐ε4, Fluidigm CN‐Copy number inferred from digital
quantitation data, Chip CN‐Copy number inferred from genome‐wide DNA
array data, Del. indicates deletion, Dip. indicates diploid, Dup. indicates
duplication, Het. Indicates heterozygous and Hom. stands for homozygous.

151
Supplementary 2: Image Results from FISH Confirmation experiments in
NIMH families
1. Family 52106: Testing for Gain
1a. Proband: ECNV05‐90C00092
Probes: RP11‐17D23R/RP11‐71J24G RP11‐479F13R/RP11‐71J24G
1b. Unaffected subject: ECNV12‐90C00694
Probes: RP11‐17D23R/RP11‐71J24G RP11‐479F13R/RP11‐71J24G
Interphase FISH analysis of Chr2: 61356817‐61597347 gain CNV in family 52106.
RP11‐ 479F13 and RP11‐17D23 5’‐ends were labeled with Cy3‐dUTP (red) and
RP11‐71J24 was labeled in FITC‐dUTP (green). All subjects show evidence for
diploid copy number in the chromosome 2p15 locus.

152
2. Family 51278: Testing for Loss
2a. Proband: ECNV37‐90C04456 2b. Affected subject: ECNV38‐90C04457
Probes: RP11‐91N2R/295G24g RP11‐91N2R/295G24g
Interphase FISH analysis of Chr9: 2414322‐2565408 deletion CNV in family
52106. RP11‐91N2 5’‐end was labeled with Cy3‐dUTP (red) and RP11‐295G24
was labeled in FITC‐dUTP (green). Both subjects in the family show evidence for
deletion in the chromosome 9p24.2 locus.

153
3. Family 50152: Testing for Loss.
3a. Proband: ECNV02‐90C00045*
Probes: RP11‐ 479F13R/RP11‐71J24G RP11‐17D23R/RP11‐71J24G
3b. Unaffected subject: ECNV03‐90C00070
Probes: RP11‐ 479F13R/RP11‐71J24G RP11‐17D23R/RP11‐71J24G
Interphase FISH analysis of Chr3: 87319617‐87650334 loss CNV in family 50152.
RP11‐479F13 and RP11‐17D23 5’‐end were labeled with Cy3‐dUTP (red) and
RP11‐71J24 was labeled in FITC‐dUTP (green). All affected individuals showed
presence for deletion in the 3p11.2 locus, while the unaffected siblings were
diploid (panel 3b).*lymphoblast cells from 90C00006 were not available.
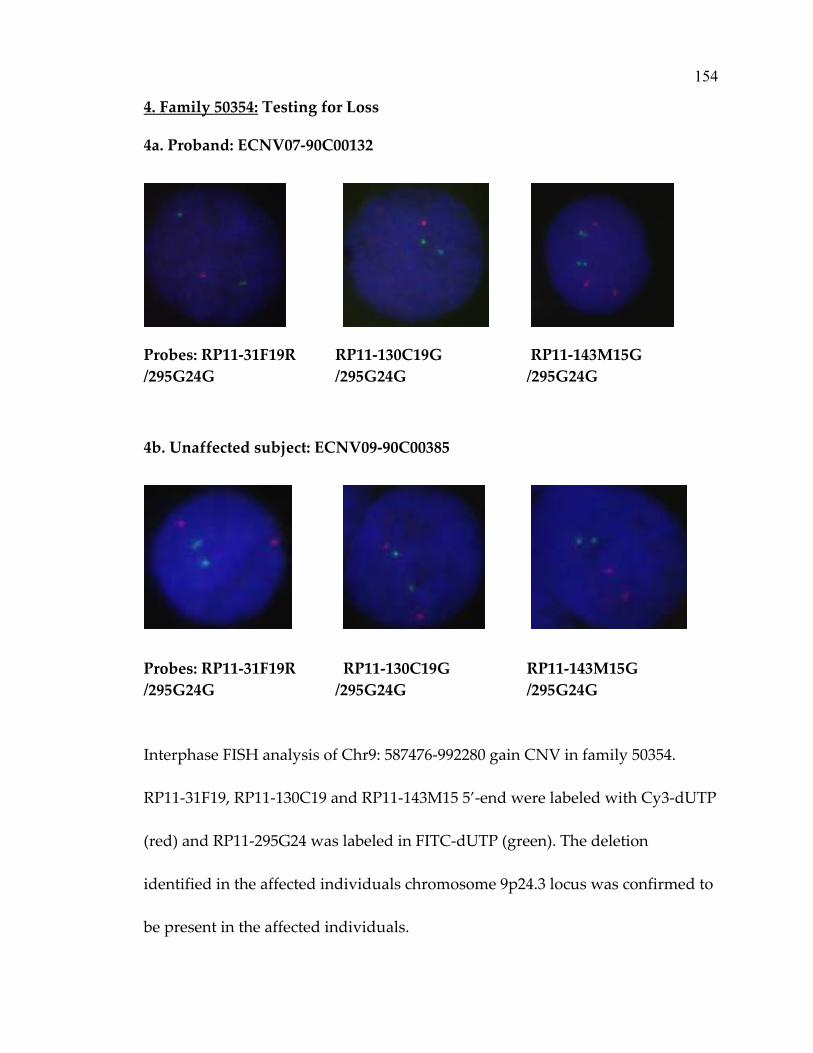
154
4. Family 50354: Testing for Loss
4a. Proband: ECNV07‐90C00132
Probes: RP11‐31F19R RP11‐130C19G RP11‐143M15G
/295G24G /295G24G /295G24G
4b. Unaffected subject: ECNV09‐90C00385
Probes: RP11‐31F19R RP11‐130C19G RP11‐143M15G
/295G24G /295G24G /295G24G
Interphase FISH analysis of Chr9: 587476‐992280 gain CNV in family 50354.
RP11‐31F19, RP11‐130C19 and RP11‐143M15 5’‐end were labeled with Cy3‐dUTP
(red) and RP11‐295G24 was labeled in FITC‐dUTP (green). The deletion
identified in the affected individuals chromosome 9p24.3 locus was confirmed to
be present in the affected individuals.
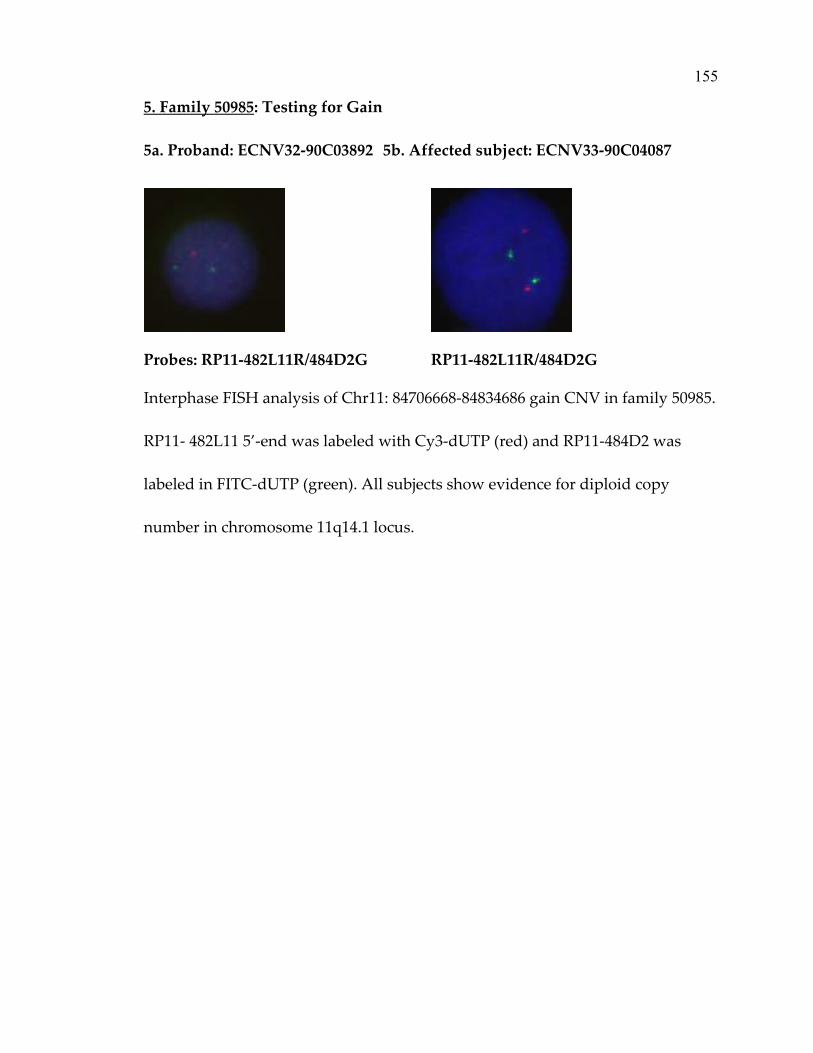
155
5. Family 50985: Testing for Gain
5a. Proband: ECNV32‐90C03892 5b. Affected subject: ECNV33‐90C04087
Probes: RP11‐482L11R/484D2G RP11‐482L11R/484D2G
Interphase FISH analysis of Chr11: 84706668‐84834686 gain CNV in family 50985.
RP11‐ 482L11 5’‐end was labeled with Cy3‐dUTP (red) and RP11‐484D2 was
labeled in FITC‐dUTP (green). All subjects show evidence for diploid copy
number in chromosome 11q14.1 locus.

156
6. Family 50996: Testing for Loss
6a. Proband: ECNV40‐90C04663 6b. Proband: ECNV39‐90C04551
Probes: RP11‐454P3R/166G2G RP11‐454P3R/166G2G
Interphase FISH analysis of Chr12: 72595802‐72710176 gain CNV in family 50996.
RP11‐454P3 5’‐end was labeled with Cy3‐dUTP (red) and RP11‐166G2 was
labeled in FITC‐dUTP (green). All subjects show evidence for diploid copy
number in chromosome 12q21.1 locus.

157
7. Family 50368: Testing for Gain
7a. Proband: ECNV14‐90C00782 7b. Affected subject: ECNV11‐90C00627
Probes: RP11‐362L22R/436G5G RP11‐362L22R/436G5G
Interphase FISH analysis of Chr14: 99818376‐99980583 gain CNV in family 50368.
RP11‐ 362L22 5’‐end was labeled with Cy3‐dUTP (red) and RP11‐436G5 was
labeled in FITC‐dUTP (green). All subjects show evidence for diploid copy
number in this chromosome 14q32.2 locus.
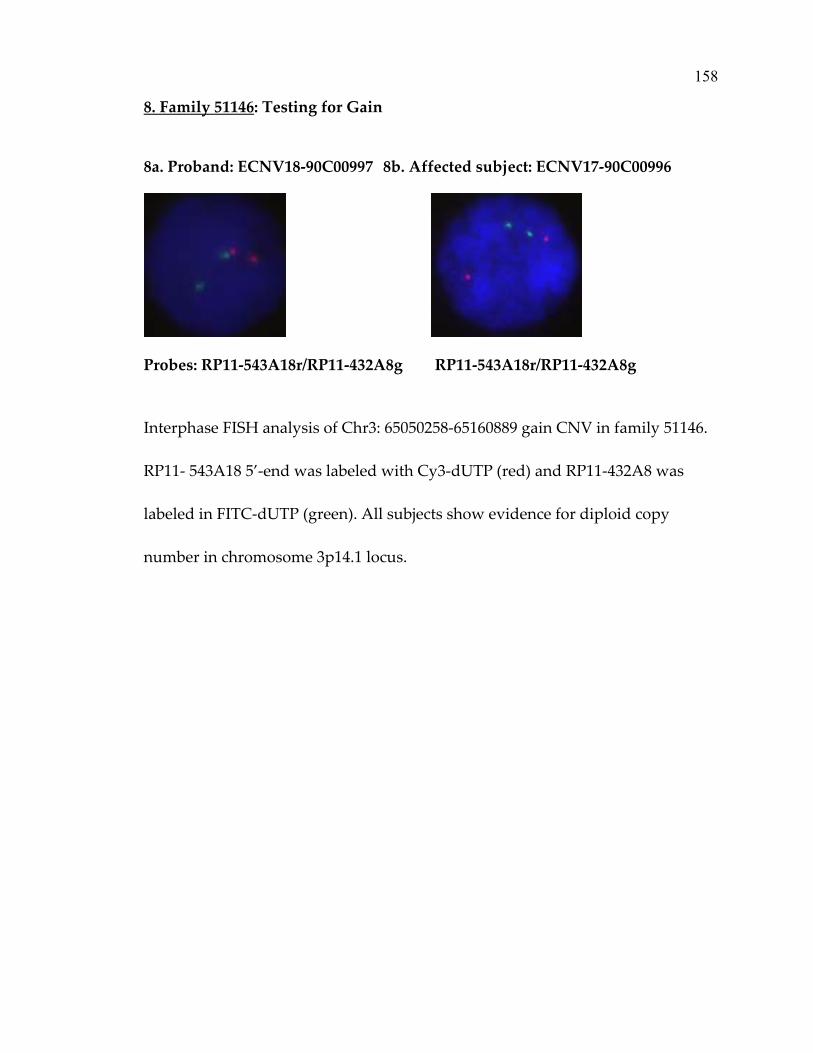
158
8. Family 51146: Testing for Gain
8a. Proband: ECNV18‐90C00997 8b. Affected subject: ECNV17‐90C00996
Probes: RP11‐543A18r/RP11‐432A8g RP11‐543A18r/RP11‐432A8g
Interphase FISH analysis of Chr3: 65050258‐65160889 gain CNV in family 51146.
RP11‐ 543A18 5’‐end was labeled with Cy3‐dUTP (red) and RP11‐432A8 was
labeled in FITC‐dUTP (green). All subjects show evidence for diploid copy
number in chromosome 3p14.1 locus.

159
9. Family 51223: Testing for Gain
9a. Proband: ECNV23‐90C02483 9b. Affected subject: ECNV25‐90C02526
Probes: RP11‐433K16R/RP11‐326O23G RP11‐433K16R/RP11‐326O23G
Interphase FISH analysis of Chr4: 73963661‐74282528 gain CNV in family 51146.
RP11‐ 433K16 5’‐end was labeled with Cy3‐dUTP (red) and RP11‐326O23 was
labeled in FITC‐dUTP (green). All subjects show evidence for diploid copy
number in chromosome 4 q13.3 locus.
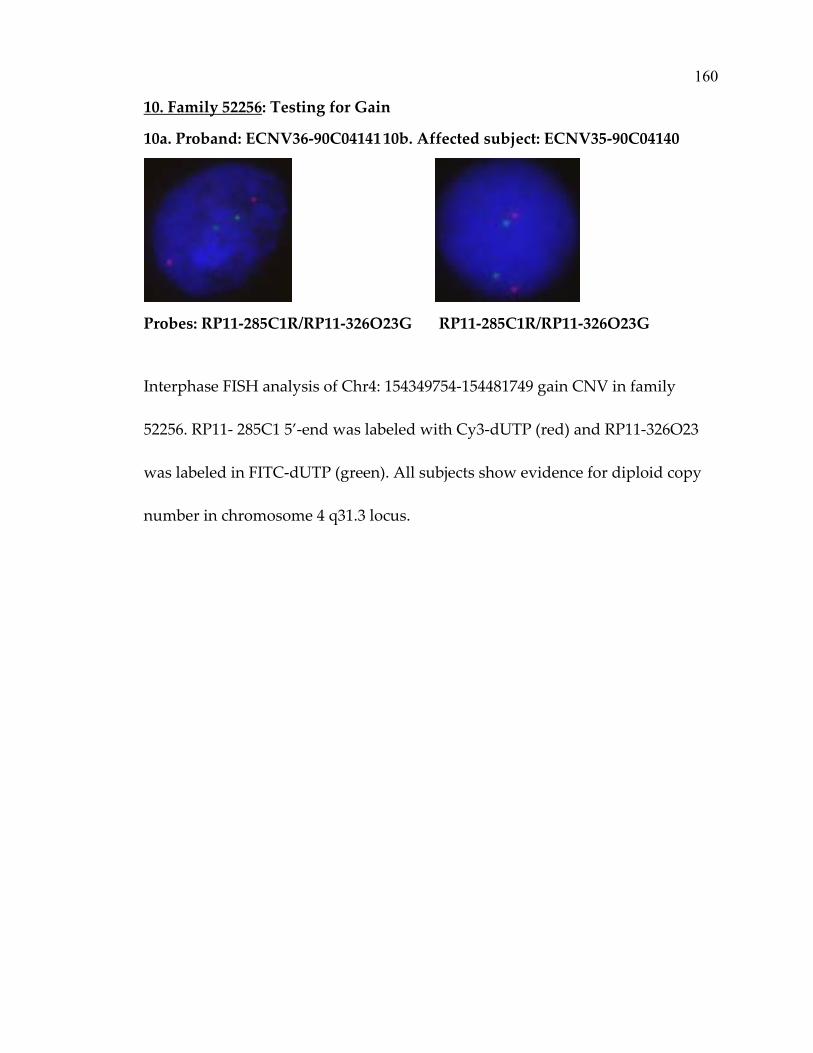
160
10. Family 52256: Testing for Gain
10a. Proband: ECNV36‐90C04141 10b. Affected subject: ECNV35‐90C04140
Probes: RP11‐285C1R/RP11‐326O23G RP11‐285C1R/RP11‐326O23G
Interphase FISH analysis of Chr4: 154349754‐154481749 gain CNV in family
52256. RP11‐ 285C1 5’‐end was labeled with Cy3‐dUTP (red) and RP11‐326O23
was labeled in FITC‐dUTP (green). All subjects show evidence for diploid copy
number in chromosome 4 q31.3 locus.

161
11. Family 51192: Testing for Gain
11.a Unaffected subject: ECNV20‐90C02053* 11.b Proband: ECNV28‐90C03539
Probes: RP5‐995C14R/RP11‐314C16G RP5‐995C14R/RP11‐314C16G
Interphase FISH analysis of Chr6: 78423561‐79081352 gain CNV in family 51192.
RP5‐995C14 5’‐end was labeled with Cy3‐dUTP (red) and RP11‐314C16 was
labeled in FITC‐dUTP (green). All subjects show evidence for diploid copy
number in chromosome 6q14.1 locus.*lymphoblast cells from 90C02341 were not
available.
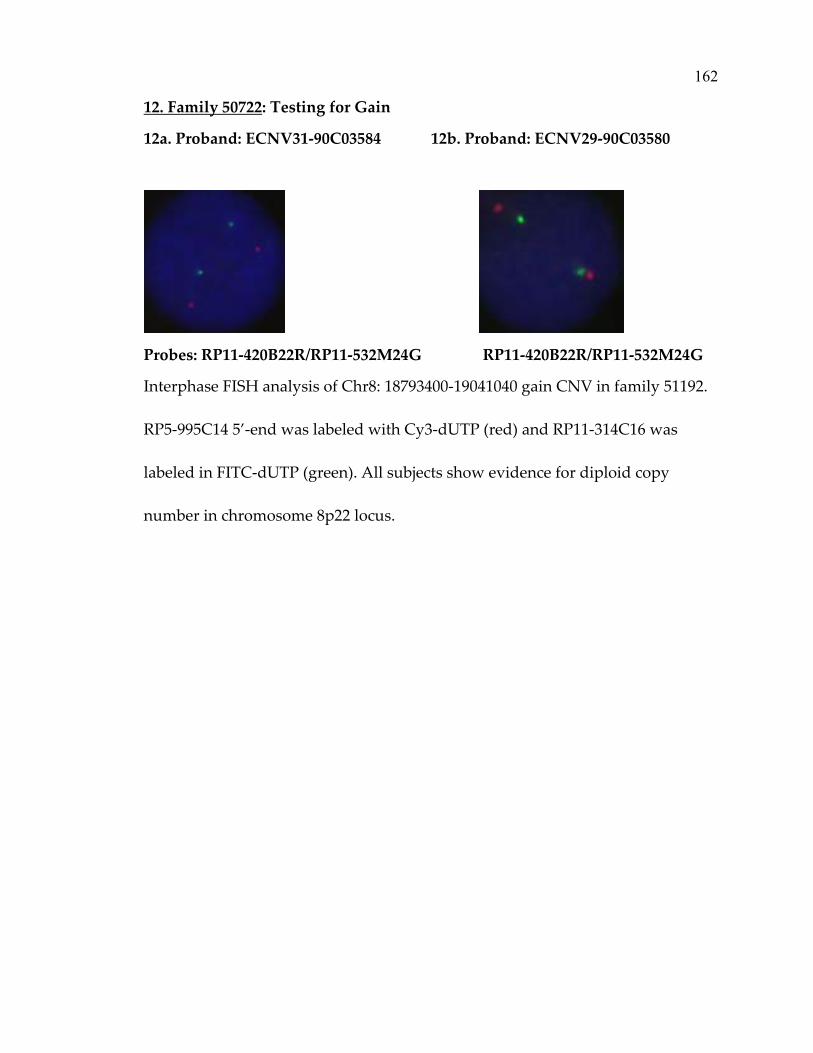
162
12. Family 50722: Testing for Gain
12a. Proband: ECNV31‐90C03584 12b. Proband: ECNV29‐90C03580
Probes: RP11‐420B22R/RP11‐532M24G RP11‐420B22R/RP11‐532M24G
Interphase FISH analysis of Chr8: 18793400‐19041040 gain CNV in family 51192.
RP5‐995C14 5’‐end was labeled with Cy3‐dUTP (red) and RP11‐314C16 was
labeled in FITC‐dUTP (green). All subjects show evidence for diploid copy
number in chromosome 8p22 locus.
163
VITA
1999 B.S. Chemical Engineering Bangalore University, India
2002 M.S. Information Systems Drexel University
2005 M.S. Biology Drexel University
2011 Ph.D. Biology Drexel University, thesis work at
Massachusetts General Hospital
1. Bertram, L., Lange, C., Mullin, K., Parkinson, M., Hogan, M.F., Hooli, B. et al.
(2008) Genome‐wide association analysis reveals putative Alzheimerʹs disease
susceptibility loci in addition to APOE. Am J Hum Genet, 83, 623‐32
2. Bertram, L., Schjeide, B.M., Hooli, B., et al. (2008) No association between
CALHM1 and Alzheimerʹs disease risk. Cell, 135, 993‐4; author reply 994‐6.
3. Schjeide, B.M., McQueen, M.B., Mullin, K., Divito, J., Hogan, M.F., Parkinson, M.,
Hooli, B. et al. (2009) Assessment of Alzheimerʹs disease case‐control
associations using family‐based methods. Neurogenetics, 10, 19‐25.
4. Schjeide, B.M., Hooli, B. et al. (2009) GAB2 as an Alzheimer disease susceptibility
gene: follow‐up of genomewide association results. Arch Neurol, 66, 250‐4.
5. Kim, M., Suh, J., Romano, D., Truong, MH., Mullin, K., Hooli, B. et al. (2009)
Potential late‐onset Alzheimerʹs disease‐associated mutations in the ADAM10
gene attenuate α‐secretase activity. Hum Mol Genet. 2009 Oct 15;18(20):3987‐96.
6. Hooli, B. and Tanzi, RE. A current view of Alzheimer’s disease. Jul 2009, F1000
Biology Reports.
7. Hooli B., Mohapatra, G., Shen, Y., Gusella, JF., Moir, R., Blacker, D., Tanzi, RE.
and Bertram, L. The role of APP genetic variants in Alzheimer’s disease
(finalizing publication).
8. Hooli, B., Mohapatra G., Blacker, D., Bertram, L., and Tanzi, RE. Rare Autosomal
Copy Number Variations in Early‐onset Alzheimer’s disease (finalizing
publication).
9. Hooli, B., Parrado, A., Mullin, K., Gotta, L., Lange, C., Bertram, L. and Tanzi, RE.
Copy Number Variation Analyses in Late‐onset Alzheimer’s disease families
(manuscript in preparation).