Genetic Parameters and Genome-Wide Association Studies for ...
Supplementary Information for
Genome-wide association study dissects the genetic architecture of
oil biosynthesis in maize kernels Hui Li1,6, Zhiyu Peng2,6, Xiaohong Yang1,6, Weidong Wang1,6, Junjie Fu3,6, Jianhua Wang1,6, Yingjia Han1, Yuchao Chai1, Tingting Guo1, Ning Yang4, Jie Liu4, Marilyn L. Warburton5, Yanbing Cheng2, Xiaomin Hao1, Pan Zhang1, Jinyang Zhao2, Yunjun Liu3, Guoying Wang3, Jiansheng Li1, Jianbing Yan4
1National Maize Improvement Center of China, Beijing Key Laboratory of Crop Genetic Improvement, China Agricultural University, Beijing 100193, China.
2BGI-Shenzhen, Shenzhen, 518083, China 3Institute of Crop Science, Chinese Academy of Agricultural Sciences, Beijing 100081, China 4National Key Laboratory of Crop Genetic Improvement, Huazhong Agricultural University, Wuhan 430070,
China. 5United States Department of Agriculture-Agricultural Research Service: Corn Host Plant Resistance
Research Unit, Box 9555, Mississippi State, MS, 39762, USA 6These authors contributed equally to this work. Correspondence should be addressed to J.Y. ([email protected]), J.L. ([email protected]) and G.W. ([email protected]). This file includes: Supplementary Figures 1-13 Supplementary Tables 1-11
Nature Genetics doi:10/1038/ng.2484

Supplementary Figure 1 Percentage of 10 kernel oil components detected by gas chromatography and measured in 508 diverse inbred lines.
Supplementary Figure 2 Distributions of maize kernel oil concentration and composition in 508 inbred lines.
Supplementary Figure 3 Manhattan plots of each chromosome resulting from the GWAS results for oil concentration in maize kernels.
Supplementary Figure 4 Manhattan and quantile-quantile plots resulting from the GWAS results for oil compositional traits in maize kernels.
Supplementary Figure 5 The simplified lipid metabolic pathway in maize, modified from Arabidopsis and other plants.
Supplementary Figure 6 Manhattan plots for the expression GWAS of proposed candidate genes with eQTL.
Supplementary Figure 7 The co-expression network of the 54 most highly connected genes among 67 genes with expression data.
Supplementary Figure 8 The validation of FAD2 via re-sequencing in an independent panel.
Supplementary Figure 9 The validation of ACP via re-sequencing in an independent panel.
Supplementary Figure 10 The validation of LACS via re-sequencing in an independent panel.
Supplementary Figure 11 The validation of WRI1a via re-sequencing in an independent panel.
Supplementary Figure 12 The co-expression network of WRI1a.
Supplementary Figure 13 The validation of COPII via re-sequencing in an independent panel.
Supplementary Table 1 Phenotypic analysis, correlations and heritability of all measured traits
Supplementary Table 2 Correlations among all the measured traits
Supplementary Table 3 SNPs and candidate genes significantly associated with oil compositional traits in two association panels of 368 and 508 maize inbred lines
Supplementary Table 4 SNPs significantly associated with traits after conditioning upon lead SNPs of all oil traits from primary GWAS analysis
Supplementary Table 5 List of possible additional candidate genes within 100 kb flanking region of the 74 lead SNPs
Supplementary Table 6 Comparison of the associations of oil concentration between regular and high-oil lines
Supplementary Table 7 Comparison of the associations of oil compositional traits between regular and high-oil lines
Supplementary Table 8 Confirmation of significant candidate genes in three linkage populations
Supplementary Table 9 Correlation analysis between the phenotype and the expression levels of proposed candidate genes with eQTLs
Supplementary Table 10 The full list of genes in the co-expression network of WRI1a
Supplementary Table 11 List of the primers used in this study
Nature Genetics doi:10/1038/ng.2484

Supplementary Figure 1 Percentage of 10 kernel oil components detected by gas chromatography and measured in 508 diverse inbred lines. Oil concentration was calculated as the sum of all the compositions. C16:0, palmitic acid; C16:1, palmitoleic acid; C18:0, stearic acid; C18:1, oleic acid; C18:2, linoleic acid; C18:3, linolenic acid; C20:0, arachidic acid; C20:1, gadoleic acid; C22:0, behenic acid; C24:0, lignoceric acid.
Nature Genetics doi:10/1038/ng.2484

Supplementary Figure 2 Distributions of maize kernel oil concentration and composition in 508 inbred lines.The left plots are the frequency distributions and the right are the density distributions.
Nature Genetics doi:10/1038/ng.2484

Supplementary Figure 3 Manhattan plots of each chromosome resulting from the GWAS results for oil concentration in maize kernels. The dashed horizontal line depicts the Bonferroni-adjusted significance threshold (1. 8 � 10–6). For each chromosome, the significant unique SNPs are indicated with red dots. The manhanttan plot of chromosome 9 is not shown as there were no significant loci detected on this chromosome. The full gene names are listed in Table 1.
Nature Genetics doi:10/1038/ng.2484

Nature Genetics doi:10/1038/ng.2484

Nature Genetics doi:10/1038/ng.2484

Nature Genetics doi:10/1038/ng.2484

Nature Genetics doi:10/1038/ng.2484

Supplementary Figure 4 Manhattan and quantile-quantile plots resulting from the GWAS results for oil compositional traits in maize kernels. The dashed horizontal line in Manhattan plot depicts the Bonferroni-adjusted significance threshold (1.8 × 10⁻⁶). The lead sites significantly associated with corresponding traits are indicated by red dots on the Manhattan plots. SFA: saturated fatty acid; USFA: Unsaturated fatty acid.
Jianbing Yan� 11/13/12 7:33 PMDeleted: �
Nature Genetics doi:10/1038/ng.2484

Supplementary Figure 5 The simplified lipid metabolic pathway in maize, modified from Arabidopsis and other plants30. The candidate genes corresponding to significant loci detected by GWAS are in orange. The plasmid, endoplasmic reticulum (ER), oil body and peroxisome, are marked with light green, light blue, light orange and light purple, respectively. Abbreviations: PDHC, pyruvate dehydrogenase complex; ACC, acetyl-CoA carboxylase; MCMT, malonyl-CoA:ACP malonyltransferase; FAS, fatty acid synthase; KAS, ketoacyl-ACP synthase; SAD, stearoyl-ACP desaturase; ACP, acyl carrier protein; FAT, acyl-ACP thioesterase; FFA, free fatty acid; LACS, long chain acyl-CoA synthase; FAD2, ER oleate desaturase; FAD3, ER linoleate desaturase; PC, phosphatidylcholine; G3P, glycerol 3-phosphate;GPAT, glycerol phosphate acyltransferase; LPAAT, lysophosphatidic acid (LPA) acyltransferase; PP, phosphatidic acid (PA) phosphatase; DGAT, acyl-CoA: diacylglycerol (DAG) acyltransferase; FAE2, fatty acid elongase; KCS, ketoacyl-CoA synthase; VLCFA, very long chain fatty acid; TAGL, triacylglycerol (TAG) lipase; MAGL: monoacylglycerol (MAG) lipase; CTS, COMATOSE (an ABC transporter); ACT, acyl-CoA thioesterase; ACX, acyl-CoA oxidase.
Nature Genetics doi:10/1038/ng.2484

Nature Genetics doi:10/1038/ng.2484

Nature Genetics doi:10/1038/ng.2484

Nature Genetics doi:10/1038/ng.2484

Supplementary Figure 6 Manhattan plots for the expression GWAS of proposed candidate genes with eQTL. (A–P) the top Manhattan plots of each panel are the GWAS results for oil compositional traits (A–L) and the GWAS results after conditioning upon 63 lead SNPs (M–P). The red dots are the proposed candidate genes with eQTLs. The small Manhattan plots are the expression GWAS results for the candidate genes, and the red diamonds are the most significant sites associated with the expression level of each candidate gene.
Nature Genetics doi:10/1038/ng.2484

Supplementary Figure 7 The co-expression network of the 54 most highly connected genes among 67 genes with expression data.
Nature Genetics doi:10/1038/ng.2484

Supplementary Figure 8 The validation of FAD2 via re-sequencing in an independent panel. (a) Association between polymorphisms within the gene and the phenotypic variation in oleic acid levels in three environments. The x axis is the distance in base pairs along the gene; the first base of the start codon is defined as position 1. The y axis is the probability expressed as –log10 P from a mixed linear model. (b) The structure and functional domain of FAD2. The filled gray boxes represent the exons, open boxes indicate the UTRs, the black dashed lines mark the region re-sequenced in this study, and the orange ellipse represents the location of the conserved functional domain in gene. The red stars represent the lead polymorphisms (PZE–104087413) detected by original GWAS and the proposed functional polymorphisms (S230A) detected by re-sequencing. R1, R2, and R3 are amplicons of
Nature Genetics doi:10/1038/ng.2484

sequencing reaction; the primer sequences are given in Supplementary Table 11. (c) A representation of the pair-wise r2 value (a measure of LD) among the significantly associated sites, where the color of each box corresponds to the r2 value according to the legend. The purple star represents the proposed functional polymorphic locus. (d) Plots of the results from the correlation analysis. The x axis represents the normalized expression level of FAD2 in kernels collected at 15 DAP. The y axis represents the levels of oleic acid and linoleic acid, and the ratio of the two components. The r value is a Pearson correlation coefficient. (e) Box plot of normalized FAD2 expression for each allele of S230A site. The P value is based on a two-tailed t-test. (f) Linkage mapping result for chromosome 4 in a RIL population derived from By804 and B73. The x axis is the genetic map position, and the y axis is the LOD value. The purple line is the empirical significance threshold (LOD = 2.5). QTLs for C18:1 from two environments in Beijing 2005 (B 05) and Beijing 2006 (B 06) were identified; FAD2 is located within these QTLs.
Jianbing Yan� 11/13/12 7:34 PMDeleted: BY804
Nature Genetics doi:10/1038/ng.2484

Supplementary Figure 9 The validation of ACP via re–sequencing in an independent panel. (a) Association between polymorphisms within the gene and the phenotypic variation in oil concentration in three environments. The x axis is the distance in base pairs along the gene; the first base of the start codon is defined as position 1. The y axis is the probability expressed as –log10 P from a mixed linear model. (b) The structure and functional domain of ACP. Filled gray boxes represent exons, open boxes indicate the UTRs, the black dashed lines mark the region re-sequenced in this study and the orange ellipse represents the location of the conserved functional domain in gene. The red star represent the lead polymorphisms (M1c248149904) detected by original GWAS. The red triangle represents the proposed functional polymorphisms (InDel_8) by re-sequencing. The marker, InDel_8, represents the allele with 8-bp or without insertions. R1, R2, and R3 are amplicons of sequencing reaction; the primer sequences are given in Supplementary Table 11. (c) A representation of the pair-wise r2 value (a measure of LD) among the significantly associated sites, where the color of each box corresponds to the r2 value according to the legend. The purple star represents the proposed functional polymorphic locus. (d) Plots of the results from the correlation analysis. The x axis represents the normalized expression level of ACP in kernels collected at 15 DAP. The y axis represents the total oil concentration. The r value is a Pearson correlation coefficient. (e) Box plot of normalized ACP expression for each allele of InDel_8 site. The P value is based on a two-tailed t-test. The phenotypic variation explained (R2) from ANOVA analysis.
Nature Genetics doi:10/1038/ng.2484

Supplementary Figure 10 The validation of LACS via re-sequencing in an independent panel. (a) Association between polymorphisms within the gene and the phenotypic variation in oil concentration in three environments. The x axis is the distance in base pairs along the gene; the first base of the start codon is defined as position 1. The y axis is the probability expressed as –log10P from a mixed linear model. (b) The structure and functional domain of LACS. Filled gray boxes represent exons, open boxes indicate the UTRs, the black dashed lines mark the region re-sequenced in this study and the location of the conserved functional domain in gene. The red star represent the lead polymorphisms (M2c149517635) detected by original GWAS. The red triangle represents the proposed functional polymorphisms (InDel_146/472) by re-sequencing. The marker, InDel_146/472, represents the allele with a 146–bp or 472–bp insertion. R1, R2, and R3 are amplicons of sequencing reaction; the primer sequences are given in Supplementary Table 11. (c) A representation of the pair–wise r2 value (a measure of LD) among the significantly associated sites, where the color of each box corresponds to the r2 value according to the legend. The purple star represents the proposed functional polymorphic locus. (d) Plots of the results from the correlation analysis. The x axis represents the normalized expression of LACS in kernels collected at 15 DAP. The y axis represents the total oil concentration. The r value is a Pearson correlation coefficient. (e) Box plot of normalized LACS expression for each allele of InDel_146/472 site. The P value is based on a two-tailed t-test. The phenotypic variation explained (R2) from ANOVA analysis.
Nature Genetics doi:10/1038/ng.2484

Supplementary Figure 11 The validation of WRI1a via re–sequencing in an independent panel. (a) Association between polymorphisms within the gene and the phenotypic variation in oil concentration in three environments. The x axis is the distance in base pairs along the gene; the first base of the start codon is defined as position 1. The y axis is the probability expressed as –log10P from a mixed linear model. (b) The structure and functional domain of WRI1a. Filled gray boxes represent exons, open boxes indicate the UTRs, the black dashed lines mark the region re-sequenced in this study and the orange ellipse represents the location of the conserved functional domains in gene. The red star represent the lead polymorphisms (M2c149341792) detected by original GWAS. The red triangle represents the proposed functional polymorphisms (InDel_2000) by re-sequencing. InDel_2000 represents the allele with 2000-bp or without insertions. R1, R2, and R3 are amplicons of sequencing reaction; the primer sequences are given in Supplementary Table 11. (c) A representation of the pair–wise r2 value (a measure of LD) among the significantly associated sites, where the color of each box corresponds to the r2 value according to the legend. The purple star represents the proposed functional polymorphic locus. (d) Plots of the results from the correlation analysis. The x axis represents the normalized expression of WRI1a in kernels collected at 15 DAP. The y axis represents the total oil concentration. The r value is a Pearson correlation coefficient. (e) Box plot of normalized WRI1a expression for each allele of InDel_2000 site. The P value is based on a two tailed t-test. The phenotypic variation explained (R2) from ANOVA analysis.
Nature Genetics doi:10/1038/ng.2484

Supplementary Figure 12 The co–expression network of WRI1a. Genes shown in light blue are annotated as transcription factors. Genes shown in yellow were previously reported as the putative target genes of WRI1a33. Genes shown in orange are involved in late glycolysis and fatty acid biosynthesis in plastids. Genes shown in light green are mainly related to carbohydrate metabolism, amino acid metabolism and transmembrane transport. Genes shown in gray have an unknown function. The full list of genes can be found in Supplementary Table 10. Abbreviations: PDHE1, pyruvate dehydrogenase E1; PDHE2, pyruvate dehydrogenase E2; LT, lipoyltransferase; OAT, oleoyl–ACP, thioesterase; KHT, ketopantoate hydroxymethyltransferase; PK, pyruvate kinase; ACAT2, acetoacetyl–CoA thiolase 2; ACP, acyl carrier protein; OLE, oleosin; PPT, phosphoenolpyruvate/phosphate translocator; KAS II, ketoacyl–ACP synthase II; OAS III, oxoacyl–ACP synthase III; SAD, stearoyl–ACP desaturase; FAD2, fatty acid desaturase 2; GH, glycosyl hydrolases; GP, ADP–glucose pyrophosphorylase; PK, protein kinase; S/TPK, serine/ threonine kinase protein; P450, cytochrome P450; ZFP, zinc finger protein; GRF, growth regulating factor; UF, unknown function.
Nature Genetics doi:10/1038/ng.2484

Supplementary Figure 13 The validation of COPII via re-sequencing in an independent panel. (a) Association between polymorphisms within the gene and the phenotypic variation in oil concentration in three environments. The x axis is the distance in base pairs along the gene; the first base of the start codon is defined as position 1. The y axis is the probability expressed as –log10P from a mixed linear model. (b) The structure and functional domain of COPII. Filled gray boxes represent exons, open boxes indicate the UTRs, the black dashed lines mark the region re-sequenced in this study and the orange ellipse represents the location of the conserved functional domain in gene. The red star represent the lead polymorphisms (M8c38521846) detected by original GWAS. The red triangle represents the proposed functional polymorphisms (InDel_20) by re-sequencing. InDel_20 represents the allele with 20-bp or without insertions. R1, R2, R3, and R4 are amplicons of sequencing reaction; the primer sequences are given in Supplementary Table 11. (c) A representation of the pair–wise r2 value (a measure of LD) among the significantly associated sites, where the color of each box corresponds to the r2 value according to the legend. The purple star represents the proposed functional polymorphic locus. (d) Plots of the results from the correlation analysis. The x axis represents the normalized expression of COPII in kernels collected at 15 DAP. The y axis represents the total oil concentration. The r value is a Pearson correlation coefficient. (e) Box plot of normalized COPII expression for each allele of InDel_20 site. The P value is based on a two-tailed t-test. (f) Linkage mapping result for chromosome 8 in the F2:3 population derived from Dan340 and K22. The x axis is the genetic map position, and the y axis is the LOD value. The gray line is the empirical significance threshold (LOD = 2.5). A QTL for total oil was identified; COPII is located within this QTL interval.
Nature Genetics doi:10/1038/ng.2484

SUPPLEMENTARY TABLES 1–11
Supplementary Table 1 Phenotypic analysis, correlations and heritability of all measured traits Category Source of variation DFc Oil C16:0 C16:1 C18:0 C18:1 C18:2 C18:3 C20:0 C20:1 C22:0 C24:0
ANOVAa Environment 3 22.90** 155.78** 0.09** 1.10** 392.56** 79.23** 1.13** 0.56** 0.22** 0.16** 0.12**
Genotype 484 7.70** 9.96** 0.01** 0.98** 128.02** 116.21** 0.29** 0.03** 0.01** 0.01** 0.02**
Error 1452 0.21** 0.32 0.00 0.06 4.70 4.05 0.01 0.00 0.00 0.00 0.00
Heritability 0.97 0.97 0.91 0.93 0.96 0.97 0.96 0.95 0.94 0.92 0.91
95% CI for Hb 0.97–0.98 0.96–0.97 0.90–0.92 0.92–0.94 0.96–0.97 0.96–0.97 0.95–0.96 0.94–0.95 0.93–0.95 0.91–0.93 0.89–0.92
Range 2.28–14.70 9.48–21.93 0.09–0.43 1.10–8.77 14.91–54.52 26.90–65.98 0.52–2.58 0.27–1.04 0.17–0.66 0.09–0.54 0.10–0.74
Mean ± s.d. 4.62 ± 1.60 15.71 ± 1.90 0.20 ± 0.05 2.10 ± 0.59 28.11 ± 6.60 51.02 ± 6.24 1.37 ± 0.32 0.53 ± 0.11 0.34 ± 0.07 0.22 ± 0.06 0.33 ± 0.09
Continued
Category Source of variation DFc C16:0/C16:1 C16:0/C18:0 C18:0/C18:1 C18:1/C18:2 C18:2/C18:3 C18:0/C20:0 C20:0/C20:1 C20:0/C22:0 C22:0/C24:0 SFA/USFA
ANOVA Environment 3 13862.38** 22.92** 0.01** 0.27** 1172.41** 22.46** 6.39** 15.66** 1.14** 0.05**
Genotype 484 901.07** 12.26** 0.00** 0.15** 291.04** 2.56** 0.33** 0.77** 0.09** 0.00**
Error 1452 90.95 0.89 0.00 0.01 10.11 0.16 0.02 0.05 0.01 0.00
Heritability 0.90 0.93 0.94 0.96 0.97 0.94 0.94 0.94 0.92 0.96
95% CI for Hb 0.88–0.91 0.92–0.94 0.93–0.95 0.95–0.96 0.96–0.97 0.93–0.95 0.93–0.95 0.92–0.94 0.91–0.93 0.95–0.97
Range 32.13–220.63 1.57–19.20 0.03–0.27 0.24–2.02 19.23–95.01 2.02–10.27 0.78–3.53 1.28–5.47 0.36–3.04 0.14–0.34
Mean ± s.d. 80.93 ± 19.18 7.93 ± 2.11 0.08 ± 0.03 0.58 ± 0.22 39.06 ± 9.96 4.00 ± 0.97 1.62 ± 0.36 2.56 ± 0.55 0.69 ± 0.19 0.23 ± 0.03
aAnalysis of variance, showing the mean square and degrees of freedom. b95% confidence interval (CI) for broad–sense heritability. **, P < 0.01; *, P < 0.05; s.d., standard
deviation. cDegrees of freedom.
Nature Genetics doi:10/1038/ng.2484

Supplementary Table 2 Correlations among all the measured traits Trait Oil C16:0 C16:1 C18:0 C18:1 C18:2 C18:3 C20:0 C20:1 C22:0 C24:0 C16:0/C16:1 C16:0/C18:0 C18:0/C18:1 C18:1/C18:2 C18:2/C18:3 C18:0/C20:0 C20:0/C20:1 C20:0/C22:0 C22:0/C24:0 SFA/USFA
Oil –0.48** –0.35** 0.19** 0.48** –0.33** –0.69** –0.02 0.04 –0.46** –0.60** 0.10* –0.36** –0.20** 0.40** 0.71** 0.23** –0.07 0.73** 0.29** –0.43**
C16:0 –0.46** 0.36** –0.12** –0.34** 0.04 0.34** 0.16** 0.01 0.32** 0.35** 0.20** 0.55** 0.13** –0.25** –0.41** –0.28** 0.16** –0.33** –0.13** 0.95**
C16:1 –0.28** 0.32** –0.13** –0.05 –0.07 0.26** 0.01 –0.14** 0.19** 0.30** –0.80** 0.23** –0.07 0.00 –0.34** –0.13** 0.15** –0.28** –0.17** 0.32**
C18:0 0.15** –0.07** –0.08** 0.21** –0.27** –0.21** 0.47** –0.18** –0.09* –0.17** 0.10* –0.79** 0.65** 0.22** 0.09* 0.64** 0.62** 0.61** 0.12** 0.19**
C18:1 0.46** –0.34** –0.03 0.19** –0.95** –0.54** 0.21** 0.32** –0.19** –0.34** –0.16** –0.33** –0.56** 0.98** 0.12** 0.06 –0.07 0.52** 0.23** –0.27**
C18:2 –0.31** 0.03 –0.09** –0.27** –0.94** 0.43** –0.34** –0.34** 0.07 0.21** 0.11* 0.24** 0.48** –0.96** 0.05 –0.00 –0.04 –0.46** –0.21** –0.05
C18:3 –0.64** 0.26** 0.25** –0.19** –0.48** 0.39** –0.10* –0.13** 0.34** 0.48** –0.08 0.32** 0.26** –0.47** –0.82** –0.14** 0.02 –0.61** –0.24** 0.28**
C20:0 –0.06* 0.25** 0.05* 0.47** 0.15** –0.31** –0.09** 0.41** 0.68** 0.37** 0.10* –0.29** 0.20** 0.23** –0.10* –0.35** 0.62** 0.13** 0.31** 0.38**
C20:1 –0.05 0.11** –0.16** –0.16** 0.22** –0.27** –0.10** 0.40** 0.42** 0.28** 0.14** 0.19** –0.41** 0.30** –0.04 –0.56** –0.44** –0.08 0.17** 0.01
C22:0 –0.45** 0.35** 0.11** –0.05 –0.21** 0.07** 0.27** 0.67** 0.49** 0.72** –0.02 0.22** 0.06 –0.15** –0.38** –0.67** 0.30** –0.60** 0.22** 0.37**
C24:0 –0.59** 0.36** 0.26** –0.12** –0.33** 0.19** 0.46** 0.41** 0.32** 0.69** –0.10* 0.30** 0.10* –0.29** –0.45** –0.49** 0.13** –0.61** –0.47** 0.37**
C16:0/C16:1 0.06** 0.20** –0.81** 0.08** –0.16** 0.11** –0.11** 0.09** 0.20** 0.07** –0.09** 0.06 0.19** –0.15** 0.13** –0.00 –0.04 0.12** 0.10* 0.22**
C16:0/C18:0 –0.32** 0.50** 0.16** –0.79** –0.32** 0.24** 0.29** –0.29** 0.21** 0.19** 0.25** 0.07** –0.44** –0.30** –0.26** –0.64** –0.45** –0.62** –0.15** 0.30**
C18:0/C18:1 –0.20** 0.17** –0.04 0.68** –0.54** 0.44** 0.20** 0.27** –0.31** 0.11** 0.13** 0.17** –0.46** –0.51** –0.03 0.51** 0.56** 0.10* –0.07 0.33**
C18:1/C18:2 0.38** –0.25** 0.02 0.21** 0.98** –0.96** –0.42** 0.18** 0.21** –0.16** –0.28** –0.16** –0.29** –0.48** 0.02 0.05 –0.03 0.47** 0.21** –0.17**
C18:2/C18:3 0.66** –0.32** –0.32** 0.06* 0.04 0.11** –0.81** –0.10** –0.05* –0.30** –0.41** 0.16** –0.20** 0.01 –0.04 0.19** –0.07 0.50** 0.17** –0.39**
C18:0/C20:0 0.22** –0.30** –0.12** 0.63** 0.08** –0.02 –0.14** –0.35** –0.52** –0.61** –0.46** –0.02 –0.64** 0.48** 0.07** 0.16** 0.14** 0.53** –0.13** –0.14**
C20:0/C20:1 –0.03 0.15** 0.20** 0.60** –0.06* –0.06* 0.01 0.61** –0.46** 0.21** 0.11** –0.10** –0.45** 0.55** –0.01 –0.06* 0.12** 0.20** 0.15** 0.37**
C20:0/C22:0 0.65** –0.26** –0.12** 0.56** 0.46** –0.42** –0.50** 0.13** –0.19** –0.61** –0.52** 0.01 –0.56** 0.12** 0.43** 0.38** 0.46** 0.29** 0.11** –0.17**
C22:0/C24:0 0.25** –0.08** –0.20** 0.09** 0.19** –0.18** –0.25** 0.27** 0.18** 0.28** –0.45** 0.16** –0.12** –0.05* 0.18** 0.18** –0.12** 0.09** –0.02 –0.09*
SFA/USFA –0.41** 0.94** 0.29** 0.25** –0.27** –0.05* 0.21** 0.46** 0.11** 0.41** 0.38** 0.21** 0.23** 0.38** –0.17** –0.31** –0.15** 0.36** –0.11** –0.04
Note: The numbers above and below the diagonal are the genetic and phenotypic correlation coefficients, respectively. **, P < 0.01; *, P < 0.05.
Nature Genetics doi:10/1038/ng.2484

Nature Genetics doi:10/1038/ng.2484

Supplementary Table 3 SNPs and candidate genes significantly associated with oil compositional traits in two association panels of 368 and 508 maize inbred lines Candidate genea Chr. Positionb SNPs Lead traitc Other traitd Allelese MAFf P valueg QTLh QTL
directioni
eQTLj Annotationk
GRMZM2G031790 1 12946006 PZE–101022796 C20:1 A/G 0.15 6.9 × 10⁻⁹ N# 5.4 × 10⁻¹⁸ Ketoacyl–CoA Synthase, KCS S1,S2,S3,S4
GRMZM2G020523 1 77258855 M1c77258855 C16:1 G/C 0.06 7.9 × 10⁻⁸ Y+(D/C) → 1.9 × 10⁻¹⁰ Haem peroxidase
GRMZM2G094742 1 177046239 M1c177046239 C16:1 A/C 0.06 4.0 × 10⁻⁷ Y+(D/C) → 5.2 × 10⁻²² Unknown
GRMZM2G059029 1 179723009 M1c179723009 C20:0 G/A 0.22 1.0 × 10⁻⁷ N# 5.7 × 10⁻⁷ Unknown
GRMZM2G152438 2 158379889 M2c158379889 C18:3 A/C 0.06 9.4 × 10⁻⁷ N# N.S* A cytochrome–b5–containing
fusion protein,
CYTOCHROMB5 30,S5,S6,S7,S8,S9
GRMZM2G169095 2 224370556 M2c224370556 C18:0 C/T 0.05 4.5 × 10⁻⁷ N# N.S* Unknown
GRMZM2G142315 3 158895417 M3c158895417 C18:0/C18:1 T/A 0.08 3.6 × 10⁻⁷ 9 8.1 × 10⁻¹⁴ Phosphatidylinositol/phosphat
idylcholine transfer protein,
PITP S10,S11
GRMZM2G148555 3 217901037 M3c217901037 C16:1 C/G 0.05 9.0 × 10⁻⁷ N# N.S* Unknown
GRMZM2G064701 4 162255467 PZE–104087413 C18:1 C18:2,C18:0/C
18:1,
C18:1/C18:2
A/C 0.47 9.8 × 10⁻¹⁰ 9 Y+(C) N.S* Oleate desaturase, FAD2
(refs.22,30,71,72,73,74)
GRMZM2G021339 4 165834025 M4c165834025 C180/C181 C/A 0.08 1.3 × 10⁻⁶ N# 7.6 × 10⁻¹⁸ Sequence–specific DNA
binding transcription factor
activity
GRMZM2G308193 4 179810276 M4c179810276 C18:0 C/G 0.05 1.1 × 10⁻⁷ N# N.S* Unknown
GRMZM2G142342 4 191765041 M4c191765041 C16:0 SFA/USFA T/C 0.49 6.6 × 10⁻⁷ N# 3.8 × 10⁻¹⁹ Nutrient reservoir activity
GRMZM2G477205 4 216320622 PUT–163a–71759
731–3434
C18:0 C/A 0.05 2.4 × 10⁻⁷ N# 1.6 × 10⁻¹² Zinc finger
Formatted: SuperscriptJianbing Yan� 11/13/12 7:43 PM
Nature Genetics doi:10/1038/ng.2484

Candidate genea Chr. Positionb SNPs Lead traitc Other traitd Allelese MAFf P valueg QTLh QTL
directioni
eQTLj Annotationk
GRMZM2G077295 5 7855279 PZA02538.5 C16:0 A/G 0.06 7.9 × 10⁻⁷ Y+(D) N.S* COPII–coated vesicles, COPII 30,70
GRMZM2G452189 5 210423679 M5c210423679 C20:0/C22:0 A/G 0.09 2.4 × 10⁻⁸ N# N.A* Unknown
GRMZM2G105398 6 102823048 M6c102823048 C18:0/C20:0 T/C 0.42 8.1 × 10⁻⁷ Y+(D/C) → N.S* WD–40 repeats
GRMZM2G079308 6 103139944 M6c103139944 C20:0 A/G 0.08 1.4 × 10⁻⁶ Y+(B) 1.8 × 10⁻¹⁶ Acyl–ACP thioesterases,
FATB.a$ 24,30,S12,S13,S14
GRMZM2G032028 6 103867816 M6c103867816 C22:0 C20:0,C24:0 T/A 0.11 4.9 × 10⁻¹⁰ N# 1.5 × 10⁻⁹ Unknown
GRMZM2G101707 6 104455181 M6c104455181 C24:0 G/T 0.07 6.5 × 10⁻⁷ Y+(B) → 2.1 × 10⁻¹⁶ Protein binding
GRMZM2G103526 6 104760351 M6c104760351 C20:1 G/A 0.29 1.9 × 10⁻⁷ Y+(B/C) ↑↓ 9.9 × 10⁻²⁶ Vegetative storage protein
GRMZM2G029685 6 104966089 M6c104966089 C22:0 C/A 0.12 2.6 × 10⁻⁷ N# 1.5 × 10⁻²⁵ Structural constituent of
ribosome
GRMZM2G416750 6 107320370 M6c107320370 C20:0 C/T 0.25 1.2 × 10⁻⁶ Y+(B) ↓ N.S* Zinc finger
GRMZM2G138842 6 111023230 PZE–106057159 C20:0 A/G 0.29 4.9 × 10⁻⁹ N# 9.9 × 10⁻²¹ Unknown
GRMZM2G701082 6 113560415 M6c113560415 C18:0/C18:1 G/T 0.11 8.4 × 10⁻⁷ N# N.S* Unknown
GRMZM2G122577 6 123914717 M6c123914717 C18:2 G/A 0.22 1.2 × 10⁻⁶ N# N.S* Unknown
GRMZM2G084812 6 124805221 M6c124805221 C18:0 G/C 0.06 1.6 × 10⁻⁶ N# 1.8 × 10⁻⁹ Fasciclin–like arabinogalactan
protein
GRMZM2G101515 6 164986580 M6c164986580 C20:1 T/C 0.09 5.9 × 10⁻⁷ N# N.S* Unknown
GRMZM2G350265 8 113302105 M8c113302105 C18:1 G/C 0.09 3.0 × 10⁻⁷ 9 Y+(C) →→ N.S* Unknown
AC204277.3_FG006 8 118559117 M8c118559117 C20:0 A/G 0.22 1.2 × 10⁻⁶ Y+(C) → 1.5 × 10⁻¹⁴ Unknown
GRMZM2G025966 8 156122430 M8c156122430 C18:0 T/C 0.08 3.6 × 10⁻⁸ Y+(C) → 9.8 × 10⁻¹⁷ Unknown
GRMZM5G863550 9 19041960 M9c19041960 C16:0 A/G 0.45 6.2 × 10⁻⁷ 9 Y+(D/C) →→ 3.5 × 10⁻¹⁶ Unknown
GRMZM2G005522 9 19290857 M9c19290857 SFA/USFA G/A 0.15 2.3 × 10⁻⁷ Y+(B/D/C) ↓→ 6.6 × 10⁻⁹ Acyl–transferase
GRMZM5G829544 9 20583914 M9c20583914 C16:0 C16:0/C16:1,C
16:0/C18:0,SF
G/T 0.2 8.5 × 10⁻¹⁹ 9Y+(D/C) 3.9 × 10⁻⁸ Acyl–ACP thioesterases,
FATB.b$ 24,30,S12,S13,S14
Formatted: SuperscriptJianbing Yan� 11/13/12 7:44 PM
Nature Genetics doi:10/1038/ng.2484

Candidate genea Chr. Positionb SNPs Lead traitc Other traitd Allelese MAFf P valueg QTLh QTL
directioni
eQTLj Annotationk
A/USFA,C18:0
/C18:1
GRMZM2G022558 9 86863679 PZB00761.1 C18:0/C20:0 A/G 0.47 6.2 × 10⁻¹⁰ N# N.S* Fatty acid elongase, FAE2 30,S15,S16,S17
GRMZM2G117207 9 138016631 PZE–109090146 C18:2/C18:3 C18:3 C/A 0.16 2.2 × 10⁻⁸ Y+(B) ↑ 7.3 × 10⁻¹¹ Unknown
GRMZM2G434170 10 5224343 M10c5224343 C18:1/C18:2 C18:1 C/G 0.10 9.4 × 10⁻⁷ N# 1.9 × 10⁻³⁰ Hydrolase activity
GRMZM2G044306 10 79745422 M10c79745422 C18:0 T/C 0.06 6.3 × 10⁻⁷ Y+(C) → N.S* RNA polymerase II aA plausible biological candidate gene in the locus or the nearest annotated gene to the lead SNP. bPosition in base pairs for the lead SNP according to B73 reference sequence (MaizeSequence V5b.60, www.maizesequence.org). cThe oil trait associated with the highest P value among oil compositional traits. dAdditional oil trait with a high probability of association (P < 1.78 × 10⁻⁶). eMajor allele (first) and minor allele. The underlined base is the favorable allele. fMinor allele frequency (MAF). gP values of the lead trait only. hThe candidate gene is located in one of the QTL intervals reported previously (see supplementary references indicated in brackets) or in the BY804/B73 RIL population (B) or in one or both of the F2:3/F2:4 populations K22/Dan340 (D) and CI7/K22 (C). #The candidate was not located in any QTL interval. +The candidate gene was located in one or more QTL intervals in the B, D and C populations. iThe allele effect direction in B, D and C populations. ↑High parent. ↓ Low parent. → Not segregated. jSNP located within 200 kb of the proposed candidate gene, that was most significantly associated with the expression level of this gene. N.S., not significant (P > 1. 8 × 10⁻⁶); N.A., not available (no expression data for that candidate gene). kEach candidate gene is annotated according to Interproscan (http://www.ebi.ac.uk/interpro). The supplementary references for these genes are included in brackets at the end of the annotation. $There are two copies of this gene in the maize genome.
Nature Genetics doi:10/1038/ng.2484

Nature Genetics doi:10/1038/ng.2484

Supplementary Table 4 SNPs significantly associated with traits after conditioning upon lead SNPs of all oil traits from primary GWAS analysis Candidate genea Chr. Positionb SNP Lead traitc Other
traitd
Allelese MAFf P valueg QTLh QTL
directioni
eQTLj Annotationk
GRMZM2G445791 1 60219002 M1c60219002 C22:0/C24:0 C/T 0.05 9.4 × 10⁻⁷ Y+(D) N.A. Acyl–CoA oxidase,
ACX S18,S19,S20
GRMZM2G062357 1 290114310 M1c290114310 C22:0/C24:0 A/G 0.11 7.1 × 10⁻⁷ Y+(B)
→
9.5 × 10⁻¹⁶ Acetyl–CoA synthetase 30,S21
GRMZM2G167428 1 296657535 SYN27357 C18:1/C18:2 C/A 0.09 1.5 × 10⁻⁶ N# 3.0 × 10⁻¹¹ Unknown
GRMZM2G132468 2 235442363 M2c235442363 C22:0/C24:0 C/A 0.06 1.3 × 10⁻⁶ N# N.S.* Protein–tyrosine
phosphatase
GRMZM2G044625 4 5118595 M4c5118595 C22:0/C24:0 T/C 0.05 3.6 × 10⁻⁷ N# 6.2 × 10⁻¹⁷ Nutrient reservoir
activity
GRMZM2G037334 4 152522282 M4c152522282 C18:3 C/G 0.19 1.7 × 10⁻⁶ N# 6.7 × 10⁻¹⁴ Unknown
GRMZM2G040452 4 229538531 M4c229538531 C16:0/C16:1 C/T 0.06 1.1 × 10⁻⁶ N# 3.0 × 10⁻¹⁶ Protein phosphatase
2C, PP2C
GRMZM2G400281 5 18624685 M5c18624685 C20:0/C20:1 G/T 0.13 1.4 × 10⁻⁶ N# N.A.* 4A nuclear receptor
GRMZM2G141999 6 167688878 M6c167688878 C22:0/C24:0 C/A 0.06 5.8 × 10⁻⁹ N# N.A.* Epoxide hydrolase, EH 51,52
GRMZM2G153569 8 112148115 M8c112148115 C18:1/C18:2 C18:1 C/G 0.07 2.2 × 10⁻⁷ Y+(C)
→
4.4 × 10⁻²¹ Translation elongation
factor, EF1B
GRMZM2G166383 8 156042698 M8c156042698 C22:0/C24:0 T/C 0.05 8.4 × 10⁻⁷ N# 5.8 × 10⁻¹² Unknown aA plausible biological candidate gene either in the locus or the nearest annotated gene to the lead SNP. bPosition in base pairs for the lead SNP according to version 5b.60 of the maize reference sequence (www.maizesequence.org). cThe lipid traits associated with the highest P value among all traits. dAdditional lipid traits with P < 1.78 × 10⁻⁶. eMajor allele (first) and minor allele. The underlined base indicates the favorable allele. fMinor allele frequency (MAF). gP values of the lead trait only. hThe candidate gene is located in one of the QTL intervals reported previously (see supplementary references indicated in brackets) or in the BY804/B73 RIL population (B) or in one or both of the F2:3/F2:4 populations, K22/Dan340 (D) and CI7/K22 (C). #The candidate was not located in any QTL interval. +The candidate gene was located in one or more QTL intervals in the B, D and C populations. iThe allele effect direction in B, D and C populations. → Not segregated. jSNP located within 200 kb of the candidate gene, that was most significantly associated with the expression of this gene. N.S., not significant (P > 1. 8 × 10⁻⁶); V. A., not available. kEach candidate gene is annotated according to InterProScan (http://www.ebi.ac.uk/interpro). The supplementary references for these genes are included in brackets at the end of the annotation.
Nature Genetics doi:10/1038/ng.2484

Supplementary Table 5 List of possible additional candidate genes within a 100 kb flanking region of the 74 lead SNPs SNPa Chr. Position Gene listb
PZE–101022796 1 12946006 GRMZM2G031718,GRMZM2G172448,GRMZM2G172410,GRMZM2G172322
M1c16370466 1 16370466 GRMZM5G855347,GRMZM2G064663,GRMZM2G064732,GRMZM2G080586
M1c17643572 1 17643572 GRMZM2G496991,GRMZM2G153393,GRMZM5G815358,GRMZM2G410623
M1c60219002 1 60219002 GRMZM2G144995,GRMZM2G144868
M1c77258855 1 77258855 GRMZM2G057412
PZE-101132612 1 170961674 None
M1c177046239 1 177046239 GRMZM2G005887,GRMZM2G009530,GRMZM2G094850
M1c179723009 1 179723009 GRMZM5G839017,GRMZM2G059064,GRMZM2G358924
M1c248149904 1 248149904 GRMZM2G110328,GRMZM2G110304,GRMZM2G110294,GRMZM2G408967
M1c290114310 1 290114310 GRMZM2G062394,GRMZM2G062377,GRMZM2G062289,GRMZM2G047299,GRMZM2G047223,GRMZM2G349062,GRMZM2G046231,GR
MZM2G046267,GRMZM2G022662
SYN27357 1 296657535 GRMZM2G051675,GRMZM2G113158
PZE-102073982 2 54358837 None
M2c149517635 2 149517635 GRMZM2G079127
M2c158379889 2 158379889 GRMZM2G455491,GRMZM2G175576
M2c224370556 2 224370556 GRMZM2G358619,GRMZM2G358633
M2c235442363 2 235442363 GRMZM5G881605,GRMZM2G082974,GRMZM2G083094,GRMZM2G132504
M3c158895417 3 158895417 GRMZM2G471529,GRMZM2G171600
M3c166664152 3 166664152 GRMZM2G176570,GRMZM2G176576
M3c167431166 3 167431166 GRMZM2G044055,GRMZM2G044092,GRMZM2G118362,GRMZM2G044584
M3c178136002 3 178136002 GRMZM2G003682,GRMZM2G177518
M3c217901037 3 217901037 GRMZM2G148532,GRMZM2G057733
M4c5118595 4 5118595 GRMZM2G088273,GRMZM2G088365,GRMZM2G088441,GRMZM2G388461,GRMZM2G045387,GRMZM2G346895,GRMZM2G346897,GR
MZM2G044104,GRMZM2G044152,GRMZM2G160739
M4c6601732 4 6601732 GRMZM2G054651,GRMZM2G133756,GRMZM2G133781
M4c32810884 4 32810884 GRMZM5G828945,GRMZM2G055520,GRMZM2G055499,GRMZM5G890820,GRMZM2G152573
Nature Genetics doi:10/1038/ng.2484

SNPa Chr. Position Gene listb
M4c152522282 4 152522282 GRMZM2G059021,GRMZM2G148485
PZE–104087413 4 162255467 GRMZM2G064960,GRMZM2G365298,GRMZM2G065030,GRMZM2G065044
M4c165680223 4 165680223 GRMZM2G122846,GRMZM2G122843,GRMZM2G122811,GRMZM2G122715
M4c165834025 4 165834025 GRMZM2G021248
M4c165969105 4 165969105 GRMZM2G166713,GRMZM2G125378,GRMZM2G125387,GRMZM2G125455,GRMZM2G125512,GRMZM2G125544
M4c179810276 4 179810276 GRMZM2G008839,GRMZM2G008819,GRMZM2G008691,GRMZM2G007729
M4c191765041 4 191765041 GRMZM2G441541,GRMZM2G142344
PUT–163a–7175973
1–3434 4 216320622 GRMZM2G173903,GRMZM2G138896
M4c228013669 4 228013669 AC185300.4_FG002,GRMZM2G345055,GRMZM2G044848
M4c229538531 4 229538531 GRMZM2G069631
M4c236185943 4 236185943 GRMZM2G339018,GRMZM2G041310,GRMZM2G041159,GRMZM2G580389,GRMZM2G087226
PZA02538.5 5 7855279 GRMZM2G147809,GRMZM2G147814,GRMZM2G147862,GRMZM2G147880
M5c15700222 5 15700222 GRMZM2G007810,AC197122.3_FG003,GRMZM2G100246
M5c15800012 5 15800012 GRMZM2G064852,GRMZM2G136889
M5c18624685 5 18624685 GRMZM2G363437,GRMZM2G044900
M5c25549428 5 25549428 GRMZM2G305446
M5c210423679 5 210423679 GRMZM2G149452,GRMZM2G154301
M6c102823048 6 102823048 GRMZM2G402672
M6c103139944 6 103139944 GRMZM2G139796,GRMZM2G079080,GRMZM2G079200
M6c103867816 6 103867816 GRMZM2G335618,GRMZM2G567373,GRMZM2G382618
M6c104455181 6 104455181 GRMZM2G055209,GRMZM2G159744
M6c104760351 6 104760351 GRMZM2G109009
M6c104859429 6 104859429 GRMZM2G169114
M6c104966089 6 104966089 GRMZM2G367631,GRMZM2G331283,GRMZM2G029506
M6c107320370 6 107320370 GRMZM2G030583,GRMZM2G116986,GRMZM2G116919
PZE–106057159 6 111023230 GRMZM2G442215,GRMZM2G442244
Nature Genetics doi:10/1038/ng.2484

SNPa Chr. Position Gene listb
M6c113560415 6 113560415 GRMZM5G826194,GRMZM5G854948
M6c123914717 6 123914717 GRMZM2G122563
M6c124805221 6 124805221 None
M6c164986580 6 164986580 GRMZM2G366778,GRMZM2G065757,GRMZM2G366795
M6c167688878 6 167688878 GRMZM2G142068,GRMZM2G167786,GRMZM2G167860,GRMZM2G010953,GRMZM2G021661
M7c109329336 7 109329336 GRMZM2G092525
M8c21615641 8 21615641 GRMZM2G527017,GRMZM2G034157
M8c38521846 8 38521846 GRMZM2G097141,GRMZM2G097103,GRMZM2G003103,GRMZM5G889218
M8c100960678 8 100960678 GRMZM2G052926,GRMZM2G457562
M8c112148115 8 112148115 GRMZM2G153552
M8c113302105 8 113302105 GRMZM2G154463
M8c118559117 8 118559117 None
M8c156042698 8 156042698 GRMZM2G043737,GRMZM5G800211,GRMZM5G847358,GRMZM2G054632
M8c156122430 8 156122430 None
M9c19041960 9 19041960 GRMZM2G098721,GRMZM2G098750,GRMZM2G028552
M9c19290857 9 19290857 GRMZM2G103179,GRMZM2G005461,GRMZM2G005339,GRMZM2G485304,GRMZM2G104269,GRMZM2G104237
M9c20583914 9 20583914 GRMZM2G391473,GRMZM5G899300,GRMZM2G103475
PZB00761.1 9 86863679 GRMZM2G022275
PZE–109090146 9 138016631 GRMZM2G117246
M10c5224343 10 5224343 None
M10c16487751 10 16487751 GRMZM2G028307,GRMZM2G091819,AC210050.3_FG006
M10c26483664 10 26483664 None
M10c79745422 10 79745422 None
PZE-110061746 10 116894888 GRMZM2G043737,GRMZM5G800211,GRMZM5G847358,GRMZM2G054632
aSNPs are reordered according to chromosome and physical position, which are listed in Table 1, Supplementary Tables 3 and 4. bOther possible candidate genes besides proposed candidates.
Nature Genetics doi:10/1038/ng.2484

Supplementary Table 6 Comparison of the associations of oil concentration between regular and high-oil lines SNP* P value* Alleles* MAF* P value (2)a Alleles (2)b MAF (2)c P value (3)a Alleles (3)b MAF(3)c
M1c16370466 7.7 × 10⁻⁸ T/C 0.07 8.0 × 10⁻⁴ T/C 0.04 3.4 × 10⁻³ T/C 0.48
M1c17643572 6.9 × 10⁻⁸ T/A 0.06 0.46 T/A 0.02 3.2 × 10⁻² T/A 0.35
PZE-101132612 4.1 × 10⁻⁸ C/A 0.06 8.8 × 10⁻³ C/A 0.03 5.9 × 10⁻² C/A 0.43
M1c248149904 1.3 × 10⁻⁶ T/C 0.05 0.26 T/C 0.02 1.5 × 10⁻⁶ C/T 0.48
PZE-102073982 3.0 × 10⁻⁷ A/G 0.13 8.6 × 10⁻² A/G 0.08 0.59 A/G 0.35
M2c149517635 1.3 × 10⁻⁷ T/G 0.05 0.26 T/G 0.02 0.42 T/G 0.35
M3c166664152 4.6 × 10⁻⁷ C/G 0.08 0.57 C/G 0.03 0.12 C/G 0.30
M3c167431166 1.1 × 10⁻⁶ C/T 0.08 5.7 × 10⁻² C/T 0.04 1.3 × 10⁻² C/T 0.39
M3c178136002 8.5 × 10⁻⁷ G/C 0.06 0.18 G/C 0.02 0.12 G/C 0.30
M4c6601732 1.8 × 10⁻⁷ A/G 0.06 0.88 A/G 0.02 0.62 A/G 0.26
M4c32810884 9.4 × 10⁻⁷ A/G 0.10 0.43 A/G 0.06 3.6 × 10⁻³ A/G 0.30
M4c165680223 8.5 × 10⁻⁷ G/C 0.14 1.3 × 10⁻² G/C 0.11 1.6 × 10⁻³ G/C 0.26
M4c165969105 1.0 × 10⁻⁶ G/A 0.05 2.5 × 10⁻³ G/A 0.02 5.7 × 10⁻⁶ G/A 0.48
M4c228013669 1.2 × 10⁻⁶ C/T 0.12 7.4 × 10⁻² C/T 0.08 7.4 × 10⁻³ C/T 0.22
M4c236185943 1.2 × 10⁻⁹ G/C 0.06 0.44 G/C 0.02 7.8 × 10⁻⁴ G/C 0.35
M5c15700222 6.7 × 10⁻⁷ A/G 0.10 0.34 A/G 0.06 1.6 × 10⁻³ A/G 0.35
M5c15800012 3.8 × 10⁻¹³ G/C 0.05 6.6 × 10⁻² G/C 0.02 3.0 × 10⁻⁶ G/C 0.35
M5c25549428 1.5 × 10⁻⁶ C/T 0.12 0.28 C/T 0.07 0.46 C/T 0.17
M6c104859429 3.9 × 10⁻¹⁵ C/T 0.15 3.9 × 10⁻⁶ C/T 0.10 0.60 C/T 0.04
M7c109329336 1.1 × 10⁻⁶ C/A 0.07 9.4 × 10⁻² C/A 0.03 6.1 × 10⁻³ C/A 0.39
M8c21615641 2.7 × 10⁻¹² G/T 0.07 9.7 × 10⁻³ G/T 0.02 0.30 G/T 0.13
M8c38521846 3.4 × 10⁻¹⁴ G/T 0.06 0.34 G/T 0.01 0.25 G/T 0.22
M8c100960678 6.1 × 10⁻¹³ G/A 0.05 6.5 × 10⁻² G/A 0.01 3.9 × 10⁻⁴ G/A 0.35
M10c16487751 1.6 × 10⁻⁷ A/C 0.05 0.77 A/C 0.02 2.5 × 10⁻² A/C 0.39
M10c26483664 7.7 × 10⁻⁷ T/C 0.18 7.3 × 10⁻³ T/C 0.13 4.6 × 10⁻² T/C 0.13
Nature Genetics doi:10/1038/ng.2484

SNP* P value* Alleles* MAF* P value (2)a Alleles (2)b MAF (2)c P value (3)a Alleles (3)b MAF(3)c
PZE-110061746 1.3 × 10⁻⁸ G/A 0.08 0.17 G/A 0.03 0.12 G/A 0.22
*These values are listed in Table1. (2) Associations of oil concentration in regular lines excluding high-oil lines. (3) Associations of oil concentration in high-oil lines excluding regular lines. aP value of association. bMajor allele (first), minor allele. The underlined bases are the favorable alleles. cMinor allele frequency (MAF).
Nature Genetics doi:10/1038/ng.2484

Supplementary Table 7 Comparison of the associations of oil compositional traits between regular and high-oil lines
SNP* P value* Alleles* MAF* P value (2)a Alleles (2)b MAF (2)b P value (3)a Alleles (3)b MAF (3)c
PZE–101022796 6.9 × 10⁻⁹ A/G 0.15 1.3 × 10⁻⁸ A/G 0.19 - A#
M1c77258855 7.9 × 10⁻⁸ G/C 0.06 1.7 × 10⁻⁷ G/C 0.06 - G#
M1c177046239 4.0 × 10⁻⁷ A/C 0.06 1.1 × 10⁻⁶ A/C 0.07 - A#
M1c179723009 1.0 × 10⁻⁷ G/A 0.22 1.3 × 10⁻⁷ G/A 0.22 0.92 A/G 0.35
M2c158379889 9.4 × 10⁻⁷ A/C 0.06 4.0 × 10⁻⁶ A/C 0.07 - A#
M2c224370556 4.5 × 10⁻⁷ C/T 0.05 1.5 × 10⁻⁵ C/T 0.05 1.1 × 10⁻³ T/C 0.13
M3c158895417 3.6 × 10⁻⁷ T/A 0.08 7.2 × 10⁻⁵ T/A 0.07 1.9 × 10⁻³ A/T 0.39
M3c217901037 9.0 × 10⁻⁷ C/G 0.05 8.8 × 10⁻⁷ C/G 0.06 0.31 G/C 0.04
PZE–104087413 9.8 × 10⁻¹⁰ A/C 0.47 3.7 × 10⁻¹⁰ A/C 0.44 0.84 C/A 0.35
M4c165834025 1.3 × 10⁻⁶ C/A 0.08 2.4 × 10⁻⁴ C/A 0.06 0.22 C/A 0.48
M4c179810276 1.1 × 10⁻⁷ C/G 0.05 1.5 × 10⁻⁷ C/G 0.06 0.99 G/C 0.04
M4c191765041 6.6 × 10⁻⁷ T/C 0.49 9.3 × 10⁻⁶ T/C 0.49 6.8 × 10⁻² C/T 0.35
PUT–163a–71759731–3434 2.4 × 10⁻⁷ C/A 0.05 1.6 × 10⁻⁷ C/A 0.07 - C#
PZA02538.5 7.9 × 10⁻⁷ A/G 0.06 5.5 × 10⁻⁵ A/G 0.04 5.5 × 10⁻² G/A 0.35
M5c210423679 2.4 × 10⁻⁸ A/G 0.09 2.8 × 10⁻⁸ A/G 0.05 0.77 A/G 0.22
M6c102823048 8.1 × 10⁻⁷ T/C 0.42 2.4 × 10⁻⁶ T/C 0.44 0.52 C/T 0.26
M6c103139944 1.4 × 10⁻⁶ A/G 0.08 1.9 × 10⁻⁶ A/G 0.09 - A#
M6c103867816 4.9 × 10⁻¹⁰ T/A 0.11 2.5 × 10⁻⁹ T/A 0.12 - T#
M6c104455181 6.5 × 10⁻⁷ G/T 0.07 3.4 × 10⁻⁷ G/T 0.08 - G*
M6c104760351 1.9 × 10⁻⁷ G/A 0.29 2.2 × 10⁻⁶ G/A 0.30 0.13 A/G 0.04
M6c104966089 2.6 × 10⁻⁷ C/A 0.12 7.2 × 10⁻⁸ C/A 0.13 - C#
M6c107320370 1.2 × 10⁻⁶ C/T 0.25 5.2 × 10⁻⁷ C/T 0.25 0.49 T/C 0.13
PZE–106057159 4.9 × 10⁻⁹ A/G 0.29 2.1 × 10⁻⁸ A/G 0.27 0.61 G/A 0.17
M6c113560415 8.4 × 10⁻⁷ G/T 0.11 7.5 × 10⁻⁵ G/T 0.11 2.7 × 10⁻² T/G 0.17
Nature Genetics doi:10/1038/ng.2484

SNP* P value* Alleles* MAF* P value (2)a Alleles (2)b MAF (2)b P value (3)a Alleles (3)b MAF (3)c
M6c123914717 1.2 × 10⁻⁶ G/A 0.22 5.1 × 10⁻⁶ G/A 0.22 0.39 A/G 0.04
M6c124805221 1.6 × 10⁻⁶ G/C 0.06 7.4 × 10⁻⁷ G/C 0.07 - G#
M6c164986580 5.9 × 10⁻⁷ T/C 0.09 4.4 × 10⁻⁴ T/C 0.10 - T#
M8c113302105 3.0 × 10⁻⁷ G/C 0.09 1.2 × 10⁻⁵ G/C 0.10 - G#
M8c118559117 1.2 × 10⁻⁶ A/G 0.22 1.5 × 10⁻⁶ A/G 0.23 1.5 × 10⁻² G/A 0.09
M8c156122430 3.6 × 10⁻⁸ T/C 0.08 5.4 × 10⁻⁸ T/C 0.09 - T#
M9c19041960 6.2 × 10⁻⁷ A/G 0.45 3.7 × 10⁻⁷ A/G 0.46 0.63 A/G 0.48
M9c19290857 2.3 × 10⁻⁷ G/A 0.15 1.4 × 10⁻⁶ G/A 0.14 3.0 × 10⁻³ A/G 0.26
M9c20583914 8.5 × 10⁻¹⁹ G/T 0.20 2.5 × 10⁻¹⁷ G/T 0.18 4.6 × 10⁻⁶ T/G 0.39
PZB00761.1 6.2 × 10⁻¹⁰ A/G 0.47 1.3 × 10⁻⁷ A/G 0.49 0.47 G/A 0.13
PZE–109090146 2.2 × 10⁻⁸ C/A 0.16 3.8 × 10⁻⁹ C/A 0.14 2.0 × 10⁻³ A/G 0.39
M10c5224343 9.4 × 10⁻⁷ C/G 0.10 1.0 × 10⁻⁴ C/G 0.11 - C#
M10c79745422 6.3 × 10⁻⁷ T/C 0.06 1.1 × 10⁻⁶ T/C 0.06 0.11 C/T 0.09 *These values are listed in Supplementary Table 3. (2) Associations of oil concentration in regular lines excluding high-oil lines. (3) Associations of oil concentration in high-oil lines excluding regular lines. aP value of association. bMajor allele (first), minor allele. The underlined bases are the favorable alleles. CMinor allele frequency (MAF). # Not segregating.
Nature Genetics doi:10/1038/ng.2484

Supplementary Table 8 Confirmation of significant candidate genes in three linkage populations Candidate gene Chr. Confidence Interval (Mb)a Populationb Trait A c D d R2 (%)e GRMZM2G445791 1 B C22:0/C24:0 – – – 51.2–60.2–77.2 D (BJ$) –0.04 0.00 10.39 C – – – GRMZM2G020523 1 B C16:1 – – – D – – – 64.2–77.2–120.0/67.8–77.2–197.1 C(BJ, WH*) 0.01/0.02 0.00/0.00 4.17/8.11 GRMZM2G142315 1 33.2–158.5–181.4/33.2–158.5–181.4 B (05BJ, 06BJ#) C18:0/C18:1 0.01/0.01 0.00/0.00 10.94/20.30 D – – – C – – – GRMZM2G094742 1 B C16:1 – – – 93.9–177.0–202.6 D (BJ $) 0.01 –0.01 10.32 67.8–177.0–197.1 C (WH*) 0.02 0.00 8.11 GRMZM2G062357 1 286.2–290.1–298.3 B (06BJ#) C22:0/C24:0 –0.03 0.00 7.91 D – – – C – – – GRMZM2G083195 3 B Oil – – – 169.2–176.4–187.9 D (BJ$) –0.01 0.22 9.20 176.3–176.4–196.4/176.3–176.4–187.0 C(BJ, WH*) 0.20/0.10 0.09/0.18 5.16/4.54 GRMZM2G064701 4 159.6–162.3–177.0/159.6–162.3–192.7 B (05BJ, 06BJ#) C18:1 –2.35/–1.97 0.00/0.00 12.64/10.29 D – – – 155.9–162.3–171.1/133.7–162.3–171.1 C (BJ, WH*) 0.94/–0.52 –0.57/–0.74 7.01/3.45 GRMZM2G077295 5 B C16:0 – – – 5.3–7.8–8.3 D (BJ$) 0.32 0.15 3.55 C – – – GRMZM2G105398 6 B C18:0/C20:0 – – – 82.9–102.8–110.6 D (BJ$) –0.16 0.00 6.95 C – – – GRMZM2G079200 6 95.3–103.2–110.2/95.3–103.2–110.2 B (05BJ, 06BJ#) C20:0 –0.05/–0.05 0.00/0.00 38.56/30.36 D – – – C – – – GRMZM2G101707 6 91.0–104.4–108.3/91.0–104.4–108.3 B(05BJ, 06BJ#) C24:0 0.02/0.03 0.00/0.00 26.11/24.65 D – – – C – – – GRMZM2G103526 6 91.0–104.7–108.3/91.0–104.7–108.3 B (05BJ, 06BJ#) C20:1 –0.03/0.03 0.00/0.00 10.14/21.18 D – – – 95.6–104.7–113.9 C (HN*) 0.00 –0.01 5.52 GRMZM2G169089 6 95.1–104.8–106.0/95.1–104.8–106.0 B (05BJ, 06BJ#) C18:1/C18:2 –0.17/–0.15 0.00/0.00 67.39/39.48 D – – – C – – – GRMZM2G416750 6 106.0–107.3–110.2/106.0–107.3–110.2 B (05BJ/06BJ#) C20:0 –0.05/–0.05 0.00/0.00 36.89/29.37 D – – – C – – –
Nature Genetics doi:10/1038/ng.2484

Candidate gene Chr. Confidence Interval (Mb)a Populationb Trait A c D d R2 (%)e GRMZM2G136072 8 B Oil – – – 4.3–21.6–66.1/17.4–21.6–66.1 D (BJ, WH$) –0.13/0.23 0.36/0.28 17.81/17.06 18.2–21.6–22.2 C (BJ*) 0.32 –0.20 4.62 GRMZM2G003022 8 B Oil – – – 4.3–38.5–66.1/17.4–38.5–66.1 D (WH$) 0.23 0.28 17.06 C – – – GRMZM2G052855 8 B Oil – – – 95.0–100.9–156.7/17.4–100.9–134.8 D(BJ, WH$) 0.03/0.23 0.26/0.28 13.77/17.06 C – – – GRMZM2G153569 8 B C18:1/C18:2 – – – D – – – 102.1–112.1–116.6/102.1–112.1–116.6/102.1–112.1–116.6 C (BJ, HN, WH*) 0.03/0.02/0.04 0.00/0.00/0.00 13.83/6.16/7.03 GRMZM2G350265 8 B C18:1 – – – D – – – 102.1–113.3–160.2/101.8–113.3–160.2/101.8–113.3–160.2 C (BJ, HN, WH*) 1.34/0.94/1.89 –0.43/0.15/–0.38 13.93/7.54/9.47 AC204277.3_FG006 8 B C20:0 – – – D – – – 101.8–118.5–160.2 C(WH*) 0.03 0.01 9.92 GRMZM2G025966 8 B C18:0 – – – D – – – 102.1–156.1–160.2/126.6–156.1–162.8/126.6–156.1–162.8 C (BJ, HN, WH*) 0.19/0.12/0.18 0.06/0.11/0.06 15.07/9.94/8.69 GRMZM5G863550 9 18.6–19.0–22.2/18.6–19.0–22.2 B (05BJ, 06BJ#) C16:0 –1.28/–1.36 0.00/0.00 55.96/52.78 11.5–19.0–63.7/17.0–19.0–19.4 D (BJ, HN$) 1.88/0.92 0.27/0.01 69.73/5.30 11.5–19.0–26.6/11.5–19.0–26.6 C (BJ, HN*) 1.56/1.33 –0.28/–0.06 39.33/31.77 GRMZM2G005522 9 18.6–19.2–22.2/18.6–19.2–22.2 B (05BJ, 06BJ#) SFA/USFA –0.02/–0.02 0.00/0.00 44.13/39.99 18.8–19.2–19.3/17.0–19.2–19.3 D (BJ,WH$) 0.02/0.03 0.00/0.00 49.28/25.80 17.0–19.2–19.3/17.0–19.2–26.6/17.0–19.2–19.3 C (BJ, HN, WH*) 0.02/0.02/0.02 0.00/0.00/0.00 38.44/28.76/29.16 GRMZM5G829544 9 18.6–20.5–22.2/18.6–20.5–22.2 B (05BJ, 06BJ#) C16:0 –1.28/–1.36 0.00/0.00 55.96/52.78 11.5–20.5–63.7/19.4–20.5–23.3/11.5–20.5–106.8 D (BJ, HN, WH$) 1.88/0.99/1.59 0.27/–0.08/–0.37 69.73/6.41/69.93 11.5–20.5–26.6/11.5–20.5–26.6/11.5–20.5–26.6 C (BJ, HN, WH*) 1.56/1.33/1.64 –0.28/–0.06/–0.31 39.33/31.78/34.97 GRMZM2G117207 9 74.1–138.0–141.5/74.1–138.0–141.5 B (05BJ, 06BJ#) C18:2/C18:3 –4.60/–3.85 0.00/0.00 18.58/17.49 D – – – C – – – GRMZM2G162972 10 8.6–26.4–85.1/25.6–26.4–85.1 B (05BJ, 06BJ#) Oil –0.31/–0.38 0.00/0.00 8.43/10.53 D – – – C – – – GRMZM2G044306 10 B C18:0 – – – D – – – 10.2–79.7–91.8 C (HN*) –0.15 –0.04 7.3 aThe physical location of the candidate gene refers to version 5b.60 of the maize reference sequence, flanked by the confidence interval of the QTL to the left and right of the gene position. bPopulations B, D and C correspond to the By804/B73 RIL, K22/D340 and CI7/K22 populations, respectively. #Phenotypic data were collected in year 2005 (05) and 2006 (06) in Beijing (BJ) for QTL analysis in B population. $F2:3 families of the D population were harvested for phenotyping in Beijing 2009, and F2:4 families were obtained
Nature Genetics doi:10/1038/ng.2484

from two environments, Hainan in 2009 and Wuhan in 2010 (HN and WH, respectively). *F2:3 families of the C population were harvested for phenotyping in Beijing, and F2:4 families were obtained from Hainan and Wuhan. cAdditive effect. dDominant effect. eThe phenotypic variation explained by this QTL.
Nature Genetics doi:10/1038/ng.2484

Supplementary Table 9 Correlation analysis between the phenotype and the expression of proposed candidate genes with eQTLs Gene eQTL Lead trait Oil C16:0 C16:1 C18:0 C18:1 C18:2 C18:3 C20:0 C20:1 C22:0 C24:0 C16:0/C16:1 C16:0/C18:0 C18:0/C18:1 C18:1/C18:2 C18:2/C18:3 C18:0/C20:0 C20:0/C20:1 C20:0/C22:0 C22:0/C24:0 SFA/USFA
GRMZM2G031790 5.4 × 10⁻¹⁸ C20:1 r 0.057 0.031 –0.013 –0.005 –0.024 0.015 –0.021 0.014 0.213 0.026 0.038 0.056 0.017 0.014 –0.033 0.031 –0.028 –0.182 –0.005 –0.027 0.034 p 0.287 0.561 0.812 0.926 0.651 0.786 0.696 0.796 <0.0001 0.629 0.476 0.291 0.748 0.794 0.536 0.563 0.605 0.001 0.920 0.616 0.529 GRMZM2G410515 4.5 × 10⁻¹³ Oil r –0.009 0.047 –0.013 0.028 0.014 –0.035 –0.014 0.101 0.139 0.088 0.015 0.039 –0.012 –0.018 0.004 –0.031 –0.056 –0.015 0.011 0.086 0.059 p 0.863 0.380 0.805 0.595 0.788 0.510 0.797 0.058 0.009 0.101 0.781 0.469 0.822 0.737 0.947 0.565 0.294 0.773 0.836 0.109 0.267 GRMZM2G020523 1.4 × 10⁻¹⁰ C16:1 r –0.037 0.000 0.043 –0.023 –0.125 0.134 0.095 –0.145 –0.171 –0.087 –0.001 –0.045 0.003 0.071 –0.131 –0.002 0.100 0.000 –0.028 –0.087 –0.019 p 0.491 0.996 0.423 0.665 0.019 0.012 0.075 0.007 0.001 0.103 0.987 0.396 0.953 0.185 0.014 0.976 0.062 0.998 0.603 0.103 0.726 GRMZM2G094742 8.2 × 10⁻²⁵ C16:1 r –0.211 0.092 0.000 –0.158 –0.081 0.059 0.136 0.002 0.094 0.189 0.226 0.060 0.170 –0.077 –0.073 –0.164 –0.159 –0.090 –0.264 –0.047 0.053 p <0.0001 0.084 0.998 0.003 0.130 0.271 0.011 0.977 0.079 0.000 <0.0001 0.260 0.001 0.149 0.175 0.002 0.003 0.091 <0.0001 0.377 0.323 GRMZM2G059029 5.7 × 10⁻⁷ C20:0 r 0.084 0.068 0.022 0.010 0.066 –0.089 –0.094 0.138 0.099 0.056 –0.009 0.049 –0.062 –0.037 0.054 0.041 –0.073 0.055 0.068 0.104 0.074 p 0.115 0.207 0.685 0.856 0.218 0.095 0.078 0.010 0.064 0.292 0.867 0.356 0.248 0.494 0.310 0.449 0.175 0.304 0.202 0.053 0.165 GRMZM2G110298 3.5 × 10⁻¹² Oil r –0.007 0.044 0.124 –0.073 0.104 –0.120 –0.037 0.059 0.102 0.124 0.140 –0.098 0.041 –0.140 0.103 –0.010 –0.095 –0.020 –0.083 –0.023 0.037 p 0.894 0.409 0.020 0.172 0.051 0.024 0.492 0.269 0.056 0.020 0.009 0.066 0.439 0.009 0.055 0.857 0.077 0.707 0.122 0.669 0.488 GRMZM2G152438 1.1 × 10⁻⁶ C18:3 r 0.106 0.079 0.049 0.003 0.176 –0.207 –0.194 0.157 0.214 0.072 0.072 0.010 0.000 –0.150 0.157 0.104 –0.112 –0.034 0.061 –0.010 0.093 p 0.048 0.137 0.364 0.962 0.001 <0.0001 0.000 0.003 <0.0001 0.179 0.176 0.851 0.998 0.005 0.003 0.053 0.036 0.528 0.253 0.846 0.082 GRMZM2G142315 8.1 × 10⁻¹⁴ C18:0/C18:1 r –0.250 0.033 0.017 –0.103 –0.220 0.218 0.206 –0.022 –0.074 0.165 0.131 –0.036 0.089 0.054 –0.220 –0.150 –0.098 0.035 –0.261 0.008 0.005 p <0.0001 0.539 0.758 0.053 <0.0001 <0.0001 <0.0001 0.687 0.168 0.002 0.014 0.507 0.097 0.316 <0.0001 0.005 0.068 0.518 <0.0001 0.875 0.931 GRMZM2G133675 2.3 × 10⁻¹³ Oil r –0.135 0.142 –0.068 –0.122 –0.048 0.011 0.094 –0.023 0.117 0.080 0.090 0.145 0.169 –0.092 –0.046 –0.113 –0.136 –0.139 –0.140 0.005 0.101 p 0.011 0.008 0.204 0.023 0.374 0.834 0.077 0.661 0.028 0.136 0.091 0.006 0.002 0.085 0.389 0.034 0.011 0.009 0.009 0.929 0.060 GRMZM5G847159 1.7 × 10⁻¹⁰ Oil r –0.016 0.081 0.113 0.071 0.041 –0.074 –0.030 0.031 0.004 –0.010 –0.028 –0.066 –0.039 0.025 0.044 –0.020 0.041 0.032 0.018 0.029 0.099 p 0.770 0.131 0.035 0.183 0.440 0.166 0.571 0.558 0.933 0.851 0.601 0.215 0.462 0.635 0.411 0.712 0.441 0.553 0.730 0.591 0.064 GRMZM2G021339 1.3 × 10⁻¹⁹ C18:0/C18:1 r –0.009 0.150 0.121 –0.052 0.100 –0.148 –0.025 0.049 0.111 –0.002 0.069 –0.010 0.120 –0.139 0.109 –0.068 –0.109 –0.048 0.021 –0.108 0.131 p 0.866 0.005 0.023 0.331 0.061 0.005 0.638 0.356 0.038 0.971 0.196 0.853 0.024 0.009 0.041 0.205 0.041 0.367 0.697 0.043 0.014 GRMZM2G125268 4.2 × 10⁻¹⁴ Oil r –0.069 –0.004 0.017 –0.073 –0.050 0.059 0.097 –0.102 –0.107 –0.049 –0.002 –0.020 0.074 –0.039 –0.050 –0.074 0.004 –0.027 –0.072 –0.070 –0.035 p 0.196 0.940 0.756 0.170 0.348 0.271 0.069 0.055 0.046 0.355 0.970 0.715 0.166 0.466 0.354 0.164 0.935 0.612 0.180 0.188 0.517 GRMZM2G142342 1.5 × 10⁻¹⁹ C16:0 r 0.143 –0.145 –0.004 –0.020 0.031 0.022 –0.113 –0.072 0.028 –0.108 –0.067 –0.051 –0.058 –0.062 –0.016 0.136 0.058 –0.094 0.094 –0.042 –0.153 p 0.007 0.006 0.934 0.713 0.557 0.684 0.034 0.179 0.606 0.044 0.213 0.340 0.275 0.248 0.768 0.011 0.278 0.078 0.079 0.435 0.004 GRMZM2G477205 1.7 × 10⁻¹³ C18:0 r 0.166 0.016 0.007 0.000 0.132 –0.139 –0.196 0.130 0.155 0.059 0.077 0.037 –0.019 –0.079 0.129 0.141 –0.101 0.008 0.056 –0.021 0.030 p 0.002 0.766 0.892 0.995 0.013 0.009 0.000 0.015 0.004 0.270 0.150 0.489 0.729 0.137 0.015 0.008 0.060 0.888 0.299 0.689 0.578 GRMZM2G092321 2.1 × 10⁻²³ Oil r –0.169 0.228 0.144 –0.012 –0.048 –0.025 0.050 0.067 0.061 0.099 0.074 0.006 0.100 0.011 –0.044 –0.123 –0.081 0.028 –0.105 0.009 0.219 p 0.002 <0.0001 0.007 0.821 0.366 0.647 0.348 0.208 0.256 0.064 0.168 0.917 0.061 0.839 0.412 0.022 0.130 0.602 0.049 0.869 <0.0001 GRMZM2G041060 6.6 × 10⁻¹⁰ Oil r 0.080 –0.111 –0.045 –0.056 –0.039 0.084 –0.021 –0.113 –0.003 –0.080 –0.013 –0.041 0.017 –0.031 –0.055 0.126 0.023 –0.097 0.015 –0.043 –0.127 p 0.136 0.038 0.405 0.298 0.462 0.115 0.696 0.035 0.948 0.136 0.808 0.441 0.757 0.557 0.301 0.018 0.663 0.069 0.783 0.422 0.018 GRMZM2G065194 4.3 × 10⁻¹⁷ Oil r 0.093 0.044 –0.076 0.104 0.141 –0.167 –0.139 0.144 0.131 0.040 –0.026 0.088 –0.090 –0.022 0.126 0.057 –0.005 0.024 0.114 0.081 0.080 p 0.082 0.413 0.156 0.053 0.008 0.002 0.009 0.007 0.014 0.459 0.634 0.099 0.091 0.679 0.018 0.290 0.921 0.649 0.033 0.128 0.134 GRMZM2G439195 8.4 × 10⁻¹⁴ Oil r 0.074 –0.026 0.039 0.022 0.155 –0.151 –0.092 0.025 0.026 –0.048 –0.099 –0.046 –0.045 –0.099 0.154 0.019 0.011 0.007 0.084 0.121 –0.023 p 0.168 0.627 0.462 0.683 0.004 0.005 0.085 0.638 0.626 0.371 0.064 0.394 0.397 0.064 0.004 0.727 0.832 0.899 0.117 0.023 0.674 GRMZM2G035779 9.7 × 10–08 Oil r –0.038 0.144 0.074 –0.018 0.094 –0.147 –0.017 0.107 0.144 0.121 0.119 0.009 0.095 –0.096 0.087 –0.074 –0.121 –0.011 –0.068 0.022 0.148 p 0.479 0.007 0.166 0.739 0.077 0.006 0.749 0.046 0.007 0.024 0.026 0.873 0.075 0.073 0.104 0.167 0.023 0.839 0.205 0.679 0.006 GRMZM2G032028 8.1 × 10⁻¹⁰ C22:0 r 0.187 0.053 0.039 0.076 0.300 –0.330 –0.237 0.147 0.209 –0.034 –0.051 0.012 –0.046 –0.168 0.281 0.087 –0.025 –0.035 0.200 0.023 0.083 p 0.000 0.320 0.464 0.155 <0.0001 <0.0001 <0.0001 0.006 <0.0001 0.521 0.341 0.826 0.386 0.002 <0.0001 0.105 0.635 0.515 0.000 0.672 0.122 GRMZM2G101707 4.0 × 10⁻¹⁸ C24:0 r 0.118 0.102 0.052 0.083 0.172 –0.220 –0.138 0.208 0.200 0.098 0.050 0.039 –0.058 –0.060 0.150 0.052 –0.073 0.035 0.110 0.021 0.139 p 0.027 0.055 0.331 0.119 0.001 <0.0001 0.010 <0.0001 0.000 0.067 0.347 0.470 0.276 0.260 0.005 0.335 0.170 0.512 0.039 0.699 0.009 GRMZM2G103526 9.9 × 10⁻²⁶ C20:1 r –0.181 0.034 0.046 –0.169 –0.262 0.269 0.262 –0.224 –0.144 –0.010 0.199 –0.022 0.164 0.037 –0.262 –0.117 0.016 –0.094 –0.232 –0.219 –0.021 p 0.001 0.520 0.392 0.002 <0.0001 <0.0001 <0.0001 <0.0001 0.007 0.853 0.000 0.677 0.002 0.491 <0.0001 0.028 0.764 0.080 <0.0001 <0.0001 0.697 GRMZM2G029685 1.5 × 10⁻²⁵ C22:0 r –0.040 0.007 0.071 –0.030 –0.152 0.157 0.156 –0.219 –0.178 –0.138 0.091 –0.058 0.009 0.087 –0.156 –0.035 0.162 –0.069 –0.051 –0.228 –0.013 p 0.450 0.895 0.183 0.578 0.004 0.003 0.004 <0.0001 0.001 0.010 0.089 0.281 0.869 0.103 0.003 0.513 0.002 0.200 0.339 <0.0001 0.809
Nature Genetics doi:10/1038/ng.2484

Gene eQTL Lead trait Oil C16:0 C16:1 C18:0 C18:1 C18:2 C18:3 C20:0 C20:1 C22:0 C24:0 C16:0/C16:1 C16:0/C18:0 C18:0/C18:1 C18:1/C18:2 C18:2/C18:3 C18:0/C20:0 C20:0/C20:1 C20:0/C22:0 C22:0/C24:0 SFA/USFA
GRMZM2G138842 6.0 × 10⁻²¹ C20:0 r –0.057 0.103 0.028 –0.105 –0.089 0.066 0.051 –0.035 0.023 0.068 0.156 0.033 0.135 –0.041 –0.093 –0.013 –0.072 –0.064 –0.141 –0.109 0.073 p 0.291 0.054 0.596 0.050 0.097 0.215 0.337 0.515 0.661 0.206 0.003 0.542 0.011 0.441 0.082 0.806 0.176 0.233 0.008 0.041 0.170 GRMZM2G084812 1.8 × 10⁻⁹ C18:0 r –0.129 0.008 0.051 –0.102 –0.150 0.155 0.209 –0.141 –0.147 –0.006 0.148 –0.055 0.081 0.037 –0.152 –0.138 0.012 –0.017 –0.152 –0.182 –0.025 p 0.015 0.887 0.337 0.057 0.005 0.004 <0.0001 0.008 0.006 0.909 0.006 0.308 0.131 0.489 0.004 0.009 0.827 0.757 0.004 0.001 0.641 GRMZM2G101515 2.9 × 10⁻⁸ C20:1 r 0.111 0.060 –0.047 0.111 –0.029 0.006 –0.079 0.099 –0.021 0.001 –0.060 0.088 –0.053 0.107 –0.027 0.093 0.021 0.105 0.107 0.051 0.091 p 0.038 0.263 0.378 0.038 0.587 0.913 0.140 0.063 0.697 0.986 0.263 0.100 0.325 0.045 0.616 0.081 0.693 0.050 0.044 0.344 0.088 GRMZM2G052855 2.0 × 10⁻²³ Oil r 0.112 –0.064 0.007 –0.022 0.004 0.017 0.042 –0.068 –0.011 –0.071 –0.066 –0.047 0.000 –0.043 –0.022 0.024 0.029 –0.067 0.042 0.021 –0.069 p 0.037 0.233 0.903 0.676 0.935 0.747 0.429 0.207 0.833 0.188 0.216 0.382 0.994 0.423 0.680 0.661 0.592 0.211 0.431 0.692 0.196 AC204277.3_FG006 9.3 × 10⁻¹⁵ C20:0 r 0.027 0.033 0.049 0.038 0.041 –0.056 –0.070 0.090 0.041 0.049 0.020 –0.029 –0.046 0.011 0.041 0.051 –0.035 0.054 0.033 0.057 0.053 p 0.617 0.543 0.356 0.480 0.445 0.297 0.191 0.091 0.441 0.358 0.712 0.592 0.390 0.833 0.445 0.339 0.509 0.309 0.536 0.287 0.320 GRMZM2G025966 9.8 × 10⁻¹⁷ C18:0 r –0.084 0.203 0.152 0.025 0.123 –0.199 –0.085 0.207 0.197 0.193 0.118 –0.022 0.077 –0.086 0.138 –0.062 –0.163 0.048 –0.074 0.074 0.218 p 0.117 0.000 0.004 0.647 0.021 0.000 0.112 <0.0001 0.000 0.000 0.027 0.682 0.151 0.108 0.010 0.244 0.002 0.370 0.166 0.168 <0.0001 GRMZM5G863550 3.5 × 10⁻¹⁶ C16:0 r 0.011 –0.040 0.055 0.041 0.065 –0.063 –0.025 0.093 0.072 0.070 0.045 –0.073 –0.055 –0.042 0.045 0.012 –0.043 0.018 –0.007 0.033 –0.016 p 0.831 0.454 0.307 0.445 0.226 0.243 0.642 0.083 0.175 0.189 0.397 0.172 0.303 0.433 0.403 0.819 0.417 0.736 0.891 0.541 0.763 GRMZM2G005522 6.6 × 10⁻⁹ SFA/USFA r 0.011 0.030 0.013 0.050 0.048 –0.062 –0.041 –0.011 0.042 –0.084 0.018 0.026 –0.022 –0.004 0.058 0.009 0.073 –0.056 0.088 –0.083 0.044 p 0.837 0.573 0.810 0.351 0.371 0.245 0.448 0.843 0.433 0.116 0.738 0.628 0.680 0.946 0.275 0.861 0.173 0.293 0.100 0.119 0.410 GRMZM5G829544 3.9 × 10⁻⁸ C16:0 r 0.030 0.184 0.094 0.090 0.101 –0.169 –0.054 0.085 0.037 –0.022 –0.064 0.018 0.025 0.009 0.117 –0.039 0.007 0.040 0.085 0.052 0.206 p 0.572 0.001 0.080 0.092 0.058 0.001 0.316 0.112 0.491 0.682 0.234 0.742 0.643 0.865 0.028 0.471 0.892 0.450 0.110 0.330 0.000 GRMZM2G434170 1.9 × 10⁻³⁰ C18:1/C18:2 r 0.000 –0.040 0.005 –0.065 –0.007 0.023 0.045 –0.061 0.043 0.003 0.053 –0.029 0.064 –0.043 –0.007 –0.020 –0.015 –0.107 –0.064 –0.066 –0.056 p 1.000 0.459 0.927 0.225 0.889 0.662 0.404 0.254 0.427 0.949 0.322 0.586 0.231 0.417 0.893 0.707 0.773 0.046 0.235 0.216 0.297 GRMZM2G162972 9.0 × 10⁻¹³ Oil r 0.154 –0.162 –0.070 0.138 0.021 0.022 –0.086 0.024 –0.052 –0.063 –0.174 –0.014 –0.182 0.110 0.017 0.138 0.123 0.042 0.125 0.107 –0.114 p 0.004 0.002 0.191 0.010 0.688 0.686 0.107 0.650 0.330 0.239 0.001 0.788 0.001 0.039 0.744 0.009 0.021 0.435 0.019 0.045 0.032 GRMZM2G062357 9.5 × 10⁻¹⁶ C22:0/C24:0 r –0.044 0.139 0.076 –0.031 –0.038 –0.005 0.062 0.058 0.010 0.077 –0.017 0.009 0.074 –0.011 –0.034 –0.073 –0.087 0.041 –0.064 0.081 0.125 p 0.408 0.009 0.154 0.564 0.479 0.931 0.248 0.277 0.856 0.149 0.755 0.869 0.166 0.839 0.524 0.170 0.104 0.440 0.231 0.130 0.019 GRMZM2G167428 3.0 × 10⁻¹¹ C18:1/C18:2 r –0.057 0.095 0.014 0.052 –0.005 –0.036 0.010 0.199 0.113 0.198 0.100 0.039 –0.016 0.025 –0.016 –0.039 –0.117 0.106 –0.047 0.117 0.125 p 0.287 0.075 0.788 0.336 0.920 0.496 0.859 0.000 0.034 0.000 0.061 0.469 0.764 0.646 0.760 0.462 0.029 0.048 0.381 0.029 0.020 GRMZM2G044625 6.2 × 10⁻¹⁷ C22:0/C24:0 r 0.014 –0.113 –0.087 0.138 –0.031 0.058 –0.016 0.019 –0.170 –0.065 –0.047 0.026 –0.169 0.143 –0.047 0.075 0.141 0.176 0.114 –0.045 –0.069 p 0.793 0.034 0.104 0.010 0.564 0.279 0.762 0.719 0.001 0.224 0.383 0.622 0.002 0.007 0.380 0.163 0.008 0.001 0.033 0.397 0.200 GRMZM2G037334 6.7 × 10⁻¹⁴ C18:3 r 0.075 0.102 0.038 0.049 0.088 –0.123 –0.172 0.157 0.082 0.069 –0.003 0.033 0.012 –0.048 0.065 0.085 –0.087 0.072 0.051 0.065 0.124 p 0.161 0.057 0.475 0.357 0.100 0.021 0.001 0.003 0.125 0.196 0.957 0.536 0.821 0.368 0.225 0.111 0.102 0.181 0.342 0.225 0.021 GRMZM2G040452 3.0 × 10⁻¹⁶ C16:0/C16:1 r –0.141 0.067 0.171 –0.090 –0.043 0.030 0.045 –0.093 –0.028 –0.007 0.089 –0.139 0.083 –0.036 –0.011 –0.066 –0.014 –0.059 –0.135 –0.091 0.031 p 0.008 0.210 0.001 0.092 0.423 0.573 0.402 0.083 0.597 0.896 0.097 0.009 0.119 0.496 0.830 0.217 0.801 0.267 0.012 0.088 0.566 GRMZM2G153569 4.4 × 10⁻²¹ C18:1/C18:2 r 0.041 –0.048 –0.015 –0.102 –0.130 0.164 0.027 –0.155 –0.051 –0.067 –0.022 –0.001 0.086 0.019 –0.142 0.104 0.007 –0.099 –0.053 –0.058 –0.085 p 0.444 0.365 0.784 0.055 0.014 0.002 0.613 0.004 0.342 0.213 0.676 0.985 0.109 0.724 0.008 0.052 0.904 0.065 0.320 0.277 0.110 GRMZM2G166383 5.8 × 10⁻¹² C22:0/C24:0 r 0.099 0.042 0.037 –0.041 0.102 –0.118 –0.071 0.079 0.181 0.109 0.118 –0.004 0.075 –0.130 0.084 0.035 –0.117 –0.078 –0.045 –0.010 0.042 p 0.063 0.434 0.493 0.440 0.057 0.027 0.184 0.140 0.001 0.042 0.027 0.943 0.160 0.015 0.115 0.508 0.028 0.147 0.399 0.854 0.432 aYellow highlighting, expression of candidate gene correlates with target trait at P < 0.01; blue highlighting, expression of candidate gene does not correlate with target trait but with other traits at P < 0.01; red highlighting, expression of candidate does not correlate with any trait at P < 0.01.
Nature Genetics doi:10/1038/ng.2484
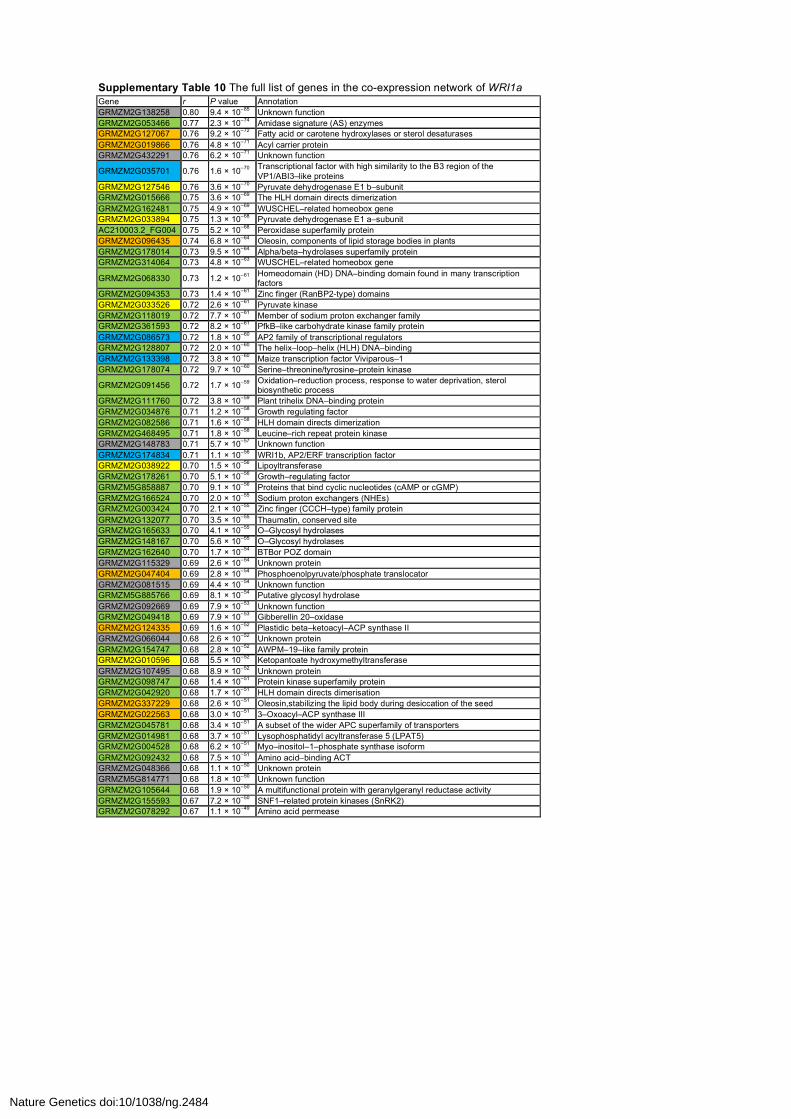
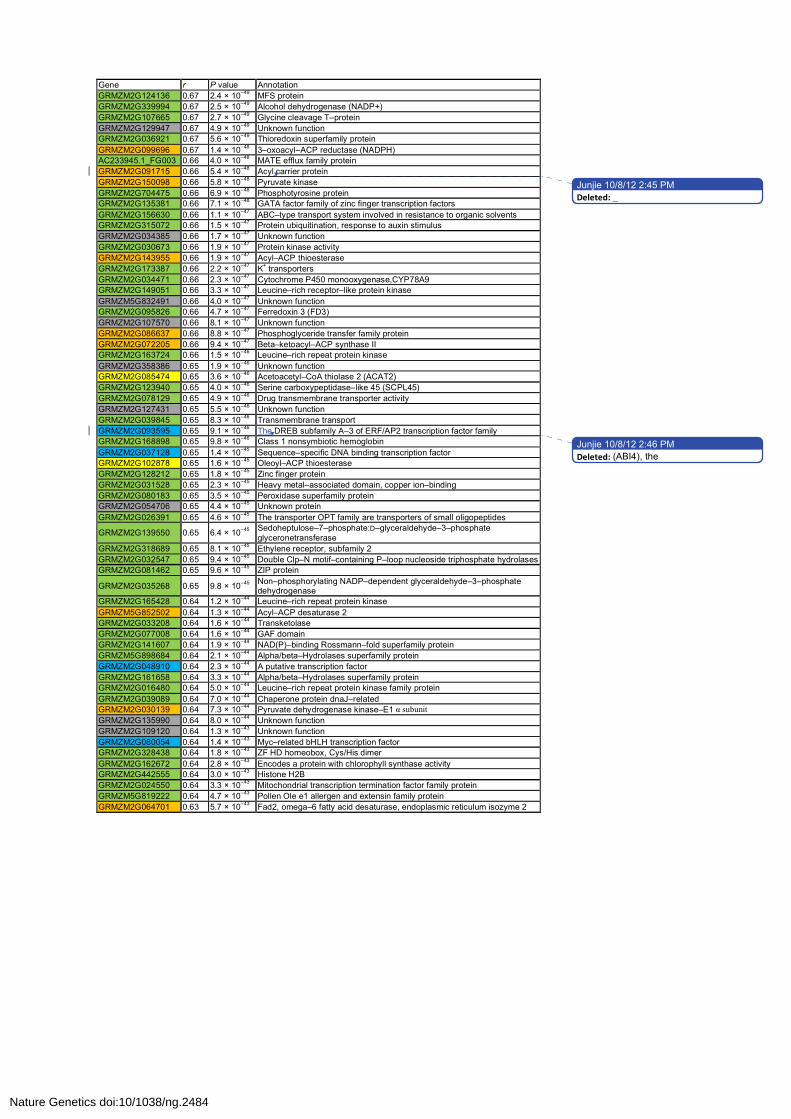
Supplementary Table 10 The full list of genes in the co-expression network of WRI1a Gene r P value Annotation GRMZM2G138258 0.80 9.4 × 10–85 Unknown function GRMZM2G053466 0.77 2.3 × 10–74 Amidase signature (AS) enzymes GRMZM2G127067 0.76 9.2 × 10–72 Fatty acid or carotene hydroxylases or sterol desaturases GRMZM2G019866 0.76 4.8 × 10–71 Acyl carrier protein GRMZM2G432291 0.76 6.2 × 10–71 Unknown function
GRMZM2G035701 0.76 1.6 × 10–70 Transcriptional factor with high similarity to the B3 region of the VP1/ABI3–like proteins
GRMZM2G127546 0.76 3.6 × 10–70 Pyruvate dehydrogenase E1 b–subunit GRMZM2G015666 0.75 3.6 × 10–69 The HLH domain directs dimerization GRMZM2G162481 0.75 4.9 × 10–69 WUSCHEL–related homeobox gene GRMZM2G033894 0.75 1.3 × 10–68 Pyruvate dehydrogenase E1 a–subunit AC210003.2_FG004 0.75 5.2 × 10–68 Peroxidase superfamily protein GRMZM2G096435 0.74 6.8 × 10–64 Oleosin, components of lipid storage bodies in plants GRMZM2G178014 0.73 9.5 × 10–64 Alpha/beta–hydrolases superfamily protein GRMZM2G314064 0.73 4.8 × 10–63 WUSCHEL–related homeobox gene
GRMZM2G068330 0.73 1.2 × 10–61 Homeodomain (HD) DNA–binding domain found in many transcription factors
GRMZM2G094353 0.73 1.4 × 10–61 Zinc finger (RanBP2-type) domains GRMZM2G033526 0.72 2.6 × 10–61 Pyruvate kinase GRMZM2G118019 0.72 7.7 × 10–61 Member of sodium proton exchanger family GRMZM2G361593 0.72 8.2 × 10–61 PfkB–like carbohydrate kinase family protein GRMZM2G086573 0.72 1.8 × 10–60 AP2 family of transcriptional regulators GRMZM2G128807 0.72 2.0 × 10–60 The helix–loop–helix (HLH) DNA–binding GRMZM2G133398 0.72 3.8 × 10–60 Maize transcription factor Viviparous–1 GRMZM2G178074 0.72 9.7 × 10–60 Serine–threonine/tyrosine–protein kinase
GRMZM2G091456 0.72 1.7 × 10–59 Oxidation–reduction process, response to water deprivation, sterol biosynthetic process
GRMZM2G111760 0.72 3.8 × 10–59 Plant trihelix DNA–binding protein GRMZM2G034876 0.71 1.2 × 10–58 Growth regulating factor GRMZM2G082586 0.71 1.6 × 10–58 HLH domain directs dimerization GRMZM2G468495 0.71 1.8 × 10–58 Leucine–rich repeat protein kinase GRMZM2G148783 0.71 5.7 × 10–57 Unknown function GRMZM2G174834 0.71 1.1 × 10–56 WRI1b, AP2/ERF transcription factor GRMZM2G038922 0.70 1.5 × 10–56 Lipoyltransferase GRMZM2G178261 0.70 5.1 × 10–56 Growth–regulating factor GRMZM5G858887 0.70 9.1 × 10–56 Proteins that bind cyclic nucleotides (cAMP or cGMP) GRMZM2G166524 0.70 2.0 × 10–55 Sodium proton exchangers (NHEs) GRMZM2G003424 0.70 2.1 × 10–55 Zinc finger (CCCH–type) family protein GRMZM2G132077 0.70 3.5 × 10–55 Thaumatin, conserved site GRMZM2G165633 0.70 4.1 × 10–55 O–Glycosyl hydrolases GRMZM2G148167 0.70 5.6 × 10–55 O–Glycosyl hydrolases GRMZM2G162640 0.70 1.7 × 10–54 BTBor POZ domain GRMZM2G115329 0.69 2.6 × 10–54 Unknown protein GRMZM2G047404 0.69 2.8 × 10–54 Phosphoenolpyruvate/phosphate translocator GRMZM2G081515 0.69 4.4 × 10–54 Unknown function GRMZM5G885766 0.69 8.1 × 10–54 Putative glycosyl hydrolase GRMZM2G092669 0.69 7.9 × 10–53 Unknown function GRMZM2G049418 0.69 7.9 × 10–53 Gibberellin 20–oxidase GRMZM2G124335 0.69 1.6 × 10–52 Plastidic beta–ketoacyl–ACP synthase II GRMZM2G066044 0.68 2.6 × 10–52 Unknown protein GRMZM2G154747 0.68 2.8 × 10–52 AWPM–19–like family protein GRMZM2G010596 0.68 5.5 × 10–52 Ketopantoate hydroxymethyltransferase GRMZM2G107495 0.68 8.9 × 10–52 Unknown protein GRMZM2G098747 0.68 1.4 × 10–51 Protein kinase superfamily protein GRMZM2G042920 0.68 1.7 × 10–51 HLH domain directs dimerisation GRMZM2G337229 0.68 2.6 × 10–51 Oleosin,stabilizing the lipid body during desiccation of the seed GRMZM2G022563 0.68 3.0 × 10–51 3–Oxoacyl–ACP synthase III GRMZM2G045781 0.68 3.4 × 10–51 A subset of the wider APC superfamily of transporters GRMZM2G014981 0.68 3.7 × 10–51 Lysophosphatidyl acyltransferase 5 (LPAT5) GRMZM2G004528 0.68 6.2 × 10–51 Myo–inositol–1–phosphate synthase isoform GRMZM2G092432 0.68 7.5 × 10–51 Amino acid–binding ACT GRMZM2G048366 0.68 1.1 × 10–50 Unknown protein GRMZM5G814771 0.68 1.8 × 10–50 Unknown function GRMZM2G105644 0.68 1.9 × 10–50 A multifunctional protein with geranylgeranyl reductase activity GRMZM2G155593 0.67 7.2 × 10–50 SNF1–related protein kinases (SnRK2) GRMZM2G078292 0.67 1.1 × 10–49 Amino acid permease
Nature Genetics doi:10/1038/ng.2484
Gene r P value Annotation GRMZM2G124136 0.67 2.4 × 10–49 MFS protein GRMZM2G339994 0.67 2.5 × 10–49 Alcohol dehydrogenase (NADP+) GRMZM2G107665 0.67 2.7 × 10–49 Glycine cleavage T–protein GRMZM2G129947 0.67 4.9 × 10–49 Unknown function GRMZM2G036921 0.67 5.6 × 10–49 Thioredoxin superfamily protein GRMZM2G099696 0.67 1.4 × 10–48 3–oxoacyl–ACP reductase (NADPH) AC233945.1_FG003 0.66 4.0 × 10–48 MATE efflux family protein GRMZM2G091715 0.66 5.4 × 10–48 Acyl carrier protein GRMZM2G150098 0.66 5.8 × 10–48 Pyruvate kinase GRMZM2G704475 0.66 6.9 × 10–48 Phosphotyrosine protein GRMZM2G135381 0.66 7.1 × 10–48 GATA factor family of zinc finger transcription factors GRMZM2G156630 0.66 1.1 × 10–47 ABC–type transport system involved in resistance to organic solvents GRMZM2G315072 0.66 1.5 × 10–47 Protein ubiquitination, response to auxin stimulus GRMZM2G034385 0.66 1.7 × 10–47 Unknown function GRMZM2G030673 0.66 1.9 × 10–47 Protein kinase activity GRMZM2G143955 0.66 1.9 × 10–47 Acyl–ACP thioesterase GRMZM2G173387 0.66 2.2 × 10–47 K+ transporters GRMZM2G034471 0.66 2.3 × 10–47 Cytochrome P450 monooxygenase,CYP78A9 GRMZM2G149051 0.66 3.3 × 10–47 Leucine–rich receptor–like protein kinase GRMZM5G832491 0.66 4.0 × 10–47 Unknown function GRMZM2G095826 0.66 4.7 × 10–47 Ferredoxin 3 (FD3) GRMZM2G107570 0.66 8.1 × 10–47 Unknown function GRMZM2G086637 0.66 8.8 × 10–47 Phosphoglyceride transfer family protein GRMZM2G072205 0.66 9.4 × 10–47 Beta–ketoacyl–ACP synthase II GRMZM2G163724 0.66 1.5 × 10–46 Leucine–rich repeat protein kinase GRMZM2G358386 0.65 1.9 × 10–46 Unknown function GRMZM2G085474 0.65 3.6 × 10–46 Acetoacetyl–CoA thiolase 2 (ACAT2) GRMZM2G123940 0.65 4.0 × 10–46 Serine carboxypeptidase–like 45 (SCPL45) GRMZM2G078129 0.65 4.9 × 10–46 Drug transmembrane transporter activity GRMZM2G127431 0.65 5.5 × 10–46 Unknown function GRMZM2G039845 0.65 8.3 × 10–46 Transmembrane transport GRMZM2G093595 0.65 9.1 × 10–46 The DREB subfamily A–3 of ERF/AP2 transcription factor family GRMZM2G168898 0.65 9.8 × 10–46 Class 1 nonsymbiotic hemoglobin GRMZM2G037128 0.65 1.4 × 10–45 Sequence–specific DNA binding transcription factor GRMZM2G102878 0.65 1.6 × 10–45 Oleoyl–ACP thioesterase GRMZM2G128212 0.65 1.8 × 10–45 Zinc finger protein GRMZM2G031528 0.65 2.3 × 10–45 Heavy metal–associated domain, copper ion–binding GRMZM2G080183 0.65 3.5 × 10–45 Peroxidase superfamily protein GRMZM2G054706 0.65 4.4 × 10–45 Unknown protein GRMZM2G026391 0.65 4.6 × 10–45 The transporter OPT family are transporters of small oligopeptides
GRMZM2G139550 0.65 6.4 × 10–45 Sedoheptulose–7–phosphate:D–glyceraldehyde–3–phosphate glyceronetransferase
GRMZM2G318689 0.65 8.1 × 10–45 Ethylene receptor, subfamily 2 GRMZM2G032547 0.65 9.4 × 10–45 Double Clp–N motif–containing P–loop nucleoside triphosphate hydrolases GRMZM2G081462 0.65 9.6 × 10–45 ZIP protein
GRMZM2G035268 0.65 9.8 × 10–45 Non–phosphorylating NADP–dependent glyceraldehyde–3–phosphate dehydrogenase
GRMZM2G165428 0.64 1.2 × 10–44 Leucine–rich repeat protein kinase GRMZM5G852502 0.64 1.3 × 10–44 Acyl–ACP desaturase 2 GRMZM2G033208 0.64 1.6 × 10–44 Transketolase GRMZM2G077008 0.64 1.6 × 10–44 GAF domain GRMZM2G141607 0.64 1.9 × 10–44 NAD(P)–binding Rossmann–fold superfamily protein GRMZM5G898684 0.64 2.1 × 10–44 Alpha/beta–Hydrolases superfamily protein GRMZM2G048910 0.64 2.3 × 10–44 A putative transcription factor GRMZM2G161658 0.64 3.3 × 10–44 Alpha/beta–Hydrolases superfamily protein GRMZM2G016480 0.64 5.0 × 10–44 Leucine–rich repeat protein kinase family protein GRMZM2G039089 0.64 7.0 × 10–44 Chaperone protein dnaJ–related GRMZM2G030139 0.64 7.3 × 10–44 Pyruvate dehydrogenase kinase–E1 α subunit GRMZM2G135990 0.64 8.0 × 10–44 Unknown function GRMZM2G109120 0.64 1.3 × 10–43 Unknown function GRMZM2G080054 0.64 1.4 × 10–43 Myc–related bHLH transcription factor GRMZM2G328438 0.64 1.8 × 10–43 ZF HD homeobox, Cys/His dimer GRMZM2G162672 0.64 2.8 × 10–43 Encodes a protein with chlorophyll synthase activity GRMZM2G442555 0.64 3.0 × 10–43 Histone H2B GRMZM2G024550 0.64 3.3 × 10–43 Mitochondrial transcription termination factor family protein GRMZM5G819222 0.64 4.7 × 10–43 Pollen Ole e1 allergen and extensin family protein GRMZM2G064701 0.63 5.7 × 10–43 Fad2, omega–6 fatty acid desaturase, endoplasmic reticulum isozyme 2
Junjie� 10/8/12 2:45 PM
Junjie� 10/8/12 2:46 PM
Deleted: _
Deleted: (ABI4), the
Nature Genetics doi:10/1038/ng.2484

Gene r P value Annotation GRMZM2G142918 0.63 5.8 × 10–43 Aspartyl protease family protein GRMZM2G042407 0.63 8.3 × 10–43 Zinc finger (lateral root primordium type 1) domains GRMZM2G144730 0.63 1.4 × 10–42 Pyruvate kinase GRMZM2G145989 0.63 1.7 × 10–42 AAP1 (amino acid permease 1) GRMZM2G123815 0.63 1.9 × 10–42 Peptidase S10, serine carboxypeptidase GRMZM5G897067 0.63 1.9 × 10–42 Cystathionine beta–synthase (CBS) protein GRMZM2G059634 0.63 2.3 × 10–42 Plasmodesmal protein GRMZM2G042865 0.63 3.4 × 10–42 DON–Glucosyltransferase GRMZM2G123202 0.63 5.0 × 10–42 Late meristem identity2 (LMI2) GRMZM2G003725 0.63 6.8 × 10–42 Ring/U–box superfamily protein GRMZM2G030831 0.63 7.2 × 10–42 Cytochrome P450, family 87, subfamily A GRMZM2G175818 0.63 7.7 × 10–42 Acyl carrier protein GRMZM2G096372 0.63 9.0 × 10–42 Thionin GRMZM2G108798 0.63 9.5 × 10–42 SHI gene family GRMZM2G065496 0.63 1.2 × 10–41 Unknown function GRMZM2G051697 0.63 1.2 × 10–41 Putative adipose–regulatory protein (Seipin) GRMZM2G100315 0.63 1.6 × 10–41 Protein–L–isoaspartate methyltransferase GRMZM2G177001 0.63 1.8 × 10–41 RNA–binding protein GRMZM2G174598 0.63 1.9 × 10–41 Polygalacturonase activity GRMZM2G120202 0.63 2.2 × 10–41 Serine/threonine–protein phosphatase GRMZM2G043493 0.63 2.3 × 10–41 Transcription regulators GRMZM2G473960 0.63 2.3 × 10–41 LEA protein GRMZM2G078691 0.63 2.4 × 10–41 Nuclear transcription factor Y subunit C–2 GRMZM2G131609 0.62 2.6 × 10–41 Leucine–rich receptor–like protein kinase GRMZM2G027955 0.62 2.9 × 10–41 ADP–glucose pyrophosphorylase GRMZM2G124566 0.62 4.7 × 10–41 Growth regulating factor encoding transcription activator GRMZM2G065635 0.62 4.7 × 10–41 Unknown function GRMZM2G148769 0.62 6.7 × 10–41 6–phosphogluconolactonases (6PGL) GRMZM2G025685 0.62 6.7 × 10–41 Heat shock transcription factor (Hsf) GRMZM2G002807 0.62 6.9 × 10–41 Triosephosphate isomerase GRMZM2G117198 0.62 7.8 × 10–41 S–adenosylmethionine synthase GRMZM2G061963 0.62 8.0 × 10–41 Unknown function GRMZM2G008263 0.62 9.3 × 10–41 Glycogen/starch synthases, ADP–glucose type GRMZM2G062429 0.62 1.0 × 10–40 Diacylglycerol kinase, plant GRMZM2G088242 0.62 1.4 × 10–40 Heat shock transcription factor (Hsf) GRMZM2G378547 0.62 2.1 × 10–40 Pto–interacting 1–4 (PTI1–4) GRMZM2G112238 0.62 2.7 × 10–40 Myrosinase–binding–related, jacalin–like lectin GRMZM2G158788 0.62 2.7 × 10–40 Unknown function GRMZM2G140739 0.62 2.9 × 10–40 Unknown function GRMZM2G100911 0.62 3.0 × 10–40 Leucine–rich repeat protein kinase family protein GRMZM2G085945 0.62 3.2 × 10–40 Zinc finger (C2H2-type) protein GRMZM2G161435 0.62 5.0 × 10–40 Transcription factor involved in photomorphogenesis GRMZM2G476322 0.62 5.6 × 10–40 Unknown function GRMZM2G087323 0.62 8.6 × 10–40 Beta–ketoacyl reductase (KCR) GRMZM2G167986 0.62 8.7 × 10–40 Cytochrome P450 78A1 GRMZM2G053627 0.62 1.0 × 10–39 Zinc finger (FYVE/PHD-type) protain GRMZM2G097313 0.61 1.1 × 10–39 Leucine–rich repeat protein kinase family protein GRMZM2G014356 0.61 1.1 × 10–39 Unknown function GRMZM2G094602 0.61 1.3 × 10–39 Zinc finger (C3HC4–type) protein GRMZM2G123544 0.61 1.5 × 10–39 P–loop containing nucleoside triphosphate hydrolases superfamily protein GRMZM2G150434 0.61 1.7 × 10–39 Peripheral–type benzodiazepine receptor GRMZM2G045278 0.61 1.9 × 10–39 Universal stress protein A GRMZM5G893630 0.61 2.2 × 10–39 Unknown function GRMZM2G129879 0.61 2.4 × 10–39 Unknown function GRMZM2G017606 0.61 2.4 × 10–39 A member of SHI gene family GRMZM2G070351 0.61 2.8 × 10–39 GHMP kinase family protein GRMZM2G088565 0.61 2.9 × 10–39 Pyruvate dehydrogenase E1 b–subunit GRMZM2G004795 0.61 3.2 × 10–39 CCCH transcription factor GRMZM2G024482 0.61 3.9 × 10–39 FabA, FabZ GRMZM2G070422 0.61 4.0 × 10–39 Enoyl–ACP reductase GRMZM2G038855 0.61 4.2 × 10–39 ESK1 (Eskimo1) GRMZM2G071196 0.61 5.2 × 10–39 Protein phosphatase 2C, manganese/magnesium aspartate binding site GRMZM2G058702 0.61 6.0 × 10–39 Pyruvate dehydrogenase E2 subunit GRMZM2G117786 0.61 6.3 × 10–39 Dihydrolipoyllysine–residue acetyltransferase GRMZM2G168588 0.61 6.7 × 10–39 Cell wall macromolecule catabolic process GRMZM2G154532 0.61 6.7 × 10–39 NAD dependent epimerase/dehydratase family protein GRMZM2G101634 0.61 7.1 × 10–39 Unknown function
Nature Genetics doi:10/1038/ng.2484

Gene r P value Annotation GRMZM2G066274 0.61 7.6 × 10–39 Leucine–repeat receptor kinase GRMZM2G141472 0.61 8.2 × 10–39 The F–box domain GRMZM2G074946 0.61 8.4 × 10–39 6–phosphogluconolactonases (6PGL) GRMZM2G097229 0.61 9.2 × 10–39 Member of beta–expansins GRMZM2G176301 0.61 9.7 × 10–39 Fatty acid or carotene hydroxylasesor sterol desaturases aGenes highlighted in blue are annotated as transcription factors; genes highlighted in yellow were previously reported as the putative target genes of WRI1a33; genes labeled in orange are involved in late glycolysis and fatty acid biosynthesis in plastids; genes labeled in green are mainly related to the carbohydrate metabolic process, amino acid metabolism process or transmembrane transport process; genes labeled in gray have an unknown function.
Nature Genetics doi:10/1038/ng.2484

Supplementary Table 11 List of the primers used in this study Category Gene Regiona Primer sequence
Sequencing ZmFAD2 R1 5'–CACAAGGGAAATCAACTACGCC–3'/5'–TCCATTCGGAACAATCTATGGAAC–3' R2 5'–GATTTGTTGGTCCCCATCTTG–3'/5'–CCTGATTTCTCCTCCCATTCC–3' R3 5'–AGACTACGGCGTCCTCAACC–3'/5'–CAGAGGAATCGGCAAGGCT–3' ZmWRI1a R1 5'–ATCATGCGTTTGGCATAGGA–3'/5'–CAAGCAACAAGTAGCCAAGAT–3' R2 5'–TGATCTTGGCTACTTGTTGCTTG–3'/5'–GTGAGAGAAGAAGCGAACTTTACG–3' R3 5'–ACTTAACCATTCGTCCGCTTCT–3'/5'–ATGCTCGACTATAACTTGATT–3' ZmLACS R1 5'–GATCTATTGGACGTGAGGCG–3'/5'–ACAGTAGGGTGTTACCAATGAGC–3' R2 5'–TTTGCTCTGCCCTGTTTGTC–3/5'–CAGAAGATTCCACAAATTCCCTC–3' R3 5'–GATCGAGCTGCTGCCTGAG–3'/5'–ATATCCAACGGACAATCTACGG–3' ZmACP R1 5'–GAAAGCGTCGTTTGAGTT–3'/5'–ATAGCCAATCTAACCGTCCAAG–3' R2 5'–GAAGGCGAACAAGAGGAAGC–3'/5'–AGCCAACCATTTCCATTCG–3' R3 5'–CGGGTGGAACTTGTTATGGC–3'/5'–AGGGCACTGAATCGGAACAC–3' ZmCOPII R1 5'–AAATACCTAACCGCGACGAC–3'/5'–GCCATCATCAATCCAGGG–3' R2 5'–CACAGTGCCATTTCGATCA–3'/5'–TAATACCAAGGGCAACCTCTAC–3' R3 5'–TGGAAACAAGTCGCCTACC–3'/5'–AGTGTAGGCCATGTCTGGTG–3' R4 5'–TGTGGCACGGGAGTTTTC–3'/5'–GGCTTTACCCTCAATATCGTCT–3' PCR assay ZmFAD2 S230A 5'–TTGGTCCCCATCTTGCTCTC–3'/5'–AGCGCCGCGGCGAGCGA–3' ZmWRI1a InDel_2000 5'–ACTTAACCATTCGTCCGCTTCT–3'/5'–ATGCTCGACTATAACTTGATT–3' ZmLACS InDel_146 5'–GATCGAGCTGCTGCCTGAG–3'/5'–ATATCCAACGGACAATCTACGG–3' ZmACP InDel_8 5'–CGGGTGGAACTTGTTATGGC–3'/5'–AGGGCACTGAATCGGAACAC–3' ZmCOPII Indel_20 5'–GCCGAGGTCCAGCCGTAGT–3'/5'–GGCGAGGCCTGGAGAGAA–3' aSee Supplementary Figs. 6–9 and 11 for the regions that R1, R2, R3 and R4 located.
Nature Genetics doi:10/1038/ng.2484

Supplementary references: S1. Han J.X. et al. Functional characterization of β–ketoacyl–CoA synthase genes from Brassica napus L.
Plant Mol. Bio. 46, 229–239 (2001). S2. Domergue, F., Chevalier, S., Créach, A., Cassagne, C. & Lessire, R. Purification of the acyl–CoA
elongase complex from developing rapeseed and characterization of the 3–ketoacyl–CoA synthase and the 3–hydroxyacyl–CoA dehydratase. Lipids 35, 487–494 (2000).
S3. Fofana, B., Duguid, S. & Cloutier, S. Cloning of fatty acid biosynthetic genes β–ketoacyl CoA synthase, fatty acid elongase, stearoyl–ACP desaturase, and fatty acid desaturase and analysis of expression in the early developmental stages of flax (Linum usitatissimum L.) seeds. Plant Sci. 166, 1487–1496 (2004).
S4. Kajikawa M. et al. Functional analysis of a β–ketoacyl–CoA synthase gene, MpFAE2, by gene silencing in the liverwort Marchantia polymorpha L. Biosci.,Biotech.,and Bioche. 67, 605–612 (2003).
S5. Bagnaresi, P., Mazars–Marty, D., Pupillo, P., Marty, F. & Briat, J.F. Tonoplast subcellular localization of maize cytochrome b5 reductases. Plant J. 24, 645–654 (2000).
S6. Bagnaresi, P. et al. Cloning and characterization of a maize cytochrome–b5 reductase with Fe3+–chelate reduction capability. Biochem J. 338, 499–505 (1999).
S7. Sayanova, O. et al. Expression of a borage desaturase cDNA containing an N–terminal cytochrome b5 domain results in the accumulation of high levels of Δ6–desaturated fatty acids in transgenic tobacco. PNAS. 94, 4211–4216 (1997).
S8. Smith, M.A., Jonsson, L., Stymne, S. & Stobart, K. Evidence for cytochrome b5 as an electron donor in ricinoleic acid biosynthesis in microsomal preparations from developing castor bean (Ricinus communis L.). Biochem. J. 287, 141–144 (1992).
S9. Sperling, P., Schmidt, H. & Heinz, E. A cytochrome–b5–containing fusion protein Similar to plant acyl lipid desaturases. FEBS J. 232, 798–805 (1995).
S10. Tchang, F. et al. Phospholipid transfer protein: full–length cDNA and amino acid sequence in maize. Amino acid sequence homologies between plant phospholipid transfer. J. Biol. Chem. 263, 16849–16855 (1988).
S11. Breu, V. et al. A 10 kD barley basic protein transfers phosphatidylcholine from liposomes to mitochondria. Carlsberg Res. Commun. 54, 81–84 (1989).
S12. Salas, J.J. & Ohlrogge, J.B. Characterization of substrate specificity of plant FatA and FatB acyl–ACP thioesterases. Arch. Biochem. Biophys. 403, 25–34 (2002).
S13. Dörmann, P., Voelker, T.A. & Ohlrogge, J.B. Accumulation of palmitate in Arabidopsis mediated by the acyl–Acyl carrier protein thioesterase FATB1. Plant Physiol. 123, 637–644 (2000).
S14. Tang, J.H., Scarth, R. & McVetty, P.B.E. Stability of the expression of acyl–ACP Thioesterase Transgenes in Oilseed Rape Doubled Haploid Lines. Crop Sci. 44, 732–740 (2002).
S15. Lemieux, B., Miquel, M., Somerville, C. & Browse, J. Mutants of Arabidopsis with alterations in seed lipid fatty acid composition. Theo.Appl.Genet. 80, 234–240 (1990).
S16. Mietkiewska, E. et al. Seed–Specific heterologous expression of a nasturtium FAE Gene in Arabidopsis results in a dramatic increase in the proportion of erucic acid. Plant Physiol. 136, 2665–2675 (2004).
S17. Dietrich, C.R. et al. Characterization of two GL8 paralogs reveals that the 3–ketoacyl reductase component of fatty acid elongase is essential for maize (Zea mays L.) development. Plant J. 42, 844–861 (2005).
S18. Eastmond, P.J., Hooks, M. & Graham, I.A. The Arabidopsis acyl–CoA oxidase gene family. Biochem. Soc. Trans. 28, 755–757 (2000).
S19. Rylott, E.L. et al. Arabidopsis mutants in short– and medium–chain acyl–CoA oxidase activities accumulate acyl–CoAs and reveals that fatty acid beta–oxidation is essential for embryo development. J. Biol. Chem. 278, 21370–21377 (2003).
S20. Adham, A.R., Zolman, B.K., Millius, A. & Bartel, B. Mutations in Arabidopsis acyl–CoA oxidase genes reveal distinct and overlapping roles in beta–oxidation. Plant J. 41, 859–874 (2005).
S21. Ke, J. et al. The role of pyruvate dehydrogenase and acetyl–coenzyme A synthetase in fatty acid synthesis in developing Arabidopsis seeds. Plant Physiol. 123, 497–508 (2000).
Nature Genetics doi:10/1038/ng.2484