GENOME-WIDE ASSOCIATION STUDIES OF NASOPHARYNGEAL ...
149
GENOME-WIDE ASSOCIATION STUDIES OF NASOPHARYNGEAL CARCINOMA IN THE MALAYSIAN CHINESE COHORT USING SINGLE GENES, META-ANALYSIS AND PATHWAY ANALYSIS APPROACHES CHIN YOON MING THESIS SUBMITTED IN FULFILMENT OF THE REQUIREMENTS FOR THE DEGREE OF DOCTOR OF PHILOSOPHY INSTITUTE OF BIOLOGICAL SCIENCES FACULTY OF SCIENCE UNIVERSITY OF MALAYA KUALA LUMPUR 2017
Transcript of GENOME-WIDE ASSOCIATION STUDIES OF NASOPHARYNGEAL ...

GENOME-WIDE ASSOCIATION STUDIES OF
NASOPHARYNGEAL CARCINOMA IN THE
MALAYSIAN CHINESE COHORT USING SINGLE
GENES, META-ANALYSIS AND PATHWAY ANALYSIS
APPROACHES
CHIN YOON MING
THESIS SUBMITTED IN FULFILMENT OF THE
REQUIREMENTS FOR THE DEGREE OF
DOCTOR OF PHILOSOPHY
INSTITUTE OF BIOLOGICAL SCIENCES
FACULTY OF SCIENCE
UNIVERSITY OF MALAYA
KUALA LUMPUR
2017

ii
UNIVERSITY OF MALAYA
ORIGINAL LITERARY WORK DECLARATION
Name of Candidate: Chin Yoon Ming
Matric No: SHC110088
Name of Degree: Doctor of Philosophy
Title of Project Paper/Research Report/Dissertation/Thesis (“this Work”):
Genome-wide association studies of nasopharyngeal carcinoma in the Malaysian
Chinese cohort using single genes, meta-analysis and pathway analysis approaches
Field of Study: Genetics and Molecular Biology
I do solemnly and sincerely declare that:
(1) I am the sole author/writer of this Work;
(2) This Work is original;
(3) Any use of any work in which copyright exists was done by way of fair dealing
and for permitted purposes and any excerpt or extract from, or reference to or
reproduction of any copyright work has been disclosed expressly and
sufficiently and the title of the Work and its authorship have been acknowledged
in this Work;
(4) I do not have any actual knowledge nor do I ought reasonably to know that the
making of this work constitutes an infringement of any copyright work;
(5) I hereby assign all and every rights in the copyright to this Work to the
University of Malaya (“UM”), who henceforth shall be owner of the copyright
in this Work and that any reproduction or use in any form or by any means
whatsoever is prohibited without the written consent of UM having been first
had and obtained;
(6) I am fully aware that if in the course of making this Work I have infringed any
copyright whether intentionally or otherwise, I may be subject to legal action or
any other action as may be determined by UM.
Candidate’s Signature Date:
Subscribed and solemnly declared before,
Witness’s Signature Date:
Name:
Designation:

iii
GENOME-WIDE ASSOCIATION STUDIES OF NASOPHARYNGEAL
CARCINOMA IN THE MALAYSIAN CHINESE COHORT USING SINGLE
GENES, META-ANALYSIS AND PATHWAY ANALYSIS APPROACHES
ABSTRACT
Nasopharyngeal carcinoma (NPC) is an epithelial squamous cell carcinoma on
the mucosal lining of the nasopharynx with high incidence in the southern Chinese
population. NPC is constantly linked to Epstein Barr virus (EBV) infection but its
etiology remains elusive considering many carriers of EBV never develop NPC.
Genetic factors play an important role in NPC susceptibility. This study set out to
identify genetic variants linked to NPC susceptibility using a genome-wide association
(GWAS) approach in the Malaysian Chinese. The GWAS encompasses single genes,
meta-analysis with NPC cohorts from Taiwan and southern China and a pathway/gene
set approach. In the single gene approach, GWAS results confirmed the association of
HLA-A to NPC with the strongest signal detected in rs3869062 (P=1.73x10⁻⁹). Fine
mapping revealed associations in the amino acid variants as well as its corresponding
SNPs in the antigen peptide binding groove (PHLA-A-aa-site-99=3.79x10⁻⁸,
Prs1136697=3.79x10⁻⁸) and T-cell receptor binding site (PHLA-A-aa-site-145=1.41x10⁻⁴,
Prs1059520=1.41x10⁻⁴) of the HLA-A. HLA-A amino acid variants and SNPs were
correlated with the effects of HLA-A*02:07. Results showed a protective trend towards
NPC for HLA-A variants in the Malaysian Chinese, consistent with previous findings of
HLA-A NPC association. Meta-analysis performed by combining results from NPC
GWAS of Malaysia, Taiwan and southern China (2,152 cases; 3,740 controls) revealed
43 noteworthy findings outside the MHC region were identified and targeted for
replication in a pooled analysis (4,716 cases; 5,379 controls). In the combined meta-
analysis, rs31489, located within the CLPTM1L/TERT region on chromosome 5p15.33,
was strongly associated with NPC (OR=0.81; P=6.3x10⁻¹³). Associations of previously
reported NPC GWAS were also replicated, namely rs6774494 (P=1.5x10⁻¹²; located in

iv
the MECOM gene region), rs9510787 (P=5.0x10⁻¹⁰; located in the TNFRSF19 gene
region), and rs1412829/rs4977756/rs1063192 (P=2.8x10⁻⁸, P=7.0x10⁻⁷, and P=8.4x10⁻⁷,
respectively; located in the CDKN2A/B gene region). The TERT gene is important for
telomere maintenance and is overexpressed in NPC. The EBV protein LMP1 has been
reported to modulate TERT expression/telomerase activity in NPC. The findings suggest
that factors involved in telomere length maintenance are involved in NPC pathogenesis.
An integrated pathway approach was employed to identify dysregulated pathways
linked to NPC. This approach combines imputation NPC GWAS data from a Malaysian
Chinese cohort as well as published expression data GSE12452 from both NPC and
healthy nasopharynx tissues. Results identified NPC association with the Gene
Ontology (GO) axonemal dyenein complex pathway (PGWAS-GSEA=1.98x10⁻²; PExpr-
GSEA=1.27x10⁻²⁴; PBonf-Combined=4.15x10⁻²¹). This association was replicated in a separate
cohort using gene expression data from NPC and healthy nasopharynx tissues (PAmpliSeq-
GSEA=1.37x10⁻³). Loss of function in the axonemal dyenein complex causes impaired
cilia function, leading to poor mucociliary clearance and subsequently upper or lower
respiratory tract infection, the former of which includes the nasopharynx. Our approach
illustrates the potential use of integrated pathway analysis in detecting gene sets
involved in the development of NPC in the Malaysian Chinese cohort.
Keywords: nasopharyngeal carcinoma, genome-wide association studies, imputation,
meta-analysis, gene-set enrichment analysis

v
ABSTRAK
Karsinoma salur udara nasofarinks (NPC) adalah sejenis karsinoma sel skuamus
epithelial pada lapisan mukosa salur udara nasofarinks dengan insiden yang tinggi di
kalangan populasi masyarakat Cina selatan. NPC sentiasa dikaitkan dengan jangkitan
virus Epstein Barr (EBV) tetapi etiologinya masih sukar difahami memandangkan
kebanyakan pembawa virus EBV tidak akan menghidap NPC. Adalah dipercayai
bahawa faktor genetik memainkan peranan penting dalam kerentanan NPC. Oleh itu,
dalam penyelidikan ini, variasi genetik yang dikaitkan dengan NPC dikenalpasti
dengan menggunakan kaedah kajian perkaitan menyeluruh genom (GWAS) dalam
populasi berketurunan Cina Malaysia. Kajian GWAS ini merangkumi gen tunggal,
analisis meta terhadap pesakit NPC dari Taiwan dan selatan Cina serta satu kaedah set
laluan gen. Melalui kaedah gen tunggal, analisis GWAS yang dijalankan telah
mengesahkan perkaitan antara HLA-A dengan NPC di mana isyarat paling tinggi
dikesan pada rs3869062 (P=1.73x10⁻⁹). Pemetaan terperinci mendedahkan perkaitan
dalam varian-varian asid amino berserta SNP yang sepadan dalam alur pengikat peptida
antigen (PHLA-A-aa-site-99=3.79x10⁻⁸, Prs1136697=3.79x10⁻⁸) dan tapak pengikat reseptor sel
T (PHLA-A-aa-site-145=1.41x10⁻⁴, Prs1059520=1.41x10⁻⁴) HLA-A. Varian-varian asid amino
dan SNP HLA-A menunjukkan korelasi tinggi dengan kesan HLA-A*02:07. Hasil kajian
ini menunjukkan varian-varian asid amino HLA-A cenderung sebagai penghindar NPC
dalam populasi keturunan Cina Malaysia, sejajar dengan penemuan terdahulu bagi
perkaitan antara HLA-A dan NPC. Kaedah analisis meta menggabungkan data NPC
GWAS Malaysia, Taiwan dan selatan China (2,152 kes; 3740 kawalan) yang dijalankan
mendedahkan 43 penemuan berpotensi di luar rantau MHC yang telah dikenalpasti dan
disasarkan untuk replikasi dalam analisis gabungan (4,716 kes; 5,379 kawalan). Dalam
meta-analisis gabungan, rs31489 yang terletak dalam rantau CLPTM1L/TERT pada
kromosom 5p15.33, dikaitkan dengan NPC (OR=0.81; P=6.3x10⁻¹³). Perkaitan variasi

vi
SNP NPC yang dilaporkan sebelum ini juga dikenalpasti, iaitu rs6774494 (P=1.5x10⁻¹²;
terletak di rantau gen MECOM), rs9510787 (P=5.0x10⁻¹⁰; terletak di rantau gen
TNFRSF19), dan rs1412829/rs4977756/rs1063192 (P=2.8x10⁻⁸, P=7.0x10⁻⁷ dan
P=8.4x10⁻⁷, masing-masing terletak di rantau gen CDKN2A/B). Gen TERT adalah
penting untuk penyelenggaraan telomer dan menunjukkan ekspresi tinggi dalam NPC.
Protein EBV iaitu LMP1 telah dilaporkan mampu mengubah aktiviti TERT dalam NPC.
Penemuan penyelidikan ini menunjukkan bahawa faktor-faktor yang terlibat dalam
penyelenggaraan telomer terlibat dalam patogenesis NPC. Pendekatan set laluan gen
untuk mengenal pasti set gen yang berkait dengan NPC. Pendekatan kami
menggabungkan data imput NPC GWAS dari populasi Cina Malaysia dan data ekspresi
gen sedia ada GSE12452 dari kedua-dua tisu NPC dan nasofarinks sihat. Kami
mengenal pasti perkaitan NPC dengan Ontologi Gen (GO) kompleks “axonemal
dynein” (PGWAS-GSEA=1.98x10⁻²; PExpr-GSEA=1.27x10⁻²⁴; PBonf-Combined=4.15x10⁻²¹).
Penemuan ini telah disahkan dengan data ekspresi gen tisu NPC dan nasofarinks sihat
(PAmpliSeq-GSEA=1.37x10⁻³). Kehilangan fungsi kompleks “axonemal dynein”
menyebabkan rencatan fungsi silia, seterusnya mengakibatkan pengumpulan mukus dan
seterusnya jangkitan di bahagian atas dan bawah saluran pernafasan, di mana jangkitan
bahagian atas termasuklah salur udara nasofarinks. Pendekatan kami menunjukkan
potensi kegunaan kaedah integrasi laluan dalam mengesan kumpulan gen yang terlibat
dalam penularan NPC di kalangan masyarakat Cina di Malaysia.

vii
ACKNOWLEDGEMENTS
This work has been a culmination of many years of research and collaboration. I
am indebted to the many people who have helped made this possible. I would like to
thank my supervisor Dr. Ng Ching Ching for her guidance and supervision as well as
the many opportunities afforded to me during my time in University Malaya. Dr. Taisei
Mushiroda for hosting my attachment at the Laboratory for Pharmacogenetics, RIKEN
Yokohama. Dr. Yew Poh Yin for technical assistance and guidance. Dr. Tan Lu Ping
and Dr. Alan Khoo from IMR for providing access to the Malaysian NPC Study Group
samples.
I would like to thank the Malaysian NPC Study Group for access to NPC
samples. I also thank all participants in this study, staff of the Department of
Otorhinolaryngology, Dr. Veera Sekaran Nadarajah from the Department of Pathology,
staff of the Blood Bank UMMC, staff of HKL, HPP, HUS, QES, Tung Shin Hospital,
and NCI Cancer Hospital. I also thank the technical staff of the Laboratory for
Pharmacogenetics and the Laboratory for Genotyping Development at RIKEN Center
for Integrative Medical Sciences for technical assistance rendered.
On a more personal note, I would like to dedicate this work to people whom I
hold dear in my heart. To my family, my closest friends and my colleagues. Thank you
for everything.

viii
TABLE OF CONTENTS
Abstract…………………………………………………………………………… iii
Abstrak……………………………………………………………………………. v
Acknowledgements……………………………………………………………...... vii
Table of Contents…………………………………………………………………. viii
List of Figures…………………………………………………………………….. xii
List of Tables……………………………………………………………………... xiv
List of Symbols and Abbreviations………………………………………………. xv
List of Appendices………………………………………………………………... xviii
CHAPTER 1: INTRODUCTION……………..………………………………… 1
CHAPTER 2: LITERATURE REVIEW………………………………………. 4
2.1 NPC diagnosis and classification ………………………………………... 4
2.2 NPC symptoms and method of diagnosis ……………………………….. 5
2.3 NPC treatment …………………………………………………................ 8
2.4 NPC epidemiology: Geographic origin ………………………………….. 9
2.5 Environmental factors …………………………………………................. 12
2.5.1 Diet ……………………………………………………………….. 12
2.5.2 Occupational exposures ………………………………………….. 15
2.5.3 Epstein-Barr virus (EBV) ………………………………………… 15
2.6 Genetic factors ……………………………………………………………. 18
2.6.1 Familial studies of NPC ………………………………………….. 18
2.6.2 Candidate gene approach ………………………………………… 19
2.6.3 Immune-related genes ……………………………………………. 20
2.6.4 Metabolic genes ………………………………………………….. 23

ix
2.6.5 DNA repair genes ………………………………………………… 24
2.7 Association studies in the age of genomics ………………………………. 25
2.7.1 The HapMap and 1000 genomes project …………………………. 26
2.7.2 Imputation ………………………………………………………… 27
2.7.3 Genome-wide association studies (GWAS) ………………...……. 29
2.7.4 GWAS in NPC ……………………………………………………. 32
2.7.5 Meta-analysis of NPC GWAS studies ………………………......... 35
2.7.6 Pathway analysis of NPC GWAS studies ……………………........ 37
CHAPTER 3: METHODOLOGY…..…………………………………….......... 39
3.1 Methodology for NPC GWAS study…………………………………....... 39
3.1.1 Study cohort …………………………………………………........ 39
3.1.2 Genotyping of SNPs and statistical analysis ………………........... 39
3.1.3 Imputation …………………………………………………........... 41
3.1.4 HLA-A SNP and amino acid variants analysis ………………........ 41
3.1.5 Regulatory functions of NPC associated HLA-A SNPs …….......... 42
3.2 Methodology for meta-analysis of NPC GWAS…..…………………........ 43
3.2.1 GWAS data for meta-analysis ………………………………......... 43
3.2.2 Imputation to combine GWAS SNPs ……………………….......... 45
3.2.3 Statistical analysis …………………………………………............ 45
3.2.4 Replication of meta-analysis targets ………………………............ 46
3.3 Methodology for integrated pathway analysis of NPC ………………........ 48
3.3.1 NPC GWAS data ……………………………………………......... 48
3.3.2 Imputation and combining GWAS datasets …………………......... 49
3.3.3 GWAS Pathway analysis …………………………………….......... 49
x
3.3.4 GEO Gene expression pathway analysis ……………………......... 50
3.3.5 Fisher’s method for integrating GWAS and expression data .......... 51
3.3.6 Sample collection for gene expression analysis …………….......... 51
3.3.7 Tissue processing and RNA isolation for gene expression
analysis ………………………………………………………........ 52
3.3.8 Read alignment and differential gene expression analysis ….......... 53
CHAPTER 4: RESULTS ………………………………………………………... 54
4.1 Results for NPC GWAS study ..………………………………………....... 54
4.1.1 GWAS genotyping and validation …………………………........... 54
4.1.2 Imputation to fine map the HLA-A gene …………………….......... 61
4.1.3 Molecular HLA-A alleles genotyping ………………………........... 63
4.1.4 Amino acid variants …………………………………………......... 65
4.1.5 Regulatory functions of NPC associated HLA-A SNP ……............ 66
4.1.6 Association signals from previous NPC GWAS studies ……......... 67
4.2 Results for meta-analysis of NPC GWAS ……………………………....... 72
4.3 Results for integrated pathway analysis of NPC ………………………..... 80
4.3.1 GWAS and gene expression data ……………………………........ 80
4.3.2 GWAS and Gene Expression Pathway analysis …………….......... 91
CHAPTER 5: DISCUSSION …………………….……………………………… 92
5.1 Discussion for NPC GWAS study ………………………………............... 92
5.2 Discussion for meta-analysis of NPC GWAS …………………….............. 95
5.3 Discussion for integrated pathway analysis of NPC ……………................ 97

xi
CHAPTER 6: CONCLUSION ………………………………………………….. 99
References …………………………………………………………………............ 101
List of publications and papers presented.…………………………………............ 130
Appendices ……………………………………………………………………....... 134

xii
LIST OF FIGURES
Figure Description Page
Figure 2.1 Anatomical view of the nasopharynx and possible routes 4
of local spread of tumor to adjacent regions
Figure 2.2 Endemic regions of nasopharyngeal carcinoma occurrence 10
Figure 2.3 Nasopharyngeal carcinoma incidence worldwide 13
Figure 2.4 Imputation work flow for genome-wide association studies 28
Figure 2.5 The case-control genome-wide association study (GWAS) 30
design
Figure 4.1 Plots of principal components from PCA analysis of NPC 55
GWAS samples
Figure 4.2 Log10 quantile-quantile (Q-Q) plot for all SNPs from Malaysian 56
NPC GWAS
Figure 4.3 Manhattan plot of the genome wide P-values of association 57
in NPC Malaysian Chinese
Figure 4.4 LD structure of GWAS SNPs with genome-wide significant 58
association
Figure 4.5 NPC associated SNPs spanning the HLA-A gene and its 62
adjacent regions
Figure 4.6 NPC association plot of amino acid variants mapped from 68
HLA-A alleles
Figure 4.7 GeneVar eQTL analysis of HLA-A flanking SNP rs41545520 69
Figure 4.8 Individual Study Results from GWAS Meta-Analysis and 78
Replication Studies for Selected SNPs
Figure 4.9 PCA plot of HumanOmniExpress_12 v1.1 and 82
HumanHap550K samples after outlier removal
Figure 4.10 PCA plot of HumanOmniExpress_12 v1.1 and 83
HumanHap550K against Hapmap CHB and JPN samples
after outlier removal
Figure 4.11 Manhattan plot of HumanOmniExpress_12 v1.1, 84
HumanHap550K and all imputated SNPs

xiii
Figure Description Page
Figure 4.12 QQ plot of merged HumanOmniExpress_12 v1.1 and 85
HumanHap550K post imputation
Figure 4.13 PCA plot 86
Figure 4.14 Sample-to-sample distances 86

xiv
LIST OF TABLES
Table Description Page
Table 2.1 WHO histopathological classification of NPC 7
Table 2.2 TNM clinical classification for tumors of the nasopharynx 8
Table 2.3 Summary of NPC association results based on GWAS studies 38
Table 3.1 Summary of studies included in the meta-analysis 44
Table 4.1 Association of GWAS SNPs to NPC in Malaysian Chinese 59
Table 4.2 Multivariate logistic regression for GWAS SNPs 60
with genome-wide significant association
Table 4.3 Association of HLA-A alleles to NPC in Malaysian Chinese 63
Table 4.4 HLA-A amino acid variants association and function prediction 70
By PROVEAN, SIFT and Polyphen-2
Table 4.5 HaploReg prediction of 5'-UTR HLA-A SNP variants 71
Table 4.6 Results for 43 SNPs in Malaysian Chinese combining GWAS 74
and replication samples
Table 4.7 Results from GWAS meta-analysis and replication study for 76
43 SNPs selected for replication
Table 4.8 Pathways associated with NPC in a Malaysian Chinese cohort 87
Table 4.9 List of genes in pathways associated with NPC 87
Table 4.10 Sample details of NPC and non-NPC nasopharynx tissues 90
from a Malaysian cohort used in gene expression analysis

xv
LIST OF SYMBOLS AND ABBREVIATIONS
λgc : lambda genomic control inflation factor
1 kG : 1000 genomes project
3’-UTR : 3’-untranslated region
5’-UTR : 5’-untranslated region
95% CI : 95% confidence interval
AJCC : The American Joint Committee on Cancer
ASN : Asians
ASP : affected sib-pair
ASR : age-standardized rate
BARF1 : Epstein-Barr virus BamHI-A rightward frame 1
CHB : Chinese Han Beijing
CHD : Chinese Han Denver
CNV : copy number variation
CT : computerized tomography
dbMHC : database for major histocompatibility complex
EA : early antigen
EBER : Epstein-Barr virus-encoded small RNAs
EBNA : Epstein-Barr virus nuclear antigen
EBV : Epstein-Barr virus
EGFR : epidermal growth factor receptor
ENCODE : Encyclopedia of DNA Elements
eQTL : expression quantitative trait loci
GEO : Gene Expression Omnibus
GO : Gene ontology
GSEA : gene-set enrichment analysis
xvi
GWAS : genome wide association study
HKL : Kuala Lumpur General Hospital
HPP : Penang General Hospital
HUS : Hospital University Sarawak
HWE : Hardy–Weinberg equilibrium
IARC : International Agency for Research on Cancer
IBS : identity-by-state
IgA : immunoglobulin A
ImmPort : Immunology Database and Analysis Portal
JPN : Japan
KEGG : Kyoto Encyclopedia of Genes and Genomes
LD : linkage disequilibrium
LMP : Epstein-Barr virus latent membrane protein
LOD : logarithm of odds
MAF : minor allele frequency
MHC : major histocompatibility complex
MRI : magnetic resonance imaging
NCBI : National Center for Biotechnology Information
NCCN : National Comprehensive Cancer Network
NDMA : N-nitrosodimethylamine
NPC : nasopharyngeal carcinoma
NPIP : N-nitrosopiperidine
NPYR : N-nitrosopyrrolidine
OR : odds ratio
PCA : principal component analysis

xvii
PET : positron emission tomography
PROVEAN : Protein Variation Effect Analyzer
QQ plot : quantile-quantile plot
QES : Queen Elizabeth Hospital Sabah
r2 : Pearson's correlation coefficient
RIKEN : The Institutes of Physical and Chemical Research
SIFT : Sorting Intolerant from Tolerant
SNP : single nucleotide polymorphism
TNM : tumor node metastasis
UICC : International Union Against Cancer
UMMC : University Malaya Medical Centre
VCA : viral capsid antigen
VEGF : vascular endothelial growth factor
WHO : World Health Organization

xviii
LIST OF APPENDICES
Appendix Description Page
Appendix A OmniExpress NPC GWAS analysis showing top 20 associations 134
Appendix B Association results of HLA-A flanking SNPs imputated 137
by Hapmap 2, Hapmap 3 and 1000 genomes
Appendix C Association of Bi-allelic HLA-A SNPs to NPC 146
susceptibility in Malaysian Chinese
Appendix D Association of Multi-allelic HLA-A SNPs to NPC 151
susceptibility in Malaysian Chinese
Appendix E Multivariate logistic regression of HLA-A single SNPs and 152
previous NPC associated SNPs adjusted for effects of
HLA-A*02:06, HLA-A*02:07 and HLA-A*11:01
Appendix F Multivariate logistic regression of HLA-A*02:06, 156
HLA-A*02:07 and HLA-A*11:01 adjusted for the effects of
HLA-A single SNPs and previous NPC associated SNPs
Appendix G Association of HLA-A amino acid residues to NPC 160
in Malaysian Chinese (Bi-allelic variants)
Appendix H Association of HLA-A amino acid residues to NPC in 168
Malaysian Chinese (Multi-allelic variants)
Appendix I HLA-A amino acid variants association and function 171
prediction by PROVEAN, SIFT and Polyphen-2
Appendix J Multivariate logistic regression of HLA-A amino acid 173
variants adjusted for effects of HLA-A*02:06, HLA-A*02:07
and HLA-A*11:01
Appendix K Multivariate logistic regression of HLA-A*02:06, HLA-A*02:07 174
and HLA-A*11:01 adjusted for the effects of HLA-A
amino acid variants
Appendix L Replication of previously reported GWAS SNPs with 175
genome-wide significance association to NPC
Appendix M Results from NPC GWAS Meta-Analysis 177
Appendix N Gene set enrichment analysis (GSEA) of pathways calculated 180
by MAGENTA

xix
Appendix Description Page
Appendix O Pathways showing nominal association in SNP GSEA 183
as well as gene expression GSEA
Appendix P List of genes in pathways associated with NPC 184
1
CHAPTER 1: INTRODUCTION
Nasopharyngeal carcinoma (NPC) is an epithelial cell carcinoma on the mucosal
lining of the nasopharynx. It is rare in most parts of the world (Feng, 2013). However,
in certain regions where NPC is prevalent, it is a major health issue that requires
immediate attention. In Malaysia, it is the fifth most common cancer among Malaysians
and third most common among men according to the latest Malaysian Cancer Registry
Report, 2007-2011 (Azizah et al., 2016). It is particular prevalent among the Chinese as
well as the indigenous tribe of Bidayuh people. NPC displays an enigmatic and
multifactorial etiology, making effective treatment challenging. It is consistently linked
to Epstein-Barr virus (EBV) infection, making it a viral-induced cancer. However,
almost 95% of the world population is infected and they are healthy carriers of the EBV
virus (Kutok & Wang, 2006). Not all EBV carriers develop NPC. Diet also strongly
influences the onset of NPC. Consumption of Chinese-style salted fish has been
strongly linked to NPC risk (Jeannel et al., 1999; Zheng et al., 1994). However, for
Chinese immigrants in non-endemic regions (e.g. North America), the risk of NPC
remains though at a much lower rate compared to their ancestors (Chang & Adami,
2006). This proves that evolving lifestyles do not completely eradicate the risk of NPC
and genetic factors could play an important role in NPC onset, especially for high-risk
populations like the southern Chinese and its descendants.
Several NPC GWAS have been reported, with the HLA-A gene continously
being identified. However, most GWAS studies have yet to identify causal SNPs or
annotate the functional implication of these polymorphisms. A NPC GWAS was
performed to fine-map the HLA-A region in high resolution with focus on variants that
either influence peptide loading or expression of the HLA-A. HLA-A variants with
potential enhancer and promoter activity could affect differential binding affinity for

2
nuclear factors, consequently influence eQTL expression trends. In view of the high
number of variants reported in the HLA-A or even the MHC region, it is imperative to
identify the key variants driving the associations in the HLA-A region, while the
remaining variants are mainly proxy association signals due to presence of linkage
disequilibrium (LD).
Genetic effects reported from single GWAS studies are generally small, causing
suspicion of false positives (Chapman et al., 2011; Ioannidis et al., 2006; Moonesinghe
et al., 2008). Therefore meta-analysis, the statistical analysis of pooling genetic effects
across different GWAS studies is performed to increase the power of variants
association and reduce false-positive findings. Meta-analysis is able to utilize summary
data without resorting to sharing individual genotype data, overcoming restrictions on
sharing individual-level data (Evangelou & Ioannidis, 2013). Therefore meta-analysis
has become a popular approach for the discovery of new genetic loci for common
diseases and phenotypes. This study was a collaborative effort between 1) Sun Yat-sen
University Cancer Center, Guangzhou, China; 2) Chang Gung University, Taiwan; 3)
University of Malaya, Kuala Lumpur, Malaysia; 4) Genome Institute of Singapore,
Singapore. The study was coordinated by the Infections and Immunoepidemiology
Branch, Division of Cancer Epidemiology and Genetics, National Cancer Institute,
Bethesda, Maryland.
The search for NPC susceptibility genes have been limited to only single
platform analysis, in particular GWAS or transcriptomics involving probe-based
microarrays. Cross platform analysis has not been reported for NPC. There are
limitations attached to single platform approaches. Firstly, GWAS and microarray
expression studies report single gene associations, the former under very stringent
multiple testing correction (Wang et al., 2010). Thus, causal loci with moderate effects
will be missed. Secondly, complex diseases like NPC arise due to the interplay of

3
several genes (Chou et al., 2008). Single gene analysis would neglect the dynamics of
gene sets or pathways leading to NPC development, thus ignoring potentially new
insights pertaining to NPC etiology. By employing an integrated pathway approach
combining GWAS SNP and gene expression data, dysregulated pathways with relevant
function to nasopharyngeal carcinoma (NPC) can be identified. This approach moves us
closer to identifying key pathways or genes affecting NPC.
This study aims to achieve the following: 1) A genome-wide sweep of 712,717
SNPs on the Illumina Human OmniExpress platform to identify NPC associated loci; 2)
Imputation with HapMap, 1000 Genomes datasets and previously reported GWAS data
(Ng et al., 2009a) to fine-map the HLA-A region; 3) High resolution molecular HLA-A
allele genotyping to identify HLA-A alleles as well as its corresponding SNP genotypes;
4) In silico prediction and amino acid variant analysis to identify functional
associations; 5) Identify new loci outside of the major histocompatibility complex
(MHC) region associated to NPC by pooling data across 4 NPC GWAS studies; 6)
Identify dysregulated pathways associated with NPC through GWAS and gene
expression data.

4
CHAPTER 2: LITERATURE REVIEW
2.1 NPC diagnosis and classification
Nasopharyngeal carcinoma (NPC) is an epithelial cell carcinoma on the mucosal
lining of the nasopharynx. The nasopharynx is the uppermost part of the pharynx,
behind the nasal cavity (Khoo & Pua, 2013). The epicenter of NPC begins at the Fossa
of Rosenmüller and can spread in any direction to adjacent regions such as the nasal
cavity, the oropharynx, the skull base, the parapahryngeal space or the retropharyngeal
space (Figure 2.1). Spreading of NPC to different regions would manifest different
symptoms. For example, when NPC spreads to the skull base, it leads to compression of
cranial nerves, resulting in cranial nerve palsies. When NPC spreads to the cervical
lymph nodes from the Fossa of Rosenmüller through the node of Rouvier, a neck lump
appears (Khoo & Pua, 2013).
Figure 2.1: Anatomical view of the nasopharynx and possible routes of local spread of
tumor to adjacent regions. Images adapted from Cancer Research UK.
(http://www.cancerresearchuk.org)

5
2.2 NPC symptoms and method of diagnosis
NPC typically portray atypical symptoms at early stages, making it difficult for
clinicians to detect. Among the more common symptoms of NPC include appearance of
neck lumps, nasal symptoms (blood stained nasal discharge, blood stained saliva, or
nasal blockage), aural symptoms (unilateral blocked ear, pressure in the ear, mild
hearing loss or tinnitus) and facial neurologic symptoms (unilateral facial numbness,
diplopia or unilateral headache).
The nasopharynx is located in an obscure position behind the nasal cavity,
making visual examination challenging. Examination of this area is carried out with the
aid of flexible fiber optic or rigid endoscope connected to a camera. NPC appears as a
mass in the nasopharynx. Biopsies are taken to confirm the diagnosis of NPC. In cases
where the NPC is a submucosal tumor, magnetic resonance imaging is used to locate the
tumor and aid the biopsy.
Serological methods are also useful for early detection of endemic NPC due to
its close association with EBV infection. Elevated levels of the EBV-IgA-VCA
antibody preceded the onset of NPC, with a window of about 3 years (Hao et al., 2003).
Therefore, measuring the IgA antibody titers would be useful for early detection. IgA
antibody titers to EBV viral capsid antigen (EBV-IgA-VCA) and EBV early antigen
(EBV-EA) in immunofluorescent assays may be used for the serologic screening of
NPC (Yi et al., 1980; Zeng et al., 1982). However, in recent years, immunofluorescent
assays have largely been replaced with enzyme-linked immunosorbent assays (ELISA)
employing purified recombinant EBV antigens (Nadala et al., 1996). These tests serve
as NPC tumor markers of remission and relapse (Chang et al., 2008; De-Vathaire et al.,
1988)

6
NPC classification is achieved through histopathological examination of the
biopsy. The current classification system follows the WHO classification of 2005 (Chan
et al., 2005) after many revisions from previous classification systems. The challenges
of classifying NPC lie in lack of acceptance by pathologists because tumor gradations
are not correlated with eventual treatment options. NPC is classified as keratinizing and
non-keratinizing (Table 2.1). Non-keratinizing NPC is the pre-dominant type in
endemic areas (Nicholls, 1997; Wei & Sham, 2005). A third type of NPC introduced by
the WHO classification of 2005 is basaloid squamous cell carcinoma. As most NPC is
detected at later stages where neck lumps appear, fine needle aspiration cytology of
enlarged lymph nodes is performed to detect nodal spread.
NPC staging is performed to evaluate extent of the cancer, determine prognosis
and recommend treatment. Staging is deduced from information obtained from
symptoms, physical examination, endoscopy, imaging of the tumor, lymph node spread
and metastases (Edge et al., 2010). Imaging techniques employed in NPC staging
include computerized tomography (CT), magnetic resonance imaging (MRI), chest X-
ray, ultrasound, bone scintigraphy and positron emission tomography (PET) scan (Khoo
& Pua, 2013). Combination of techniques employed for NPC staging is dependent on
cost, availability as well as the extent of NPC. As per recommendation by the National
Comprehensive Cancer Network (NCCN), CT with contrast or MRI with gadolinium is
performed for NPC imaging. For more advanced stages of NPC (Stage III-IV or distant
metastasis) PET or CT is preferred (National Comprehensive Cancer Network, 2011).
MRI is superior to PET/CT scan in imaging tumor spread in the areas adjacent to the
epicenter, namely parapharyngeal space, base of the skull, intracranial area, sphenoid
sinus and retropharyngeal lymph nodes (Liao et al., 2008). PET/CT scan is more
superior in capturing distant metastatis (Lin et al., 2008; Ng et al., 2009b) to extent of
replacing more conventional methods such as chest radiography, abdominal ultrasound

7
and bone scintigraphy (Liu et al., 2007). As such, using inferior imaging equipment
would result in understaging of the disease.
The various symptoms that manifests during NPC progression is a consequence
of the spread of the tumor. For example, nasal and aural symptoms suggest the tumor is
still confined to the primary site of the nasopharynx (T1), neck mass suggests tumor
spread to cervical lymph nodes (N1-3) while facial neurologic symptoms imply spread
to the skull base (T4).
NPC staging follows the “tumor node metastasis” (TNM) staging system, jointly
developed by The American Joint Committee on Cancer (AJCC) and the International
Union Against Cancer (UICC) (Edge et al., 2010). The TNM staging describes the
anatomy of the tumor, in which, T refers to the local extent of the primary tumor, N
refers to the extent of regional nodes involvement and M refers to the distant spread
(metastasis) of the tumor. The TNM scores are then combined to determine the overall
stage (Table 2.2).
Table 2.1: WHO histopathological classification of NPC (Edge et al., 2010).
______________________________________________________________________
WHO Classification (2005) Former Terminology (WHO 1998)
Keratinizing carcinoma WHO Type 1
Nonkeratinizing carcinoma
- differentiated WHO Type 2
- undifferentiated WHO Type 3
Basaloid squamous cell carcinoma (no former terminology)
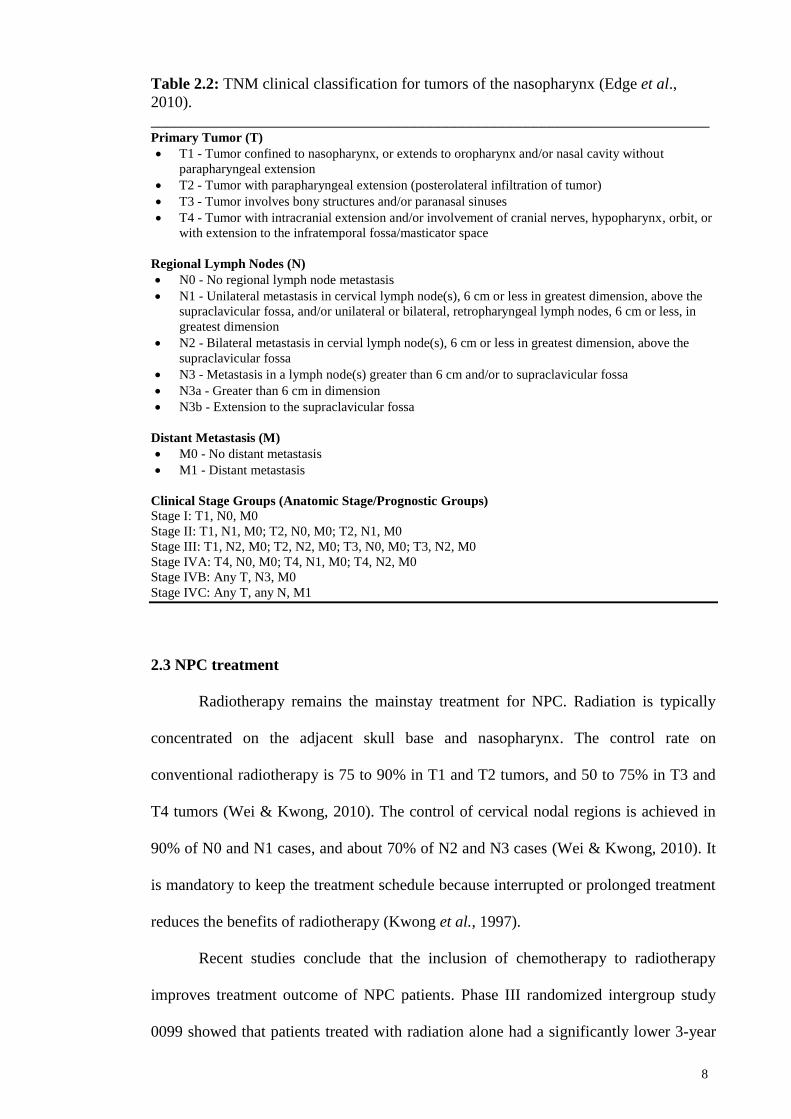
8
Table 2.2: TNM clinical classification for tumors of the nasopharynx (Edge et al.,
2010).
______________________________________________________________________ Primary Tumor (T)
T1 - Tumor confined to nasopharynx, or extends to oropharynx and/or nasal cavity without
parapharyngeal extension
T2 - Tumor with parapharyngeal extension (posterolateral infiltration of tumor)
T3 - Tumor involves bony structures and/or paranasal sinuses
T4 - Tumor with intracranial extension and/or involvement of cranial nerves, hypopharynx, orbit, or
with extension to the infratemporal fossa/masticator space
Regional Lymph Nodes (N)
N0 - No regional lymph node metastasis
N1 - Unilateral metastasis in cervical lymph node(s), 6 cm or less in greatest dimension, above the
supraclavicular fossa, and/or unilateral or bilateral, retropharyngeal lymph nodes, 6 cm or less, in
greatest dimension
N2 - Bilateral metastasis in cervial lymph node(s), 6 cm or less in greatest dimension, above the
supraclavicular fossa
N3 - Metastasis in a lymph node(s) greater than 6 cm and/or to supraclavicular fossa
N3a - Greater than 6 cm in dimension
N3b - Extension to the supraclavicular fossa
Distant Metastasis (M)
M0 - No distant metastasis
M1 - Distant metastasis
Clinical Stage Groups (Anatomic Stage/Prognostic Groups)
Stage I: T1, N0, M0
Stage II: T1, N1, M0; T2, N0, M0; T2, N1, M0
Stage III: T1, N2, M0; T2, N2, M0; T3, N0, M0; T3, N2, M0
Stage IVA: T4, N0, M0; T4, N1, M0; T4, N2, M0
Stage IVB: Any T, N3, M0
Stage IVC: Any T, any N, M1
2.3 NPC treatment
Radiotherapy remains the mainstay treatment for NPC. Radiation is typically
concentrated on the adjacent skull base and nasopharynx. The control rate on
conventional radiotherapy is 75 to 90% in T1 and T2 tumors, and 50 to 75% in T3 and
T4 tumors (Wei & Kwong, 2010). The control of cervical nodal regions is achieved in
90% of N0 and N1 cases, and about 70% of N2 and N3 cases (Wei & Kwong, 2010). It
is mandatory to keep the treatment schedule because interrupted or prolonged treatment
reduces the benefits of radiotherapy (Kwong et al., 1997).
Recent studies conclude that the inclusion of chemotherapy to radiotherapy
improves treatment outcome of NPC patients. Phase III randomized intergroup study
0099 showed that patients treated with radiation alone had a significantly lower 3-year
9
survival rate than those receiving radiation with cisplatin and 5-fluorouracil
chemotherapy (Al-Sarraf et al., 1998). Several meta-analysis reported a definite
improvement of the 5-year survival rate due to the addition of chemotherapy (56% with
radiotherapy alone versus 62% with chemoradiotherapy) (Baujat et al., 2006).
Studies and clinical trials are ongoing to find the optimal treatment strategy for
NPC. These include molecular targeted therapies in NPC, including the epidermal
growth factor receptor (EGFR), vascular endothelial growth factor (VEGF), epigenetic
therapy, Epstein-Barr virus (EBV) directed immunotherapy and gene therapy (Hui &
Chan, 2013).
2.4 NPC epidemiology: Geographic origin
NPC is a rare cancer in most parts of the world with the exception of certain
endemic regions (Figure 2.2). In 2012, 87,000 cases of NPC were reported. However,
this only made up 0.6% of all cancers reported that year (Ferlay et al., 2015). A
whopping 71% of the 87,000 NPC cases came from highly prevalent regions in
southern China, Hong Kong, Taiwan, Southeast Asia, Maghrebian countries in northern
Africa (Algeria, Morocco and Tunisia) and the arctic and sub-arctic region of North
America and Greenland (Ferlay et al., 2015).

10
Figure 2.2: Endemic regions of nasopharyngeal carcinoma occurence. Incidence rates
at these regions record ASR of > 10 per 105 person-years. In non-endemic regions, NPC
incidence is 0.5 per 105 person-years.
The populations most affected by NPC are the southern Chinese, Amazigh- and
Arabic-speaking North Africans and the Inuits (Feng, 2013). Zhongshan city of the
Guangdong province in southern China reported one of the highest incidence rates of
NPC, with age-standardized rates (ASR) of 26.9 per 105 person-years for males and
10.1 for females (Curado et al., 2013). Similar ASRs were observed in neighboring
cities like Hong Kong and Guangzhou (Curado et al., 2013). The majority of the
population in these cities is Cantonese. Taiwan recorded a moderate NPC incidence rate
of ASR 6.96 (Chiang et al., 2016). The inuits in Alaska, Canada and Greenland also
show high rates of NPC with ASR was 12.1 for males and 7.3 for females (Kelly et al.,
2008). Magrebian countries of Tunisia and Algeria show moderate rates of NPC with
ASRs of 5.4 and 4.6 per 105 person-years for males and ASRs of 1.7 and 1.9 for
females (Curado et al., 2013). The incidence rate in other non-endemic countries is 0.5
per 105 person-years with a general trend of higher incidence in males compared to
females (incidence ratio 2-3:1) (Curado et al., 2013).

11
The population of Southeast Asia is an admixed population of major southern
Chinese dialect groups, namely the Cantonese, Hakka and Teochew people from
Guangdong province and the Hokkien from Fujian province (Feng, 2013). The
Cantonese has an NPC risk twice those of other dialect groups in China (Yu & Yuan,
2002). Other populations showing moderate to high NPC incidence include the Thais,
Vietnamese and Filipinos with ASRs ranging from 2.5 to 15 for males (Yu & Yuan,
2002).
In Malaysia, NPC is the fifth most common cancer among Malaysians and third
most common among men (Azizah et al., 2016). A general trend is observed where
NPC incidence is higher in males (ASR 6.4) than in females (ASR 2.2). The disease is
particularly prevalent in the Chinese, with low incidences in the Malays and Indians.
Malaysian Chinese record the highest incidence of NPC with ASRs of 11.0 in Chinese
males and 3.5 in Chinese females (Azizah et al., 2016). The Malays record NPC
incidence ASRs of 3.3 in males and 1.3 in females while the Indians show low
incidence rates of ASR 1.1 in males and 0.6 in females (Azizah et al., 2016). A high
risk of NPC has also been observed in Sarawak, particularly the indigenous tribe of
Bidayuh people, with ASRs of 31.5 for males and 11.8 for females (Devi et al., 2004).
The incidence rate for Bidayuhs is much higher than other ethnic groups living in
Sarawak. Overall, the incidence rate of NPC in Malaysian Chinese, Malays and Indians
is similar to that of neighboring Singapore (Azizah et al., 2016). NPC incidences in
Malaysian males are elevated from age 25 years and peaks at age 65 years (Azizah et
al., 2016). This is somewhat late compared to other high-risk Asian populations with
peak incidence reported at the age of 45-55 years old (Bray et al., 2008). Most
nasopharyngeal carcinoma cases detected in Malaysia were of Stage III and IV (Azizah
et al., 2016), highlighting once again the difficulties in diagnosis due to its non-distinct
symptoms.

12
Migration does influence the NPC incidence rate for people belonging to high-
risk areas. Immigrants from high-risk regions show higher incidence of NPC than the
local population after moving to low-risk countries. This has been observed for Chinese
immigrants in the USA, UK, Canada and Australia (Chang & Adami, 2006), Inuit in
Denmark (Boysen et al., 2008) and North Africans in several European countries
(Jeannel et al., 1999). However, the incidence rate tends to decrease with successive
generations. The disparate NPC incidence rates among pioneering immigrants and
successive generations points to the influence of environmental factors in NPC
development. However, in multi-racial countries such as Malaysia and Singapore
populated by successive generations of immigrants, NPC incidence rates remain high
with little difference in incidence rates among the different ethnic groups, pointing to
the probable influence of genetic factors as well as the continued practise of our
ancestors’ lifestyle. NPC incidence from different populations is summarized in Figure
2.3.
2.5 Environmental factors
2.5.1 Diet
Consumption of preserved food has been constantly linked to NPC. A common
factor that links NPC to its endemic regions is the low socioeconomic status, leading to
high consumption of preserved food as a cheap form of sustenance (Jeannel et al.,
1999). Chinese-style salted fish is constantly linked to NPC among the Cantonese as
well as Thais in South and South East Asia (Jeannel et al., 1999). Chinese-style salted
fish is prepared by curing the fish in salt and then sun-dried. Other methods of food
preservation are not linked to NPC. An example would be in among the Eskimos in
Greenland where consumption of wind-dried and fermented fish is not associated with
NPC (Jeannel et al., 1999). In Japan, salted fish in consumed frequently and yet, NPC is

13
Figure 2.3: Nasopharyngeal carcinoma incidence worldwide. A comparison of NPC
incidence between Malaysian Chinese and Malay against other populations. Incidence
reported as age standardized rates (ASR). Image taken from Azizah et al. (2016). NPC
incidence data taken from Azizah et al. (2016) and Curado et al. (2007).
rare (Jeannel et al., 1999). In Thailand, 3 types of salted fish are consumed but only
Chinese-style salted fish is linked to NPC (Sriamporn et al., 1992). Therefore, the
consumption of salted-fish leading to risk of NPC is reliant upon the type of fish (salt
water fish), method of preparation (salt-cured then sun-dried) and method of cooking
(steamed salted fish) (Jeannel et al., 1999).

14
Other types of preserved food posing NPC risks are fermented fish sauce, salted
shrimp paste, moldy bean curd, preserved plums, salted duck eggs, salted mustard
green, dried fish, and fermented soy bean paste (Jeannel et al., 1999). The age of
consumption of preserved food is also critical for NPC risks. Studies have shown that
consumption of preserved food during weaning or childhood increases NPC risks as
opposed to consumption only in adulthood (Jeannel et al., 1999). Preserved food
elevates the risk of NPC because it contains volatile N-nitrosamines, namely N-
nitrosodimethylamine (NDMA), N-nitrosopyrrolidine (NPYR) and N-nitrosopiperidine
(NPIP), compounds that are classified as probably or possibly carcinogenic to humans
by the International Agency for Research on Cancer, better known as IARC
(International Agency for Research on Cancer, 1978).
The link between smoking and risks of NPC is less established. Smoking is
linked to NPC in low-risk areas like North America (Chow et al., 1993; Mabuchi et al.,
1985; Nam et al., 1992; Vaughan et al., 1996; Zhu et al., 1997). It is linked to a
particular histological type, namely differentiated NPC (Ou et al., 2007). However, in
endemic regions, smoking is not linked or only confers moderate risk to NPC (Chen et
al., 1990; Cheng et al., 1999; Friborg et al., 2007; Yuan et al., 2000). Alcohol
consumption also shows mixed results when correlated with NPC onset. Most studies
reveal no association between alcohol consumption and NPC with the exception of
Malaysia (Armstrong et al., 1983) and the United States (Nam et al., 1992; Vaughan et
al., 1996). The discrepant observation could be due to the small sample sizes of these
studies, leading to conflicting results. Therefore, the relationship between smoking and
alcohol towards NPC risk warrants further investigation.

15
2.5.2 Occupational exposures
Occupational exposures can also elevate the risk of NPC. In a study evaluating
occupational risk factors and its link to NPC in Hong Kong, exposure to cotton dust
(OR=1.93; 95% CI=1.13-3.28), chemical fumes (OR=13.11; 95% CI=1.53-112.17), and
welding fumes (OR=9.18; 95% CI=1.05-80.35) increased the risk of NPC (Xie et al.,
2017). Interestingly, formaldehyde was not linked to elevated NPC risk despite reports
linking its exposure to NPC risks in non-endemic regions (IARC Working Group on the
Evaluation of Carcinogenic Risks to Humans, 2006; Xie et al., 2017). Inhalation of
domestic fumes due to poor ventilation in kitchen or cooking with wood fire has also
been linked with NPC (Chen & Huang, 1997; Yu et al., 1986; Zheng et al., 1994).
2.5.3 Epstein-Barr virus (EBV)
Epstein-Barr virus is a double-stranded DNA human herpes virus. Epstein-Barr
virus has been repeatedly linked with NPC through clinical, epidemiological and
experimental data (Gourzones et al., 2013). EBV infection is constantly linked with
non-keratinizing NPC, the more prevalent form of NPC in endemic regions (Andersson-
Anvret et al., 1977; Nicholls et al., 1997) and this association transcends geographic
origins. The EBV genome is constantly detected in epithelial cells but not lymphoid
cells. It is interesting to note that despite repeated studies and clinical data reaffirming
this association, EBV infection and NPC onset are not mutually exclusive occurrences.
More than 95% adults in all ethnic groups through the world are healthy carriers of
EBV (Kutok & Wang, 2006) and not all go on to develop NPC. Thus, interaction of
EBV infection and host genetic factors play an important role in NPC onset.
Once a subject has been primo-infected, EBV virus enters latency for long-term
persistence. EBV in latent phase undergoes restricted expression of limited viral genes
and production of viral particles is ceased. Circular viral genomes co-exist with the host

16
genome. In its latent state, EBV expresses several viral proteins or noncoding RNAs,
most of them with the potential to contribute to apoptosis resistance or proliferation of
the host cells. Latent proteins are either nuclear (called Epstein-Barr nuclear antigens:
EBNA1, EBNA2, EBNA 3a,b,c, EBNA-LP) or associated to the cell membrane
network (called latent membrane proteins : LMP1, LMP2 a and b) (Kutok & Wang,
2006). The oncogenic function of key EBV latent proteins is discussed below.
LMP1 is able to modulate the expression of key tumor suppressor genes by
repressing p53-mediated apoptosis. This is achieved by inducing TNFAIP3/A20 that
blocks p53-mediated apoptosis (Fries et al., 1996), activating MAPK/SAPK complex to
modulate p53 expression through phosphorylation (Li et al., 2007) or by working
together with Bcl-2 to override the growth suppression induced by wild-type p53 (Sheu
et al., 2004). LMP1 is also capable of modulating the G1-S cell-cycle checkpoint. In
epithelial cells, LMP1 down regulate p16INK4a and p21, and induces Cdk2 and cyclin
D1, resulting in progression from G1 phase to S phase (Huang & Huang, 2003; Lo et
al., 2004).
There is little evidence to illustrate the oncogenic role of LMP2 in epithelial
cells. The most prominent being its ability to activate the PI3-K/Akt pathway, which, in
turn, affects cell survival, apoptosis, proliferation and genomic instability via its
downstream target proteins to cause cancer (Allen et al., 2005; Fukuda & Longnecker,
2007; Lu et al., 2006; Morrison & Raab-Traub, 2005; Scholle et al., 2000).
EBNA1 is a EBV nuclear protein, consistently expressed in NPC cells and it
was the first viral protein to be detected in this tumor (Huang et al., 1978). It is required
in proliferating latently infected cells as a critical factor for the replication of the viral
episomes and their balanced segregation in dividing cells (Sivachandran et al., 2011).
BARF1 is an EBV oncoprotein that has oncogenic and anti-apototic effects in various
types of epithelial cells (Seto et al., 2008; Wang et al., 2006; Wei et al., 1997). It is

17
speculated to be a decoy receptor for the m-CSF (Strockbine et al., 1998). M-CSF
affects macrophages and monocytes in several ways, including stimulating increased
phagocytic and chemotactic activity, and increased tumor cell cytotoxicity (Cohen &
Lekstrom, 1999).
Epstein-Barr encoded RNA or EBERs are small nuclear untranslated RNAs and
they are the most abundant viral RNAs in NPC cells. EBERs have been linked to
malignant phenotypes leading to oncogenesis. In vitro studies in B-lymphocyte (BL)-
derived Akata cells and immune-deficient mice have shown that EBER genes
expression inhibit apoptosis (Komano et al., 1999; Ruf et al., 2000; Shimizu et al.,
1994; Yamamoto et al., 2000), induce IGF1, which acts as an autocrine growth factor
for NPC cells (Iwakiri et al., 2003; Iwakiri et al., 2005). EBERs are also known to
mediate pathogenesis by modulating innate immune signals. Through constitutive
activation of RIG-I by EBERs, NFκB and IRF-3 are activated, subsequently induction
of type-I IFN (Samanta et al., 2006). The induction of IFN induction appears
disadvantageous for EBV, though it enables the virus to maintain a latent infection state
because of resistance to IFN, which is provided by EBER-mediated PKR inhibition
(Nanbo et al., 2002).
Based on data and information currently available, a hypothesis is put forth
suggesting EBV as a tumor promoting agent rather than an initiator. Nasopharynx
epithelial cells with pre-existing molecular aberrations come in contact with EBV,
establishing a latent infection. Over time, the EBV infected cells progress to severe
dysplasia or pre-invasive carcinomas or even full malignancy.

18
2.6 Genetic factors
2.6.1 Familial studies of NPC
Familial studies or linkage analysis entails genotyping relatives and family
members with a set or panel of genetic markers, calculating the linkage statistics and
identifying the inherited genes predisposing to NPC among the affected relatives
(Lander & Kruglyak, 1995). Two important designs of familial studies is affected sib-
pair (ASP) and extended pedigree analysis (Freimer & Sabatti, 2004). To date, four
linkage studies of NPC have been reported where the linkage of 3p21 (Xiong et al.,
2004), 4p15-q12 (Feng et al., 2002), 5p13 (Hu et al., 2008), and 6p21 (Lu et al., 1990)
were identified.
The earliest linkage analysis was reported by Lu et al. (1990) using an affected
sib-pair design, focusing on the HLA region due to previous reports linking HLA
antigens to NPC risk in the Chinese (Chan et al., 1983; Simons et al., 1974; Simons et
al., 1975). The study recruited 30 sibships from Guangxi and Hong Kong in China,
Singapore and Malaysia and performed HLA typing using allelic typing antisera
corresponding to HLA alleles (Lu et al., 1990). Results indicate a recessive
susceptibility gene(s) with logarithm of odds for linkage (LOD) score +2.39 and P-
values 0.004. The HLA region confers an increased risk of 20.9 (95% CI = 5.1 to
infinite) for NPC, which is around 10-fold greater than previously reported associations
with HLA Bw46 or B17, suggesting the genetic lesion is HLA-linked but might be
distinct from HLA Bw46 or B17 (Lu et al., 1990).
The first extensive linkage study of NPC was done by Feng et al. (2002). The
study utilized an extended pedigree design; with genome-wide microsatellite markers
placed 10 cM apart covering 22 autosomes. This study examined members among 20
high-risk Cantonese-speaking families in the Guangdong region. The study identified
strong linkage to the D4S405 marker on chromosome 4p15–q12 with a logarithm of

19
odds (LOD) score of 3.06 (Feng et al., 2002). Fine mapping using denser microsatellite
markers and SNPs pinpointed a smaller region of 8.29 cM in genetic length at 4p11–
p14 (Feng et al., 2002).
Another linkage study using the extended pedigree design was reported by
Xiong et al. (2004). The study recruited 18 high-risk NPC families of southern Chinese
descent from the Hunan province and genotyping was performed using a less extensive
panel covering only microsatellite markers on the short arms of chromosomes 3, 9, and
4p15.1–q12. Locus 3p21.31–21.2 showed strong linkage to NPC through adjacent
markers D3S3624 (LOD=4.177) and D3S1568 (LOD=3.922) (Xiong et al., 2004).
Linkage of locus 4p15–q12 as reported by Feng et al. (2002) in the Guangdong Chinese
families was not detected.
The most recent linkage study was carried out by Hu et al. (2008) utilizing a
pedigree design with a denser microsatellite marker distribution of 5cM apart. The study
recruited 15 families from the Guangdong province. Initial analysis identified four loci
on chromosomes 2q, 5p, 12p, and 18p showing LOD scores for linkage above 1.5. Fine-
mapping with additional markers only identified suggestive linkage at 5p13.1 with its
corresponding marker D5S2021 showing a LOD score of 2.1 (Hu et al., 2008).
2.6.2 Candidate gene approach
Most candidate gene approaches employ a case-control study design to detect
association to NPC. A case-control design is more suited to detect genes or loci
prediposed to sporadic NPC cases rather than familial NPC. In addition, recruitment of
samples is easier when extended pedigrees are unavailable. Association is determined if
a variant, be it an allele, genotype or haplotype, shows a statistically significant bias or
difference between the affected (in this case NPC patients) and unaffected (healthy
controls). To rule out false associations, affected and unaffected samples are matched as
20
much as possible in terms of ethnicity, gender, age and other related covariates to
minimize confounders. Candidate approach studies have identified many susceptible
genes to NPC, many of which were driven by prior knowledge related to NPC
carcinogenesis. Many genes associated with NPC are related to immune-related genes
(HLA class I and II), carcinogenic metabolism (CYP2E1, CYP2A6, GSTM1, NAT2),
DNA repair (XRCC1 and hOGG1, ERCC1, RAD51L1), cell cycle regulation (TP53,
CCND1), immune response (TLRs, PLUNC, interleukins, FAS131), or EBV receptors
(PIGR, TCR).
2.6.3 Immune-related genes
It is sensible to target immune-related genes as possible NPC susceptibility
genes considering its EBV etiology. Studies were focused on the HLA antigen
presenting molecules given its ability to elicit an immune response against viral
infection. The first study reported NPC susceptible associations of HLA-A2 and -A11 in
Singapore Chinese (Simons et al., 1974). Subsequent studies on the HLA-A2 have been
consistent in detecting increased NPC risk in Chinese populations from Taiwan,
southern China, and Singapore (Hu et al., 2005; Lu et al., 2003; Wu et al., 1989) though
the same association was not detected in non-Chinese populations (Betuel et al., 1975;
Burt et al., 1996; Herait et al., 1983; Mokni-Baizig et al., 2001; Moore et al., 1983;
Zervas et al., 1983). The association of HLA-A11 confers protective effect towards NPC
and this has been observed in Taiwan (Lu et al., 2003; Wu et al., 1989), Singapore
(Chan et al., 1983; Ooi et al., 1997) and southern China (Hu et al., 2005). Another class
I HLA antigen studied was the HLA-B. HLA-B13 conferred a protective effect in the
Chinese of Taiwan (Hildesheim et al., 2002), Singapore (Chan et al., 1983) and
southern China (Hu et al., 2005) but not in Caucasian (Moore et al., 1983) and
Maghrebian populations (Herait et al., 1983). HLA-B46 conferred a risk effect towards
21
NPC in the Chinese of Singapore (Chan et al., 1983) and Taiwan (Hu et al., 2005).
These early studies utilized the serological typing approach for the HLA allele typing.
Subsequent HLA typing studies evolved with the emergence of polymerase
chain reaction and sequencing technologies, giving rise to higher resolution HLA
typing. HLA-A*0201 (Ren et al., 1995), HLA-A*0203 (Lu et al., 2003) and HLA*0207
(Hildesheim et al., 2002) were linked to higher risk of NPC in the Chinese. HLA-
A*1101 confers a protective effect against NPC in Taiwanese Chinese (Hildesheim et
al., 2002). HLA-B*4601 showed a protective effect to NPC in Thais (Pimtanothai et al.,
2002) and Taiwanese (Hildesheim et al., 2002). HLA-DRB1*03 and -DRB1*0301 were
associated with NPC risk in Tunisian (Mokni-Baizig et al., 2001) and Taiwan Chinese
(Hildesheim et al., 2002).
Apart from the antigen presenting molecules, researchers also looked at
immune-related cytokines and surface proteins on immune cells for NPC susceptibility
genes. In the southern Chinese, certain interleukin variants conferred risk to NPC, such
as IL1A (rs3783553, deletion allele) (Yang et al., 2011), IL1B (−511T) (Zhu et al.,
2008), IL2 (−330G) (Wei et al., 2010), IL8 (−251A) (Wei et al., 2007b), IL10 (−1082G)
(Wei et al., 2007a), IL12 (rs3212227, C allele) (Wei et al., 2009), IL16 (rs11556218, G
allele) (Gao et al., 2009), and IL18 (−137C) (Nong et al., 2009). In addition, toll-like
receptors, a critical part of the innate immune surveillance also harbored variants that
confer risk to NPC. For example TLR3 (829A>C) (He et al., 2007), TLR4 (11350G>C)
(Song et al., 2006), TLR10 (haplotype GCGTGGC for rs10856837, rs11466651,
rs11466652, rs11466653, rs11096956, rs11096955 and rs11466655) (Zhou et al.,
2006), DC-SIGN (−139A>G and −939G>A) (Xu et al., 2010), and CTLA-4 (+49A>G)
(Xiao et al., 2010).

22
Tumorigenesis encompass many genes and cascades of processes, culminating
in uncontrolled cell division and growth, forming a malignant mass. Some genes related
to the process were examined for the association with NPC. A case-control study in
Nanning city, southern China evaluated associations of SNPs along Phosphatase and
tensin homolog (PTEN) (rs11202592), v-akt murine thymoma viral oncogene homolog
1 (AKT1) (rs3803300, rs1130214, rs3730358, rs1130233 and rs2494732), mouse double
minute 2 (MDM2) and p53 (rs1042522) (Zhang et al., 2014). None of the single SNPs
were associated with NPC risk. However, haplotype analyses indicated that a two-SNP
core haplotype (rs1130233-A-rs2494732-A) in AKT1 was associated with a
significantly increased susceptibility to NPC risk (adjusted OR = 3.87, 95% CI = 1.96-
7.65; P<0.001). Combined risk genotypes from 3-4 SNPs gave significantly increased
susceptibility to NPC risk (adjusted OR = 1.67, 95% CI = 1.12-2.50; P = 0.012)
In Malaysia, Yew et al. (2012) conducted a case-control study on 447 NPC
cases and 487 controls of Chinese descent. Results found association to NPC risk at
SNP rs2752903 of SPLUNC1 (P=0.00032, odds ratio = 1.62, 95% confidence interval =
1.25-2.11) (Yew et al., 2012). Functional analysis identified rs1407019 located in intron
3 (r2=0.994 with rs2752903) caused allelic difference in the binding of specificity
protein 1 (Sp1) transcription factor and affected luciferase activity (Yew et al., 2012).
SPLUNC1 is believed to play a role in innate immune defense in the airway because of
its ability to regulate ENaC, influencing airway pathology (Garcia-Caballero et al.,
2009).

23
2.6.4 Metabolic genes
NPC is heavily influenced by diet, particularly the consumption of salted fish
containing high amounts of carcinogenic nitrosamines. Thus, research was focused on
identifying variants in metabolic enzymes that function in metabolizing carcinogens.
The CYP superfamily has been constantly studied for its relation to NPC susceptibility.
The earliest report was carried out by Hildesheim et al. (1995) comparing CYP2E1
RFLP digestion sites between 50 NPC cases and matched control samples in Taiwan.
Homozygous carriers of the CYP2E1 DraI digestion showed a 5-fold risk of NPC (95%
CI= 0.95-16) while homozygous carriers of CYP2E1 RsaI digestion conferred a 7.7-fold
risk of NPC (95% CI=0.87-68) (Hildesheim et al., 1995). An extended study using 364
NPC cases and 364 controls in a Taiwanese population linked CYP2E1 RsaI digestion
to elevated NPC risk (relative risk [RR] = 2.6; 95% CI = 1.2-5.7) (Hildesheim et al.,
1997). Similar results were reported by a study investigating CYP2E1 polymorphism in
Thailand where CYP2E1 RsaI polymorphism elevating NPC risk in the Thais (RR =
1.51; 95% CI = 0.08-90.06) and Thai Chinese (RR = 1.99; 95% CI = 0.39-10.87). When
combined, the ethnicity-adjusted odds ratio is 2.39 with 95% CI, 0.72-7.89
(Kongruttanachok et al., 2001). A separate study from Thailand also reported elevated
NPC risk for carriers of CYP2A6 mutants (*1B and *4C) when compared to wild type
*1A/*1A (OR=2.37, 95% CI=1.27-4.46) (Tiwawech et al., 2006).
More recent CYP typing utilizes high-resolution genotyping. A study in
Guangdong, southern China employed both a family-based and case-control design to
investigate CYP2E1 association between CYP2E1 and NPC susceptibility (Jia et al.,
2009). In the case-control analysis, 755 NPC cases and 755 controls were compared and
SNP rs9418990, rs3813865, rs915906, rs2249695, rs8192780, rs1536826, rs3827688
(OR=1.88-2.99; P<0.015) and haplotypes h2 with OR = 1.65 (P = 0.026), h5
(CCCGTTAA) with OR = 2.58 (P = 0.007) were found to increase NPC risk (Jia et al.,

24
2009). Recently, a meta-analysis combining previous case-control CYP2E1 NPC studies
(Ben Chaaben et al., 2015; Guo et al., 2010; Hildesheim et al., 1995; Hildesheim et al.,
1997; Kongruttanachok et al., 2001; Lourembam et al., 2015) found association of
RsaI/PstI polymorphism with NPC, however only under recessive and homozygote
genetic models (OR = 2.72, 95% CI 1.73–4.25; OR = 2.64, 95% CI=1.68–4.16,
respectively) (Yao et al., 2017).
2.6.5 DNA repair genes
Due to the notion that both EBV and environmental carcinogens may promote
DNA damage (Frenkel, 1992; Gruhne et al., 2009), subsequently contributing to NPC
carcinogenesis, association of the genetic variants of genes related to DNA repair and
damage was widely studied. Cho et al. (2003) conducted a case-control study to
investigate the genotypes of 334 NPC patients and 283 healthy controls in a Taiwanese
population and found increased NPC risk for hOGG1 codon 326 genotypes of Ser/Cys
and Cys/Cys compared with the Ser/Ser genotype (OR=1.6; 95% CI=1.0-2.6). For
XRCC1 codon 280 genotypes of Arg/His and His/His compared with the Arg/Arg
genotype, the OR was 0.64 (95% CI=0.43-0.96) (Cho et al., 2003). When high-risk
genotypes for both hOGG1 and XRCC1 were combined, the OR was 3.0 (95% CI=1.0-
8.8) (Cho et al., 2003). Another study by Cao et al. (2006) found reduced risk of
developing NPC in individuals with the Trp194Trp genotype (OR=0.48; 95% CI=0.27-
0.86). Further analysis stratified by gender and smoking status revealed a significantly
reduced risk of NPC among males (OR = 0.32; 95% CI, 0.14-0.70) and smokers (OR =
0.34; 95% CI=0.14-0.82) carrying the XRCC1 194Trp/Trp genotype (Cao et al., 2006).
XRCC1 and hOGG1 associations were not replicated in the Maghrebian population of
north Africa (Laantri et al., 2011). The XRCC1 Codon399 Gln/Gln allele may also be
associated with better tumor regression (Zhai et al., 2016). A large scale case-control

25
study of XRCC3 in the southern Chinese found association of rs861539 and NPC risk
under the recessive model (TT vs. CT + CC) (OR = 2.72; 95 % CI=1.10-6.72; P = 0.03)
(Cui et al., 2016b).
Yang et al. (2008) performed a case-control study in Sichuan province, southern
China. The results identified ERCC1 SNP 8092 C>A, with 8092 C allele showing
1.411-fold (OR = 1.411, 95% CI, 1.076–1.850, P = 0.014) increased risk of developing
NPC (Yang et al., 2009). However, a separate study arrived at a contradictory
conclusion. Patients with the ERCC1 SNP 8092 C/A or A/A genotype had an increased
risk of disease progression on cisplatin-based chemotherapy (7.9 vs. 9.3 months; HR
1.61; 95 % CI 1.08-2.61; P = 0.047) (Chen et al., 2013).
Lye et al. (2015) reported association of xeroderma pigmentosum group D
(XPD) K751Q polymorphism to NPC risk. Subjects with homozygous Lys/Lys
(wildtype) genotype have 1.58 times higher odds of developing NPC compared to
subjects with recessive combination of heterozygous Lys/Gln and homozygous Gln/Gln
genotypes (OR = 1.58, 95% CI = 1.05-2.38 p = 0.028) (Lye et al., 2015).
2.7 Association studies in the age of genomics
The widespread adoption of genomics and bioinformatics started after the
completion of the first human genome draft in 2001 (Lander et al., 2001). Since then,
the reference genome has gone through several revisions, and at the time of writing, it is
currently on build GRCh38.p7. With the emergence of detailed genetic and physical
maps, scientists are able to pinpoint location of plausible disease genes.

26
2.7.1 The HapMap and 1000 genomes project
The completion of the human genome project spurred the establishment of the
HapMap (International HapMap Consortium, 2003, 2005) and 1000 genomes (1000
Genomes Project Consortium, 2015; Sudmant et al., 2015) databases to catalog
distribution of genomic variants in major populations in the world. The International
HapMap project was established with the aim of mapping haplotypes and SNPs due to
the presence of linkage disequilibrium (LD)- the co-inheritance of SNP alleles in
haplotypes. This strong correlation between SNPs enables the genotyping of tag SNPs,
representative SNPs that are able to provide enough information to predict much of the
information about the remainder of the common SNPs in that region (Carlson et al.,
2003; Daly et al., 2001; Johnson et al., 2001). The pilot study recruited 270 DNA
samples: 90 samples from a US Utah population with Northern and Western European
ancestry (samples collected in 1980 by the Centre d’Etude du Polymorphisme Humain
(CEPH) (49) and used for other human genetic maps, 30 trios of two parents and an
adult child), and new samples collected from 90 Yoruba people in Ibadan, Nigeria (30
trios), 45 unrelated Japanese in Tokyo, Japan, and 45 unrelated Han Chinese in Beijing,
China (International HapMap Consortium, 2003). Genotyping was performed across
different centers in Japan, China, Europe and the United States using various platforms,
namely Thirdwave Invader Asssay, Illumina Beadarrays, Sequenom MassExtend,
ParAllele MIP and PerkinElmer AcycloPrime-FP. This pilot effort identified 2.8 million
SNPs (International HapMap Consortium, 2003). However, the HapMap project is
currently superseded by the 1000 genomes project (1000 Genomes Project Consortium,
2015; Sudmant et al., 2015), which remains the current reference database for SNPs,
CNVs and structural variants data.

27
The 1000 genomes project set out to comprehensively catalog all forms of
genomic variants using low-coverage whole-genome sequencing, deep exome
sequencing, and dense microarray genotyping (1000 Genomes Project Consortium,
2015; Sudmant et al., 2015). The project surveys the genomes of 2,504 individuals from
26 populations. The 1000 genomes project improved upon the HapMap initiative by
profiling a larger number of SNPs (80 million) in addition to structural variants such as
deletion, insertion, CNV (1000 Genomes Project Consortium, 2015; Sudmant et al.,
2015). The larger number of samples also enable discovery of rare variants with
frequency <0.5%. With the availability of the 1000 genomes haplotypes, a detailed and
more comprehensive investigation of disease genes is made possible either through
physical genotyping or in silico imputation methods (Browning & Browning, 2007;
Browning & Browning, 2013, 2016; Howie et al., 2009; Howie et al., 2011; Howie et
al., 2012; Marchini et al., 2007).
2.7.2 Imputation
Imputation is an in silico method to predict or impute genotypes that are not
directly assayed in samples (Figure 2.4). This method takes into consideration the
reference dataset in use, LD structure and the recombination rate (Marchini & Howie,
2010; Marchini et al., 2007). The current recommended reference phased haplotypes are
from the 1000 genomes project phase 3 data (1000 Genomes Project Consortium, 2015;
Sudmant et al., 2015), with all phased haplotypes used for imputation rather than
samples of the population in study (Delaneau et al., 2013a; Howie et al., 2011).
Imputation is done using different algorithms, though more common methods in use
currently are IMPUTE2 (Howie et al., 2009; Howie et al., 2011; Howie et al., 2012;
Marchini et al., 2007) and BEAGLE v4.1 (Browning & Browning, 2007; Browning &
Browning, 2013, 2016). Imputation is especially useful for fine mapping of a particular

28
region or for meta-analysis. In fine mapping, imputation allows a high-resolution view
of an associated region with the possibility of finding the causal variant. As in the case
of meta-analysis, when combining studies using different genotyping chips, very rarely
do the variants overlap. To avoid direct genotyping of the missing variants, imputation
is able to “fill-in” missing genotypes, thus combining analysis across different studies.
This method not only can boost up the power of association but also uncover new
genotypes. Though promising, the accuracy of imputation varies and is affected by
factors such as variant density, frequency of variants (imputation fares poorly for rare
alleles), recombination hotspots and LD structure. Therefore, it is imperative to evaluate
imputation accuracy prior to selection for association analysis. IMPUTE2 uses an
information measure (Howie et al., 2009) to assess post imputation accuracy while
BEAGLE v4.1 relies on the R2 correlation (Browning & Browning, 2013). Variants that
are genotyped in the GWAS can be masked and imputed to evaluate imputation
accuracy (Marchini & Howie, 2010).
Figure 2.4: Imputation work flow for genome-wide association studies (GWAS).
Missing genotypes in the GWAS data set are ‘filled’ in by matching with the reference
data set (e.g. the Hapmap or 1000 Genomes reference haplotypes). The existing
genotypes on the GWAS data set act as reference points or markers to match the data
set. The subsequent step of ‘filling in’ the missing genotypes is performed, taking into
account the linkage disequilibrium (LD) and recombination rate of the target region.
Each row represents a haplotype from a single individual while each row represents a
SNP.

29
2.7.3 Genome-wide association studies (GWAS)
GWAS is a large-scale association study, typically using a case-control
approach, testing hundreds or even millions of SNPs concurrently to identify disease
risk (Figure 2.5). The difference between GWAS and candidate gene approach is: 1)
Candidate gene approach is hypothesis driven while GWAS is not - variants
encompassing the whole genome is analyzed simultaneously; 2) Magnitude of variants -
candidate approach usually studies limited variants on the genes of choice while GWAS
screening can include up to millions of variants. GWAS screening can be performed
either using a 2-tier or 3-tier design. The preliminary screening involves GWAS
genotyping and association analysis followed either 1 or 2 separate replication cohorts.
Replication is essential to identify variants showing a true association rather than by
chance due to small sample size. Typically the selection of case and control subjects is
crucial to avoid false positive associations. The case and control subjects ideally should
be matched in terms of ethnicity, age and gender (McCarthy et al., 2008). Subjects
showing population stratification or cryptic relatedness should be removed to avoid
inflation of the type I error with the remaining spurious population structure to be
corrected using genomic control (Zheng et al., 2006) or principal components (Price et
al., 2006). Genotyping is performed using proprietary microarray platforms, with
varying configuration of SNPs to best capture variants of a particular ethnicity or across
different populations. Marker selection is based on data generated from the 1000
genomes project, with tag SNPs selected to maximize coverage of all available variants.
Association analysis adopts the frequentist method (McCarthy et al., 2008),
sometimes including covariates such as age, gender, populations structure and lifestyle
habits. Frequentists methods can also account for various genetic models: additive,
dominant, recessive or even co-dominant models. Though accounting for different
genetic models could enhance the association of some variants (Lettre et al., 2007), the

30
use of multiple genetic models also complicates computation of type 1 error rates by
increasing the stringency of the multiple-testing threshold. This in turn reduces the
number of potential disease loci and subsequent follow-up efforts. In addition, without
confirmation of the causal function of SNPs, the adoption of genetic models at the
genomics stage is academic at best.
Figure 2.5: The case-control genome-wide association study (GWAS) design. A.
Polymorphic SNP sites in the genome. B. Association analysis is done using a case
control design testing for association of SNPs on a genome-wide scale. C. Manhattan
plot shows an overview of all association signals from a GWAS study.
31
To date, there are 2838 GWAS publications and 33353 unique SNP-trait
associations reported (MacArthur et al., 2017), surpassing the genome-wide threshold
of P≤5.0x10⁻⁸ (Hoggart et al., 2008). The introduction of GWAS has improved the
understanding of genetic basis of particular diseases, for example type 1 (Hakonarson et
al., 2007; Todd et al., 2007) and type 2 diabetes (Saxena et al., 2007; Scott et al., 2007;
Sladek et al., 2007; Steinthorsdottir et al., 2007; Zeggini et al., 2007; Zeggini et al.,
2008), inflammatory bowel disease (Duerr et al., 2006; Hampe et al., 2007; Libioulle et
al., 2007; Parkes et al., 2007; Rioux et al., 2007), prostate cancer (Eeles et al., 2008;
Gudmundsson et al., 2007a; Gudmundsson, et al., 2007b; Gudmundsson et al., 2008;
Thomas et al., 2008; Yeager et al., 2007) and breast cancer (Easton et al., 2007; Hunter
et al., 2007; Stacey et al., 2007). Results from GWAS studies have confirmed
previously hypothesized risk gene, though there are also instances whereby genes
originally not thought to have a role in a given disease showed consistent association
(Helgadottir et al., 2007; Klein et al., 2005; Moffatt et al., 2007; Rioux et al., 2007;
Scott et al., 2007). The bulk of variants identified through GWAS falls in the low
penetrance, high prevalence category (Manolio, 2010; McCarthy et al., 2008). In
addition, most variants have modest effect sizes, with a median of 1.33 (Hindorff et al.,
2009). Many of the variants are situated in non-coding regions (Manolio, 2010), making
functional interpretation difficult. It is suggested these GWAS signals could perhaps tag
nearby causal variants. Perhaps, with the emergence of epigenetic initiatives like the
ENCODE project (ENCODE Project Consortium, 2004; Kellis et al., 2014) and the
Roadmap Epigenomics project (Bernstein et al., 2010), potential roles of intronic, and
particularly intergenic regions in regulating gene expression can be identified.
The transition from identifying genetic variants to understanding its functional
relevance remains elusive. However, with the emergence of new and more affordable

32
technologies, it is hoped this gap can be bridged, paving the way for widespread
adoption of genomics in a clinical setting.
2.7.4 GWAS in NPC
To date, there are 6 GWAS studies conducted on NPC (Bei et al., 2010; Chin et
al., 2015; Cui et al., 2016a; Ng et al., 2009a; Tang et al., 2012; Tse et al., 2009). The
details of the Malaysian GWAS published in 2015 (Chin et al., 2015) will be discussed
in detail in subsequent chapters of this thesis. Thus it will be omitted from discussion at
this point. All the GWAS studies are concentrated in the Chinese population, be it from
southern China, Taiwan or Malaysian Chinese. Previous studies have indicated the
sporadic nature of NPC, involving multiple genetic variants, each with low penetrance.
The first GWAS of NPC was carried out in the Malaysian Chinese using a 2-tier
case-control design (Ng et al., 2009a). At the discovery stage, 111 NPC cases and 260
unrelated controls were genotyped at the genome-wide scale of 533,048 SNPs. The top
200 GWAS SNPs were replicated in a separate set of 168 cases and 252 controls. The
combined analysis identified a SNP in intron 3 of the ITGA9 (integrin-alpha 9) gene,
rs2212020, is strongly associated with NPC (P=8.27x10⁻⁷, OR=2.24, 95% CI=1.59-
3.15). Fine mapping of the surrounding region was also done, genotyping an additional
19 tag SNPs within a 40-kb linkage disequilibrium (LD) block surrounding rs2212020.
SNP rs189897 was identified, showing improved an improved association to NPC risk
(P=6.85x10⁻⁸, OR=3.18, 95% CI=1.94-5.21). ITGA9 encodes a subunit of integrin,
which mediates many biological processes such as cell-cell adhesion, proliferation,
apoptosis, and differentiation (Birkenbach et al., 1992; Lin et al., 1997; Stewart &
Nemerow, 2007; Young et al., 1989).

33
At about the same time, a separate GWAS study was conducted in Taiwan,
using a 3-tier case-control design (Tse et al., 2009). The discovery stage recruited 277
NPC patients and 285 healthy controls, analyzing 480,365 single-nucleotide
polymorphisms (SNPs). This identified 12 statistically significant SNPs at the 6p21.3
region. The GWAS signals were replicated in 2 independent sets of case-controls
(replication 1=339 NPC-696 controls; replication 2=296 NPC-944 controls). The results
identified SNPs in the following genes: 1) rs2517713 (P=3.9x10⁻²⁰) and rs2975042
(P=1.6x10⁻¹⁹), located downstream of the HLA-A gene; 2) rs29232 (P=8.97x10⁻¹⁷)
gamma aminobutyric acid b receptor 1 (GABBR1); 3) rs3129055 (P=7.36x10⁻¹¹) and
rs9258122 (P=3.33x10⁻¹⁰) on HLA-F. rs29232 retained its association (P<5x10⁻⁴) after
adjustment with HLA-related SNPs, proving its association to be independent and not
correlated with HLA SNPs. Immunohistochemical staining of NPC biopsies showed
that the expression of GABBR1 protein in tumor cells was significantly higher than that
in adjacent normal epithelial cells (P<0.001). GABA may affect cancer growth through
activation GABA receptors (Zhang et al., 2013).
Bei et al. (2010) reported a large NPC GWAS from populations of southern
Chinese descent. A 2-tier case control desgin was employed, supported by a trio linkage
study. The discovery stage recruited 1,583 NPC cases and 1,894 controls, analyzing
464,328 autosomal SNPs. The top 49 SNPs from the GWAS were replicated in 3,507
cases and 3,063 controls of southern Chinese descent from Guangdong and Guangxi.
The seven SNPs showing genome-wide association significance (P≤5.0x10⁻⁸) were
further confirmed by transmission disequilibrium test analysis in 279 trios from
Guangdong. This study identified three new susceptibility loci, TNFRSF19 on 13q12
(rs9510787, P=1.53x10⁻⁹, OR=1.20), MDS1-EVI1 on 3q26 (rs6774494, P=1.34x10⁻⁸,
OR=0.84) and the CDKN2A-CDKN2B gene cluster on 9p21 (rs1412829, P=4.84x10⁻⁷,
OR=0.78) (Bei et al., 2010). The study also confirmed the association of HLA by

34
revealing independent associations at rs2860580 (P=4.88x10−67, OR=0.58), rs2894207
(P=3.42x10⁻³³, OR=0.61) and rs28421666 (P= 2.49x10⁻¹⁸, OR=0.67) (Bei et al., 2010).
TNFRSF19 encodes a member of the TNF receptor superfamily (Hu et al., 1999), and
when overexpressed, activates the c-Jun N-terminal kinase (JNK) pathway and induces
caspase-independent cell death (Eby et al., 2000). EVI1 can suppress the effect of
transforming growth factor (TGF)-β on growth inhibition, which in turn promotes tumor
growth. EVI1 can also protect cells from stress-induced cell death by inhibiting c-JNK
(Kurokawa et al., 2000; Nitta et al., 2005). Fusion of EVI1 with MDS1 impairs its
capacity to repress TGF-β signaling (Nitta et al., 2005). Presence of SNPs in the MDS1-
EVI1 might interrupt the balance between EVI1 and MDS1, and subsequently the
regulation of (TGF)-β. CDKN2A and CDKN2B are known tumor suppressor genes
(Krimpenfort et al., 2007; Sharpless et al., 2001).
A separate GWAS was conducted by Tang et al. (2012) from Guangxi Zhuang
Autonomous Region and Guangdong province of southern China. In this study, the
authors focused on the amino acid variants of the HLA class I genes, complementing
GWAS results with HLA class I typing. The results identified strong association signals
involving SNPs, HLA alleles, and amino acid (aa) variants across the major
histocompatibility complex-HLA-A (PHLA-A-aa-site-62 = 7.4x10⁻²⁹), HLA-B (PHLA-B-aa-site-
116 = 6.5x10⁻¹⁹), and HLA-C class I genes (PHLA-C-aa-site-156 = 6.8x10⁻⁸) (Tang et al., 2012).
Multivariate logistic regression of adjacent regions found that all association signals
were driven by effects of HLA- A*11:01, HLA-B*13:01, B*38:02 and B*55:02 (Tang et
al., 2012). The strong association of amino acid variants implicate specific class I
peptide recognition motifs in HLA-A and -B peptide binding groove as conferring strong
genetic influence on the development of NPC in China.

35
The latest NPC GWAS study by Cui et al. (2016a) is an extension of the GWAS
reported by Bei et al. (2010). The study recruited samples of southern Chinese ancestry,
and the GWAS was done using a 3-tier case-control design. The discovery stage
consisting of 463,250 SNPs in 1,583 NPC cases and 2,979 controls of southern Chinese
ancestry revealed 1,257 top SNPs to be associated with NPC, which were validated in a
separate case-control set of 1,925 NPC cases and 1,947 controls of southern Chinese
(Cui et al., 2016a). Further 11 SNPs were selected for another independent validation in
3,538 NPC cases and 3,644 controls of southern Chinese giving a total set of 7,046 NPC
cases and 8,570 controls. This study found associations with genome-wide significance
(P≤5.0x10⁻⁸) at TERT-CLPTM1L at chromosome 5p15 (rs401681; P=2.65x10⁻¹⁴; OR =
0.82) and CIITA at chromosome 16p13 (rs6498114; P=4.01x10⁻⁹; OR=0.87) (Cui et al.,
2016a). CLPTM1L and TERT have been implicated in cancers (Blasco, 2005; James et
al., 2014) and CIITA is considered as the “master control factor” for the expression of
NPC-associated MHC class II genes (Steimle et al., 1993). Table 2.3 summarizes all the
NPC GWAS studies reported to date.
2.7.5 Meta-analysis of NPC GWAS studies
There are several approaches to GWAS meta-analysis (Cooper et al., 2009), the
most commonly adopted method being the fixed effects (Pfeiffer et al., 2009) or random
effects method (Pereira et al., 2009). Fixed effects meta-analysis assumes that the true
effect of each risk allele is the same in each data set. In other words, fixed effects is
used when there is no heterogeneity across meta-analysis studies. Fixed effects method
employs inverse variance weighting (Kavvoura & Ioannidis, 2008) to weight genetic
effects across different studies. Each study is weighted according to the inverse of its
squared standard error (Zeggini & Ioannidis, 2009). Random effects method is used
when there is probable between-study heterogeneity (Ioannidis et al., 2007; Pereira et

36
al., 2009). The most popular estimator used is the DerSimonian and Laird estimator
(DerSimonian & Laird, 1986), though many other approaches do exist. Weighting of
genetic effects also use the inverse variance method. The bayesian method is another
alternative method for meta-analysis. However, bayesian models may depend on
assumptions made about the prior distributions of parameters of interest, and their
genome-wide implementation can become computationally intensive (Evangelou &
Ioannidis, 2013).
Nasopharyngeal carcinoma (NPC) is linked to Epstein-Barr virus (EBV)
infection. While EBV infection is ubiquitous, NPC incidence varies considerably
around the world (Chang & Adami, 2006). It is hypothesized that genetic differences
across populations partly explain the predisposition of this cancer to individuals of
Southeast Asian descent. Several lines of evidence support a role for genetic
susceptibility in NPC. The disease clusters within families (Chang & Adami, 2006).
Also, numerous studies have implicated polymorphisms in candidate genes in NPC (Bei
et al., 2012; Hildesheim & Wang, 2012). The most consistent evidence has been for an
association between HLA and NPC, an association that is biologically plausible given
the central role of EBV in NPC and of HLA in immune presentation or handling (Su et
al., 2013).

37
Many major GWAS meta-analyses have been published thus far, though not for
NPC. Several NPC GWAS have recently been published (Bei et al., 2010; Chin et al.,
2015; Ng et al., 2009a; Tang et al., 2012; Tse et al., 2009); all provided support for the
importance of genetic factors and clearly confirmed the involvement of genes in the
MHC region (region where HLA genes reside) in NPC. Associations outside the MHC
were also reported from these GWAS but were not as strong or consistent, suggesting
the need for pooling across studies and larger efforts to identify novel genes involved in
this disease (Bei et al., 2010; Chin et al., 2015; Ng et al., 2009a; Tang et al., 2012; Tse
et al., 2009).
2.7.6 Pathway analysis of NPC GWAS studies
Pathway or ‘gene-set’ analysis on GWAS has been gaining traction of late.
However, this approach has not been popular for NPC, with only two candidate gene
approaches implicating DNA repair (Qin et al., 2011) and TERT-CLPTM1L (Yee Ko et
al., 2014) pathways in NPC etiology. Pathway analysis is appealing as it tests the
cumulative association for gene sets of related function without the constraints of
stringent multiple testing threshold. The inclusion of genes or loci with moderate to
small effects better represent the gene interaction dynamics of NPC. This study aims to
identify aberrant pathways associated to NPC in both GWAS and gene expression
platforms. Pathway analyses employ either a competitive or self-contained hypothesis
testing method (Tian et al., 2005).

38
Table 2.3: Summary of NPC association results based on GWAS studies.
Gene SNP Pos Effect
allele/
AA
Sample
(case/ctrl)
P-value OR (95% CI) Reference
ITGA9
GABBR1
GABBR1
GABBR1
GABBR1
HLA-F
HLA-F
HLA-A
HLA-A
HCG9
HCG9
HCG9
HCG9
MECOM
HLA-A
HLA-B/C
HLA-DQ/DR
CDKN2A/2B
TNFRSF19
TNFRSF19
HLA-A
HLA-B
HLA-C
CLPTM1L
CIITA
rs2212020
rs2267633
rs2076483
rs29230
rs29232
rs3129055
rs9258122
rs2517713
rs2975042
rs9260734
rs3869062
rs5009448
rs16896923
rs6774494
rs2860580
rs2894207
rs28421666
rs1412829
rs9510787
rs1572072
11:01
AAsite 62
AAsite 70
AAsite 97
AAsite 114
AAsite 276
13:01
38:02
55:02
AAsite -16
AAsite 97
AAsite 116
AAsite 116
AAsite 158
12:02
AAsite 24
AAsite 95
AAsite 95
AAsite 156
AAsite 304
rs401681
rs6498114
3p22-21.3
6p22.1
3q26
6p22.1
6p21.33
6p21.32
9p21
13q12
13q12
6p22.1
6p21.33
6p21.33
5p15
16p13
T
A
A
A
A
G
A
A
A
G
A
G
A
G
A
G
G
G
G
A
-
Q
Q
I
R
L
-
-
-
L
R
L
F
T
-
S
I
L
W
M
T
G
279/512
912/1925
5090/4957
1405/2650
8.27x10⁻⁷
1.28x10⁻⁹
1.49x10⁻⁹
4.77x10⁻⁹
8.87x10⁻¹⁷
7.36x10⁻¹¹
3.33x10⁻¹⁰
3.65x10-38
3.90x10⁻²⁰
1.60x10⁻¹⁹
6.77x10⁻¹⁸
1.30x10⁻¹⁵
2.49x10⁻¹⁰
1.34x10⁻⁸
4.88x10-67
3.42x10⁻³³
2.49x10⁻¹⁸
4.84x10⁻⁷
1.53x10⁻⁹
1.30x10⁻⁸
1.72x10⁻¹⁹
1.17x10⁻²⁴
1.47x10⁻²¹
3.05x10⁻²⁰
5.74x10⁻²²
3.29x10⁻²³
4.52x10⁻⁷
1.96x10⁻¹⁰
1.57x10⁻¹⁰
1.70x10⁻¹³
4.41x10⁻¹¹
2.37x10⁻¹³
1.58x10⁻⁷
5.96x10⁻⁸
4.28x10⁻⁵
3.88x10⁻⁶
4.48x10⁻⁶
1.50x10⁻⁵
1.35x10⁻⁹
6.15x10⁻⁵
2.65x10⁻¹⁴
4.01x10⁻⁹
2.24 (1.59-3.15)
1.57 (1.36-1.82)
1.57 (1.36-1.82)
1.56 (1.34-1.80)
1.67 (1.48-1.88)
1.51 (1.34-1.71)
1.49 (1.32-1.69)
1.88 (1.65-2.15)
1.86 (1.63-2.13)
1.85 (1.61-2.12)
1.78 (1.55-2.05)
1.72 (1.51-1.96)
1.66 (1.42-1.94)
0.84 (0.79-0.89)
0.58 (0.55-0.62)
0.61 (0.57-0.66)
0.67 (0.61-0.73)
0.78 (0.71-0.85)
0.84 (0.79-0.90)
0.84 (0.79-0.90)
0.59 (0.53-0.66)
0.59
0.61
0.62
0.61
0.58
0.66 (0.56-0.77)
1.88 (1.55-2.28)
0.27 (0.18-0.40)
0.65
0.66
0.63
1.45
1.48
0.41 (0.27-0.63)
1.24
0.76
0.77
0.47
0.78
0.82 (0.78-0.87)
0.87 (0.83-0.91)
(Ng et al.,
2009a)
(Tse et al.,
2009)
(Bei et al.,
2010)
(Tang et
al., 2012)
(Cui et al.,
2016a)
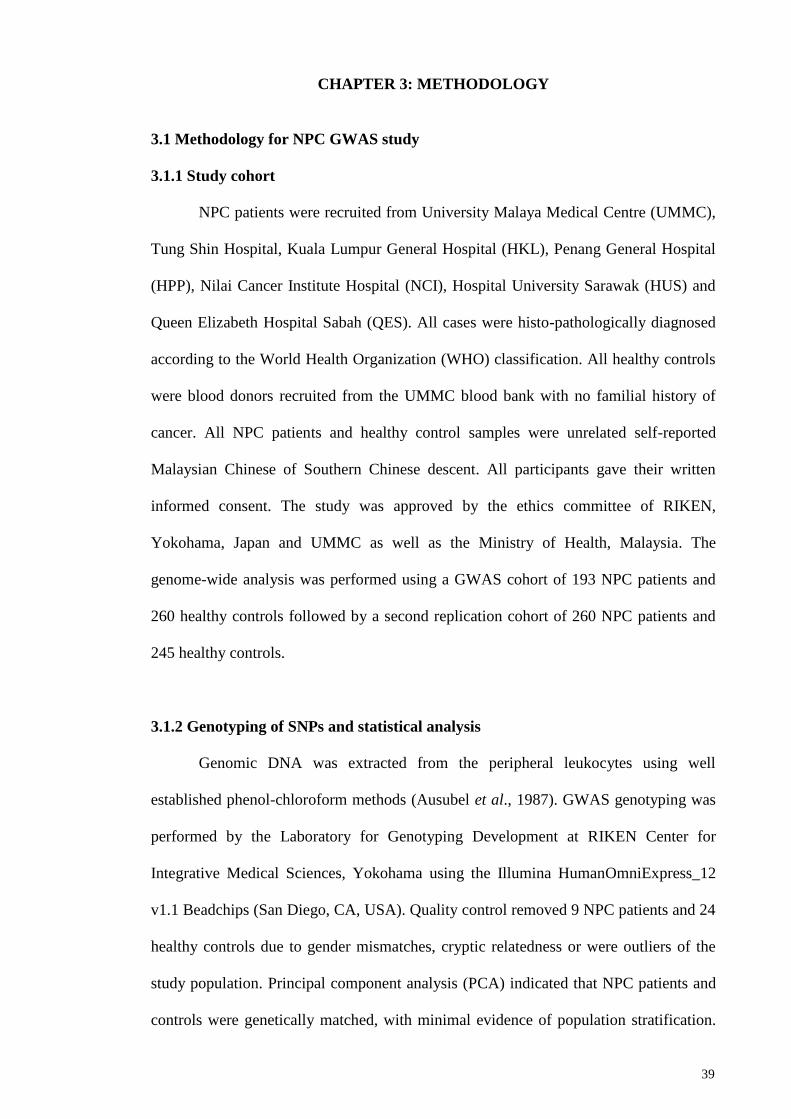
39
CHAPTER 3: METHODOLOGY
3.1 Methodology for NPC GWAS study
3.1.1 Study cohort
NPC patients were recruited from University Malaya Medical Centre (UMMC),
Tung Shin Hospital, Kuala Lumpur General Hospital (HKL), Penang General Hospital
(HPP), Nilai Cancer Institute Hospital (NCI), Hospital University Sarawak (HUS) and
Queen Elizabeth Hospital Sabah (QES). All cases were histo-pathologically diagnosed
according to the World Health Organization (WHO) classification. All healthy controls
were blood donors recruited from the UMMC blood bank with no familial history of
cancer. All NPC patients and healthy control samples were unrelated self-reported
Malaysian Chinese of Southern Chinese descent. All participants gave their written
informed consent. The study was approved by the ethics committee of RIKEN,
Yokohama, Japan and UMMC as well as the Ministry of Health, Malaysia. The
genome-wide analysis was performed using a GWAS cohort of 193 NPC patients and
260 healthy controls followed by a second replication cohort of 260 NPC patients and
245 healthy controls.
3.1.2 Genotyping of SNPs and statistical analysis
Genomic DNA was extracted from the peripheral leukocytes using well
established phenol-chloroform methods (Ausubel et al., 1987). GWAS genotyping was
performed by the Laboratory for Genotyping Development at RIKEN Center for
Integrative Medical Sciences, Yokohama using the Illumina HumanOmniExpress_12
v1.1 Beadchips (San Diego, CA, USA). Quality control removed 9 NPC patients and 24
healthy controls due to gender mismatches, cryptic relatedness or were outliers of the
study population. Principal component analysis (PCA) indicated that NPC patients and
controls were genetically matched, with minimal evidence of population stratification.

40
For SNP quality control, 137,470 SNPs were excluded where 29,876 SNPs had call
rates < 99%, 107,589 SNPs had minor allele frequency (MAF) < 1% (74,883 SNPs
were mono-allelic) and 5 SNPs showed significant deviation from Hardy-Weinberg
equilibrium (HWE) in controls (P<1.0x10⁻⁶). A total of 575,247 autosomal SNPs passed
quality control in a GWAS cohort of 184 NPC patients and 236 healthy controls.
Validation of the GWAS genotyping results as well as genotyping of replication
samples were performed using multiplex-PCR-based invader assay (Third Wave
Technologies, Madison, WI, USA). The same quality control measures as the genome-
wide analysis were applied but with more stringent HWE thresholds in controls
(P<0.05). Genotyping of previously reported GWAS SNPs from Ng et al. (2009a), Tse
et al. (2009), Bei et al. (2010), Tang et al. (2012) were performed in the same manner.
The quantile-quantile plot (Q-Q plot) of trend test was generated using R (https://cran.r-
project.org/) to evaluate overall association of GWAS and presence of population
stratification inferred through genomic control inflation factor (λgc). The Manhattan plot
of –log10(PGWAS) for autosomal SNPs was generated using Haploview (Barrett et al.,
2005). The genome-wide association analysis was performed in PLINK (Purcell et al.,
2007) using multivariate logistic regression assuming an additive model (0, 1, 2 allele
dosage coding for minor allele) adjusting for age, gender and the first principal
component (PC1). Only PC1 was estimated to be significant by the Tracy-Widom
statistic (P<0.05). Odds ratios (OR) and 95% confidence intervals (95% CI) were
calculated per risk allele assuming an additive model. SNPs were ranked in order of the
lowest P-value. Association of previously reported GWAS SNPs from Ng et al.
(2009a), Tse et al. (2009), Bei et al. (2010) and Tang et al. (2012) was analyzed in the
same manner.

41
3.1.3 Imputation
Imputation of all HLA-A region SNPs were performed using IMPUTE (Marchini
et al., 2007) utilizing HapMap 2 (CHB & JPN), HapMap 3 Mixed Population, 1000
Genomes Asian population and previously reported GWAS data (Ng et al., 2009a).
SNPs showing MAF ≥ 1%, imputation power (INFO) > 0.5 and imputation confidence
(CERTAINTY) > 0.9 were selected for validation and replication through multiplex-
PCR-based invader assay (Third Wave Technologies, Madison, WI, USA). Statistical
analysis and quality control measures were performed similar to the GWAS analysis.
3.1.4 HLA-A SNP and amino acid variants analysis
HLA-A genotyping was carried out using a WAKFlow HLA typing kit and the
data was analyzed using the WAKFlow HLA typing software (Wakunaga, Hiroshima,
Japan). We mapped HLA-A SNPs and amino acid variants referencing the HLA-A sub-
type sequences from dbMHC using the WAKFlow HLA-A typing data
(www.ncbi.nlm.nih.gov/projects/gv/mhc/). Statistical analysis and quality control
measures for HLA-A alleles and HLA-A single SNPs were performed in PLINK similar
to the GWAS analysis. For multi-allelic SNPs and amino acid variants, statistical
analysis was performed in R employing a Fisher’s Exact Test in R x C contingency
table. OR and 95% CI were calculated with reference to the major allele. To identify
LD-driven associations, Multivariate logistic regression was used to adjust for the
additive effects of both HLA-A single SNPs and HLA-A alleles, entered as 0, 1, 2 allele
dosage coding. The coded allele was either the minor allele of a HLA-A SNP, a carrier
allele of a HLA-A allele or the rare amino acid variant. Same approach was used to
analyse multi-allelic SNPs by only considering the strongest bi-allelic or
damaging/deleterious combination. All P-values were also adjusted for age, gender and
PC1. Corresponding function of amino acid residues were annotated with reference to
42
the Immunology Database and Analysis Portal (ImmPort) system
(immport.niaid.nih.gov/). Functional impact of HLA-A gene SNPs were annotated using
PROVEAN (Choi et al., 2012), SIFT (Kumar et al., 2009) and Polyphen-2 (Adzhubei et
al., 2010) prediction scores. Variants were deemed damaging or deleterious if predicted
in 2 out of 3 of the annotation methods.
3.1.5 Regulatory functions of NPC associated HLA-A SNP variants
HaploReg (Ward & Kellis, 2012) was used to predict 5’-UTR HLA-A SNP
variants with function related to transcription regulation. SNP variants were annotated
to locate epigenetic functions related to i) enhancer (H3K4me1 and H3K27ac histone
modification) or promoter activity (H3K4me3 histone modification) ii) DNase I enzyme
hypersensitivity (suggestive of a regulatory region) iii) Protein or transcription factor
binding iv) Regulatory motif changes as predicted from Position Weight Matrices
(PWM) of TRANSFAC (Matys et al., 2003), JASPAR (Portales-Casamar et al., 2010)
and protein-binding microarray experiments (Badis et al., 2009; Berger et al., 2008).
Strength of regulatory motif binding is inferred by log-of-odds (LOD) of reference and
alternate alleles. We investigated effects of SNP genotypes on HLA-A expression
through expression quantitative trait loci analysis (eQTL) data obtained from the Sanger
Institute Genevar Database (Yang et al., 2010) using fibroblasts, LCLs and T cells
derived from the umbilical cords from the Geneva GenCord (Dimas et al., 2009) dataset
and adipose, LCLs and skin tissues from the MuTHER resource (Nica et al., 2011)
dataset. A cis-eQTL is defined as a SNP located within 2Mb region of the gene of
interest, in our case the HLA-A gene, with significant Spearman-rank correlation
between SNP genotype and gene expression (P<1.0x10⁻³).

43
3.2 Methodology for meta-analysis of NPC GWAS
3.2.1 GWAS data for meta-analysis
The GWAS contributing to the meta-analysis included histologically confirmed
NPC cases and region-specific controls restricted to individuals of Chinese ethnicity
(Table 3.1) (Bei et al., 2010; Chin et al., 2015; Ng et al., 2009a; Tang et al., 2012; Tse
et al., 2009). GWAS genotyping was performed by the Laboratory for Genotyping
Development at RIKEN Center for Integrative Medical Sciences, Yokohama.
Genotyping for the Malaysian GWAS was performed using Illumina Hap550v3
Beadchip and Illumina Human OmniExpress_12 v1.1 Beadchip. Both Malaysian
GWAS were analyzed as one. All data included passed QC filtering criteria as described
previously (Chin et al., 2015; Ng et al., 2009a).

44
Table 3.1: Summary of studies included in the meta-analysis (Bei et al., 2016).
Phase Reference Location Genotyping platform Cases Controls
GWAS Bei et al., 2010 Southern China Illumina Hap610 1,583 2,979
GWAS Tse et al., 2009 Taiwan Illumina 600 Hap550v3 Beadchips 277 285
GWAS Ng et al., 2009 Malaysia 1 Illumina Hap550v3 Beadchip 108 240
GWAS Chin et al., 2015 Malaysia 2 Illumina Human OmniExpress_12 v1.1 Beadchip 184 236
GWAS-
SUM
2,152 3,740
Replication I Southern China I Sequenom custom array 3,525 4,121
Replication I Malaysia Sequenom custom array 335 405
Replication I Taiwan I Sequenom custom array 352 312
Replication I Taiwan II Sequenom custom array 504 541
Rep I - SUM 4,716 5,379
Total 6,868 9,119

45
3.2.2 Imputation to combine GWAS SNPs
To maximize coverage across studies, genome-wide imputations were
performed for both Malaysian NPC GWAS studies using typed SNPs. SNPs with call
rates >90%, minor allele frequencies >3%, and that had genotype distributions that did
not deviate from the expected by Hardy-Weinberg equilibrium (in controls; P>10-6)
were retained for imputation using IMPUTE2 (Howie et al., 2009). HapMap reference
data were used (HapMap phase III, CHB+CHD+JPN data). Imputated genotypes with
information score <90%, MAF <3%, or missing >10% were excluded. GTOOL
(http://www.well.ox.ac.uk/~cfreeman/software/gwas/gtool.html) was used for data
conversions.
3.2.3 Statistical analysis
For each GWAS, SNPs were analyzed by logistic regression under a log
additive model, adjusting for age and cryptic population stratification. To define
population stratification adjustment factors, principal component analysis was
performed using EIGENSTRAT (Price et al., 2006) with a pruned set of 30,956 SNPs
defined based on pairwise linkage disequilibrium (r2 < 0.05 among Chinese) and
restricted to SNPs with MAF >3%. The top 10 eigenvectors were evaluated for their
association with NPC (separately for each individual GWAS) and included in the final
logistic models if P-value <0.05 by the Wald test.
Using results from individual GWAS, the 500 SNPs with the lowest P-values
from each of the studies were identified after exclusion of SNPs that could not be
imputed or failed QC filtering. These study-specific lists of top-SNPs were combined
into a single list for consideration as part of the present meta-analysis. In total, 1,590
SNPs were identified through this process and these 1,590 SNPs comprised the basis for
the present meta-analysis. Summary statistics (number cases/controls, genotype counts,

46
β-coefficients, and SDs) were obtained from individual studies for selected SNPs and a
meta-analysis was performed using a fixed effects model in R (https://cran.r-
project.org). The merging of post-imputation data from individual GWAS was
performed by the Biostatistics Branch, Division of Cancer Epidemiology and Genetics,
National Cancer Institute, Bethesda, Maryland.
3.2.4 Replication of meta-analysis targets
SNPs were selected for replication as follows. The top 200 hits (all with P-
values <0.0167) from the meta-analysis for which the direction of the association was
consistent across all individual studies were arbitrarily ranked by P-value. These
selected SNPs with P-values <1x10⁻⁵ were 250 kb+ from other selected SNPs. For SNPs
within 250kb of another SNP on the list, the SNP with the smaller P-value when the r2
between SNPs was >0.80 were retained (r2 based on Chinese population from the 1000
genomes project). Thirty SNPs were selected based on these criteria. A further 14 SNPs
nominated by consortium members were added based on results from individual GWAS
and other information from candidate-based studies and other studies in the published
literature. One SNP that qualified based on the criteria above but failed in the design of
the custom array described below was excluded (rs11865086). A second SNP that
qualified but failed in the custom array design (rs6931820) was replaced with a SNP in
strong LD with the original SNP (rs1324103; r2=0.88). In total, 43 SNPs were evaluated
in the replication phase in the Malaysian samples.
Replication studies were restricted to studies among individuals of Chinese
descent. All four studies were hospital-based, recruiting NPC cases from selected
hospitals in their respective geographical area. From Malaysia, 335 cases and 405
controls were recruited for the replication phase. Cases were recruited from the
University of Malaya Medical Center (Kuala Lumpur, Malaysia) and from a network of

47
additional hospitals across the country. For the southern China study, cases were
recruited from the Sun Yat-Sen University Cancer Center (Guangzhou, China) and the
Southern Medical University Hospital. For the Malaysia study, For the two Taiwan
studies, cases were recruited form the National Taiwan University (Taipei, Taiwan) and
MacKay Memorial hospitals and from the Chang Gung Memorial and Linkou hospitals,
respectively. Cases were restricted to adults with histologically confirmed NPC.
Geographically matched controls of Chinese descent were frequency (southern China,
Malaysia, and Taiwan II studies) or individually (Taiwan I study) matched to cases on
age and gender. Controls did not have a history of NPC diagnosis. Studies were
reviewed/approved by ethical committees and informed consent was obtained from
participants. In total, 4,716 cases and 5,379 controls across four case–control studies in
Mainland China, Malaysia, and Taiwan were recruited for the meta-analysis (Table 3.1).
A custom designed array containing the 43 SNPs selected for replication was
developed using the Sequenom MassARRAY iPlex assay. To ensure comparable
quality across laboratories, a common QC panel consisting of 94 HapMap samples was
tested. Percent agreement across laboratories for the 43 SNPs tested was 97% (range:
82%–100%; agreement was >85% for all but two SNPs: rs189897 and rs4714505).
To analyze the replication studies, individual genotyping results were pooled
and an additive logistic regression model used to evaluate the effect of each SNP,
adjusting for study. To summarize information across the GWAS and replication
studies, a meta-analysis was conducted using the fixed effect model to integrate
estimates from all studies. As for the meta-analysis merging both GWAS and
replication association data across different study groups, the analysis was performed by
the Biostatistics Branch, Division of Cancer Epidemiology and Genetics, National
Cancer Institute, Bethesda, Maryland.
48
3.3 Methodology for integrated pathway analysis of NPC
3.3.1 NPC GWAS data
Samples for this study were from previous NPC GWAS studies generated on the
Illumina HumanHap 550K and Illumina Human OmniExpress_12 v1.1 platform in a
Malaysian Chinese cohort (Chin et al., 2015; Ng et al., 2009a). The details of sample
recruitment, quality controls and patient consent have been described elsewhere (Chin
et al., 2015; Ng et al., 2009a). Briefly, SNPs with call rates >99%, minor allele
frequency (MAF) >1% and minimal Hardy–Weinberg equilibrium (HWE) deviation in
controls (P>1.0x10⁻⁶) were retained. Samples were retained after removing gender
mismatches, cryptic relatedness and outliers in the study population. Principal
component analysis (PCA) was performed to adjust for population structure and to
identify outliers using EIGENSOFT (Patterson et al., 2006) package in a pruned set of
76,181 overlapping SNPs (r2<0.2) from both Illumina HumanHap 550K v3 and Human
OmniExpress_12 v1.1. The study cohort after quality control are as follows: (1)
Illumina HumanHap 550K v3 platform, 441,812 autosomal SNPs were retained in 108
NPC patients and 240 healthy controls; (2) Illumina Human OmniExpress_12 v1.1
platform, 575,247 autosomal SNPs were retained in 184 NPC patients and 236 healthy
controls.

49
3.3.2 Imputation and combining GWAS datasets
Both Illumina HumanHap 550K and Illumina Human OmniExpress_12 v1.1
datasets were phased using SHAPEIT v2 release 7 (Delaneau et al., 2013b) prior to
imputation. Imputation was performed using IMPUTE2 (Howie et al., 2009) with
phased haplotypes from all populations of the December 2013 release of the 1000
Genomes Project data. SNP genotypes were called from posterior probabilities in
PLINK 1.9 beta (Chang et al., 2015) using default parameters. Only overlapping SNPs
found on both Illumina HumanHap 550K and Illumina Human OmniExpress_12 v1.1
datasets with MAF>1%, imputation confidence (INFO)>0.5 and best called genotype
certainty (CERTAINTY)>0.9 were retained for pathway analysis. The association
analysis was also performed in PLINK 1.9 beta using multivariate logistic regression
assuming an additive model (0, 1, 2 allele dosage coding for minor allele) adjusting for
age, gender, and the first principal component (PC1). Only PC1 was estimated to be
statistically associated with case–control status by the Tracy–Widom statistic (P<0.05).
Odds ratios (OR) and 95% confidence intervals (95% CI) were calculated per minor
allele assuming an additive model. The quantile–quantile plot (QQ plot) of trend test
was generated to evaluate overall association of GWAS and presence of population
stratification inferred through genomic control inflation factor (λgc). The Manhattan plot
of –log10(Pimp-GWAS) for autosomal SNPs was generated to plot post-imputation GWAS
signals.
3.3.3 GWAS Pathway analysis
Pathway analysis was performed in MAGENTA (Segre et al., 2010). Details of
MAGENTA analysis parameters have been described previously (Segre et al., 2010).
Briefly, SNPs were mapped onto genes using several boundary settings following the
gene’s most extreme transcript start and end site: 110kb UTR-40kb DTR; 20kb UTR

50
DTR; 10kb UTR-2kb DTR. Gene scores were calculated adjusting for potential
confounders using step-wise multiple linear regression and the best SNP (strongest
adjusted P-value) will be retained to represent the said gene. The confounders include:
(1) Gene size; (2) Number of SNPs per kb for each gene; (3) Number of independent
SNPs per kb for each gene (pairwise r2<0.5 based on Malaysian Chinese population);
(4) Number of recombination hotspots per kb each gene; (5) Genetic distance of each
gene; (6) Linkage equilibrium units (LDU) per kb for each gene. The MHC region was
omitted from the analysis. Pathway analysis was performed on 2757 predefined
pathways from BioCarta, GO, Ingenuity, KEGG, Panther and Reactome databases.
Pathways were limited to 10-100 gene-sets size. Nominal PGSEA was calculated through
permutation via random resampling of 10,000 gene sets of identical size. MAGENTA
sets two thresholds for gene-level significance, 95th percentile and 75th percentile with
the latter capturing weaker gene-level association signals. In this study, the more
stringent 95th percentile was set as threshold for gene-level significance. Gene sets with
P<0.05 were selected for integrated pathway analysis.
3.3.4 GEO Gene expression pathway analysis
Microarray data from dataset GSE12452 (Sengupta et al., 2006) was chosen to
corroborate the gene expression profiles of pathways identified by MAGENTA.
GSE12452 consists of mRNA from laser-captured epithelium of 31 nasopharyngeal
carcinomas and 10 non-NPC nasopharynx tissues from a Taiwanese case control cohort.
The mRNA profiling was performed on Affymetrix Human Genome U133 Plus 2.0
Array. Normalization of gene expression values are as described previously (Sengupta
et al., 2006). Differential gene expression analysis was performed in GEO2R employing
the limma package. A t-test was performed, adjusting for log2 fold-change of expression
in the direction of NPC cases vs healthy nasopharynx tissues. P-values were used as

51
gene-level input for GSEA in GSA-SNP (Nam et al., 2010). Pathway sizes were limited
to 10-100 gene-sets size. For purpose of consistency, gene sets used for GSEA in GSA-
SNP were the same gene sets used for MAGENTA covering 2757 predefined pathways
from BioCarta, GO, Ingenuity, KEGG, Panther and Reactome databases. Pathways
showing nominal P<0.05 were selected for integrated pathway analysis.
3.3.5 Fisher’s method for integrating GWAS and expression data
Fisher’s method was used to combine FDR-corrected GWAS pathway and gene
expression pathway P-values. Pathways selected for integrated pathway analysis must
show nominal P<0.05 in both platforms. Fisher’s method is a combined probability test
of results from independent tests sharing the same null hypothesis H0 (Fisher, 1925),
generating a combined statistic, 2 using the formula below:
𝜒2𝑘2 = −2∑ln(𝑝𝑖)
𝑘
𝑖=1
pi is the p-value for the ith hypothesis test
2 is the chi-square critical value with 2k degrees of freedom
3.3.6 Sample collection for gene expression analysis
A total of 10 NPC and 7 non-NPC nasopharynx tissues were collected from the
Queen Elizabeth Hospital (QES), Kuala Lumpur General hospital (HKL), and Pulau
Pinang General Hospital (HPP). Tissues were snap frozen and stored at -80oC. All NPC
cases were histologically diagnosed following the World Health Organization (WHO)
classification. Non-NPC nasopharynx tissues were from patients initially suspected for
NPC but histologically diagnosed otherwise. All patients provided written, informed

52
consent prior to tissue collection for the purposes of research. The Medical Review and
Ethics Committee of the Ministry of Health, Malaysia, approved the study.
3.3.7 Tissue processing and RNA isolation for gene expression analysis
Snap frozen tissue samples were embedded into Optimal Cutting Temperature
(OCT) compound for cryosectioning. For every 9 sections of 8 micron thick tissue
sections, a H&E slide was made for histology review. For NPC, RNA was extracted
from laser capture microdissection or whole tissue sections of tumour tissue with at
least 80% of cancer cells. Non-NPC nasopharynx tissue sections were lymphoid tissues
with 20% to 40% normal epithelial cells. Total RNA was isolated using AllPrep
DNA/RNA/miRNA universal kit (Qiagen, Germany). RNA yield was assessed using
Qubit® RNA HS Assay Kit (Thermo Fisher Scientific, USA) and RNA quality was
assessed using Fragment Analyzer (Advanced Analytical, Germany). RNA samples
with at least 10 ng of material and DV200 (percentage of RNA fragments larger than
200 nt) >30% were used for RNA sequencing.
Whole genome gene expression analysis was performed by Lotterywest State
Biomedical Facility Genomics in the University of Western Australia using the
Ion AmpliSeq™ Transcriptome Human Gene Expression Kit (Thermo Fisher Scientific,
USA). Briefly, 10 ng of total RNA is reverse transcribed to construct a barcoded cDNA
library using the SuperScript® VILO™ cDNA Synthesis kit. Then, cDNA is amplified
using Ion AmpliSeq™ technology to produce a single amplicon spanning 2 exons for
each gene (20,813 genes). Library quality was evaluated using Agilent Bioanalyzer.
Libraries were then amplified using emulsion PCR and enriched following
manufacturer’s instructions. The final mixture was then sequenced on a Ion PITM chip
using an Ion Torrent Proton™ sequencing system.

53
3.3.8 Read alignment and differential gene expression analysis
Primary analysis of Ion AmpliSeq™ Transcriptome data was done using the
Torrent SuiteTM software. Raw reads are mapped to a custom reference sequence set
using the Torrent Mapping Alignment Program (TMAP) (Li et al., 2015). The custom
reference set contains all transcripts targeted by the AmpliSeq kit. This method greatly
improves alignment time. The number of reads mapping to each target is counted using
samtools (Li et al., 2009), giving the raw total read counts. Differential gene expression
analysis was performed in DESeq2 (Love et al., 2014) with raw read counts from
AmpliSeq. Raw counts were normalized and transformed using the regularized
logarithm (rlog) method in DESeq2. Genes showing normalized read counts <10 were
removed from analysis. Sample quality was evaluated using sample-to-sample distance
heatmap and the PCA plot. Differential expression P-values calculated through FDR-
corrected Wald test were used as gene-level input for GSEA of axonemal dynein
complex and chromosomal centromeric region pathways in GSA-SNP following similar
methods in the “GEO Gene expression pathway analysis” section.
54
CHAPTER 4: RESULTS
4.1 Results for NPC GWAS study
4.1.1 GWAS genotyping and validation
The PCA indicated that NPC patients and controls were genetically matched,
with minimal evidence of population stratification (Figure 4.1). Quantile-quantile plot
analysis detected a small inflation factor (λgc) of 1.04, indicating minimal inflation of
the genome-wide association significance due to population stratification (Figure 4.2).
Several loci showed potential association to NPC susceptibility, although not genome-
wide significant (PGWAS<5.0x10⁻⁸) (Figure 4.3). A total of 45 SNPs showing PSNP-
GWAS<1.0x10⁻⁴ were selected for validation and replication analysis through multiplex-
PCR-based-Invader assay. Only the PSNP-Combined for the top 20 GWAS SNPs are shown
(Appendix A). Strong association signals were detected in only the major
histocompatibility complex HLA-A region. These 6 HLA-A region SNPs showed PSNP-
Combined ranging from 10-8 to 10-9 and are located upstream or downstream of the HLA-A
(Table 4.1, Figure 4.4). All 6 SNPs render a protective effect against NPC with
rs3869062 showing the strongest association (PSNP-Combined=1.73x10⁻⁹; odds ratio (OR)
=2.37; 95% confidence interval (CI) =1.79-3.14) and is located 13-kb downstream of
the HLA-A gene. All 6 SNPs are in high linkage disequilibrium (LD) with each other
(r2=0.72-0.99) (Figure 4.4). Association signals of the 6 HLA-A region SNPs were lost
after regressing against each other, suggesting highly correlated associations (Table
4.2).

55
Figure 4.1: Plots of principal components from PCA analysis of NPC GWAS samples.
(Top) Plot of PC1 and PC2 from the PCA of 184 NPC patients and 236 healthy
controls. Orange markers signify GWAS cases (NPC patients) while purple markers
signify GWAS controls (healthy controls). (Bottom) Plot of PC1 and PC2 from the PCA
of 184 NPC patients and 236 healthy controls together with 44 Japanese in Tokyo,
Japan (JPT), 45 Han Chinese in Beijing, China (CHB). Orange markers signify GWAS
cases (NPC patients) while purple markers signify GWAS controls (healthy controls).
Hapmap controls were designated with round circles for Han Chinese in Beijing (CHB)
and ‘X’ for Japanese in Tokyo, Japan (JPT).

56
Figure 4.2: Log10 quantile-quantile (Q-Q) plot for all SNPs from Malaysian NPC GWAS. Q-Q plot showing the distribution of observed statistics by
trend test for all 575,247 SNPs from our genome-wide study of 184 NPC patients and 236 healthy controls of a Malaysian Chinese population. The
diagonal line shows the values expected under null hypothesis of a 2 distribution. Genomic control inflation factor (λgc) is 1.04, suggesting little or
absence of stratification in our samples.

57
Figure 4.3: Manhattan plot of the genome wide P-values of association in NPC Malaysian Chinese. SNPs were ranked using logistic regression
assuming an additive model adjusting for age, gender and principal component 1 (PC1). The –log10(PGWAS) (y axis) of 575,247 SNPs in 184 NPC cases
and 236 healthy controls are shown mapped against its corresponding chromosomal positions (x axis). Screening threshold was set at 1.0x10⁻⁴.

58
Figure 4.4: LD structure of GWAS SNPs with genome-wide significant association. LD structure of GWAS SNPs showing moderate to strong LD
(r2=0.72-0.99), suggesting all SNPs to be strongly linked in a single LD block.

59
Table 4.1: Association of GWAS SNPs to NPC in Malaysian Chinese.
No SNP CHR Position Position Risk Panel Case, RAF Control, RAF P-val OR Nearby Gene
b36 b37 allele
(95% CI)
1 rs3869062 6 30042870 29934891 G Cohort 1 (GWAS) 0.81 0.66 2.6 x 10⁻⁶ 2.57 (1.73-3.81) 3’-UTR HLA-A
1/2=A/G Cohort 2 0.80 0.68 3.51 x 10⁻⁴ 2.11 (1.4-3.17)
Combined 0.80 0.67 1.73 x 10⁻⁹ 2.37 (1.79-3.14)
2 rs2735085 6 30035073 29927095 C Cohort 1 (GWAS) 0.79 0.66 7.16 x 10⁻⁶ 2.41 (1.64-3.53) 3’-UTR HLA-A
1/2=T/C Cohort 2 0.79 0.65 1.95 x 10⁻⁴ 2.12 (1.43-3.14)
Combined 0.79 0.65 1.92 x 10⁻⁹ 2.31 (1.76-3.03)
3 rs7747253 6 30027757 29919779 A Cohort 1 (GWAS) 0.75 0.62 1.58 x 10⁻⁵ 2.2 (1.54-3.15) 3’-UTR HLA-A
1/2=C/A Cohort 2 0.75 0.60 8.44 x 10⁻⁵ 2.14 (1.47-3.14)
Combined 0.75 0.61 2.08 x 10⁻⁹ 2.21 (1.71-2.86)
4 rs2893999 6 30051811 29943832 T Cohort 1 (GWAS) 0.81 0.66 1.73 x 10⁻⁶ 2.63 (1.77-3.9) 3’-UTR HLA-A
1/2=C/T Cohort 2 0.79 0.67 8.12 x 10⁻⁴ 1.98 (1.33-2.95)
Combined 0.80 0.67 2.61 x 10⁻⁹ 2.32 (1.76-3.07)
5 rs9260734 6 30040644 29932666 G Cohort 1 (GWAS) 0.79 0.65 8.25 x 10⁻⁶ 2.39 (1.63-3.5) 3’-UTR HLA-A
1/2=A/G Cohort 2 0.79 0.66 2.35 x 10⁻⁴ 2.1 (1.41-3.12)
Combined 0.79 0.65 2.96 x 10⁻⁹ 2.29 (1.74-3)
6 rs2860580 6 30014669 29906691 C Cohort 1 (GWAS) 0.75 0.79 7.28 x 10⁻⁶ 2.23 (1.57-3.17) 5’-UTR HLA-A
1/2=T/C Cohort 2 0.73 0.79 1.29 x 10⁻³ 1.8 (1.26-2.58)
Combined 0.74 0.79 1.86 x 10⁻⁸ 2.04 (1.59-2.62)
1=minor allele; 2=major allele; RAF=Risk allele frequency; P-val= Logistic regression P-value adjusting for age, gender and PC1;
OR=Odds ratio; 95% CI= 95% confidence interval
Cohort 1 (GWAS): Cases, n=184; Controls, n=236; Total, n=420
Cohort 2: Cases, n=260; Controls, n=245; Total, n=505
Combined: Cases, n=444; Controls, n=481; Total, n=925

60
Table 4.2: Multivariate logistic regression for GWAS SNPs with genome-wide significant association. SNP1 is adjusted against effects of SNP2
assuming an additive model. Results are also adjusted for age and gender.
SNP1 unadjusted SNP2
P-value rs2860580 rs7747253 rs2735085 rs9260734 rs3869062 rs3202637 rs2893999 rs2286404 rs16896044
rs2860580 1.86x10-08 NA 7.53x10-01 3.02x10-01 6.27x10-01 3.89x10-01 8.36x10-03 3.97x10-01 6.02x10-03 6.02x10-03
rs7747253 2.08x10-09 3.30x10-02 NA 1.23x10-01 2.15x10-01 1.26x10-01 8.20x10-04 1.28x10-01 9.83x10-04 9.83x10-04
rs2735085 1.92x10-09 1.06x10-02 7.53x10-02 NA 5.26x10-01 6.24x10-01 4.14x10-04 5.75x10-01 1.79x10-03 1.79x10-03
rs9260734 2.96x10-09 1.16x10-02 6.72x10-02 2.60x10-01 NA 3.83x10-01 2.83x10-04 3.39x10-01 1.04x10-03 1.04x10-03
rs3869062 1.73x10-09 1.06x10-02 5.52x10-02 3.02x10-01 3.37x10-01 NA 1.33x10-04 NA 1.50x10-03 1.50x10-03
rs2893999 2.61x10-09 9.82x10-03 5.79x10-02 3.58x10-01 4.02x10-01 NA 2.40x10-04 NA 1.66x10-03 1.66x10-03

61
4.1.2 Imputation to fine map the HLA-A gene
Fine mapping of the HLA-A gene region was performed using imputation in
search of stronger association signals. Imputation was performed using the HapMap 2,
HapMap 3 and 1000 Genomes reference datasets. Imputated SNPs with MAF ≥ 1%,
INFO > 0.5, CERTAINTY > 0.9 and PSNP-GWAS<1.0x10⁻⁴ were retained. Total of 20
SNPs from HapMap 2, 1 SNP from HapMap 3 and 60 SNPs from 1000 Genomes
imputation were detected. Upon validation of GWAS cohort samples and replication
cohort samples, all but 4 SNPs (rs7754245, rs3873291, rs2275854, rs16896970) showed
strong association signals with genome-wide significance (PSNP-Combined 10-8-10-9)
(Figure 4.5; Appendix B). All imputation SNPs detected were also protective SNPs.
The strongest imputation association signals (rs414215, rs9260029, rs9260033 PSNP-
Combined=1.44x10⁻⁸; OR=2.21; 95% CI=1.71-2.86) did not improve upon the strongest
association signal from the GWAS (rs3869062; PSNP-Combined=1.73x10⁻⁹). None of the
imputated SNPs were located on exonic or intronic regions of the HLA-A gene. These
imputated SNPs were all flanking SNPs of the HLA-A gene.
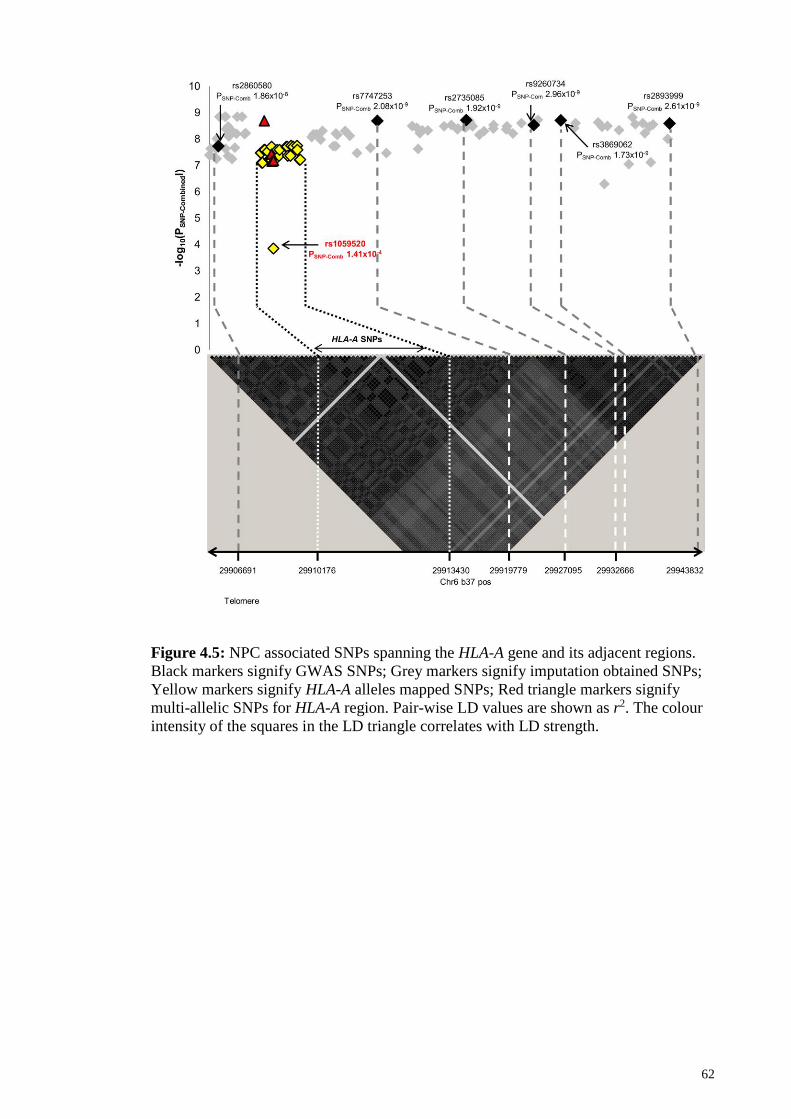
62
Figure 4.5: NPC associated SNPs spanning the HLA-A gene and its adjacent regions.
Black markers signify GWAS SNPs; Grey markers signify imputation obtained SNPs;
Yellow markers signify HLA-A alleles mapped SNPs; Red triangle markers signify
multi-allelic SNPs for HLA-A region. Pair-wise LD values are shown as r2. The colour
intensity of the squares in the LD triangle correlates with LD strength.
63
4.1.3 Molecular HLA-A alleles genotyping
HLA-A alleles genotyping identified 23 HLA-A alleles in the Malaysian Chinese
cohort (Table 4.3). Only 3 HLA-A alleles were associated or showed suggestive
association to NPC, namely HLA-A*02:06 (PHLA-A-Combined=6.22x10⁻³; OR=3.14; 95%
CI= 1.38-7.14), HLA-A*02:07 (PHLA-A-Combined=7.71x10⁻⁵; OR=1.94; 95% CI=1.40-2.69)
and HLA-A*11:01 (PHLA-A-Combined=4.84x10⁻⁷; OR=0.48; 95% CI=0.36-0.64). The
association did not reach genome-wide significance. All HLA-A SNPs were derived
from our HLA-A genotyping data referencing HLA-A allele sequences of the NCBI
dbMHC database. A total of 187 bi-allelic and 18 multi-allelic SNPs were found on the
HLA-A gene, with 31 bi-allelic SNPs and 5 multi-allelic SNPs reaching genome-wide
thresholds (PSNP-Combined <5.0x10⁻⁸) (Figure 4.5; Appendix C-D).
In order to test the independence of HLA-A single SNPs from the effects of
HLA-A alleles, association signals of both HLA-A significant single SNPs and the 3
most prominent HLA-A alleles (HLA-A*02:06, HLA-A*02:07 and HLA-A*11:01) were
conditioned against each other (Appendix E-F). Controlling for HLA-A*02:06 and
HLA-A*02:07 only saw marginal reduction in strength of association for HLA-A
significant single SNPs (Padjusted_ A*02:06 range from 10-9-10-4; Padjusted_ A*02:07 range from
10-7-10-2) but controlling for HLA-A*11:01 saw a distinct reduction (Padjusted_ A*11:01
range from 10-4-10-1) (Appendix E). A similar trend was observed when HLA-A*11:01
was designated as the index allele, conditioned against all HLA-A significant single
SNPs (PA*11:01 4.84x10⁻⁷; extreme PA*11:01_index 10-3-10-1) showing a reduction in
association strength (Appendix F). The results indicate that HLA-A single SNP is
correlated to HLA-A*11:01, and to a lesser extent HLA-A*02:06 and HLA-A*02:07.

64
Table 4.3: Association of HLA-A alleles to NPC in Malaysian Chinese.
No HLA-A CHR Sample set Case Control P-val OR (95% CI)
alleles Carrier Frequency Carrier Frequency
1 A*01:01 6 Cohort 1 (GWAS) 0.003 0.011 2.11E-01 0.24 (0.03-2.23)
Cohort 2 0.008 0.006 1.87E-01 3.47 (0.55-21.99) Combined 0.006 0.008 8.16E-01 0.86 (0.23-3.17)
2 A*02:01 6 Cohort 1 (GWAS) 0.099 0.069 2.11E-01 1.49 (0.8-2.79)
Cohort 2 0.068 0.088 5.48E-01 0.83 (0.45-1.52) Combined 0.081 0.079 7.47E-01 1.07 (0.7-1.65)
3 A*02:03 6 Cohort 1 (GWAS) 0.082 0.088 9.44E-01 1.02 (0.55-1.91)
Cohort 2 0.076 0.074 5.14E-01 0.81 (0.43-1.53) Combined 0.079 0.081 6.99E-01 0.92 (0.59-1.43)
4 A*02:06 6 Cohort 1 (GWAS) 0.031 0.022 1.66E-01 2.15 (0.73-6.34)
Cohort 2 0.039 0.008 2.02E-02 4.98 (1.29-19.3) Combined 0.036 0.015 6.22E-03 3.14 (1.38-7.14)
5 A*02:07 6 Cohort 1 (GWAS) 0.165 0.093 4.28E-03 2.11 (1.26-3.51)
Cohort 2 0.206 0.113 1.60E-02 1.71 (1.11-2.63) Combined 0.189 0.103 7.71E-05 1.94 (1.4-2.69)
6 A*02:10 6 Cohort 1 (GWAS) 0.000 0.000 1.00E+00 #N/A
Cohort 2 0.000 0.006 9.99E-01 #N/A
Combined 0.000 0.003 9.99E-01 #N/A
7 A*02:18 6 Cohort 1 (GWAS) 0.006 0.000 9.99E-01 #N/A
Cohort 2 0.000 0.000 1.00E+00 #N/A Combined 0.002 0.000 9.99E-01 #N/A
8 A*03:01 6 Cohort 1 (GWAS) 0.003 0.002 4.35E-01 4.19 (0.12-152.4)
Cohort 2 0.004 0.006 6.41E-01 0.57 (0.05-6.2) Combined 0.004 0.004 9.29E-01 1.09 (0.17-6.9)
9 A*03:02 6 Cohort 1 (GWAS) 0.000 0.000 1.00E+00 #N/A
Cohort 2 0.002 0.000 9.99E-01 #N/A Combined 0.001 0.000 9.99E-01 #N/A
10 A*11:01 6 Cohort 1 (GWAS) 0.190 0.300 1.20E-04 0.46 (0.3-0.68)
Cohort 2 0.202 0.297 1.32E-03 0.51 (0.34-0.77) Combined 0.197 0.298 4.84E-07 0.48 (0.36-0.64)
11 A*11:02 6 Cohort 1 (GWAS) 0.023 0.052 5.92E-02 0.39 (0.15-1.04)
Cohort 2 0.041 0.043 7.69E-01 1.15 (0.45-2.9) Combined 0.033 0.047 2.05E-01 0.66 (0.35-1.26)
12 A*24:02 6 Cohort 1 (GWAS) 0.170 0.149 7.65E-01 1.08 (0.67-1.73)
Cohort 2 0.158 0.121 5.40E-01 1.16 (0.72-1.89) Combined 0.163 0.134 5.10E-01 1.12 (0.8-1.57)
13 A*24:03 6 Cohort 1 (GWAS) 0.000 0.000 1.00E+00 #N/A
Cohort 2 0.002 0.000 9.99E-01 #N/A Combined 0.001 0.000 9.99E-01 #N/A
14 A*24:07 6 Cohort 1 (GWAS) 0.009 0.009 9.49E-01 0.94 (0.14-6.36)
Cohort 2 0.002 0.000 9.99E-01 #N/A Combined 0.005 0.004 8.10E-01 1.24 (0.22-7.1)
15 A*24:08 6 Cohort 1 (GWAS) 0.003 0.000 9.99E-01 #N/A
Cohort 2 0.000 0.000 NA #N/A Combined 0.001 0.000 9.99E-01 #N/A
16 A*24:10 6 Cohort 1 (GWAS) 0.000 0.002 9.99E-01 #N/A
Cohort 2 0.000 0.004 9.99E-01 #N/A Combined 0.000 0.003 9.99E-01 #N/A
17 A*24:20 6 Cohort 1 (GWAS) 0.006 0.004 9.75E-01 0.96 (0.06-14.59) Cohort 2 0.004 0.002 3.82E-01 9.06 (0.06-1267)
Combined 0.005 0.003 6.37E-01 1.7 (0.19-15.3)
18 A*26:01 6 Cohort 1 (GWAS) 0.023 0.024 6.06E-01 0.76 (0.26-2.18) Cohort 2 0.033 0.016 3.25E-02 3.14 (1.1-8.95)
Combined 0.029 0.020 2.20E-01 1.58 (0.76-3.26)
19 A*29:01 6 Cohort 1 (GWAS) 0.009 0.002 4.65E-01 3.03 (0.16-58.96)
Cohort 2 0.000 0.018 9.98E-01 #N/A
Combined 0.004 0.011 3.37E-01 0.44 (0.08-2.34)
20 A*30:01 6 Cohort 1 (GWAS) 0.009 0.009 7.71E-01 0.78 (0.15-4.09) Cohort 2 0.004 0.014 1.26E-01 0.2 (0.02-1.58)
Combined 0.006 0.012 1.79E-01 0.42 (0.12-1.49)
21 A*31:01 6 Cohort 1 (GWAS) 0.003 0.022 1.59E-01 0.2 (0.02-1.86) Cohort 2 0.006 0.008 6.56E-01 1.52 (0.24-9.53)
Combined 0.005 0.015 3.27E-01 0.52 (0.14-1.93)
22 A*32:01 6 Cohort 1 (GWAS) 0.003 0.000 9.99E-01 #N/A Cohort 2 0.000 0.002 9.99E-01 #N/A
Combined 0.001 0.001 8.19E-01 1.44 (0.06-32.48)
23 A*33:03 6 Cohort 1 (GWAS) 0.148 0.121 9.37E-03 2.36 (1.24-4.51) Cohort 2 0.134 0.141 3.48E-01 1.25 (0.78-2)
Combined 0.140 0.131 2.79E-02 1.51 (1.05-2.18)
P-val=Logistic regression additive model P-value adjusting for age, gender and PC1; OR=Odds ratio;
95% CI= 95% confidence interval
Example coding of HLA-A alleles, e.g. A*02:06/A*02:06=1/1; A*02:06/0=1/2; 0/0=2/2
Multiple testing threshold = 2.17x10-03

65
4.1.4 Amino acid variants
This study aimed to identify amino acid variants that are also functional variants
coded by the corresponding HLA-A SNP. HLA-A gene sequence was translated to
identify amino acid variants using NCBI dbMHC database. Corresponding function of
amino acid residues were identified using the Immunology Database and Analysis
Portal (ImmPort) database while functional impact of amino acid/SNP substitutions
were predicted by PROVEAN (Choi et al., 2012), SIFT (Kumar et al., 2009) and
Polyphen-2 (Adzhubei et al., 2010). Out of 364 amino acid residues identified (Figure
4.6, Appendix G-H), 27 amino acid variants were statistically significant after multiple
testing correction (Paa-Combined<1.37x10⁻⁴) (Table 4.4, Appendix I). These amino acid
variants have corresponding bi-allelic and multi-allelic SNPs. PROVEAN (Choi et al.,
2012), SIFT (Kumar et al., 2009) and Polyphen-2 (Adzhubei et al., 2010) only
predicted HLA-A-aa-site-99 (Paa-Combined=3.79x10⁻⁸; ORAA99-Tyr/Cys=2.19; 95% CIAA99-
Tyr/Cys=1.66-2.89; ORAA99-Tyr/Phe=1.40; 95% CIAA99-Tyr/Phe=1.09-1.82) and HLA-A-aa-
site-145 (Paa-Combined=1.41x10⁻⁴; ORAA145-Arg/His=1.64; 95% CIAA145-Arg/His=1.27-2.12) to
be deleterious or damaging variants (Table 4.4, Appendix G-I). The corresponding SNP
for HLA-A-aa-site-99 is rs1136697 (PSNP-Combined=3.79x10⁻⁸ ; ORrs1136697-A/G=2.19; 95%
CIrs1136697-A/G=1.66-2.89; ORrs1136697-A/T=1.40; 95% CIrs1136697-A/T=1.09-1.82) and HLA-
A-aa-site-145 is rs1059520 (PSNP-Combined=1.41x10⁻⁴ ; OR=1.64; 95% CI=1.27-2.12).
The HLA-A-99Tyr reference amino acid tyrosine (Tyr, Y) is substituted for cysteine
(Cys, C) when rs1136697-A is substituted for G. The HLA-A-145Arg reference amino
acid arginine (Arg, R) is substituted for histidine when rs1059520-G is substituted for –
A. The remaining amino acid variants, though showing association signals in both
amino acid and SNP variants were benign or tolerated variants (Table 4.4, Appendix I).
To establish if the association of HLA-A-99 and HLA-A-145 is independent or due to
LD with HLA-A alleles, logistic regression controlling for effects of HLA-A*02:07 was

66
done. This is because HLA-A-99, HLA-A-145 and HLA-A*02:07 show a susceptible
genetic effect. Controlling for HLA-A*02:07 reduced the effects of HLA-A-99Tyr/Cys
and rs1136697-A/G (Padjusted=1) and HLA-A-145Arg/His and rs1059520
(Padjusted=8.04x10⁻²) and vice versa (Appendix E-F, Appendix J-K). These results
indicated that effects of HLA-A-99Tyr/Cys and HLA-A-145Arg/His to be driven by
and correlated with HLA-A*02:07.
4.1.5 Regulatory functions of NPC associated HLA-A SNP variants
HaploReg was used to predict potential epigenetic signatures in the NPC
associated HLA-A SNP variants. The search only focused on 5’-UTR region of the
HLA-A. Epigenetic data was limited to those of the B-cell lymphoblastoid cell lines as
we focus on epigenetic signatures related to immune-response function. HaploReg data
indicated that rs9260067, rs9260072, rs9260077, rs41545520, rs9260120 and
rs114945359 may regulate transcription of HLA-A as the SNP variants intersect histone
modification sites and/or DNase I hypersensitivity sites, suggesting promoter or
enhancer activity. The variants also influence binding of transcription factors and/or a
regulatory motif (Table 4.5). The 6 SNPs with potential epigenetic function are
correlated with HLA-A*11:01. Controlling for effects of HLA-A*11:01 diminished the
association of the 6 SNPs (extreme Padjusted_ A*11:01 10-3-10-2) (Appendix E). The
association of HLA-A*11:01 also diminished after controlling against effects of the 6
SNPs (PA*11:01_unadjusted 4.63x10⁻⁷; extreme PA*11:01_index 10-1) (Appendix F).
SNP rs41545520 is of particular interest as it influence change in strength of
motif binding for activating transcription factor 3 (ATF3). ATF3 binds the cAMP
response element (CRE), repressing transcription by stabilizing the binding of inhibitory
cofactors at the promoter (Gilchrist et al., 2006). Genotype data of rs41545520 was
corroborated with eQTL data from Genevar Database to investigate effects of SNP
67
genotypes on HLA-A expression. Though not listed in the Genevar Database,
rs41545520 is tightly linked to rs2860580 (r2=0.84). The eQTL expression profiles of
rs2860580 is more consistent with HaploReg predictions of strengthened motif binding
for repressor ATF3 in reference allele rs41545520-G (rs2860580-G), resulting in lower
HLA-A expression. The alternate allele rs41545520-T (rs2860580-A) shows weakened
binding of ATF3, resulting in higher HLA-A expression (Table 4.5; Figure 4.7).
rs41545520-T also defines HLA-A*11:01, with the higher HLA-A*11:01 expression
implying a protective effect towards NPC. The epigenetic influence of rs9260077 is not
discussed as the predicted transcription factor, HDAC2, does not directly bind DNA but
is tethered against other transcription factors (Ropero & Esteller, 2010), thus strength of
motif binding is not directly influenced by change in rs9260077 alleles. Further
examination in NPC cell lines to replicate effects of HLA-A 5’-UTR SNP variants on
transcriptional regulation and gene expression would be necessary.
4.1.6 Association signals from previous NPC GWAS studies
Previously reported association signals from Ng et al. 2009a, Tse et al. 2009,
Bei et al. 2010 and Tang et al. 2012 were genotyped (Appendix L). Our results
replicated the associations reported in the HLA-A region (including adjacent GABBR1,
HLA-F and HCG9). Controlling for HLA-A*11:01 reduced the association strength of
GABBR1, HLA-F, HLA-A and HCG9 where the extreme NPC association is reduced
from 1.73x10⁻⁹-0.01 to 1.0x10⁻⁴-0.51 (Appendix E). The association of HLA-A*11:01
also diminished after controlling against effects of the NPC SNPs (PA*11:01 4.84x10-
7;extreme PA*11:01_index 10-1) (Appendix F). The results suggest the HLA-A region
association signals from previous NPC reports to be correlated with the effects of HLA-
A*11:01.

68
Figure 4.6: NPC association plot of amino acid variants mapped from HLA-A alleles. The false positive rates are expressed in –log10 Paa-Combined (y-
axis) according to the HLA-A amino acid residue position (x-axis). Coloured markers signify corresponding function of amino acid positions, be it for
β2-microglobulin binding, CD8 receptor binding, T-cell receptor binding, Natural killer cell receptor binding KIR3DL or antigenic peptide binding
pocket A-F; red line signifies multiple testing threshold 1.37x10⁻⁴.

69
SNP rs2860580
Reference allele : G
Variant allele : A
Major allele : G LD r2=0.84 with rs41545520-G ATF3 LOD 11.6
Minor allele : A LD r2=0.84 with rs41545520-T ATF3 LOD 8.6
Ensemble Gene ID : ENSG00000206503
Gene Name : HLA-A
Figure 4.7: GeneVar eQTL analysis of HLA-A flanking SNP rs41545520 using MuTHER resource datasets (Nica et al., 2011) as well as
corresponding nuclear factor binding affinity.

70
Table 4.4: HLA-A amino acid variants association and function prediction by PROVEAN, SIFT and Polyphen-2.
No Amino acid Paa-Combined SNP PSNP-Combined Codon Change Residue Change PROVEAN SIFT Polyphen-2
1 AA-15 1.37 x 10⁻⁵ rs1143146 1.37 x 10⁻⁵ C/G Leu>Val Neutral Tol Benign
2 AA9 5.36 x 10⁻⁵ rs1136659 1.46 x 10⁻¹ T/A Phe>Ile Neutral Dmg Benign
rs2075684 6.98 x 10⁻⁶ T/A/C Phe>Tyr/Ser Neutral/Neutral Tol/Tol Benign/Benign
3 AA62 2.10 x 10⁻⁹ rs1059455 3.74 x 10⁻⁵ C/G Gln>Glu Neutral Tol Benign
rs1064588 1.29 x 10⁻⁶ A/G/T Gln>Arg/Leu Neutral/Del Tol/Tol Benign/Benign
4 AA66 5.60 x 10⁻⁵ rs199474436 5.60 x 10⁻⁵ T/A Asn>Lys Neutral Tol Benign
5 AA70 3.01 x 10⁻⁸ rs78306866 3.01 x 10⁻⁸ G/C Gln>His Neutral Tol Benign
6 AA74 2.20 x 10⁻⁴ rs1136683 2.20 x 10⁻⁴ G/C Asp>His Neutral Tol Pos Dmg
7 AA90 7.73 x 10⁻⁷ rs1136692 7.73 x 10⁻⁷ C/A Ala>Asp Del Tol Benign
8 AA95 1.21E-07 rs1071743 1.21 x 10⁻⁷ A/C/G Ile>Leu/Val Neutral/Neutral Tol/Tol Benign/Benign
9 AA97 2.44 x 10⁻⁹ rs199474485 4.65 x 10⁻⁵ T/G Ile>Arg Neutral Tol Benign
rs1136695 1.95 x 10⁻⁸ A/G Ile>Met Neutral Tol Benign
10 AA99 3.79 x 10⁻⁸ rs1136697 3.79 x 10⁻⁸ A/G/T Tyr>Cys/Phe Del/Del Dmg/Tol Prob Dmg/Benign
11 AA105 7.06 x 10⁻⁷ rs1136700 7.06 x 10⁻⁷ T/C Ser>Pro Neutral Tol Benign
12 AA107 9.61 x 10⁻⁵ rs1136702 9.61 x 10⁻⁵ G/T Gly>Trp Del Tol Prob Dmg
13 AA114 2.78 x 10⁻⁹ rs3173420 4.60 x 10⁻⁸ G/A Arg>Gln Neutral Tol Pos Dmg
rs12721717 7.00 x 10⁻⁸ G/A/C Arg Neutral/Neutral Tol/Tol N/A
14 AA116 7.00 x 10⁻⁸ rs3173419 7.00 x 10⁻⁸ G/C/T Asp>His/Tyr Neutral/Neutral Tol/Tol Benign/Benign
15 AA127 5.24 x 10⁻⁵ rs1059509 5.24 x 10⁻⁵ C/A Asn>Lys Del Tol Benign
16 AA142 1.41 x 10⁻⁴ rs1059516 1.41 x 10⁻⁴ T/C Ile>Thr Del Tol Prob Dmg
17 AA145 1.41 x 10⁻⁴ rs1059520 1.41 x 10⁻⁴ G/A Arg>His Del Tol Prob Dmg
18 AA152 6.64 x 10⁻⁸ rs9256983 6.64 x 10⁻⁸ A/T/C/G Glu>Val/Ala/Gly Neutral/Neutral/Neutral Tol/Tol/Dmg Benign/Benign/Benign
19 AA163 1.66 x 10⁻⁷ rs3129017 2.82 x 10⁻⁷ A/C Thr>Pro Neutral Tol Pos Dmg
rs3129018 2.82 x 10⁻⁷ C/G Thr>Arg Neutral Tol Benign
20 AA184 7.94 x 10⁻⁵ rs1136741 7.94 x 10⁻⁵ C/G Pro>Ala Del Tol Prob Dmg
21 AA193 7.42 x 10⁻⁷ rs1059563 1.09 x 10⁻⁶ C/G Pro>Ala Del Tol Prob Dmg
rs1059564 8.14 x 10⁻⁵ C/G/T Pro Neutral/Neutral Tol/Tol N/A
22 AA194 7.42 x 10⁻⁷ rs9260179 7.42 x 10⁻⁷ A/G Ile>Val Neutral Tol Benign
23 AA207 7.42 x 10⁻⁷ rs9260180 7.42 x 10⁻⁷ G/A Gly>Ser Del Tol Pos Dmg
24 AA253 7.42 x 10⁻⁷ rs2231095 7.42 x 10⁻⁷ G/C Glu>Gln Neutral Tol Pos Dmg
25 AA276 2.11 x 10⁻⁸ rs1136903 1.95 x 10⁻⁸ T/C Leu>Pro Neutral Tol Benign
rs1136917 5.28 x 10⁻¹ G/A Leu Neutral Tol N/A
26 AA294 6.58 x 10⁻⁷ rs3179982 6.58 x 10⁻⁷ C/T Leu>Phe Neutral Tol Prob Dmg

71
Table 4.4, continued.
No Amino acid Paa-Combined SNP PSNP-Combined Codon Change Residue Change PROVEAN SIFT Polyphen-2
27 AA321 1.95 x 10⁻⁸ rs2231119 1.95 x 10⁻⁸ A/T Thr>Ser Neutral Tol Benign
Paa-Combined=amino acid association in combined cohort; PSNP-Combined=SNP association in combined cohort;
Tol=Tolerated, Dmg=Damaging; Del=Deleterious; Prob Dmg= Probably Damaging; Pos Dmg= Possibly damaging
Table 4.5: HaploReg prediction of 5'-UTR HLA-A SNP variants.
CHR SNP Pos b37 Ref Alt
aPromoter
histone
marks
aEnhancer
histone
marks bDNAse cProteins bound dMotifs changed RefSeq genes
6 rs9260067 29908649 T A,C,G None
State 5
Strong
enhancer None None None
1.6kb 5' of
HLA-A
6 rs9260072 29908838 G C None
State 4
Strong
enhancer None None None
1.4kb 5' of
HLA-A
6 rs9260077 29908954 G A None
State 4
Strong
enhancer Present None HDAC2,Pax-5
1.3kb 5' of
HLA-A
6 rs41545520
G>T
29910265 G T State 1
Active
promoter
None Present NFKB,OCT2,POL2,PO
L24H8,POU2F2,RFX5,S
P1,TBP,YY1
ATF3,Duxl,Gfi1,
HNF1,ATF3
RefLOD 11.6; AltLOD 8.6
5' of HLA-A
6 rs9260120 29910277 G C,T State 1
Active
promoter
None Present NFKB,OCT2,POL2,POL
24H8,POU2F2,RFX5,SP1
,TBP,YY1
None 5' of HLA-A
6 rs114945359 29910324 G C State 1
Active
promoter
None Present NFKB,OCT2,POL2,POL
24H8,POU2F2,RFX5,SP1
,TBP,YY1
LF-A1 5' of HLA-A
aRegulatory chromatin states follows the 15-state definition of Ernst et al., 2011 bRegion where chromatin is hypersensitive to Dnase I enzyme cleavage (ENCODE data) cProtein binding regions assayed by ChIP-seq (ENCODE data) dMotif change as predicted by TRANSFAC, JASPAR and protein-binding microarray experiments
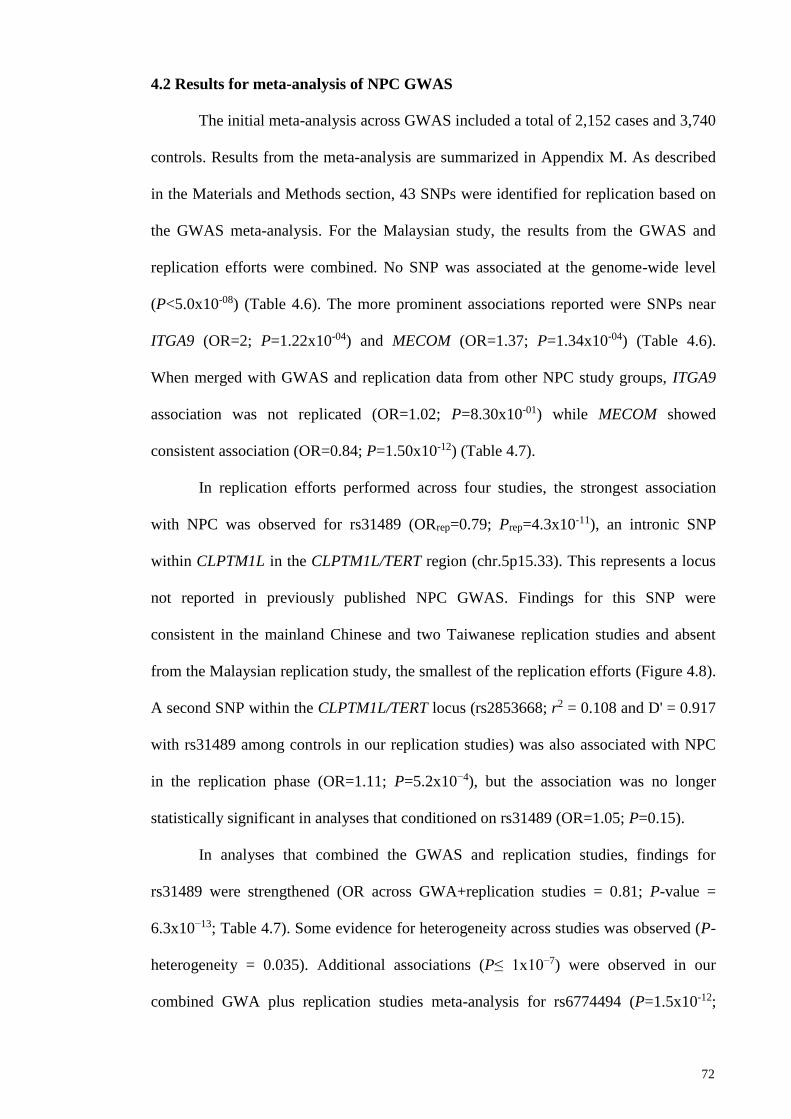
72
4.2 Results for meta-analysis of NPC GWAS
The initial meta-analysis across GWAS included a total of 2,152 cases and 3,740
controls. Results from the meta-analysis are summarized in Appendix M. As described
in the Materials and Methods section, 43 SNPs were identified for replication based on
the GWAS meta-analysis. For the Malaysian study, the results from the GWAS and
replication efforts were combined. No SNP was associated at the genome-wide level
(P<5.0x10-08) (Table 4.6). The more prominent associations reported were SNPs near
ITGA9 (OR=2; P=1.22x10-04) and MECOM (OR=1.37; P=1.34x10-04) (Table 4.6).
When merged with GWAS and replication data from other NPC study groups, ITGA9
association was not replicated (OR=1.02; P=8.30x10-01) while MECOM showed
consistent association (OR=0.84; P=1.50x10⁻¹²) (Table 4.7).
In replication efforts performed across four studies, the strongest association
with NPC was observed for rs31489 (ORrep=0.79; Prep=4.3x10⁻¹¹), an intronic SNP
within CLPTM1L in the CLPTM1L/TERT region (chr.5p15.33). This represents a locus
not reported in previously published NPC GWAS. Findings for this SNP were
consistent in the mainland Chinese and two Taiwanese replication studies and absent
from the Malaysian replication study, the smallest of the replication efforts (Figure 4.8).
A second SNP within the CLPTM1L/TERT locus (rs2853668; r2 = 0.108 and D' = 0.917
with rs31489 among controls in our replication studies) was also associated with NPC
in the replication phase (OR=1.11; P=5.2x10⁻⁴), but the association was no longer
statistically significant in analyses that conditioned on rs31489 (OR=1.05; P=0.15).
In analyses that combined the GWAS and replication studies, findings for
rs31489 were strengthened (OR across GWA+replication studies = 0.81; P-value =
6.3x10⁻¹³; Table 4.7). Some evidence for heterogeneity across studies was observed (P-
heterogeneity = 0.035). Additional associations (P≤ 1x10⁻⁷) were observed in our
combined GWA plus replication studies meta-analysis for rs6774494 (P=1.5x10⁻¹²;

73
MECOM gene region), rs9510787 (P=5.0x10⁻¹⁰; TNFRSF19 gene region), rs1412829,
rs4977756, and rs1063192 (P=2.8x10⁻⁸, P=7.0x10⁻⁷, and P=8.4x10⁻⁷, respectively;
CDKN2A/2B gene region; Table 4.7 and Figure 4.8).

74
Table 4.6: Results for 43 SNPs in Malaysian Chinese combining GWAS and replication samples.
GWAS Replication study Combined
SNP Nearest gene CHR Pos hg19 Selection
criteriaa
MAF
(Ctrls)
Major
allele
Minor
allele OR P OR P OR P
rs31489 CLPTM1L/TERT 5 1342714 2 0.22 C A 1.04 7.55x10-01 1.11 5.09x10-01 1.07 4.96x10-01
rs6774494 MECOM 3 169082633 2 0.36 A G 0.76 1.29x10-02 0.69 4.11x10-03 1.37 1.34x10-04
rs9510787 TNFRSF19 13 24205195 2 0.35 A G 1.23 5.33x10-02 1.04 7.35x10-01 1.14 1.01x10-01
rs1412829 CDKN2A/2B 9 22043926 1 0.11 T C 0.8 1.78x10-01 1.15 4.79x10-01 1.07 5.94x10-01
rs4977756 CDKN2A/2B 9 22068652 1 0.22 A G 0.85 2.02x10-01 1.31 6.76x10-02 1.02 8.13x10-01
rs1063192 CDKN2A/2B 9 22003367 1 0.17 T C 0.89 3.97x10-01 1.1 5.73x10-01 1.03 7.98x10-01
rs2853668 CLPTM1L/TERT 5 1300025 2 0.31 C A 1.09 5.13x10-01 1.02 8.98x10-01 1.05 5.70x10-01
rs3731239 C9orf53,CDKN2A 9 21974218 1 0.13 T C 0.92 5.88x10-01 1.03 8.62x10-01 1.03 7.70x10-01
rs1572072 TNFRSF19 13 24127210 2 0.26 G T 1.02 8.49x10-01 1.15 2.94x10-01 1.08 4.10x10-01
rs3109384 LOC646388 11 40118598 1 0.26 C T 0.9 3.95x10-01 0.84 1.77x10-01 1.15 1.10x10-01
rs9928448 ALDOA,PPP4C 16 30072530 2 0.41 T C 1.05 6.26x10-01 1.14 2.62x10-01 1.09 2.57x10-01
rs10120688 RP11-145E5.4 9 22056499 2 0.28 A G 0.9 3.51x10-01 0.8 7.78x10-02 1.17 6.63x10-01
rs2877822 MUC13 3 124645034 2 0.04 C T 0.72 1.80x10-01 1.58 9.22x10-02 1.03 8.79x10-01
rs6671127 LOC100133029,
GPR177
1 68571220 1 0.37 A C 1.07 5.20x10-01 1.06 6.40x10-01 1.07 4.29x10-01
rs10796139 FRMD4A 10 13892298 1 0.36 A G 0.82 8.72x10-02 0.95 6.65x10-01 1.14 1.26x10-01
rs1331627 NTNG2 9 135091879 1 0.42 C T 0.84 9.95x10-02 0.97 7.56x10-01 1.12 1.63x10-01
rs11672613 C3 19 6705246 1 0.42 T C 0.87 1.91x10-01 0.9 3.58x10-01 1.13 1.12x10-01
rs6468749 YWHAZ 8 102008828 1 0.37 T C 1.04 7.20x10-01 1.17 1.97x10-01 1.1 2.61x10-01
rs12577139 BARX2 11 129301284 2 0.15 C T 0.91 5.51x10-01 0.82 2.44x10-01 1.15 1.98x10-01
rs7119879 BARX2 11 129305687 2 0.16 G A 0.84 2.21x10-01 0.88 4.24x10-01 1.17 1.50x10-01
rs1991007 N/A 5 55968018 1 0.08 C A 1.63 1.16x10-02 0.59 2.10x10-02 1.09 5.76x10-01
rs12570170 HK1 10 70801833 1 0.37 G A 1.13 2.67x10-01 0.94 5.68x10-01 1.04 6.23x10-01
rs2886189 ZBTB16 11 113501655 1 0.3 T C 0.95 6.67x10-01 1.02 8.56x10-01 1.02 8.34x10-01
rs9820110 N/A 3 70469958 1 0.29 G T 1.24 6.61x10-02 1.09 4.74x10-01 1.17 7.04x10-02
rs17801001 EPHA3 3 89414555 1 0.12 A C 1.56 5.69x10-03 0.88 4.75x10-01 1.21 1.15x10-01
rs11209216 LOC100133029,
GPR177
1 68571431 1 0.44 C T 1.05 6.67x10-01 1.06 5.98x10-01 1.05 5.03x10-01
rs6795074 EPHA3 3 89516652 1 0.1 T C 1.36 8.06x10-02 0.7 8.19x10-02 1.02 8.56x10-01
rs9538032 N/A 13 58985847 1 0.25 T C 1.18 1.99x10-01 1.1 4.99x10-01 1.14 1.57x10-01
rs3181088 VCAM1 1 101198708 2 0.11 C T 1.1 5.91x10-01 1.08 6.63x10-01 1.09 4.87x10-01

75
Table 4.6, continued.
GWAS Replication study Combined
SNP Nearest gene CHR Pos hg19 Selection
criteriaa MAF
(Ctrls)
Major
allele
Minor
allele OR P OR P OR P
rs6800118 MIRN138-1,
hsa-mir-138-1
3 44141157 2 0.28 A G 0.99 9.19x10-01 0.72 1.08x10-02 1.16 7.71x10-02
rs7702277 N/A 5 14020756 1 0.12 G T 1.58 3.87x10-03 0.99 9.49x10-01 1.28 3.44x10-02
rs1296284 N/A 5 55934938 1 0.33 G A 1.29 6.84x10-02 1.13 3.14x10-01 1.2 5.12x10-02
rs2802402 ITM2B 13 47685360 1 0.16 C T 0.85 2.30x10-01 1.04 8.01x10-01 1.08 4.64x10-01
rs695207 MIR3134,ROD1 9 114056169 1 0.27 T G 1.14 2.29x10-01 0.89 3.66x10-01 1.02 8.07x10-01
rs189897 ITGA9 3 37518545 2 0.04 A T 2.52 4.13x10-06 1.23 5.15x10-01 2 1.22x10-04
rs2158250 ITGB8 7 20425446 2 0.41 A G 0.97 7.72x10-01 0.92 4.65x10-01 1.06 4.93x10-01
rs1286041 N/A 6 6839192 1 0.17 A G 1.41 1.36x10-02 0.7 2.84x10-02 1.05 6.63x10-01
rs4714505 LOC100130606,
TFEB
6 41648147 1 0.11 C T 0.7 3.79x10-02 1.13 4.99x10-01 1.13 3.16x10-01
rs7014115 ASPH 8 62649567 1 0.12 T G 1.63 3.84x10-03 1.01 9.55x10-01 1.3 3.15x10-02
rs4936612 N/A 11 121203120 1 0.4 A G 0.92 4.30x10-01 0.97 8.01x10-01 1.06 4.50x10-01
rs11637457 AGBL1 15 87572506 1 0.16 C T 0.88 4.21x10-01 1.34 5.17x10-02 1.1 3.97x10-01
rs1324103b N/A 6 93901016 1 0.42 A G 0.84 1.10x10-01 0.75 1.57x10-02 1.25 3.84x10-03
rs9924017 HS3ST4 16 25849321 1 0.36 A G 1.1 4.17x10-05 1.09 4.63x10-01 1.09 2.70x10-01
a1=Selected based on GWAS meta-analysis results; 2= Selected as an additional candidate based on a-priori literature. bReplaced rs6931820 with P=3.47x10-06 in GWAS meta.

76
Table 4.7: Results from GWAS meta-analysis and replication study for 43 SNPs selected for replication (Bei et al., 2016).
GWAS
meta-analysis Replication study Combined
SNP Nearest gene CHR Pos hg19 Selection
criteriaa
MAF
(Ctrls)
Major
allele
Minor
allele OR P OR P OR P
rs31489 CLPTM1L/TERT 5 1342714 2 0.22 C A 0.85 1.80x10-03 0.79 4.30x10⁻¹¹ 0.81 6.30x10⁻¹³
rs6774494 MECOM 3 169082633 2 0.36 A G 0.81 4.00x10-07 0.86 3.40x10-07 0.84 1.50x10⁻¹²
rs9510787 TNFRSF19 13 24205195 2 0.35 A G 1.2 1.90x10-05 1.14 4.10x10-06 1.16 5.00x10⁻¹⁰
rs1412829 CDKN2A/2B 9 22043926 1 0.11 T C 0.72 2.80x10-06 0.85 4.20x10-04 0.8 2.80x10-08
rs4977756 CDKN2A/2B 9 22068652 1 0.22 A G 0.8 9.70x10-06 0.9 2.70x10-03 0.87 7.00x10-07
rs1063192 CDKN2A/2B 9 22003367 1 0.17 T C 0.77 2.40x10-06 0.9 6.00x10-03 0.86 8.40x10-07
rs2853668 CLPTM1L/TERT 5 1300025 2 0.31 C A 1.15 1.70x10-03 1.11 5.20x10-04 1.12 3.60x10-06
rs3731239 C9orf53,CDKN2A 9 21974218 1 0.13 T C 0.77 6.30x10-05 0.87 1.60x10-03 0.84 1.30x10-06
rs1572072 TNFRSF19 13 24127210 2 0.26 G T 0.89 1.3x10-02 0.92 1.10x10-02 0.91 4.80x10-04
rs3109384 LOC646388 11 40118598 1 0.26 C T 0.83 3.30x10-05 0.93 1.80x10-02 0.89 1.60x10-05
rs9928448 ALDOA,PPP4C 16 30072530 2 0.41 T C 1.17 1.50x10-04 1.07 2.40x10-02 1.1 6.50x10-05
rs10120688 RP11-145E5.4 9 22056499 2 0.28 A G 0.84 1.80x10-04 0.94 4.30x10-02 0.91 1.50x10-04
rs2877822 MUC13 3 124645034 2 0.04 C T 0.68 1.10x10-04 1.14 5.40x10-02 0.96 5.20x10-01
rs6671127 LOC100133029,
GPR177
1 68571220 1 0.37 A C 1.2 1.60x10-05 1.05 8.50x10-02 1.1 1.20x10-04
rs10796139 FRMD4A 10 13892298 1 0.36 A G 0.82 1.30x10-05 0.96 1.20x10-01 0.91 2.10x10-04
rs1331627 NTNG2 9 135091879 1 0.42 C T 0.84 4.70x10-05 1.04 1.30x10-01 0.98 2.90x10-01
rs11672613 C3 19 6705246 1 0.42 T C 0.83 1.10x10-05 0.96 1.50x10-01 0.92 2.40x10-04
rs6468749 YWHAZ 8 102008828 1 0.37 T C 1.21 1.00x10-05 1.04 1.50x10-01 1.09 2.20x10-04
rs12577139 BARX2 11 129301284 2 0.15 C T 0.84 2.10x10-03 1.06 1.50x10-01 0.98 5.70x10-01
rs7119879 BARX2 11 129305687 2 0.16 G A 0.84 1.60x10-03 1.05 1.90x10-01 0.98 4.80x10-01
rs1991007 N/A 5 55968018 1 0.08 C A 1.38 2.50x10-05 1.05 3.20x10-01 1.15 1.30x10-03
rs12570170 HK1 10 70801833 1 0.37 G A 1.19 5.30x10-05 1.03 3.50x10-01 1.08 2.10x10-03
rs2886189 ZBTB16 11 113501655 1 0.3 T C 0.83 4.30x10-05 0.97 3.80x10-01 0.93 2.40x10-03
rs9820110 N/A 3 70469958 1 0.29 G T 1.24 2.60x10-06 1.03 3.80x10-01 1.09 7.10x10-04
rs17801001 EPHA3 3 89414555 1 0.12 A C 1.32 7.70x10-06 1.03 4.40x10-01 1.11 1.70x10-03
rs11209216 LOC100133029,
GPR177
1 68571431 1 0.44 C T 1.18 5.50x10-05 1.02 4.90x10-01 1.07 4.60x10-03
rs6795074 EPHA3 3 89516652 1 0.1 T C 1.38 3.30x10-06 1.03 5.10x10-01 1.13 1.70x10-03
rs9538032 N/A 13 58985847 1 0.25 T C 1.21 5.50x10-05 0.98 5.10x10-01 1.05 8.20x10-02
rs3181088 VCAM1 1 101198708 2 0.11 C T 1.28 2.60x10-04 1.03 5.80x10-01 1.1 1.20x10-02

77
Table 4.7, continued
GWAS
meta-analysis Replication study Combined
SNP Nearest gene CHR Pos hg19 Selection
criteriaa MAF
(Ctrls) Major
allele Minor
allele OR P OR P OR P
rs6800118 MIRN138-1,
hsa-mir-138-1
3 44141157 2 0.28 A G 0.84 1.20x10-04 1.02 6.20x10-01 0.96 8.00x10-02
rs7702277 N/A 5 14020756 1 0.12 G T 1.39 8.00x10-08 0.98 6.60x10-01 1.1 6.50x10-03
rs1296284 N/A 5 55934938 1 0.33 G A 1.21 2.90x10-05 1.01 7.00x10-01 1.07 7.90x10-03
rs2802402 ITM2B 13 47685360 1 0.16 C T 0.77 2.90x10-06 0.99 8.10x10-01 0.91 4.40x10-03
rs695207 MIR3134,ROD1 9 114056169 1 0.27 T G 1.2 7.30x10-05 0.99 8.20x10-01 1.06 3.50x10-02
rs189897 ITGA9 3 37518545 2 0.04 A T N/A N/A 1.02 8.30x10-01 1.02 8.30x10-01
rs2158250 ITGB8 7 20425446 2 0.41 A G 0.86 4.80x10-04 1 8.70x10-01 0.95 3.70x10-02
rs1286041 N/A 6 6839192 1 0.17 A G 1.26 3.10x10-05 1.01 8.90x10-01 1.08 1.40x10-02
rs4714505 LOC100130606,
TFEB
6 41648147 1 0.11 C T 0.71 1.70x10-07 1 9.30x10-01 0.9 4.30x10-03
rs7014115 ASPH 8 62649567 1 0.12 T G 1.33 6.10x10-06 1 9.50x10-01 1.09 1.30x10-02
rs4936612 N/A 11 121203120 1 0.4 A G 0.85 6.30x10-05 1 9.50x10-01 0.95 2.70x10-02
rs11637457 AGBL1 15 87572506 1 0.16 C T 0.8 7.70x10-05 1 9.50x10-01 0.93 3.10x10-02
rs1324103b N/A 6 93901016 1 0.42 A G 0.84 1.40x10-05 1 9.60x10-01 0.94 1.20x10-02
rs9924017 HS3ST4 16 25849321 1 0.36 A G 1.19 4.70x10-05 1 9.70x10-01 1.06 2.20x10-02
a1=Selected based on GWAS meta-analysis results; 2= Selected as an additional candidate based on a-priori literature. bReplaced rs6931820 with P=3.47x10-06 in GWAS meta.

78
A. rs31489 B. rs1063192
P-heterogeneity across studies: 0.035 P-heterogeneity across studies: 0.097
C. rs1412829 D. rs4977756
P-heterogeneity across studies: 0.25 P-heterogeneity across studies: 0.039
Figure 4.8: Individual Study Results from GWAS Meta-Analysis and Replication Studies for Selected SNPs (Bei et al., 2016).

79
E. rs6774494 F. rs9510787
P-heterogeneity across studies: 0.0093 P-heterogeneity across studies: 0.016
Figure 4.8, continued. Individual Study Results from GWAS Meta-Analysis and Replication Studies for Selected SNPs (Bei et al., 2016).

80
4.3 Results for integrated pathway analysis of NPC
4.3.1 GWAS and gene expression data
The PCA indicated that NPC patients and controls were genetically matched,
with minimal evidence of population stratification (Figure 4.9; Figure 4.10). Total of
6,702,151 autosomal SNPs overlapping Illumina HumanHap 550K and Illumina Human
OmniExpress_12 v1.1 were retained post-imputation after quality control measures
were applied (Figure 4.11). SNP association P-values have been adjusted for age,
gender and population structure. Quantile–quantile plot analysis detected a small
inflation factor (λgc) of 1.03, indicating minimal inflation of the genome-wide
association due to population structure (Figure 4.12). Post-imputation SNPs were
mapped to 20,273 genes. Total of 18,905 gene scores were calculated out of 20,273
genes and were used for GSEA. The remaining 1,368 genes were removed either due to
lack of a gene score or were situated in the MHC region. Gene scores calculation have
been adjusted for confounding factors.
Differential gene expression analysis was performed on GSE12452 data (31
nasopharyngeal carcinomas; 10 non-NPC nasopharynx tissues) from a Taiwanese case
control cohort using GEO2R employing a Student’s t-test, adjusted for log2 fold-
change. Total of 21,586 genes were evaluated, of which 5,680 genes showed differential
expression, PGEO2R<0.05. All 21,586 P-values from GEO2R were used as gene level P-
values for GSEA analysis, screening 2,757 pathways across BioCarta, GO, Ingenuity,
KEGG, Panther and Reactome databases.
Pathways identified through joint GWAS and published gene expression data
GSE12452 were replicated in a separate cohort of 10 NPC and 7 non-NPC nasopharynx
tissues (Table 4.8; Table 4.9). Sample details are listed in Table 4.10. Whole genome
gene expression analysis was performed using the Ion AmpliSeq™ Transcriptome
Human Gene Expression Kit. Total of 3,218 genes showing normalized read counts <10

81
were removed from analysis. PCA plot (Figure 4.13), heatmap of sample-to-sample
distance (Figure 4.14) all showed consistent clustering and demarcation of sample
phenotypes. Differential expression analysis for remaining 17,595 genes was performed
in DESeq2, and P-values for genes that form the target replication pathways were used
for GSEA in GSA-SNP.

82
Figure 4.9: PCA plot of HumanOmniExpress_12 v1.1 and HumanHap550K samples after outlier removal. Overlapping SNPs were pruned (r2<0.2)
and first 2 principal components (PC1 vs PC2) plotted. Blue markers signify OMNI chip cases (NPC patients), orange markers signify OMNI chip
controls (healthy controls), black markers signify 550K chip cases (NPC patients) and white markers signify 550K chip controls (healthy controls).
-0.3
-0.2
-0.1
0
0.1
0.2
0.3
-0.1 -0.08 -0.06 -0.04 -0.02 0 0.02 0.04 0.06 0.08 0.1 0.12
PC
2
PC1
OMNI Cases OMNI Controls 550K Cases 550K Controls

83
Figure 4.10: PCA plot of HumanOmniExpress_12 v1.1 and HumanHap550K against Hapmap CHB and JPN samples after outlier removal.
Overlapping SNPs were pruned (r2<0.2) and first 2 principal components plotted. Blue markers signify OMNI chip cases (NPC patients), orange
markers signify OMNI chip controls (healthy controls), black markers signify 550K chip cases (NPC patients), white markers signify 550K chip
controls (healthy controls), green markers signify Hapmap Chinese Han Beijing samples and red markers signify Hapmap Japanese samples.
-0.2
-0.15
-0.1
-0.05
0
0.05
0.1
0.15
0.2
-0.15 -0.13 -0.11 -0.09 -0.07 -0.05 -0.03 -0.01 0.01 0.03 0.05
PC
2
PC1
OMNI Cases OMNI Controls 550K Cases 550K Controls Hapmap CHB Hapmap JPT

84
Figure 4.11: Manhattan plot of HumanOmniExpress_12 v1.1, HumanHap550K and all imputated SNPs. Only SNPs showing P<0.01 are shown. The
blue line marks suggestive association (P<1.0x10⁻⁵) while the red line marks the genome-wide association (P<5.0x10⁻⁸).

85
Figure 4.12: QQ plot of merged HumanOmniExpress_12 v1.1 and HumanHap550K post imputation. Red markers signify unadjusted P-values and
blue markers signify adjusted P-values. Genomic inflation factor λgc=1.03

86
Figure 4.13: PCA plot. The 10 NPC and 7 non-NPC tissues clustered across their first
two principal components based on regularized log (rlog) of expression data from Ion
AmpliSeq™ Transcriptome Human Gene Expression Kit.
Figure 4.14: Sample-to-sample distances. Heatmap showing the Euclidean distances
between the samples as calculated from the regularized log transformation count data
from Ion AmpliSeq™ Transcriptome Human Gene Expression Kit.
-30
-20
-10
0
10
20
30
40
50
60
-60 -10 40 90
PC
2
PC1
non-NPC
NPC

87
Table 4.8: Pathways associated with NPC in a Malaysian Chinese cohort.
DATABASE GENE SET # GENE aMAGENTA
GSEA
bGSA-SNP
GSEA
cPCombined dPBonf-Combined eAmpliSeq
GSEA
Gene Ontology Axonemal dynein complex 12 0.0198 1.27x10⁻²⁴ 1.50x10⁻²⁴ 4.15x10⁻²¹ 6.56x10⁻⁴
Gene Ontology Chromosome, centromeric region 46 0.0235 3.54x10⁻⁸ 1.82x10⁻⁸ 5.02x10⁻⁵ 0.95
aNominal GSEA calculated by MAGENTA bNominal GSEA calculated by GSA-SNP cCombination P-values of nominal MAGENTA and GSA-SNP P-values using Fisher’s method dBonferroni corrected combination P-values eGSEA of DESeq2 FDR-corrected Wald test P-values from AmpliSeq data
Table 4.9: List of genes in pathways associated with NPC.
GENE SET # GENE ENTREZ
GENE ID GENE aMAGENTA
PVAL
bGEO2R cLog2FC
GEO2R
dAmpliSeq
PVAL
eLog2FC
AmpliSeq
Axonemal dynein complex 12 1767 DNAH5 1.30x10⁻² 3.07x10⁻⁷ -2.64 1.28x10⁻⁶ -2.82
1769 DNAH8 8.22x10⁻¹ 7.4X10⁻¹ -0.05 2.08x10⁻² -2.14
1770 DNAH9 3.80x10⁻² 6.79X10⁻⁸ -2.16 5.60x10⁻⁶ -3.59
7802 DNALI1 4.23x10⁻¹ 4.24X10⁻⁹ -3.05 4.31x10⁻²⁴ -5.60
8632 DNAH17 3.74x10⁻¹ 3.34X10⁻¹ -0.11 3.81x10⁻⁴ 2.51
8701 DNAH11 4.37x10⁻¹ 5.37X10⁻⁶ -0.64 2.52x10⁻⁴ -2.31
10126 DNAL4 6.03X10⁻¹ 7.65X10⁻³ -0.45 3.05x10⁻¹ 0.35
25981 DNAH1 9.07X10⁻¹ 3.14X10⁻⁷ -0.59 3.66x10⁻⁵ -1.83
55567 DNAH3 4.85X10⁻² 2.82X10⁻⁸ -0.99 2.84x10⁻⁶ -4.40
56171 DNAH7 1.62X10⁻¹ 1.83X10⁻⁷ -1.72 1.19x10⁻⁵ -3.33
64446 DNAI2 4.64X10⁻¹ 3.04X10⁻⁷ -2.48 1.96x10⁻¹⁶ -6.81
146754 DNAH2 2.65X10⁻¹ 1.11X10⁻⁷ -1.88 4.81x10⁻⁵ -3.93

88
Table 4.9, continued.
GENE SET # GENE ENTREZ
GENE ID GENE aMAGENTA
PVAL
bGEO2R cLog2FC
GEO2R
dAmpliSeq
PVAL
eLog2FC
AmpliSeq Chromosomal, centromeric region 46 332 BIRC5 1.38X10⁻² 1.05x10⁻⁵ 1.56 1.39x10⁻⁴ 1.58
1058 CENPA 8.96X10⁻¹ 1.68x10⁻⁴ 1.27 5.78x10⁻⁴ 1.46
1059 CENPB 5.82X10⁻¹ 3.96x10⁻² 0.22 3.70x10⁻¹ 0.27
1062 CENPE 7.34X10⁻¹ 4.25x10⁻⁵ 1.18 3.21x10⁻² 1.17
1063 CENPF 6.65X10⁻¹ 3.73x10⁻⁶ 1.51 1.14x10⁻⁴ 1.66
2491 CENPI N/A 3.97x10⁻⁴ 0.83 1.06x10⁻³ 1.28
3070 HELLS 3.17X10⁻¹ 7.11x10⁻⁸ 2 6.98x10⁻⁴ 1.13
3619 INCENP 8.51X10⁻¹ 2.76x10⁻¹ -0.1 4.63x10⁻¹ 0.26
4288 MKI67 1.27X10⁻¹ 2.79x10⁻⁵ 0.94 3.29x10⁻² 1.06
5515 PPP2CA 6.48X10⁻¹ 4.14x10⁻¹ 0.20 4.40x10⁻¹ 0.31
5516 PPP2CB 8.28X10⁻¹ 1.22x10⁻¹ -0.22 1.35x10⁻¹ 0.45
5518 PPP2R1A 4.54X10⁻¹ 7.12x10⁻¹ -0.08 5.43x10⁻¹ 0.15
5525 PPP2R5A 7.31X10⁻¹ 2.41x10⁻³ -0.55 6.88x10⁻⁵ -1.12
5527 PPP2R5C 1.38X10⁻¹ 7.45x10⁻² -0.54 1.26x10⁻⁶ -1.49
5663 PSEN1 7.42X10⁻² 1.00x10⁻¹ -0.13 2.53x10⁻¹ -0.27
6839 SUV39H1 N/A 5.37x10⁻¹ 0.08 5.09x10⁻² 0.45
8690 JRKL 7.10X10⁻¹ 1.16x10⁻¹ -0.14 8.26x10⁻¹ -0.09
10403 NDC80 5.16X10⁻¹ 4.00x10⁻⁶ 1.97 3.09x10⁻² 0.97
10664 CTCF 2.33x10⁻¹ 4.59x10⁻² -0.31 8.95x10⁻² -0.51
10951 CBX1 1.40X10⁻¹ 6.32x10⁻³ 0.82 1.06x10⁻⁷ 2.28
11004 KIF2C 1.81X10⁻¹ 1.19x10⁻⁴ 0.90 1.29x10⁻⁴ 1.57
11339 OIP5 5.11X10⁻¹ 1.87x10⁻⁴ 1.48 3.72x10⁻⁵ 1.82
23421 ITGB3BP 6.04X10⁻¹ 1.89x10⁻⁴ 0.77 3.89x10⁻² 0.78
27309 ZNF330 6.76X10⁻¹ 4.27x10⁻¹ -0.13 3.56x10⁻¹ 0.25
54069 MIS18A 6.65x10⁻¹ 6.51x10⁻⁴ 1.16 2.30x10⁻⁴ 0.83
55143 CDCA8 5.31X10⁻¹ 2.32x10⁻² 0.38 1.79x10⁻³ 1.19
55166 CENPQ 7.77X10⁻¹ 1.40x10⁻³ 0.79 4.77x10⁻² 0.91

89
Table 4.9, continued.
GENE SET # GENE ENTREZ
GENE ID GENE aMAGENTA
PVAL
bGEO2R cLog2FC
GEO2R
dAmpliSeq
PVAL
eLog2FC
AmpliSeq 55320 MIS18BP1 7.29x10⁻¹ 1.23x10⁻² 0.55 1.66x10⁻¹ -0.40
55355 HJURP 3.85X10⁻¹ 1.52x10⁻³ 0.63 6.63x10⁻⁴ 1.33
55920 RCC2 6.02X10⁻¹ 6.13x10⁻³ 0.47 1.74x10⁻³ 1.05
79075 DSCC1 4.31X10⁻¹ 4.95x10⁻⁶ 1.49 1.33x10⁻³ 1.57
79723 SUV39H2 2.83X10⁻² 8.58x10⁻⁴ 1.27 1.73x10⁻⁶ 1.80
81789 TIGD6 4.09X10⁻³ 9.65x10⁻¹ 0.01 8.56x10⁻¹ -0.11
83540 NUF2 1.67X10⁻² 2.75x10⁻⁵ 2.06 1.94x10⁻⁴ 1.47
84948 TIGD5 5.23X10⁻¹ 1.65x10⁻¹ 0.21 4.03x10⁻³ 0.78
91151 TIGD7 3.95X10⁻¹ 5.48x10⁻² -0.56 4.33x10⁻¹ -0.67
91687 CENPL 6.66X10⁻¹ 1.06x10⁻³ 0.65 2.21x10⁻³ 1.13
151246 SGOL2 4.34X10⁻² 3.59x10⁻³ 0.88 1.45x10⁻² 0.82
151648 SGOL1 1.89X10⁻¹ 1.02x10⁻² 0.22 5.26x10⁻⁴ 1.30
166815 TIGD2 5.61X10⁻¹ 1.21x10⁻² 0.64 3.56x10⁻² 0.56
200765 TIGD1 9.12X10⁻¹ 1.29x10⁻¹ 0.61 2.72x10⁻² -0.59
201254 STRA13 4.17X10⁻² 3.00x10⁻¹ 0.27 2.84x10⁻¹ 0.37
201798 TIGD4 6.68X10⁻¹ 1.31x10⁻¹ -0.19 N/A N/A
220359 TIGD3 3.69X10⁻¹ 1.94x10⁻¹ -0.14 4.06x10⁻¹ -0.81
378708 APITD1 5.39X10⁻¹ 6.94x10⁻¹ 0.12 2.97x10⁻¹ 0.48
387103 CENPW 8.99X10⁻¹ 1.04x10⁻² 0.97 1.85x10⁻⁵ 1.71 aGene P-val assigned using best SNP association; 10kb UTR 2kb DTR bGene differential expression calculated by GEO2R (limma package) adjusting for log2 fold change cLog2 fold change calculated in the direction of NPC cases vs non-NPC nasopharynx tissue dGene differential expression calculated by DESeq2 from 10 NPC and 7 non-NPC nasopharynx tissues from a Malaysian cohort eLog2 fold change calculated in the direction of NPC vs non-NPC nasopharynx tissue from a Malaysian cohort

90
Table 4.10: Sample details of NPC and non-NPC nasopharynx tissues from a Malaysian cohort used in gene expression analysis.
Sample ID Phenotype Gender Ethnic group Histology
non-NPC1 non-NPC Male Bajau lymphoid tissue with 40% normal epithelial
non-NPC2 non-NPC Female Other Malaysian lymphoid tissue with 30% epithelial
non-NPC3 non-NPC Female Bajau lymphoid tissue with 20% normal epithelial
non-NPC4 non-NPC Female Kadazan Dusun lymphoid tissue with 30% epithelial
non-NPC5 non-NPC Male Indian lymphoid tissue with 20% epithelial
non-NPC6 non-NPC Female Malay lymphoid tissue with 20% epithelial
non-NPC7 non-NPC Male Malay lymphoid tissue with 40% epithelial
NPC1 NPC Male Other Malaysian 80% cancer cells
NPC2 NPC Male Bajau 80% cancer cells
NPC3 NPC Female Kadazan Dusun 80% cancer cells
NPC4 NPC Male Kadazan Dusun 80-90% cancer cells
NPC5 NPC Female Other Malaysian 80% cancer cells
NPC6 NPC Male Other Malaysian 80-90% cancer cells
NPC7 NPC Female Kadazan Dusun 80% cancer cells
NPC8 NPC Male Kadazan Dusun 90% cancer cells
NPC9 NPC Male Malay 90% cancer cells
NPC10 NPC Male Chinese laser-captured microdissection

91
4.3.2 GWAS and Gene Expression Pathway analysis
For GSEA of both GWAS and gene expression data, 2,757 pathways was
screened with gene sizes of 10-100 genes across BioCarta, GO, Ingenuity, KEGG,
Panther and Reactome databases. GSEA of GWAS data in MAGENTA identified 92
pathways associated with NPC, showing nominal PGWAS-GSEA<0.05 (Appendix N).
GSEA of gene expression data in GSA-SNP identified 312 pathways associated with
NPC, with a similar threshold of nominal PEXPR-GSEA<0.05 (Appendix N). A total of 8
overlapping pathways were identified across the two platforms, assuming the nominal
threshold of P<0.05 (Appendix O). We used Fisher’s method to integrate the GSEA P-
values from GWAS and gene expression data.
Two pathways were identified to be associated with NPC, namely the GO
axonemal dynein complex (PGWAS-GSEA=1.98x10⁻²; Pexp-GSEA=1.27x10⁻²⁴; PCombined-
FDR=1.38x10⁻²²) and the chromosomal centromic region (PGWAS-GSEA=2.35x10⁻²; Pexp-
GSEA=6.03x10⁻⁹; PCombined-FDR=1.03x10⁻⁵) pathway (Table 4.8; Appendix P). Upon
replication using NPC and non-NPC nasopharynx tissues, only the Gene Ontology (GO)
axonemal dynein complex association was replicated (PAmpliSeq-GSEA=6.56x10⁻⁴) while
the chromosomal centromic region association was not replicated (PAmpliSeq-GSEA=0.95)
(Table 4.8). Of the 12 genes that form this axonemal dynein complex pathway, 2 genes
showed nominal significance in both GWAS and gene expression data with log2 fold-
change ≤ -2, namely DNAH5 (PDNAH5-GWAS=1.30x10⁻²; PDNAH5-exp=3.07x10⁻⁷; log2FC=-
2.64) and DNAH9 (PDNAH9-GWAS=3.8x10⁻²; PDNAH9-exp=6.79x10⁻⁸; log2FC=-2.16) (Table
4.9). The difference in gene expression of DNAH5 and DNAH9 between NPC and non-
NPC nasopharynx tissues was replicated (DESeq2 FDR-corrected Wald test P<0.05,
log2FC≤-2) in our replication cohort (PDNAH5-AmpliSeq=7.75x10⁻⁵, log2FC=-2.44; PDNAH9-
AmpliSeq=4.50x10⁻⁶, log2FC=-3.67) (Table 4.9). These results implicate key genes in the
axonemal dynein complex pathway driving NPC development.

92
CHAPTER 5: DISCUSSION
5.1 Discussion for NPC GWAS study
This study describes a NPC GWAS of the Malaysian Chinese population, with
emphasis on the HLA-A region. NPC GWAS studies to date have consistently
implicated the HLA-A as a strongly associated locus towards NPC (Bei et al., 2010;
Tang et al., 2012; Tse et al., 2009). In this study, strong SNP and amino acid
association signals were detected, driven by both susceptible HLA-A allele HLA-
A*02:07 and protective HLA-A*11:01. Controlling for effects of HLA-A*02:07 reduced
the associations of both damaging variants, HLA-A-99Tyr/Cys-rs1136697-A/G and
HLA-A-145Arg/His-rs1059520 while controlling for effects of HLA-A*11:01 reduced
the associations of HLA-A 5’-UTR SNPs and adjacent GABBR1, HLA-F and HCG9 loci
(Appendix E-F, Appendix J-K). Thus, HLA-A association is largely driven by effects of
HLA-A*02:07 and HLA-A*11:01, with internal and adjacent SNPs and amino acid
variants acting as proxies.
HLA-A alleles display diverse occurrence across different populations. The
HLA-A*02:07 allele shows a frequency ranging from 6% to 13% among Southern Han
Chinese individuals, including those of Hong Kong, Taiwan, Singapore and Malaysia
(González-Galarza et al., 2015). In stark contrast, HLA-A*02:07 is rare in Japan, with
only frequency of less than 1% (González-Galarza et al., 2015). The HLA-A*11:01
allele shows an even more striking contrast between Southern Han Chinese individuals
and Japanese individuals with frequencies of approximately 30% in Southern Han
Chinese while it is reported to be only 5% in the Japanese population (Nakaoka &
Inoue, 2015). As HLA-A alleles are linked to NPC occurrence, its diverse distribution
could be a factor in the distinct distribution of NPC incidence.

93
In our present study, in silico methods of PROVEAN (Choi et al., 2012), SIFT
(Kumar et al., 2009) and Polyphen-2 (Adzhubei et al., 2010) predicted damaging
variants for HLA-A-99Tyr (pocket groove binding) and HLA-A-145Arg (T-cell
receptor binding site). HLA-A-99Tyr is a residue for pocket A, B, C and D binding. The
stability of pocket B is critical as it is the binding groove for anchor position 2 of HLA-
A associated peptides (Matsui et al., 1993). From our study, multi-allelic variants are
observed for HLA-A-aa-site-99, namely HLA-A-99Phe and HLA-A-99Cys. However,
HLA-A-99Phe is predicted to be a benign or tolerated variant (Table 3.4). Thus, the
damaging variant HLA-A-99Cys could possibly be influencing the peptide loading
ability of HLA-A, and subsequently altering the cytotoxic T lymphocyte (CTL)
recognition of the MHC-peptide complex. The stability of cell-mediated immune
responses is also modulated by the T-cell receptors. In HLA-A molecules, the T-cell
receptor acts to bind and stabilize the cytotoxic T-cells-MHC-peptide complex, while
the CTL elicits an apoptotic response to destroy the infected cell (Salter et al., 1990). A
damaging variant on HLA-A-145Arg was detected. It is a T-cell receptor binding site of
the HLA-A molecule. This variant is located in the α3 domain encoded by exon 3 of the
HLA-A gene, the binding site of the CD8 co-receptor (Salter et al., 1990). Despite not
being the main contact point for the CD8 receptor (residue 223-229), it is possible that
mutation in HLA-A-145Arg could de-stabilize the T-cell receptor binding to the MHC-
peptide complex, disrupting the antigen-specific activation. Although HLA-A variants
have been identified to be associated with NPC in this study, the results fail to exclude
the influence of EBV in NPC development. This limitation is because EBV data such as
serology or DNA viral load is not available for our samples.
EBV genotypes have been found to be unique for specific tissue types (Chen et
al., 1996) as well as ethnicity (Zhou et al., 2008). EBV genotypes show distinct BZLF
gene variation in blood and tissue samples (Chen et al., 1996). In Southern China, the

94
type C EBV variant is more prevalent. This variant shows a loss of a BamHI site
between the BamHl Wl* and I1* regions. In addition, an “f” variant harboring an extra
BamHI site in the BamHI F region is also detected (Lung et al., 1990). The type C
variant is less prevalent in non-endemic regions, as observed in NPC cases in Japan
whereby EBV type A is the more prevalent genotype (Zhou et al., 2008). The different
EBV genotypes are speculated to influence NPC development differently. However,
most reports merely document association and correlation. No studies thus far have
reported on how the EBV genotype influences NPC occurrence.
The high SNP exclusion rate from our GWAS could possibly result in lower
power of detection. The excluded SNPs were cross-checked against the National
Human Genome Research Institute (NHGRI) Catalog of Published Genome-Wide
Association Studies (GWAS) Catalog (Welter et al., 2014), the Catalogue of Somatic
Mutations (COSMIC) (Forbes et al., 2011) and the Genetic Association Database
(GAD) (Becker et al., 2004). No previous GWAS and COSMIC loci were found among
our excluded SNPs. As for the GAD database, there were potential NPC associated
genes that were implicated such as ABCB1, GSTM1, MDM2, MMP2, NAT2, NQO1,
TLR10 and TLR4 and these loci were excluded due to low genotyping rate (call rates <
99%) or rare minor alleles (MAF < 1%). In addition, removal of sample outliers
showing abnormal population structure or cryptic relatedness is important to avoid false
positives. Samples of different ethnicity would introduce a bias and skew the SNP
frequencies, affecting the association analysis. Similarly, presence of relatives would
inflate the frequencies of SNP alleles and affect the association analysis as well. In
GWAS studies, the common practice would be to remove all unexpected relatedness,
including 4th and 5th degree relatives. This would minimize the effect of cryptic
relatedness on the association analysis.

95
5.2 Discussion for meta-analysis of NPC GWAS
This study presents results from a meta-analysis of NPC GWAS followed by
replication studies across three regions in Asia. A novel association was observed
within the CLPTM1L/TERT locus. This finding is of note given that SNPs in this region
were reported from GWAS conducted for numerous other cancers, including lung,
bladder, pancreas, testis, and central nervous system (Mocellin et al., 2012). A recent
meta-analysis of 85 studies including over 490,000 subjects that evaluated 67
TERT/CLPTM1L locus polymorphisms and 24 tumor types identified 11 SNPs with
strong cumulative evidence for an association with at least one cancer type. rs31489
was one of these SNPs and was found to have strong cumulative evidence for
association with testicular cancer among Caucasians and moderate cumulative evidence
for association with Asian lung cancer (Mocellin et al., 2012). Furthermore, a review of
the literature identified candidate gene studies (two that evaluated SNPs and a third that
evaluated a microsatellite marker) that reported an association between polymorphisms
within the CLPTM1L/TERT locus and NPC (Fachiroh et al., 2012; Yee Ko et al., 2014;
Zhang et al., 2011). Two of the three SNPs evaluated in these studies are in LD with
rs31489 (rs401681 r2=0.427 in 1 kG ASN and 0.512 in 1 kG CHB; rs402710 r2=0.433
in 1 kG ASN and 0.569 in 1 kG CHB). The third SNP is not in LD with rs31489,
suggesting the possibility for the existence of greater than one independent
susceptibility variant within the CLPTM1L/TERT locus (rs2736098 r2=0.016 in 1 kG
ASN and 0.049 in 1 kG CHB). Our findings in the CLPTM1L/TERT locus gain added
significance given the role of TERT in telomere length regulation (Bellon & Nicot,
2008), the finding that telomerase overexpression is observed in NPC (Cheng et al.,
1998), and that the EBV protein LMP1, a protein frequently expressed in NPC,
activates TERT expression and enhances telomerase activity (Mei et al., 2006; Terrin et
al., 2008). There was evidence for possible heterogeneity in effect observed for rs31489
96
across study populations (Phet=0.035). The evidence for heterogeneity was of marginal
statistical significance and was driven primarily by the two Malaysian studies included
in this study. It is unclear at this time whether our findings reflect true heterogeneity.
This observation deserves further consideration in future studies.
Additional associations (P≤ 1x10⁻⁷) were observed in our combined GWA plus
replication studies meta-analysis for rs6774494 (P=1.5x10⁻¹²; MECOM gene region),
rs9510787 (P=5.0x10⁻¹⁰; TNFRSF19 gene region), rs1412829, rs4977756, and
rs1063192 (P=2.8x10⁻⁸, P=7.0x10⁻⁷, and P=8.4x10⁻⁷, respectively; CDKN2A/2B gene
region; Table 4.3 and Figure 4.1). These associations were previously reported from the
Mainland China NPC GWAS and their potential biological implications discussed (Bei
et al., 2010); the study data provide support for these associations.
Strengths of the study include the fact that it evaluated associations with NPC
across multiple GWAS and the large size of its replication effort. Limitations include
the inability to further investigate potential heterogeneity of effects by exposure status
or geographic/ethnic groups. This study also did not identify functional variants of the
CLPTM1L/TERT locus. This aspect is important considering cells with mutated TERT
promoters have elongated telomeres, with the possibility of promoting immortalization
and tumorigenesis of cancer cells (Chiba et al., 2015). Future studies should explore the
associations reported herein in additional populations with differing ethnic makeup.

97
5.3 Discussion for integrated pathway analysis of NPC
This work reports an integrated approach of investigating pathway associations
towards NPC. Using this study design that combines GWAS and gene expression data,
the joint contributions of genomic variants and differential gene expression towards
NPC development can be identified. Also, focusing on pathway-based associations
removes the need to adhere to strict multiple testing thresholds commonly practiced in
GWAS studies, enabling inclusion of moderate to small effect loci. GSEA was chosen
for pathway analysis of both GWAS and gene expression data to standardize the
pathway analysis methodology and avoid discrepancies brought upon by other pathway
analysis methods. The choice is strongly influenced by MAGENTA and its ability to
account for confounding factors on the association scores of genes for GWAS data, a
feature not available for other GSEA methods (Segre et al., 2010).
GWAS and gene expression data used in this study are from independent
sources. Also, the epigenetic effect is not addressed in this study. These are possible
reasons leading to low concordance of gene association strength and differential gene
expression. Nonetheless, the results identified a link between the axonemal dynein
complex and NPC. This association was also replicated in a separate cohort of NPC and
non-NPC tissues, further strengthening our findings.
Axonemal dynein complex are critical components in the ciliated cells. The
axonemal dynein complex functions in mucociliary clearance, failure of which would
lead to infection in the upper and lower respiratory tract (Palmblad et al., 1984).
Ciliated cells line the upper and lower respiratory tract, the nasopharynx included.
Coordinated movement of the cilia sweeps mucus out of the upper and lower respiratory
tract, acting as a primary defense mechanism of the airways (Knowles & Boucher,
2002). Seeing that NPC is a viral cancer caused by EBV infection as well as
nasopharynx exposure to carcinogens, the implications of impaired mucociliary

98
clearance, in particular in the upper respiratory tract, are highly relevant to NPC.
Two genes grouped under the axonemal dynein complex, namely DNAH5 and
DNAH9 showed consistent association to NPC across both genomic and gene
expression data. DNAH5 codes for a heavy chain of the dynein complex. Mutations in
DNAH5 have been linked to cilia immotility (Olbrich et al., 2002). DNAH9 co-exists
with DNAH5, but is localized in a distal position of the cilia. It also codes for a heavy
chain of the dynein complex and functions to drive beating of the cilia. Both DNAH5
(GEO2R log2FC=-2.64; AmpliSeq log2FC= log2FC=-2.44) and DNAH9 (GEO2R
log2FC=-2.16; AmpliSeq log2FC=-3.67) are lowly expressed in NPC tissues, suggesting
a loss of function. This study was unable to investigate any links of EBV genes to host
gene expression due to lack of EBV genes expression data. In addition, there has been
no previous reports documenting the influence of EBV genes in modulating expression
of axonemal dynein genes.
This study is not without its limitations. The association of the axonemal
dyenein gene set is largely driven by the expression data. In addition, although DNAH5
and DNAH9 are lowly expressed in NPC tissues, there is no data available indicating
direct impairment of cilia function. The results are also unable to identify the main
reason behind the dysregulation of the axonemal dyenein gene set. Other probable
causes include epigenetic signatures, in particular methylation. There is no paired
epigenetic data to corroborate this hypothesis. Likewise, the absence of paired genomic
data also hinders identifying genomic variants that directly correlate with gene
expression, thus implying possible regulatory function.
99
CHAPTER 6: CONCLUSION
The advent of high throughput GWAS studies have accelerated the discovery of
potential susceptible variants in our genome. The amount of data generated is
unprecedented, and have led to better understanding of disease etiology. Despite the
wealth of data available, GWAS studies remains at best, an epidemiological study.
Despite our best efforts, we have yet to translate our findings to the clinic. Correlation
does not imply causation. The challenge remains to identify disease causing genomic
variants with direct consequence to disease. Current limitations include the high cost of
next generation sequencing technologies to enable large scale sequencing of samples,
generating even more detailed maps of our genome. This can be corroborated with other
data, for example transcriptomics, proteomics and epigenomics to construct a more
wholistic representation of the dynamics of disease onset.
In the case of NPC, there is no doubt it displays a multi-factorial etiology. NPC
onset can range from environmental factors such as diet, lifestyle habits, viral infection
or even genetics. The challenge moving forward would be to identify functional variants
of NPC. To unravel the complex etiology of NPC, high throughput platforms will play a
crucial role in accelerating the search for prospective therapeutic candidates. This
coupled with the emergence of machine learning or artificial intelligence will shape the
future direction of cancer research in our never ending quest to understand and combat
cancer.
The antigen presentation mechanism of the HLA-A is a complex process,
instrumented by the peptide loading complex (PLC) that consists of a myriad of
assembly molecules (Purcell & Elliott, 2008). Polymorphisms in the HLA-A gene only
constitute a small portion of the processes involved in HLA-A-peptide presentation. Any
defect in the cascade of processes, starting from the formation of the nascent class I
heavy chain until the final stage of transporting the MHC-peptide complex to the cell

100
surface, would result in a defective MHC-peptide complex. Not forgetting, the EBV
virus through the EBNA-1 is capable of eluding the cells immune-surveillance by
expressing a Gly-Ala repeat sequence, thus preventing its proteosomal breakdown
(Young & Rickinson, 2004). Solving the genetic predisposition of NPC remains a
challenging task. Nevertheless, the plethora of genomic data available would greatly
facilitate exploring the functional basis of NPC development, in particular, the HLA-A
region.
The GWAS meta-analysis and replication effort has identified an additional
susceptibility locus for NPC within the CLPTM1L/TERT region of chromosome
5p15.33 and provides support for several previously reported NPC susceptibility loci.
However, heterogeneity does exists across studies, as evidenced by the lack of
association of the Malaysian NPC loci, ITGA9 in other NPC studies.
The integrated approach of investigating pathway associations towards NPC,
utilizing joint contributions of genomic variants and differential gene expression data.
The results uncovered a pathway with possible influence on NPC development. The
limited concordance between GWAS association data and differential gene expression
levels put forth the challenges of adopting a multi-platform approach in identifying
aberrant or dysregulated pathways in NPC. An eQTL approach analyzing correlation of
genomic variants to gene expression of a common cohort could enhance the resolution
of pathway-based GWAS approaches and enable us to drill down to the key pathways
or genes affecting NPC.

101
REFERENCES
1000 Genomes Project Consortium. (2015). A global reference for human genetic
variation. Nature, 526(7571), 68-74.
Adzhubei, I. A., Schmidt, S., Peshkin, L., Ramensky, V. E., Gerasimova, A., Bork, P., .
. . Sunyaev, S. R. (2010). A method and server for predicting damaging
missense mutations. Nature Methods, 7(4), 248-249.
Al-Sarraf, M., LeBlanc, M., Giri, P. G., Fu, K. K., Cooper, J., Vuong, T., . . . Ensley, J.
F. (1998). Chemoradiotherapy versus radiotherapy in patients with advanced
nasopharyngeal cancer: phase III randomized Intergroup study 0099. Journal of
Clinical Oncology, 16(4), 1310-1317.
Allen, M. D., Young, L. S., & Dawson, C. W. (2005). The Epstein-Barr virus-encoded
LMP2A and LMP2B proteins promote epithelial cell spreading and motility.
Journal of Virology, 79(3), 1789-1802.
Andersson-Anvret, M., Forsby, N., Klein, G., & Henle, W. (1977). Relationship
between the Epstein-Barr virus and undifferentiated nasopharyngeal carcinoma:
correlated nucleic acid hybridization and histopathological examination.
International Journal of Cancer, 20(4), 486-494.
Armstrong, R. W., Armstrong, M. J., Mimi, C. Y., & Henderson, B. E. (1983). Salted
fish and inhalants as risk factors for nasopharyngeal carcinoma in Malaysian
Chinese. Cancer Research, 43(6), 2967-2970.
Ausubel, F. M., Brent, R., Kingston, R. E., Moore, D. D., Seidman, J. G., Smith, J. A.,
& Struhl, K. (1987). Current protocols in molecular biology. New York: Greene
Publication Associates & Wiley-Interscience.
Azizah Abdul Manan, Nor Saleha Ibrahim Tamin, Noor Hashimah Abdullah, Asmah
Zainal Abidin, & Mastulu Wahab. (2016). Malaysian national cancer registry
report 2007-2011. Putrajaya: National Cancer Institute, Ministry of Health,
Malaysia.
Badis, G., Berger, M. F., Philippakis, A. A., Talukder, S., Gehrke, A. R., Jaeger, S. A., .
. . Chen, X. (2009). Diversity and complexity in DNA recognition by
transcription factors. Science, 324(5935), 1720-1723.
Barrett, J. C., Fry, B., Maller, J., & Daly, M. J. (2005). Haploview: analysis and
visualization of LD and haplotype maps. Bioinformatics, 21(2), 263-265.

102
Baujat, B., Audry, H., Bourhis, J., Chan, A. T., Onat, H., Chua, D. T., . . . MAC-NPC
Collaborative Group. (2006). Chemotherapy as an adjunct to radiotherapy in
locally advanced nasopharyngeal carcinoma. Cochrane Database of Systematic
Reviews (4), CD004329.
Becker, K. G., Barnes, K. C., Bright, T. J., & Wang, S. A. (2004). The genetic
association database. Nature Genetics, 36(5), 431-432.
Bei, J. X., Jia, W. H., & Zeng, Y. X. (2012). Familial and large-scale case-control
studies identify genes associated with nasopharyngeal carcinoma. Seminars in
Cancer Biology, 22(2), 96-106.
Bei, J. X., Li, Y., Jia, W. H., Feng, B. J., Zhou, G., Chen, L. Z., . . . Zeng, Y. X. (2010).
A genome-wide association study of nasopharyngeal carcinoma identifies three
new susceptibility loci. Nature Genetics, 42(7), 599-603.
Bei, J. X., Su, W. H., Ng, C. C., Yu, K., Chin, Y. M., Lou, P. J., . . . International
Nasopharyngeal Carcinoma Genetics Working Group. (2016). A GWAS meta-
analysis and replication study identifies a novel locus within CLPTM1L/TERT
associated with nasopharyngeal carcinoma in individuals of Chinese ancestry.
Cancer Epidemiology Biomarkers & Prevention, 25(1), 188-192.
Bellon, M., & Nicot, C. (2008). Regulation of telomerase and telomeres: human tumor
viruses take control. Journal of the National Cancer Institute, 100(2), 98-108.
Ben Chaaben, A., Abaza, H., Douik, H., Chaouch, L., Ayari, F., Ouni, N., . . . Guemira,
F. (2015). Genetic polymorphism of cytochrome P450 2E1 and the risk of
nasopharyngeal carcinoma. Bulletin du Cancer, 102(12), 967-972.
Berger, M. F., Badis, G., Gehrke, A. R., Talukder, S., Philippakis, A. A., Pena-Castillo,
L., . . . Chan, E. T. (2008). Variation in homeodomain DNA binding revealed by
high-resolution analysis of sequence preferences. Cell, 133(7), 1266-1276.
Bernstein, B. E., Stamatoyannopoulos, J. A., Costello, J. F., Ren, B., Milosavljevic, A.,
Meissner, A., . . . Thomson, J. A. (2010). The NIH roadmap epigenomics
mapping consortium. Nature Biotechnology, 28(10), 1045-1048.
Betuel, H., Camoun, M., Colombani, J., Day, N. E., Ellouz, R., & de-The, G. (1975).
The relationship between nasopharyngeal carcinoma and the HL-A system
among Tunisians. International Journal of Cancer, 16(2), 249-254.

103
Birkenbach, M., Tong, X., Bradbury, L. E., Tedder, T. F., & Kieff, E. (1992).
Characterization of an Epstein-Barr virus receptor on human epithelial cells. The
Journal of Experimental Medicine, 176(5), 1405-1414.
Blasco, M. A. (2005). Telomeres and human disease: ageing, cancer and beyond.
Nature Reviews Genetics, 6(8), 611-622.
Boysen, T., Friborg, J., Andersen, A., Poulsen, G. N., Wohlfahrt, J., & Melbye, M.
(2008). The Inuit cancer pattern - the influence of migration. International
Journal of Cancer, 122(11), 2568-2572.
Bray, F., Haugen, M., Moger, T. A., Tretli, S., Aalen, O. O., & Grotmol, T. (2008).
Age-incidence curves of nasopharyngeal carcinoma worldwide: bimodality in
low-risk populations and aetiologic implications. Cancer Epidemiology
Biomarkers & Prevention, 17(9), 2356-2365.
Browning, B. L., & Browning, S. R. (2013). Improving the accuracy and efficiency of
identity-by-descent detection in population data. Genetics, 194(2), 459-471.
Browning, B. L., & Browning, S. R. (2016). Genotype imputation with millions of
reference samples. American Journal of Human Genetics, 98(1), 116-126.
Browning, S. R., & Browning, B. L. (2007). Rapid and accurate haplotype phasing and
missing-data inference for whole-genome association studies by use of localized
haplotype clustering. American Journal of Human Genetics, 81(5), 1084-1097.
Burt, R. D., Vaughan, T. L., McKnight, B., Davis, S., Beckmann, A. M., Smith, A. G., .
. . Berwick, M. (1996). Associations between human leukocyte antigen type and
nasopharyngeal carcinoma in Caucasians in the United States. Cancer
Epidemiology Biomarkers & Prevention, 5(11), 879-887.
Cao, Y., Miao, X. P., Huang, M. Y., Deng, L., Hu, L. F., Ernberg, I., . . . Shao, J. Y.
(2006). Polymorphisms of XRCC1 genes and risk of nasopharyngeal carcinoma
in the Cantonese population. BMC Cancer, 6, 167.
Carlson, C. S., Eberle, M. A., Rieder, M. J., Smith, J. D., Kruglyak, L., & Nickerson, D.
A. (2003). Additional SNPs and linkage-disequilibrium analyses are necessary
for whole-genome association studies in humans. Nature Genetics, 33(4), 518-
521.

104
Chan, J. K. C., Pilch, B. Z., Kuo, T. T., Wenig, B. M., & Lee, A. W. M. (2005).
Tumours of the nasopharynx. In L. Barnes, J. W. Eveson, P. Reichart, & D.
Sidransky (Eds.), Pathology and genetics of head and neck tumours (pp. 85-97).
Lyon: IARC Press.
Chan, S. H., Day, N. E., Kunaratnam, N., Chia, K. B., & Simons, M. J. (1983). HLA
and nasopharyngeal carcinoma in Chinese - a further study. International
Journal of Cancer, 32(2), 171-176.
Chang, C. C., Chow, C. C., Tellier, L. C., Vattikuti, S., Purcell, S. M., & Lee, J. J.
(2015). Second-generation PLINK: rising to the challenge of larger and richer
datasets. Gigascience, 4, 7.
Chang, E. T., & Adami, H. O. (2006). The enigmatic epidemiology of nasopharyngeal
carcinoma. Cancer Epidemiology Biomarkers & Prevention, 15(10), 1765-1777.
Chang, K. P., Hsu, C. L., Chang, Y. L., Tsang, N. M., Chen, C. K., Lee, T. J., . . . Hao,
S. P. (2008). Complementary serum test of antibodies to Epstein-Barr virus
nuclear antigen-1 and early antigen: a possible alternative for primary screening
of nasopharyngeal carcinoma. Oral Oncology, 44(8), 784-792.
Chapman, K., Ferreira, T., Morris, A., Asimit, J., & Zeggini, E. (2011). Defining the
power limits of genome-wide association scan meta-analyses. Genetic
Epidemiology, 35(8), 781-789
Chen, C., Wang, F., Wang, Z., Li, C., Luo, H., Liang, Y., . . . Li, Y. (2013).
Polymorphisms in ERCC1 C8092A predict progression-free survival in
metastatic/recurrent nasopharyngeal carcinoma treated with cisplatin-based
chemotherapy. Cancer Chemotherapy and Pharmacology, 72(2), 315-322.
Chen, C. J., Liang, K. Y., Chang, Y. S., Wang, Y. F., Hsieh, T., Hsu, M. M., . . . Liu, M.
Y. (1990). Multiple risk factors of nasopharyngeal carcinoma: Epstein-Barr
virus, malarial infection, cigarette smoking and familial tendency. Anticancer
Research, 10(2), 547-553.
Chen, D. L., & Huang, T. B. (1997). A case-control study of risk factors of
nasopharyngeal carcinoma. Cancer Letters, 117(1), 17-22.
Chen, H. L., Lung, M. L., Chan, K. H., Griffin, B. E., & Ng, M. H. (1996). Tissue
distribution of Epstein-Barr virus genotypes. Journal of Virology, 70(10), 7301-
7305.

105
Cheng, R. Y., Yuen, P. W., Nicholls, J. M., Zheng, Z., Wei, W., Sham, J. S., . . . Tsao,
S. W. (1998). Telomerase activation in nasopharyngeal carcinomas. British
Journal of Cancer, 77(3), 456-460.
Cheng, Y.-J., Hildesheim, A., Hsu, M.-M., Chen, I.-H., Brinton, L. A., Levine, P. H., . .
. Yang, C.-S. (1999). Cigarette smoking, alcohol consumption and risk of
nasopharyngeal carcinoma in Taiwan. Cancer Causes & Control, 10(3), 201-
207.
Chiang, C. J., Lo, W. C., Yang, Y. W., You, S. L., Chen, C. J., & Lai, M. S. (2016).
Incidence and survival of adult cancer patients in Taiwan, 2002-2012. Journal of
the Formosan Medical Association, 115(12), 1076-1088.
Chiba, K., Johnson, J. Z., Vogan, J. M., Wagner, T., Boyle, J. M., & Hockemeyer, D.
(2015). Cancer-associated TERT promoter mutations abrogate telomerase
silencing. Elife, 4, e07918.
Chin, Y. M., Mushiroda, T., Takahashi, A., Kubo, M., Krishnan, G., Yap, L. F., . . . Ng,
C. C. (2015). HLA-A SNPs and amino acid variants are associated with
nasopharyngeal carcinoma in Malaysian Chinese. International Journal of
Cancer, 136(3), 678-687.
Cho, E.-Y., Hildesheim, A., Chen, C.-J., Hsu, M.-M., Chen, I.-H., Mittl, B. F., . . .
Brinton, L. A. (2003). Nasopharyngeal carcinoma and genetic polymorphisms of
DNA repair enzymes XRCC1 and hOGG1. Cancer Epidemiology Biomarkers &
Prevention, 12(10), 1100-1104.
Choi, Y., Sims, G. E., Murphy, S., Miller, J. R., & Chan, A. P. (2012). Predicting the
functional effect of amino acid substitutions and indels. PLOS ONE, 7(10),
e46688.
Chou, J., Lin, Y. C., Kim, J., You, L., Xu, Z., He, B., & Jablons, D. M. (2008).
Nasopharyngeal carcinoma - review of the molecular mechanisms of
tumorigenesis. Head & Neck, 30(7), 946-963.
Chow, W. H., McLaughlin, J. K., Hrubec, Z., Nam, J. M., & Blot, W. J. (1993).
Tobacco use and nasopharyngeal carcinoma in a cohort of US veterans.
International Journal of Cancer, 55(4), 538-540.
Cohen, J. I., & Lekstrom, K. (1999). Epstein-Barr virus BARF1 protein is dispensable
for B-cell transformation and inhibits alpha interferon secretion from
mononuclear cells. Journal of Virology, 73(9), 7627-7632.

106
Cooper, H. M., Hedges, L. V., & Valentine, J. C. (2009). The handbook of research
synthesis and meta-analysis (2nd ed.). New York: Russell Sage Foundation.
Cui, Q., Feng, Q. S., Mo, H. Y., Sun, J., Xia, Y. F., Zhang, H., . . . Bei, J. X. (2016a).
An extended genome-wide association study identifies novel susceptibility loci
for nasopharyngeal carcinoma. Human Molecular Genetics, 25(16), 3626-3634.
Cui, Q., Zuo, X. Y., Lian, Y. F., Feng, Q. S., Xia, Y. F., He, C. Y., . . . Bei, J. X.
(2016b). Association between XRCC3 Thr241Met polymorphism and
nasopharyngeal carcinoma risk: evidence from a large-scale case-control study
and a meta-analysis. Tumour Biology, 37(11), 14825-14830.
Curado, M. P., Edwards, B., Shin, H. R., Storm, H., Ferlay, J., Heanue, M., & Boyle, P.
(2007). Cancer incidence in five continents (Vol. IX). Lyon: IARC Press.
Daly, M. J., Rioux, J. D., Schaffner, S. F., Hudson, T. J., & Lander, E. S. (2001). High-
resolution haplotype structure in the human genome. Nature Genetics, 29(2),
229-232.
De-Vathaire, F., Sancho-Garner, H., De-Thé, H., Pieddeloup, C., Schwaab, G., Ho, J., . .
. Cachin, Y. (1988). Prognostic value of ebv markers in the clinical management
of nasopharyngeal carcinoma (NPC): A multicenter follow-up study.
International Journal of Cancer, 42(2), 176-181.
Delaneau, O., Howie, B., Cox, A. J., Zagury, J. F., & Marchini, J. (2013a). Haplotype
estimation using sequencing reads. American Journal of Human Genetics, 93(4),
687-696.
Delaneau, O., Zagury, J. F., & Marchini, J. (2013b). Improved whole-chromosome
phasing for disease and population genetic studies. Nature Methods, 10(1), 5-6.
DerSimonian, R., & Laird, N. (1986). Meta-analysis in clinical trials. Controlled
Clinical Trials, 7(3), 177-188.
Devi, B. C., Pisani, P., Tang, T. S., & Parkin, D. M. (2004). High incidence of
nasopharyngeal carcinoma in native people of Sarawak, Borneo Island. Cancer
Epidemiology Biomarkers & Prevention, 13(3), 482-486.
Dimas, A. S., Deutsch, S., Stranger, B. E., Montgomery, S. B., Borel, C., Attar-Cohen,
H., . . . Antonarakis, S. E. (2009). Common regulatory variation impacts gene
expression in a cell type-dependent manner. Science, 325(5945), 1246-1250.

107
Duerr, R. H., Taylor, K. D., Brant, S. R., Rioux, J. D., Silverberg, M. S., Daly, M. J., . .
. Cho, J. H. (2006). A genome-wide association study identifies IL23R as an
inflammatory bowel disease gene. Science, 314(5804), 1461-1463.
Easton, D. F., Pooley, K. A., Dunning, A. M., Pharoah, P. D., Thompson, D., Ballinger,
D. G., . . . Ponder, B. A. (2007). Genome-wide association study identifies novel
breast cancer susceptibility loci. Nature, 447(7148), 1087-1093.
Eby, M. T., Jasmin, A., Kumar, A., Sharma, K., & Chaudhary, P. M. (2000). TAJ, a
novel member of the tumor necrosis factor receptor family, activates the c-Jun
N-terminal kinase pathway and mediates caspase-independent cell death. The
Journal of Biological Chemistry, 275(20), 15336-15342.
Edge, S., Byrd, D. R., Compton, C. C., Fritz, A. G., Greene, F. L., & Trotti, A. (2010).
AJCC cancer staging handbook (Vol. 7). New York: Springer-Verlag.
Eeles, R. A., Kote-Jarai, Z., Giles, G. G., Olama, A. A., Guy, M., Jugurnauth, S. K., . . .
Easton, D. F. (2008). Multiple newly identified loci associated with prostate
cancer susceptibility. Nature Genetics, 40(3), 316-321.
ENCODE Project Consortium (2004). The ENCODE (ENCyclopedia Of DNA
Elements) Project. Science, 306(5696), 636-640.
Evangelou, E., & Ioannidis, J. P. (2013). Meta-analysis methods for genome-wide
association studies and beyond. Nature Reviews Genetics, 14(6), 379-389.
Fachiroh, J., Sangrajrang, S., Johansson, M., Renard, H., Gaborieau, V., Chabrier, A., . .
. McKay, J. D. (2012). Tobacco consumption and genetic susceptibility to
nasopharyngeal carcinoma (NPC) in Thailand. Cancer Causes Control, 23(12),
1995-2002.
Feng, B.-J. (2013). Descriptive, Environmental and Genetic Epidemiology of
Nasopharyngeal Carcinoma. In P. Busson (Ed.), Nasopharyngeal carcinoma:
keys for translational medicine and biology (pp. 23-41). New York, NY:
Springer New York.
Feng, B. J., Huang, W., Shugart, Y. Y., Lee, M. K., Zhang, F., Xia, J. C., . . . Zeng, Y.
X. (2002). Genome-wide scan for familial nasopharyngeal carcinoma reveals
evidence of linkage to chromosome 4. Nature Genetics, 31(4), 395-399.

108
Ferlay, J., Soerjomataram, I., Dikshit, R., Eser, S., Mathers, C., Rebelo, M., . . . Bray, F.
(2015). Cancer incidence and mortality worldwide: sources, methods and major
patterns in GLOBOCAN 2012. International Journal of Cancer, 136(5), 359-
386.
Fisher, R. A. (1925). Statistical methods for research workers. Edinburgh, London:
Oliver and Boyd.
Forbes, S. A., Bindal, N., Bamford, S., Cole, C., Kok, C. Y., Beare, D., . . . Futreal, P.
A. (2011). COSMIC: mining complete cancer genomes in the Catalogue of
Somatic Mutations in Cancer. Nucleic Acids Research, 39, 945-950.
Freimer, N., & Sabatti, C. (2004). The use of pedigree, sib-pair and association studies
of common diseases for genetic mapping and epidemiology. Nature Genetics,
36(10), 1045-1051.
Frenkel, K. (1992). Carcinogen-mediated oxidant formation and oxidative DNA
damage. Pharmacology & Therapeutics, 53(1), 127-166.
Friborg, J. T., Yuan, J. M., Wang, R., Koh, W. P., Lee, H. P., & Yu, M. C. (2007). A
prospective study of tobacco and alcohol use as risk factors for pharyngeal
carcinomas in Singapore Chinese. Cancer, 109(6), 1183-1191.
Fries, K. L., Miller, W. E., & Raab-Traub, N. (1996). Epstein-Barr virus latent
membrane protein 1 blocks p53-mediated apoptosis through the induction of the
A20 gene. Journal of Virology, 70(12), 8653-8659.
Fukuda, M., & Longnecker, R. (2007). Epstein-Barr virus latent membrane protein 2A
mediates transformation through constitutive activation of the Ras/PI3-K/Akt
Pathway. Journal of Virology, 81(17), 9299-9306.
Gao, L. B., Liang, W. B., Xue, H., Rao, L., Pan, X. M., Lv, M. L., . . . Zhang, L. (2009).
Genetic polymorphism of interleukin-16 and risk of nasopharyngeal carcinoma.
Clinica Chimica Acta, 409(1), 132-135.
Garcia-Caballero, A., Rasmussen, J. E., Gaillard, E., Watson, M. J., Olsen, J. C.,
Donaldson, S. H., . . . Tarran, R. (2009). SPLUNC1 regulates airway surface
liquid volume by protecting ENaC from proteolytic cleavage. Proceedings of the
National Academy of Sciences of the United States of America, 106(27), 11412-
11417.
109
Gilchrist, M., Thorsson, V., Li, B., Rust, A. G., Korb, M., Roach, J. C., . . . Aderem, A.
(2006). Systems biology approaches identify ATF3 as a negative regulator of
Toll-like receptor 4. Nature, 441(7090), 173-178.
González-Galarza, F. F., Takeshita, L. Y., Santos, E. J., Kempson, F., Maia, M. H. T.,
Silva, A. L. S. D., ... & Middleton, D. (2014). Allele frequency net 2015 update:
new features for HLA epitopes, KIR and disease and HLA adverse drug reaction
associations. Nucleic Acids Research, 43, 784-788.
Gourzones, C., Busson, P., & Raab-Traub, N. (2013). Epstein-Barr virus and the
pathogenesis of nasopharyngeal carcinomas. In P. Busson (Ed.),
Nasopharyngeal carcinoma: keys for translational medicine and biology (pp.
42-60). New York, NY: Springer New York.
Gruhne, B., Sompallae, R., Marescotti, D., Kamranvar, S. A., Gastaldello, S., &
Masucci, M. G. (2009). The Epstein-Barr virus nuclear antigen-1 promotes
genomic instability via induction of reactive oxygen species. Proceedings of the
National Academy of Sciences of the United States of America, 106(7), 2313-
2318.
Gudmundsson, J., Sulem, P., Manolescu, A., Amundadottir, L. T., Gudbjartsson, D.,
Helgason, A., . . . Stefansson, K. (2007a). Genome-wide association study
identifies a second prostate cancer susceptibility variant at 8q24. Nature
Genetics, 39(5), 631-637.
Gudmundsson, J., Sulem, P., Rafnar, T., Bergthorsson, J. T., Manolescu, A.,
Gudbjartsson, D., . . . Stefansson, K. (2008). Common sequence variants on
2p15 and Xp11.22 confer susceptibility to prostate cancer. Nature Genetics,
40(3), 281-283.
Gudmundsson, J., Sulem, P., Steinthorsdottir, V., Bergthorsson, J. T., Thorleifsson, G.,
Manolescu, A., . . . Stefansson, K. (2007b). Two variants on chromosome 17
confer prostate cancer risk, and the one in TCF2 protects against type 2 diabetes.
Nature Genetics, 39(8), 977-983.
Guo, X., Zeng, Y., Deng, H., Liao, J., Zheng, Y., Li, J., . . . O'Brien, S. J. (2010).
Genetic polymorphisms of CYP2E1, GSTP1, NQO1 and MPO and the risk of
nasopharyngeal carcinoma in a Han Chinese population of southern China. BMC
Research Notes, 3, 212.
Hakonarson, H., Grant, S. F., Bradfield, J. P., Marchand, L., Kim, C. E., Glessner, J. T.,
. . . Polychronakos, C. (2007). A genome-wide association study identifies
KIAA0350 as a type 1 diabetes gene. Nature, 448(7153), 591-594.

110
Hampe, J., Franke, A., Rosenstiel, P., Till, A., Teuber, M., Huse, K., . . . Schreiber, S.
(2007). A genome-wide association scan of nonsynonymous SNPs identifies a
susceptibility variant for Crohn disease in ATG16L1. Nature Genetics, 39(2),
207-211.
Hao, S. P., Tsang, N. M., & Chang, K. P. (2003). Screening nasopharyngeal carcinoma
by detection of the latent membrane protein 1 (LMP-1) gene with
nasopharyngeal swabs. Cancer, 97(8), 1909-1913.
He, J. F., Jia, W. H., Fan, Q., Zhou, X. X., Qin, H. D., Shugart, Y. Y., & Zeng, Y. X.
(2007). Genetic polymorphisms of TLR3 are associated with nasopharyngeal
carcinoma risk in Cantonese population. BMC Cancer, 7, 194.
Helgadottir, A., Thorleifsson, G., Manolescu, A., Gretarsdottir, S., Blondal, T.,
Jonasdottir, A., . . . Stefansson, K. (2007). A common variant on chromosome
9p21 affects the risk of myocardial infarction. Science, 316(5830), 1491-1493.
Herait, P., Tursz, T., Guillard, M. Y., Hanna, K., Lipinski, M., Micheau, C., . . . De The,
G. (1983). HLA-A, -B, and -DR antigens in North African patients with
nasopharyngeal carcinoma. Tissue Antigens, 22(5), 335-341.
Hildesheim, A., Anderson, L. M., Chen, C. J., Cheng, Y. J., Brinton, L. A., Daly, A. K.,
. . . Chhabra, S. K. (1997). CYP2E1 genetic polymorphisms and risk of
nasopharyngeal carcinoma in Taiwan. Journal of the National Cancer Institute,
89(16), 1207-1212.
Hildesheim, A., Apple, R. J., Chen, C.-J., Wang, S. S., Cheng, Y.-J., Klitz, W., . . .
Yang, C.-S. (2002). Association of HLA class I and II alleles and extended
haplotypes with nasopharyngeal carcinoma in Taiwan. Journal of the National
Cancer Institute, 94(23), 1780-1789.
Hildesheim, A., Chen, C. J., Caporaso, N. E., Cheng, Y. J., Hoover, R. N., Hsu, . . .
Yang, C. S. (1995). Cytochrome P4502E1 genetic polymorphisms and risk of
nasopharyngeal carcinoma: results from a case-control study conducted in
Taiwan. Cancer Epidemiology Biomarkers & Prevention, 4(6), 607-610.
Hildesheim, A., & Wang, C. P. (2012). Genetic predisposition factors and
nasopharyngeal carcinoma risk: a review of epidemiological association studies,
2000-2011: Rosetta Stone for NPC: genetics, viral infection, and other
environmental factors. Seminars in Cancer Biology, 22(2), 107-116.
111
Hindorff, L. A., Sethupathy, P., Junkins, H. A., Ramos, E. M., Mehta, J. P., Collins, F.
S., & Manolio, T. A. (2009). Potential etiologic and functional implications of
genome-wide association loci for human diseases and traits. Proceedings of the
National Academy of Sciences of the United States of America, 106(23), 9362-
9367.
Hoggart, C. J., Clark, T. G., De Iorio, M., Whittaker, J. C., & Balding, D. J. (2008).
Genome-wide significance for dense SNP and resequencing data. Genetic
Epidemiology, 32(2), 179-185.
Howie, B., Fuchsberger, C., Stephens, M., Marchini, J., & Abecasis, G. R. (2012). Fast
and accurate genotype imputation in genome-wide association studies through
pre-phasing. Nature Genetics, 44(8), 955-959.
Howie, B., Marchini, J., & Stephens, M. (2011). Genotype imputation with thousands
of genomes. G3 (Bethesda), 1(6), 457-470.
Howie, B. N., Donnelly, P., & Marchini, J. (2009). A flexible and accurate genotype
imputation method for the next generation of genome-wide association studies.
PLOS Genetics, 5(6), e1000529.
Hu, L. F., Qiu, Q. H., Fu, S. M., Sun, D., Magnusson, K., He, B., . . . Ernberg, I. (2008).
A genome-wide scan suggests a susceptibility locus on 5p13 for nasopharyngeal
carcinoma. European Journal of Human Genetics, 16(3), 343-349.
Hu, S., Tamada, K., Ni, J., Vincenz, C., & Chen, L. (1999). Characterization of
TNFRSF19, a novel member of the tumor necrosis factor receptor superfamily.
Genomics, 62(1), 103-107.
Hu, S. P., Day, N. E., Li, D. R., Luben, R. N., Cai, K. L., Ou-Yang, T., . . . Ponder, B.
A. (2005). Further evidence for an HLA-related recessive mutation in
nasopharyngeal carcinoma among the Chinese. British Journal of Cancer, 92(5),
967-970.
Huang, D. P., Ho, H. C., Henle, W., Henle, G., Saw, D., & Lui, M. (1978). Presence of
EBNA in nasopharyngeal carcinoma and control patient tissues related to EBV
serology. International Journal of Cancer, 22(3), 266-274.
Huang, H., & Huang, P. C. (2003). Effects of two LMP1 variants on resistance of CNE1
cell strain to TGF-beta1. Ai Zheng, 22(12), 1254-1259.
112
Hui, E. P., & Chan, A. T. C. (2013). The evolving role of systemic therapy in
nasopharyngeal carcinoma: Current strategies and perspectives. In P. Busson
(Ed.), Nasopharyngeal carcinoma: keys for translational medicine and biology
(pp. 149-172). New York, NY: Springer New York.
Hunter, D. J., Kraft, P., Jacobs, K. B., Cox, D. G., Yeager, M., Hankinson, S. E., . . .
Chanock, S. J. (2007). A genome-wide association study identifies alleles in
FGFR2 associated with risk of sporadic postmenopausal breast cancer. Nature
Genetics, 39(7), 870-874.
IARC Working Group on the Evaluation of Carcinogenic Risks to Humans. (2006).
Formaldehyde, 2-butoxyethanol and 1-tert-butoxypropan-2-ol. IARC
monographs on the evaluation of carcinogenic risks to humans, 88, 1-478.
International Agency for Research on Cancer. (1978). Some N-nitroso compounds.
IARC monographs on the evaluation of the carcinogenic risk of chemicals to
humans (Vol. 17). Lyon: IARC Press.
International HapMap Consortium. (2003). The International HapMap Project. Nature,
426(6968), 789-796.
International HapMap Consortium. (2005). A haplotype map of the human genome.
Nature, 437(7063), 1299-1320.
Ioannidis, J. P., Patsopoulos, N. A., & Evangelou, E. (2007). Heterogeneity in meta-
analyses of genome-wide association investigations. PLOS ONE, 2(9), e841.
Ioannidis, J. P., Trikalinos, T. A., & Khoury, M. J. (2006). Implications of small effect
sizes of individual genetic variants on the design and interpretation of genetic
association studies of complex diseases. American Journal of Epidemiology,
164(7), 609-614.
Iwakiri, D., Eizuru, Y., Tokunaga, M., & Takada, K. (2003). Autocrine growth of
Epstein-Barr virus-positive gastric carcinoma cells mediated by an Epstein-Barr
virus-encoded small RNA. Cancer Research, 63(21), 7062-7067.
Iwakiri, D., Sheen, T. S., Chen, J. Y., Huang, D. P., & Takada, K. (2005). Epstein-Barr
virus-encoded small RNA induces insulin-like growth factor 1 and supports
growth of nasopharyngeal carcinoma-derived cell lines. Oncogene, 24(10),
1767-1773.

113
James, M. A., Vikis, H. G., Tate, E., Rymaszewski, A. L., & You, M. (2014).
CRR9/CLPTM1L regulates cell survival signaling and is required for Ras
transformation and lung tumorigenesis. Cancer Research, 74(4), 1116-1127.
Jeannel, D., Bouvier, G., & Hubert, A. (1999). Nasopharyngeal carcinoma: an
epidemiological approach to carcinogenesis. Cancer Surveys, 33, 125-155.
Jia, W.-H., Pan, Q.-H., Qin, H.-D., Xu, Y.-F., Shen, G.-P., Chen, L., . . . Zeng, Y.-X.
(2009). A case–control and a family-based association study revealing an
association between CYP2E1 polymorphisms and nasopharyngeal carcinoma
risk in Cantonese. Carcinogenesis, 30(12), 2031-2036.
Johnson, G. C., Esposito, L., Barratt, B. J., Smith, A. N., Heward, J., Di Genova, G., . . .
Todd, J. A. (2001). Haplotype tagging for the identification of common disease
genes. Nature Genetics, 29(2), 233-237.
Kavvoura, F. K., & Ioannidis, J. P. (2008). Methods for meta-analysis in genetic
association studies: a review of their potential and pitfalls. Human Genetics,
123(1), 1-14.
Kellis, M., Wold, B., Snyder, M. P., Bernstein, B. E., Kundaje, A., Marinov, G. K., . . .
Hardison, R. C. (2014). Defining functional DNA elements in the human
genome. Proceedings of the National Academy of Sciences of the United States
of America, 111(17), 6131-6138.
Kelly, J., Lanier, A., Santos, M., Healey, S., Louchini, R., Friborg, J., & Kon, Y.
(2008). Cancer among the circumpolar Inuit, 1989–2003. II. Patterns and trends.
International Journal of Circumpolar Health, 67(5), 408-420.
Khoo, A. S.-B., & Pua, K.-C. (2013). Diagnosis and clinical evaluation of
nasopharyngeal carcinoma. In P. Busson (Ed.), Nasopharyngeal carcinoma:
keys for translational medicine and biology (pp. 1-9). New York, NY: Springer
New York.
Klein, R. J., Zeiss, C., Chew, E. Y., Tsai, J. Y., Sackler, R. S., Haynes, C., . . . Hoh, J.
(2005). Complement factor H polymorphism in age-related macular
degeneration. Science, 308(5720), 385-389.
Knowles, M. R., & Boucher, R. C. (2002). Mucus clearance as a primary innate defense
mechanism for mammalian airways. Journal of Clinical Investigation, 109(5),
571-577.

114
Komano, J., Maruo, S., Kurozumi, K., Oda, T., & Takada, K. (1999). Oncogenic role of
Epstein-Barr virus-encoded RNAs in Burkitt's lymphoma cell line Akata.
Journal of Virology, 73(12), 9827-9831.
Kongruttanachok, N., Sukdikul, S., Setavarin, S., Kerekhjanarong, V., Supiyaphun, P.,
Voravud, N., . . . Mutirangura, A. (2001). Cytochrome P450 2E1 polymorphism
and nasopharyngeal carcinoma development in Thailand: a correlative study.
BMC Cancer, 1, 4.
Krimpenfort, P., Ijpenberg, A., Song, J. Y., van der Valk, M., Nawijn, M., Zevenhoven,
J., & Berns, A. (2007). p15Ink4b is a critical tumour suppressor in the absence
of p16Ink4a. Nature, 448(7156), 943-946.
Kumar, P., Henikoff, S., & Ng, P. C. (2009). Predicting the effects of coding non-
synonymous variants on protein function using the SIFT algorithm. Nature
Protocols, 4(7), 1073-1081.
Kurokawa, M., Mitani, K., Yamagata, T., Takahashi, T., Izutsu, K., Ogawa, S., . . .
Hirai, H. (2000). The evi-1 oncoprotein inhibits c-Jun N-terminal kinase and
prevents stress-induced cell death. The EMBO Journal, 19(12), 2958-2968.
Kutok, J. L., & Wang, F. (2006). Spectrum of Epstein-Barr virus-associated diseases.
Annual Review of Pathology, 1, 375-404.
Kwong, D. L., Sham, J. S., Chua, D. T., Choy, D. T., Au, G. K., & Wu, P. M. (1997).
The effect of interruptions and prolonged treatment time in radiotherapy for
nasopharyngeal carcinoma. International Journal of Radiation Oncology*
Biology* Physics, 39(3), 703-710.
Laantri, N., Jalbout, M., Khyatti, M., Ayoub, W. B., Dahmoul, S., Ayad, M., . . .
Corbex, M. (2011). XRCC1 and hOGG1 genes and risk of nasopharyngeal
carcinoma in North African countries. Molecular Carcinogenesis, 50(9), 732-
737.
Lander, E., & Kruglyak, L. (1995). Genetic dissection of complex traits: guidelines for
interpreting and reporting linkage results. Nature Genetics, 11(3), 241-247.
Lander, E. S., Linton, L. M., Birren, B., Nusbaum, C., Zody, M. C., Baldwin, J., . . .
International Human Genome Sequencing Consortium. (2001). Initial
sequencing and analysis of the human genome. Nature, 409(6822), 860-921.

115
Lettre, G., Lange, C., & Hirschhorn, J. N. (2007). Genetic model testing and statistical
power in population-based association studies of quantitative traits. Genetic
Epidemiology, 31(4), 358-362.
Li, H., Handsaker, B., Wysoker, A., Fennell, T., Ruan, J., Homer, N., . . . 1000 Genome
Project Data Processing Subgroup. (2009). The Sequence Alignment/Map
format and SAMtools. Bioinformatics, 25(16), 2078-2079.
Li, L., Guo, L., Tao, Y., Zhou, S., Wang, Z., Luo, W., . . . Cao, Y. (2007). Latent
membrane protein 1 of Epstein-Barr virus regulates p53 phosphorylation
through MAP kinases. Cancer Letters, 255(2), 219-231.
Li, W., Turner, A., Aggarwal, P., Matter, A., Storvick, E., Arnett, D. K., & Broeckel, U.
(2015). Comprehensive evaluation of AmpliSeq transcriptome, a novel targeted
whole transcriptome RNA sequencing methodology for global gene expression
analysis. BMC Genomics, 16, 1069.
Liao, X.-B., Mao, Y.-P., Liu, L.-Z., Tang, L.-L., Sun, Y., Wang, Y., . . . Ma, J. (2008).
How does magnetic resonance imaging influence staging according to AJCC
staging system for nasopharyngeal carcinoma compared with computed
tomography? International Journal of Radiation Oncology* Biology* Physics,
72(5), 1368-1377.
Libioulle, C., Louis, E., Hansoul, S., Sandor, C., Farnir, F., Franchimont, D., . . .
Georges, M. (2007). Novel Crohn disease locus identified by genome-wide
association maps to a gene desert on 5p13.1 and modulates expression of
PTGER4. PLOS Genetics, 3(4), e58.
Lin, C. T., Lin, C. R., Tan, G. K., Chen, W., Dee, A. N., & Chan, W. Y. (1997). The
mechanism of Epstein-Barr virus infection in nasopharyngeal carcinoma cells.
American Journal of Pathology, 150(5), 1745-1756.
Lin, X. P., Zhao, C., Chen, M. Y., Fan, W., Zhang, X., Zhi, S. F., & Liang, P. Y. (2008).
Role of 18F-FDG PET/CT in diagnosis and staging of nasopharyngeal
carcinoma. Ai Zheng, 27(9), 974-978.
Liu, F.-Y., Lin, C.-Y., Chang, J. T., Ng, S.-H., Chin, S.-C., Wang, H.-M., . . . Yen, T.-
C. (2007). 18F-FDG PET can replace conventional work-up in primary M
staging of nonkeratinizing nasopharyngeal carcinoma. Journal of Nuclear
Medicine, 48(10), 1614-1619.

116
Lo, A. K., Huang, D. P., Lo, K. W., Chui, Y. L., Li, H. M., Pang, J. C., & Tsao, S. W.
(2004). Phenotypic alterations induced by the Hong Kong-prevalent Epstein-
Barr virus-encoded LMP1 variant (2117-LMP1) in nasopharyngeal epithelial
cells. International Journal of Cancer, 109(6), 919-925.
Lourembam, D. S., Singh, A. R., Sharma, T. D., Singh, T. S., Singh, T. R., & Singh, L.
S. (2015). Evaluation of Risk Factors for Nasopharyngeal Carcinoma in a High-
risk Area of India, the Northeastern Region. Asian Pacific Journal of Cancer
Prevention, 16(12), 4927-4935.
Love, M. I., Huber, W., & Anders, S. (2014). Moderated estimation of fold change and
dispersion for RNA-seq data with DESeq2. Genome Biology, 15(12), 550.
Lu, C. C., Chen, J. C., Jin, Y. T., Yang, H. B., Chan, S. H., & Tsai, S. T. (2003).
Genetic susceptibility to nasopharyngeal carcinoma within the HLA-A locus in
Taiwanese. International Journal of Cancer, 103(6), 745-751.
Lu, C. C., Chen, J. C., Tsai, S. T., Jin, Y. T., Tsai, J. C., Chan, S. H., & Su, I. J. (2005).
Nasopharyngeal carcinoma–susceptibility locus is localized to a 132 kb segment
containing HLA-A using high-resolution microsatellite mapping. International
Journal of Cancer, 115(5), 742-746.
Lu, J., Lin, W. H., Chen, S. Y., Longnecker, R., Tsai, S. C., Chen, C. L., & Tsai, C. H.
(2006). Syk tyrosine kinase mediates Epstein-Barr virus latent membrane
protein 2A-induced cell migration in epithelial cells. The Journal of Biological
Chemistry, 281(13), 8806-8814.
Lu, S. J., Day, N. E., Degos, L., Lepage, V., Wang, P. C., Chan, S. H., . . . De The, G.
(1990). Linkage of a nasopharyngeal carcinoma susceptibility locus to the HLA
region. Nature, 346(6283), 470-471.
Lung, M. L., Chang, R. S., Huang, M. L., Guo, H. Y., Choy, D., Sham, J., ... & Ng, M.
H. (1990). Epstein-Barr virus genotypes associated with nasopharyngeal
carcinoma in southern China. Virology, 177(1), 44-53.
Lye, M. S., Visuvanathan, S., Chong, P. P., Yap, Y. Y., Lim, C. C., & Ban, E. Z.
(2015). Homozygous Wildtype of XPD K751Q Polymorphism Is Associated
with Increased Risk of Nasopharyngeal Carcinoma in Malaysian Population.
PLOS ONE, 10(6), e0130530.
Mabuchi, K., Bross, D. S., & Kessler, II. (1985). Cigarette smoking and nasopharyngeal
carcinoma. Cancer, 55(12), 2874-2876.

117
MacArthur, J., Bowler, E., Cerezo, M., Gil, L., Hall, P., Hastings, E., . . . Parkinson, H.
(2017). The new NHGRI-EBI Catalog of published genome-wide association
studies (GWAS Catalog). Nucleic Acids Research, 45, 896-901.
Manolio, T. A. (2010). Genomewide association studies and assessment of the risk of
disease. New England Journal of Medicine, 363(2), 166-176.
Marchini, J., & Howie, B. (2010). Genotype imputation for genome-wide association
studies. Nature Reviews Genetics, 11(7), 499-511.
Marchini, J., Howie, B., Myers, S., McVean, G., & Donnelly, P. (2007). A new
multipoint method for genome-wide association studies by imputation of
genotypes. Nature Genetics, 39(7), 906-913.
Matsui, M., Hioe, C. E., & Frelinger, J. A. (1993). Roles of the six peptide-binding
pockets of the HLA-A2 molecule in allorecognition by human cytotoxic T-cell
clones. Proceedings of the National Academy of Sciences of the United States of
America, 90(2), 674-678.
Matys, V., Fricke, E., Geffers, R., Gößling, E., Haubrock, M., Hehl, R., . . . Kel-
Margoulis, O. V. (2003). TRANSFAC®: Transcriptional regulation, from
patterns to profiles. Nucleic Acids Research, 31(1), 374-378.
McCarthy, M. I., Abecasis, G. R., Cardon, L. R., Goldstein, D. B., Little, J., Ioannidis,
J. P., & Hirschhorn, J. N. (2008). Genome-wide association studies for complex
traits: consensus, uncertainty and challenges. Nature Reviews Genetics, 9(5),
356-369.
Mei, Y. P., Zhu, X. F., Zhou, J. M., Huang, H., Deng, R., & Zeng, Y. X. (2006). siRNA
targeting LMP1-induced apoptosis in EBV-positive lymphoma cells is
associated with inhibition of telomerase activity and expression. Cancer Letters,
232(2), 189-198.
Mocellin, S., Verdi, D., Pooley, K. A., Landi, M. T., Egan, K. M., Baird, D. M., . . .
Nitti, D. (2012). Telomerase reverse transcriptase locus polymorphisms and
cancer risk: a field synopsis and meta-analysis. Journal of the National Cancer
Institute, 104(11), 840-854.
Moffatt, M. F., Kabesch, M., Liang, L., Dixon, A. L., Strachan, D., Heath, S., . . .
Cookson, W. O. (2007). Genetic variants regulating ORMDL3 expression
contribute to the risk of childhood asthma. Nature, 448(7152), 470-473.

118
Mokni-Baizig, N., Ayed, K., Ayed, F. B., Ayed, S., Sassi, F., Ladgham, A., . . . El May,
A. (2001). Association between HLA-A/-B antigens and -DRB1 alleles and
nasopharyngeal carcinoma in Tunisia. Oncology, 61(1), 55-58.
Moonesinghe, R., Khoury, M. J., Liu, T., & Ioannidis, J. P. (2008). Required sample
size and nonreplicability thresholds for heterogeneous genetic associations.
Proceedings of the National Academy of Sciences of the United States of
America, 105(2), 617-622.
Moore, S. B., Pearson, G. R., Neel, H. B., 3rd, & Weiland, L. H. (1983). HLA and
nasopharyngeal carcinoma in North American Caucasoids. Tissue Antigens,
22(1), 72-75.
Morrison, J. A., & Raab-Traub, N. (2005). Roles of the ITAM and PY motifs of
Epstein-Barr virus latent membrane protein 2A in the inhibition of epithelial cell
differentiation and activation of beta-catenin signaling. Journal of Virology,
79(4), 2375-2382.
Nadala, E. C., Tan, T. M., Wong, H. M., & Ting, R. C. (1996). ELISA for the detection
of serum and saliva IgA against the BMRFI gene product of Epstein-Barr virus.
Journal of Medical Virology, 50(1), 93-96.
Nakaoka, H., & Inoue, I. (2015). Distribution of HLA haplotypes across Japanese
Archipelago: similarity, difference and admixture. Journal of Human Genetics,
60(11), 683.
Nam, D., Kim, J., Kim, S. Y., & Kim, S. (2010). GSA-SNP: a general approach for
gene set analysis of polymorphisms. Nucleic Acids Research, 38, 749-754.
Nam, J. M., McLaughlin, J. K., & Blot, W. J. (1992). Cigarette smoking, alcohol, and
nasopharyngeal carcinoma: a case-control study among U.S. whites. Journal of
the National Cancer Institute, 84(8), 619-622.
Nanbo, A., Inoue, K., Adachi-Takasawa, K., & Takada, K. (2002). Epstein-Barr virus
RNA confers resistance to interferon-alpha-induced apoptosis in Burkitt's
lymphoma. The EMBO Journal, 21(5), 954-965.
National Comprehensive Cancer Network. (2011). NCCN clinical practice guidelines in
oncology: head and neck cancers. Retrieved from
http://www.nccn.org/professionals/physician_gls/pdf/head-and-neck.pdf

119
Ng, C. C., Yew, P. Y., Puah, S. M., Krishnan, G., Yap, L. F., Teo, S. H., . . . Mushiroda,
T. (2009a). A genome-wide association study identifies ITGA9 conferring risk
of nasopharyngeal carcinoma. Journal of Human Genetics, 54(7), 392-397.
Ng, S. H., Chan, S. C., Yen, T. C., Chang, J. T., Liao, C. T., Ko, S. F., . . . Hsu, C. L.
(2009b). Staging of untreated nasopharyngeal carcinoma with PET/CT:
comparison with conventional imaging work-up. European Journal of Nuclear
Medicine and Molecular Imaging, 36(1), 12-22.
Nica, A. C., Parts, L., Glass, D., Nisbet, J., Barrett, A., Sekowska, M., . . . Spector, T.
D. (2011). The architecture of gene regulatory variation across multiple human
tissues: the MuTHER study. PLOS Genetics, 7(2), e1002003.
Nicholls, J. M. (1997). Nasopharyngeal Carcinoma: Classification and histologic
appearances. Advances in Anatomic Pathology, 4(2), 71-84.
Nicholls, J. M., Agathanggelou, A., Fung, K., Zeng, X., & Niedobitek, G. (1997). The
association of squamous cell carcinomas of the nasopharynx with Epstein-Barr
virus shows geographical variation reminiscent of Burkitt's lymphoma. The
Journal of Pathology, 183(2), 164-168.
Nitta, E., Izutsu, K., Yamaguchi, Y., Imai, Y., Ogawa, S., Chiba, S., . . . Hirai, H.
(2005). Oligomerization of Evi-1 regulated by the PR domain contributes to
recruitment of corepressor CtBP. Oncogene, 24(40), 6165-6173.
Nong, L. G., Luo, B., Zhang, L., & Nong, H. B. (2009). Interleukin-18 gene promoter
polymorphism and the risk of nasopharyngeal carcinoma in a Chinese
population. DNA Cell Biology, 28(10), 507-513.
Olbrich, H., Haffner, K., Kispert, A., Volkel, A., Volz, A., Sasmaz, G., . . . Omran, H.
(2002). Mutations in DNAH5 cause primary ciliary dyskinesia and
randomization of left-right asymmetry. Nature Genetics, 30(2), 143-144.
Ooi, E. E., Ren, E. C., & Chan, S. H. (1997). Association between microsatellites within
the human MHC and nasopharyngeal carcinoma. International Journal of
Cancer, 74(2), 229-232.
Ou, S. H., Zell, J. A., Ziogas, A., & Anton-Culver, H. (2007). Epidemiology of
nasopharyngeal carcinoma in the United States: improved survival of Chinese
patients within the keratinizing squamous cell carcinoma histology. Annals of
Oncology, 18(1), 29-35.

120
Palmblad, J., Mossberg, B., & Afzelius, B. A. (1984). Ultrastructural, cellular, and
clinical features of the immotile-cilia syndrome. Annual Review of Medicine, 35,
481-492.
Parkes, M., Barrett, J. C., Prescott, N. J., Tremelling, M., Anderson, C. A., Fisher, S. A.,
. . . Mathew, C. G. (2007). Sequence variants in the autophagy gene IRGM and
multiple other replicating loci contribute to Crohn's disease susceptibility.
Nature Genetics, 39(7), 830-832.
Patterson, N., Price, A. L., & Reich, D. (2006). Population structure and eigenanalysis.
PLOS Genetics, 2(12), e190.
Pereira, T. V., Patsopoulos, N. A., Salanti, G., & Ioannidis, J. P. (2009). Discovery
properties of genome-wide association signals from cumulatively combined data
sets. American Journal of Epidemiology, 170(10), 1197-1206.
Pfeiffer, R. M., Gail, M. H., & Pee, D. (2009). On combining data from genome-wide
association studies to discover disease-associated SNPs. Statistical Science,
24(4), 547-560.
Pimtanothai, N., Charoenwongse, P., Mutirangura, A., & Hurley, C. K. (2002).
Distribution of HLA-B alleles in nasopharyngeal carcinoma patients and normal
controls in Thailand. Tissue Antigens, 59(3), 223-225.
Portales-Casamar, E., Thongjuea, S., Kwon, A. T., Arenillas, D., Zhao, X., Valen, E., . .
. Sandelin, A. (2010). JASPAR 2010: the greatly expanded open-access database
of transcription factor binding profiles. Nucleic Acids Research, 38, 105-110.
Price, A. L., Patterson, N. J., Plenge, R. M., Weinblatt, M. E., Shadick, N. A., & Reich,
D. (2006). Principal components analysis corrects for stratification in genome-
wide association studies. Nature Genetics, 38(8), 904-909.
Purcell, A. W., & Elliott, T. (2008). Molecular machinations of the MHC-I peptide
loading complex. Current Opinion in Immunology, 20(1), 75-81.
Purcell, S., Neale, B., Todd-Brown, K., Thomas, L., Ferreira, M. A., Bender, D., . . .
Sham, P. C. (2007). PLINK: a tool set for whole-genome association and
population-based linkage analyses. American Journal of Human Genetics, 81(3),
559-575.

121
Qin, H. D., Shugart, Y. Y., Bei, J. X., Pan, Q. H., Chen, L., Feng, Q. S., . . . Jia, W. H.
(2011). Comprehensive pathway-based association study of DNA repair gene
variants and the risk of nasopharyngeal carcinoma. Cancer Research, 71(8),
3000-3008.
Ren, E. C., Law, G. C., & Chan, S. H. (1995). HLA-A2 allelic microvariants in
nasopharyngeal carcinoma. International Journal of Cancer, 63(2), 213-215.
Rioux, J. D., Xavier, R. J., Taylor, K. D., Silverberg, M. S., Goyette, P., Huett, A., . . .
Brant, S. R. (2007). Genome-wide association study identifies new susceptibility
loci for Crohn disease and implicates autophagy in disease pathogenesis. Nature
Genetics, 39(5), 596-604.
Ropero, S., & Esteller, M. (2010). HDAC2 (histone deacetylase 2). In Atlas of genetics
and cytogenetics in oncology and haematology. Retrieved from
http://AtlasGeneticsOncology.org/Genes/HDAC2ID40803ch6q22.html
Ruf, I. K., Rhyne, P. W., Yang, C., Cleveland, J. L., & Sample, J. T. (2000). Epstein-
Barr virus small RNAs potentiate tumorigenicity of Burkitt lymphoma cells
independently of an effect on apoptosis. Journal of Virology, 74(21), 10223-
10228.
Salter, R. D., Benjamin, R. J., Wesley, P. K., Buxton, S. E., Garrett, T. P., Clayberger,
C., . . . Parham, P. (1990). A binding site for the T-cell co-receptor CD8 on the
alpha 3 domain of HLA-A2. Nature, 345(6270), 41-46.
Samanta, M., Iwakiri, D., Kanda, T., Imaizumi, T., & Takada, K. (2006). EB virus-
encoded RNAs are recognized by RIG-I and activate signaling to induce type I
IFN. The EMBO Journal, 25(18), 4207-4214.
Saxena, R., Voight, B. F., Lyssenko, V., Burtt, N. P., de Bakker, P. I., Chen, H., . . .
Purcell, S. (2007). Genome-wide association analysis identifies loci for type 2
diabetes and triglyceride levels. Science, 316(5829), 1331-1336.
Scholle, F., Bendt, K. M., & Raab-Traub, N. (2000). Epstein-Barr virus LMP2A
transforms epithelial cells, inhibits cell differentiation, and activates Akt.
Journal of Virology, 74(22), 10681-10689.
Scott, L. J., Mohlke, K. L., Bonnycastle, L. L., Willer, C. J., Li, Y., Duren, W. L., . . .
Boehnke, M. (2007). A genome-wide association study of type 2 diabetes in
Finns detects multiple susceptibility variants. Science, 316(5829), 1341-1345.

122
Segre, A. V., Groop, L., Mootha, V. K., Daly, M. J., & Altshuler, D. (2010). Common
inherited variation in mitochondrial genes is not enriched for associations with
type 2 diabetes or related glycemic traits. PLOS Genetics, 6(8).
Sengupta, S., den Boon, J. A., Chen, I. H., Newton, M. A., Dahl, D. B., Chen, M., . . .
Ahlquist, P. (2006). Genome-wide expression profiling reveals EBV-associated
inhibition of MHC class I expression in nasopharyngeal carcinoma. Cancer
Research, 66(16), 7999-8006.
Seto, E., Ooka, T., Middeldorp, J., & Takada, K. (2008). Reconstitution of
nasopharyngeal carcinoma-type EBV infection induces tumorigenicity. Cancer
Research, 68(4), 1030-1036.
Sharpless, N. E., Bardeesy, N., Lee, K. H., Carrasco, D., Castrillon, D. H., Aguirre, A.
J., . . . DePinho, R. A. (2001). Loss of p16Ink4a with retention of p19Arf
predisposes mice to tumorigenesis. Nature, 413(6851), 86-91.
Sheu, L. F., Chen, A., Lee, H. S., Hsu, H. Y., & Yu, D. S. (2004). Cooperative
interactions among p53, bcl-2 and Epstein-Barr virus latent membrane protein 1
in nasopharyngeal carcinoma cells. Pathology International, 54(7), 475-485.
Shimizu, N., Tanabe-Tochikura, A., Kuroiwa, Y., & Takada, K. (1994). Isolation of
Epstein-Barr virus (EBV)-negative cell clones from the EBV-positive Burkitt's
lymphoma (BL) line Akata: malignant phenotypes of BL cells are dependent on
EBV. Journal of Virology, 68(9), 6069-6073.
Simons, M. J., Wee, G. B., Chan, S. H., & Shanmugaratnam, K. (1975). Probable
identification of an HL-A second-locus antigen associated with a high risk of
nasopharyngeal carcinoma. Lancet, 1(7899), 142-143.
Simons, M. J., Wee, G. B., Day, N. E., Morris, P. J., Shanmugaratnam, K., & De-The,
G. B. (1974). Immunogenetic aspects of nasopharyngeal carcinoma: I.
Differences in HL-A antigen profiles between patients and control groups.
International Journal of Cancer, 13(1), 122-134.
Sivachandran, N., Thawe, N. N., & Frappier, L. (2011). Epstein-Barr virus nuclear
antigen 1 replication and segregation functions in nasopharyngeal carcinoma cell
lines. Journal of Virology, 85(19), 10425-10430.
Sladek, R., Rocheleau, G., Rung, J., Dina, C., Shen, L., Serre, D., . . . Froguel, P.
(2007). A genome-wide association study identifies novel risk loci for type 2
diabetes. Nature, 445(7130), 881-885.

123
Song, C., Chen, L. Z., Zhang, R. H., Yu, X. J., & Zeng, Y. X. (2006). Functional variant
in the 3'-untranslated region of Toll-like receptor 4 is associated with
nasopharyngeal carcinoma risk. Cancer Biology & Therapy, 5(10), 1285-1291.
Sriamporn, S., Vatanasapt, V., Pisani, P., Yongchaiyudha, S., & Rungpitarangsri, V.
(1992). Environmental risk factors for nasopharyngeal carcinoma: a case-control
study in northeastern Thailand. Cancer Epidemiology Biomarkers & Prevention,
1(5), 345-348.
Stacey, S. N., Manolescu, A., Sulem, P., Rafnar, T., Gudmundsson, J., Gudjonsson, S.
A., . . . Stefansson, K. (2007). Common variants on chromosomes 2q35 and
16q12 confer susceptibility to estrogen receptor-positive breast cancer. Nature
Genetics, 39(7), 865-869.
Steimle, V., Otten, L. A., Zufferey, M., & Mach, B. (1993). Complementation cloning
of an MHC class II transactivator mutated in hereditary MHC class II deficiency
(or bare lymphocyte syndrome). Cell, 75(1), 135-146.
Steinthorsdottir, V., Thorleifsson, G., Reynisdottir, I., Benediktsson, R., Jonsdottir, T.,
Walters, G. B., . . . Stefansson, K. (2007). A variant in CDKAL1 influences
insulin response and risk of type 2 diabetes. Nature Genetics, 39(6), 770-775.
Stewart, P. L., & Nemerow, G. R. (2007). Cell integrins: commonly used receptors for
diverse viral pathogens. Trends in Microbiology, 15(11), 500-507.
Strockbine, L. D., Cohen, J. I., Farrah, T., Lyman, S. D., Wagener, F., DuBose, R. F., . .
. Spriggs, M. K. (1998). The Epstein-Barr virus BARF1 gene encodes a novel,
soluble colony-stimulating factor-1 receptor. Journal of Virology, 72(5), 4015-
4021.
Su, W. H., Hildesheim, A., & Chang, Y. S. (2013). Human leukocyte antigens and
epstein-barr virus-associated nasopharyngeal carcinoma: old associations offer
new clues into the role of immunity in infection-associated cancers. Frontiers in
Oncology, 3, 299.
Sudmant, P. H., Rausch, T., Gardner, E. J., Handsaker, R. E., Abyzov, A., Huddleston,
J., . . . Korbel, J. O. (2015). An integrated map of structural variation in 2,504
human genomes. Nature, 526(7571), 75-81.
Tang, M., Lautenberger, J. A., Gao, X., Sezgin, E., Hendrickson, S. L., Troyer, J. L., . . .
O'Brien, S. J. (2012). The principal genetic determinants for nasopharyngeal
carcinoma in China involve the HLA class I antigen recognition groove. PLOS
Genetics, 8(11), e1003103.
124
Terrin, L., Dal Col, J., Rampazzo, E., Zancai, P., Pedrotti, M., Ammirabile, G., . . . De
Rossi, A. (2008). Latent membrane protein 1 of Epstein-Barr virus activates the
hTERT promoter and enhances telomerase activity in B lymphocytes. Journal of
Virology, 82(20), 10175-10187.
Thomas, G., Jacobs, K. B., Yeager, M., Kraft, P., Wacholder, S., Orr, N., . . . Chanock,
S. J. (2008). Multiple loci identified in a genome-wide association study of
prostate cancer. Nature Genetics, 40(3), 310-315.
Tian, L., Greenberg, S. A., Kong, S. W., Altschuler, J., Kohane, I. S., & Park, P. J.
(2005). Discovering statistically significant pathways in expression profiling
studies. Proceedings of the National Academy of Sciences of the United States of
America, 102(38), 13544-13549.
Tiwawech, D., Srivatanakul, P., Karalak, A., & Ishida, T. (2006). Cytochrome P450
2A6 polymorphism in nasopharyngeal carcinoma. Cancer Letters, 241(1), 135-
141.
Todd, J. A., Walker, N. M., Cooper, J. D., Smyth, D. J., Downes, K., Plagnol, V., . . .
Clayton, D. G. (2007). Robust associations of four new chromosome regions
from genome-wide analyses of type 1 diabetes. Nature Genetics, 39(7), 857-864.
Tse, K. P., Su, W. H., Chang, K. P., Tsang, N. M., Yu, C. J., Tang, P., . . . Shugart, Y.
Y. (2009). Genome-wide association study reveals multiple nasopharyngeal
carcinoma-associated loci within the HLA region at chromosome 6p21.3.
American Journal of Human Genetics, 85(2), 194-203.
Vaughan, T. L., Shapiro, J. A., Burt, R. D., Swanson, G. M., Berwick, M., Lynch, C. F.,
& Lyon, J. L. (1996). Nasopharyngeal cancer in a low-risk population: defining
risk factors by histological type. Cancer Epidemiology Biomarkers &
Prevention, 5(8), 587-593.
Wang, K., Li, M., & Hakonarson, H. (2010). Analysing biological pathways in genome-
wide association studies. Nature Reviews Genetics, 11(12), 843-854.
Wang, Q., Tsao, S. W., Ooka, T., Nicholls, J. M., Cheung, H. W., Fu, S., . . . Wang, X.
(2006). Anti-apoptotic role of BARF1 in gastric cancer cells. Cancer Letters,
238(1), 90-103.
Ward, L. D., & Kellis, M. (2012). HaploReg: a resource for exploring chromatin states,
conservation, and regulatory motif alterations within sets of genetically linked
variants. Nucleic Acids Research, 40, 930-934.

125
Wei, M. X., de Turenne-Tessier, M., Decaussin, G., Benet, G., & Ooka, T. (1997).
Establishment of a monkey kidney epithelial cell line with the BARF1 open
reading frame from Epstein-Barr virus. Oncogene, 14(25), 3073-3081.
Wei, W. I., & Kwong, D. L. (2010). Current management strategy of nasopharyngeal
carcinoma. Clinical and Experimental Otorhinolaryngology, 3(1), 1-12.
Wei, W. I., & Sham, J. S. (2005). Nasopharyngeal carcinoma. Lancet, 365(9476), 2041-
2054.
Wei, Y. S., Kuang, X. H., Zhu, Y. H., Liang, W. B., Yang, Z. H., Tai, S. H., . . . Zhang,
L. (2007a). Interleukin-10 gene promoter polymorphisms and the risk of
nasopharyngeal carcinoma. Tissue Antigens, 70(1), 12-17.
Wei, Y. S., Lan, Y., Luo, B., Lu, D., & Nong, H. B. (2009). Association of variants in
the interleukin-27 and interleukin-12 gene with nasopharyngeal carcinoma.
Molecular Carcinogenesis, 48(8), 751-757.
Wei, Y. S., Lan, Y., Tang, R. G., Xu, Q. Q., Huang, Y., Nong, H. B., & Huang, W. T.
(2007b). Single nucleotide polymorphism and haplotype association of the
interleukin-8 gene with nasopharyngeal carcinoma. Clinical Immunology,
125(3), 309-317.
Wei, Y. S., Lan, Y., Zhang, L., & Wang, J. C. (2010). Association of the interleukin-2
polymorphisms with interleukin-2 serum levels and risk of nasopharyngeal
carcinoma. DNA and Cell Biology, 29(7), 363-368.
Welter, D., MacArthur, J., Morales, J., Burdett, T., Hall, P., Junkins, H., . . . Parkinson,
H. (2014). The NHGRI GWAS Catalog, a curated resource of SNP-trait
associations. Nucleic Acids Research, 42, 1001-1006.
Wu, S. B., Hwang, S. J., Chang, A. S., Hsieh, T., Hsu, M. M., Hsieh, R. P., & Chen, C.
J. (1989). Human leukocyte antigen (HLA) frequency among patients with
nasopharyngeal carcinoma in Taiwan. Anticancer Research, 9(6), 1649-1653.
Xiao, M., Qi, F., Chen, X., Luo, Z., Zhang, L., Zheng, C., . . . Tang, J. (2010).
Functional polymorphism of cytotoxic T-lymphocyte antigen 4 and
nasopharyngeal carcinoma susceptibility in a Chinese population. International
Journal of Immunogenetics, 37(1), 27-32.

126
Xie, S. H., Yu, I. T., Tse, L. A., Au, J. S., & Lau, J. S. (2017). Occupational risk factors
for nasopharyngeal carcinoma in Hong Kong Chinese: a case-referent study.
International Archives of Occupational and Environmental Health, 1-7
Xiong, W., Zeng, Z. Y., Xia, J. H., Xia, K., Shen, S. R., Li, X. L., . . . Li, G. Y. (2004).
A susceptibility locus at chromosome 3p21 linked to familial nasopharyngeal
carcinoma. Cancer Research, 64(6), 1972-1974.
Xu, Y. F., Liu, W. L., Dong, J. Q., Liu, W. S., Feng, Q. S., Chen, L. Z., . . . Jia, W. H.
(2010). Sequencing of DC-SIGN promoter indicates an association between
promoter variation and risk of nasopharyngeal carcinoma in cantonese. BMC
Medical Genetics, 11, 161.
Yamamoto, N., Takizawa, T., Iwanaga, Y., Shimizu, N., & Yamamoto, N. (2000).
Malignant transformation of B lymphoma cell line BJAB by Epstein-Barr virus-
encoded small RNAs. FEBS Letters, 484(2), 153-158.
Yang, T. P., Beazley, C., Montgomery, S. B., Dimas, A. S., Gutierrez-Arcelus, M.,
Stranger, B. E., . . . Dermitzakis, E. T. (2010). Genevar: a database and Java
application for the analysis and visualization of SNP-gene associations in eQTL
studies. Bioinformatics, 26(19), 2474-2476.
Yang, Z. H., Dai, Q., Kong, X. L., Yang, W. L., & Zhang, L. (2009). Association of
ERCC1 polymorphisms and susceptibility to nasopharyngeal carcinoma.
Molecular Carcinogenesis, 48(3), 196-201.
Yang, Z. H., Dai, Q., Zhong, L., Zhang, X., Guo, Q. X., & Li, S. N. (2011). Association
of IL-1 polymorphisms and IL-1 serum levels with susceptibility to
nasopharyngeal carcinoma. Molecular Carcinogenesis, 50(3), 208-214.
Yao, K., Qin, H., Gong, L., Zhang, R., & Li, L. (2017). CYP2E1 polymorphisms and
nasopharyngeal carcinoma risk: a meta-analysis. European Archives of
Otorhinolaryngology, 274(1), 253-259.
Yeager, M., Orr, N., Hayes, R. B., Jacobs, K. B., Kraft, P., Wacholder, S., . . . Thomas,
G. (2007). Genome-wide association study of prostate cancer identifies a second
risk locus at 8q24. Nature Genetics, 39(5), 645-649.
Yee Ko, J. M., Dai, W., Wun Wong, E. H., Kwong, D., Tong Ng, W., Lee, A., . . . Li
Lung, M. (2014). Multigene pathway-based analyses identify nasopharyngeal
carcinoma risk associations for cumulative adverse effects of TERT-CLPTM1L
and DNA double-strand breaks repair. International Journal of Cancer, 135(7),
1634-1645.

127
Yew, P. Y., Mushiroda, T., Kiyotani, K., Govindasamy, G. K., Yap, L. F., Teo, S. H., . .
. Ng, C. C. (2012). Identification of a functional variant in SPLUNC1 associated
with nasopharyngeal carcinoma susceptibility among Malaysian Chinese.
Molecular Carcinogenesis, 51, 74-82.
Yi, Z., Yuxi, L., Chunren, L., Sanwen, C., Jihneng, W., Jisong, Z., & Huijong, Z.
(1980). Application of an immunoenzymatic method and an
immunoautoradiographic method for a mass survey of nasopharyngeal
carcinoma. Intervirology, 13(3), 162-168.
Young, L. S., Dawson, C. W., Brown, K. W., & Rickinson, A. B. (1989). Identification
of a human epithelial cell surface protein sharing an epitope with the
C3d/Epstein-Barr virus receptor molecule of B lymphocytes. International
Journal of Cancer, 43(5), 786-794.
Young, L. S., & Rickinson, A. B. (2004). Epstein-Barr virus: 40 years on. Nature
Reviews Cancer, 4(10), 757-768.
Yu, M. C., Ho, J. H., Lai, S. H., & Henderson, B. E. (1986). Cantonese-style salted fish
as a cause of nasopharyngeal carcinoma: report of a case-control study in Hong
Kong. Cancer Research, 46(2), 956-961.
Yu, M. C., & Yuan, J. M. (2002). Epidemiology of nasopharyngeal carcinoma.
Seminars in Cancer Biology, 12(6), 421-429.
Yuan, J. M., Wang, X. L., Xiang, Y. B., Gao, Y. T., Ross, R. K., & Yu, M. C. (2000).
Non-dietary risk factors for nasopharyngeal carcinoma in Shanghai, China.
International Journal of Cancer, 85(3), 364-369.
Zeggini, E., & Ioannidis, J. P. (2009). Meta-analysis in genome-wide association
studies. Pharmacogenomics, 10(2), 191-201.
Zeggini, E., Scott, L. J., Saxena, R., Voight, B. F., Marchini, J. L., Hu, T., . . . Altshuler,
D. (2008). Meta-analysis of genome-wide association data and large-scale
replication identifies additional susceptibility loci for type 2 diabetes. Nature
Genetics, 40(5), 638-645.
Zeggini, E., Weedon, M. N., Lindgren, C. M., Frayling, T. M., Elliott, K. S., Lango, H.,
. . . Hattersley, A. T. (2007). Replication of genome-wide association signals in
UK samples reveals risk loci for type 2 diabetes. Science, 316(5829), 1336-
1341.

128
Zeng, Y., Zhang, L. G., Li, H. Y., Jan, M. G., Zhang, Q., Wu, Y. C., . . . Su, G. R.
(1982). Serological mass survey for early detection of nasopharyngeal
carcinoma in Wuzhou City, China. International Journal of Cancer, 29(2), 139-
141.
Zervas, J., Gregoriadis, S., Tourlas, D., Varlegidis, E., & Pantazopoulos, P. (1983).
Association between nasopharyngeal carcinoma and HLA antigens in Greeks.
Panminerva Medica, 25(4), 255-257.
Zhai, X. M., Hu, Q. C., Gu, K., Wang, J. P., Zhang, J. N., & Wu, Y. W. (2016).
Significance of XRCC1 Codon399 polymorphisms in Chinese patients with
locally advanced nasopharyngeal carcinoma treated with radiation therapy. Asia-
Pacific Journal of Clinical Oncology, 12(1), 125-132.
Zhang, X., Chen, X., Zhai, Y., Cui, Y., Cao, P., Zhang, H., . . . Zhou, G. (2014).
Combined effects of genetic variants of the PTEN, AKT1, MDM2 and p53
genes on the risk of nasopharyngeal carcinoma. PLOS ONE, 9(3), e92135.
Zhang, X., Zhang, R., Zheng, Y., Shen, J., Xiao, D., Li, J., . . . Zhang, H. (2013).
Expression of gamma-aminobutyric acid receptors on neoplastic growth and
prediction of prognosis in non-small cell lung cancer. Journal of Translational
Medicine, 11, 102.
Zhang, Y., Zhang, H., Zhai, Y., Wang, Z., Ma, F., Wang, H., . . . Zhou, G. (2011). A
functional tandem-repeats polymorphism in the downstream of TERT is
associated with the risk of nasopharyngeal carcinoma in Chinese population.
BMC Medicine, 9, 106.
Zheng, G., Freidlin, B., & Gastwirth, J. L. (2006). Robust genomic control for
association studies. American Journal of Human Genetics, 78(2), 350-356.
Zheng, Y. M., Tuppin, P., Hubert, A., Jeannel, D., Pan, Y. J., Zeng, Y., & De The, G.
(1994). Environmental and dietary risk factors for nasopharyngeal carcinoma: a
case-control study in Zangwu County, Guangxi, China. British Journal of
Cancer, 69(3), 508-514.
Zhou, X. X., Jia, W. H., Shen, G. P., Qin, H. D., Yu, X. J., Chen, L. Z., . . . Zeng, Y. X.
(2006). Sequence variants in toll-like receptor 10 are associated with
nasopharyngeal carcinoma risk. Cancer Epidemiology Biomarkers &
Prevention, 15(5), 862-866.

129
Zhou, Y., Nabeshima, K., Koga, K., Aoki, M., Hayashi, H., Hamasaki, M., & Iwasaki,
H. (2008). Comparison of Epstein-Barr virus genotypes and
clinicohistopathological features of nasopharyngeal carcinoma between Guilin,
China and Fukuoka, Japan. Oncology reports, 19(6), 1413-1420.
Zhu, K., Levine, R. S., Brann, E. A., Gnepp, D. R., & Baum, M. K. (1997). Cigarette
smoking and nasopharyngeal cancer: an analysis of the relationship according to
age at starting smoking and age at diagnosis. Journal of Epidemiology, 7(2),
107-111.
Zhu, Y., Xu, Y., Wei, Y., Liang, W., Liao, M., & Zhang, L. (2008). Association of IL-
1B gene polymorphisms with nasopharyngeal carcinoma in a Chinese
population. Clinical Oncology Journal, 20(3), 207-211.
130
List of Publications and Papers Presented
Pubilcations
1. Chin, Y. M., Mushiroda, T., Takahashi, A., Kubo, M., Krishnan, G., Yap, L. F.,
. . . Ng, C. C. (2015). HLA-A SNPs and amino acid variants are associated with
nasopharyngeal carcinoma in Malaysian Chinese. International Journal of
Cancer, 136(3), 678-687.
2. Bei, J. X., Su, W. H., Ng, C. C., Yu, K., Chin, Y. M., Lou, P. J., . . .
International Nasopharyngeal Carcinoma Genetics Working Group. (2016). A
GWAS meta-analysis and replication study identifies a novel locus within
CLPTM1L/TERT associated with nasopharyngeal carcinoma in individuals of
Chinese ancestry. Cancer Epidemiology Biomarkers & Prevention, 25(1), 188-
192.
3. Chin, Y. M., Tan, L. P., Norazlin Abdul Aziz., Mushiroda, T., Kubo, M., Nor
Kaslina Mohd Kornain, . . . Ng, C. C. (2016). Integrated pathway analysis of
nasopharyngeal carcinoma implicates the axonemal dynein complex in the
Malaysian cohort. International Journal of Cancer, 139(8), 1731-1739.
Presentations
1. Chin, Y.M., Mushiroda, T., Ng, C.C. and The Malaysian NPC Study Group.
(2013). High resolution genotyping of HLA-A reveals stronger association of
HLA-A single SNPs compared to HLA-A allele subtypes to nasopharyngeal
carcinoma susceptibility in Malaysian Chinese. Poster presented at the Joint
Conference of HGM 2013 and 21st International Congress of Genetics, The
Sands Expo and Convention Centre, Marina Bay Sands, Singapore.
2. Chin, Y.M. (2014). Imputation of NPC genome-wide SNP data reveals single
gene and gene-set pathway associations. Paper presented at the 4th NPC
Research Day, University Malaya, Kuala Lumpur.
3. Chin, Y.M. (2016). Genome-wide association studies (GWAS) of
nasopharyngeal carcinoma in the Malaysian cohort using single genes, meta-
analysis and pathway analysis approaches. Paper presented at the 2nd
International Symposium on Molecular Medicine, Tokushima University, Japan.
4. Chin, Y.M., Tan, L.P., Tan, G.W., Norazlin Abdul Aziz., Nor Kaslina Mohd
Kornain, Pua, K.C., . . . The Malaysian NPC Study Group. (2016). Identification
of candidate loci for nasopharyngeal carcinoma through GWAS and eQTL.
Poster presented at NIH Research Week 2016, Institute for Health Management
(IHM), Bangsar Kuala Lumpur.