Genetic diversity and population structure of the sweet ...Stevia rebaudiana, native from Paraguay,...
11
RESEARCH ARTICLE Open Access Genetic diversity and population structure of the sweet leaf herb, Stevia rebaudiana B., cultivated and landraces germplasm assessed by EST-SSRs genotyping and steviol glycosides phenotyping Patrick Cosson 1 , Cécile Hastoy 1,2 , Luis Ernesto Errazzu 3 , Carlos Jorge Budeguer 4 , Philippe Boutié 2 , Dominique Rolin 1 and Valérie Schurdi-Levraud 1* Abstract Background: Stevia rebaudiana (Asteraceae), native from Paraguay, accumulates steviol glycosides (SGs) into its leaves. These compounds exhibit acaloric intense sweet taste which answers to consumer demands for reducing daily sugar intake. Despite the developpement of S. rebaudiana cultivation all over the world, the development of new cultivars is very recent, in particular due to a colossal lack of (1) germplasm collection and breeding, (2) studies on genetic diversity and its structuring, (3) genomic tools. Results: In this study, we developped 18 EST-SSR from 150,258 EST from The Compositae Genome Project of UC Davis (http://compgenomics.ucdavis.edu/data/). We genotyped 145 S. rebaudiana individuals, issued from thirty-one cultivars and thirty-one landraces of various origins worldwide. Markers polymorphic information content (PIC) ranged between 0.60 and 0.84. An average of 12 alleles per locus and a high observed heterozygoty of 0.69 could be observed. The landraces revealed twice as many private alleles as cultivars. The genotypes could be clustered into 3 genetic populations. The landraces were grouped in the same cluster in which the oldest cultivars “Eirete” and “MoritaIII” type are also found. The other two clusters only include cultivated genotypes. One of them revealed an original genetic variability. SG phenotypes could not discriminate the three genetic clusters but phenotyping showed a wide range of composition in terms of bitter to sweet SGs. Conclusion: This is the first study of genetic diversity in Stevia rebaudiana involving 145 genotypes, including known cultivars as well as landrace populations of different origin. This study pointed out the structuration of S. rebaudiana germplasm and the resource of the landrace populations for genetic improvement, even on the trait of SG’s composition. Keywords: Stevia rebaudiana, Genetic diversity, Cultivars, Landraces, Steviol glycosides © The Author(s). 2019 Open Access This article is distributed under the terms of the Creative Commons Attribution 4.0 International License (http://creativecommons.org/licenses/by/4.0/), which permits unrestricted use, distribution, and reproduction in any medium, provided you give appropriate credit to the original author(s) and the source, provide a link to the Creative Commons license, and indicate if changes were made. The Creative Commons Public Domain Dedication waiver (http://creativecommons.org/publicdomain/zero/1.0/) applies to the data made available in this article, unless otherwise stated. * Correspondence: [email protected] 1 UMR Biologie du Fruit et Pathologie, 1332, INRA Université de Bordeaux, 71 avenue Edouard Bourlaux, 33883 Villenave d’Ornon cedex, France Full list of author information is available at the end of the article Cosson et al. BMC Plant Biology (2019) 19:436 https://doi.org/10.1186/s12870-019-2061-y
Transcript of Genetic diversity and population structure of the sweet ...Stevia rebaudiana, native from Paraguay,...

RESEARCH ARTICLE Open Access
Genetic diversity and population structureof the sweet leaf herb, Stevia rebaudiana B.,cultivated and landraces germplasmassessed by EST-SSRs genotyping andsteviol glycosides phenotypingPatrick Cosson1, Cécile Hastoy1,2, Luis Ernesto Errazzu3, Carlos Jorge Budeguer4, Philippe Boutié2,Dominique Rolin1 and Valérie Schurdi-Levraud1*
Abstract
Background: Stevia rebaudiana (Asteraceae), native from Paraguay, accumulates steviol glycosides (SGs) into itsleaves. These compounds exhibit acaloric intense sweet taste which answers to consumer demands for reducingdaily sugar intake. Despite the developpement of S. rebaudiana cultivation all over the world, the development ofnew cultivars is very recent, in particular due to a colossal lack of (1) germplasm collection and breeding, (2) studieson genetic diversity and its structuring, (3) genomic tools.
Results: In this study, we developped 18 EST-SSR from 150,258 EST from The Compositae Genome Project of UCDavis (http://compgenomics.ucdavis.edu/data/). We genotyped 145 S. rebaudiana individuals, issued from thirty-onecultivars and thirty-one landraces of various origins worldwide. Markers polymorphic information content (PIC)ranged between 0.60 and 0.84. An average of 12 alleles per locus and a high observed heterozygoty of 0.69 couldbe observed. The landraces revealed twice as many private alleles as cultivars. The genotypes could be clusteredinto 3 genetic populations. The landraces were grouped in the same cluster in which the oldest cultivars “Eirete”and “MoritaIII” type are also found. The other two clusters only include cultivated genotypes. One of them revealedan original genetic variability. SG phenotypes could not discriminate the three genetic clusters but phenotypingshowed a wide range of composition in terms of bitter to sweet SGs.
Conclusion: This is the first study of genetic diversity in Stevia rebaudiana involving 145 genotypes, includingknown cultivars as well as landrace populations of different origin. This study pointed out the structuration of S.rebaudiana germplasm and the resource of the landrace populations for genetic improvement, even on the trait ofSG’s composition.
Keywords: Stevia rebaudiana, Genetic diversity, Cultivars, Landraces, Steviol glycosides
© The Author(s). 2019 Open Access This article is distributed under the terms of the Creative Commons Attribution 4.0International License (http://creativecommons.org/licenses/by/4.0/), which permits unrestricted use, distribution, andreproduction in any medium, provided you give appropriate credit to the original author(s) and the source, provide a link tothe Creative Commons license, and indicate if changes were made. The Creative Commons Public Domain Dedication waiver(http://creativecommons.org/publicdomain/zero/1.0/) applies to the data made available in this article, unless otherwise stated.
* Correspondence: [email protected] Biologie du Fruit et Pathologie, 1332, INRA Université de Bordeaux, 71avenue Edouard Bourlaux, 33883 Villenave d’Ornon cedex, FranceFull list of author information is available at the end of the article
Cosson et al. BMC Plant Biology (2019) 19:436 https://doi.org/10.1186/s12870-019-2061-y

BackgroundStevia rebaudiana, native from Paraguay, is a perennialspecies that accumulates steviol glycosides (SGs) into itsleaves. These natural compounds exhibit acaloric intensesweet taste. Leaves of S. rebaudiana were firstly used asa general sweetening agent by native people of Paraguayand Brazil [1]. Consumer demands for reducing dailysugar intake and for healthy products place S. rebaudi-ana production at the crossroad of these needs. Corre-lated to growing demand, S. rebaudiana’s cultivation isincreasing all over the world. The species can be grownin a wide range of climatic areas. Nevertheless, the culti-vation of S. rebaudiana as a crop is very recent and isdone on a small scale in the countries of origin. In 1964,its first commercial cultivation was reported in Paraguay(Katayama et al. 1976; Lewis 1992). Afterwards, great ef-forts were made by Sumida in 1971 to establish S.rebaudiana cultivation in Japan (Crammer & Ikan,1986). Later on, it was introduced as a crop in manycountries. In 2016, 80% of world stevia leaves productionwas coming from China with 50,000–60,000 tons of dryleaves per year [2]. Other significant producing countriesare located in Asia (Indonesia, India, Japan, Korea) andin America (Mexico, USA, and Canada) [3]. Recent regu-latory approval explains the newly beginning area of pro-duction in Europe [4].This recently developed crop suffers from a lack of
high-value adapted and traceable cultivars. Ninety culti-vars have been recently listed by Angelini et al. in 2016[5]. But, farmers’ practices show that most of the culti-vars that are produced are related to cultivars known as“Eirete”, “Criolla” and “Morita” type. They are sold asseeds, often through open-pollinated production as thespecies is self-incompatible [6]. These genotypes havebeen mainly bred through mass selection. Besides thesecurrently grown population cultivars, some others arepatented as those from the US S&W company [7] or theMalaysian PureCircle. These genotypes are mainly im-proved for SG’s yield and SG’s composition producingthe sweetest taste.However numerous other traits such as seed germin-
ation rate, flowering date, aerial biomass yield, responseto biotic and abiotic stresses are poorly improved. Then,identification of productive genetic resources and breed-ing is clearly needed.Collecting and studying germplasm is a key pillar to
start a breeding program. Diversity in plant genetic re-sources provides opportunity for plant breeders to developnew and improved cultivars with desirable characteristicsand is also fundamental to limit the genetic erosion. Noavailable public collection exists and only private compan-ies own collections that are not available. The phenotypicstudy of a limited number of genotypes have been con-ducted in different countries [8–10]. Since many years, the
use of molecular markers has improved significantly themanagement and utilization of crop genetic diversity [11].In Stevia, until recently, the lack of genomic informationhas made genotyping a bottleneck. Some molecularmarkers as RAPD [12] and ISSR [13] have been used inprevious studies to analyze the diversity in very small col-lection of individuals. RAPD have also been used to con-struct the first S. rebaudiana genetic map in 1999 [14].Due to their lack of repeatability these markers were aban-doned. Despite the huge development of crop sequencingin the recent years, S. rebaudiana has just been sequencedin 2017 by the private consortium PureCircle/Coca-Cola/Keygene [15]. The consortium declared to have sequencedone genotype but sequences have not been released yet.The lack of information on SNP markers confirmed theneed to develop SSR markers. For some orphan species asS. rebaudiana and for genetic populations analysis SSR re-main first choice markers [16, 17]. They still have greatapplicability due to their high polymorphism, relativelyeasy scoring, testable neutrality, and Mendelian inherit-ance. Kaur et al. and Bhandawat et al. [18, 19] developed aset of 52 and 17 SSR markers respectively through thescreening of 5548 stevia ESTs sequences from leaf tissuesretrieved from the NCBI. These markers were used toclassify forty randomly chosen genotypes from selection atCSIR Institute (India) or 12 local genotypes from North-ern India. These studies were pioneer in the developmentand use of SSR markers in S. rebaudiana. In 2013, theCompositae Genome Project released EST data from 15reference transcriptome assemblies for Compositae cropsor their wild relatives including S. rebaudiana [20]. Thislarge amount of sequences allowed to screen for SSR pat-terns and develop EST-SSR markers. To our knowledge,in S. rebaudiana no studies addressed the question of de-veloping molecular markers to classify germplasm and toquestion population structure. The purpose of this workwas 1) to develop and assess the applicability of EST-SSRsdeveloped for S. rebaudiana as markers in thirty-onelandraces genotypes and one hundred and fourteen culti-vated genotypes issued from thirty-one cultivars; 2) toidentify genetic diversity and population structure in S.rebaudiana’s landraces and cultivars and 3) to check thelink between genetic variability and its structure andphenotypic SG variability in cultivated and landracespopulations.
ResultsEST-SSR genotypingOf the 150,258 unigenes, 3401 SSR pattern could be de-tected, 1745 being unique. These 1745 SSR are dividedinto 6% of mono-nucleotide, 16% of di-nucleotide, 52%of tri-nucleotide, 11% of tetra-nucleotide and 15% ofpenta-nucleotide (Fig. 1 and Additional file 2: Table S1).Among these 1745, 1060 were considered suitable for
Cosson et al. BMC Plant Biology (2019) 19:436 Page 2 of 11

primer design (Table 1). More than 60% are tri-nucleotide repeat type. Ninety-four with 10 to 26 repeatswere selected for primer design (Additional file 1: FigureS1). Screened with 5 genotypes, 19 did not produce anyamplification, 5 generated PCR products over 300 bpsize and 17 monomorphic or multiloci profiles. Fifty-three primer pairs amplified a polymorphic fragment.Eighteen were selected for population studies, based onthe multiplexing possibility (Additional file 2: Table S2).
Genetic variabilityA panel consisting of 145 individual plants (Table 2 andAdditional file 2: Table S3) was genotyped with the 18 se-lected markers. A total of 213 alleles were detected in the145 individual plants analyzed (Table 3). The number of al-leles detected per locus ranged between 5 and 19 (stvia021;stvia048 respectively) with an average of 12 alleles per locus.Markers’ PICs ranged between 0.60 (stvia021) and 0.84(stvia025 and stvia051). The average observed and expectedheterozygoty across markers were Ho = 0.69 (min–max:0.46 (stv018)-0.87 (Stv036)) and He = 0.78 (min–max:0.66–0.86). The allelic richness calculated as the meannumber of private alleles ranged from 1.5 for cultivated ge-notypes to 3 for landraces (Additional file 1: Figure S2).
Population structureThe change rate in the log-likelihood between successiveK values (DK) inferred with STRUCTURE revealed threeclusters with a relatively high ΔK value at K = 3 (Fig. 2a).We used STRUCTURE membership coefficients inferredat K = 3 to define the populations used in subsequentanalyses. For analyses hereafter, genotypes were assignedto a given population if their membership coefficient forthat population was ≥0.80. Thus, genotypes with anidentity value under 80% probability of belonging to agiven subpopulation were considered as admixed. Basedon this, cluster 1 had 24 accessions, cluster 2 had 48 ac-cessions and cluster 3, 54. Nineteen accessions wereadmixed (Additional file 2: Table S4). At K = 3 (Fig. 2a),the cultivated Stevia were shown to belong to the threeclusters (named cluster 1, 2 and 3) whereas the landracesfrom Argentina and Cuba belonged to cluster 2. In thiscluster 2, cultivated stevia belong to the oldest selectionsknown as “EireteI”, “EireteII” and “MoritaIII” types butalso with the “C” and “D” cultivars more recently selectedin Germany and belonging to the EUSTAS collection.
Genetic variation and differentiation among the threestevia clustersWe built a Neighbor-Joining tree of the 126 non-admixed individuals (Additional file 2: Table S4) basedon dissimilarity scores. The dendrogram showed threemajor clades (Fig. 2b). Structure of the dendrogram wasin agreement with the clustering inferred with STRUCTURE, distinguishing three clades corresponding to clus-ters 1 (in red), 2 (in blue) and 3 (in orange) except forsome genotypes, CULT75_GER, CULT02_CAN andCULT40_FRA. Dendrograms of clusters provided an in-teresting pattern with a clear differentiation of cultivatedstevia cluster 1. The PCA (Fig. 3) revealed a similar pat-tern as inferred with STRUCTURE, with a clear differen-tiation of cultivated stevia cluster 1, clearly separatedfrom the other stevia clusters.
Fig. 1 Summary of the distribution of the number of repetitionsobserved in the total of 1745 unique SSRs selected from the 150,258unigenes available for Stevia rebaudiana at http://compgenomics.ucdavis.edu/data/cwassy_2012/iAssSta.fa (The Compositae GenomeProject of UC Davis)
Table 1 Information summary on the number and percentageof each SSR selected through the pipeline Additional file 1:Figure S1
Searching items Numbers
Total number of unigene 150,258
Total number of SSR detected 3401
Total number of unique SSR (Blast <80%) 1745
Total number of SSR suitable for primer design a 1060
Repeat type Percentage
mono-nucleotide 56 5.28
di-nucleotide 107 10.09
tri-nucleotide 655 61.79
tetra-nucleotide 108 10.19
penta-nucleotide 134 12.64
Total 1060 100.00a minimum 100 pb each side
Cosson et al. BMC Plant Biology (2019) 19:436 Page 3 of 11

Table 2 List of Stevia rebaudiana cultivated and landraces genotypes used in the current study
IDa Type of materialb Originc Number of cultivarsd Total number ofgenotypes
Cult_CAN Cultivar Canada 3 13
Cult_CHI Cultivar China 2 15
Cult_FRA Cultivar France 12 34
Cult_GER Cultivar Germany 8 20
Cult_ISR Cultivar Israël 1 5
Cult_NET Cultivar Netherlands 2 9
Cult_SPA Cultivar Spain 3 18
Lr_FOR Landrace Argentina 1
Lr_JUJ Landrace Argentina 9
Lr_MIS Landrace Argentina 9
Lr_TUC Landrace Argentina 10
Lr_CUB Landrace Cuba 2aIdentificationbCultivars refer to sold genotypes through commercial providers. They were provided as seed lotscCountry of the provider or origin of the landrace; Landraces from Cuba were provided by the New York Botanical Garden Herbarium, catalog number 1687090and 1,687,091, collection number 5353, collected in Cuba in 1927 and 1931dDetails of ID of each genotype per cultivar is given in Additional file 2: Table S1
Table 3 Polymorphism analysis at 18 loci of Stevia rebaudiana genome for 145 genotypes
Markers Name AlleleNumber
Product sizeexpected
Allele sizerange
Major AlleleFrequency
PICa Gene Diversity(He)
Heterozygosity(Ho)b
FisW&Cc
stvia004 17 185 166–226 0.32 0.81 0.83 0.79 ns 0.047
stvia018 13 121 89–134 0.22 0.82 0.84 0.46*** 0.452
stvia021 5 119 97–121 0.38 0.60 0.67 0.47*** 0.299
stvia024 16 205 173–220 0.25 0.83 0.84 0.69*** 0.18
stvia025 15 224 203–243 0.21 0.84 0.86 0.70*** 0.193
stvia036 15 163 144–180 0.28 0.83 0.85 0.87*** −0.021
stvia044 9 208 203–221 0.36 0.70 0.74 0.49*** 0.341
stvia048 19 153 132–163 0.31 0.82 0.84 0.84 ns 0.002
stvia051 13 194 182–224 0.23 0.84 0.86 0.81*** 0.062
stvia057 16 236 190–265 0.28 0.77 0.80 0.68*** 0.156
stvia071 8 187 168–191 0.36 0.74 0.77 0.74 ns 0.038
stvia072 10 239 231–251 0.56 0.63 0.65 0.61*** 0.057
stvia079 13 173 153–198 0.29 0.80 0.82 0.79*** 0.035
stvia084 11 159 142–178 0.49 0.70 0.72 0.70 ns 0.041
stvia093 12 221 205–247 0.38 0.78 0.80 0.79*** 0.017
stvia096 8 204 174–213 0.29 0.75 0.78 0.76*** 0.033
stvia099 6 111 88–121 0.34 0.66 0.71 0.66 ns 0.076
stvia107 7 125 125–143 0.52 0.61 0.65 0.61 ns 0.062aPIC Polymorphic information contentbChi-square test for Hardy-Weinberg equilibrium; ns = not significant; ***P < 0.001cFIS W&C FIS Weir and Cockerham (1984) [47]
Cosson et al. BMC Plant Biology (2019) 19:436 Page 4 of 11

We computed population genetic statistics for thethree genetic populations (Table 4). The inbreeding co-efficients (Fis) were all low but positive. This result canbe linked to the significant Chi-square test for Hardy-Weinberg equilibrium on most of the markers (Table 3),related to the putative kinship within the seeds lots.High genetic diversity was found in the cultivated popu-lations clusters 1 and 3 with He = 0.725 and 0.753 re-spectively and in the mixed landraces and cultivatedcluster 2 (He = 0.801).Pairwise FST among the three stevia populations were
all significant (Table 5). They indicated a differentiationbetween the three populations. AMOVA was used to es-timate the variance among and within populations(Table 6). The results indicated that the majority of gen-etic variation was due to a remarkable degree of withinpopulation variation (98%; Table 6). Only 2% of the
genetic variation was attributed to differences amongpopulations.
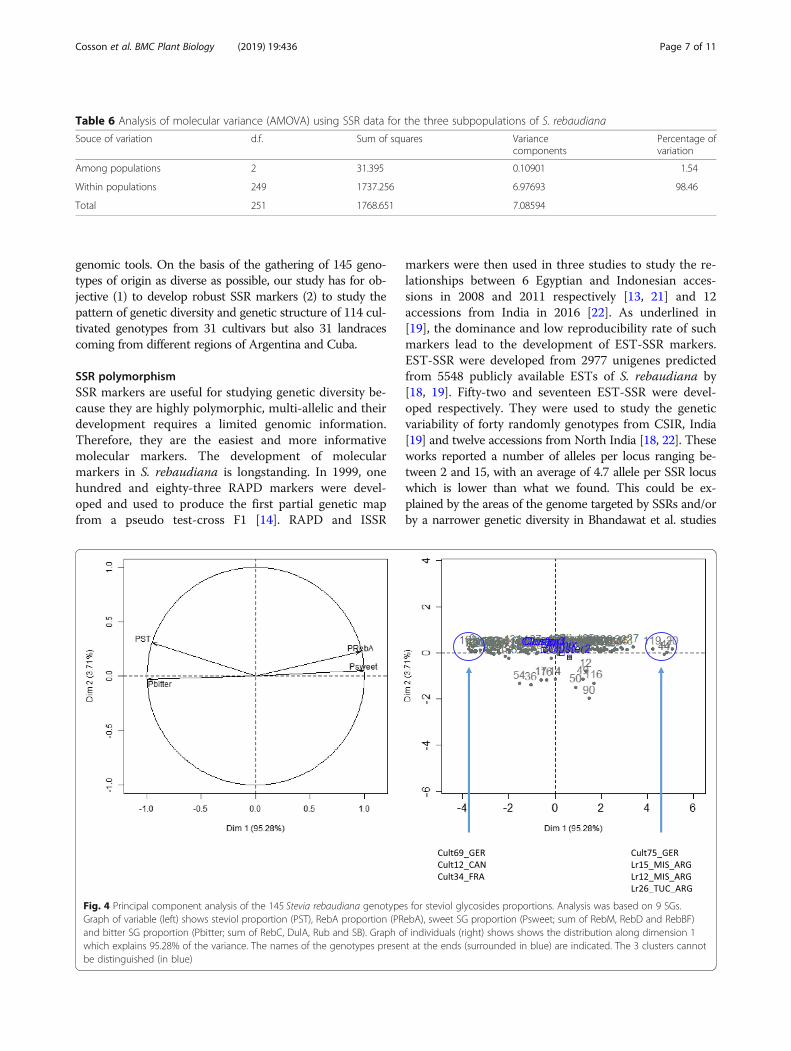
Variation of steviol glycosides composition among SteviapopulationsThe analyses above revealed high genetic diversity incultivated as in stevia landraces. In order to evaluate theclassification of the different populations according totheir SG composition, we estimated the ratio of steviol(ST), RebA, sweet SG as the sum of RebM, RebD andRebBF and bitter SG as the sum of RebC, DulA, Ruband SB. Expectedly, the graph of the variables contrastedthe sweet-flavored SGs such as RebA and sweet SG withstevioside and bitter SG (Fig. 4). The graph of the indi-viduals showed a distribution along the first dimensionseparating the genotypes presenting the most sweetietaste SG until those presenting a dominant bitterness.
Fig. 2 Population structure analysis of the cultivated and landraces stevia inferred using the model-based program STRUCTURE at K = 3. aProportions of ancestry of cultivated and landraces Stevia rebaudiana accessions (n = 145) inferred with STRUCTURE for K = 3. Each individual isrepresented by a vertical bar, partitioned into colored segments in proportion of the estimated membership in the different genetic clustersinferred with STRUCTURE. Under the figure are depicted the two groups of genotypes cultivated (CULT) or landraces (LR) and color and names ofthe three clusters. b Neighbor-Joining dendrogram based on DICE dissimilarity indices showing the relationships among the nonadmixed 126Stevia rebaudiana individuals (i.e. individuals assigned to one cluster at K = 3 with a membership coefficient > 0.80). Genotypes were coloredaccording to their assignment to the three different genetic clusters, as inferred by STRUCTURE. Branch length is proportional to the distancebetween nodes
Cosson et al. BMC Plant Biology (2019) 19:436 Page 5 of 11

Interestingly, the 3 genetic populations appear little dif-ferentiated for the content trait in the different SGs, the3 clusters being grouped in the center of the graph ofthe individuals. Clusters 1 and 3 appear superimposed.Nevertheless, it should be noted that the cluster 2,stands out slightly towards the highest compositions inSG of sweet taste. Thus, the genotypes that explain themost the composition of sweet taste SG are 3 genotypes
of populations of Argentina (Lr15_MIS_ARG, Lr12_MIS_ARG and Lr26_TUC_ARG) as well as the culti-vated genotype Cult75_GER which is the improvedgenotype “C” of the EUSTAS collection (Hastoy et al.,2019). The genotypes that explain the most the com-position in bitter SG are essentially cultivated geno-types such as Cult69_GER, Cult12_CAN and Cult34_FRA.
DiscussionThe gathering and in-depth study of genetic resources is anessential step in setting up a breeding program. S. rebaudi-ana has a recognized interest in health and the associatedindustry is now highly developed and world-wide. Never-theless, the optimized improvement of Stevia is in its veryearly stages. Breeding programs are relatively new. In par-ticular, they suffer from the critical lack of in-depth infor-mation on genetic resources associated with a lack of
Fig. 3 Principal component analysis of the 145 Stevia rebaudiana genotypes for steviol glycosides proportions. Analysis was based on 9 SGs.Graph of variable (left) shows steviol proportion (PST), RebA proportion (PRebA), sweet SG proportion (Psweet; sum of RebM, RebD and RebBF)and bitter SG proportion (Pbitter; sum of RebC, DulA, Rub and SB). Graph of individuals (right) shows the distribution along dimension 1 whichexplains 95.28% of the variance. The names of the genotypes present at the ends (surrounded in blue) are indicated. The 3 clusters cannot bedistinguished (in blue).
Table 4 Summary statistics of genetic variation among thethree Stevia rebaudiana populations detected with STRUCTURE
Pop N Na Ne Ho He Fis
Cluster1 Mean 24 6.444 3.833 0.623 0.725 0.140
SE 0.372 0.203 0.040 0.016 0.054
Cluster2 Mean 48 10.778 5.626 0.723 0.801 0.100
SE 0.823 0.433 0.031 0.017 0.031
Cluster3 Mean 54 8.611 4.441 0.690 0.753 0.083
SE 0.652 0.307 0.031 0.020 0.032
N = sample sizeNa = No. of Different AllelesNe = No. of Effective Alleles = 1/(Sum pi
2)Ho = Observed Heterozygosity = No. of Heterozygotes/NHe = Expected Heterozygosity = 1 - Sum pi
2
He = Unbiased Expected Heterozygosity = (2 N / (2 N-1)) * HeFis = Fixation Index = (He - Ho) / He = 1 - (Ho / He)Where pi is the frequency of the ith allele for the population & Sum pi
2 is thesum of the squared population allele frequencies
Table 5 Pairwise Population Matrix of Fst Values for Total
Cluster1 Cluster2 Cluster3
Cluster1 0.000 0.001 0.046
Cluster2 0.020 0.000 0.004
Cluster3 0.013 0.012 0.000
Fst values below the diagonal. Probability, P(rand > = data) based on 999permutations is shown above diagonal
Cosson et al. BMC Plant Biology (2019) 19:436 Page 6 of 11
genomic tools. On the basis of the gathering of 145 geno-types of origin as diverse as possible, our study has for ob-jective (1) to develop robust SSR markers (2) to study thepattern of genetic diversity and genetic structure of 114 cul-tivated genotypes from 31 cultivars but also 31 landracescoming from different regions of Argentina and Cuba.
SSR polymorphismSSR markers are useful for studying genetic diversity be-cause they are highly polymorphic, multi-allelic and theirdevelopment requires a limited genomic information.Therefore, they are the easiest and more informativemolecular markers. The development of molecularmarkers in S. rebaudiana is longstanding. In 1999, onehundred and eighty-three RAPD markers were devel-oped and used to produce the first partial genetic mapfrom a pseudo test-cross F1 [14]. RAPD and ISSR
markers were then used in three studies to study the re-lationships between 6 Egyptian and Indonesian acces-sions in 2008 and 2011 respectively [13, 21] and 12accessions from India in 2016 [22]. As underlined in[19], the dominance and low reproducibility rate of suchmarkers lead to the development of EST-SSR markers.EST-SSR were developed from 2977 unigenes predictedfrom 5548 publicly available ESTs of S. rebaudiana by[18, 19]. Fifty-two and seventeen EST-SSR were devel-oped respectively. They were used to study the geneticvariability of forty randomly genotypes from CSIR, India[19] and twelve accessions from North India [18, 22]. Theseworks reported a number of alleles per locus ranging be-tween 2 and 15, with an average of 4.7 allele per SSR locuswhich is lower than what we found. This could be ex-plained by the areas of the genome targeted by SSRs and/orby a narrower genetic diversity in Bhandawat et al. studies
Table 6 Analysis of molecular variance (AMOVA) using SSR data for the three subpopulations of S. rebaudiana
Souce of variation d.f. Sum of squares Variancecomponents
Percentage ofvariation
Among populations 2 31.395 0.10901 1.54
Within populations 249 1737.256 6.97693 98.46
Total 251 1768.651 7.08594
Fig. 4 Principal component analysis of the 145 Stevia rebaudiana genotypes for steviol glycosides proportions. Analysis was based on 9 SGs.Graph of variable (left) shows steviol proportion (PST), RebA proportion (PRebA), sweet SG proportion (Psweet; sum of RebM, RebD and RebBF)and bitter SG proportion (Pbitter; sum of RebC, DulA, Rub and SB). Graph of individuals (right) shows shows the distribution along dimension 1which explains 95.28% of the variance. The names of the genotypes present at the ends (surrounded in blue) are indicated. The 3 clusters cannotbe distinguished (in blue)
Cosson et al. BMC Plant Biology (2019) 19:436 Page 7 of 11

[19] and in Kaur et al. studies [18], focused on Indian geno-types. It has also been shown in durum wheat [23], in egg-plant [24] or in opium poppy [25] that genomic SSRs aremore polymorphic than EST-SSRs.Nevertheless, in both studies and our, average Ho was
high, 0.80 and 0.69 respectively, in accordance with thereported outcross mating system of S. rebaudiana [6].
Population structure and genetic diversityThe population structure and dendogram analyses dividedthe accessions into three clusters/subpopulations, althoughthe analyses are based on different methods. The low num-ber of admixed genotypes (19/145) can be explained by thecomposition of the collection, 78% (114/145) of which arecultivated varieties and 22% (31/145) of landraces. No wildgenotypes could be analyzed. In addition, the varietiesgrown are often produced by crossing between two identi-fied parents. The use of a limited number of parents mayalso explain the low number of admixed.Except for the two Chinese cultivars belonging to admix
cluster, no regional aggregation could be observed. Cluster1, in particular, gathers genotypes from Canada, Germanyand Israël, indicating large seed and alleles exchanges inStevia. Cluster 1 and Cluster 3 consisted essentially of culti-vated varieties. Cluster 1 seems to reveal original diversity.It contains the genotype “Gawi” selected in Germany [26,27] but of unknown origin [28]. Nevertheless, in our previ-ous study on the phenotype of 15 genotypes from variousorigin in southwestern France field conditions, “Gawi’ wasshown to belong to a different morphotype from “Eirete”on the basis of foliar biomass production [28]. Cluster 3also consist of cultivated varieties, some of them being soldas “Criolla” type. In a very interesting way, the Argentinelandraces as well as the old samples from Cuba are allgrouped in the cluster 2. Landraces revealed a mean num-ber of private allele per locus around twice the mean of cul-tivated genotypes. This cluster is shared with cultivatedvarieties, type “Eirete” and “MoritaIII”, known to be var-ieties formerly improved and very widespread in the world.AMOVA results showed that the genetic differentiation
was overwhelmingly due to within population variation. Asour study is the first large study on S. rebaudiana genetic re-sources, there is no reference study. But, similar results havebeen observed in other outcrossing perennials such as alfalfa(Medicago sativa) [29], Dalmatian Pyrethrum (Tanacetumcinerariifolium) [30] or agronomic switchgrass (Panicum vir-gatum) [31]. The high level of genetic variability observedwithin populations of such species is most likely due to theirpartial or completely allogamous reproductive systems.
SG phenotypingPhenotyping of SGs does not allow to structure the differ-ent populations. The three genetic populations differed very
little based on this trait. Surprisingly, it is the landracespopulations that appear to draw towards the quality ofsweetness in SG, while cluster 1 and 3, composed only ofcultivars cannot be distinguished. They are composed ofcultivars producing very varied SGs, from bitter to sweet,which may seem surprising considering that the ratio SGsoft/bitter is the first selection criterion in Stevia [5].
ConclusionsOur study is the first analysis of genetic diversity in S.rebaudiana involving 145 genotypes, including known cul-tivars as well as landrace populations of different origin.This study generated 18 new highly polymorphic and ro-bust microsatellite markers. These markers are of great po-tential for genetic diversity evaluation and germplasmmanaging which is a crucial step of breeding. Thesemarkers could also be used for genotypes traceability. The145 genotypes of S. rebaudiana were successfully geno-typed. They revealed three genetic populations with a re-markable variation within population. Landraces revealedtheir allelic richness and their interest in term of sweet SGphenotype. They harbor valuable genetic variation for fur-ther improvement via breeding as shown through theirphenotyping in Argentina [32].
MethodsPlant materialsA panel consisting of 145 individual plants belonging to S.rebaudiana was collected from different origins (Table 2and Additional file 2: Table S3). One hundred and fourteengenotypes called “cultivated” issued from thirty-one culti-vars were obtained from different providers as seed lots anddistributed as follow: 13 from Canada, 15 from China, 34from France, 20 from Germany, 5 from Israël, 9 from TheNetherlands and 18 from Spain. Thirty-one are landraces.Twenty-nine are originated from North Argentina, regionsof Formosa, Tucuman, Jujuy and Misiones and belong toINTA collection [32]. Two, catalog number 1687090 and 1,687,091, collection number 5353, were provided by theNew York Botanical Garden Herbarium. They were col-lected in Cuba in 1927 and 1931, respectively.
SSR genotypingIdentification of EST-SSR markersMicrosatellite or SSRs were developed from 150,258 ESTgenerated on 454 sequencing and downloaded from TheCompositae Genome Project of UC Davis (http://compge-nomics.ucdavis.edu/data/cwassy_2012/iAssSta.fa) accordingto the pipeline described in Additional file 1: Figure S1. Theprogram Sputnik (http://abajian.net/sputnik/) were used toidentify EST containing SSR. For SSR identification, theminimum motif repeats were defined as 20 repeats for amononucleotide unit, 10 repeats for a dinucleotide unit, 7repeats for trinucleotide unit, 5 repeats for tetranucleotide
Cosson et al. BMC Plant Biology (2019) 19:436 Page 8 of 11
unit and 4 repeats for pentanucleotide unit. Primer pairsflanking the SSRs were designed using Primer3Plus [33]with melting temperatures 52–57 °C, primer lengths 18–24bp, expected fragment size 100–300 bp. All the designedprimers were screened on five samples, Cult32_FRA,Cult33_FRA, Cult34_FRA, Cult36_FRA, Cult37_FRA. Theprimers producing clear and polymorphic bands were sub-sequently used for genetic diversity assessments.
DNA extraction and molecular genotypingGenomic DNA was extracted using a modified previ-ously published protocol [34]. Young leaves weredehydrated in the oven at 55 °C for 48 h, and thenground to fine powder in a Grinobender. One ml ofbuffer (0.1 M Tris-HCl pH 8, 0.7 M NaCl, 0.04MEDTA, 1% HATMAB, plus 1% β-mercaptoethanol and50 μg/ml proteinase K added just before use) wasadded to 30 mg of powder and incubated for 60 minat 65 °C, gently mixing by inversion every 15 min.After Chloroform: IsoAmylic Alcohol extraction, iso-propanol precipitation and 70% ethanol washing,DNA was resuspended in 100 μl of pure water. Gen-omic DNA was quantified on Epoch Microplate Spec-trophotometer (BioTek).PCR amplifications were performed in 15 μl reaction
volume containing 10 ng of template DNA, 1 X PCRbuffer (10 mM Tris-HCl pH 8.3; 50 mM KCl), 2.5 mMMgCL2, 0.2 μM of each primer, 200 μM of each DNTP’sand 0.5 U SurePRIME™ DNA polymerase (MP Biomedi-cals). The amplifications were performed in a Mastercy-cler Pro (Eppendorf) with the following PCR protocol:15 min initial denaturation at 95 °C and 35 cycles of 30 sat 94 °C, 45 s at 55 °C, 60 s at 72 °C, followed by a finalextension for 10 min at 72 °C.PCR amplicons were separated on denaturing polyacryl-
amide gels consisting of 4.5% polyacrylamide (acrylamide:bis-acrylamide 19: 1) and 7M urea in 1× TBE buffer. Afterrun, amplified fragments were visualized using silver stain-ing protocol [35].Fragments were genotyped at each locus, and the allele
sizes were scored using 10–330 bp ladder (Invitrogen).
Genetic variationAllele frequencies and genetic diversity measures werecalculated using PowerMarker 3.25 [36] and GenAlEx6.5 [37]. These measures included number of alleles(Na), major allele frequency, polymorphic informationcontent (PIC), expected heterozygosity or Gene Diversity(He), observed heterozygosity (Ho). Inbreeding coeffi-cient (Fis) was calculated using SPAGEDI 1.3 [38] andverified with GENETIX v4.05 [39]. Private allelic rich-ness was computed with ADZE software to adjust forsample size differences [40]. We further explored the
genetic differentiation and relationships among samplesusing an unweighted Neighbor-Joining tree constructedusing simple matching dissimilarity indices of Jaccard’scoefficient method and bootstrap values over 2000 repli-cates as implemented in the DARWIN software packagev6.0.010 [41]. Among-population FST and Nei’s indiceswere estimated using ARLEQUIN v3.5 [42]. The signifi-cance of FST was assessed by random resampling of thegenotypic data through 1000 permutations.
Population structureRepresentation of the genetic relationships among individ-uals was explored with a principal component analysis(PCA) performed with GENETIX v4.05 [39]. We also usedthe individual based Bayesian clustering method imple-mented in STRUCTURE 2.3.3 [43] to investigate populationsubdivision. We ran STRUCTURE from K= 2 to K= 10using admixture and correlated allele frequencies assumingno prior population information. Burn-in and number ofMarkov chain Monte Carlo iterations were set to 10,000and 100,000, respectively. Ten independent runs were car-ried out for each K, and outputs were processed withCLUMPP V1.1.2 [44]. STRUCTURE barplots were displayedusing DISTRUCT 1.1 [45]. We examined the distribution ofΔK, plotted with STRUCTURE harvester (http://taylor0.biology.ucla.edu/structureHarvester/) according to Evannoet al. (2005) [46].
Steviol glycosides extraction and quantificationSteviol glycosides extraction and quantification was doneas described in Hastoy et al. (2019) [28]. Nine SGs weredetected at 202 nm (RebD, RebM, ST, RebA, RebC,DulA, Rub, RebB, SB) and previously identified by puri-fied SG standard (Chromadex, USA). For each SG, astandard range between 5 and 1000 ng/μL of purifiedstandard was used to quantify each amount. Resultswere expressed as content per unit of leaf dry weight (%w/w) for each SG and total SGs, and as a proportion (%)of the content of each SG to total SG content.
Supplementary informationSupplementary information accompanies this paper at https://doi.org/10.1186/s12870-019-2061-y.
Additional file 1: Figure S1. Summary of the pipeline for the selectionof the 18 SSRs used in the current study. Figure S2. Mean number ofprivate alleles per locus and mean number of distinct allele per locus forthe cultivated and landraces genotypes computed with ADZE software
Additional file 2: Table S1. Type and number of repeat pattern of the1745 unique SSR among the 150,258 unigenes available for Steviarebaudiana at http://compgenomics.ucdavis.edu/data/cwassy_2012/iAssSta.fa (The Compositae Genome Project of UC Davis). Table S2. Listof the 18 SSR and related primers and characteristics used in this study.Table S3. List of Stevia rebaudiana cultivated and landraces groupsstudied. Table S4. Distribution of the studied genotypes in the differentclusters and admix following the analysis by Structure
Cosson et al. BMC Plant Biology (2019) 19:436 Page 9 of 11

AcknowledgementsAuthors thank the Director of the Herbarium and Dr. Tom Zanoni from TheNew York Botanical Garden, Bronx, NY 10458-5126 (USA) for providing thesamples from Cuba, Coralie Chesseron (INRA, Bordeaux, France) for plant pro-duction and Pierre Jannot for scientific support (Rouages, Agen, France).Grateful thanks to Dr. S. Mariette (INRA, UMR BIOGECO, France) for criticalreading of the manuscript.
Authors’ contributionsVSL conceived and designed the experiments with the contribution of PC andDR; PC developed the EST-SSR. PC and CH performed the experiments. PB, LEEand CJB contributed to material supply; VSL and PC analyzed the data. VSLwrote the paper with proofreading from DR, LEE and CJB All authors read andapproved the final version of the manuscript.
FundingC. Hastoy was supported by ANRT n° 2014/0915 funding and Oviatis SA,France. Nouvelle-Aquitaine region supported the work through Cifre specificfundings.
Availability of data and materialsAll data generated or analysed during this study are included in thispublished article as supplementary information files.
Ethics approval and consent to participateNot applicable.
Consent for publicationNot applicable.
Competing interestsThe authors declare that they have no competing interests.
Author details1UMR Biologie du Fruit et Pathologie, 1332, INRA Université de Bordeaux, 71avenue Edouard Bourlaux, 33883 Villenave d’Ornon cedex, France. 2OviatisSA, Le Bourg, 47150 Lacaussade, France. 3INTA INTA-EEA Famaillá CP 4132Famaillá, Tucumán, Argentina. 4FAZ, National University of Tucumán,Tucumán, Argentina.
Received: 28 April 2019 Accepted: 29 September 2019
References1. Soejarto DD. Botany of Stevia and S. rebaudiana. Stevia: The genus Stevia.
2002;Taylor an:18–39.2. Sun J. Development of Stevia and steviol glycosides industry in China. Proc
9th Stevia Symp 2016, EUSTAS, Sweden, 15-16th Sept 2016, Jan MC GeunsEd. 2016;145–50.
3. Gantait S, Das A, Banerjee J. Geographical distribution, botanical descriptionand self-incompatibility mechanism of genus Stevia. Sugar Tech. 2018;20:1–10.
4. Commission Regulation (EU). No 1131/2011 of 11 November 2011amending Annex II to Regulation (EC) No 1333/2008 of the EuropeanParliament and of the Council with regard to steviol glycosides. Off J EurUnion. 2011;amending A:L295/205 L295/211.
5. Angelini LG, Martini A, Passera B, Tavarini S. Cultivation of S. rebaudianaBertoni and associated challenges. In: Sweeteners. Cham: SpringerInternational Publishing; 2016. 1–52.
6. Yadav AK, Dhyani D, Ahuja PSSS. A review on the improvement of Steviarebaudiana (Bertoni). Can J Plant Sci. 2011;91:1–27.
7. Parris CA, Shock CC, Qian M. Dry leaf and steviol glycoside productivity ofStevia rebaudiana in the Western United States. HortScience. 2016;51:1220–7.
8. Barbet-Massin C, Giuliano S, Alletto L, Daydé J, Berger M. Towards a semi-perennial culture of Stevia rebaudiana (Bertoni) Bertoni under temperateclimate: effects of genotype, environment and plant age on steviolglycoside content and composition. Genet Resour Crop Evol. 2016:685–94.
9. Grevsen K, Sorensen JN. 2nd year cultivation results of the Danish “GreenStevia” project-a natural sweetener for organic food products. From Field toFork, Proc 9th Stevia Symp 2016, EUSTAS, Sweden, 15-16th Sept 2016, JanMC Geuns Ed. 2016;:115–26.
10. Lankes C, Grosser P. Evaluation of Stevia rebaudiana genotypes at a locationin the Alentejo region in Portugal. Proc 8th Stevia Symp 2015, EUSTAS,Bonn, Ger Geuns JMC, Ceunen S, Eds. 2015;167–76.
11. Govindaraj M, Vetriventhan M, Srinivasan M. Importance of genetic diversityassessment in crop plants and its recent advances: an overview of itsanalytical perspectives. Genet Res Int. 2015;215:14.
12. Chester K, Tamboli ET, Parveen R, Ahmad S. Genetic and metabolic diversity inStevia rebaudiana using RAPD and HPTLC analysis. Pharm Biol. 2013;51:771–7.
13. Hadia HA, Badawy O, Hafez AM. Genetic relationships among some Stevia(Stevia rebaudiana Bertoni) accessions based on ISSR analysis. Res J Cell MolBiol. 2008;2:1–5.
14. Yao Y, Ban M, Brandle J. A genetic linkage map for Stevia rebaudiana.Genome. 1999;42:657–61.
15. Schauer S, Huang T, Samuel P, Khazi F, Markosyan A. Insights from thesequencing and annotation of the Stevia rebaudiana genome and theirapplication in agronomy and health. Ann Nutr Metab. 2017;71:1316–7.
16. Hodel RG, Segovia-Salcedo MC, Landis JB, Crowl AA, Sun M, Liu X, et al. Thereport of my death was an exaggeration: a review for researchers usingmicrosatellites in the 21st century. Appl Plant Sci. 2016;4.
17. Carneiro Vieira ML, Santini L, Diniz AL, de Freitas Munhoz C. microsatellitemarkers: what they mean and why they are so useful. Genet Mol Biol. 2016;39:312–28.
18. Kaur R, Sharma N, Raina R. Identification and functional annotation ofexpressed sequence tags based SSR markers of Stevia rebaudiana. Turkish JAgric For. 2015;39:439–50.
19. Bhandawat A, Sharma H, Nag A, Singh S, Singh Ahuja P, Kumar SR.Functionally relevant novel microsatellite markers for efficient genotyping inStevia rebaudiana Bertoni. J Genet. 2014;93:75–81.
20. Hodgins KA, Lai Z, Oliveira LO, Still DW, Scascitelli M, Barker MS, et al. Genomicsof Compositae crops: reference transcriptome assemblies and evidence ofhybridization with wild relatives. Mol Ecol Resour. 2014;14:166–77.
21. Dyah S, Rina Sri K, Budi SD. Genetic diversity of Stevia (Stevia rebaudiana(Bertoni) Bertoni) based on molecular characters. Int Conf Biosci BiotechnolProc. 2011;1:37–43.
22. Sharma N, Kaur R, Era V. Potential of RAPD and ISSR markers for assessinggenetic diversity among Stevia rebaudiana Bertoni accessions. Indian JBiotechnol. 2016;15:95–100.
23. Eujayl I, Sorrells M, Baum M, Wolters P, Powell W. Assessment of genotypicvariation among cultivated durum wheat based on EST-SSRS and genomicSSRS. Euphytica. 2001;119:39–43.
24. Muñoz-Falcón JE, Vilanova S, Plazas M, Prohens J. Diversity, relationships,and genetic fingerprinting of the Listada de Gandía eggplant landraceusing genomic SSRs and EST-SSRs. Sci Hortic. 2011;129:238–46.
25. Şelale H, Çelik I, Gültekin V, Allmer J, Doğanlar S, Frary A. Development ofEST-SSR markers for diversity and breeding studies in opium poppy. PlantBreed. 2013;132:344–51.
26. Zabala UM. Optimierung von Wachstum und Ertrag ( Süßstoffbildung ) beiStevia rebaudiana Bertoni unter mitteleuropäischen Standortbedingungen.Rheinischen Friedrich-Wilhelms-Universität Bonn; 2011.
27. Lankes C, Zabala U. Evaluation of Stevia rebaudiana genotypes. Proc 5thStevia Symp 2011, EUSTAS, Belgium, Jan MC Geuns Ed. 2011;75–87.
28. Hastoy C, Cosson P, Cavaignac S, Boutié P, Waffo-Teguo P, Rolin D, et al.Deciphering performances of fifteen genotypes of Stevia rebaudiana insouthwestern France through dry biomass and steviol glycoside evaluation.Ind Crop Prod. 2019;128:607–19.
29. Yin S, Wang Y, Nan Z. Genetic diversity studies of alfalfa germplasm(Medicago sativa L. subsp sativa) of United States origin using microsatelliteanalysis. Legum Res. 2018;41:202–7.
30. Grdisa M, Liber Z, Radosavljevic I, Carovic-Stanko K, Kolak I, Satovic Z. Geneticdiversity and structure of Dalmatian pyrethrum (Tanacetum cinerariifoliumTrevir./Sch./Bip., Asteraceae) within the Balkan Refugium. PLoS One. 2014;9.
31. Nageswara-Rao M, Stewart CN, Kwit C. Genetic diversity and structure ofnatural and agronomic switchgrass (Panicum virgatum L.) populations.Genet Resour Crop Evol. 2013;60:1057–68.
32. Moreno FE, Salomon V, Erazzú LE, Budeguer CJ, Maldonado LM. Steviarebaudiana (Bertoni) Bertoni: Determinación de Esteviósido y RebaudiósidoA en genotipos promisorios de una colección en Tucumán. Novena ReunProd Veg y Séptima Prod Anim del NOA S M Tucumán. 2016:393–8.
33. Untergasser A, Nijveen H, Rao X, Bisseling T, Geurts R, Leunissen JAM. Primer3Plus,an enhanced web interface to Primer3. Nucleic Acids Res. 2007;35:1–4.
34. Doyle J. Isolation of plant DNA from fresh tissue. Focus (Madison). 1990;12:13–5.
Cosson et al. BMC Plant Biology (2019) 19:436 Page 10 of 11

35. Bassam BJ, Caetano-Anollés G, Gresshoff PM. Fast and sensitive silverstaining of DNA in polyacrylamide gels. Anal Biochem. 1991;196:80–3.
36. Liu K, Muse SV. PowerMarker: an integrated analysis environment forgenetic marker analysis. Bioinformatics. 2005;21:2128–9.
37. Peakall R, Smouse PE. GenAlEx 6.5: genetic analysis in excel. Population geneticsoftware for teaching and research-an update. Bioinformatics. 2012;28:2537–9.
38. Hardy OJ, Vekemans X. SPAGEDi: a versatile computer program to analysespatial genetic structure at the individual or population levels. Mol EcolNotes. 2002;2:618–20.
39. Belkhir K, Borsa P, Chikhi L, Raufaste N, Bonhomme F. GENETIX 4.05, logicielsous Windows TM pour la génétique des populations. Laboratoire Génome,Populations, Interactions, CNRS UMR 5171, Université de Montpellier II,Montpellier (France). 2004.
40. Szpiech ZA, Jakobsson M, Rosenberg NA. ADZE: a rarefaction approach forcounting alleles private to combinations of populations. Bioinformatics.2008;24:2498–504.
41. Perrier X, Jacquemoud-Collet JP. DARwin software. 2006. http://darwin.cirad.fr/.42. Excoffier L, Lischer HEL. Arlequin suite ver 3.5: a new series of programs to
perform population genetics analyses under Linux and windows. Mol EcolResour. 2010;10:564–7.
43. Pritchard JK, Stephens M, Donnelly P. Inference of population structureusing multilocus genotype data. Genetics. 2000;155:945–59.
44. Jakobsson M, Rosenberg NA. CLUMPP: a cluster matching and permutationprogram for dealing with label switching and multimodality in analysis ofpopulation structure. Bioinformatics. 2007;23:1801–6.
45. Rosenberg NA. DISTRUCT: a program for the graphical display of populationstructure. Mol Ecol Notes. 2004;4:137–8.
46. Evanno G, Regnaut S, Goudet J. Detecting the number of clusters of individualsusing the software structure: a simulation study. Mol Ecol. 2005;14:2611–20.
47. Weir BS, Cockerham CC. Estimating F-statistics for the analysis of populationstructure. Evolution (N Y). 1984;38:1358–70.
Publisher’s NoteSpringer Nature remains neutral with regard to jurisdictional claims inpublished maps and institutional affiliations.
Cosson et al. BMC Plant Biology (2019) 19:436 Page 11 of 11