Genetic Characterization of Webster’s Salamander ... · 85 Genetic Characterization of...
11
85 Genetic Characterization of Webster’s Salamander (Plethodon websteri) Within a Fragmented Landscape, Using Novel Microsatellites Sheena M. Feist 1,3 , Thomas M. Mann 1 , and Debora L. Mann 2 1 Mississippi Department of Wildlife, Fisheries, and Parks, Museum of Natural Science, 2148 Riverside Drive, Jackson, Mississippi 39202, USA 2 Millsaps College, Department of Biology, 1701 North State Street, Jackson, Mississippi 39210, USA 3 Corresponding author, e-mail: [email protected] Abstract.—Habitat fragmentation can have a substantial influence on the genetic structure of wildlife populations, but the specific impacts of fragmentation vary among species, populations, and landscapes. We used genetics to investigate the potential impacts of fragmentation imposed by a highway, a deforested powerline right of way, low-lying flood zones, and a small creek on an isolated population of Webster’s Salamander (Plethodon websteri) occupying a small geographic area. Results from nine newly developed microsatellite loci reveal rather low genetic diversity, but no genetic population subdivision. Such results, although potentially influenced by spatial and temporal scales, suggest that the landscape features within our study site are not absolute barriers to movement of Webster’s Salamander. Our study supports a growing body of evidence that dispersal and movement potentials of small salamanders in heterogeneous landscapes needs to be better quantified. Key Words.—fragmentation; gene flow; microsatellites; road; deforestation; powerline Introduction The genetic structure of wildlife populations can be substantially influenced by habitat fragmentation. Fragmentation decreases availability of suitable habitat and resources, increases distances between habitat patches, and has the potential to impose absolute barriers to movement. Thus, fragmentation often results in smaller population sizes and decreased population connectivity (Fischer and Lindenmayer 2007). As a result of their influence on the rate at which gene flow and genetic drift occur, population size and connectivity, in turn, determine the genetic structure and genetic diversity of populations (Wright 1931; Slatkin 1987). Because genetic drift intensifies in small, isolated populations, populations inhabiting fragmented landscapes may exhibit greater susceptibility to genetic erosion and population divergence, which may place the population at a greater risk of extirpation (Keyghobadi 2007). Results from a recent simulation study show that the most influential factor on population connectivity, and thus the main driver of genetic structure, is not how a landscape is divided, but instead the amount of habitat remaining (Jackson and Fahrig 2016). Yet, permeability of the intervening matrix is of importance in its influence on dispersal and gene flow. In agreement Herpetological Conservation and Biology 12:85–95. Submitted: 1 June 2016; Accepted: 29 December 2016; Published: 31 April 2017. with the theory of isolation by distance (Wright 1943), several authors suggest that a significant factor in gene flow is distance between patches, with small scale fragmentation bearing little consequence to successful dispersal and genetic connectivity (e.g., Marsh et al. 2004; Jackson and Fahrig 2016). The scale at which fragmentation becomes problematic is species-specific, and is dependent upon the perceptual range of an organism (Baguette and Van Dyck 2007) and the degree to which remaining habitat meets the ecological needs and specific life-history requirements of the focal species (Fischer and Lindenmayer 2006; and as discussed in Oyler-McCance et al. 2013). For salamanders, which typically exhibit narrow environmental tolerances and limited dispersal abilities, fragmentation may segregate essential habitat types needed for different life-history stages, elevate desiccation risks, increase dispersal-related mortality, and create absolute dispersal barriers (reviewed in Cushman 2006). Examples of barriers include open fields and/or forest edges (although, this research has been typically biased towards pond-breeding salamanders; e.g., Jenkins et al. 2006; Rittenhouse and Semlitsch 2006; Walston and Mullin 2008; Pittman and Semlitsch 2013) and roads (Gibbs 1998a; deMaynadier and Hunter 2000; Marsh et al. 2005). For Plethodontids in particular, experimental and genetic evidence suggests Copyright © 2017. Sheena M. Feist All Rights Reserved.
Transcript of Genetic Characterization of Webster’s Salamander ... · 85 Genetic Characterization of...

85
Genetic Characterization of Webster’s Salamander (Plethodon websteri) Within a Fragmented Landscape,
Using Novel Microsatellites
Sheena M. Feist1,3, Thomas M. Mann1, and Debora L. Mann2
1Mississippi Department of Wildlife, Fisheries, and Parks, Museum of Natural Science, 2148 Riverside Drive, Jackson, Mississippi 39202, USA
2Millsaps College, Department of Biology, 1701 North State Street, Jackson, Mississippi 39210, USA 3Corresponding author, e-mail: [email protected]
Abstract.—Habitat fragmentation can have a substantial influence on the genetic structure of wildlife populations, but the specific impacts of fragmentation vary among species, populations, and landscapes. We used genetics to investigate the potential impacts of fragmentation imposed by a highway, a deforested powerline right of way, low-lying flood zones, and a small creek on an isolated population of Webster’s Salamander (Plethodon websteri) occupying a small geographic area. Results from nine newly developed microsatellite loci reveal rather low genetic diversity, but no genetic population subdivision. Such results, although potentially influenced by spatial and temporal scales, suggest that the landscape features within our study site are not absolute barriers to movement of Webster’s Salamander. Our study supports a growing body of evidence that dispersal and movement potentials of small salamanders in heterogeneous landscapes needs to be better quantified.
Key Words.—fragmentation; gene flow; microsatellites; road; deforestation; powerline
Introduction
The genetic structure of wildlife populations can be substantially influenced by habitat fragmentation. Fragmentation decreases availability of suitable habitat and resources, increases distances between habitat patches, and has the potential to impose absolute barriers to movement. Thus, fragmentation often results in smaller population sizes and decreased population connectivity (Fischer and Lindenmayer 2007). As a result of their influence on the rate at which gene flow and genetic drift occur, population size and connectivity, in turn, determine the genetic structure and genetic diversity of populations (Wright 1931; Slatkin 1987). Because genetic drift intensifies in small, isolated populations, populations inhabiting fragmented landscapes may exhibit greater susceptibility to genetic erosion and population divergence, which may place the population at a greater risk of extirpation (Keyghobadi 2007).
Results from a recent simulation study show that the most influential factor on population connectivity, and thus the main driver of genetic structure, is not how a landscape is divided, but instead the amount of habitat remaining (Jackson and Fahrig 2016). Yet, permeability of the intervening matrix is of importance in its influence on dispersal and gene flow. In agreement
Herpetological Conservation and Biology 12:85–95.Submitted: 1 June 2016; Accepted: 29 December 2016; Published: 31 April 2017.
with the theory of isolation by distance (Wright 1943), several authors suggest that a significant factor in gene flow is distance between patches, with small scale fragmentation bearing little consequence to successful dispersal and genetic connectivity (e.g., Marsh et al. 2004; Jackson and Fahrig 2016). The scale at which fragmentation becomes problematic is species-specific, and is dependent upon the perceptual range of an organism (Baguette and Van Dyck 2007) and the degree to which remaining habitat meets the ecological needs and specific life-history requirements of the focal species (Fischer and Lindenmayer 2006; and as discussed in Oyler-McCance et al. 2013).
For salamanders, which typically exhibit narrow environmental tolerances and limited dispersal abilities, fragmentation may segregate essential habitat types needed for different life-history stages, elevate desiccation risks, increase dispersal-related mortality, and create absolute dispersal barriers (reviewed in Cushman 2006). Examples of barriers include open fields and/or forest edges (although, this research has been typically biased towards pond-breeding salamanders; e.g., Jenkins et al. 2006; Rittenhouse and Semlitsch 2006; Walston and Mullin 2008; Pittman and Semlitsch 2013) and roads (Gibbs 1998a; deMaynadier and Hunter 2000; Marsh et al. 2005). For Plethodontids in particular, experimental and genetic evidence suggests
Copyright © 2017. Sheena M. FeistAll Rights Reserved.

86
Feist et al.—Salamander genetic connectivity in a fragmented landscape.
that even natural landscape features, including low-order streams (Marsh et al. 2007), can restrict movement and gene flow.
Because responses to fragmentation are not consistent across differing species, landscapes, or scales (Haila 2002; Cushman 2006; Baguette and Van Dyck 2007; Storfer et al. 2010), caution should be used before making broad generalizations across taxa, even among salamanders. Experimental studies reveal that some salamanders adopt compensatory movements that allow them to navigate through areas which had been previously labeled as resistant. Examples include navigation through open fields (Marsh et al. 2004; Gibbs 1998a), increased gene flow across inhospitable areas predicted to increase rates of water loss (Peterman et al. 2014), and/or accelerated movements through atypical substrates associated with roads, such as gravel and asphalt (Semlitsch et al. 2012). While successful movement through unfavorable environments may offset potential effects of reduced gene flow, increased vagility may expose dispersing amphibians to a greater risk of mortality and thus, contrary to expectations based solely on dispersal abilities, increase the susceptibility of a population to the negative consequences of habitat fragmentation (Gibbs 1998b). Thus, to understand how a specific landscape affects a particular salamander, habitat fragmentation must be investigated on a case by case basis.
Despite the call for species-specific data (Fischer and Lindenmayer 2007; Storfer et al. 2010), population genetic assessments in light of habitat fragmentation are still uncommon in small Plethodons (but see observations in the Red-backed Salamander, Plethodon cinereus, which has been rather intensively studied, e.g., Cabe et al. 2007; Noël et al. 2007; Marsh et al. 2008; Jordan et al. 2009). In this study we help fill the void in species-specific data by providing genetic characterization of a Webster’s Salamander (P. websteri) population. Webster’s Salamander is a small species of lungless salamander native to the southeastern United States, where it is strongly associated with forested habitats containing rock outcrops, or shallowly buried rock (pers. obs.). The population studied is isolated and inhabits a landscape of small geographic scale that is fragmented by four landscape features: a two-lane scenic highway, a low-lying seasonally flooded zone, a small creek, and a powerline right of way. We investigate the potential impacts of habitat fragmentation on this population by specifically addressing the following questions: do these natural and artificial landscape features impose barriers to movement and gene flow in Webster’s Salamanders as evidenced from population differentiation, and is there evidence that the artificial features and accompanying loss of habitat initiated a severe population decline (i.e., genetic bottleneck) with concomitant reductions in genetic diversity?
Materials and Methods
Study site.—Our study site is approximately 22 ha in area and is adjacent to a short (approximately 1 km) stretch of the Natchez Trace Parkway (hereafter, NTP) in Hinds County, Mississippi, USA. This area is characterized by intermittent outcrops of limestone and forest. The species composition of the forest varies across patches, suggesting different histories of disturbance. Remnants of furrows indicate past row-crop agriculture in much of the study site; here, Water Oak (Quercus nigra), Loblolly Pine (Pinus taeda), and Eastern Red Cedar (Juniperus virginiana) make up a large component of the canopy. In steep or rocky areas less suitable for farming, canopy species include hickories (Carya spp.), White Oak (Q. alba), Shumard Oak (Q. shumardii), Southern Red Oak (Q. falcata), Cherrybark Oak (Q. pagoda), Chinquapin Oak (Q. muehlenbergii), Post Oak (Q. stellata), and American Beech (Fagus grandifolia).
Although forested, our study site is conspicuously fragmented by four distinct landscape features that may act as barriers to movement (and subsequent gene flow) in Webster’s Salamander: the NTP, a powerline right of way, an intermittent tributary of a creek, and a low-lying, seasonally flooded zone (Fig. 1). Using these landscape features as boundaries, we divided the study site into five sections (1–5), each of which contains a discrete outcropping of rock. Descriptions of these landscape features, and their orientation within the study site, are detailed below.
The NTP is a paved, two-lane scenic highway with a width of 7 m. At our study site, the NTP was constructed and paved between 1970 and 1973. The NTP receives, at times (e.g., rush hour traffic), moderately heavy traffic from nearby Jackson, Mississippi, and surrounding areas. The road has on either side a small (approximately 5 m) shoulder composed of closely mown grass, which is adjacent to a relatively narrow stretch (about 0.10–0.45 km wide) of forest. The tree canopy overhangs the edge of the NTP in many places except along the stretches that are adjacent to the powerline right of way and the lowland flood zone. At the flood zone, the NTP is situated on an elevated embankment (hereafter, causeway) with steep, approximately 20 m wide shoulders covered in short grass. The 40 m wide powerline right of way has been in place since 1965, and is maintained as an open field consisting of tall grasses and occasional woody plants. There is no canopy cover in the powerline right of way. The intermittent tributary flows westward through our study site between Section 1 and Section 3, where it then flows into Lindsey Creek. Lindsey Creek is a deeply incised, small, perennial stream that flows southward along the northern and western edges of our study site. No ideal Webster’s Salamander habitat exists immediately north or west

87
Herpetological Conservation and Biology
of Lindsey Creek. Lindsey Creek and its tributaries flow through alluvial deposits of silt loam soils that are subject to seasonal flooding (Cole et al. 1979); these floodplain terraces are frequently scoured of leafy and woody debris, leaving little cover for salamanders. The flood zone is a bottomland area that collects spillover from Lindsey Creek and fills seasonally during heavy rains from fall to spring, forming a large ephemeral pond. The flood zone is positioned west of the elevated causeway, between Sections 1 and 3.
As typical of woodland salamanders where they exist (reviewed in Davic and Welsh 2004), Webster’s Salamanders appear to be rather abundant at our study site. However, population size and density is unknown. Furthermore, this studied population is isolated from other populations of Webster’s Salamander by at least six highly fragmented kilometers.
Sampling and analyses.—We collected tail tips from P. websteri found under natural cover objects during a three week period during October and November 2013 when individuals began to emerge from below ground. We attempted to collect tail clips as early as possible in the season, when the animals were active on the surface and before they had an opportunity to move between discrete outcrops/sampling sections. We collected 68 tail clips, with an average of 13.6 tail tips from each section of the study site. We assigned all samples
collected within a given section the same central coordinate. We stored tail clips in 100% EtOH and froze them until extraction. We performed extractions with Qiagen DNeasy Blood & Tissue kits (Qiagen, Valencia, California, USA).
We developed novel microsatellite loci for P. websteri by submitting DNA extractions to the Savannah River Ecology Laboratories (SREL) where candidate microsatellite markers were identified using Illumina paired-end genomic sequencing (SREL protocol outlined in Castoe et al. 2012). Of the 5,454 potential primer sets resulting from SREL development, we screened 32 primers for amplification using a thermal gradient PCR, where annealing temperatures ranged between 45° C and 65° C. Twelve of the 32 primers amplified well and exhibited signs of polymorphism according to bands observed in agarose gels stained with GelRed (Biotium).
To assess the degree of variability, we screened these 12 primers using 30 P. websteri from four isolated populations (including our study site) in Mississippi. Primers were fluorescently labeled using ABI dyes (Table 1). PCR reactions were carried out in 15 μl volumes following DreamTAQ (ThermoScientific) suggested protocols, adjusting for volume and incorporating approximately 5 ng of DNA. PCR reactions were performed in a BioRad T100 thermal cycler under the following PCR conditions: Initial denaturation at 95° C for 3 min; 35 cycles of 95° C for 30 s, optimal annealing
Figure 1. Map of study site along the Natchez Trace Parkway (NTP), Hinds County, Mississippi, USA. Sampling sections are numbered in white. Lindsey Creek is highlighted in dark blue; its tributary is shown in light blue. The elevated embankment (causeway) along the NTP is indicated by “C”. Monitoring observations show that Webster’s Salamanders migrate across the NTP predominantly along the area marked by “M”. (Aerial imagery: U.S. Department of Agriculture National Agriculture Imagery Program, USDA-NAIP).

88
temperature (see Table 1) for 30 s, 72° C for 1 min; with a final extension of 72° C for 10 min. Fragment analysis (University of Missouri DNA Core Facility, ABI 3730 DNA Analyzer using GeneScan LIZ 600 size standard) revealed satisfactory PCR products. Thus, all samples were genotyped using these 12 novel microsatellite loci.
For this study, loci were arranged into four multiplexes according to base pair range and optimal annealing temperature (Table 1). All 68 samples underwent polymerase chain reactions (PCR) using Qiagen Multiplex kits (Qiagen, Valencia, California, USA), adjusting the protocol of the manufacturer to meet a final volume of 8 μl (incorporating approximately 5 ng of DNA). PCR conditions were as follows: Initial denaturation at 95° C for 15 min; 30 cycles of 94° C for 30 s, optimal annealing temperature (see Table 1) for
90 s, 72° C for 1 min; with a final extension of 60° C for 30 min. PCR products were sized at the University of Missouri DNA Core Facility on an ABI 3730 DNA Analyzer (Applied Biosystems, Foster City, California, USA) using GeneScan LIZ 600 size standard (Applied Biosystems, Foster City, California, USA). Resulting chromatograms were visualized, and individuals assigned genotypes, in GENEMARKER (Softgenetics, State College, Pennsylvania, USA).
Probability of identity P(ID) (Paetkau et al. 1995), or the probability that two randomly chosen individuals from a population will share the same multilocus genotype, was assessed in GenAlex (Peakall and Smouse 2012). The threshold for P(ID) was set at ≤ 0.001 as suggested by Waits et al. (2001). Although P(ID) is typically used to assess power in differentiating between individuals,
Feist et al.—Salamander genetic connectivity in a fragmented landscape.
Locus Primer sequence Repeat motif Label Number of alleles
Multiplex 1, TA = 55° C
PWEB15 F GTGAAGTCCTGTTGTAATCATGC AATG FAM 10
R* TGACTTCATATCAACTGCCTACG
PWEB17 F* GGTTGATGTTTATGTTGCATGGG AATG NED 1
R AAGCCAAGGACAAGTGCAGG
Multiplex 2, TA = 60° C
PWEB24 F* CAAATCAGTTGCCCGTACCC TTCC FAM 10
R GCTGATGTCATTACATGCTCCC
PWEB30 F* AATGCCATTGTGGTGAGTGG AATG VIC 2
R TGAAAGCGCCTTACAGATGC
PWEB31 F* TGGAACGAGGCTTATAGAAGTGC ACTG PET 1
R TATGACGCTCAGAAGCAGCC
Multiplex 3, TA = 62° C
PWEB3 F GGCCTTTAACCTCTTCCTCC TTCCTC FAM 15
R* AGTCACGTCACGGTTCCC
PWEB6 F GGACACTCATGTACTGCCTAATGG AACAT FAM 11
R* TGTACAAACTGTGCTCCGGG
PWEB14 F* TTGTCTGTTGTGCAAATGCG ATCT VIC 14
R TGGTCTCCGCTCAACTCACC
PWEB22 F* TGAAACTGAGATTTGTGTCAATGG AAAC FAM 5
R TTCCCTCTGTACCCTGTGCC
PWEB27 F* AATTCCAGGGCAGAGAAACC ATGG PET 9
R ATGGTCATTCCTCTCCATGC
Multiplex 4, TA = 62° C
PWEB12 F GCTGTCAGCGTGGATAGAGC AAAG FAM 11
R* TTTATTTATGCACATGGTTCTAGGC
PWEB28 F* TGGATAGCAGTCAGGCACC TCTG NED 12
R AAAGCTACACCTGGGAAAGC
Table 1. Microsatellites used for genotyping Webster’s Salamanders (Plethodon websteri). Number of alleles is based on 30 individuals from four isolated populations (including our study site) across four counties in Mississippi, USA. TA indicates PCR amplification annealing temperature, and asterisks (*) indicate which primer (forward, F, or reverse, R) received a fluorescent label at the 5’ end.
89
Herpetological Conservation and Biology
we use it as a proxy to demonstrate the resolution of our microsatellites for detecting population genetic structure.
Investigations into Hardy Weinberg Equilibrium (HWE) and linkage disequilibrium were accomplished with GenePOP (Rousset 2008). We applied a Bonferroni correction (Rice 1989) to these tests, and all other multiple comparisons, to decrease the chance of Type I error. We used HPrare (Kalinowski 2005a) to evaluate genetic diversity; specifically, we evaluated the number of observed alleles (including private alleles), rarified allelic richness (which accounts for differences in sample size), and rarified private allelic richness. We used GenAlex (Peakall and Smouse 2012) to measure levels of observed and expected heterozygosity.
We assessed population genetic structure (i.e., differentiation between sampling sections) using two methods. First, we partitioned genetic variation using an Analysis of Molecular Variance (AMOVA) in ARLEQUIN (Excoffier and Lischer 2010), where ARLEQUIN input files were created from GenePOP input files using CONVERT (Glaubitz 2004). With the AMOVA, genetic variation was assessed at three hierarchical levels: among populations (which would be indicative of differentiation), among individuals within populations, and within individuals. Individuals were assigned to populations geographically, where populations are synonymous with sampling location (i.e., section). We then investigated genetic structure with the R-package, ADEGENET (Jombart 2008), using RStudio and R version 3.0.3 (R Core Team 2014). This package uses a multivariate method, Discriminant Analysis of Principal Components (DAPC; Jombart et al. 2010), to identify the most likely number of clusters (K), or subdivided groups of genetically similar individuals.
To assess the interaction between geographic distance and gene flow, we calculated population-level
pairwise genetic differentiation between sampling locations using FST, also known as genetic distance. We then evaluated, in GENALEX (Peakall and Smouse 2012), the relationship between FST and geographic distance with a Mantel test in an analysis of Isolation by Distance (IBD). Here, the prediction is that populations in close proximity will be more genetically similar than distant populations, as movement between neighboring populations is more likely (Wright 1943).
We investigated the demographic history of the population of P. websteri inhabiting our study site using BOTTLENECK (Piry et al. 1999), which uses heterozygosity statistics to detect substantial changes in effective population size (Ne) that have occurred within the past 0.2Ne–4Ne generations. We conducted the BOTTLENECK analysis using two microsatellite mutation models: stepwise (SMM) and two-phase (TPM). Parameters were set to those recommended by the authors of the program, with TPM set to 95% adherence, and variance set to 12 (Piry et al. 1999). Significance was evaluated with the Wilcoxon test, which is most appropriate and most powerful for the number of loci employed in this study (Piry et al. 1999).
Results
Two loci (PWEB17 and PWEB31) were monomorphic. Repeat patterns were inconsistent within locus PWEB28, with some individuals exhibiting what appears to be a dinucleotide motif rather than the expected tetranucleotide motif. As such, these three loci were removed from further analyses.
P(ID) for the nine remaining loci showed that individuals could be identified from one another with a probability of 8 × 10⁻⁶ when genotyped at all nine loci, with the threshold for P(ID) ≤ 0.001 surpassed at a combination of four loci. We interpret this to mean that our novel microsatellites possess enough power for use in this study as well as future studies. All loci and all sampling sections conformed to HWE. No loci exhibited signs of linkage. Although the number of alleles per locus ranged from two to 10 across the entire NTP study site (Table 2), the average number of alleles per locus within sampling sections (rarified allelic richness) was between 3.51 and 4.56 (Table 3). The total number of alleles observed within study sites ranged between 32 and 41, with an average of 37.4 across sites (Appendix). The highest average rarified allelic richness was observed in Sections 1 and 4 (4.26 and 4.56, respectively). Section 3 exhibited the lowest average allelic richness (3.51). Private allelic richness within study sites (averaged across loci; Table 3) followed an identical pattern with the highest values in Sections 1 and 4 (0.32 and 0.71, respectively) and the
Locus No. of alleles HE HO
PWEB15 10 0.83 0.85
PWEB24 7 0.34 0.39
PWEB30 2 0.04 0.01
PWEB3 5 0.43 0.39
PWEB6 4 0.39 0.35
PWEB14 10 0.78 0.81
PWEB22 3 0.11 0.10
PWEB27 4 0.32 0.32
PWEB12 10 0.75 0.75
Table 2. Webster’s Salamander (Plethodon websteri) microsatellite locus-specific characteristics as observed across the Natchez Trace Parkway, Hinds County, Mississippi, USA study site, including expected and observed heterozygosity (HE and HO, respectively).

90
Feist et al.—Salamander genetic connectivity in a fragmented landscape.
lowest values in Section 3 (0.01). When found, private alleles were observed in low frequencies in the sampling sections where they occurred; in other words, private alleles were also rare within the sampling section found and not commonly observed in genetic profiles (Table 3, Appendix). Observed heterozygosity was fairly low (≤ 0.46) when evaluated within individual sampling sections and averaged across loci, but did not deviate significantly from expected heterozygosity (Table 3).
The AMOVA analysis indicated that > 98% of the observed genetic variation can be explained by variation within individuals (Table 4), with no significant variation observed among sections, nor among individuals within sections. Genetic distances (FST values) were low among all sampling sections, and ranged from ˗0.0070 and 0.017 with geographic distances ranging between 90 m and 850 m (Table 5). When evaluating the most likely number of genetic clusters (K) in ADEGENET, we retained 40 principal components for the K-means evaluation, and chose to retain a K of two. We then retained 20 principal components. For the DAPC, only a single eigenvalue (or, discriminant function) was available for selection. A K of two was chosen because a clear elbow, or obvious change in the curvature of the slope, was evident in the graph depicting the BIC values for each potential number of clusters. However, the difference in BIC value between a K of one and a K of two was minimal (BIC values of 52.5 and 50.5, respectively), indicating that an additional cluster (K = 2) was not substantially more informative than having a single cluster (K = 1). The resulting cluster graph was biologically uninformative with no strong assignment probabilities observed among individuals and clusters. Thus, we interpret this to mean no genetic structure is evident among the sampled NTP sections using the ADEGENET method. The relationship
between genetic distance (FST) and geographic distance was not significant (r2 = 0.178, P = 0.142; Fig. 2). No bottleneck was detected in the demographic history of our population.
Discussion
This is the first published study investigating the population genetics of P. websteri. Through the use of nine novel microsatellites, we were able to assess genetic patterns relevant to dispersal and connectivity within a Webster’s Salamander population inhabiting a fragmented landscape of small scale. Our results indicate that a single population exists at our study site with no genetic structure detected among the five sections sampled.
Observed genetic distances (FST) were small and nearly identical among all sections. The lack of divergence between Sections 3 and 4, which are separated by the powerline right of way, may indicate that some salamanders are successfully dispersing through this open area despite the substantial (40 m) gap in the canopy cover, a result that is congruent with experimental observations involving P. cinereus (Marsh et al. 2004). In contrast to observations involving P. cinereus (Marsh et al. 2007), no divergence is observed between sampling sections divided by water bodies. The lack of evidence that the low-lying flood zones act as barriers to movement likely reflects variability in seasonal precipitation patterns, and the impact of that variability on the magnitude and/or timing of flooding in relation to the timing of potential P. websteri dispersal events. This point is relevant to the potential barrier imposed by the small tributary of Lindsey Creek which flows through and around the low-lying flood zone located between Sections 1 and 3. Even if salamanders
Figure 2. Plot used to investigate isolation by distance (IBD) among Webster’s Salamander (Plethodon websteri) sampling sections.
NTP sampling site
n P AR AP HE HO
Section 1 14 3 4.26 0.32 0.43 0.46
Section 2 12 1 3.89 0.16 0.42 0.45
Section 3 13 0 3.51 0.01 0.43 0.42
Section 4 12 6 4.56 0.71 0.45 0.45
Section 5 17 0 3.94 0.02 0.42 0.43
Average across sites
13.6 2 4.03 0.24 0.43 0.44
Table 3. Genetic summary statistics for Webster’s Salamanders (Plethodon websteri) based on five sampling sites at the Natchez Trace Parkway, Hinds County, Mississippi, USA and across nine microsatellite loci, where n = sample size, P = observed number of private alleles, AR = average rarified allelic richness (average number of alleles corrected for differences in sample size), AP = average private (rarified) allelic richness, HE = average heterozyogisty expected, and HO = average heterozygosity observed.

91
Herpetological Conservation and Biology
are not intentionally entering the tributary or Lindsey Creek, both streams have the potential to displace salamanders during flood pulses, and thus, may function as occasional conveyors of downstream gene flow.
Despite the lack of evidence for significant population differentiation, disparity in genetic variation is observed among sampling sections. We hypothesize that the particular distinctiveness observed between Sections 3 and 4 may be an artifact of demography. The relatively high heterozygosity, allelic richness, and private alleles displayed in Section 4 suggest that Section 4 may host a larger number of Webster’s Salamanders than other sampling sections (Wright 1931; Kimura and Crow 1964; Frankham 1996). In contrast, Section 3 carries the signatures of the lowest genetic diversity. Because Section 3 is physically segregated from all other sampling sections by all four landscape features (tributary of Lindsey Creek, flood zones, power line right of way, and NTP), it may receive the fewest migrants from other sampling sections, and thus be the most susceptible to genetic drift, especially if it also has the smallest population size.
Because we used novel microsatellites in a species that has never undergone population genetic assessments, our genetic summary statistics cannot be directly compared to other studies. Nevertheless, our diversity metrics appear to be rather low overall. We suspect that these observations are ultimately influenced by factors at a larger scale; more specifically, we recognize that our population is already subject to genetic erosion because the overall study site is, in itself, of small scale and isolated from other Webster’s Salamander populations by more than 6 km. We also acknowledge that factors influencing genetic diversity in populations similar to the one studied here (small, isolated and within a heterogeneous landscape) are numerous and synergistic, making interpretations of observed genetic patterns complicated. Although gene flow possibly occurs through the fragmented landscape of our study site, alternative explanations exist for the lack of observed genetic structure in this population of
P. websteri. The first possibility is a lack of power to detect structure. Perhaps the geographic scale of our study is inappropriate for our organism, its ecological/life-history needs, and/or its dispersal ability (Cushman 2006 and references therein; Anderson et al. 2010; although see Cabe et al. 2007). Also, perhaps we did not use enough [polymorphic] loci and/or sampled too few individuals (Kalinowski 2005b; Ryman et al. 2006; Waples and Gaggiotti 2006).
Our inability to detect genetic structure may be further influenced by genetic lag, which is defined as the amount of time at which a genetic response to a perturbation (in this case, fragmentation) becomes detectable. At the time of our study, the NTP and the powerline right of way had been in place for 40 and 48 y, respectively. We do not know if this amount of time is sufficient for genetic effects of fragmentation to become evident, as the length of a genetic lag is indeterminate and largely influenced by population-specific variables, including population size, population growth rates, generation time, and dispersal distances (reviewed in Epps and Keyghobadi 2015). Because these variables are unknown in P. websteri, our current observations (indicating one population) may potentially reflect past connectivity before fragmentation.
Although responses to fragmentation differ among species and landscapes, general patterns do emerge (Storfer et al. 2010). The results of our study are specific to P. websteri, but the interpretation echoes what other authors have previously stated. Our study occurred within a small landscape, where the degree of fragmentation is relatively minor with presumably ample, suitable habitat remaining. With greater degrees of fragmentation, especially when accompanied with substantial habitat loss and/or long distances between suitable habitats (Marsh et al. 2004; Jackson and Fahrig 2016), it is likely that woodland salamanders, such as Webster’s Salamander, will experience greater negative consequences (e.g., genetic drift, increased mortality during dispersal) that may impact population persistence and individual survival.
Source of variation Sum of squares
Variance components
Percentage variation
Among sections (FST)
9.44 0.01 0.61
Among individuals within sections (FIS)
126.49 0.02 0.82
Within individuals (FIT)
134.50 1.99 98.57
Total 270.44 2.02
Table 4. Analysis of Molecular Variance (AMOVA) explaining the amount of variation observed in Webster’s Salamanders (Plethodon websteri) at three hierarchical levels.
Table 5. Distances observed among Webster’s Salamander (Plethodon websteri) sampling sections, with genetic distances (FST values) above the diagonal and geographic distances (in meters, taken from approximate central point of sampling section) below. Genetic distances between sampling sections were not statistically significant (P-values = 0.11–0.72). Abbreviation Sec. = Section.
Sec. 1 Sec. 2 Sec. 3 Sec. 4 Sec. 5
Sec. 1 — ˗0.0046 0.0083 0.0075 0.0071
Sec. 2 90 — 0.0167 0.0028 0.0136
Sec. 3 350 370 — 0.0110 0.0071
Sec. 4 580 570 260 — ˗0.0070
Sec. 5 850 830 550 290 —

92
Our study emphasizes the complex interaction between heterogeneous landscapes, habitat use, and dispersal abilities, and suggests that woodland salamanders may be able to negotiate even such presumably inhospitable features as open fields, paved roadways, and water bodies with sufficient frequency to maintain gene flow. These findings have implications for the conservation of salamander species, and highlight the importance of maintaining natural environments in human altered landscapes. Although salamanders may show some resilience to habitat alteration, we caution that resilience has a threshold. Dramatic changes to the environment without consideration of the behavior, life history, and ecology of local species will present conservation challenges unique to each population and each landscape.
Acknowledgments.—Thanks are extended to members of the Bucket Brigade for their dedication to the conservation of this population and to Webster’s Salamanders in general. Jose Polanco provided much appreciated laboratory assistance. Drs. Robert L. Jones and William E. Peterman reviewed early versions of the manuscript and provided comments which greatly improved the final version. Salamanders from the Natchez Trace Parkway were handled and tail clips collected under U.S. National Park Service scientific collection permit #NATR-2013-SCI-0001. This project was made possible by State Wildlife Grant funding, which is provided by the United States Fish and Wildlife Service.
Literature Cited
Anderson, C.D., B.K. Epperson, M.-J. Fortin, R. Holderegger, P.M.A. James, M.S. Rosenberg, K.T. Scribner, and S. Spear. 2010. Considering spatial and temporal scale in landscape-genetic studies of gene flow. Molecular Ecology 19:3565–3575.
Baguette, M., and H. Van Dyck. 2007. Landscape connectivity and animal behavior: functional grain as a key determinant for dispersal. Landscape Ecology 22:1117–1129.
Cabe, P.R., R.B. Page, T.J. Hanlon, M.E. Aldrich, L. Connors, and D.M. Marsh. 2007. Fine-scale population differentiation and gene flow in a terrestrial salamander (Plethodon cinereus) living in continuous habitat. Heredity 98:53–60.
Castoe, T.A., A.W. Poole, A.P.J. de Koning, K.L. Jones, D.F. Tomback, S.J. Oyler-McCance, J.A. Fike, S.L. Lance, J.W. Streicher, E.N. Smith, and D.D. Pollack. 2012. Rapid microsatellite identification from Illumina paired-end genomic sequencing in two birds and a snake. PLoS ONE 7(2):e30953. http://dx.doi.org/10.1371/journal.pone.0030953.
Cole, W.A., R.W. Smith, J.W. Keyes, F.T. Scott, and L.B. Watson. 1979. Soil Survey of Hinds County, Mississippi. United States Department of Agriculture, National Resource Conservation Service in cooperation with Mississippi Agricultural and Forestry Experiment Station. 122 p.
Cushman, S.A. 2006. Effects of habitat loss and fragmentation on amphibians: a review and prospectus. Biological Conservation 128:231–240.
Davic, R.D., and H.H. Welsh Jr. 2004. On the ecological roles of salamanders. Annual Review of Ecology, Evolution, and Systematics 35:405–434.
deMaynadier, P.G, and M.L. Hunter, Jr. 2000. Road effects on amphibian movements in a forested landscape. Natural Areas Journal 20:56–65.
Epps, C.W., and N. Keyghobadi. 2015. Landscape genetics in a changing world: disentangling historical and contemporary influences and inferring change. Molecular Ecology 24:6021–6040.
Excoffier, L., and H.E.L. Lischer. 2010. Arlequin suite v. 3.5: a new series of programs to perform population genetics analyses under Linux and Windows. Molecular Ecology Resources 10:564–567.
Fischer, J., and D.B. Lindenmayer. 2006. Beyond fragmentation: the continuum model for fauna research and conservation in human-modified landscapes. Oikos 112:473–480.
Fischer, J., and D.B. Lindenmayer. 2007. Landscape modification and habitat fragmentation: a synthesis. Global Ecology and Biogeography 16:265–280.
Frankham, R. 1996. Relationship of genetic variation to population size in wildlife. Conservation Biology 10:1500–1508.
Gibbs, J.P. 1998a. Amphibian movements in response to forest edges, roads, and streambeds in southern New England. Journal of Wildlife Management 62:584–589.
Gibbs, J.P. 1998b. Genetic structure of Redback Salamander Plethodon cinereus populations in continuous and fragmented forests. Biological Conservation 86:77–81.
Glaubitz, J.C. 2004. Convert: a user-friendly program to reformat diploid genotypic data for commonly used population genetic software packages. Molecular Ecology Notes 4:309–310.
Haila, Y. 2002. A conceptual genealogy of fragmentation research: from island biogeography to landscape ecology. Ecological Applications 12:321–334.
Jackson, N.D., and L. Fahrig. 2016. Habitat amount, not habitat configuration, best predicts population genetic structure in fragmented landscapes. Landscape Ecology 31:951–968.
Jenkins, C.L., K. McGarigal, and B.C. Timm. 2006. Orientation of movements and habitat selection in a spatially structured population of Marbled
Feist et al.—Salamander genetic connectivity in a fragmented landscape.

93
Salamanders (Ambystoma opacum). Journal of Herpetology 40:240–248.
Jombart, T. 2008. Adegenet: a R package for the multivariate analysis of genetic markers. Bioinformatics 24:1403–1405.
Jombart, T., S. Devillard, and F. Balloux, F. 2010. Discriminant analysis of principal components: a new method for the analysis of genetically structured populations. BMC Genetics 11:94.
Jordan, M.A., D.A. Morris, and S.E. Gibson. 2009. The influence of historical landscape change on genetic variation and population structure of a terrestrial salamander (Plethodon cinereus). Conservation Genetics 10:1647–1658.
Kalinowski, S.T. 2005a. Hp-rare 1.0: a computer program for performing rarefaction on measures of allelic richness. Molecular Ecology Notes 5:187–189.
Kalinowski, S.T. 2005b. Do polymorphic loci require large sample sizes to estimate genetic distances? Heredity 94:33–36.
Keyghobadi, N. 2007. The genetic implications of habitat fragmentation for animals. Canadian Journal of Zoology 85:1049–1064.
Kimura, M. and J.F. Crow. 1964. The number of alleles that can be maintained in a finite population. Genetics 49:725–738.
Marsh, D.M., G.S. Milam, N.P. Gorham, and N.G. Beckman. 2005. Forest roads as partial barriers to terrestrial salamander movement. Conservation Biology 19:2004–2008.
Marsh, D.M., R.B. Page, T.J. Hanlon, H. Bareke, R. Corritone, N. Jetter, N.G. Beckman, K. Gardner, D.E. Seifert, and P.R. Cabe. 2007. Ecological and genetic evidence that low-order streams inhibit dispersal by Red-backed Salamanders (Plethodon cinereus). Canadian Journal of Zoology 85:319–327.
Marsh, D.M., R.B. Page, T.J. Hanlon, R. Corritone, E.C. Little, D.E. Seifert, and P.R. Cabe. 2008. Effects of roads on patterns of genetic differentiation in Red-backed Salamanders, Plethodon cinereus. Conservation Genetics 9:603–613.
Marsh, D.M., K.A. Thakur, K.C. Bulka, and L.B. Clarke. 2004. Dispersal and colonization through open fields by a terrestrial, woodland salamander. Ecology 85:3396–3405.
Noël, S., M. Ouellet, P. Galois, and F.-J. Lapointe. 2007. Impact of urban fragmentation on the genetic structure of the Eastern Red-backed Salamander. Conservation Genetics 8:599–606.
Oyler-McCance, S.J., B.C. Fedy, and E.L. Landguth. 2013. Sample design effects in landscape genetics. Conservation Genetics 14:275–285.
Paetkau, D., W. Calvert, I. Stirling, and C. Strobeck. 1995. Microsatellite analysis of population structure
in Canadian Polar Bears. Molecular Ecology 4:347–354.
Peakall, R., and P.E. Smouse. 2012. GenAlEx 6.5: genetic analysis in Excel. Population genetic software for teaching and research-an update. Bioinformatics 28:2537–2539.
Peterman, W.E., G. M. Connette, R.D. Semlitsch, and L.S. Eggert. 2014. Ecological resistance surfaces predict fine-scale genetic differentiation in a terrestrial woodland salamander. Molecular Ecology 23:2402–2413.
Piry, S., G. Luikart, and J.-M. Cornuet. 1999. Computer note. BOTTLENECK: a computer program for detecting recent reductions in the effective size using allele frequency data. Journal of Heredity 90:502–503.
Pittman, S.E., and R.D. Semlitsch. 2013. Habitat type and distance to edge affect movement behavior of juvenile pond-breeding salamanders. Journal of Zoology 291:154–162.
R Core Team. 2014. R: a language and environment for statistical computing. R Foundation for Statistical Computing, Vienna, Austria. http://www.R-project.org/.
Rice, W.R. 1989. Analyzing tables of statistical tests. Evolution 43:223–25.
Rittenhouse, T.A.G., and R.D. Semlitsch. 2006. Grasslands as movement barriers for a forest-associated salamander: migration behavior of adult and juvenile salamanders at a distinct habitat edge. Biological Conservation 131:14–22.
Rousset, F. 2008. Genepop’007: a complete re-implementation of the genepop software for Windows and Linux. Molecular Ecology Resources 8:103–106.
Ryman, N., S. Palm, C. André, G.R. Carvalho, T.G. Dahlgren, P.E. Jorde, L. Laikre, L.C. Larsson, A. Palmé, and D.E. Ruzzante. 2006. Power for detecting genetic divergence: differences between statistical methods and marker loci. Molecular Ecology 15:2031–2045.
Semlitsch, R.D., S. Ecrement, A. Fuller, K. Hammer, J. Howard, C. Krager, J. Mozeley, J. Ogle, N. Shipman, J. Speier, et al. 2012. Natural and anthropogenic substrates affect movement behavior of the Southern Graycheek Salamander (Plethodon metcalfi). Canadian Journal of Zoology 90:1128–1135.
Slatkin, M. 1987. Gene flow and the geographic structure of natural populations. Science 236:787–792.
Storfer, A., M.A. Murphy, S.F. Spear, R. Holderegger, and L.P. Waits. 2010. Landscape genetics: where are we now? Molecular Ecology 19:3496–3514.
Waits, L.P., G. Luikart, and P. Taberlet. 2001. Estimating the probability of identity among genotypes in natural
Herpetological Conservation and Biology

94
populations: cautions and guidelines. Molecular Ecology 10:249–256.
Walston, L.J., and S.J. Mullin. 2008. Variation in amount of surrounding forest habitat influences the initial orientation of juvenile amphibians emigrating from breeding ponds. Canadian Journal of Zoology 86:141–146.
Waples. R.S., and O. Gaggiotti. 2006. What is a population? An empirical evaluation of some genetic methods for identifying the number of gene pools and their degree of connectivity. Molecular Ecology 15:1419–1439.
Wright, S. 1931. Evolution in Mendelian populations. Genetics 16:97–159.
Wright, S. 1943. Isolation by distance. Genetics 28:114–138.
Feist et al.—Salamander genetic connectivity in a fragmented landscape.
Thomas M. Mann (right) has been the Mississippi Natural Heritage Program Zoologist at the Mississippi Museum of Natural Science, Mississippi Department of Wildlife, Fisheries, and Parks, in Jackson, Mississippi, USA, since 1990. Tom received his B.S. degree at the University of Miami (Florida, USA) in 1972, and his M.S. degree at Florida Atlantic University in 1977, where he studied the impact of developed shoreline in Southeast Florida on nesting and hatchling sea turtles. As Natural Heritage Program Zoologist, Tom has been involved in more general surveys throughout the Scala Naturae, but has also undertaken focused surveys on the distribution and abundance of Gopher Tortoises (Gopherus polyphemus), Diamond-backed Terrapins (Malaclemys terrapene pileata), Gulf Saltmarsh Watersnakes (Nerodia clarkia), the Alabama Red-bellied Cooter (Pseudemys alabamensis), and Florida Harvester Ants (Pogonomyrmex badius). More recently, in collaboration with Dr. Debora Mann, Tom has studied previously unknown migratory behavior in Webster’s Salamander (Plethodon websteri), and morphological variation in this species throughout Mississippi, in Louisiana, and in much of Alabama. Debora L. Mann (left) is an Assistant Professor of Biology and Director of Environmental Studies at Millsaps College, where she teaches introductory biology, ecology, field biology, and environmental studies. She received her M.S. at Vanderbilt University and her Ph.D. at Clemson University. (Photographed by Victor Mendia).
Sheena M. Feist is a Conservation Resources Biologist at the Mississippi Department of Wildlife, Fisheries, and Parks’ Museum of Natural Science, Jackson, USA. She received her M.A. at the University of Missouri. She uses genetic techniques to investigate questions relevant to the conservation of non-game organisms. (Photographed by Sam Beibers).
95
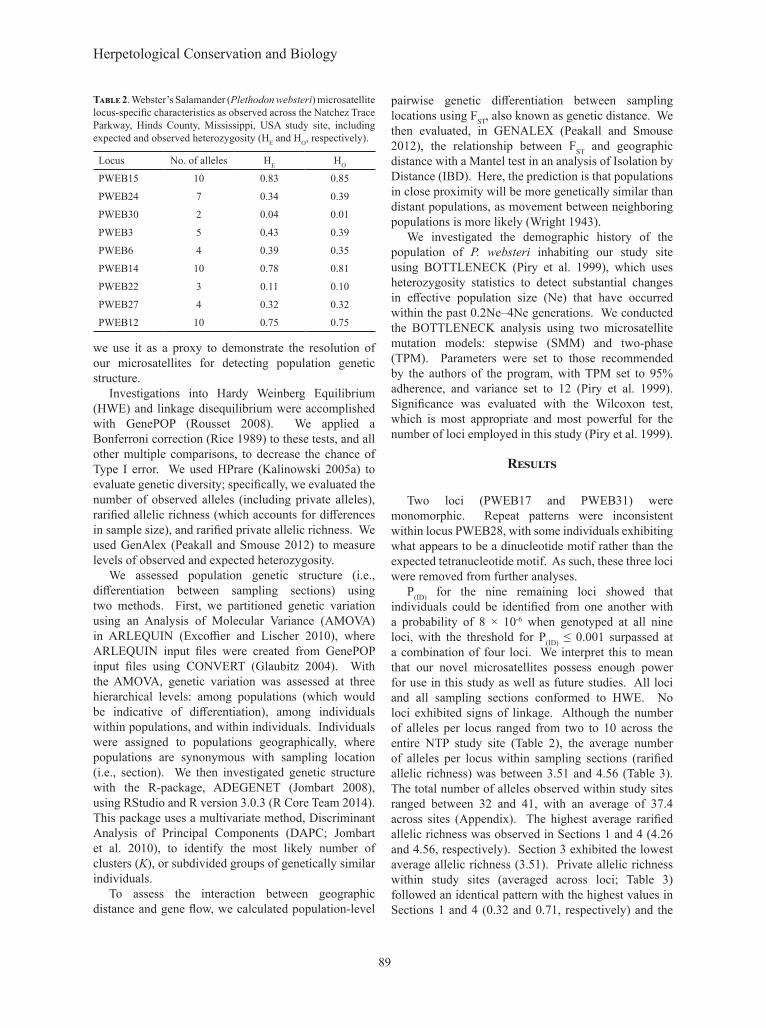
Appendix. Distribution of observed Webster’s Salamander (Plethodon websteri) alleles across nine microsatellite loci and five sampling sections at our Natchez Trace Parkway study site in Hinds County, Mississippi, USA.
Herpetological Conservation and Biology