Genetic Characterisation of Dog Personality Traits · 1 Genetic characterisation of dog personality...
32
1 Genetic characterisation of dog personality traits 1 2 Joanna Ilska 1 3 Marie J. Haskell 1 4 Sarah C. Blott 2 5 Enrique Sánchez-Molano 3 6 Zita Polgar 3 7 Sarah E. Lofgren 4 8 Dylan N. Clements 3 9 Pamela Wiener 3 10 11 1. Scotland’s Rural College, Edinburgh, Scotland, UK 12 2. University of Nottingham, Sutton Bonington, England, UK 13 3. The Roslin Institute and Royal (Dick) School of Veterinary Studies, University of 14 Edinburgh, Easter Bush, Scotland, UK 15 4. Youth Science Institute, Los Gatos, California, USA 16 17 Genetics: Early Online, published on April 10, 2017 as 10.1534/genetics.116.192674 Copyright 2017.
Transcript of Genetic Characterisation of Dog Personality Traits · 1 Genetic characterisation of dog personality...

1
Genetic characterisation of dog personality traits 1
2
Joanna Ilska1 3
Marie J. Haskell1 4
Sarah C. Blott2 5
Enrique Sánchez-Molano3 6
Zita Polgar3 7
Sarah E. Lofgren4 8
Dylan N. Clements3 9
Pamela Wiener3 10
11
1. Scotland’s Rural College, Edinburgh, Scotland, UK 12
2. University of Nottingham, Sutton Bonington, England, UK 13
3. The Roslin Institute and Royal (Dick) School of Veterinary Studies, University of 14
Edinburgh, Easter Bush, Scotland, UK 15
4. Youth Science Institute, Los Gatos, California, USA 16
17
Genetics: Early Online, published on April 10, 2017 as 10.1534/genetics.116.192674
Copyright 2017.

2
Abstract 18
The genetic architecture of behavioural traits in dogs is of great interest to owners, breeders 19
and professionals involved in animal welfare, as well as to scientists studying the genetics of 20
animal (including human) behaviour. The genetic component of dog behaviour is supported 21
by between-breed differences and some evidence of within-breed variation. However, it is a 22
challenge to gather sufficiently large datasets to dissect the genetic basis of complex traits 23
such as behaviour, which are both time-consuming and logistically difficult to measure, and 24
known to be influenced by non-genetic factors. In this study, we exploited the knowledge that 25
owners have of their dogs to generate a large dataset of personality traits in Labrador 26
Retrievers. While accounting for key environmental factors, we demonstrate that genetic 27
variance can be detected for dog personality traits assessed using questionnaire data. We 28
identified substantial genetic variance for several traits, including fetching tendency and fear 29
of loud noises, while other traits revealed negligibly small heritabilities. Genetic correlations 30
were also estimated between traits, however, due to fairly large standard errors, only a 31
handful of trait pairs yielded statistically significant estimates. Genomic analyses indicated 32
that these traits are mainly polygenic, such that individual genomic regions have small 33
effects, and suggested chromosomal associations for six of the traits. The polygenic nature of 34
these traits is consistent with previous behavioural genetics studies in other species, for 35
example in mouse, and confirms that large datasets are required to quantify the genetic 36
variance and to identify the individual genes that influence behavioural traits. 37
38
Key words: canine genetics, dog, temperament, personality, heritability, genome-wide 39
association 40

3
Introduction 41
Dogs play important roles as companions and helpers for humans and dog personality 42
influences their ability to carry out these functions (Jones & Gosling 2005), where personality 43
refers to individual consistency in behavioural responsiveness to stimuli and situations. The 44
distinct behavioural predispositions of individual dog breeds clearly indicate a strong genetic 45
component to dog personality, which is further strengthened by estimates of substantial 46
within-breed genetic variance found for a variety of dog behavioural traits across studies (e.g. 47
Wilsson & Sundgren 1997; Saetre et al. 2006; Meyer et al. 2012; Arvelius et al. 2014a; 48
Persson et al. 2015). 49
The majority of dog behaviour studies have been carried out on working dogs and have used 50
standardised tests, where the effects of the environment at the time of the test could be clearly 51
characterised. These standardised tests in controlled environments provide estimates of 52
moderate heritability for some tested behaviours, e.g. heritability of “gun shyness” has been 53
estimated at 0.56 (SE 0.09) in Labrador Retrievers (van der Waaij et al. 2008). However, the 54
majority of the reported heritability estimates for these traits fall below 0.4 (e.g. Wilsson & 55
Sundgren 1997; Saetre et al. 2006; van der Waaij et al. 2008; Arvelius et al. 2014b), with 56
various management and lifestyle factors (e.g. training practices, Haverbeke et al. 2010) 57
shown to affect behaviour. Thus, large datasets are required for accurate decomposition of the 58
variance in these traits into genetic and non-genetic components. Generating such datasets 59
requires substantial infrastructure which, in practice, may be unattainable for most pet dog 60
populations. Thus, even though personality traits are extremely important for the well-being 61
of both the dog and its owner, their heritabilities for pet dogs, usually not subjected to any 62
formalized behaviour testing, are still largely unknown. 63
Genomic methodologies like GWAS that assess markers across the genome have been used 64
to determine associations between traits and particular genetic variants. However, again 65
substantial datasets are required to identify genomic associations or to obtain genomic 66
predictions when a large number of small genetic effects are involved, as is expected to be 67
the case for behavioural traits (Willis-Owen & Flint 2006). As a result, few genomic analyses 68
have been applied to dog behaviour traits so far and thus, little is known about their genetic 69
architecture or the individual genes involved. Variation in a few functional candidate genes 70
(e.g. DRD4, TH, OXTR, SLC6A) has been shown to be associated with behaviour in dogs 71
(Våge et al. 2010; Kubinyi et al. 2012; Wan et al. 2013; Kis et al. 2014). However, these 72
4
detected associations are only a starting point in the process of understanding the molecular 73
genetic basis of dog behaviour. 74
Thus, the size of available datasets is a limiting factor to the dissection of the variance 75
components of behavioural traits as well as to the characterisation of their genetic 76
architecture. An alternative approach to using data from standardised tests would be to 77
exploit the knowledge that pet owners and dog breeders have of their own dogs in everyday 78
situations, in order to accumulate sufficiently large datasets. The size of these datasets could 79
then overcome the lack of standardised assessment and at the same time, avoid possible 80
interactions between the behaviour and the somewhat artificial conditions of the test 81
environment. 82
A survey-based approach has been now utilized in a number of studies on dog behaviour, 83
where the dog owner’s answers to validated questionnaires, such as Canine Behavioral 84
Assessment and Research Questionnaire (C-BARQ), were used to assess the personality traits 85
of the dog. C-BARQ was developed at the University of Pennsylvania originally as a method 86
for evaluating and predicting the success of guide dogs (Serpell & Hsu 2001). The reliability 87
and validity of C-BARQ demonstrated by the developers of the method and others (e.g. Hsu 88
& Serpell 2003; Svartberg 2005; Duffy & Serpell 2012) as well as the relationship between 89
C-BARQ responses and standardised test scores (Arvelius et al. 2014a) support its use as a 90
tool in behavioural research (Wiener & Haskell, 2016). Subsequently, it has been applied in 91
studies of dog behaviour by various groups (e.g. Liinamo et al. 2007; Kutsumi et al. 2013). 92
The C-BARQ survey contains 101 questions regarding the dog’s behavioural response to 93
various situations, with answers marked on a 5-step scale. The particular items of the 94
C-BARQ questionnaires are then typically grouped into factors describing a personality trait. 95
In most studies (e.g. Arvelius et al. 2014a; Asp et al. 2015), the grouping of questions and 96
number of resulting traits are largely based on the definitions derived by the developers of the 97
questionnaire (Hsu & Serpell 2003; Duffy & Serpell 2012), who used factor analysis to 98
define 11 (and later, 14) behavioural traits. In a previous study of Labrador Retrievers, we 99
used multivariate statistical techniques to define 12 personality traits from C-BARQ data 100
(Lofgren et al. 2014), some of which overlapped the previous grouping while others were 101
novel. 102

5
In this paper we used quantitative genetic and genomic approaches to investigate the genetic 103
contribution to everyday life behaviour, as assessed by C-BARQ data, in the Labrador 104
Retriever breed. 105
106
Methods 107
Personality trait characterisation 108
The data used in the study were a subset of a larger study on genetics of complex traits in 109
dogs, and consisted of owner-supplied responses to C-BARQ as well as a separate 110
demographic questionnaire. The dataset was limited to UK Kennel Club-registered Labrador 111
Retrievers. We previously applied a combination of Principal Components Analysis and 112
correlation structure to derive 12 behaviour traits (subsequently referred to as “SetA traits”): 113
Agitated when Ignored (Agitated), Attention-seeking (Attention), Barking Tendency 114
(Barking), Excitability, Fetching, Human and Object Fear (HOFear), Noise Fear (NoiseFear), 115
Non-owner-directed Aggression (NOAggression), Owner-directed Aggression 116
(OAggression), Separation Anxiety (SepAnxiety), Trainability and Unusual Behaviour 117
(Unusual) (Lofgren et al. 2014). The 12 trait values were calculated as averages of the 118
responses observed in each associated group, where the number of questions in the group 119
ranged from 1 (Barking, Fetching) to 20 (Unusual) (Supplementary Table 3 in Lofgren et al. 120
2014), as long as at least half of the questions were answered (otherwise, the dog’s record for 121
that trait was treated as missing). The final dataset used in the current analyses included 1,975 122
animals. The numbers of observations and the range of scores observed for each of the SetA 123
traits are presented in Table 1. Two of the traits (OAggression and SepAnxiety) showed 124
highly skewed distributions, with most dogs showing no evidence of these behavioural 125
characteristics. For comparison, we also calculated values for the 14 traits previously defined 126
for C-BARQ data (subsequently referred to as “SetB traits”) (Hsu & Serpell 2003; Duffy & 127
Serpell 2012), for the same dogs as in SetA. 128
129
130

6
Table 1. Description of the 12 SetA personality traits analysed in the study. 131
Trait Pedigree analysis Genomic analysis
Range No. observations Range No. observations
Agitated 1 - 5 1901 1 - 5 780
Attention 1 - 5 1942 1 - 5 792
Barking 1 - 5 1955 1 - 5 795
Excitability 1 - 5 1962 1 - 5 777
Fetching 1 - 5 1953 1 - 5 798
HOFear 0.7 - 5 1970 0.73 – 3.33 776
NoiseFear 1 - 5 1942 1 - 5 788
NOAggression 1 – 3.86 1971 1 – 3.86 802
OAggression 1 – 2.43 1967 1 – 2.14 801
SepAnxiety 1 - 3 1947 1 – 2.75 856
Trainability 1 – 5 1969 2 – 5 799
Unusual 1 – 3.55 1968 1 – 3.55 800
132
133
Demographic factors 134
Factors included as fixed effects and covariates were based on information on management 135
and physical traits recorded from a separate questionnaire sent to the dog owners (Lofgren et 136
al. 2014; Sánchez Molano et al. 2014). The fixed effects included sex and neuter status, 137
housing, coat colour, health status, exercise per day and “Role” (based on the activities of the 138
dog), as described in Table 2. The latter was determined using a stringent criterion such that 139
in case of uncertainty, the value was recoded as missing. The age of the dog in days (760 – 140
3,380 days) was fitted as a covariate. All of these factors were shown to be associated with 141
one or more traits in the previous analysis (Lofgren et al. 2014). Records with missing values 142
(either trait values or fixed effects) were removed from the analyses, thus resulting in variable 143
numbers of observations for each trait. 144
145

7
Table 2. Description of factors included as fixed effects in genetic models. These include sex and 146
neuter status (four levels), housing (three levels), coat colour (three levels), health status (two levels: 147
healthy or having had some health problem during their lifetime), exercise per day (four levels) and 148
“Role” (three levels). 149
Factors Categories No. observations
Coat colour Black 1144
Yellow 521
Chocolate 310
missing 0
Exercise per day <1 315
(hours) 1-2 972
2-4 565
>4 118
missing 5
Health Some health problem during
lifetime
1697
No health problems 278
missing 0
Housing Primarily inside 1578
Both inside and outside 170
Primarily outside 176
missing 51
Role Gundog 840
Pet 817
Showdog 140
missing 178
Sex/neutered status Male entire 451
Male neutered 59
Female entire 1028
Female neutered 426
missing 11
150
Mixed linear models analysis 151
The pedigree used in the analysis was spread over 29 generations and included 28,943 dogs: 152
9,040 sires (from 3,837 paternal grand-sires and 6,524 paternal grand-dams) and 17,975 dams 153
(from 6,555 maternal grand-sires and 12,272 maternal grand-dams). Approximately 70% of 154
the sires had only one offspring with phenotypes. The maximum number of phenotyped 155
offspring per sire was 37 (for one sire). As most of the trait distributions were skewed, we 156
first attempted to transform the traits using standard approaches (log, inverse, square root). 157
8
However, most of the distributions were not improved by transformation and some were 158
considerably worsened. We therefore decided to analyse the untransformed traits. 159
While other methods (e.g. Bayesian approaches) can be used for heritability estimation of 160
non-normally-distributed traits, the Mixed Linear Model (REML) approach has been shown 161
to be asymptotically consistent, i.e. it approaches the true value for the genetic variance as the 162
size of the dataset increases, independent of trait distributions (Jiang 1996), and furthermore, 163
does not depend on assumptions about prior distributions. In a range of studies of non-164
normally-distributed traits, REML has performed well in comparison with other methods, 165
both in terms of variance component estimation and predictive accuracy (Olesen et al. 1994; 166
Matos et al. 1997; Koeck et al. 2010; de Villemereuil et al. 2013). We therefore implemented 167
REML using ASReml software (Gilmour et al. 2009) for heritability estimation. 168
169
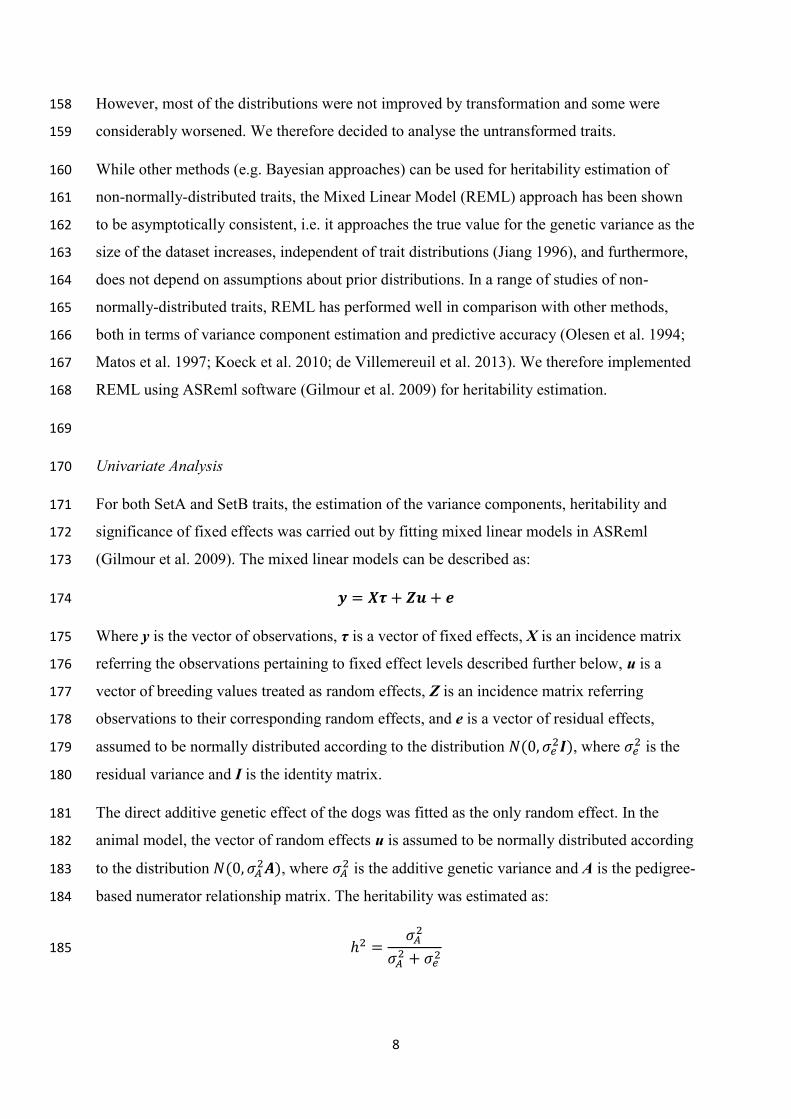
Univariate Analysis 170
For both SetA and SetB traits, the estimation of the variance components, heritability and 171
significance of fixed effects was carried out by fitting mixed linear models in ASReml 172
(Gilmour et al. 2009). The mixed linear models can be described as: 173
𝒚 = 𝑿𝝉 + 𝒁𝒖 + 𝒆 174
Where y is the vector of observations, τ is a vector of fixed effects, X is an incidence matrix 175
referring the observations pertaining to fixed effect levels described further below, u is a 176
vector of breeding values treated as random effects, Z is an incidence matrix referring 177
observations to their corresponding random effects, and e is a vector of residual effects, 178
assumed to be normally distributed according to the distribution 𝑁(0, 𝜎𝑒2𝑰), where 𝜎𝑒
2 is the 179
residual variance and I is the identity matrix. 180
The direct additive genetic effect of the dogs was fitted as the only random effect. In the 181
animal model, the vector of random effects u is assumed to be normally distributed according 182
to the distribution 𝑁(0, 𝜎𝐴2𝑨), where 𝜎𝐴
2 is the additive genetic variance and A is the pedigree-183
based numerator relationship matrix. The heritability was estimated as: 184
ℎ2 =𝜎𝐴2
𝜎𝐴2 + 𝜎𝑒2
185
9
The choice of effects included in the best fitting model was based on their p-value. The 186
model was constructed through backward elimination, i.e. by first fitting all effects, followed 187
by stepwise subtraction of the term with highest p-value from the model. Model construction 188
was performed separately in each trait, being carried out until all effects included were 189
significant. Thus, the final model was defined as the most comprehensive model in which all 190
fixed effects and covariates had a p-value below 0.05. 191
The analyses were run until the likelihood and parameters converged, which, through a 192
default setting in ASReml, was determined when the variance component estimates changed 193
by no more than 1% between iterations and the change in the likelihood was less than 194
0.002*current iteration number (Gilmour et al. 2015). The significance of the additive genetic 195
component of the variance was tested via log-likelihood ratio test, with the parameter deemed 196
significant when twice the difference between the log-likelihood value of the model 197
containing it and a simpler model with no additive variance exceeded 3.84. 198
Because the log-likelihood ratio tests performed to assess significance of heritability may 199
have been influenced by the non-normal nature of the traits, we carried out an alternative 200
permutation-based approach to assess significance, which was independent of trait 201
distribution. We first fitted a fixed effects model, i.e. including only the relevant fixed effects, 202
to obtain the residuals for each trait (fixed effects were fitted separately so that these did not 203
need to be considered in the permutation process). We then randomized the residuals 100 204
times with respect to the animal IDs and re-ran the variance components analysis for each 205
permuted dataset, using the correct pedigree. This procedure randomized the relationship 206
between the traits and pedigree relationships. Thus we derived a null distribution of h2 values 207
under the assumption of no effect of pedigree relationships on the phenotype (i.e. h2=0), 208
without any assumption of normality. We then compared the actual estimates of h2 with this 209
distribution, such that significance was concluded if the actual estimate exceeded the 95th 210
percentile of the permutation results. 211
Bivariate analysis 212
Genetic and environmental correlations between SetA traits with significant heritabilities 213
were obtained by fitting bivariate models to their records. The general model behind bivariate 214
analyses is similar to that presented in univariate analyses, but with u assumed to be 215
MVN(0,𝑽⊗ 𝑨), where V is a (co)variance matrix of the two trait terms. The fixed effects 216
fitted to each trait in the bivariate analyses were the same as those fitted in the final model 217

10
derived for each trait in the univariate analyses. The phenotypic, genetic and environmental 218
correlations were calculated as: 219
𝑟 =𝑐𝑜𝑣𝑋𝑌
√𝑣𝑎𝑟𝑋𝑣𝑎𝑟𝑌 220
Where 𝑐𝑜𝑣𝑋𝑌 is the covariance between the particular components of traits X and Y, and 221
𝑣𝑎𝑟𝑋 and 𝑣𝑎𝑟𝑌 are the given variance components. 222
Bivariate analyses were also conducted between SetA and SetB traits for which a significant 223
genetic variance was detected in the univariate analyses. 224
225
SNP genotyping and marker quality control 226
The genomic data was collected as part of a larger project (Sánchez Molano et al. 2014; 227
Sánchez Molano et al. 2015) where genotypes were obtained using the Illumina Canine High 228
Density Beadchip containing 173,662 SNPs 229
(http://www.illumina.com/documents/products/datasheets/datasheet_caninehd.pdf; accessed 230
27/04/16). Filtering criteria were previously applied to samples based on call rate and 231
excessive genotyping errors, detected as inconsistencies between the genomic and pedigree 232
relatedness of individuals or between recorded sex and sex determined from the genotyping 233
(Sánchez Molano et al. 2014). Of the 1,179 animals that satisfied these quality control 234
criteria, 885 were included in the set of 1,975 with C-BARQ assessments and thus were 235
retained for the current study. Filtering criteria were also previously applied to markers 236
(Sánchez Molano et al. 2014). Using Genome Studio software 237
(http://www.illumina.com/techniques/microarrays/array-data-analysis-experimental-238
design/genomestudio.html; accessed 27/04/16), 59,260 markers were discarded due to low 239
call rate (<98%), low reproducibility (GenTrain score, GTS, < 0.6, where GTS measures the 240
shape of the genotype clusters and their relative distance to each other) and low or 241
confounded signal (ABR mean < 0.3, where ABR is the normalized intensity (R) of the 242
heterozygote cluster). Further quality control was applied using PLINK (Purcell et al. 2007), 243
removing markers with low minor allele frequency (MAF < 0.01) and subsequently, those 244
showing a significant excess of heterozygotes compared to that predicted under Hardy-245
Weinberg equilibrium (thresholds of p<4.59E-7 for autosomal markers and p<1.80E-5 for X-246
linked markers, applying Bonferroni correction); regarding deviations from HWE, we made 247
the decision to only exclude markers showing significant excess of heterozygotes since a 248

11
deficit of heterozygotes may represent a true effect of inbreeding while a highly significant 249
excess of heterozygotes is likely to be an indicator of genotyping errors. The final set of 250
108,829 autosomal and 2,772 X-linked SNPs were assigned genomic positions according to 251
the CanFam 2.0 assembly. 252
253
254
Genomic analyses 255
Genome-wide association analyses of the SetA traits with significant heritabilities were 256
performed using GEMMA (Zhou & Stephens 2012), accounting for population stratification 257
by fitting the genomic relationship matrix (GRM, G). The linear mixed models were assumed 258
as follows: 259
260
y = Wα + xβ + u + e, 261
262
where y is the vector of phenotypes, W is the matrix of covariates with the α vector of 263
associated fixed effects (including the intercept) and x is the vector of marker genotypes 264
(coded as 0/1/2) with β representing the regression coefficient of the marker genotype on the 265
phenotype. The vectors of random polygenic effects, u, and residual errors, e, follow 266
multivariate normal (MVN) distributions given by u ~ MVN(0, 𝜎𝑔2 G) and e ~ MVN(0, 𝜎𝑒
2I), 267
where 𝜎𝑔2 and 𝜎𝑒
2 are the variances associated with random polygenic (u) and residual (e) 268
terms, respectively. Fixed effects were determined for each trait separately, based on results 269
from the pedigree-based analysis (described above), with minor changes in coding. Thus, the 270
following effects were used: sex (only for autosomal markers) (2 classes), neuter status (2 271
classes), Role (2 classes, Gundog and Pet/Showdog) and exercise (covariate, 1-4), health (2 272
classes), housing (covariate, 1-3) and age (covariate). Unlike the pedigree-based analysis, 273
coat colour was not included as a fixed effect under the assumption that this factor would be 274
accounted for by markers linked to the genes encoding coat colour (i.e. MC1R, TYRP1 275
genes). It is likely that Role incorporates both genetic and lifestyle factors, based on analysis 276
of genetic structure in this population (unpublished). The genomic relationship matrix should 277
account for much of the genetic component. Animals for which one or more fixed effects or 278
covariates were missing were removed from the analysis, such that the number of animals 279
12
included in the analysis varied across the traits (range: 778-878; analyses of nine of the 12 280
traits incorporated 802-807 animals) (Table 1). For X-linked markers, analyses were 281
conducted separately for males and females. 282
283
The statistical significance for each marker was assessed using a Wald t-test. Due to the 284
possibility of inflation of –log(p) as a result of differences in allele frequencies (cryptic 285
population stratification) or genotyping errors, a correction to the p-values by the inflation 286
factor λ was also performed using the method suggested by Amin et al. (Amin et al. 2007) 287
under the assumption that the inflation is roughly constant across the genome. For X-linked 288
markers, p-values were first calculated separately for males and females. The weighted Z-test 289
was then used to combine these into an overall p-value (Whitlock 2005). Following 290
Bonferroni correction for multiple testing resulting from the large number of markers, 291
significance thresholds (based on the corrected p-values) were p<4.480E-7 for genome-wide 292
(p<0.05) and p<8.961E-6 for suggestive (one false positive per genome scan) levels. 293
294
Estimations of the variance explained by the full set or subsets of SNPs were performed in 295
GCTA (Yang et al. 2010; Yang et al. 2011) using the same models as for the GWAS. Genetic 296
variances (VG) explained by the autosomes and X chromosome were calculated separately for 297
each trait (using the “--make-grm” and “--make-grm-xchr” options, respectively). Autosomal 298
and X-linked genomic heritabilities for each trait were reported. 299
300
Data availability: Data is available at Dryad repository: doi:10.5061/dryad.171q5. 301
302
Results 303
Mixed linear models 304
The number of significant demographic factors affecting a personality trait differed between 305
the SetA traits, ranging from just one significant effect detected for Barking to five effects 306
detected for Unusual (Table 3). The factors with largest impact on personality were Role (11 307
traits) and sex-neuter status (8 traits). Exercise levels and coat colour were also associated 308
with several traits (5 and 4 traits, respectively). Health status, housing and age were 309
associated with the fewest traits (2, 2 and 1, respectively). The results for Role were similar 310
to those found in the previous study (Lofgren et al. 2014), such that Gundogs were generally 311
different from Pets and/or Showdogs, while Pets and Showdogs showed fewer differences, 312

13
Analysis of the SetB traits showed similar results, with sex-neuter status, Role and exercise 313
levels having effects on the largest number of traits (Table 3). 314
315

14
Table 3. Summary of fixed effects and covariates found to be significantly associated with personality 316 traits using mixed linear models (* indicates p<0.05, ** indicates p<0.01 and *** indicates p<0.001). 317
Trait Factor
SetA Age Coat
colour
Sex/
Neuter
Health Housing Exercise Role
Agitated
*
***
Attention
***
***
Barking
***
Excitability
* *** ***
Fetching ** *
***
HOFear
**
*
***
NoiseFear
***
***
NOAggression
* *
*** ***
OAggression
*
**
SepAnxiety
* *** *
***
Trainability
*
*** ***
Unusual
** *
** ***
SetB
Attachment *** * *
Chasing *** ** ***
Dog-directed
aggression ** ***
Dog-directed fear ** ***
Dog rivalry
Energy level ** * ***
Excitability ** *** ***
Non-social fear *** ***
Owner-directed
aggression * *
Separation-related
behavior *** * ***
Stranger-directed
aggression *** *** **
Stranger-directed
fear **
Touch sensitivity * ***
Trainability ** ***
318
15
The h2 estimates from the best-fitting models for the SetA traits varied from 0.03 (SE 0.04) 319
for OAggression to 0.38 (SE 0.08) for Fetching (Table 4). Heritabilities greater than 0.20 320
were found for six traits. Based on the log-likelihood ratio test (LRT), all traits except 321
OAggression and SepAnxiety were found to have genetic variance significantly greater than 322
0 (Table 4). The permutation test results (Supplementary Table S1) were in good agreement 323
with the LRT results with two exceptions: HOFear was significantly different from 0 324
according to the LRT but not the permuted h2 values, and SepAnxiety was not significantly 325
different from 0 according to the LRT but it was for the permuted h2 values. Thus we 326
conclude that nine traits showed significant heritability, OAggression showed no evidence of 327
genetic variance and significance could not be confirmed for HOFear or SepAnxiety.328

16
Table 4. Pedigree-based (SetA and SetB) and genomic (SetA) heritability estimates and associated standard errors for trait-specific models (fixed effects and 329 covariates fitted as shown in Table 2). Values significantly greater than 0 based on a log-likelihood ratio test shown in bold. 330
Trait (SetA)
(number of
questions on which
it was based)
h2 (SE) genomic h2 (SE) Number of
questions in
common
Traits (SetB)
(number of questions on which it
was based)
h2 (SE)
Autosomal markers X-linked markers
Agitated (2) 0.22 (0.07) 0.02 (0.03) 0.03 (0.03) 2 Attachment (6) 0.13 (0.06)
Attention (3) 0.14 (0.06) 0.00 (0.04) 0.00 (0.02) 3
Barking (1) 0.15 (0.07) 0.10 (0.07) 0.01 (0.02)
Excitability (5) 0.10 (0.06) 0.00 (0.04) 0.00 (0.02) 5 Excitability (6) 0.11 (0.06)
Fetching (1) 0.38 (0.08) 0.19 (0.08) 0.05 (0.03)
HOFear (15) 0.08 (0.05) 0.12 (0.06) 0.02 (0.02) 4 Stranger-directed fear (4) 0.14 (0.06)
4 Dog-directed fear (4) 0.07 (0.05)
NoiseFear (2) 0.30 (0.08) 0.23 (0.07) 0.08 (0.03) 2 Non-social fear (6) 0.25 (0.08)
NOAggression (14) 0.29 (0.08) 0.19 (0.07) 0.02 (0.02) 8 Stranger-directed aggression (9) 0.26 (0.07)
4 Dog-directed aggression (4) 0.17 (0.07)
OAggression (7) 0.03 (0.04) 0.04 (0.06) 0.00 (0.02) 7 Owner-directed aggression (8) 0.02 (0.03)
SepAnxiety* (8) 0.06 (0.05) 0.00 (0.04) 0.01 (0.02) 8 Separation-related behaviour* (8) 0.00 (0.02)
Trainability (7) 0.28 (0.07) 0.20 (0.07) 0.04 (0.02) 7 Trainability (8) 0.15 (0.06)
Unusual (20) 0.25 (0.08) 0.12 (0.07) 0.01 (0.02) 3 Chasing (4) 0.26 (0.07)
Dog rivalry (4) 0.11 (0.06)
Energy level (2) 0.15 (0.06)
Touch sensitivity (3) 0.18 (0.08) 331
* These two traits had the same definition but heritability estimates were slightly different due to different rules regarding treatment of missing values for 332 individual CBARQ responses.333

17
The range of heritability estimates for the SetB traits were somewhat lower than for the SetA 334
traits (Table 4), with similarities between some related traits (e.g. NoiseFear and Non-social 335
Fear, NOAggression and Stranger-directed aggression, Unusual and Chasing) but also some 336
notable differences (e.g. SetA_Trainability greater than SetB_Trainability). 337
Only five out of 36 of the SetA trait pairs were found to be significantly genetically 338
correlated (Supplementary Table S1). Four of these involved Unusual Behaviour (with 339
Agitated, NoiseFear, NOAggression and Trainability); the other significant genetic 340
correlation was for NOAggression - Fetching. The significant correlations were mostly 341
moderate and positive, with the exception of that between Unusual and Trainability. In 342
contrast, more than half of the residual correlations (22 out of 36) between the SetA traits 343
were found to be significant, suggesting shared environmental influences. The residual 344
correlations varied in sign and magnitude, with the strongest negative correlation found for 345
Trainability and Unusual (re= -0.36, SE 0.06) and the strongest positive correlation found for 346
Excitability and Unusual (re= 0.42, SE 0.05). 347
Genetic correlations between SetA and SetB traits are given in Supplementary Table S2 (the 348
analysis failed for the NoiseFear (SetA) - Non-social Fear (SetB) pair due to a singularity in 349
the average information matrix computed by the ASREML algorithm). For some related trait 350
pairs, the genetic correlation was very high (e.g. SetA-SetB: Excitability-Excitability, 351
rg=0.98, SE 0.01; NOAggression-Stranger-directed-aggression, rg=0.98, SE 0.03) while it 352
was not as high for others (e.g. Trainability-Trainability, rg=0.55, SE 0.18). Another notably 353
high genetic correlation was between Unusual (SetA) and Chasing (SetB) (rg =0.88, SE 0.07). 354
355
Genomic Analyses 356
The proportion of the phenotypic variance explained by the full set of SNPs (“genomic 357
heritabilities,” considering the total of the autosomal and X-linked estimates), based on a 358
smaller dataset than that of the pedigree-based heritabilities, ranged from 0.00 (Attention, 359
Excitability) to 0.31 (NoiseFear) (Table 4). Nine of the traits showed lower genomic 360
heritabilities than the pedigree-based estimates; for four of these traits, the SNP data 361
explained less than half of the pedigree-based heritability, although for three traits (Barking, 362
NOAggression and Trainability), the proportion explained by the SNP data was >70% of the 363
pedigree-based heritability. For HOFear, NoiseFear and OAggression, the genomic 364

18
heritabilities were higher than the pedigree-based heritabilities, although the differences were 365
small. 366
GWAS was carried out for the nine SetA traits with pedigree-based heritabilities significantly 367
different from 0 according to both log-likelihood ratio and permutation tests (excluding 368
HOFear, OAggression and SepAnxiety, Table 4). No SNPs were found to show genome-wide 369
significance, however, we identified 11 SNPs (in 8 genomic regions) showing suggestive 370
significance (“suggestive SNPs”) for six traits: Agitated (CFA18), Barking (CFA4), Fetching 371
(CFA1, 4 and 22), NoiseFear (CFA20), NOAggression (CFA9), and Unusual (CFA2) (Table 372
5; Supplementary Figure 1). A visual inspection of Quantile-Quantile (Q-Q) plots revealed 373
that the lambda-correction procedure adequately corrected for unexplained population 374
structure in the sample for the autosomes, although it was slightly less effective for the X-375
chromosome (Supplementary Figure 2). The proportion of the variance explained by the 376
individual suggestive SNPs across the genome ranged from 0.022 to 0.043 across the traits 377
(Table 5). 378
379

19
Table 5. SNPs exceeding suggestive level threshold in genome-wide association analysis. 380
381 Trait Chrom Position* SNP Effect size (β)¥ (SE)
Corrected p-value
Proportion of variance explained§
Agitated 18 50359100 BICF2P964118 -0.2540 (0.05) 2.60e-06 0.028
Barking 4 55645061 BICF2P696817 -0.2256 (0.05) 7.98e-06 0.023
Fetching 1 84905345 BICF2G630792579 -0.2914 (0.06) 7.56e-06 0.031
4 91287944 BICF2P844921 -0.3270 (0.07) 9.19e-07 0.030
4 91442298 BICF2P456276 -0.3596 (0.08) 1.88e-06 0.027
4 91453025 BICF2P73495 -0.3623 (0.08) 1.98e-06 0.027
4 91475109 BICF2P519369 -0.4003 (0.09) 4.06e-06 0.023
22 35218609 BICF2S2314224 -0.6587 (0.15) 7.00e-06 0.022
NoiseFear 20 31482825 BICF2P846231 0.3945 (0.09) 6.08e-06 0.043
NOAggression 9 28762604 BICF2G630832223 -0.1210 (0.03) 8.76e-06 0.039
Unusual 2 77975665 BICF2P612229 0.3290 (0.07) 6.74e-06 0.023
382 *SNP positions according to CanFam2.0 383 ¥ Additive effect of the minor allele 384 § Calculated using GCTA 385 386
387

20
Discussion 388
The analysis of C-BARQ responses collected from owners of Labrador Retrievers in the UK 389
revealed a significant genetic variance present for most of the behavioural traits examined. 390
The magnitude of the estimates significantly different from 0 (according to both log-391
likelihood ratio and permutation tests) for the SetA traits ranged between 0.10 (Excitability) 392
and 0.38 (Fetching), showing consistency with the range of heritabilities previously reported 393
for behavioural traits in dogs (Strandberg et al. 2005; Saetre et al. 2006; Meyer et al. 2012; 394
Eken Asp et al. 2014; also see review by Hall & Wynne 2012). For nine out of 12 traits, 395
genomic heritabilities were lower than pedigree-based estimates, however, genome-wide 396
association analysis identified several genomic regions showing suggestive associations with 397
C-BARQ traits. While C-BARQ has been used in a large number of studies on dog 398
behaviour, the genetic analysis of the traits derived from the questionnaire is still in its 399
infancy, with only a handful of heritability estimates published to date (e.g. Liinamo et al. 400
2007; Arvelius et al. 2014a). The results presented in this study show that there is a 401
consistency in detection of the genetic variance and detectable genomic associations for traits 402
derived from C-BARQ, but also that quantification of the genetic component of C-BARQ-403
based traits is sensitive to how these behavioural factors are extracted from the questionnaire 404
responses. 405
406
Heritability estimates and trait definition for C-BARQ data 407
The SetA traits with highest heritability were Fetching and NoiseFear. Our estimate for the 408
latter falls within the range of previous reports based on standardised tests, with heritabilities 409
of “reaction to gunfire” ranging between 0.23 and 0.56 (Ruefenacht et al. 2002; van der 410
Waaij et al. 2008). The heritability estimate for Non-social fear (SetB) was similar to 411
NoiseFear for this dataset and somewhat lower than found previously for Rough Collies 412
(h2=0.36, SE 0.06) (Arvelius et al. 2014a). Thus it appears that genetic variation for this trait 413
exists in various breeds, including gun dogs. 414
Fetching was only considered as a separate trait for SetA. In SetB, the question related to 415
fetching ability was included in Trainability (h2=0.15, SE 0.06). Treating Fetching and 416
Trainability as separate traits resulted in higher heritability estimates for both: h2=0.38 (SE 417
0.08) for Fetching and h2=0.28 (SE 0.07) for Trainability, with a positive but small genetic 418
correlation between the traits (rg=0.26, SE 0.18). Heritabilities for Trainability (SetB) have 419

21
been previously estimated at 0.15 (SE 0.04) for Rough Collies (Arvelius et al. 2014a) and 420
0.25 (SE 0.04–0.06) across 14 breeds (not including either Labrador Retrievers or Rough 421
Collies) (Eken Asp et al. 2014). The genetic correlations between SetA and SetB traits 422
demonstrate the large influence of fetching ability on SetB Trainability for this population 423
such that their estimates are higher for Fetching (SetA) – Trainability (SetB) (rg=0.78, SE 424
0.11) than for Trainability (SetA) – Trainability (SetB) (rg=0.55, SE 0.18). These results 425
suggest, at least in Labrador Retrievers, some degree of distinction between the genetic basis 426
for fetching ability and other trainability characteristics, and illustrate the effects of trait 427
grouping on resulting heritability estimates. 428
Agitated and Attention were considered as separate traits in SetA but together contributed to 429
Attachment in SetB. The heritability estimate for Attention (SetA) was very similar to that for 430
Attachment (SetB), with a high genetic correlation (rg=0.86, SE 0.08). The estimate of 431
heritability for Agitated (SetA) was higher than the estimate for Attachment (SetB), with a 432
lower genetic correlation (rg=0.62, SE 0.17). These results suggest that there may be 433
differences between the genetic influences on Agitated and Attention. 434
In contrast to aggression directed towards strangers and other dogs, which showed moderate 435
heritability, our estimate of heritability for owner-directed aggression was not significantly 436
different from 0, in accordance with previous reports showing low or no genetic variance, 437
most likely due to strong selection intensity against this trait, particularly in breeds of large 438
size (Duffy et al. 2008; Eken Asp et al. 2014). 439
While the questions contained in the C-BARQ questionnaire seem to capture the variance of 440
the behavioural traits, the method of grouping into behavioural factors may influence 441
estimates of heritability, as was shown above for Trainability and also suggested for Agitated. 442
One alternative approach to trait definition could involve grouping questions based on their 443
genetic, rather than phenotypic, covariances. Such an approach has been shown in the context 444
of standardised behavioural tests to improve the estimates of the behavioural dimensions of 445
the temperament test used by the Swedish Armed Forces, especially when items with 0 446
genetic variance were removed from the factor (Arvelius et al. 2014b). Evaluating the genetic 447
variance of individual C-BARQ questions has only been carried out once to our knowledge, 448
based on data for young (6 and 12 months old) guide dog candidates (Schiefelbein 2012). 449
Using a similar approach, it would be interesting to examine the heritabilities of responses to 450
22
particular questions, as well as their genetic correlations, using data collected from adult 451
dogs. 452
In considering how to interpret results of genetic studies on behavioural traits, it is important 453
to recognise that dog breeds may differ in terms of the meaningfulness (and thus heritability) 454
of behavioural constructs, as is suggested by differences between heritability estimates for 455
Labrador Retrievers (our study) and Rough Collies (Arvelius et al. 2014a), which could be 456
due to differences in breed history or the intensity of selection for specific traits. Depending 457
on the scientific question or practical application, researchers may need to make a choice 458
between using the same trait definitions across breeds but accepting that their meaning differs 459
between breeds or alternatively, developing breed-specific trait definitions that show similar 460
levels of genetic variation. 461
462
Genomic analysis of personality traits 463
The limited number of molecular genetic studies of canine behaviour mainly comprise 464
candidate gene studies or studies targeted at clinical behavioural disorders, which tend to 465
have more clearly defined phenotypes than everyday life behaviours. The few studies using 466
genomic techniques to address everyday life behaviour have primarily implemented between-467
breed comparisons based on breed-average phenotypes (e.g. Jones et al. 2008; Vaysse et al. 468
2011; Zapata et al. 2016). This approach has limitations in that behavioural and physical traits 469
distinguishing breeds are often confounded, making it difficult to identify which trait is 470
associated with a particular genomic region. Analysis of within-breed genotypic and 471
phenotypic variation, such as in the current study, avoids this problem although the variants 472
(genes) that contribute to behavioural differences within breeds may not be the same as those 473
that account for between-breed behavioural variation. 474
Based on results in mice, behavioural traits are suspected to be largely polygenic, with a 475
strong environmental component (Flint 2003; Willis-Owen & Flint 2006), thus, difficulties 476
are expected in detecting genomic associations. Our results were consistent with a model of 477
polygenic inheritance for most traits, nevertheless, several suggestive associations were 478
identified, albeit only explaining small proportions of the phenotypic variance. Based on the 479
number of suggestive SNPs within the identified regions, the most convincing genomic 480
association was identified for Fetching (CFA4). The largest effect sizes were seen for 481
Fetching (CFA4 and CFA22) and NoiseFear (CFA20). The finding that pedigree-based 482
23
heritability estimates were generally higher than genomic estimates was consistent with the 483
common finding of “missing heritability” in other recent studies that have estimated genomic 484
heritability for complex traits and compared them to pedigree-based heritability. A possible 485
explanation for under-estimation of the genomic variance is that rare variants of large effect 486
may not be well-tagged by the analysed SNPs, supported by the fact that the extent of 487
missing heritability for human height has decreased with increases in sample size and the 488
application of genotype imputation, leading to improved variant characterisation (Yang et al. 489
2015). Studies of human traits have also demonstrated that family-based heritability estimates 490
may be inflated when shared environmental factors are not accounted for (Zaitlen et al. 2013; 491
Yang et al. 2015; Munoz et al. 2016), but this is likely to be less of a problem for pedigree 492
dogs in which puppies are generally sold and distributed to multiple households and thus 493
spend much less time with their littermates than do human siblings. 494
Several SNPs showing suggestive associations with the CBARQ traits were found close to 495
genes with known neurological or behavioural functions. The TH (tyrosinase hydroxylase) 496
gene, whose enzyme product is involved in the synthesis of L-DOPA, the precursor of the 497
neurotransmitter dopamine, is located ~1 Mb from the SNP on CFA18 associated with 498
Agitated. Dopamine plays numerous functions and several distinct dopamine pathways are 499
found in the brain. Furthermore, conditions in humans involving inattention and impulsivity, 500
such as attention deficit hyperactivity disorder (ADHD), are associated with decreased 501
dopamine activity (Volkow et al. 2009). Polymorphism in TH has previously been associated 502
with activity, impulsivity and inattention in two dog breeds (Kubinyi et al. 2012; Wan et al. 503
2013). Studies have also shown an association between TH polymorphisms in humans and 504
“neuroticism” (tendency to experience negative emotions) and “extraversion” (characterised 505
by sociability and excitability) (Persson et al. 2000; Tochigi et al. 2006), two personality 506
traits associated with impulsivity (Whiteside & Lynam 2001). 507
Genes in the suggestive GWAS peak regions on CFA4 and CFA20 have also been associated 508
with neurological functions. The SNP on CFA4 associated with Barking is located ~5 kb 509
from CLINT1 (Epsin 4), a gene for which mutations have been associated with susceptibility 510
to schizophrenia (Pimm et al. 2005). Furthermore, the SNP associated with NoiseFear is 511
located ~0.27 Mb from CADPS2 on CFA20. CADPS2 is a member of a gene family 512
encoding calcium binding proteins that regulate the exocytosis of neuropeptide-encompassing 513
(dense-core) vesicles from neurons and neuroendocrine cells. The gene and its variants have 514
been associated with autism in humans (Cisternas et al. 2003; Bonora et al. 2014) and with 515

24
various behavioural and neurological phenotypes in mice (Sadakata et al. 2013). An 516
association with noise phobia on CFA20 (position not given) was previously reported for 517
dogs (Hakosalo et al. 2015). 518
519
Conclusions 520
The analysis of an owner-evaluated behavioural questionnaire, C-BARQ, together with a 521
questionnaire examining demographic factors, revealed significant genetic variation for most 522
of the behavioural traits studied in a population of Labrador Retrievers. While owner-523
assessed questionnaires are thus confirmed as a valuable tool in detecting genetic variance in 524
everyday life behaviours of dogs across different lifestyles, it has also been shown that the 525
grouping of the questions into behavioural factors may have a considerable effect on the 526
magnitude of the genetic variance detected. A model of polygenic inheritance with small 527
effect sizes is consistent with most traits investigated in this study. Chromosomal regions 528
associated with some traits were suggested by genomic analyses, however, additional data 529
will be required to fully capture the genomic variance and to confirm and resolve the 530
genomic associations.531

25
Acknowledgements 532
We are grateful to James Serpell for allowing us to use C-BARQ for our study and to all the 533
owners of Labrador Retrievers who completed the C-BARQ survey. We would also like to 534
thank John Woolliams for a series of valuable discussions and for suggesting the use of 535
permutation testing; John Hickey, Ricardo Pong-Wong, James Prendergast, Albert Tenesa 536
and Ian White for helpful advice; and Melissa Rolph, Tom Lewis and the Kennel Club for 537
assistance with data collection. Funding was provided by the UK Biotechnology and 538
Biological Sciences Research Council (grant BB/H019073/1 and core funding to the Roslin 539
Institute). 540

26
Supplementary material 541
542
Figure S1. Results from genome-wide association analysis of 9 personality traits with 543
significant heritability estimates: -log(p) values for all SNPs across the genome. The genome-544
wide threshold (red line) corresponds to the Bonferroni correction for a nominal P-value = 545
0.05. The suggestive threshold (blue line) corresponds to one false positive per genome scan. 546
A. Autosomal markers. B. X-linked markers. 547
548
Figure S2. Results from genome-wide association analysis of 9 personality traits with 549
significant heritability estimates: Q-Q plot of Expected versus Observed p-values. A. 550
Autosomal markers. B. X-linked markers. 551
552
Table S1. Results from permutation testing of heritability significance. Actual h2 estimates 553
were compared to the distribution of results for 100 permutations per trait (for residuals pre-554
adjusted for fixed effects) and significance was concluded if the actual estimate exceeded the 555
95th percentile of the permutation results. 556
557
Table S2. Results from bivariate analysis for pairs of SetA traits with significant genetic 558
variance determined by univariate analyses; factors included in the model were the same as 559
those fitted in the final models derived for each trait in the univariate analyses (see Table 4). 560
Above diagonal: additive genetic correlations (standard errors); below diagonal: residual 561
correlations (standard errors). Those shown in bold are significantly greater than 0 (p<0.05). 562
563
Table S3. Genetic correlations between SetA and SetB traits with significant genetic variance 564
determined by univariate analyses (the genetic correlation for NoiseFear-Non-social Fear 565
could not be estimated, see text); factors included in the model were the same as those fitted 566
in the final models derived for each trait in the univariate analyses (see Table 4). Those 567
shown in bold are significantly greater than 0 (p<0.05). 568
569
27
References 570
571
Amin, N., C. M. van Duijn & Y. S. Aulchenko, 2007 A Genomic Background Based Method 572
for Association Analysis in Related Individuals. Plos One 2. 573
Arata, S., Y. Takeuchi, M. Inoue & Y. Mori, 2014 "Reactivity to Stimuli'' Is a 574
Temperamental Factor Contributing to Canine Aggression. Plos One 9. 575
Arvelius, P., H. E. Asp, W. F. Fikse, E. Strandberg & K. Nilsson, 2014a Genetic analysis of a 576
temperament test as a tool to select against everyday life fearfulness in Rough Collie. 577
Journal of Animal Science 92: 4843-4855. 578
Arvelius, P., E. Strandberg & W. F. Fikse, 2014b The Swedish Armed Forces temperament 579
test gives information on genetic differences among dogs. Journal of Veterinary Behavior-580
Clinical Applications and Research 9: 281-289. 581
Asp, H. E., W. F. Fikse, K. Nilsson & E. Strandberg, 2015 Breed differences in everyday 582
behaviour of dogs. Applied Animal Behaviour Science 169: 69-77. 583
Begemann, M., S. Grube, S. Papiol, D. Malzahn, H. Krampe et al., 2010 Modification of 584
Cognitive Performance in Schizophrenia by Complexin 2 Gene Polymorphisms. Archives 585
of General Psychiatry 67: 879-888. 586
Bonora, E., C. Graziano, F. Minopoli, E. Bacchelli, P. Magini et al., 2014 Maternally 587
inherited genetic variants of CADPS2 are present in Autism Spectrum Disorders and 588
Intellectual Disability patients. Embo Molecular Medicine 6: 795-809. 589
Cisternas, F. A., J. B. Vincent, S. W. Scherer & P. N. Ray, 2003 Cloning and characterization 590
of human CADPS and CADPS2, new members of the Ca2+-dependent activator for 591
secretion protein family. Genomics 81: 279-291. 592
de Villemereuil, P., O. Gimenez & B. Doligez, 2013 Comparing parent-offspring regression 593
with frequentist and Bayesian animal models to estimate heritability in wild populations: a 594
simulation study for Gaussian and binary traits. Methods in Ecology and Evolution 4: 260-595
275. 596
Drew, C. J. G., R. J. Kyd & A. J. Morton, 2007 Complexin 1 knockout mice exhibit marked 597
deficits in social behaviours but appear to be cognitively normal. Human Molecular 598
Genetics 16: 2288-2305. 599
Duffy, D. L., Y. Hsu & J. A. Serpell, 2008 Breed differences in canine aggression. Applied 600
Animal Behaviour Science 114: 441-460. 601
28
Duffy, D. L. & J. A. Serpell, 2012 Predictive validity of a method for evaluating 602
temperament in young guide and service dogs. Applied Animal Behaviour Science 138: 603
99-109. 604
Eken Asp, H., P. Arvelius, W. F. Fikse, K. Nilsson & E. Strandberg, 2014 Genetics of 605
aggression, fear and sociability in everyday life of Swedish dogs. Proceedings, 10th World 606
Congress of Genetics Applied to Livestock Production. 607
Flint, J., 2003 Analysis of quantitative trait loci that influence animal behavior. Journal of 608
Neurobiology 54: 46-77. 609
Gilmour, A. R., B. J. Gogel, B. R. Cullis & R. Thompson, 2009 ASReml User Guide Release 610
3.0, pp. VSN International Ltd, Hemel Hempstead, UK. 611
Gilmour, A. R., B. J. Gogel, B. R. Cullis, S. J. Welham & R. Thompson, 2015 ASReml User 612
Guide Release 4.1 Structural Specification, pp. VSN International Ltd, Hemel Hempstead, 613
UK. 614
Glynn, D., C. J. Drew, K. Reim, N. Brose & A. J. Morton, 2005 Profound ataxia in 615
complexin I knockout mice masks a complex phenotype that includes exploratory and 616
habituation deficits. Human Molecular Genetics 14: 2369-2385. 617
Hakosalo, O., K. Tiira, R. Sarviaho, M. Sillanpaa, J. Kere et al., 2015 Identification of Novel 618
Candidate Genes in Canine Noise Phobia - A Model for Human Phobias. Biological 619
Psychiatry 77: 80S-81S. 620
Hall, N. J. & C. D. L. Wynne, 2012 The canid genome: behavioral geneticists' best friend? 621
Genes Brain and Behavior 11: 889-902. 622
Haverbeke, A., C. Rzepa, E. Depiereux, J. Deroo, J.-M. Giffroy et al., 2010 Assessing 623
efficiency of a Human Familiarisation and Training Programme on fearfulness and 624
aggressiveness of military dogs. Applied Animal Behaviour Science 123: 143-149. 625
Hsu, Y. Y. & J. A. Serpell, 2003 Development and validation of a questionnaire for 626
measuring behavior and temperament traits in pet dogs. Journal of the American 627
Veterinary Medical Association 223: 1293-1300. 628
Jiang, J.M., 1996 REML estimation: Asymptotic behavior and related topics. Annals of 629
Statistics 24: 255-286. 630
Jones, A. C. & S. D. Gosling, 2005 Temperament and personality in dogs (Canis familiaris): 631
A review and evaluation of past research. Applied Animal Behaviour Science 95: 1-53. 632
Jones, P., K. Chase, A. Martin, P. Davern, E. A. Ostrander et al., 2008 Single-nucleotide-633
polymorphism-based association mapping of dog stereotypes. Genetics 179: 1033-1044. 634

29
Kis, A., M. Bence, G. Lakatos, E. Pergel, B. Turcsan et al., 2014 Oxytocin Receptor Gene 635
Polymorphisms Are Associated with Human Directed Social Behavior in Dogs (Canis 636
familiaris). Plos One 9. 637
Koeck, A., B. Heringstad, C. Egger-Danner, C. Fuerst & B. Fuerst-Waltl, 2010 Comparison 638
of different models for genetic analysis of clinical mastitis in Austrian Fleckvieh dual-639
purpose cows. Journal of Dairy Science 93: 4351-4358. 640
Kubinyi, E., J. Vas, K. Hejjas, Z. Ronai, I. Bruder et al., 2012 Polymorphism in the Tyrosine 641
Hydroxylase (TH) Gene Is Associated with Activity-Impulsivity in German Shepherd 642
Dogs. Plos One 7. 643
Kutsumi, A., M. Nagasawa, M. Ohta & N. Ohtani, 2013 Importance of Puppy Training for 644
Future Behavior of the Dog. Journal of Veterinary Medical Science 75: 141-149. 645
Liinamo, A.-E., L. van den Berg, P. A. J. Leegwater, M. B. H. Schilder, J. A. M. van 646
Arendonk et al., 2007 Genetic variation in aggression-related traits in Golden Retriever 647
dogs. Applied Animal Behaviour Science 104: 95-106. 648
Lofgren, S. E., P. Wiener, S. C. Blott, E. Sánchez Molano, J. A. Woolliams et al., 2014 649
Management and Personality in the Labrador Retriever dogs. Applied Animal Behaviour 650
Science 156: 44-53. 651
Matos, C. A. P., D. L. Thomas, D. Gianola, M. Perez-Enciso & L. D. Young, 1997 Genetic 652
analysis of discrete reproductive traits in sheep using linear and nonlinear models .2. 653
Goodness of fit and predictive ability. Journal of Animal Science 75: 88-94. 654
Meyer, F., P. Schawalder, C. Gaillard & G. Dolf, 2012 Estimation of genetic parameters for 655
behavior based on results of German Shepherd Dogs in Switzerland. Applied Animal 656
Behaviour Science 140: 53-61. 657
Munoz, M., R. Pong-Wong, O. Canela-Xandri, K. Rawlik, C. S. Haley et al., 2016 Evaluating 658
the contribution of genetics and familial shared environment to common disease using the 659
UK Biobank. Nature Genetics 48: 980-+. 660
Olesen, I., M. Perezenciso, D. Gianola & D. L. Thomas, 1994 A comparison of normal and 661
nonnormal mixed models for number of lambs born in Norwegian sheep. Journal of 662
Animal Science 72: 1166-1173. 663
Persson, M. E., L. S. V. Roth, M. Johnsson, D. Wright & P. Jensen, 2015 Human-directed 664
social behaviour in dogs shows significant heritability. Genes Brain and Behavior 14: 337-665
344. 666

30
Persson, M. L., D. Wasserman, E. G. Jonsson, H. Bergman, L. Terenius et al., 2000 Search 667
for the influence of the tyrosine hydroxylase (TCAT)(n) repeat polymorphism on 668
personality traits. Psychiatry Research 95: 1-8. 669
Pimm, J., A. McQuillin, S. Thirumalai, J. Lawrence, D. Quested et al., 2005 The Epsin 4 670
gene on chromosome 5q, which encodes the clathrin-associated protein enthoprotin, is 671
involved in the genetic susceptibility to schizophrenia. American Journal of Human 672
Genetics 76: 902-907. 673
Purcell, S., B. Neale, K. Todd-Brown, L. Thomas, M. A. R. Ferreira et al., 2007 PLINK: A 674
tool set for whole-genome association and population-based linkage analyses. American 675
Journal of Human Genetics 81: 559-575. 676
Reim, K., M. Mansour, F. Varoqueaux, H. T. McMahon, T. C. Sudhof et al., 2001 677
Complexins regulate a late step in Ca2+-dependent neurotransmitter release. Cell 104: 71-678
81. 679
Ruefenacht, S., S. Gebhardt-Henrich, T. Miyake & C. Gaillard, 2002 A behaviour test on 680
German Shepherd dogs: heritability of seven different traits. Applied Animal Behaviour 681
Science 79: 113-132. 682
Sadakata, T., Y. Shinoda, M. Oka, Y. Sekine & T. Furuichi, 2013 Autistic-like behavioral 683
phenotypes in a mouse model with copy number variation of the CAPS2/CADPS2 gene. 684
FEBS Letters 587: 54-59. 685
Saetre, P., E. Strandberg, P. E. Sundgren, U. Pettersson, E. Jazin et al., 2006 The genetic 686
contribution to canine personality. Genes Brain and Behavior 5: 240-248. 687
Sánchez Molano, E., R. Pong-Wong, D. N. Clements, S. C. Blott, P. Wiener et al., 2015 688
Genomic prediction of traits related to canine hip dysplasia. Frontiers in Genetics 6: 97. 689
Sánchez Molano, E., J. A. Woolliams, R. Pong-Wong, D. N. Clements, S. C. Blott et al., 690
2014 Quantitative trait loci mapping for canine hip dysplasia and its related traits in UK 691
Labrador Retrievers. BMC Genomics 15: 833. 692
Schiefelbein, K. M., 2012 Estimation of genetic parameters for behavioral assessment scores 693
in Labrador Retrievers, German Shepherd Dogs and Golden Retrievers, Department of 694
Animal Sciences & Industry, College of Agriculture, Kansas State University, Manhattan, 695
Kansas. 696
Serpell, J. A. & Y. Y. Hsu, 2001 Development and validation of a novel method for 697
evaluating behavior and temperament in guide dogs. Applied Animal Behaviour Science 698
72: 347-364. 699

31
Strandberg, E., J. Jacobsson & P. Saetre, 2005 Direct genetic, maternal and litter effects on 700
behaviour in German shepherd dogs in Sweden. Livestock Production Science 93: 33-42. 701
Svartberg, K., 2005 A comparison of behaviour in test and in everyday life: evidence of three 702
consistent boldness-related personality traits in dogs. Applied Animal Behaviour Science 703
91: 103-128. 704
Tochigi, M., T. Otowa, H. Hibino, C. Kato, T. Otani et al., 2006 Combined analysis of 705
association between personality traits and three functional polymorphisms in the tyrosine 706
hydroxylase,) monoamine oxidase A, and catechol-O-methyltransferase genes. 707
Neuroscience Research 54: 180-185. 708
Våge, J., C. Wade, T. Biagi, J. Fatjo, M. Amat et al., 2010 Association of dopamine- and 709
serotonin-related genes with canine aggression. Genes Brain and Behavior 9: 372-378. 710
van den Berg, S. M., H. C. M. Heuven, L. van den Berg, D. L. Duffy & J. A. Serpell, 2010 711
Evaluation of the C-BARQ as a measure of stranger-directed aggression in three common 712
dog breeds. Applied Animal Behaviour Science 124: 136-141. 713
van der Waaij, E. H., E. Wilsson & E. Strandberg, 2008 Genetic analysis of results of a 714
Swedish behavior test on German Shepherd Dogs and Labrador Retrievers. Journal of 715
Animal Science 86: 2853-2861. 716
Vaysse, A., A. Ratnakumar, T. Derrien, E. Axelsson, G. Rosengren Pielberg et al., 2011 717
Identification of genomic regions associated with phenotypic variation between dog breeds 718
using selection mapping. Plos Genetics 7: e1002316. 719
Volkow, N. D., G.-J. Wang, S. H. Kollins, T. L. Wigal, J. H. Newcorn et al., 2009 Evaluating 720
Dopamine Reward Pathway in ADHD Clinical Implications. Jama-Journal of the 721
American Medical Association 302: 1084-1091. 722
Wan, M., K. Hejjas, Z. Ronai, Z. Elek, M. Sasvari-Szekely et al., 2013 DRD4 and TH gene 723
polymorphisms are associated with activity, impulsivity and inattention in Siberian Husky 724
dogs. Animal Genetics 44: 717-727. 725
Whiteside, S. P. & D. R. Lynam, 2001 The Five Factor Model and impulsivity: using a 726
structural model of personality to understand impulsivity. Personality and Individual 727
Differences 30: 669-689. 728
Whitlock, M. C., 2005 Combining probability from independent tests: the weighted Z-729
method is superior to Fisher's approach. Journal of Evolutionary Biology 18: 1368-1373. 730
Wiener, P. & M. J. Haskell, 2016 Use of questionnaire-based data to assess dog personality. 731
Journal of Veterinary Behavior: Clinical Applications and Research 16: 81-85. 732

32
Willis-Owen, S. A. G. & J. Flint, 2006 The genetic basis of emotional behaviour in mice. 733
European Journal of Human Genetics 14: 721-728. 734
Wilsson, E. & P. E. Sundgren, 1997 The use of a behaviour test for selection of dogs for 735
service and breeding .2. Heritability for tested parameters and effect of selection based on 736
service dog characteristics. Applied Animal Behaviour Science 54: 235-241. 737
Yang, J., A. Bakshi, Z. Zhu, G. Hemani, A. A. E. Vinkhuyzen et al., 2015 Genetic variance 738
estimation with imputed variants finds negligible missing heritability for human height and 739
body mass index. Nature Genetics 47: 1114-+. 740
Yang, J., B. Benyamin, B. P. McEvoy, S. Gordon, A. K. Henders et al., 2010 Common SNPs 741
explain a large proportion of the heritability for human height. Nature Genetics 42: 565-742
569. 743
Yang, J., S. H. Lee, M. E. Goddard & P. M. Visscher, 2011 GCTA: A Tool for Genome-wide 744
Complex Trait Analysis. American Journal of Human Genetics 88: 76-82. 745
Zaitlen, N., P. Kraft, N. Patterson, B. Pasaniuc, G. Bhatia et al., 2013 Using Extended 746
Genealogy to Estimate Components of Heritability for 23 Quantitative and Dichotomous 747
Traits. Plos Genetics 9. 748
Zapata, I., J. A. Serpell & C. E. Alvarez, 2016 Genetic mapping of canine fear and 749
aggression. Bmc Genomics 17. 750
Zhou, X. & M. Stephens, 2012 Genome-wide efficient mixed-model analysis for association 751
studies. Nature Genetics 44: 821-824. 752
753