Genetic Algorithm Using Iterative Shrinking for Solving Clustering Problems UNIVERSITY OF JOENSUU...
20
Genetic Algorithm Using Iterative Shrinking for Solving Clustering Problems UNIVERSITY OF JOENSUU DEPARTMENT OF COMPUTER SCIENCE FINLAND Pasi Fränti and Olli Virmajoki to be presented at: Data Mining 2003
-
Upload
leon-dawson -
Category
Documents
-
view
225 -
download
2
Transcript of Genetic Algorithm Using Iterative Shrinking for Solving Clustering Problems UNIVERSITY OF JOENSUU...
Genetic Algorithm Using Iterative Shrinking for Solving Clustering Problems
UNIVERSITY OF JOENSUUDEPARTMENT OF COMPUTER SCIENCEFINLAND
Pasi Fränti and Olli Virmajoki
to be presented at: Data Mining 2003
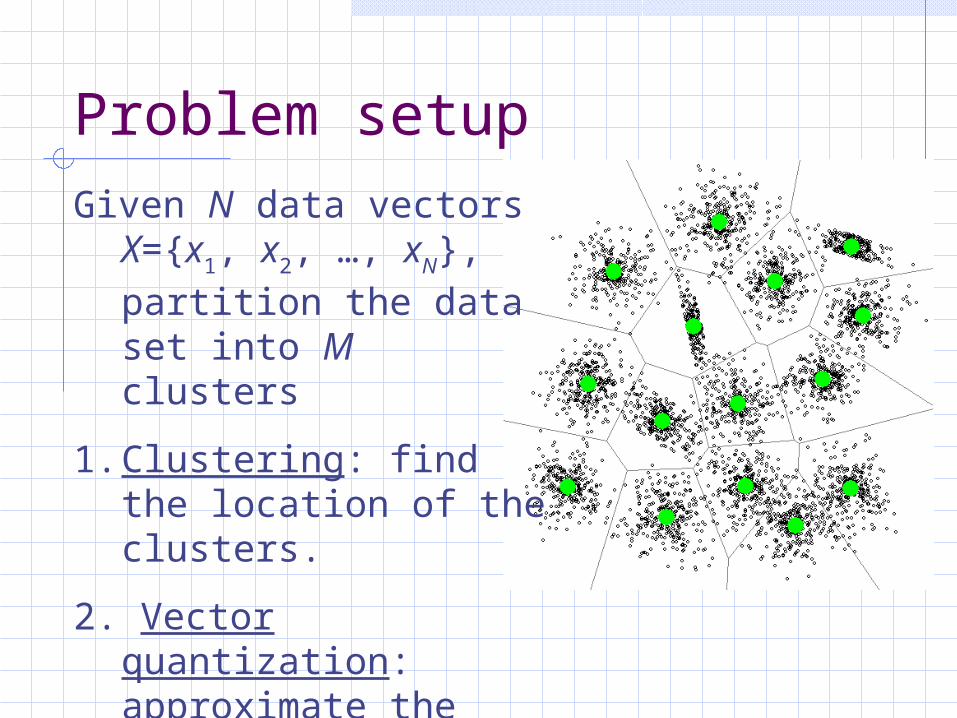
Problem setupGiven N data vectors
X={x1, x2, …, xN}, partition the data set into M clusters
1. Clustering: find the location of the clusters.
2. Vector quantization: approximate the original data by a set of code vectors.
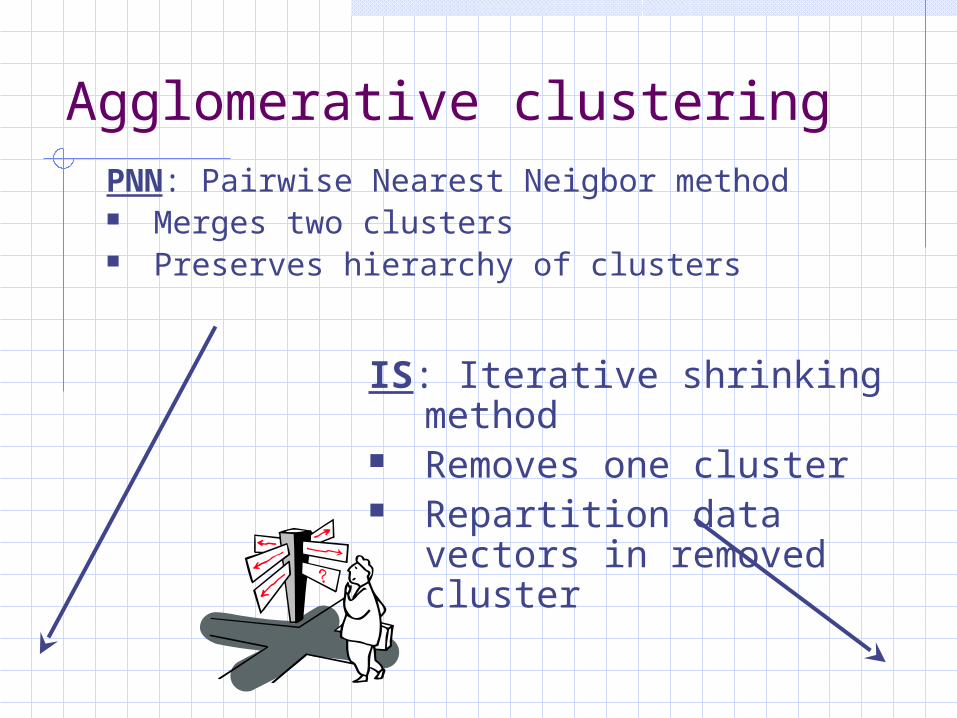
Agglomerative clusteringPNN: Pairwise Nearest Neigbor method Merges two clusters Preserves hierarchy of clusters
IS: Iterative shrinking method
Removes one cluster Repartition data vectors
in removed cluster
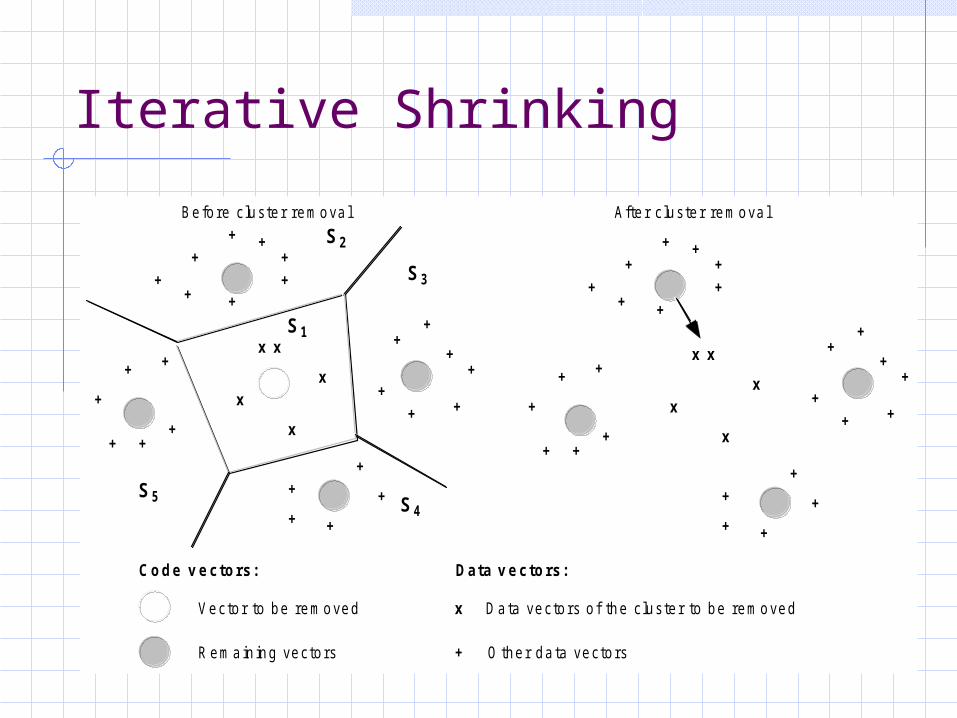
Iterative Shrinking
Code v e cto rs: Data v e cto rs:
Be fo re c luste r remova l Afte r c luste r remova l
Vecto r to be removed
R ema in ing vecto rs
D a ta vecto rs o f the c luste r to be removed
O the r da ta vecto rs
S2
S3
S4S5
S1
x
+
+ ++
++
+
++
x x
x
x
x+
+
+ ++
+
+
+ +
+
+
+
++
++ +
+
+ ++
++
++
x x
x
x
x+
+
+ ++
+
+
+ +
+
+
++
++ +
+
+
+
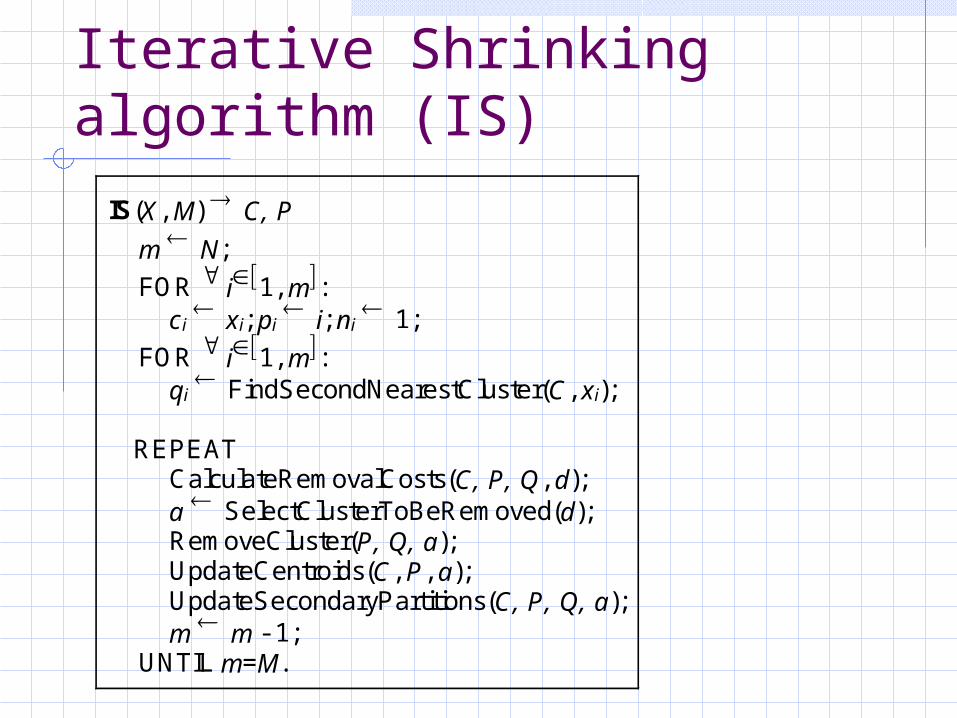
Iterative Shrinking algorithm (IS)
IS(X, M) C, P
m N;
FOR i1, m: ci xi; pi i; ni 1;
FOR i1, m: qi FindSecondNearestCluster(C, xi);
REPEAT CalculateRemovalCosts(C, P, Q, d); a SelectClusterToBeRemoved(d); RemoveCluster(P, Q, a); UpdateCentroids(C, P, a); UpdateSecondaryPartitions(C, P, Q, a); m m - 1;
UNTIL m=M.
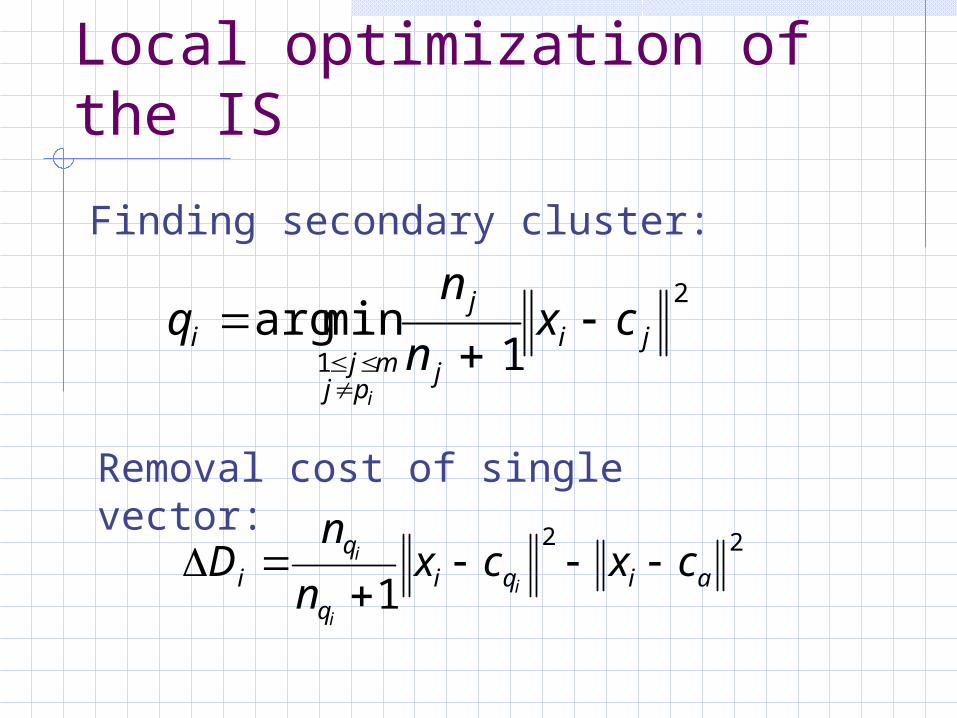
Local optimization of the IS
Finding secondary cluster:
Removal cost of single vector:
2
1 1minarg ji
j
j
pjmj
i cxn
nq
i
22
1 aiqiq
qi cxcx
n
nD
i
i
i
Generalization to the case of unknown number of clusters
Measure variance-ratio F-test for every intermediate clustering from M=1..N.Select the clustering with minimum
F-ratio as final clustering.No additional computing – except the calculation of the F-ratio.
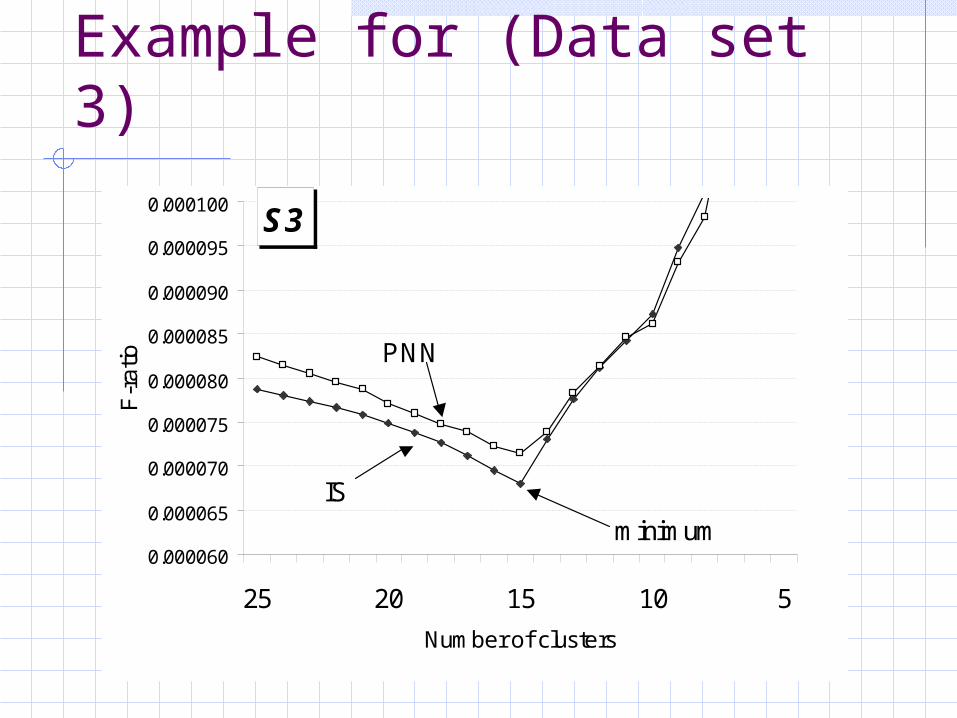
Example for (Data set 3)
S3
0.000060
0.000065
0.000070
0.000075
0.000080
0.000085
0.000090
0.000095
0.000100
25 20 15 10 5
Number of clusters
F-r
atio
minimum
IS
PNN
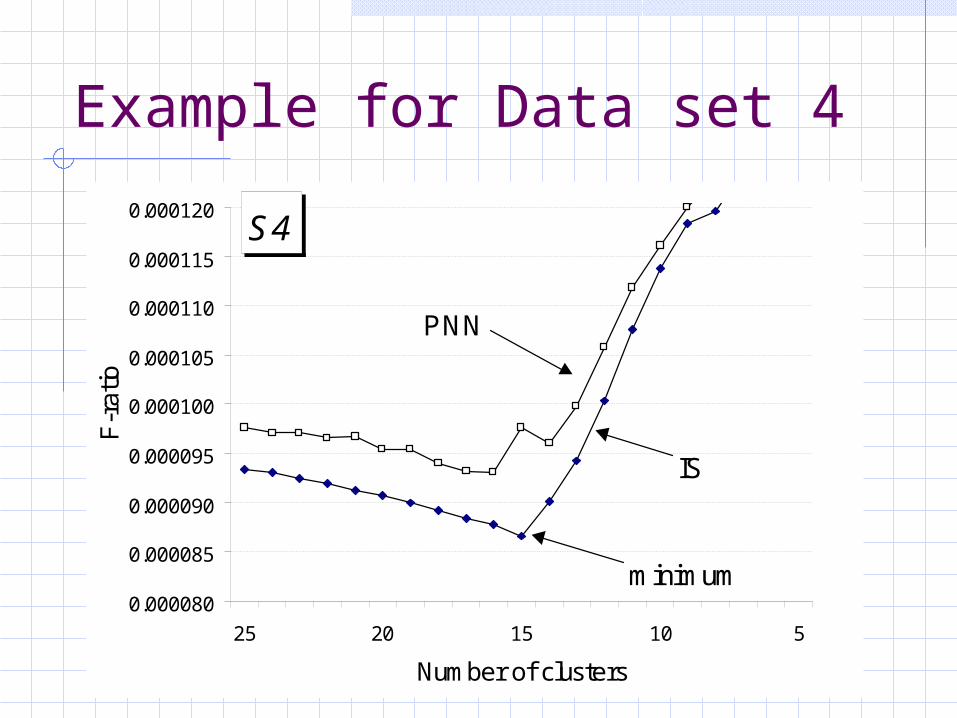
Example for Data set 4
S4
0.000080
0.000085
0.000090
0.000095
0.000100
0.000105
0.000110
0.000115
0.000120
25 20 15 10 5
Number of clusters
F-r
atio
minimum
IS
PNN
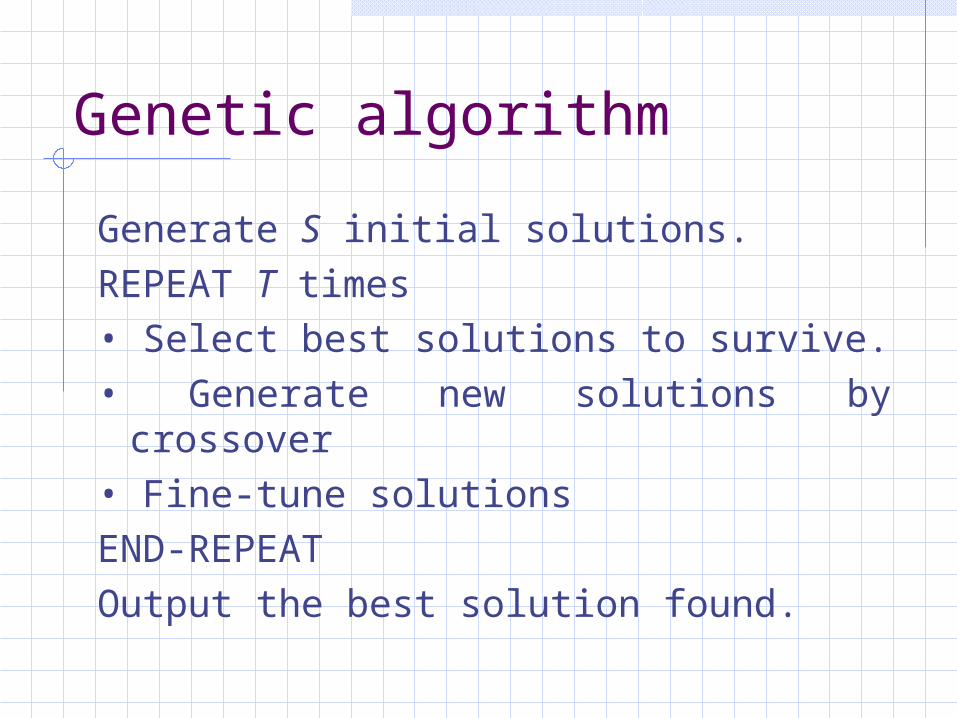
Genetic algorithm
Generate S initial solutions.REPEAT T times• Select best solutions to survive.• Generate new solutions by crossover• Fine-tune solutions END-REPEATOutput the best solution found.
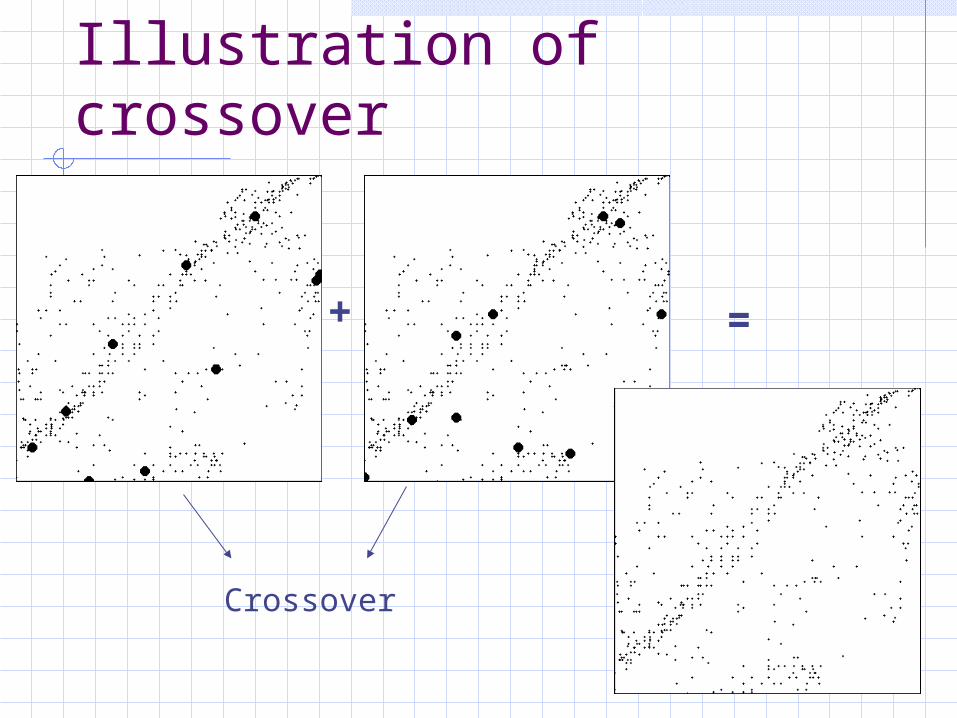
Illustration of crossover
+ =
Crossover
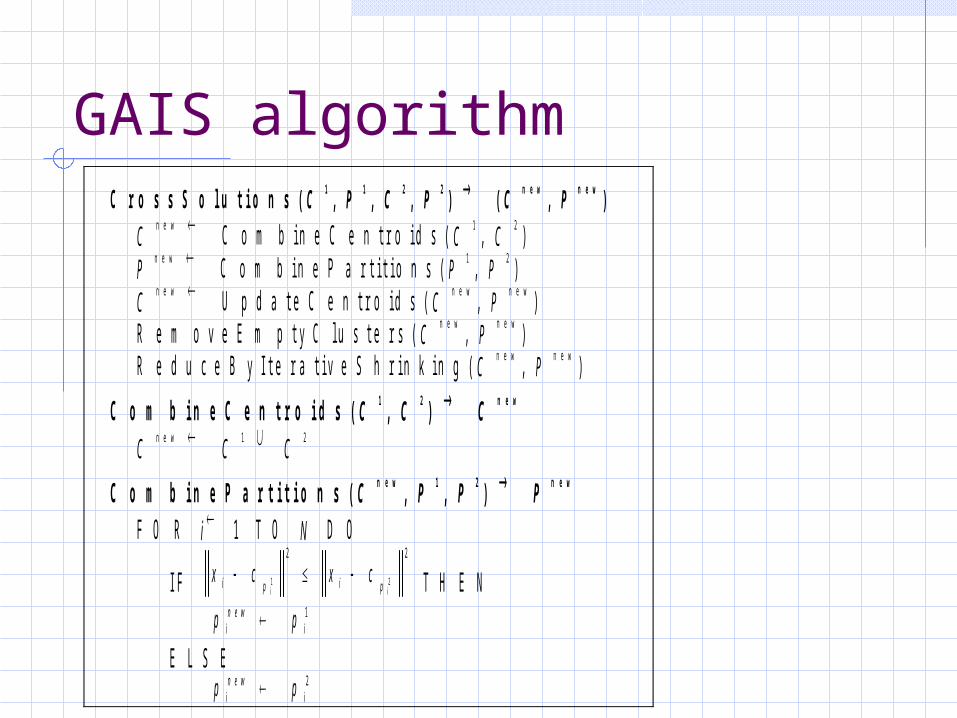
GAIS algorithmC r o s s S o l u t i o n s ( C 1 , P 1 , C 2 , P 2 ) ( C n e w , P n e w )
C n e w C o m b i n e C e n t r o i d s ( C 1 , C 2 ) P n e w C o m b i n e P a r t i t i o n s ( P 1 , P 2 ) C n e w U p d a t e C e n t r o i d s ( C n e w , P n e w ) R e m o v e E m p t y C l u s t e r s ( C n e w , P n e w ) R e d u c e B y I t e r a t i v e S h r i n k i n g ( C n e w , P n e w )
C o m b i n e C e n t r o i d s ( C 1 , C 2 ) C n e w
C n e w C 1 C 2
C o m b i n e P a r t i t i o n s ( C n e w , P 1 , P 2 ) P n e w F O R i 1 T O N D O
I F x c x ci p i pi i 1 2
2 2
T H E N
p pin e w
i 1 E L S E
p pin e w
i 2
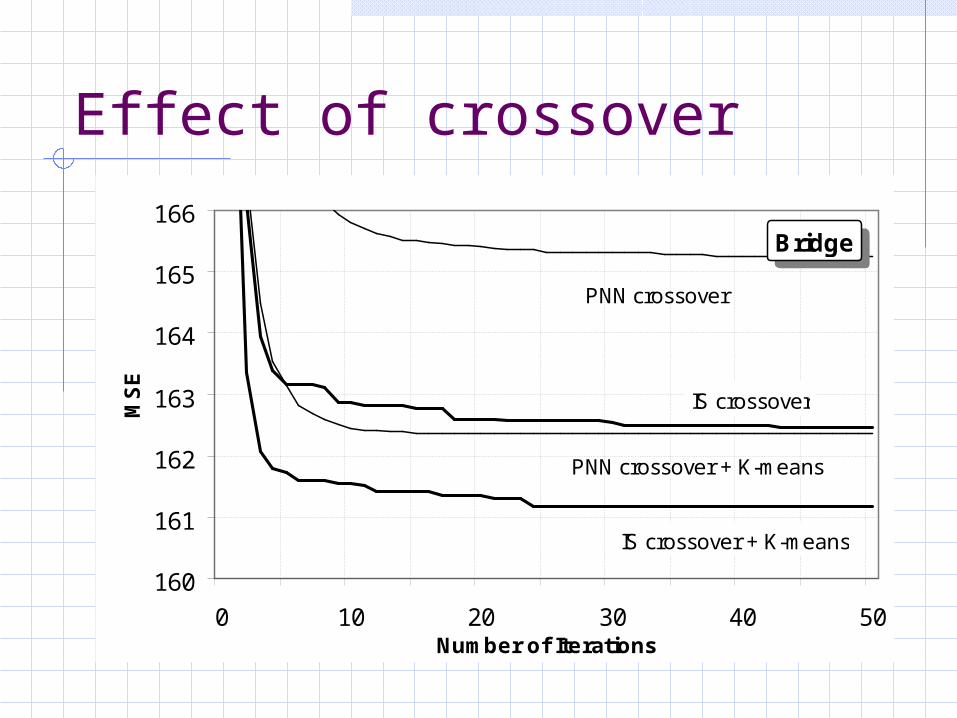
Effect of crossover
160
161
162
163
164
165
166
0 10 20 30 40 50Number of Iterations
MS
E
IS crossover + K-means
IS crossover
PNN crossover
PNN crossover + K-means
Bridge
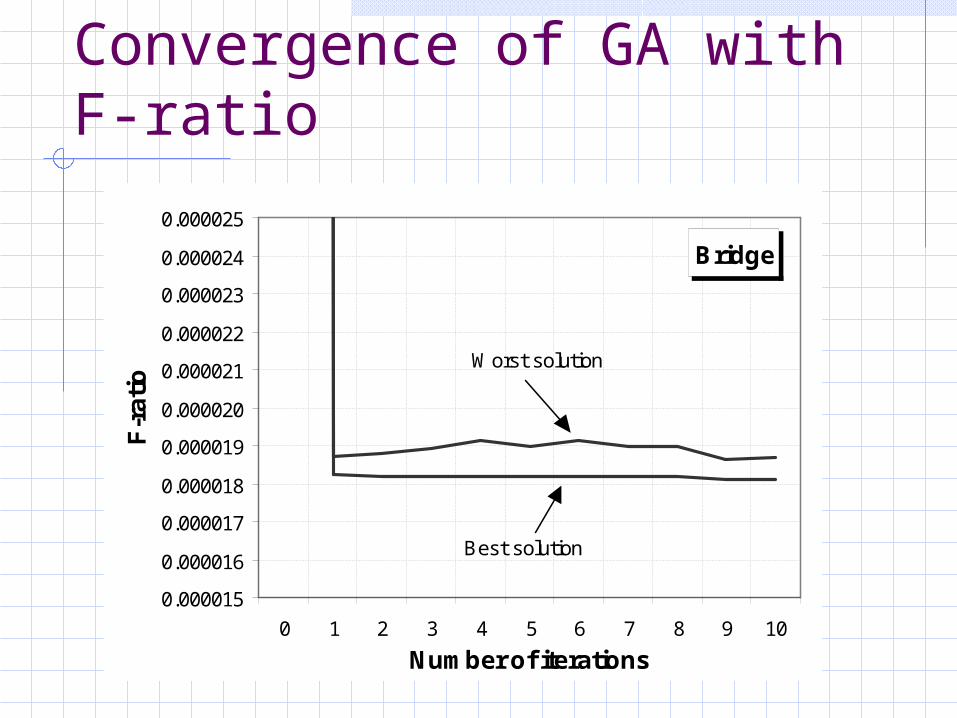
Convergence of GA with F-ratio
Bridge
0.000015
0.000016
0.000017
0.000018
0.000019
0.000020
0.000021
0.000022
0.000023
0.000024
0.000025
0 1 2 3 4 5 6 7 8 9 10
Number of iterations
F-r
ati
o
Best solution
Worst solution
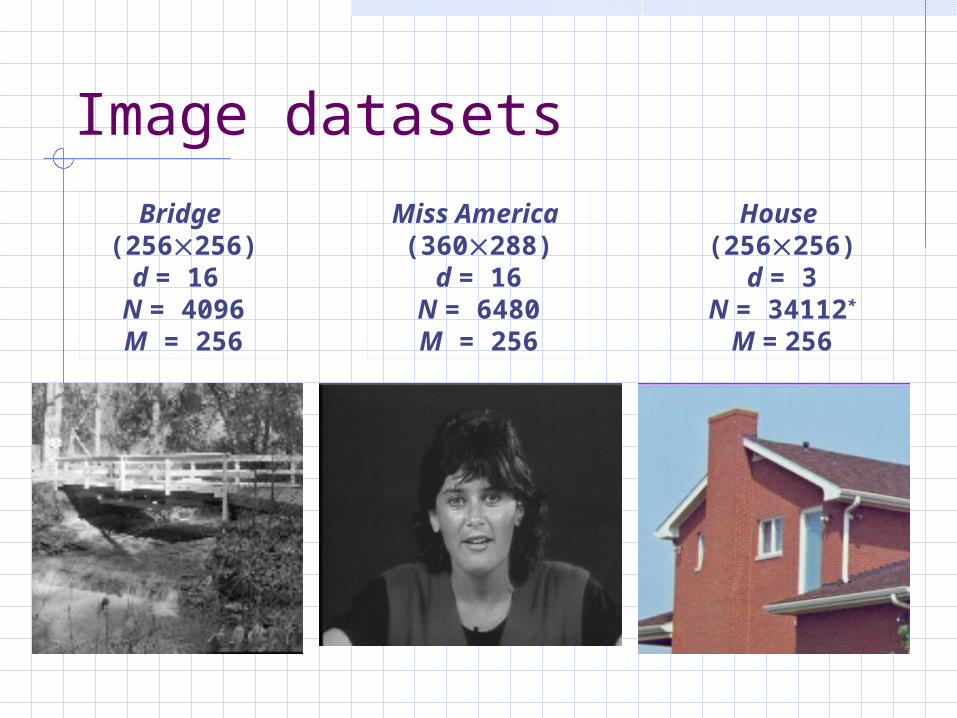
Image datasets
Bridge (256256)
d = 16 N = 4096M = 256
Miss America (360288)
d = 16N = 6480M = 256
House (256256)
d = 3N = 34112*
M = 256
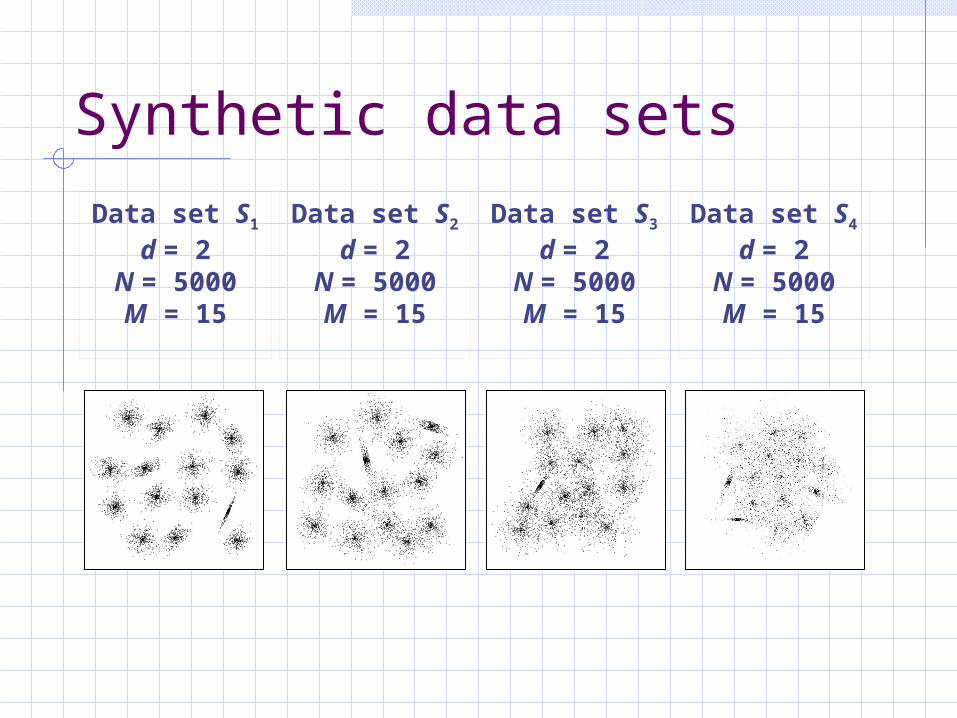
Synthetic data sets
Data set S1
d = 2N = 5000M = 15
Data set S2
d = 2N = 5000M = 15
Data set S3
d = 2N = 5000M = 15
Data set S4
d = 2N = 5000M = 15
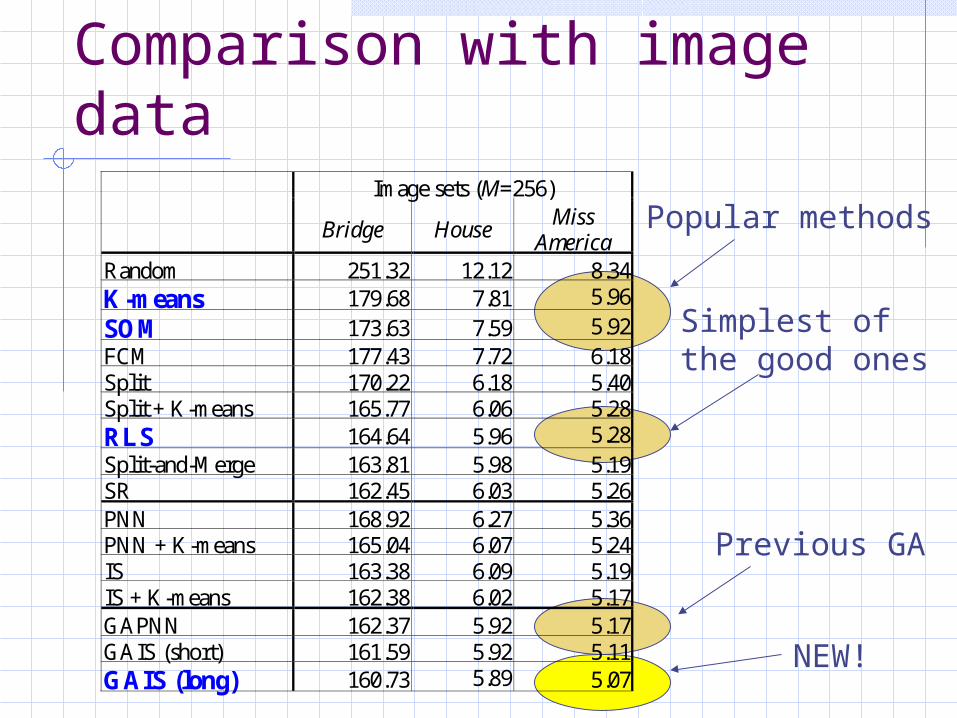
Comparison with image data
Image sets (M=256)
Bridge House Miss
America Random 251.32 12.12 8.34 K-means 179.68 7.81 5.96
SOM 173.63 7.59 5.92 FCM 177.43 7.72 6.18 Split 170.22 6.18 5.40 Split + K-means 165.77 6.06 5.28 RLS 164.64 5.96 5.28 Split-and-Merge 163.81 5.98 5.19 SR 162.45 6.03 5.26 PNN 168.92 6.27 5.36 PNN + K-means 165.04 6.07 5.24 IS 163.38 6.09 5.19 IS + K-means 162.38 6.02 5.17 GAPNN 162.37 5.92 5.17 GAIS (short) 161.59 5.92 5.11 GAIS (long) 160.73 5.89 5.07
Popular methods
Previous GA
NEW!
Simplest of the good ones
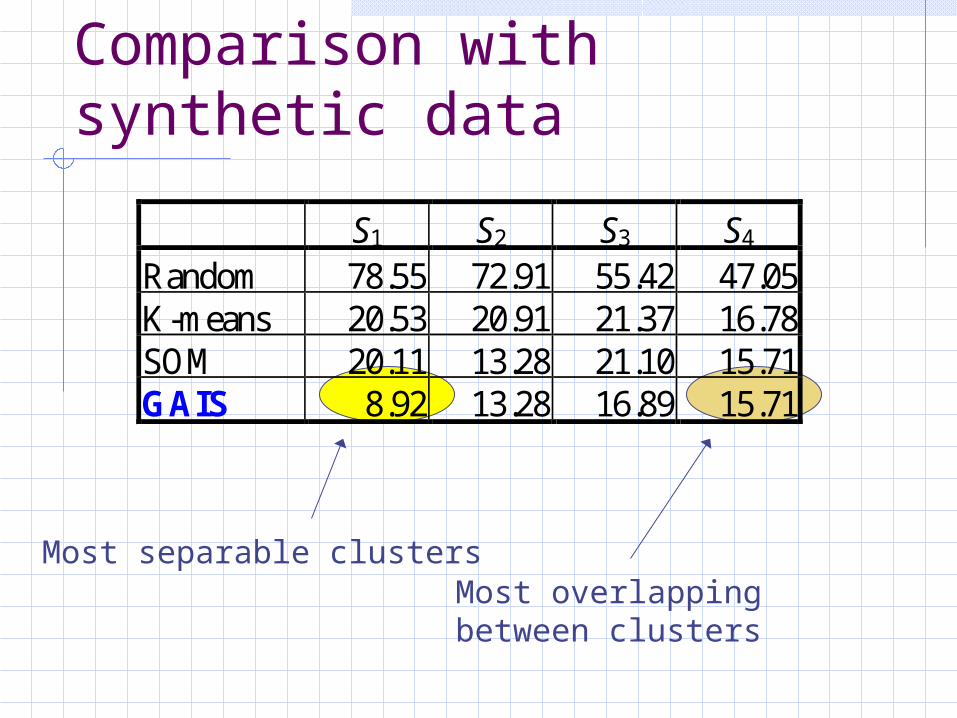
Comparison with synthetic data
Most separable clustersMost overlappingbetween clusters
S1 S2 S3 S4 Random 78.55 72.91 55.42 47.05 K-means 20.53 20.91 21.37 16.78 SOM 20.11 13.28 21.10 15.71 GAIS 8.92 13.28 16.89 15.71
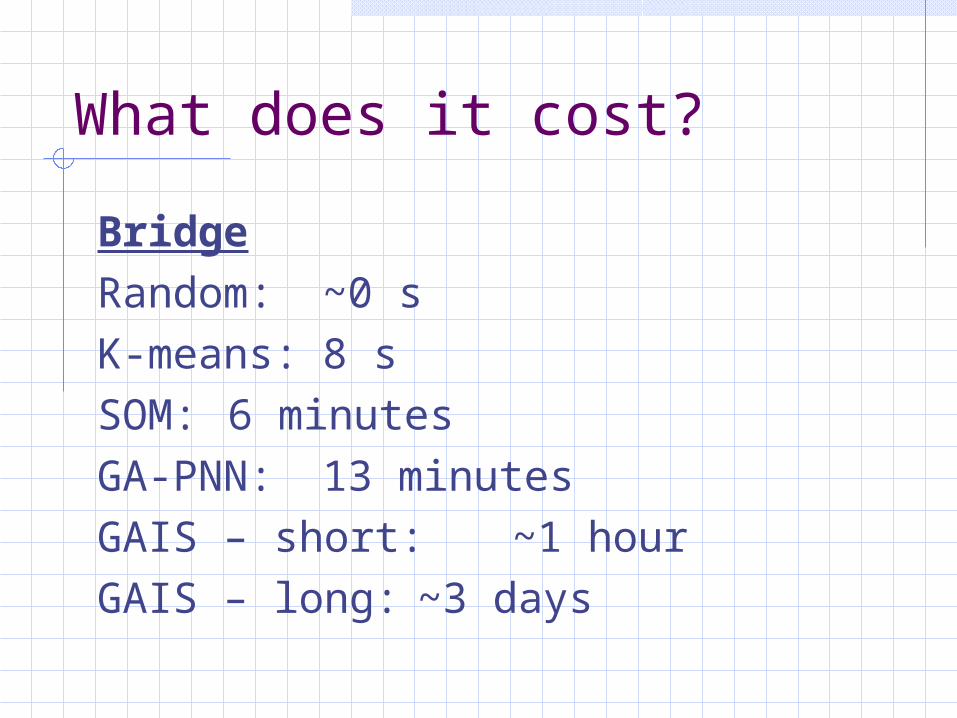
What does it cost?
BridgeRandom: ~0 sK-means: 8 sSOM: 6 minutesGA-PNN: 13 minutesGAIS – short: ~1 hourGAIS – long: ~3 days
Conclusions
Slower but better clustering algorithm. BEST known clustering algorithm in minimizing MSE
Thank you!