Generic Sector Update
16
Bourne Capital Partners, LLC Healthcare Merchant Banking & Financial Advisory 6100 Fairview, Suite 725, Charlotte, NC 28210 • 704. 552. 8407 • www.bourne-partners.com Generic Pharmaceuticals Sector Report June 2009
Transcript of Generic Sector Update
Bourne Capital Partners, LLCHealthcare Merchant Banking & Financial Advisory
6100 Fairview, Suite 725, Charlotte, NC 28210 • 704. 552. 8407 • www.bourne-partners.com
Generic PharmaceuticalsSector Report
June 2009
www.bourne-partners.com2
Generic Pharmaceuticals Market - Global
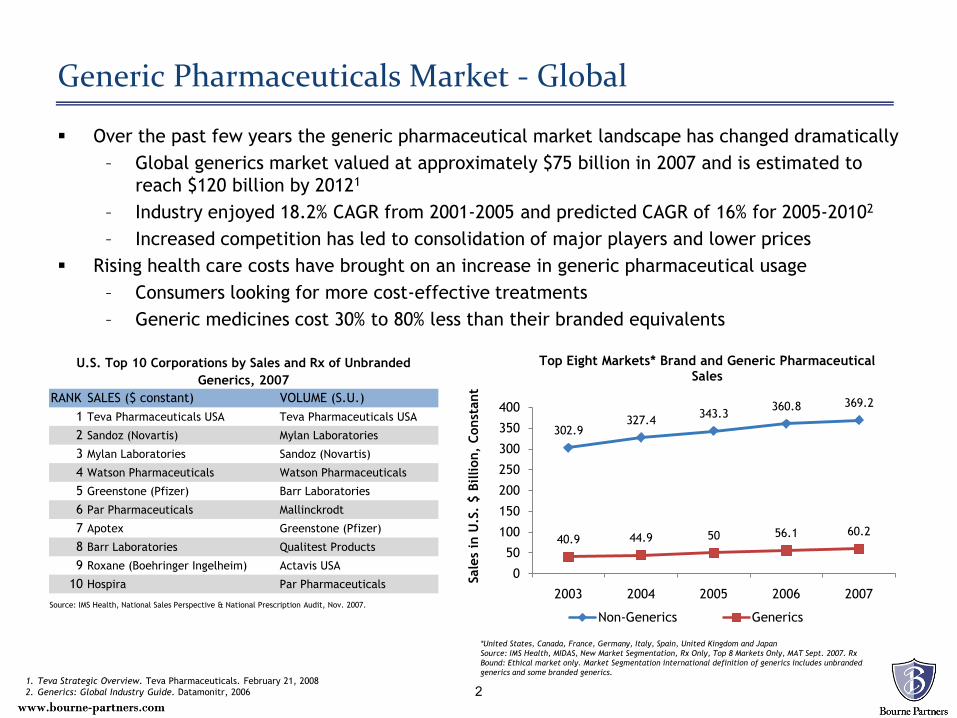
Over the past few years the generic pharmaceutical market landscape has changed dramatically– Global generics market valued at approximately $75 billion in 2007 and is estimated to
reach $120 billion by 20121
– Industry enjoyed 18.2% CAGR from 2001-2005 and predicted CAGR of 16% for 2005-20102
– Increased competition has led to consolidation of major players and lower prices Rising health care costs have brought on an increase in generic pharmaceutical usage
– Consumers looking for more cost-effective treatments– Generic medicines cost 30% to 80% less than their branded equivalents
www.bourne-partners.com
*United States, Canada, France, Germany, Italy, Spain, United Kingdom and JapanSource: IMS Health, MIDAS, New Market Segmentation, Rx Only, Top 8 Markets Only, MAT Sept. 2007. Rx Bound: Ethical market only. Market Segmentation international definition of generics includes unbranded generics and some branded generics.
302.9327.4 343.3
360.8 369.2
40.9 44.9 50 56.1 60.2
0
50
100
150
200
250
300
350
400
2003 2004 2005 2006 2007
Sale
s in
U.S
. $
Billi
on,
Cons
tant
Top Eight Markets* Brand and Generic Pharmaceutical Sales
Non-Generics Generics
1. Teva Strategic Overview. Teva Pharmaceuticals. February 21, 20082. Generics: Global Industry Guide. Datamonitr, 2006
RANK SALES ($ constant) VOLUME (S.U.)1 Teva Pharmaceuticals USA Teva Pharmaceuticals USA
2 Sandoz (Novartis) Mylan Laboratories
3 Mylan Laboratories Sandoz (Novartis)
4 Watson Pharmaceuticals Watson Pharmaceuticals
5 Greenstone (Pfizer) Barr Laboratories
6 Par Pharmaceuticals Mallinckrodt
7 Apotex Greenstone (Pfizer)
8 Barr Laboratories Qualitest Products
9 Roxane (Boehringer Ingelheim) Actavis USA
10 Hospira Par Pharmaceuticals
U.S. Top 10 Corporations by Sales and Rx of Unbranded Generics, 2007
Source: IMS Health, National Sales Perspective & National Prescription Audit, Nov. 2007.
www.bourne-partners.com
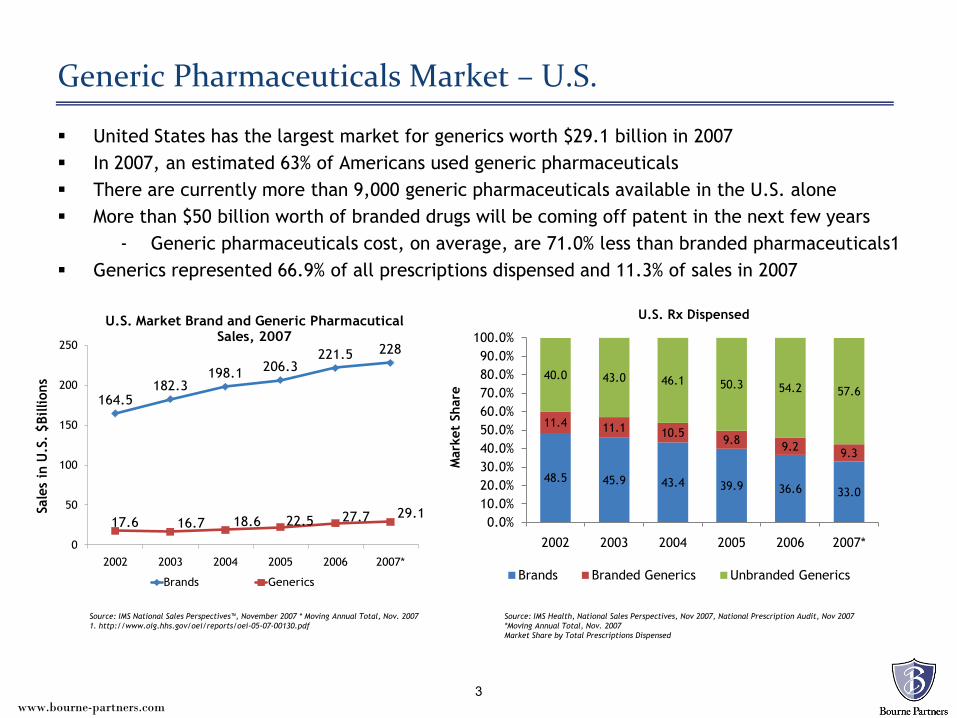
United States has the largest market for generics worth $29.1 billion in 2007 In 2007, an estimated 63% of Americans used generic pharmaceuticals There are currently more than 9,000 generic pharmaceuticals available in the U.S. alone More than $50 billion worth of branded drugs will be coming off patent in the next few years
- Generic pharmaceuticals cost, on average, are 71.0% less than branded pharmaceuticals1 Generics represented 66.9% of all prescriptions dispensed and 11.3% of sales in 2007
164.5182.3
198.1 206.3221.5 228
17.6 16.7 18.6 22.5 27.7 29.1
0
50
100
150
200
250
2002 2003 2004 2005 2006 2007*
Sale
s in
U.S
. $B
illio
ns
U.S. Market Brand and Generic Pharmacutical Sales, 2007
Brands Generics
3
Generic Pharmaceuticals Market – U.S.
Source: IMS National Sales Perspectives™, November 2007 * Moving Annual Total, Nov. 2007 1. http://www.oig.hhs.gov/oei/reports/oei-05-07-00130.pdf
48.5 45.9 43.4 39.9 36.6 33.0
11.4 11.1 10.5 9.8 9.2 9.3
40.0 43.0 46.1 50.3 54.2 57.6
0.0%10.0%20.0%30.0%40.0%50.0%60.0%70.0%80.0%90.0%
100.0%
2002 2003 2004 2005 2006 2007*
Mar
ket
Shar
e
U.S. Rx Dispensed
Brands Branded Generics Unbranded Generics
Source: IMS Health, National Sales Perspectives, Nov 2007, National Prescription Audit, Nov 2007*Moving Annual Total, Nov. 2007Market Share by Total Prescriptions Dispensed
www.bourne-partners.com
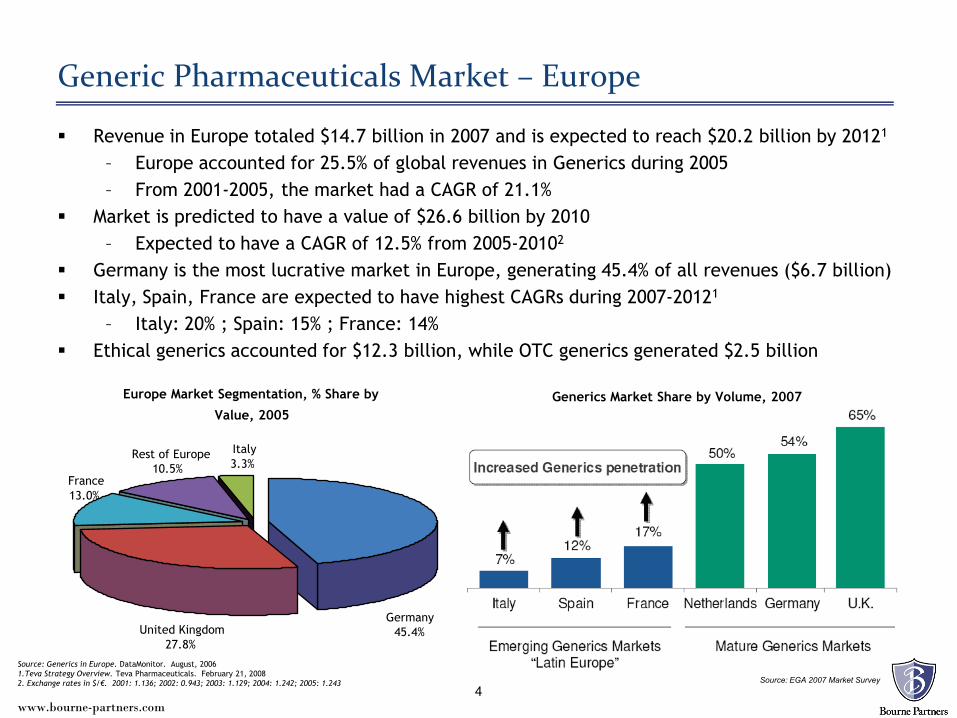
Revenue in Europe totaled $14.7 billion in 2007 and is expected to reach $20.2 billion by 20121
– Europe accounted for 25.5% of global revenues in Generics during 2005 – From 2001-2005, the market had a CAGR of 21.1%
Market is predicted to have a value of $26.6 billion by 2010– Expected to have a CAGR of 12.5% from 2005-20102
Germany is the most lucrative market in Europe, generating 45.4% of all revenues ($6.7 billion) Italy, Spain, France are expected to have highest CAGRs during 2007-20121
– Italy: 20% ; Spain: 15% ; France: 14% Ethical generics accounted for $12.3 billion, while OTC generics generated $2.5 billion
4
Generic Pharmaceuticals Market – Europe
Source: Generics in Europe. DataMonitor. August, 20061.Teva Strategy Overview. Teva Pharmaceuticals. February 21, 20082. Exchange rates in $/€. 2001: 1.136; 2002: 0.943; 2003: 1.129; 2004: 1.242; 2005: 1.243
Europe Market Segmentation, % Share by
Value, 2005
Germany45.4%
Italy 3.3%
Rest of Europe 10.5%
France 13.0%
United Kingdom 27.8%
Source: EGA 2007 Market Survey
Generics Market Share by Volume, 2007
www.bourne-partners.com5
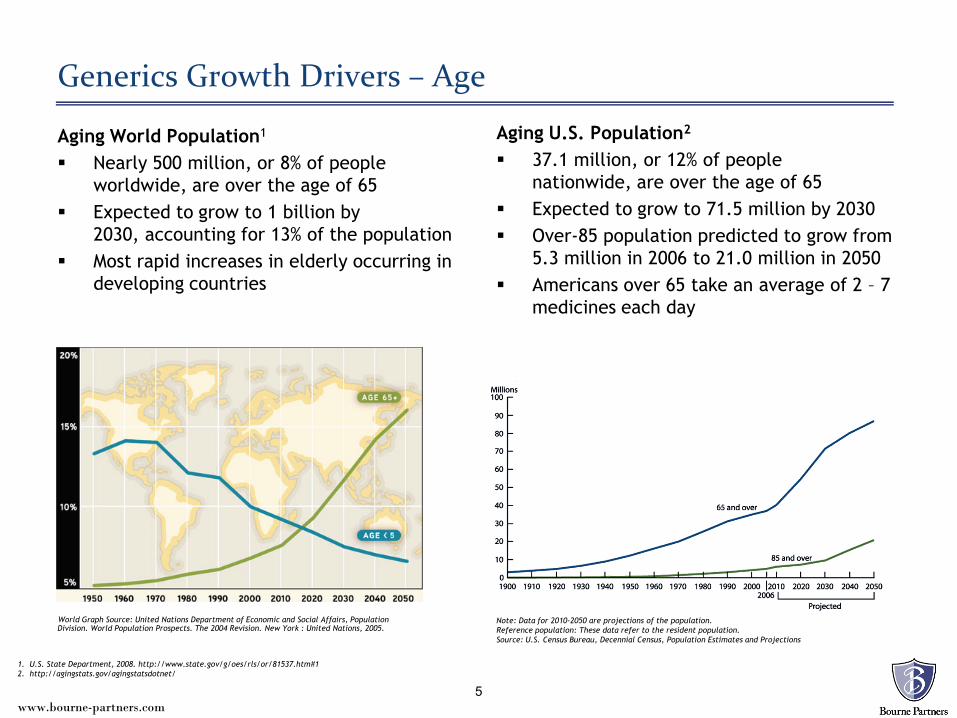
Aging U.S. Population2
37.1 million, or 12% of people nationwide, are over the age of 65
Expected to grow to 71.5 million by 2030 Over-85 population predicted to grow from
5.3 million in 2006 to 21.0 million in 2050 Americans over 65 take an average of 2 – 7
medicines each day
Generics Growth Drivers – Age
Aging World Population1
Nearly 500 million, or 8% of people worldwide, are over the age of 65
Expected to grow to 1 billion by 2030, accounting for 13% of the population
Most rapid increases in elderly occurring in developing countries
World Graph Source: United Nations Department of Economic and Social Affairs, Population Division. World Population Prospects. The 2004 Revision. New York : United Nations, 2005.
1. U.S. State Department, 2008. http://www.state.gov/g/oes/rls/or/81537.htm#12. http://agingstats.gov/agingstatsdotnet/
Note: Data for 2010-2050 are projections of the population.Reference population: These data refer to the resident population.Source: U.S. Census Bureau, Decennial Census, Population Estimates and Projections
www.bourne-partners.com
Medicare Part D Generic Rx Claims %
52.0%
54.0%
56.0%
58.0%
60.0%
62.0%
Jan-
06
Feb-
06
Mar
-06
Apr-
06
May
-06
Jun-
06
Jul-
06
Aug-
06
Sep-
06
Oct
-06
Nov
-06
Dec
-06
Jan-
07
Feb-
07
Mar
-07
Apr-
07
May
-07
Jun-
07
Jul-
07
Aug-
07
Sep-
07
Oct
-07
Nov
-07
Dec
-07
% o
f C
laim
s
6
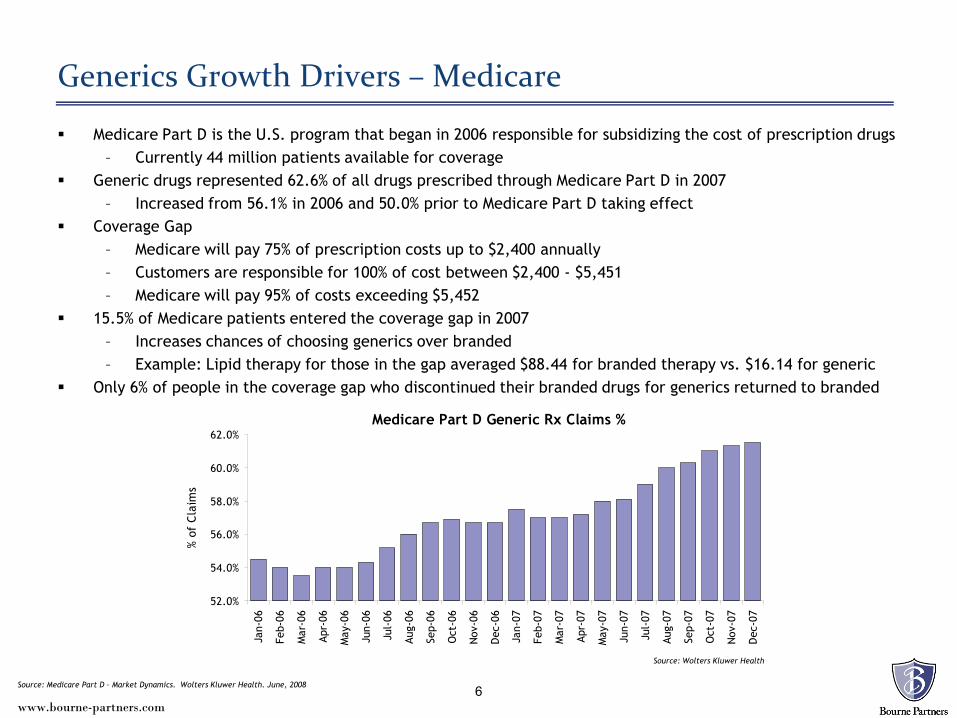
Generics Growth Drivers – Medicare
Medicare Part D is the U.S. program that began in 2006 responsible for subsidizing the cost of prescription drugs– Currently 44 million patients available for coverage
Generic drugs represented 62.6% of all drugs prescribed through Medicare Part D in 2007– Increased from 56.1% in 2006 and 50.0% prior to Medicare Part D taking effect
Coverage Gap– Medicare will pay 75% of prescription costs up to $2,400 annually– Customers are responsible for 100% of cost between $2,400 - $5,451– Medicare will pay 95% of costs exceeding $5,452
15.5% of Medicare patients entered the coverage gap in 2007– Increases chances of choosing generics over branded – Example: Lipid therapy for those in the gap averaged $88.44 for branded therapy vs. $16.14 for generic
Only 6% of people in the coverage gap who discontinued their branded drugs for generics returned to branded
Source: Wolters Kluwer Health
Source: Medicare Part D – Market Dynamics. Wolters Kluwer Health. June, 2008
www.bourne-partners.com7
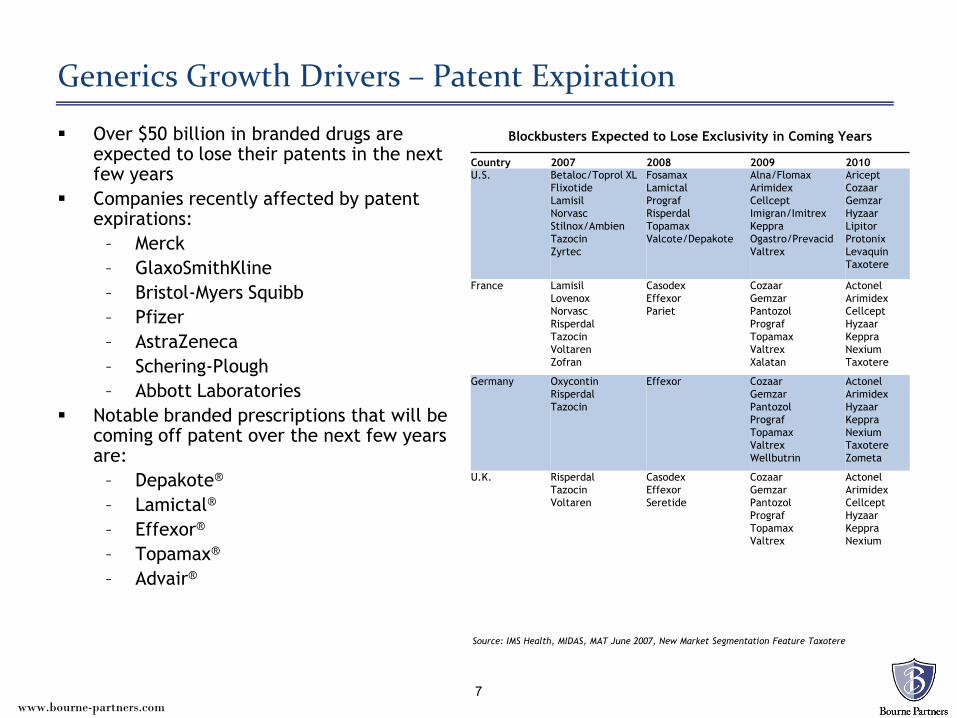
Generics Growth Drivers – Patent Expiration
Over $50 billion in branded drugs are expected to lose their patents in the next few years
Companies recently affected by patent expirations:
– Merck– GlaxoSmithKline– Bristol-Myers Squibb– Pfizer– AstraZeneca– Schering-Plough– Abbott Laboratories
Notable branded prescriptions that will be coming off patent over the next few years are:
– Depakote®
– Lamictal®
– Effexor®
– Topamax®
– Advair®
Blockbusters Expected to Lose Exclusivity in Coming Years
Country 2007 2008 2009 2010U.S. Betaloc/Toprol XL
FlixotideLamisilNorvascStilnox/AmbienTazocinZyrtec
FosamaxLamictalPrografRisperdalTopamaxValcote/Depakote
Alna/FlomaxArimidexCellceptImigran/ImitrexKeppraOgastro/PrevacidValtrex
AriceptCozaarGemzarHyzaarLipitorProtonixLevaquinTaxotere
France LamisilLovenoxNorvascRisperdalTazocinVoltarenZofran
CasodexEffexorPariet
CozaarGemzarPantozolPrografTopamaxValtrexXalatan
ActonelArimidexCellceptHyzaarKeppraNexiumTaxotere
Germany OxycontinRisperdalTazocin
Effexor CozaarGemzarPantozolPrografTopamaxValtrexWellbutrin
ActonelArimidexHyzaarKeppraNexiumTaxotereZometa
U.K. RisperdalTazocinVoltaren
CasodexEffexorSeretide
CozaarGemzarPantozolPrografTopamaxValtrex
ActonelArimidexCellceptHyzaarKeppraNexium
Source: IMS Health, MIDAS, MAT June 2007, New Market Segmentation Feature Taxotere
www.bourne-partners.com8
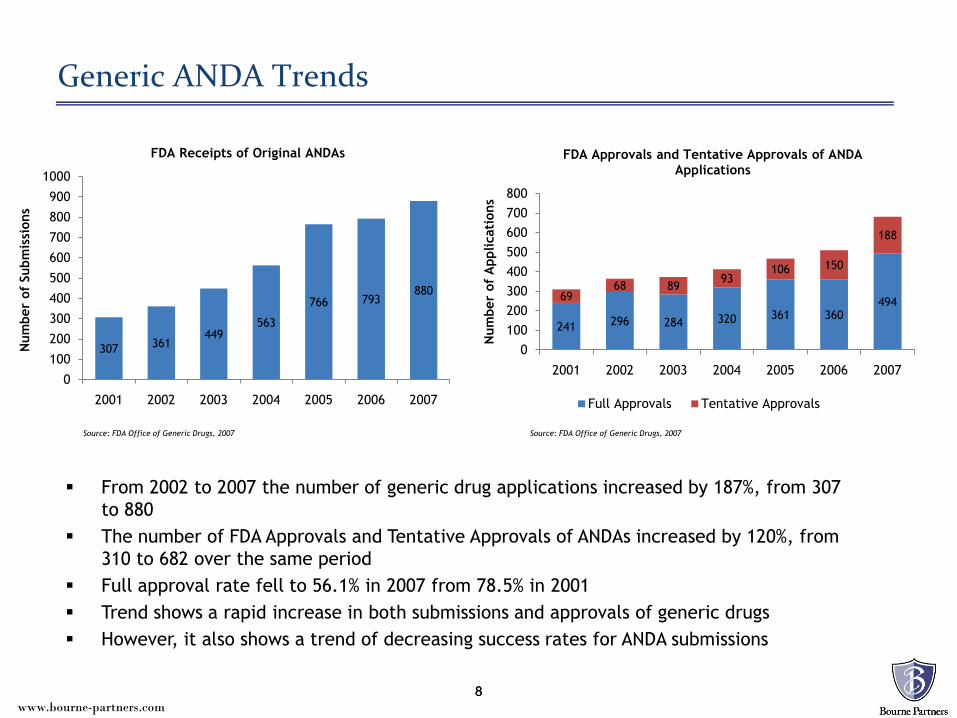
Generic ANDA Trends
8
307 361449
563
766 793880
0
100
200
300
400
500
600
700
800
900
1000
2001 2002 2003 2004 2005 2006 2007
Num
ber
of S
ubm
issi
ons
FDA Receipts of Original ANDAs
241 296 284 320 361 36049469
68 8993
106 150
188
0100200300400500600700800
2001 2002 2003 2004 2005 2006 2007
Num
ber
of A
pplic
atio
ns
FDA Approvals and Tentative Approvals of ANDAApplications
Full Approvals Tentative Approvals
Source: FDA Office of Generic Drugs, 2007 Source: FDA Office of Generic Drugs, 2007
From 2002 to 2007 the number of generic drug applications increased by 187%, from 307 to 880
The number of FDA Approvals and Tentative Approvals of ANDAs increased by 120%, from 310 to 682 over the same period
Full approval rate fell to 56.1% in 2007 from 78.5% in 2001 Trend shows a rapid increase in both submissions and approvals of generic drugs However, it also shows a trend of decreasing success rates for ANDA submissions
www.bourne-partners.com9
Transaction Highlight
Watson Pharmaceuticals to acquire Arrow Pharmaceuticals – June 16, 2009– Enterprise vale of $1.7 billion, or 2.7x revenue
• Total consideration included a cash payment of $1.05 billion
– Arrow shareholders will receive additional contingent payments based on sales of the authorized generic version of Lipitor
• Market launch is anticipated in November 2011
– Transaction grants Watson access to a promising drug candidates and new markets– Combined company is expected to generate $3 billion in annual revenue
Trends Most acquisitions have been positioned towards achieving vertical integration and regional
expansion Recent high value bids from major generic pharmaceutical companies may open the door for
their competitors to do the same Many pharmaceutical companies are looking to lessen the negative impact of losing a
blockbuster patent in the coming years
9
www.bourne-partners.com1010
www.bourne-partners.com
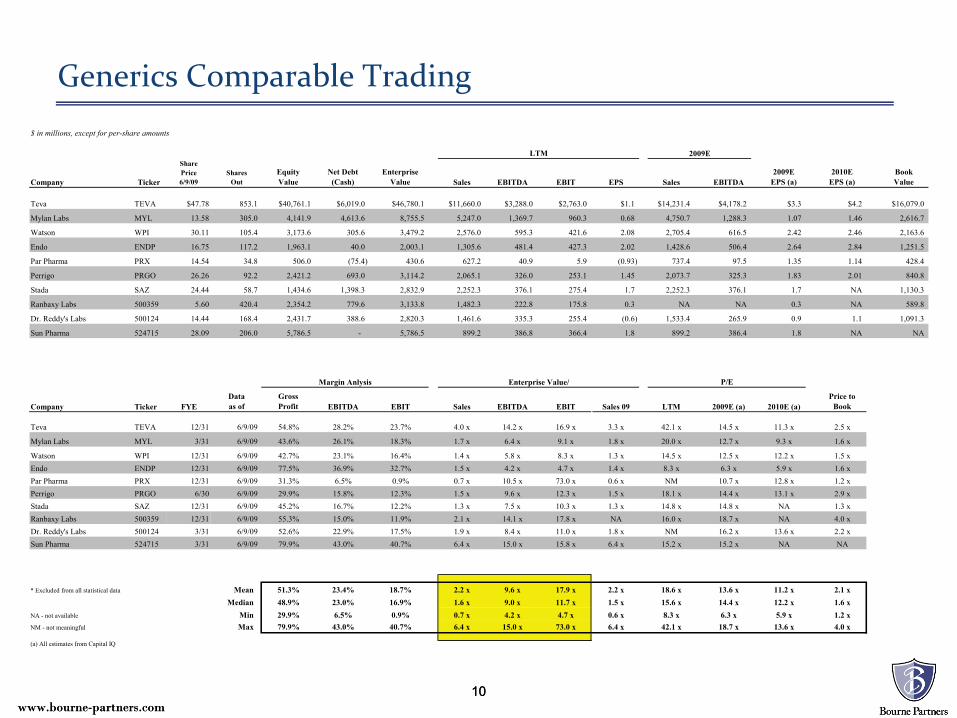
Generics Comparable Trading$ in millions, except for per-share amounts
Company Ticker
SharePrice6/9/09
SharesOut
Equity Value
Net Debt(Cash)
Enterprise Value Sales EBITDA EBIT EPS Sales EBITDA
2009EEPS (a)
2010EEPS (a)
BookValue
Teva TEVA $47.78 853.1 $40,761.1 $6,019.0 $46,780.1 $11,660.0 $3,288.0 $2,763.0 $1.1 $14,231.4 $4,178.2 $3.3 $4.2 $16,079.0
Mylan Labs MYL 13.58 305.0 4,141.9 4,613.6 8,755.5 5,247.0 1,369.7 960.3 0.68 4,750.7 1,288.3 1.07 1.46 2,616.7
Watson WPI 30.11 105.4 3,173.6 305.6 3,479.2 2,576.0 595.3 421.6 2.08 2,705.4 616.5 2.42 2.46 2,163.6
Endo ENDP 16.75 117.2 1,963.1 40.0 2,003.1 1,305.6 481.4 427.3 2.02 1,428.6 506.4 2.64 2.84 1,251.5
Par Pharma PRX 14.54 34.8 506.0 (75.4) 430.6 627.2 40.9 5.9 (0.93) 737.4 97.5 1.35 1.14 428.4
Perrigo PRGO 26.26 92.2 2,421.2 693.0 3,114.2 2,065.1 326.0 253.1 1.45 2,073.7 325.3 1.83 2.01 840.8
Stada SAZ 24.44 58.7 1,434.6 1,398.3 2,832.9 2,252.3 376.1 275.4 1.7 2,252.3 376.1 1.7 NA 1,130.3
Ranbaxy Labs 500359 5.60 420.4 2,354.2 779.6 3,133.8 1,482.3 222.8 175.8 0.3 NA NA 0.3 NA 589.8
Dr. Reddy's Labs 500124 14.44 168.4 2,431.7 388.6 2,820.3 1,461.6 335.3 255.4 (0.6) 1,533.4 265.9 0.9 1.1 1,091.3
Sun Pharma 524715 28.09 206.0 5,786.5 - 5,786.5 899.2 386.8 366.4 1.8 899.2 386.4 1.8 NA NA
Company Ticker FYEDataas of
GrossProfit EBITDA EBIT Sales EBITDA EBIT Sales 09 LTM 2009E (a) 2010E (a)
Price toBook
Teva TEVA 12/31 6/9/09 54.8% 28.2% 23.7% 4.0 x 14.2 x 16.9 x 3.3 x 42.1 x 14.5 x 11.3 x 2.5 x
Mylan Labs MYL 3/31 6/9/09 43.6% 26.1% 18.3% 1.7 x 6.4 x 9.1 x 1.8 x 20.0 x 12.7 x 9.3 x 1.6 x
Watson WPI 12/31 6/9/09 42.7% 23.1% 16.4% 1.4 x 5.8 x 8.3 x 1.3 x 14.5 x 12.5 x 12.2 x 1.5 xEndo ENDP 12/31 6/9/09 77.5% 36.9% 32.7% 1.5 x 4.2 x 4.7 x 1.4 x 8.3 x 6.3 x 5.9 x 1.6 xPar Pharma PRX 12/31 6/9/09 31.3% 6.5% 0.9% 0.7 x 10.5 x 73.0 x 0.6 x NM 10.7 x 12.8 x 1.2 xPerrigo PRGO 6/30 6/9/09 29.9% 15.8% 12.3% 1.5 x 9.6 x 12.3 x 1.5 x 18.1 x 14.4 x 13.1 x 2.9 xStada SAZ 12/31 6/9/09 45.2% 16.7% 12.2% 1.3 x 7.5 x 10.3 x 1.3 x 14.8 x 14.8 x NA 1.3 xRanbaxy Labs 500359 12/31 6/9/09 55.3% 15.0% 11.9% 2.1 x 14.1 x 17.8 x NA 16.0 x 18.7 x NA 4.0 xDr. Reddy's Labs 500124 3/31 6/9/09 52.6% 22.9% 17.5% 1.9 x 8.4 x 11.0 x 1.8 x NM 16.2 x 13.6 x 2.2 xSun Pharma 524715 3/31 6/9/09 79.9% 43.0% 40.7% 6.4 x 15.0 x 15.8 x 6.4 x 15.2 x 15.2 x NA NA
* Excluded from all statistical data Mean 51.3% 23.4% 18.7% 2.2 x 9.6 x 17.9 x 2.2 x 18.6 x 13.6 x 11.2 x 2.1 xMedian 48.9% 23.0% 16.9% 1.6 x 9.0 x 11.7 x 1.5 x 15.6 x 14.4 x 12.2 x 1.6 x
NA - not available Min 29.9% 6.5% 0.9% 0.7 x 4.2 x 4.7 x 0.6 x 8.3 x 6.3 x 5.9 x 1.2 xNM - not meaningful Max 79.9% 43.0% 40.7% 6.4 x 15.0 x 73.0 x 6.4 x 42.1 x 18.7 x 13.6 x 4.0 x
(a) All estimates from Capital IQ
LTM 2009E
Margin Anlysis Enterprise Value/ P/E
www.bourne-partners.com11
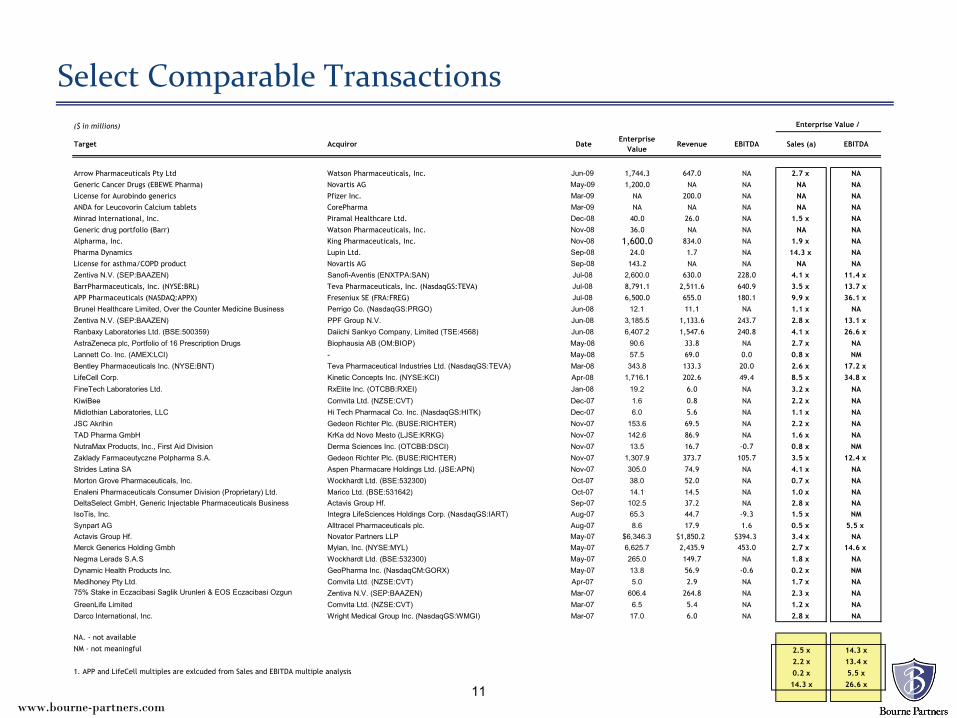
Select Comparable Transactions($ in millions) Enterprise Value /
Target Acquiror DateEnterprise
ValueRevenue EBITDA Sales (a) EBITDA
Arrow Pharmaceuticals Pty Ltd Watson Pharmaceuticals, Inc. Jun-09 1,744.3 647.0 NA 2.7 x NAGeneric Cancer Drugs (EBEWE Pharma) Novartis AG May-09 1,200.0 NA NA NA NALicense for Aurobindo generics Pfizer Inc. Mar-09 NA 200.0 NA NA NAANDA for Leucovorin Calcium tablets CorePharma Mar-09 NA NA NA NA NAMinrad International, Inc. Piramal Healthcare Ltd. Dec-08 40.0 26.0 NA 1.5 x NAGeneric drug portfolio (Barr) Watson Pharmaceuticals, Inc. Nov-08 36.0 NA NA NA NAAlpharma, Inc. King Pharmaceuticals, Inc. Nov-08 1,600.0 834.0 NA 1.9 x NAPharma Dynamics Lupin Ltd. Sep-08 24.0 1.7 NA 14.3 x NALicense for asthma/COPD product Novartis AG Sep-08 143.2 NA NA NA NAZentiva N.V. (SEP:BAAZEN) Sanofi-Aventis (ENXTPA:SAN) Jul-08 2,600.0 630.0 228.0 4.1 x 11.4 x BarrPharmaceuticals, Inc. (NYSE:BRL) Teva Pharmaceuticals, Inc. (NasdaqGS:TEVA) Jul-08 8,791.1 2,511.6 640.9 3.5 x 13.7 x APP Pharmaceuticals (NASDAQ:APPX) Freseniux SE (FRA:FREG) Jul-08 6,500.0 655.0 180.1 9.9 x 36.1 x Brunel Healthcare Limited, Over the Counter Medicine Business Perrigo Co. (NasdaqGS:PRGO) Jun-08 12.1 11.1 NA 1.1 x NAZentiva N.V. (SEP:BAAZEN) PPF Group N.V. Jun-08 3,185.5 1,133.6 243.7 2.8 x 13.1 x Ranbaxy Laboratories Ltd. (BSE:500359) Daiichi Sankyo Company, Limited (TSE:4568) Jun-08 6,407.2 1,547.6 240.8 4.1 x 26.6 x AstraZeneca plc, Portfolio of 16 Prescription Drugs Biophausia AB (OM:BIOP) May-08 90.6 33.8 NA 2.7 x NALannett Co. Inc. (AMEX:LCI) - May-08 57.5 69.0 0.0 0.8 x NMBentley Pharmaceuticals Inc. (NYSE:BNT) Teva Pharmaceutical Industries Ltd. (NasdaqGS:TEVA) Mar-08 343.8 133.3 20.0 2.6 x 17.2 x LifeCell Corp. Kinetic Concepts Inc. (NYSE:KCI) Apr-08 1,716.1 202.6 49.4 8.5 x 34.8 x
FineTech Laboratories Ltd. RxElite Inc. (OTCBB:RXEI) Jan-08 19.2 6.0 NA 3.2 x NA
KiwiBee Comvita Ltd. (NZSE:CVT) Dec-07 1.6 0.8 NA 2.2 x NAMidlothian Laboratories, LLC Hi Tech Pharmacal Co. Inc. (NasdaqGS:HITK) Dec-07 6.0 5.6 NA 1.1 x NAJSC Akrihin Gedeon Richter Plc. (BUSE:RICHTER) Nov-07 153.6 69.5 NA 2.2 x NATAD Pharma GmbH KrKa dd Novo Mesto (LJSE:KRKG) Nov-07 142.6 86.9 NA 1.6 x NANutraMax Products, Inc., First Aid Division Derma Sciences Inc. (OTCBB:DSCI) Nov-07 13.5 16.7 -0.7 0.8 x NMZaklady Farmaceutyczne Polpharma S.A. Gedeon Richter Plc. (BUSE:RICHTER) Nov-07 1,307.9 373.7 105.7 3.5 x 12.4 x Strides Latina SA Aspen Pharmacare Holdings Ltd. (JSE:APN) Nov-07 305.0 74.9 NA 4.1 x NAMorton Grove Pharmaceuticals, Inc. Wockhardt Ltd. (BSE:532300) Oct-07 38.0 52.0 NA 0.7 x NAEnaleni Pharmaceuticals Consumer Division (Proprietary) Ltd. Marico Ltd. (BSE:531642) Oct-07 14.1 14.5 NA 1.0 x NADeltaSelect GmbH, Generic Injectable Pharmaceuticals Business Actavis Group Hf. Sep-07 102.5 37.2 NA 2.8 x NAIsoTis, Inc. Integra LifeSciences Holdings Corp. (NasdaqGS:IART) Aug-07 65.3 44.7 -9.3 1.5 x NMSynpart AG Alltracel Pharmaceuticals plc. Aug-07 8.6 17.9 1.6 0.5 x 5.5 x Actavis Group Hf. Novator Partners LLP May-07 $6,346.3 $1,850.2 $394.3 3.4 x NAMerck Generics Holding Gmbh Mylan, Inc. (NYSE:MYL) May-07 6,625.7 2,435.9 453.0 2.7 x 14.6 x Negma Lerads S.A.S Wockhardt Ltd. (BSE:532300) May-07 265.0 149.7 NA 1.8 x NADynamic Health Products Inc. GeoPharma Inc. (NasdaqCM:GORX) May-07 13.8 56.9 -0.6 0.2 x NMMedihoney Pty Ltd. Comvita Ltd. (NZSE:CVT) Apr-07 5.0 2.9 NA 1.7 x NA75% Stake in Eczacibasi Saglik Urunleri & EOS Eczacibasi Ozgun
Zentiva N.V. (SEP:BAAZEN) Mar-07 606.4 264.8 NA 2.3 x NA
GreenLife Limited Comvita Ltd. (NZSE:CVT) Mar-07 6.5 5.4 NA 1.2 x NADarco International, Inc. Wright Medical Group Inc. (NasdaqGS:WMGI) Mar-07 17.0 6.0 NA 2.8 x NA
NA. - not available
NM - not meaningful 2.5 x 14.3 x2.2 x 13.4 x
1. APP and LifeCell multiples are exlcuded from Sales and EBITDA multiple analysis 0.2 x 5.5 x14.3 x 26.6 x
www.bourne-partners.com1212
www.bourne-partners.com
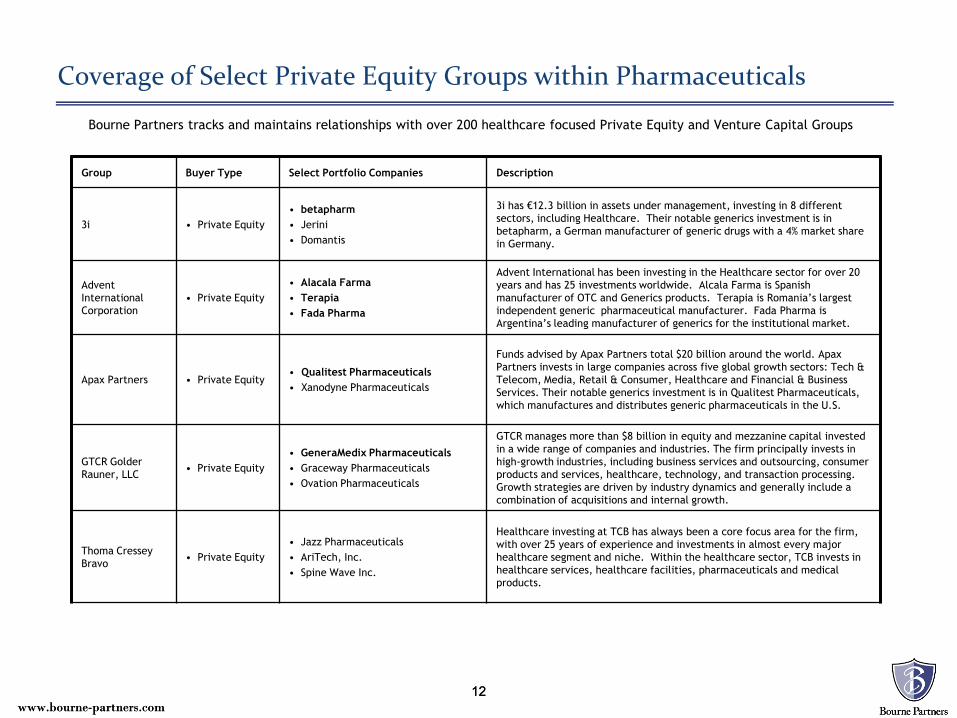
Coverage of Select Private Equity Groups within Pharmaceuticals
Bourne Partners tracks and maintains relationships with over 200 healthcare focused Private Equity and Venture Capital Groups
Group Buyer Type Select Portfolio Companies Description
3i • Private Equity• betapharm• Jerini• Domantis
3i has €12.3 billion in assets under management, investing in 8 different sectors, including Healthcare. Their notable generics investment is in betapharm, a German manufacturer of generic drugs with a 4% market share in Germany.
Advent International Corporation
• Private Equity• Alacala Farma• Terapia • Fada Pharma
Advent International has been investing in the Healthcare sector for over 20 years and has 25 investments worldwide. Alcala Farma is Spanish manufacturer of OTC and Generics products. Terapia is Romania’s largest independent generic pharmaceutical manufacturer. Fada Pharma is Argentina’s leading manufacturer of generics for the institutional market.
Apax Partners • Private Equity• Qualitest Pharmaceuticals • Xanodyne Pharmaceuticals
Funds advised by Apax Partners total $20 billion around the world. Apax Partners invests in large companies across five global growth sectors: Tech & Telecom, Media, Retail & Consumer, Healthcare and Financial & Business Services. Their notable generics investment is in Qualitest Pharmaceuticals, which manufactures and distributes generic pharmaceuticals in the U.S.
GTCR Golder Rauner, LLC • Private Equity
• GeneraMedix Pharmaceuticals• Graceway Pharmaceuticals• Ovation Pharmaceuticals
GTCR manages more than $8 billion in equity and mezzanine capital invested in a wide range of companies and industries. The firm principally invests in high-growth industries, including business services and outsourcing, consumer products and services, healthcare, technology, and transaction processing. Growth strategies are driven by industry dynamics and generally include a combination of acquisitions and internal growth.
Thoma Cressey Bravo • Private Equity
• Jazz Pharmaceuticals• AriTech, Inc.• Spine Wave Inc.
Healthcare investing at TCB has always been a core focus area for the firm, with over 25 years of experience and investments in almost every major healthcare segment and niche. Within the healthcare sector, TCB invests in healthcare services, healthcare facilities, pharmaceuticals and medical products.
www.bourne-partners.com1313
www.bourne-partners.com
Bourne Partners Overview
Investment banking and strategic business development support services
Healthcare focus
Client segmentation
– Specialty Pharmaceuticals
– OTC/Nutraceutical
– Medical Device
– Healthcare services
– Distribution
– Biotechnology
Over $2.5 billion in debt and equity capital raised in the healthcare sector
Over $2.5 billion executed in financial advisory (M&A) assignments in the healthcare sector
Since 2004, Bourne Partners has advised on deals in 8 different countries:
– U.S., Germany, Canada, Ireland, Sweden, Denmark, Brazil, and Italy
www.bourne-partners.com1414
www.bourne-partners.com
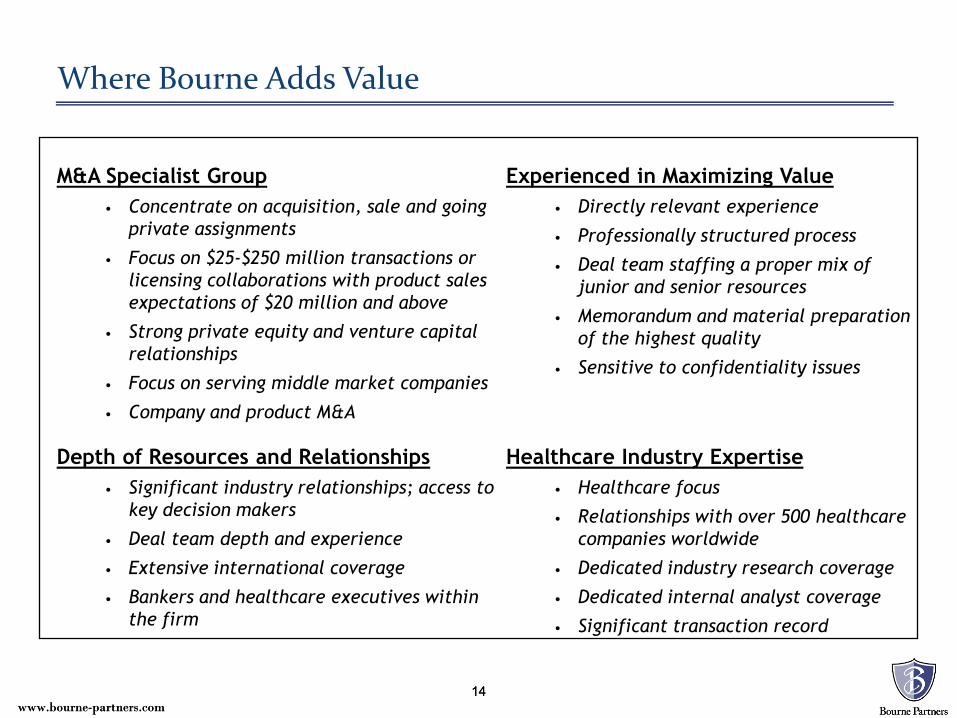
M&A Specialist Group• Concentrate on acquisition, sale and going
private assignments
• Focus on $25-$250 million transactions or licensing collaborations with product sales expectations of $20 million and above
• Strong private equity and venture capital relationships
• Focus on serving middle market companies
• Company and product M&A
Experienced in Maximizing Value• Directly relevant experience
• Professionally structured process
• Deal team staffing a proper mix of junior and senior resources
• Memorandum and material preparation of the highest quality
• Sensitive to confidentiality issues
Where Bourne Adds Value
Healthcare Industry Expertise• Healthcare focus
• Relationships with over 500 healthcare companies worldwide
• Dedicated industry research coverage
• Dedicated internal analyst coverage
• Significant transaction record
Depth of Resources and Relationships• Significant industry relationships; access to
key decision makers
• Deal team depth and experience
• Extensive international coverage
• Bankers and healthcare executives within the firm
www.bourne-partners.com1515
www.bourne-partners.com
Professionals to Contact
Banks Bourne, Senior Managing Director
704.315.6020
– Investment banking with Wachovia Securities, Inc.
– Founder and managing partner of Bourne Partners
– B.A. – Business Management with distinction, MBA – Wake Forest University
Jeremy Johnson, Vice President
704.315.6024
– 7 years of life sciences M&A and licensing experience
– B.S. from Georgetown University
www.bourne-partners.com1616
www.bourne-partners.com
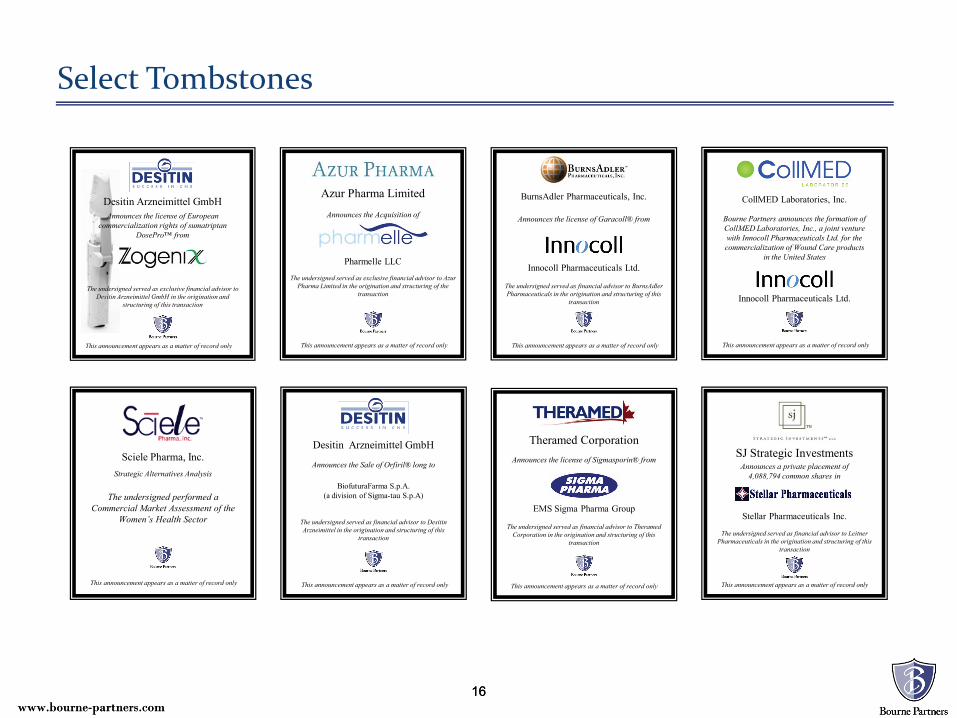
BurnsAdler Pharmaceuticals, Inc.
Announces the license of Garacoll® from
The undersigned served as financial advisor to BurnsAdler Pharmaceuticals in the origination and structuring of this
transaction
This announcement appears as a matter of record only
Innocoll Pharmaceuticals Ltd.
Azur Pharma Limited
This announcement appears as a matter of record only
Announces the Acquisition of
Pharmelle LLC
The undersigned served as exclusive financial advisor to Azur Pharma Limited in the origination and structuring of the
transaction
This announcement appears as a matter of record only
Sciele Pharma, Inc.Strategic Alternatives Analysis
The undersigned performed a Commercial Market Assessment of the
Women’s Health Sector
Desitin Arzneimittel GmbH
Announces the Sale of Orfiril® long to
The undersigned served as financial advisor to Desitin Arzneimittel in the origination and structuring of this
transaction
This announcement appears as a matter of record only
BiofuturaFarma S.p.A.(a division of Sigma-tau S.p.A)
SJ Strategic InvestmentsAnnounces a private placement of
4,088,794 common shares in
Stellar Pharmaceuticals Inc.
The undersigned served as financial advisor to Leitner Pharmaceuticals in the origination and structuring of this
transaction
This announcement appears as a matter of record only
Theramed CorporationAnnounces the license of Sigmasporin® from
EMS Sigma Pharma Group
The undersigned served as financial advisor to Theramed Corporation in the origination and structuring of this
transaction
This announcement appears as a matter of record only
Desitin Arzneimittel GmbHAnnounces the license of European
commercialization rights of sumatriptan DosePro™ from
The undersigned served as exclusive financial advisor to Desitin Arzneimittel GmbH in the origination and
structuring of this transaction
This announcement appears as a matter of record only
CollMED Laboratories, Inc.
Bourne Partners announces the formation of CollMED Laboratories, Inc., a joint venture with Innocoll Pharmaceuticals Ltd. for the commercialization of Wound Care products
in the United States
This announcement appears as a matter of record only
Innocoll Pharmaceuticals Ltd.
Select Tombstones