
Generating Portfolio Outperformance Using Fair Value Spreads
72
-
Upload
moodys-analytics -
Category
Economy & Finance
-
view
624 -
download
5
description
In this presentation, David Munves, Divisional Managing Director of the Capital Markets Research Group, discusses how cash and synthetic corporate portfolio managers can use Fair Value Spreads, as derived from public firm EDFs, in their investment and portfolio monitoring processes.
Transcript of Generating Portfolio Outperformance Using Fair Value Spreads

David Munves, CFA, Capital Markets Research Group
From the Moody's Analytics Webcast: Alpha Factor Model Portfolios Continue to Outperform | April 2013
Generating Portfolio OutperformanceUsing Fair Value Spreads

Generating Portfolio Outperformance Using Fair Value Spreads, April 2013 2
Contents
1. The EDF public firm model explained -- briefly
2. Model portfolio construction and performance measurement
3. IG and HY cash model portfolio performance
4. How did you do that? Decomposing our high yield returns
5. The big short: betting against financial institutions
6. Taking a view: Alpha Factor portfolio performance in bull and bear markets
7. What’s really going on here? Analyzing the link between Alpha Factors and bond
performance
8. CDS long/short portfolio performance
9. Appendix I: List of defaulted HY bonds that had been in the model portfolio
10. Appendix II: Lists of current IG and HY portfolio bonds and performance statistics

Generating Portfolio Outperformance Using Fair Value Spreads, April 2013
The EDF Public Firm Model Explained -- Briefly
1

Generating Portfolio Outperformance Using Fair Value Spreads, April 2013 4
Traditional balance sheet-based credit analysis focuses on the book values of assets and liabilities
A Stylized Company Balance Sheet
Assets
Assets generate cash flow.
Assets are at book value.
Cash flows go to 1)
debt holders; and 2) to equity holders
Liabilities
Equity
Liabiilities are obligations to external parties. They have first claim on cash flows.
Liabilities are at book value.
BV of Assets - BV of Liabilities. A company's share price fluctuates with the market's assessment of the assets' ability to generate future CF.
Is there a better way than Book Value to determine
what a company’s assets are worth?

Generating Portfolio Outperformance Using Fair Value Spreads, April 2013 5
There is a different, and arguably better, way: use equity market information to help derive asset value and asset volatility
Assets
The greater the cash flow generative power of the assets, the more they're worth, and the higher the stock price
Liabilities
Equity
A company’s stock price changes because the
market’s assessment of the assets’ future CF generation
changes. We can see the former, but not the latter.
Going from equity
value and equity volatility to asset value
and asset volatility
Observed Price
Changes
Unobserved Value
Changes

Generating Portfolio Outperformance Using Fair Value Spreads, April 2013 6
A side-by-side comparison of a strong and a weak company illustrates the interplay between an EDF and its drivers
EDFs and key inputs for Johnson & Johnson and RadioShack (as of October 2012)
M etric/Input J&J RadioShack
Default Point (100% of STD +50% of LTD) $38bn $1,179m
Market Value of Assets $247bn $1,459m
Market Legerage (DP/MVA) 16% 81%
Asset Volatility 9% 21%
1yr EDF 0.01% 13.52%
EDF-IR Aaa Ca
MIS Rating Aaa Caa1

Generating Portfolio Outperformance Using Fair Value Spreads, April 2013 7
J&J is a very low risk company, combining a large gap between its MVA and Default Point and minimal asset volatility
Time
$400bn
$0
$200bn
$180bn
$100bn
DP = $38bn
MVA = $247bn
Oct 2012 Oct 2013
$280bn
$300bn
$350bn
Key drivers of J&J’s EDF
No. of
Std. Dev.
% Probability
"Normal
Dist" PD
1 68% 2 96%
3 99.7%
4 99.993666%
5 99.9999426697%
6 99.9999998027% <0.01% 6 99.9999998027% <0.01%
$220bn
$70bn
$260bn
Generating Portfolio Outperformance Using Fair Value Spreads, April 2013 8
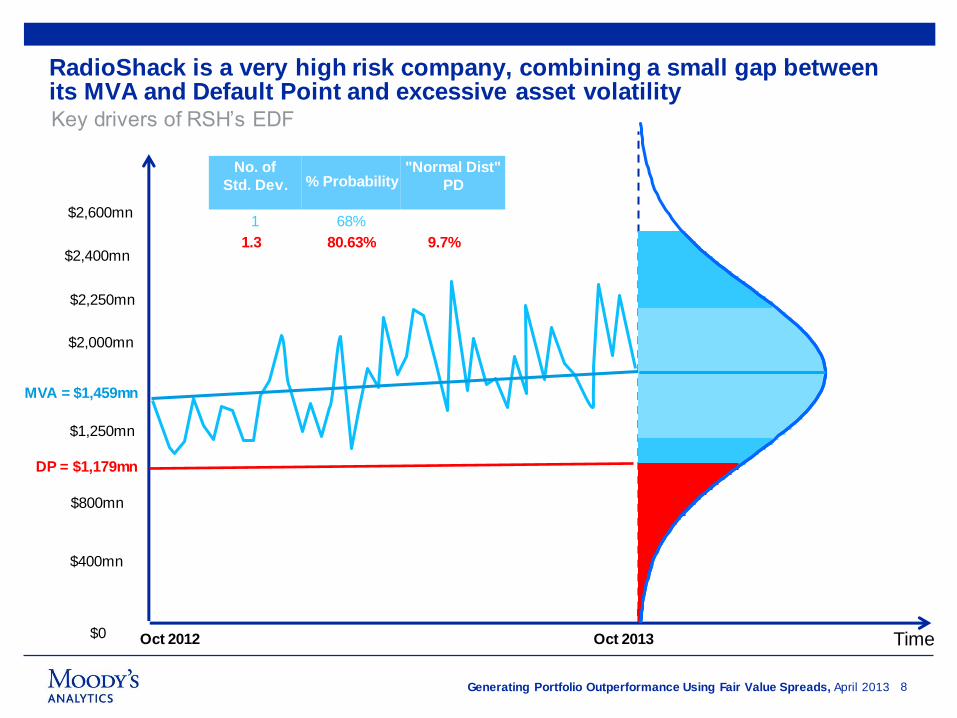
RadioShack is a very high risk company, combining a small gap between its MVA and Default Point and excessive asset volatility
Time $0
$1,250mn
$800mn
$400mn
DP = $1,179mn
MVA = $1,459mn
Oct 2012 Oct 2013
$2,250mn
$2,600mn
Key drivers of RSH’s EDF
No. of
Std. Dev.
% Probability
"Normal Dist"
PD
1 68%
$2,000mn
$2,400mn 2 96% 1.3 80.63% 9.7%

Generating Portfolio Outperformance Using Fair Value Spreads, April 2013
A big problem is that defaults are NOT normally distributed. So a firm’s DD (measured in Std Devs), understates its real default risk. EDFs address this via our empirical mapping.
» EDFs are derived from an empirical
mapping of DDs to historical default
rates
» Public firm EDFs were calibrated
using US corporates from 1980 to
2007, including over 8,000 defaults.
This is being extended to take into
account the more recent
experience.
DD = 4 maps to a 0.003% PD in
the simple BSM model, but to a
0.4% EDFTM metric
Note: the EDF-DD curve in the graph is a stylized representation
of the actual DD to EDF mapping function
9
Generating Portfolio Outperformance Using Fair Value Spreads, April 2013 10
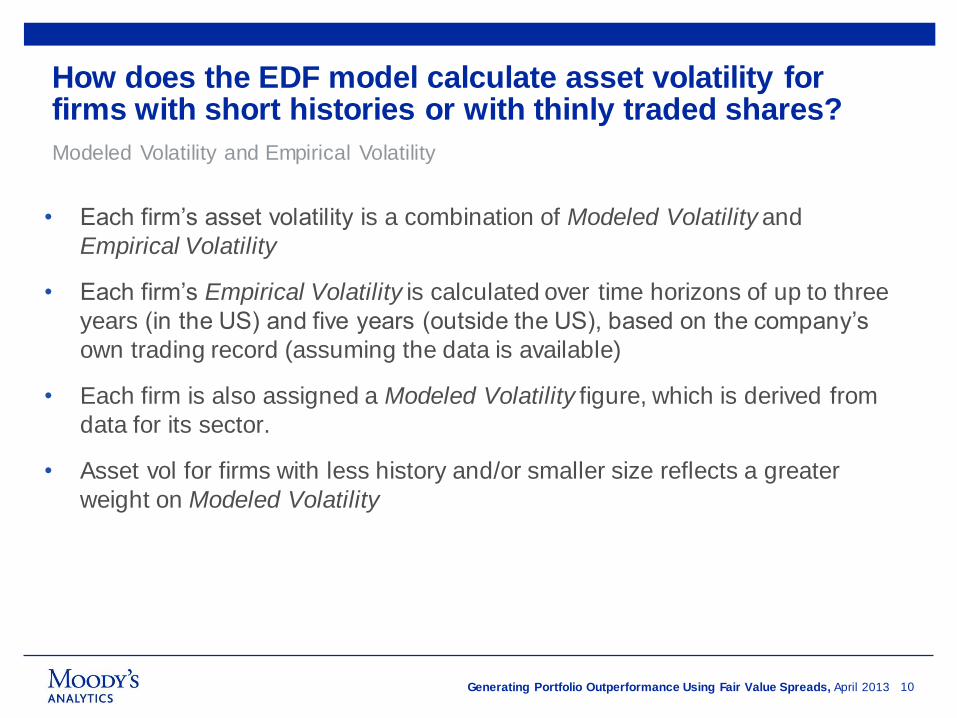
How does the EDF model calculate asset volatility for firms with short histories or with thinly traded shares?
• Each firm’s asset volatility is a combination of Modeled Volatility and
Empirical Volatility
• Each firm’s Empirical Volatility is calculated over time horizons of up to three
years (in the US) and five years (outside the US), based on the company’s
own trading record (assuming the data is available)
• Each firm is also assigned a Modeled Volatility figure, which is derived from
data for its sector.
• Asset vol for firms with less history and/or smaller size reflects a greater
weight on Modeled Volatility
Modeled Volatility and Empirical Volatility

Generating Portfolio Outperformance Using Fair Value Spreads, April 2013
The public firm EDF model summarized
» The two key drivers of the EDF model are:
– Financial risk: measured by the gap between the market value of a firm’s assets and the book value of its liabilities.
» Captured by its market leverage, i.e., BV of liabilities / MV of assets
– Business risk: measured by the volatility of the market value of a firm’s assets
» A key concept is distance to default (DD):
– The size of the move in a firm’s MV of assets, measured in Std Dev and
assuming a normal distribution of asset values.
» An EDF of 1% means that out of a portfolio of 100 firms, we would expect one
to default over a given horizon, usually 12 months
)ln()ln( XADD

Generating Portfolio Outperformance Using Fair Value Spreads, April 2013
Model Portfolio Construction and Performance Measurement
2

Generating Portfolio Outperformance Using Fair Value Spreads, April 2013
EDFs alone don’t equate to credit spreads, of course. However, they are a key component of our modeled bond-level FVS.
Correlation of Co. asset
value to market
Market Risk Premium
(broad market)
Expected LGD (sector and
seniority-based)
Company EDF
FVS
A simplified/stylistic view of the FVS model at the bond level
l ln
13
Company size
Term of the bond
Exp
ecte
d L
oss
Mkt P
rice
of R
isk
Co
. Size
Fa
cto
r

Generating Portfolio Outperformance Using Fair Value Spreads, April 2013 14
The principal bond selection criterion for the model portfolios is the issues’ Alpha Factors
A Bond’s Alpha Factor = (OAS-FVS)/(CEDF*LGD)
» CEDF is the cumulative EDF (on an annualized basis) that matches the
maturity of the bond issue
» The Alpha Factor for a given month is based on values from the previous month
Investment Universe:
» A member of ML US Investment Grade (IG) and High Yield (HY) Indices
» Sold by a publicly traded company with a Moody’s Analytics EDF credit measure
» Rated by Moody’s or S&P

Generating Portfolio Outperformance Using Fair Value Spreads, April 2013
Model portfolio construction and returns calculation
» Divide the relevant index into six duration groups. From each group exclude the top 2%
of issues by Alpha Factor.
» Rebalance monthly by buying the bonds with the highest Alpha Factors in each duration
bucket and selling the issues that are no longer top-ranked or that fall out of the index.
» 180 bonds in IG and HY portfolios*
» Transaction costs:
– For IG, 60 bp for a roundtrip transaction during the period July 2007 through
December 2009, and 15 bp otherwise;
– For HY, 100 bp for a round trip transaction during the period July 2007 through
December 2009, and 30 bp otherwise
» Monthly turnover of around 5%
» Portfolios are duration-matched to the indices
» All bonds are equally-weighted
» Portfolio excess return = portfolio total return – index total return
» Returns are calculated monthly, and are compounded to get annualized figures
i
* Bond counts are for the “on-going” portfolios (2007- present). The “research” portfolios (1999-2012) contain more issues

Generating Portfolio Outperformance Using Fair Value Spreads, April 2013
IG and HY Cash Model Portfolio Performance
3

Generating Portfolio Outperformance Using Fair Value Spreads, April 2013
The IG model portfolio has outperformed strongly on a cumulative basis
17
Investment grade performance vs. the ML IG Corp Index (1999-2012)
90%
120%
150%
180%
210%
240%
270%
300%
330%
Jul99 Sep00 Nov01 Jan03 Mar04 May05 Jul06 Sep07 Nov08 Jan10 Mar11 May12
Alpha Factor portfolio ML USIG
Average
Return
Standard
Deviation
Sharpe
Ratio
Alpha portfolio 9.2 5.7 1.16
Benchm ark 6.9 5.8 0.76
Generating Portfolio Outperformance Using Fair Value Spreads, April 2013
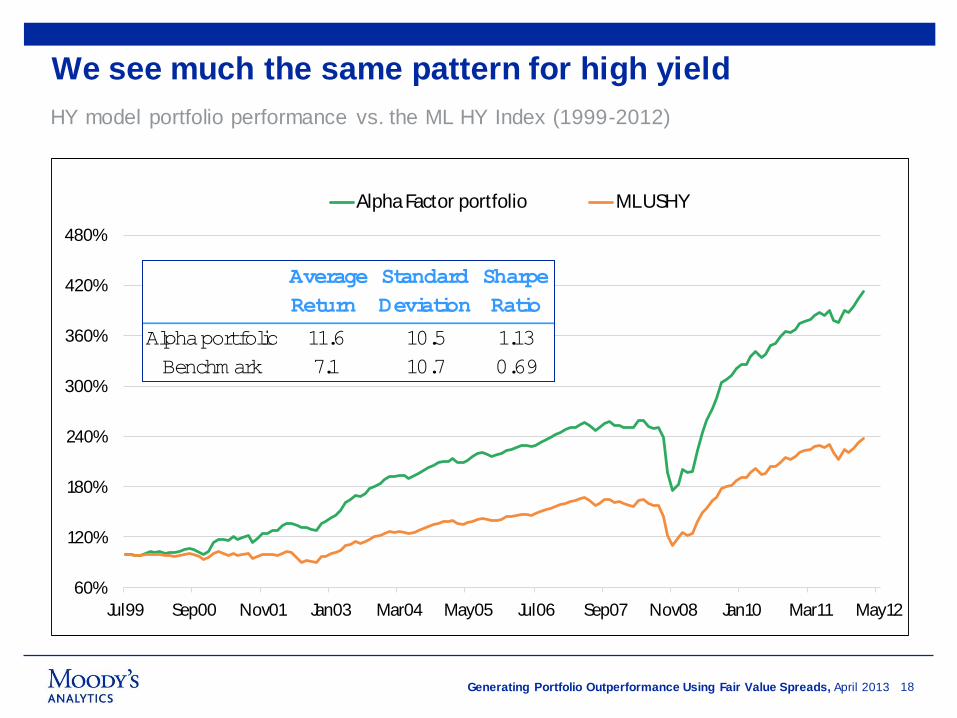
We see much the same pattern for high yield
18
HY model portfolio performance vs. the ML HY Index (1999-2012)
60%
120%
180%
240%
300%
360%
420%
480%
Jul99 Sep00 Nov01 Jan03 Mar04 May05 Jul06 Sep07 Nov08 Jan10 Mar11 May12
Alpha Factor portfolio ML USHY
Average
Return
Standard
Deviation
Sharpe
Ratio
Alpha portfolio 11.6 10.5 1.13
Benchm ark 7.1 10.7 0.69

Generating Portfolio Outperformance Using Fair Value Spreads, April 2013
The IG portfolio has outperformed the ML IG Index in most years, with the best results coming in high volatility periods
19
Investment grade performance vs. the ML IG Corp Index on an annual basis (1999-2011)
-10
-5
0
5
10
15
20
25
30
35
1999 2000 2001 2002 2003 2004 2005 2006 2007 2008 2009 2010 2011
Alpha Factor portfolio ML USIG%

Generating Portfolio Outperformance Using Fair Value Spreads, April 2013
The picture is similar for high yield, but with somewhat less consistency
20
High yield performance vs. the ML HY Corp Index on an annual basis (1999-2011)
-40
-20
0
20
40
60
80
1999 2000 2001 2002 2003 2004 2005 2006 2007 2008 2009 2010 2011
Alpha Factor portfolio ML USHY%

Generating Portfolio Outperformance Using Fair Value Spreads, April 2013
The US IG model portfolio had positive excess returns in 68% of the months, with a strong bias towards strongly positive months
21
Count of US investment grade model portfolio excess returns by month (8/99-9/2012)
0
2
4
6
8
10
12
14
16
18
<= -30 -9 - -5 6 - 8 16 - 20 31 - 35 101>=
Count
Outperform →←Underperform MonthlyExcess Return (bp)
Generating Portfolio Outperformance Using Fair Value Spreads, April 2013
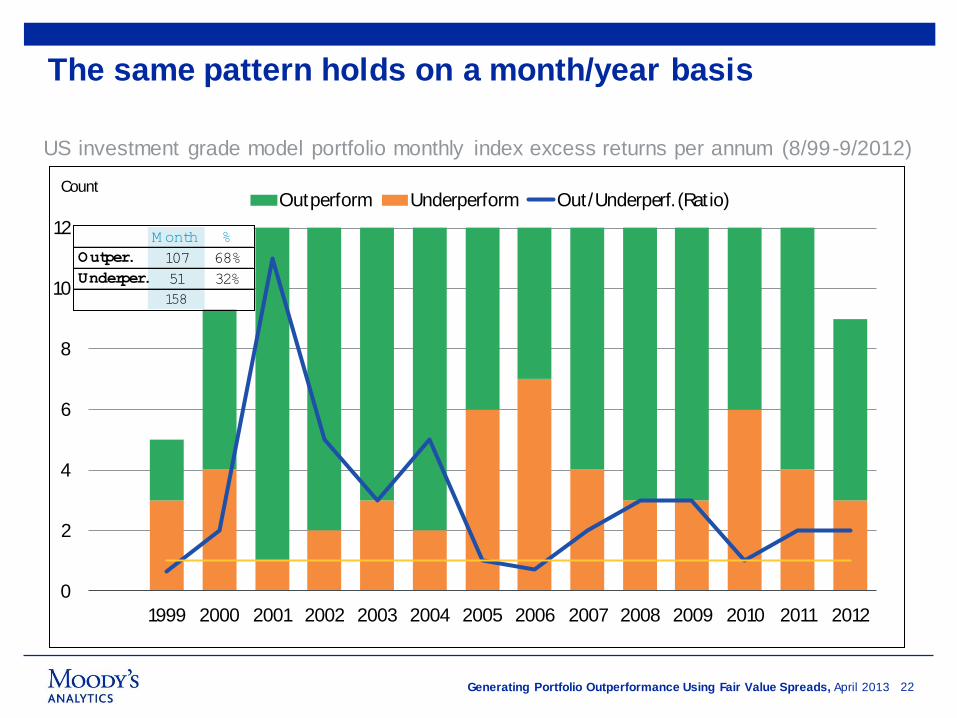
The same pattern holds on a month/year basis
22
US investment grade model portfolio monthly index excess returns per annum (8/99-9/2012)
0
2
4
6
8
10
12
1999 2000 2001 2002 2003 2004 2005 2006 2007 2008 2009 2010 2011 2012
Outperform Underperform Out/Underperf. (Ratio)Count
M onth %
Outper. 107 68%
Underper. 51 32%
158

Generating Portfolio Outperformance Using Fair Value Spreads, April 2013
We see almost exactly the same picture for US high yield, with positive excess returns in 66% of the months
23
Count of US high yield model portfolio excess returns by month (8/99-9/2012)
0
2
4
6
8
10
12
14
16
18
<= -80 -39 - -30 -9 - 0 21 - 30 56 - 80 201>=
Count
Outperform →←Underperform MonthlyExcess Return (bp)

Generating Portfolio Outperformance Using Fair Value Spreads, April 2013
One difference with high yield is that the more recent balance of monthly outperformance by year isn’t as favorable
24
US high yield model portfolio monthly index excess returns per annum (8/99-9/2012)
0
2
4
6
8
10
12
1999 2000 2001 2002 2003 2004 2005 2006 2007 2008 2009 2010 2011 2012
outperform underperform Out/Underperf. (Rat io)Count
M onth %
Outper. 105 66%
Underper. 53 34%

Generating Portfolio Outperformance Using Fair Value Spreads, April 2013
Liquid market focus: Building model portfolios using only liquid bond issues*
25
Summary of average performance and portfolio and index sizes (2007-2012)
* A “liquid” bond is defined as having an outstanding amount of at least $750m for IG and $400m for HY, and a minimum of
three years to maturity
US IG US HY EU IG
M L Indices 5,228 2,065 1,731
√ Liquid Index 1,379 994 788
Alpha Factor Liquid Portfolio 180 160 160
# Bonds

Generating Portfolio Outperformance Using Fair Value Spreads, April 2013 26
The US IG liquid portfolio consistently outperforms the IG index; the liquid portfolio’s outperformance is strongest in high volatility years
Performance of the liquid US IG portfolio vs. the ML US IG Index
Index TR (% ) Port. TR (% ) Excess Return (bp) Sharpe Ratio
Avg. 2007-2012 (annualized) 6.7 10.3 360 1.4
2007 4.6 6.5 184
2008 -6.8 2.8 961
2009 19.8 21.2 148
2010 9.5 10.8 128
2011 7.5 10.0 249
2012 (YTD) 8.2 9.1 90

Generating Portfolio Outperformance Using Fair Value Spreads, April 2013 27
We see pretty much the same thing for the high yield liquid benchmark, with an even more pronounced tendency to do less well in stable markets
Performance of the liquid US HY portfolio vs. the ML US HY Index
Index TR (% ) Port. TR (% ) Excess Return (bp) Sharpe Ratio
Avg. 2007-2012 (annualized) 7.8 14.5 670 1.1
2007 2.2 4.2 204
2008 -26.4 -13.1 1,326
2009 57.5 75.5 1,798
2010 15.2 14.2 -102
2011 4.4 8.8 442
2012 (YTD) 10.4 10.0 -48

Generating Portfolio Outperformance Using Fair Value Spreads, April 2013
Credit spread analysis: the IG portfolio’s better performance is due to superior asset selection, rather than putting on carry trades
28
IG Alpha Factor portfolio and ML Index: average spreads
0
130
260
390
520
650
Jan07 Apr08 Jul09 Oct10 Jan12 Apr13
Alpha Factor Portfolio ML USIG IndexSprd (bp)

Generating Portfolio Outperformance Using Fair Value Spreads, April 2013
How did you do that? Decomposing our high yield returns
4

Generating Portfolio Outperformance Using Fair Value Spreads, April 2013
Based on ratings, our high yield portfolio is conservatively positioned against the ML US HY index
30
Current distribution of the HY portfolio and the ML HY index by broad ratings bucket
Caa
Caa
B
B
Ba
Ba
0
25
50
75
100
AF HY Portfolio Index
Ba B Caa%

Generating Portfolio Outperformance Using Fair Value Spreads, April 2013
This shows up in the consistently lower average spread on the portfolio compared to the index
31
HY Alpha Factor portfolio and the ML HY Index: average spreads
0
400
800
1,200
1,600
2,000
Jan07 Apr08 Jul09 Oct10 Jan12 Apr13
Alpha Factor Portfolio ML USHY IndexSprd (bp)

Generating Portfolio Outperformance Using Fair Value Spreads, April 2013
One benefit of the AF framework in HY is its conservatism; it filters out a lot of bonds that end up defaulting
32
HY Alpha Factor portfolio and ML Index: number of defaulted bonds
0
10
20
30
40
50
60
70
80
2007 2008 2009 2010 2011 2012
ML USHY Alpha Factor portfolioBond Count
Def. Cos. Def. Bonds
Index 135 948
HY Portfolio 10 18
Cum . Totals (2007-2012)

Generating Portfolio Outperformance Using Fair Value Spreads, April 2013
Around 50 issues were in the HY portfolio, left it, and then defaulted. Kicking them out saved a lot of $$$.
33
HY portfolio and ML Index: avg. price of defaulted bonds that had been in portfolio
* Avg. number of months btw when the bond left the AF portfolio and was defaulted

Generating Portfolio Outperformance Using Fair Value Spreads, April 2013
The big short: betting against financial institutions 5

Generating Portfolio Outperformance Using Fair Value Spreads, April 2013 35
Since 2007 the IG portfolio has been significantly underweight financial institutions. This has been the AF framework’s big sector bet -- has it paid off?
Share of FIs in the ML IG index and the Alpha Factor portfolio, and the percent underweight
0%
10%
20%
30%
40%
50%
60%
70%
80%
90%
100%0%
10%
20%
30%
40%
50%
60%
70%
80%
90%
100%
Jan07 Dec07 Nov08 Oct09 Sep10 Aug11 Jul12
% Underweight (R) AF Portfolio (L) ML USIG (L)% Underweight

Generating Portfolio Outperformance Using Fair Value Spreads, April 2013 36
The short bet has performed well – over the period the right call has been to underweight financials against the index
ML USIG Index total returns for financials and corporates
0
5
10
15
20
25
0.8
0.9
1
1.1
1.2
1.3
1.4
1.5
1.6
Jan07 Dec07 Nov08 Oct09 Sep10 Aug11 Jul12
Valu
e o
f $1
inve
sted in
1/0
7
Corp - FI (R) Financial (L) Corporate (L)
Cum
. Tota
l Retu
rn (%
)

Generating Portfolio Outperformance Using Fair Value Spreads, April 2013 37
The main driver of the IG portfolio’s underweight of FI bonds is that their FVS spreads are usually above their OAS
IG corporate and FI FVS vs. OAS (January 2012-June 2012)

Generating Portfolio Outperformance Using Fair Value Spreads, April 2013 38
Moreover, the few FI bonds that we’ve held have outperformed strongly
Cumulative total returns for the IG index and portfolio, by sector
0.8
1.0
1.2
1.4
1.6
1.8
2.0
2.2
0.8
1.0
1.2
1.4
1.6
1.8
2.0
2.2
Jan07 Dec07 Nov08 Oct09 Sep10 Aug11 Jul12
Valu
e o
f $1
inve
sted in
1/0
7
Financial (Portfolio) Financial (Index) Corporate (P) Corporate (I)
Valu
e o
f $1 in
veste
d in
1/07

Generating Portfolio Outperformance Using Fair Value Spreads, April 2013 39
But the short position vs. the index hasn’t worked every month, of course. The recent rally in financials caused our model portfolio to underperform.
Monthly IG index sector performance differential (corporates vs. financials)
-6
-4
-2
0
2
4
6
8
Jan07 Dec07 Nov08 Oct09 Sep10 Aug11 Jul12
Corporates vs. Financials%
Financials
Outperforme
d
Financials
Underperform
ed
Generating Portfolio Outperformance Using Fair Value Spreads, April 2013
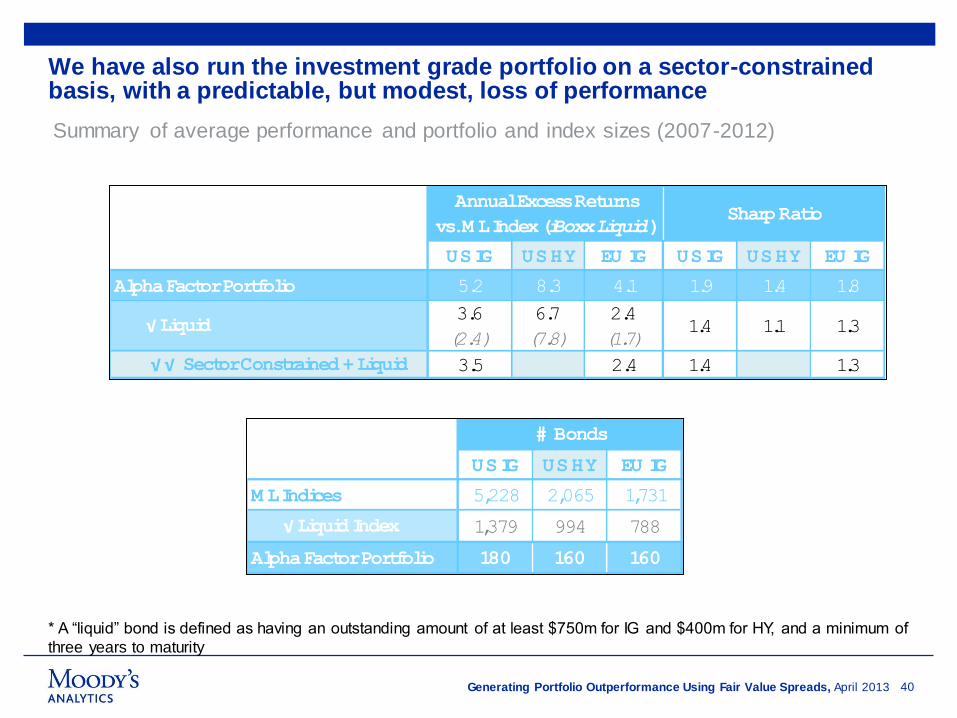
We have also run the investment grade portfolio on a sector-constrained basis, with a predictable, but modest, loss of performance
40
Summary of average performance and portfolio and index sizes (2007-2012)
* A “liquid” bond is defined as having an outstanding amount of at least $750m for IG and $400m for HY, and a minimum of
three years to maturity
US IG US HY EU IG US IG US HY EU IG
Alpha Factor Portfolio 5.2 8.3 4.1 1.9 1.4 1.8
√ Liquid 3.6
(2.4)
6.7
(7.8)
2.4
(1.7)1.4 1.1 1.3
√ √ Sector Constrained + Liquid 3.5 2.4 1.4 1.3
Annual Excess Returns
vs. M L Index (iBoxx Liquid)Sharp Ratio
US IG US HY EU IG
M L Indices 5,228 2,065 1,731
√ Liquid Index 1,379 994 788
Alpha Factor Portfolio 180 160 160
# Bonds

Generating Portfolio Outperformance Using Fair Value Spreads, April 2013 41
The addition of sector matching reduces the portfolios’ outperformance in some of the low volatility years, but the amount of return added by our naïve strategy remains significant
Performance of the liquid sector-constrained US IG portfolio vs. ML USIG Index
Index TR (% ) Port. TR (% ) Excess Return (bp) Sharpe Ratio
Avg. 2007-2012 (annualized) 6.7 10.2 350 1.4
2007 4.6 6.5 182
2008 -6.8 3.8 1,065
2009 19.8 21.3 155
2010 9.5 10.3 77
2011 7.5 8.0 52
2012 (YTD) 8.2 8.5 27
Generating Portfolio Outperformance Using Fair Value Spreads, April 2013 42
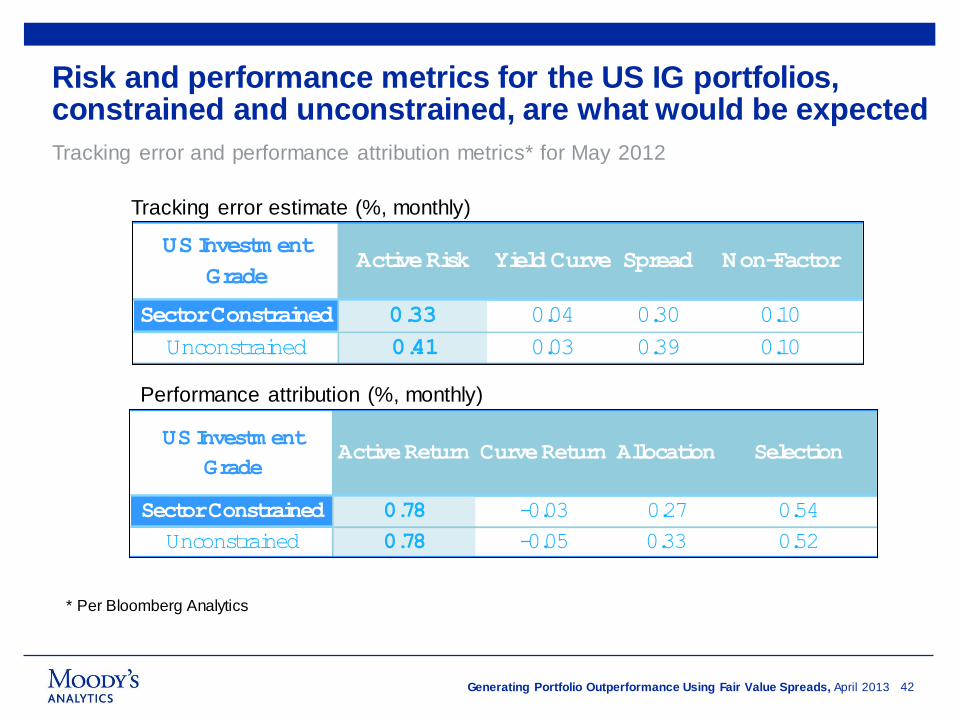
Risk and performance metrics for the US IG portfolios, constrained and unconstrained, are what would be expected
Tracking error and performance attribution metrics* for May 2012
US Investm ent
GradeActive Risk Yield Curve Spread Non-Factor
Sector Constrained 0.33 0.04 0.30 0.10
Unconstrained 0.41 0.03 0.39 0.10
Tracking error estimate (%, monthly)
US Investm ent
GradeActive Return Curve Return Allocation Selection
Sector Constrained 0.78 -0.03 0.27 0.54
Unconstrained 0.78 -0.05 0.33 0.52
Performance attribution (%, monthly)
* Per Bloomberg Analytics

Generating Portfolio Outperformance Using Fair Value Spreads, April 2013 43
In sum, the Alpha Factor framework improves significantly the tradeoff between return and volatility, even under stringent portfolio limitations
Risk/Return profiles of various Alpha Factor portfolios and relevant indices (2007-2012)
$IG:Index
$IG:AF
$IG:Liquid
$IG: L&S
$HY:Index
$HY:AF
$HY:Liquid
€IG:Index
€IG:AF
€IG:Liquid€IG: L&S
3
6
9
12
15
18
3 6 9 12 15
Annualiz
ed R
etu
rn
Annualized Standard Deviation
USIG USHY EUIG

Generating Portfolio Outperformance Using Fair Value Spreads, April 2013
Taking a view: Alpha Factor portfolio performance in bull and bear markets
6

Generating Portfolio Outperformance Using Fair Value Spreads, April 2013
The model portfolios performed better in bear and neutral months, with the latter standing out, particularly in HY
45
Monthly index excess returns according to the degree of spread movement* (8/99-9/2012)
* Neutral spread movement for IG is a 5 bp change vs. the previous month and 10 bp for HY. Bear and bull months are
when the monthly movement exceeded those levels in a positive/negative direction.
US IG US HY
Bear 0.34 0.62
Neutral 0.07 0.16
Bull 0.21 0.24
Average Excess Return (% )
Alpha Factor
Generating Portfolio Outperformance Using Fair Value Spreads, April 2013
What’s really going on here? Analyzing Alpha Factors at the portfolio and bond level
7

Generating Portfolio Outperformance Using Fair Value Spreads, April 2013 47
In the aggregate, looking at the bond-level relationship between monthly relative spread deltas and Alpha Factors isn’t hugely informative. The picture for the USHY index is about the same.
US IG bond monthly spread deltas vs. the IG index and their Alpha Factors (2007-2012)

Generating Portfolio Outperformance Using Fair Value Spreads, April 2013
US IG analysis: During Bear market* months, the outperformance bias is strong on a bond count basis across most AF buckets
48
Portfolio bond level performance* distributions, Bear market months* (2007-2012)
* A Bear Market month is one where the index’s average spread widened by more than 5 bp
Bo
nd C
ount B
asis
S
pre
ad C
hg B
asis
0
100
200
300
400
500
600
1 2 3-4 5-7 8-12 13-17 18-
Outperform Underperform# Bond
Alpha Factor
0
9
18
27
36
45
1 2 3-4 5-7 8-12 13-17 18-
Outperform UnderperformSpread Chg.
Alpha Factor

Generating Portfolio Outperformance Using Fair Value Spreads, April 2013
During Bull market* months the bond counts are more even, but the spread changes favor the outperformers
49
Portfolio bond level performance distributions by AF, Bull market* months (2007-2012)
* A Bull market month is a month in which the index’s average spread fell by more than 5 bp
Bo
nd C
ount B
asis
S
pre
ad C
hg B
asis
0
90
180
270
360
450
1 2 3-4 5-7 8-12 13-17 18-
Outperform Underperform# Bond
0
10
20
30
40
50
1 2 3-4 5-7 8-12 13-17 18-
Outperform UnderperformSpread Chg.
Alpha Factor

Generating Portfolio Outperformance Using Fair Value Spreads, April 2013
The IG picture is not compelling during Neutral market* months
50
* A “Neutral market” is one in which the spread change from the previous month was 5 bp or less
Bo
nd C
ount B
asis
S
pre
ad C
hg B
asis
Portfolio bond level performance distributions by AF, Neutral market* months (2007-2012)
0
70
140
210
280
350
1 2 3-4 5-7 8-12 13-17 18-
Outperform Underperform# Bond
0
4
8
12
16
1 2 3-4 5-7 8-12 13-17 18-
Outperform UnderperformSpread Chg.
Alpha Factor

Generating Portfolio Outperformance Using Fair Value Spreads, April 2013
HY analysis: As with the US portfolio, during Bear market* months the AF framework helps across the portfolio, although the main gains are on a spread delta basis
51
HY portfolio bond level performance* distributions, Bear market months* (2007-2012)
* A Bear Market month is one where the index’s average spread widened by more than 10 bp
Bo
nd C
ount B
asis
S
pre
ad C
hg B
asis
0
200
400
600
800
1 2 3-4 5-7 8-12 13-17 18-
Outperform Underperform# Bond
Alpha Factor
0
20
40
60
80
100
120
140
1 2 3-4 5-7 8-12 13-17 18-
Outperform UnderperformSpread Chg.
Alpha Factor

Generating Portfolio Outperformance Using Fair Value Spreads, April 2013
The Alpha Factors’ contribution during Bull market* months is quite meaningful on both a bond count and spread delta basis (for most buckets)
52
HY portfolio bond level performance distributions by AF, Bull market* months (2007-2012)
* A Bull market month is a month in which the index’s average spread fell by more than 10 bp
Bo
nd C
ount B
asis
S
pre
ad C
hg B
asis
0
200
400
600
800
1000
1 2 3-4 5-7 8-12 13-17 18-
Outperform Underperform# Bond
Alpha Factor
0
90
180
270
1 2 3-4 5-7 8-12 13-17 18-
Outperform UnderperformSpread Chg.
Alpha Factor
Generating Portfolio Outperformance Using Fair Value Spreads, April 2013
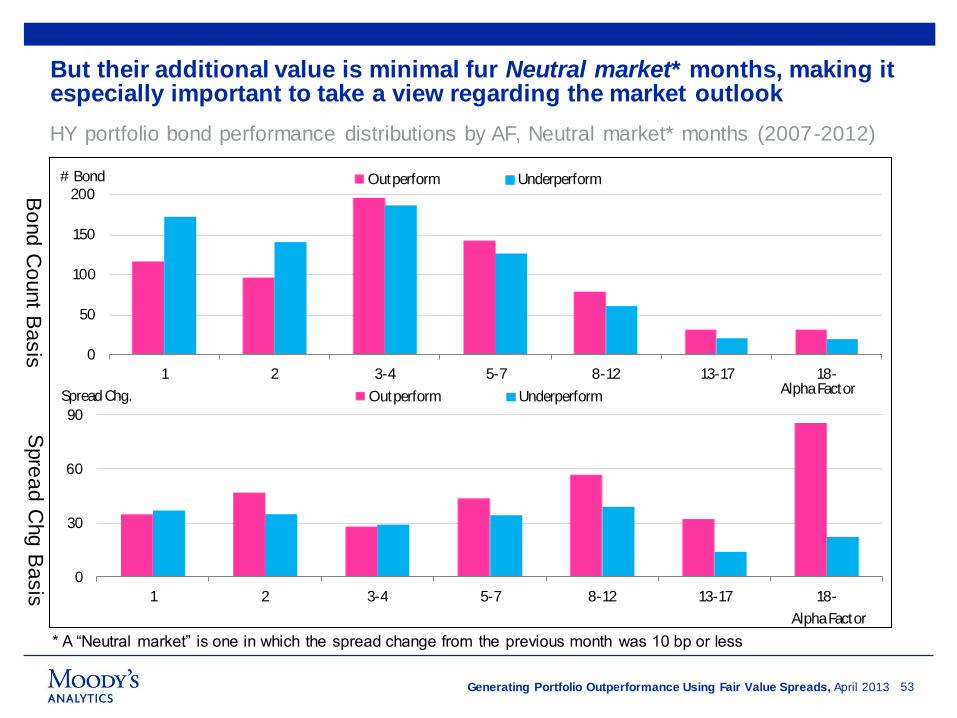
But their additional value is minimal fur Neutral market* months, making it especially important to take a view regarding the market outlook
53
* A “Neutral market” is one in which the spread change from the previous month was 10 bp or less
Bo
nd C
ount B
asis
S
pre
ad C
hg B
asis
HY portfolio bond performance distributions by AF, Neutral market* months (2007-2012)
0
50
100
150
200
1 2 3-4 5-7 8-12 13-17 18-
Outperform Underperform# Bond
Alpha Factor
0
30
60
90
1 2 3-4 5-7 8-12 13-17 18-
Outperform UnderperformSpread Chg.
Alpha Factor

Generating Portfolio Outperformance Using Fair Value Spreads, April 2013
CDS Long/Short Model Portfolio Performance
8

Generating Portfolio Outperformance Using Fair Value Spreads, April 2013
CDS long/short model portfolio construction
Alpha Factor = (CDS Spread – FVS)/(CEDF*LGD)
» Buy CDS protection with the lowest 12% Alpha Factors in the CDX IG or HY Index
» Sell CDS protection with the highest 12% Alpha Factors in the CDX IG or HY Index
» The average portfolio size is 30 names (Long 15 & Short 15) vs. 125 names in CDX IG
Index (100 in HY)
» All names are equally-weighted
» We review the model portfolio at the end of each index series roll date.
» We are not currently charging ourselves transaction costs

Generating Portfolio Outperformance Using Fair Value Spreads, April 2013
The model portfolio has posted a 6.0% annual return since its launch. CDX IG index has posted only 1.1% annual return during the same period.
56
The value of $1 invested in the portfolio in April 2007
0.9
1.0
1.1
1.2
1.3
0.9
1.0
1.1
1.2
1.3
Mar07 Dec07 Sep08 Jun09 Mar10 Dec10 Sep11 Jun12
Long AF Short AF CDX IG $ 1 $1
Annual excess returns : 4.9%
-5
0
5
10
15
20
2007 2008 2009 2010 2011 2012
Alpha Factor portfolioCDX IG Excess
%

Generating Portfolio Outperformance Using Fair Value Spreads, April 2013
The model portfolio has posted a 8.6% annual return since its launch. The CDX HY index has posted only 2.5% annual return during the same period.
57
The value of $1 invested in the portfolio in April 2007
0.7
0.8
0.9
1.0
1.1
1.2
1.3
1.4
0.7
0.8
0.9
1.0
1.1
1.2
1.3
1.4
Mar07 Feb08 Jan09 Dec09 Nov10 Oct11 Sep12
Long AF Short AF CDX HY$ 1 $1
Annual excess returns : 6.1%
-15-10-505
101520
2007 2008 2009 2010 2011 2012
Alpha Factor portfolioCDX HYExcess
%

Generating Portfolio Outperformance Using Fair Value Spreads, April 2013
Appendix I: List of defaulted bonds that had been in the HY portfolio

Generating Portfolio Outperformance Using Fair Value Spreads, April 2013 59
Appendix I
Defaulted bonds in the HY portfolio
Date Price Date Price Date PriceDiff
(Column I - G)
US247907AC23 DELTA PETROLEUM DPTR 7.000 4/01/2015 4/1/2008 89 4/30/2008 88.5 12/15/2011 86.00 1,324
US629121AC89 NGC CORP DYN 7.625 10/15/2026 4/1/2007 97 6/30/2008 83 11/7/2011 64.25 1,225
US26816LAG77 DYNEGY HLDGS INC DYN 8.750 02/15/2012 1/1/2007 106 8/29/2008 101 11/7/2011 - 1,165
US629121AF11 NGC CORP DYN 7.125 05/15/2018 3/1/2007 96 8/29/2008 87 11/7/2011 64.50 1,165
US62912PAC59 NGC CORP CAP TR DYN 8.316 06/01/2027 1/1/2007 94.5 8/29/2008 81.75 11/7/2011 20.00 1,165
US873168AL29 TXU CORP TXU 5.550 11/15/2014 1/1/2007 94.93 10/31/2007 78 8/17/2010 50.25 1,021
US202608AC95 COMMERCIAL VEHIC CVGI 8.000 07/01/2013 6/1/2007 100 6/29/2007 99.75 8/4/2009 57.00 767
US69344MAH43 PMI GROUP INC PMI 6.000 09/15/2016 1/1/2010 57.44 3/31/2010 65.39 11/23/2011 26.00 602
US69344MAJ09 PMI GROUP INC PMI 6.625 09/15/2036 2/1/2010 42.35 3/31/2010 54.14 11/23/2011 26.00 602
US896047AE75 TRIBUNE CO TRB 4.875 08/15/2010 5/1/2007 93.33 6/29/2007 90.49 12/8/2008 10.00 528
US857689AV53 STATION CASINOS STN 6.000 4/01/2012 8/1/2007 91.5 11/30/2007 90.75 5/1/2009 36.00 518
US857689AZ67 STATION CASINOS STN 6.625 03/15/2018 9/1/2007 80.5 11/30/2007 75.75 4/15/2009 4.00 502
US857689AT08 STATION CASINOS STN 6.875 03/01/2016 6/1/2007 92.25 11/30/2007 79.63 4/1/2009 3.25 488
US857689AR42 STATION CASINOS STN 6.500 02/01/2014 7/1/2007 84.75 11/30/2007 81 3/3/2009 5.00 459
US184502AP71 CLEAR CHANNEL CCU 5.750 01/15/2013 1/1/2007 88.93 5/30/2008 73 8/27/2009 39.00 454
US184502AV40 CLEAR CHANNEL CCU 5.500 09/15/2014 1/1/2007 84.36 5/30/2008 65.5 8/27/2009 33.50 454
US184502AU66 CLEAR CHANNEL CCU 5.000 03/15/2012 1/1/2007 89.96 7/31/2008 64.75 8/27/2009 49.00 392
US001920AB36 ARCO CHEMICAL CO LYO 9.800 02/01/2020 10/1/2007 98 12/31/2007 97 1/6/2009 25.00 372
US001920AD91 ARCO CHEMICAL CO LYO 10.250 11/01/2010 10/1/2007 105.5 12/31/2007 104 1/6/2009 25.00 372
US413627AN01 HARRAHS OPER CO CZR 5.375 12/15/2013 1/1/2007 88.01 12/31/2007 76 12/19/2008 22.25 354
US413627AU44 HARRAHS OPER CO HET 5.625 06/01/2015 1/1/2007 85.76 1/31/2008 63.5 12/19/2008 17.00 323
US413627AW00 HARRAHS OPER CO HET 5.750 10/01/2017 1/1/2007 83.78 1/31/2008 60 12/19/2008 15.50 323
In Out Default
ISIN Company Detail
Generating Portfolio Outperformance Using Fair Value Spreads, April 2013 60
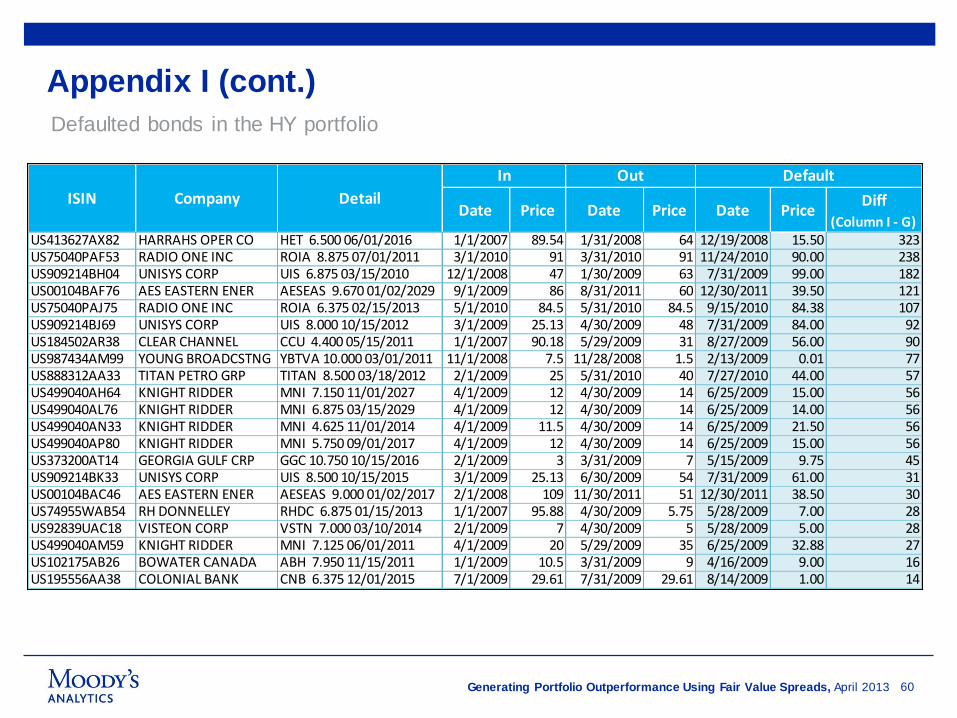
Appendix I (cont.)
Defaulted bonds in the HY portfolio
Date Price Date Price Date PriceDiff
(Column I - G)US413627AX82 HARRAHS OPER CO HET 6.500 06/01/2016 1/1/2007 89.54 1/31/2008 64 12/19/2008 15.50 323US75040PAF53 RADIO ONE INC ROIA 8.875 07/01/2011 3/1/2010 91 3/31/2010 91 11/24/2010 90.00 238US909214BH04 UNISYS CORP UIS 6.875 03/15/2010 12/1/2008 47 1/30/2009 63 7/31/2009 99.00 182US00104BAF76 AES EASTERN ENER AESEAS 9.670 01/02/2029 9/1/2009 86 8/31/2011 60 12/30/2011 39.50 121US75040PAJ75 RADIO ONE INC ROIA 6.375 02/15/2013 5/1/2010 84.5 5/31/2010 84.5 9/15/2010 84.38 107US909214BJ69 UNISYS CORP UIS 8.000 10/15/2012 3/1/2009 25.13 4/30/2009 48 7/31/2009 84.00 92US184502AR38 CLEAR CHANNEL CCU 4.400 05/15/2011 1/1/2007 90.18 5/29/2009 31 8/27/2009 56.00 90US987434AM99 YOUNG BROADCSTNG YBTVA 10.000 03/01/2011 11/1/2008 7.5 11/28/2008 1.5 2/13/2009 0.01 77US888312AA33 TITAN PETRO GRP TITAN 8.500 03/18/2012 2/1/2009 25 5/31/2010 40 7/27/2010 44.00 57US499040AH64 KNIGHT RIDDER MNI 7.150 11/01/2027 4/1/2009 12 4/30/2009 14 6/25/2009 15.00 56US499040AL76 KNIGHT RIDDER MNI 6.875 03/15/2029 4/1/2009 12 4/30/2009 14 6/25/2009 14.00 56US499040AN33 KNIGHT RIDDER MNI 4.625 11/01/2014 4/1/2009 11.5 4/30/2009 14 6/25/2009 21.50 56US499040AP80 KNIGHT RIDDER MNI 5.750 09/01/2017 4/1/2009 12 4/30/2009 14 6/25/2009 15.00 56US373200AT14 GEORGIA GULF CRP GGC 10.750 10/15/2016 2/1/2009 3 3/31/2009 7 5/15/2009 9.75 45US909214BK33 UNISYS CORP UIS 8.500 10/15/2015 3/1/2009 25.13 6/30/2009 54 7/31/2009 61.00 31US00104BAC46 AES EASTERN ENER AESEAS 9.000 01/02/2017 2/1/2008 109 11/30/2011 51 12/30/2011 38.50 30US74955WAB54 RH DONNELLEY RHDC 6.875 01/15/2013 1/1/2007 95.88 4/30/2009 5.75 5/28/2009 7.00 28US92839UAC18 VISTEON CORP VSTN 7.000 03/10/2014 2/1/2009 7 4/30/2009 5 5/28/2009 5.00 28US499040AM59 KNIGHT RIDDER MNI 7.125 06/01/2011 4/1/2009 20 5/29/2009 35 6/25/2009 32.88 27US102175AB26 BOWATER CANADA ABH 7.950 11/15/2011 1/1/2009 10.5 3/31/2009 9 4/16/2009 9.00 16US195556AA38 COLONIAL BANK CNB 6.375 12/01/2015 7/1/2009 29.61 7/31/2009 29.61 8/14/2009 1.00 14
In Out Default
ISIN Company Detail

Generating Portfolio Outperformance Using Fair Value Spreads, April 2013
Appendix II: Lists of current IG and HY portfolio bonds and performance statistics

Generating Portfolio Outperformance Using Fair Value Spreads, April 2013 62
Appendix II
List of bonds in the IG portfolio
FVS
ISIN Issuer name bond details Dur.
When
the bond
entered
the
portfolio
Dur
(Buckets)
Beginnin
gEnd Chg
Beginnin
gEnd Chg
Avg
Chg by
Bucket -
Index
Column
N-OFVS CEDF LGD
US302445AC58 FLIR SYSTEMS FLIR 3.750 09/01/2016 3.3 201110 B2 20.4 13.5 -34% 257 196 -61 -1.1 -59.9 56 0.2 0.4
US037389AK90 AON CORP AOC 8.205 01/01/2027 9.0 200909 B6 4.4 3.7 -15% 335 299 -36 5.0 -41.0 123 0.6 0.9
US72766CAD83 PLATINUM UW FIN PTP 7.500 06/01/2017 3.6 200701 B3 21.5 21.5 0% 393 369 -24 2.1 -26.1 51 0.3 0.5
US570535AJ39 MARKEL CORP MKL 5.350 06/01/2021 6.8 201204 B6 4.4 4.0 -11% 213 193 -20 5.0 -25.0 73 0.6 0.5
US564759QB72 MANUF & TRADERS MTB 5.629 12/01/2021 3.3 201210 B2 18.8 20.1 7% 454 431 -23 -1.1 -21.9 137 0.3 0.6
US14170TAB70 CAREFUSION CORP CFN 6.375 08/01/2019 5.4 201207 B4 10.1 10.5 4% 191 173 -18 3.7 -21.7 63 0.2 0.7
US172062AF88 CINCINNATI FINL CINF 6.920 05/15/2028 10.3 200705 B6 3.1 2.9 -7% 212 196 -16 5.0 -21.0 91 0.7 0.5
US705012AA08 PEARSON FUND TWO PSON 4.000 05/17/2016 3.0 201103 B2 33.0 30.9 -6% 128 106 -22 -1.1 -20.9 30 0.0 0.7
US017175AB67 ALLEGHANY CORP Y 5.625 09/15/2020 6.2 201010 B5 6.4 5.8 -9% 218 204 -14 3.3 -17.3 47 0.5 0.5
US079867AW73 BELLSOUTH TELEC T 6.375 06/01/2028 10.5 201203 B6 3.9 4.2 7% 220 209 -11 5.0 -16.0 98 0.4 0.7
US58013MEH34 MCDONALD'S CORP MCD 5.700 02/01/2039 15.4 201011 B6 3.1 2.5 -19% 116 106 -10 5.0 -15.0 61 0.3 0.6
US030955AN88 AMERITECH CAP T 6.550 01/15/2028 10.1 200702 B6 6.2 6.8 8% 280 272 -8 5.0 -13.0 95 0.4 0.7
US19122TAE91 COCA-COLA ENTER CCE 3.250 08/19/2021 7.6 201208 B6 12.0 11.6 -3% 132 124 -8 5.0 -13.0 25 0.1 0.6
US950840AB49 WESFARMERS LTD WESAU 2.983 05/18/2016 3.1 201106 B2 17.2 13.7 -20% 97 83 -14 -1.1 -12.9 7 0.1 0.6
US05540KAA97 BFF INTL LTD BRFSBZ 7.250 01/28/2020 5.6 201205 B5 10.4 10.7 3% 316 307 -9 3.3 -12.3 68 0.4 0.6
US08658EAA55 BESTFOODS UNANA 6.625 04/15/2028 10.7 201302 B6 7.3 6.9 -6% 92 85 -7 5.0 -12.0 25 0.1 0.6
US337738AM09 FISERV INC FISV 3.500 10/01/2022 8.2 201211 B6 7.3 7.5 3% 187 180 -7 5.0 -12.0 73 0.2 0.6
US893521AB05 TRANSATLANTIC HL TRH 8.000 11/30/2039 13.2 201003 B6 2.3 2.2 -5% 258 251 -7 5.0 -12.0 98 1.3 0.5
US58013MEJ99 MCDONALD'S CORP MCD 3.500 07/15/2020 6.6 201101 B6 8.7 7.7 -11% 78 71 -7 5.0 -12.0 23 0.1 0.6
US84756NAA72 SPECTRA ENERGY SEP 2.950 06/15/2016 3.1 201210 B2 29.2 39.7 36% 146 133 -13 -1.1 -11.9 11 0.1 0.6
US205887AR36 CONAGRA INC CAG 7.000 10/01/2028 10.3 201108 B6 5.8 5.8 1% 216 210 -6 5.0 -11.0 65 0.4 0.6
US205887AF97 CONAGRA INC CAG 7.125 10/01/2026 9.4 201204 B6 7.2 7.3 2% 225 220 -5 5.0 -10.0 59 0.4 0.6
US10552TAA51 BRF-BRASIL FOODS PRGA 5.875 06/06/22 7.3 201207 B6 5.3 5.5 4% 282 277 -5 5.0 -10.0 89 0.6 0.6
US487836AT55 KELLOGG CO K 7.450 04/01/2031 11.2 200701 B6 5.6 6.0 7% 207 202 -5 5.0 -10.0 77 0.4 0.6
US872540AM11 TJX COS INC TJX 6.950 04/15/2019 5.1 201204 B4 15.1 15.0 0% 121 115 -6 3.7 -9.7 24 0.1 0.6
US874060AA45 TAKEDA PHARMACEU TACHEM 1.031 03/17/2015 2.0 201208 B1 24.9 15.7 -37% 45 35 -10 -0.8 -9.2 11 0.0 0.7
US25244SAF83 DIAGEO FINANCE DIAG 3.250 01/15/2015 1.8 201004 B1 26.8 17.0 -36% 41 31 -10 -0.8 -9.2 11 0.0 0.6
US030955AM06 AMERITECH CAP T 6.450 01/15/2018 4.3 200702 B3 25.3 27.3 8% 175 168 -7 2.1 -9.1 20 0.1 0.7
US017175AC41 ALLEGHANY CORP Y 4.950 06/27/2022 7.7 201211 B6 3.7 3.7 -1% 191 187 -4 5.0 -9.0 59 0.7 0.5
US883556AY80 THERMO FISHER TMO 3.200 03/01/2016 2.9 201103 B2 18.6 22.5 21% 85 75 -10 -1.1 -8.9 19 0.1 0.4
US713448BN75 PEPSICO INC PEP 4.500 01/15/2020 6.1 201002 B5 10.5 10.3 -2% 96 91 -5 3.3 -8.3 16 0.1 0.6
US079860AD40 BELLSOUTH CAP FD T 6.875 10/15/2031 11.3 201203 B6 4.4 5.0 13% 261 258 -3 5.0 -8.0 108 0.5 0.7
US151020AE43 CELGENE CORP CELG 3.950 10/15/2020 6.6 201103 B6 7.1 7.6 7% 145 142 -3 5.0 -8.0 53 0.2 0.7
US018490AN28 ALLERGAN INC AGN 3.375 09/15/2020 6.7 201207 B6 9.2 7.9 -15% 98 95 -3 5.0 -8.0 42 0.1 0.7
US53217VAC37 LIFE TECH CORP LIFE 6.000 03/01/2020 5.9 201208 B5 7.2 8.0 12% 286 282 -4 3.3 -7.3 89 0.4 0.7
US25243YAR09 DIAGEO CAP PLC DGELN 1.500 05/11/2017 4.1 201207 B3 17.3 15.0 -14% 62 57 -5 2.1 -7.1 16 0.0 0.6
Performance in March 2013 Alpha Factor Spread EDF

Generating Portfolio Outperformance Using Fair Value Spreads, April 2013
Appendix II
63
List of bonds in the IG portfolio FVS
ISIN Issuer name bond details Dur.
When
the bond
entered
the
portfolio
Dur
(Buckets)
Beginnin
gEnd Chg
Beginnin
gEnd Chg
Avg
Chg by
Bucket -
Index
Column
N-OFVS CEDF LGD
US427866AL29 HERSHEY FOODS CO HSY 7.200 08/15/2027 10.2 200908 B6 7.4 7.7 4% 144 142 -2 5.0 -7.0 54 0.2 0.6
US126149AD59 CPC INTL INC UNANA 7.250 12/15/2026 9.9 201301 B6 8.4 8.6 2% 93 91 -2 5.0 -7.0 23 0.1 0.6
US205887AX04 CONAGRA INC CAG 8.250 09/15/2030 10.4 201108 B6 7.8 8.0 3% 272 270 -2 5.0 -7.0 66 0.4 0.6
US423074AP89 HJ HEINZ CO HNZ 2.850 03/01/2022 8.1 201207 B6 8.3 7.6 -9% 109 107 -2 5.0 -7.0 40 0.1 0.6
US19122TAB52 COCA-COLA ENTER CCE 4.500 09/01/2021 7.3 201207 B6 12.0 12.3 2% 125 123 -2 5.0 -7.0 24 0.1 0.6
US931142CU56 WAL-MART STORES WMT 3.625 07/08/2020 6.6 201205 B6 4.9 5.1 6% 84 82 -2 5.0 -7.0 34 0.2 0.6
US958254AA26 WESTERN GAS WES 5.375 06/01/2021 6.8 201207 B6 6.5 7.5 15% 208 206 -2 5.0 -7.0 45 0.4 0.6
US084664BU46 BERKSHIRE HATH BRK 4.400 05/15/2042 16.7 201210 B6 5.3 5.2 -1% 148 146 -2 5.0 -7.0 64 0.3 0.5
US25746UAY55 DOMINION RES D 7.500 06/30/2016 2.9 201205 B2 18.1 19.7 9% 353 345 -8 -1.1 -6.9 205 0.1 0.6
US776696AD82 ROPER INDUSTRIES ROP 1.850 11/15/2017 4.5 201301 B4 15.1 21.4 42% 100 97 -3 3.7 -6.7 43 0.1 0.4
US92933DAA81 WEA FIN/WT FIN WDCAU 7.500 06/02/2014 1.2 200910 B1 60.7 53.2 -12% 95 88 -7 -0.8 -6.2 1 0.0 0.9
US964152AA01 WHITE MOUNTAINS WTM 6.375 03/20/2017 3.5 200805 B3 18.1 17.1 -5% 252 248 -4 2.1 -6.1 34 0.2 0.5
US478160AQ79 JOHNSON&JOHNSON JNJ 5.550 08/15/2017 4.1 200709 B3 12.1 10.2 -16% 38 34 -4 2.1 -6.1 5 0.0 0.7
US05530QAF72 BAT INTL FINANCE BATSLN 3.250 06/07/2022 8.2 201207 B6 11.1 12.1 8% 109 108 -1 5.0 -6.0 35 0.1 0.6
US58013MEC47 MCDONALD'S CORP MCD 6.300 10/15/2037 14.4 200904 B6 3.9 3.9 0% 122 121 -1 5.0 -6.0 57 0.3 0.6
US58013MEF77 MCDONALD'S CORP MCD 6.300 03/01/2038 14.8 201011 B6 3.5 3.5 -1% 119 118 -1 5.0 -6.0 59 0.3 0.6
US151020AD69 CELGENE CORP CELG 2.450 10/15/2015 2.5 201201 B2 22.9 19.1 -17% 71 64 -7 -1.1 -5.9 27 0.0 0.7
US278865AH31 ECOLAB INC ECL 4.875 02/15/2015 1.9 200803 B1 49.1 43.0 -12% 73 67 -6 -0.8 -5.2 16 0.0 0.6
US717081DA89 PFIZER INC PFE 5.350 03/15/2015 1.9 201208 B1 36.4 30.5 -16% 43 37 -6 -0.8 -5.2 -4 0.0 0.7
US205887BD31 CONAGRA INC CAG 5.819 06/15/2017 3.8 201110 B3 24.2 26.6 10% 128 125 -3 2.1 -5.1 22 0.1 0.6
US694032AT09 PACIFIC BELL T 7.125 03/15/2026 9.2 201203 B6 3.6 4.0 13% 177 177 0 5.0 -5.0 85 0.4 0.7
US742718BH18 PROCTER & GAMBLE PG 6.450 01/15/2026 9.7 200701 B6 4.2 4.3 1% 77 77 0 5.0 -5.0 37 0.2 0.6
US478160AL82 JOHNSON&JOHNSON JNJ 4.950 05/15/2033 13.8 200701 B6 4.0 3.6 -9% 85 85 0 5.0 -5.0 48 0.1 0.7
US595620AE52 MIDAMERICAN ENER BRK 5.750 11/01/2035 14.0 201207 B6 6.3 6.5 2% 135 135 0 5.0 -5.0 52 0.2 0.5
US695114CB21 PACIFICORP BRK 6.100 08/01/2036 14.2 201210 B6 5.6 5.8 2% 129 129 0 5.0 -5.0 53 0.3 0.5
US59562EAH80 MIDAMERICAN ENER BRK 5.800 10/15/2036 14.5 200807 B6 5.8 5.9 2% 133 133 0 5.0 -5.0 54 0.3 0.5
US695114CG18 PACIFICORP BRK 6.250 10/15/2037 14.4 201212 B6 5.4 5.5 3% 127 127 0 5.0 -5.0 54 0.3 0.5
US695114BZ08 PACIFICORP BRK 5.250 06/15/2035 14.3 201210 B6 5.3 5.4 2% 124 124 0 5.0 -5.0 53 0.3 0.5
US695114CJ56 PACIFICORP BRK 6.350 07/15/2038 14.7 201210 B6 5.2 5.3 3% 128 128 0 5.0 -5.0 56 0.3 0.5
US695114CL03 PACIFICORP BRK 6.000 01/15/2039 15.1 201212 B6 4.6 4.7 3% 123 123 0 5.0 -5.0 57 0.3 0.5
US03523TBA51 ANHEUSER-BUSCH ABIBB 2.875 02/15/2016 2.9 201103 B2 20.4 18.6 -9% 47 41 -6 -1.1 -4.9 3 0.0 0.6
US756109AK03 REALTY INCOME O 6.750 08/15/2019 5.5 200905 B4 9.3 14.7 59% 166 165 -1 3.7 -4.7 31 0.2 0.9
US478160AU81 JOHNSON&JOHNSON JNJ 5.150 07/15/2018 4.8 200812 B4 10.2 9.4 -8% 41 40 -1 3.7 -4.7 8 0.0 0.7
US03523TAN81 ANHEUSER-BUSCH ABIBB 5.375 01/15/2020 5.9 201104 B5 6.1 6.6 9% 97 96 -1 3.3 -4.3 26 0.2 0.6
US427866AM02 HERSHEY COMPANY HSY 4.850 08/15/2015 2.3 200811 B1 20.6 16.3 -21% 53 48 -5 -0.8 -4.2 23 0.0 0.6
US0258M0CZ01 AMER EXPRESS CR AXP 5.125 08/25/2014 1.4 201207 B1 54.1 59.1 9% 49 44 -5 -0.8 -4.2 -4 0.0 0.5
Performance in March 2013 Alpha Factor Spread EDF

Generating Portfolio Outperformance Using Fair Value Spreads, April 2013 64
Appendix II
List of bonds in the IG portfolio FVS
ISIN Issuer name bond details Dur.
When
the bond
entered
the
portfolio
Dur
(Buckets)
Beginnin
gEnd Chg
Beginnin
gEnd Chg
Avg
Chg by
Bucket -
Index
Column
N-OFVS CEDF LGD
US461202AB98 INTUIT INC INTU 5.750 03/15/2017 3.6 200704 B3 19.0 22.6 19% 141 139 -2 2.1 -4.1 37 0.1 0.6
US874060AB28 TAKEDA PHARMACEU TACHEM 1.625 03/17/2017 3.9 201210 B3 19.8 18.2 -8% 75 73 -2 2.1 -4.1 17 0.0 0.7
US151020AH73 CELGENE CORP CELG 3.250 08/15/2022 8.3 201210 B6 4.1 4.6 13% 139 140 1 5.0 -4.0 63 0.3 0.7
US988498AH48 YUM! BRANDS INC YUM 3.750 11/01/2021 7.5 201201 B6 7.5 8.7 16% 156 157 1 5.0 -4.0 51 0.2 0.6
US695114CP17 PACIFICORP BRK 2.950 02/01/2022 8.0 201207 B6 8.0 8.4 5% 77 78 1 5.0 -4.0 23 0.1 0.5
US58013MEM29 MCDONALD'S CORP MCD 2.625 01/15/2022 8.1 201201 B6 5.3 5.5 4% 73 74 1 5.0 -4.0 29 0.1 0.6
US191216AV26 COCA-COLA CO/THE KO 3.300 09/01/2021 7.6 201207 B6 4.7 5.2 9% 68 69 1 5.0 -4.0 25 0.1 0.6
US695114CM85 PACIFICORP BRK 3.850 06/15/2021 7.2 201210 B6 10.0 10.4 4% 78 79 1 5.0 -4.0 19 0.1 0.5
US38259PAB85 GOOGLE INC GOOG 3.625 05/19/2021 7.3 201107 B6 5.1 4.8 -6% 70 71 1 5.0 -4.0 22 0.1 0.6
US742718CB39 PROCTER & GAMBLE PG 5.500 02/01/2034 13.9 200702 B6 2.3 2.4 5% 93 94 1 5.0 -4.0 61 0.2 0.6
US40420XAA37 HKCG FIN LTD HKCGAS 6.250 08/07/2018 4.7 200811 B4 11.9 14.1 19% 137 137 0 3.7 -3.7 22 0.2 0.6
US756109AL85 REALTY INCOME O 5.750 01/15/2021 6.5 201204 B5 7.4 12.1 63% 194 194 0 3.3 -3.3 43 0.2 0.9
US911308AA21 UPS OF AMER INC UPS 8.375 04/01/2020 5.6 200702 B5 9.1 11.0 20% 121 121 0 3.3 -3.3 31 0.2 0.6
US035229CY74 ANHEUSER-BUSCH ABIBB 5.000 01/15/2015 1.8 200809 B1 48.7 44.3 -9% 54 50 -4 -0.8 -3.2 0 0.0 0.6
US931142BY87 WAL-MART STORES WMT 4.500 07/01/2015 2.2 200811 B1 23.2 20.7 -11% 30 26 -4 -0.8 -3.2 -3 0.0 0.6
US02209SAN36 ALTRIA GROUP INC MO 2.850 08/09/2022 8.4 201210 B6 7.8 8.1 4% 132 134 2 5.0 -3.0 43 0.2 0.6
US695114CD86 PACIFICORP BRK 5.750 04/01/2037 14.5 201212 B6 5.1 5.2 1% 124 126 2 5.0 -3.0 54 0.3 0.5
US494550AZ99 KINDER MORGAN EN KMP 9.000 02/01/2019 4.9 201204 B4 7.4 8.0 8% 179 180 1 3.7 -2.7 55 0.3 0.6
US718172AH26 PHILIP MORRIS IN PM 4.500 03/26/2020 6.1 201009 B5 7.7 7.5 -3% 96 97 1 3.3 -2.3 29 0.1 0.6
US05530QAD25 BAT INTL FINANCE BATSLN 1.400 06/05/2015 2.2 201208 B1 38.8 35.8 -8% 61 58 -3 -0.8 -2.2 8 0.0 0.6
US278865AJ96 ECOLAB INC ECL 2.375 12/08/2014 1.7 201201 B1 37.7 34.1 -10% 56 53 -3 -0.8 -2.2 16 0.0 0.6
US66989HAC25 NOVARTIS CAPITAL NOVART 2.900 04/24/2015 2.1 201008 B1 22.3 19.8 -11% 30 27 -3 -0.8 -2.2 -2 0.0 0.7
US294429AF21 EQUIFAX INC EFX 6.300 07/01/2017 3.8 200708 B3 9.5 8.7 -9% 161 161 0 2.1 -2.1 49 0.2 0.6
US084670BD98 BERKSHIRE HATHWY BRK 1.900 01/31/2017 3.8 201303 B3 22.7 23.2 2% 53 53 0 2.1 -2.1 2 0.0 0.5
US12189LAL53 BURLINGTON NORTH BNSF 3.050 09/01/2022 8.5 201210 B6 10.7 11.3 6% 102 105 3 5.0 -2.0 25 0.1 0.5
US478160AW48 JOHNSON&JOHNSON JNJ 2.950 09/01/2020 6.9 201112 B6 8.7 8.8 1% 57 60 3 5.0 -2.0 16 0.1 0.7
US079857AH17 BELLSOUTH CAP FD T 7.875 02/15/2030 10.6 201203 B6 5.8 6.7 15% 283 286 3 5.0 -2.0 100 0.4 0.7
US084670BB33 BERKSHIRE HATHWY BRK 2.200 08/15/2016 3.3 201211 B2 18.9 17.6 -7% 35 32 -3 -1.1 -1.9 0 0.0 0.5
US771196AS16 ROCHE HLDGS INC ROSW 6.000 03/01/2019 5.2 200910 B4 8.9 9.2 3% 70 72 2 3.7 -1.7 18 0.1 0.7
US58013MEG50 MCDONALD'S CORP MCD 5.000 02/01/2019 5.3 200906 B4 12.9 13.5 5% 75 77 2 3.7 -1.7 17 0.1 0.6
US695114CH90 PACIFICORP BRK 5.650 07/15/2018 4.8 201208 B4 13.7 14.6 7% 51 53 2 3.7 -1.7 6 0.1 0.5
US337738AJ79 FISERV INC FISV 4.625 10/01/2020 6.4 201202 B5 13.5 14.6 8% 204 206 2 3.3 -1.3 60 0.2 0.6
US582839AE65 MEAD JOHNSON NUT MJN 4.900 11/01/2019 5.8 201108 B5 7.8 8.3 6% 151 153 2 3.3 -1.3 54 0.2 0.6
US988498AF81 YUM! BRANDS INC YUM 5.300 9/15/2019 5.6 201101 B5 12.2 13.4 10% 141 143 2 3.3 -1.3 37 0.1 0.6
US66989HAD08 NOVARTIS CAPITAL NOVART 4.400 04/24/2020 6.2 201009 B5 5.2 6.5 25% 82 84 2 3.3 -1.3 31 0.1 0.7
US78632LAA35 SADIA OVERSEAS SADIA 6.875 05/24/2017 3.7 201212 B3 23.3 25.7 10% 290 291 1 2.1 -1.1 41 0.2 0.6
Performance in March 2013 Alpha Factor Spread EDF

Generating Portfolio Outperformance Using Fair Value Spreads, April 2013 65
Appendix II
List of bonds in the IG portfolio FVS
ISIN Issuer name bond details Dur.
When
the bond
entered
the
portfolio
Dur
(Buckets)
Beginnin
gEnd Chg
Beginnin
gEnd Chg
Avg
Chg by
Bucket -
Index
Column
N-OFVS CEDF LGD
US337738AG31 FISERV INC FISV 6.800 11/20/2017 4.1 200801 B3 28.6 31.5 10% 153 154 1 2.1 -1.1 39 0.1 0.6
US58013MEA80 MCDONALD'S CORP MCD 5.300 03/15/2017 3.6 200710 B3 17.9 17.5 -2% 55 56 1 2.1 -1.1 10 0.0 0.6
US337738AL26 FISERV INC FISV 4.750 06/15/2021 7.0 201202 B6 11.7 13.5 15% 208 212 4 5.0 -1.0 64 0.2 0.6
US478160AZ78 JOHNSON&JOHNSON JNJ 3.550 05/15/2021 7.3 201112 B6 8.5 8.8 3% 60 64 4 5.0 -1.0 18 0.1 0.7
US001957AW94 AT&T CORP T 6.500 03/15/2029 10.6 201112 B6 3.8 4.4 14% 222 226 4 5.0 -1.0 100 0.5 0.7
US02209SAE37 ALTRIA GROUP INC MO 9.950 11/10/2038 12.5 200812 B6 10.0 10.4 4% 256 260 4 5.0 -1.0 66 0.3 0.6
US478160AT19 JOHNSON&JOHNSON JNJ 5.850 07/15/2038 15.3 200808 B6 3.9 3.9 1% 95 99 4 5.0 -1.0 55 0.2 0.7
US427866AP33 HERSHEY COMPANY HSY 5.450 09/01/2016 3.3 200708 B2 25.5 24.3 -5% 79 77 -2 -1.1 -0.9 25 0.0 0.6
US571748AQ56 MARSH & MCLENNAN MMC 9.250 04/15/2019 4.9 201208 B4 9.9 11.3 15% 205 208 3 3.7 -0.7 48 0.2 0.9
US10138MAK18 BOTTLING GROUP PBG 5.125 01/15/2019 5.2 201012 B4 13.2 14.3 9% 86 89 3 3.7 -0.7 11 0.1 0.6
US713448BJ63 PEPSICO INC PEP 7.900 11/01/2018 4.7 200908 B4 14.7 16.1 9% 77 80 3 3.7 -0.7 8 0.1 0.6
US337738AH14 FISERV INC FISV 3.125 10/01/2015 2.5 201204 B1 32.4 30.7 -5% 82 81 -1 -0.8 -0.2 29 0.0 0.6
US845335BQ03 SOUTHWN BELL TEL T 7.000 07/01/2015 2.2 200702 B1 41.7 45.7 10% 65 64 -1 -0.8 -0.2 -1 0.0 0.7
US907818CV82 UNION PACIFIC CO UNP 4.875 01/15/2015 1.8 200805 B1 42.6 48.6 14% 59 58 -1 -0.8 -0.2 9 0.0 0.6
US713448BM92 PEPSICO INC PEP 3.100 01/15/2015 1.8 201002 B1 24.9 24.1 -3% 23 22 -1 -0.8 -0.2 -5 0.0 0.6
US718172AN93 PHILIP MORRIS IN PM 1.625 03/20/2017 3.9 201205 B3 13.1 13.5 3% 58 60 2 2.1 -0.1 12 0.1 0.6
US478160AN49 JOHNSON&JOHNSON JNJ 5.950 08/15/2037 14.9 200709 B6 4.6 4.7 2% 100 105 5 5.0 0.0 53 0.1 0.7
US958254AB09 WESTERN GAS WES 4.000 07/01/2022 7.9 201208 B6 4.1 4.9 19% 183 188 5 5.0 0.0 54 0.5 0.6
US12189LAG68 BURLINGTON NORTH BRK 4.950 09/15/2041 16.0 201210 B6 5.6 5.9 4% 147 152 5 5.0 0.0 61 0.3 0.5
US12189LAJ08 BURLINGTON NORTH BRK 4.400 03/15/2042 16.6 201301 B6 4.7 5.0 5% 139 144 5 5.0 0.0 64 0.3 0.5
US883556AP73 THERMO FISHER TMO 5.000 06/01/2015 2.1 200705 B1 27.1 39.1 44% 79 79 0 -0.8 0.8 16 0.1 0.4
US02209SAK96 ALTRIA GROUP INC MO 4.125 09/11/2015 2.4 201008 B1 30.5 29.0 -5% 56 56 0 -0.8 0.8 11 0.0 0.6
US084664AT81 BERKSHIRE HATHWY BRK 4.850 01/15/2015 1.8 200701 B1 36.5 37.2 2% 30 30 0 -0.8 0.8 -5 0.0 0.5
US931142CG62 WAL-MART STORES WMT 5.375 04/05/2017 3.7 200805 B3 7.9 9.7 24% 31 34 3 2.1 0.9 6 0.1 0.6
US084664BS99 BERKSHIRE HATH BRK 1.600 05/15/2017 4.1 201207 B3 18.4 19.9 8% 49 52 3 2.1 0.9 3 0.0 0.5
US524671AA21 LEGRAND LR 8.500 02/15/2025 8.3 200901 B6 9.0 11.8 31% 282 288 6 5.0 1.0 69 0.6 0.4
US084664BT72 BERKSHIRE HATH BRK 3.000 05/15/2022 8.2 201206 B6 11.5 12.6 10% 103 109 6 5.0 1.0 24 0.1 0.5
US25245BAB36 DIAGEO INV CORP DGELN 2.875 05/11/2022 8.2 201303 B6 11.1 12.1 9% 101 107 6 5.0 1.0 29 0.1 0.6
US205887BJ01 CONAGRA INC CAG 3.250 09/15/2022 8.3 201210 B6 4.4 5.1 16% 137 143 6 5.0 1.0 52 0.3 0.6
US478160AF15 JOHNSON&JOHNSON JNJ 6.730 11/15/2023 8.3 200701 B6 7.2 7.8 8% 63 69 6 5.0 1.0 22 0.1 0.7
US883556AX08 THERMO FISHER TMO 4.500 03/01/2021 6.9 201105 B6 6.7 10.2 52% 166 172 6 5.0 1.0 47 0.5 0.4
US564759PS17 MANUF & TRADERS MTB 5.585 12/28/2015 2.6 201210 B2 33.8 38.8 15% 507 507 0 -1.1 1.1 128 0.2 0.6
US10138MAG06 BOTTLING GROUP PEP 5.500 04/01/2016 2.8 200706 B2 29.6 28.5 -4% 49 49 0 -1.1 1.1 -3 0.0 0.6
US205887BF88 CONAGRA INC CAG 7.000 04/15/2019 5.1 201111 B4 13.7 16.0 17% 148 153 5 3.7 1.3 31 0.1 0.6
US293791AR03 ENTERPRISE PRODU EPD 5.000 03/01/2015 1.9 201203 B1 25.6 37.6 47% 66 67 1 -0.8 1.8 3 0.0 0.6
US191216AK60 COCA-COLA CO/THE KO 5.350 11/15/2017 4.2 200801 B3 13.3 15.0 13% 50 54 4 2.1 1.9 6 0.1 0.6
Performance in March 2013 Alpha Factor Spread EDF

Generating Portfolio Outperformance Using Fair Value Spreads, April 2013 66
Appendix II
List of bonds in the IG portfolio FVS
ISIN Issuer name bond details Dur.
When
the bond
entered
the
portfolio
Dur
(Buckets)
Beginnin
gEnd Chg
Beginnin
gEnd Chg
Avg
Chg by
Bucket -
Index
Column
N-OFVS CEDF LGD
US665501AK83 NORTHERN NAT GAS MIDAM 4.100 09/15/2042 17.4 201302 B6 2.6 3.0 14% 110 117 7 5.0 2.0 66 0.3 0.5
US02209SAM52 ALTRIA GROUP INC MO 4.250 08/09/2042 16.9 201209 B6 2.6 2.9 14% 156 163 7 5.0 2.0 86 0.4 0.6
US756109AN42 REALTY INCOME O 3.250 10/15/2022 8.3 201302 B6 3.5 6.4 81% 169 176 7 5.0 2.0 61 0.4 0.9
US904764AM94 UNILEVER CAPITAL UNANA 4.250 02/10/2021 7.0 201106 B6 12.4 14.2 14% 80 87 7 5.0 2.0 12 0.1 0.6
US87656XAD30 TATE & LYLE INTL TATELN 6.625 06/15/2016 3.0 201208 B2 15.5 17.0 10% 195 196 1 -1.1 2.1 47 0.2 0.6
US337738AK43 FISERV INC FISV 3.125 06/15/2016 3.1 201204 B2 30.1 32.3 7% 99 100 1 -1.1 2.1 32 0.0 0.6
US595620AH83 MIDAMERICAN ENER BRK 5.300 03/15/2018 4.5 201204 B3 19.3 20.5 7% 61 66 5 2.1 2.9 5 0.1 0.5
US904764AP26 UNILEVER CAPITAL UNANA 0.850 08/02/2017 4.4 201210 B3 10.8 12.6 17% 34 39 5 2.1 2.9 2 0.0 0.6
US25245BAA52 DIAGEO INV CORP DGELN 4.250 05/11/2042 17.3 201210 B6 3.2 3.6 14% 106 114 8 5.0 3.0 59 0.2 0.6
US079867AM91 BELLSOUTH TELEC T 7.000 10/01/2025 8.9 201203 B6 6.0 6.8 14% 230 238 8 5.0 3.0 81 0.4 0.7
US19416QDR83 COLGATE-PALM CO CL 2.950 11/01/2020 7.0 201204 B6 6.2 7.4 21% 63 71 8 5.0 3.0 28 0.1 0.6
US78573AAD28 SABMILLER HLD IN SABLN 1.850 01/15/2015 1.8 201207 B1 39.9 47.9 20% 68 71 3 -0.8 3.8 12 0.0 0.6
US029912AT94 AMERICAN TOWER AMT 7 10/15/2017 USD 4.0 201007 B3 12.4 13.1 6% 186 192 6 2.1 3.9 55 0.2 0.7
US035229DB62 ANHEUSER-BUSCH ABIBB 5.600 03/01/2017 3.7 200710 B3 17.7 21.6 22% 74 80 6 2.1 3.9 8 0.1 0.6
US911684AD06 US CELLULAR USM 6.700 12/15/2033 11.6 200703 B6 2.2 2.0 -8% 355 364 9 5.0 4.0 149 1.3 0.7
US78572MAD74 SABMILLER PLC SABLN 6.500 07/01/2016 3.0 200710 B2 25.8 31.5 22% 103 106 3 -1.1 4.1 18 0.1 0.6
US00206RBB78 AT&T INC T 0.875 02/13/2015 1.9 201208 B1 38.1 44.9 18% 49 53 4 -0.8 4.8 -3 0.0 0.7
US988498AC50 YUM! BRANDS INC YUM 6.250 03/15/2018 4.4 200812 B3 19.9 22.4 13% 126 133 7 2.1 4.9 26 0.1 0.6
US03523TBE73 ANHEUSER-BUSCH ABIBB 7.750 01/15/2019 5.0 201104 B4 10.0 12.6 25% 99 108 9 3.7 5.3 18 0.1 0.6
US191216AM27 COCA-COLA CO/THE KO 4.875 3/15/2019 5.3 200910 B4 10.5 12.2 17% 66 75 9 3.7 5.3 12 0.1 0.6
US03523TBH05 ANHEUSER-BUSCH ABIBB 6.875 11/15/2019 5.6 201107 B5 6.4 8.1 26% 90 99 9 3.3 5.7 23 0.2 0.6
US459284AA37 COCA-COLA ENTER CCE 2.125 09/15/2015 2.5 201207 B1 39.9 42.5 7% 60 65 5 -0.8 5.8 -1 0.0 0.6
US25244SAC52 DIAGEO FINANCE DIAG 5.300 10/28/2015 2.5 200708 B1 24.6 27.0 10% 50 55 5 -0.8 5.8 12 0.0 0.6
US084670AV06 BERKSHIRE HATHWY BRK 3.200 02/11/2015 1.9 201207 B1 28.4 33.9 19% 24 29 5 -0.8 5.8 -5 0.0 0.5
US00206RAV42 AT&T INC T 2.500 08/15/2015 2.4 201207 B1 27.5 33.9 23% 51 56 5 -0.8 5.8 0 0.0 0.7
US12189LAK70 BURLINGTON NORTH BNSF 4.375 09/01/2042 17.2 201301 B6 3.9 4.8 21% 131 142 11 5.0 6.0 66 0.3 0.5
US487836BB39 KELLOGG CO K 4.450 05/30/2016 3.0 201202 B2 30.3 33.9 12% 76 81 5 -1.1 6.1 17 0.0 0.6
US742718DV83 PROCTER & GAMBLE PG 1.450 08/15/2016 3.4 201109 B2 9.6 11.8 23% 22 27 5 -1.1 6.1 1 0.0 0.6
US58013MEE03 MCDONALD'S CORP MCD 5.350 03/01/2018 4.5 200809 B4 11.3 14.3 27% 53 63 10 3.7 6.3 14 0.1 0.6
US25243YAM12 DIAGEO CAP PLC DIAG 5.750 10/23/2017 4.1 201210 B3 18.4 21.4 16% 66 75 9 2.1 6.9 17 0.0 0.6
US278865AL43 ECOLAB INC ECL 4.350 12/08/2021 7.5 201201 B6 4.1 4.5 10% 132 144 12 5.0 7.0 52 0.3 0.6
US03523TAM09 ANHEUSER-BUSCH ABIBB 4.125 01/15/2015 1.8 201008 B1 34.1 39.5 16% 38 45 7 -0.8 7.8 0 0.0 0.6
US12189LAC54 BURLINGTON NORTH BRK 5.050 03/01/2041 16.1 201301 B6 5.5 6.6 21% 146 160 14 5.0 9.0 61 0.3 0.5
US53217VAD10 LIFE TECH CORP LIFE 3.500 01/15/2016 2.7 201208 B2 13.3 16.9 27% 146 154 8 -1.1 9.1 47 0.1 0.7
US25243YAJ82 DIAGEO CAP PLC DIAG 5.500 09/30/2016 3.3 200705 B2 22.6 26.4 17% 60 71 11 -1.1 12.1 14 0.0 0.6US40053FAA66 GRUPO AVAL LTD GAA 5.250 02/01/2017 3.6 201208 B3 13.7 16.1 17% 254 277 23 2.1 20.9 41 0.2 0.6
Performance in March 2013 Alpha Factor Spread EDF

Generating Portfolio Outperformance Using Fair Value Spreads, April 2013 67
Appendix II
List of bonds in the HY portfolio
FVS
ISIN Issuer name bond details Dur.
When
the bond
entered
the
portfolio
Dur
(Buckets)
Beginnin
gEnd Chg
Beginnin
gEnd Chg
Avg
Chg by
Bucket -
Index
Column
N-OFVS CEDF LGD
US23327BAD55 DJO FINANCE LLC DJOGL 9.750 10/15/2017 3.5 201211 B3 28.6 28.4 -1% 983 780 -203 -21.0 -182.0 69 0.6 0.5
US37247DAG16 GENWORTH FINL GNW 6.150 11/15/2066 3.1 201301 B2 2.7 2.8 4% 971 847 -124 -26.8 -97.2 309 4.7 0.5
US302567AA03 FPL ENERGY AMER FPL 6.639 06/20/2023 3.7 201111 B3 25.8 8.1 -69% 636 530 -106 -21.0 -85.0 67 0.3 0.6
US428303AM35 HEXION US/NOVA HXN 9.000 11/15/2020 5.3 201301 B4 1.6 7.4 368% 959 872 -87 -13.6 -73.4 106 10.2 0.5
US23327BAM54 DJO FINANCE LLC DJOGL 9.875 04/15/2018 3.6 201303 B3 19.6 25.0 27% 729 637 -92 -21.0 -71.0 76 0.6 0.5
US10801PAA21 BRICKMAN GRP HLD BRKMAN 9.125 11/01/2018 2.9 201206 B2 21.6 71.6 232% 609 514 -95 -26.8 -68.2 134 0.3 0.9
US72347QAG82 PINNACLE FOOD FI PFHC 8.250 09/01/2017 2.0 201212 B1 32.4 67.6 108% 538 470 -68 -4.3 -63.7 73 0.3 0.5US052068AA16 AURORA USA OIL AAGLF 9.875 02/15/2017 2.8 201301 B2 7.5 5.8 -23% 663 575 -88 -26.8 -61.2 188 1.1 0.6
US00828DAN12 AFFINION GROUP I AFNGR 7.875 12/15/18 4.2 201205 B3 2.8 15.6 457% 1,318 1,236 -82 -21.0 -61.0 88 8.2 0.5
US398436AA34 GRIFOLS INC GRFSM 8.250 02/01/2018 1.2 201201 B1 57.7 46.7 -19% 379 317 -62 -4.3 -57.7 85 0.1 0.7
US89469AAA25 TREEHOUSE FOODS THS 7.750 03/01/2018 1.1 201008 B1 63.7 53.0 -17% 309 247 -62 -4.3 -57.7 78 0.1 0.6
US004010AA24 ACADEMY LTD ACASPO 9.250 08/01/2019 2.3 201112 B1 8.7 51.1 490% 471 412 -59 -4.3 -54.7 77 0.7 0.6
US422680AE80 HECKMANN CORP HEK 9.875 04/15/2018 3.7 201301 B3 2.4 6.9 188% 793 724 -69 -21.0 -48.0 238 3.7 0.6
US573334AB59 MRT MID PART/FIN MMLP 8.875 04/01/2018 2.1 201101 B1 24.9 36.7 48% 567 519 -48 -4.3 -43.7 99 0.3 0.6
US44965UAA25 ILFC E-CAP TRUST AIG 6.250 12/21/2065 2.5 201205 B1 27.7 27.5 -1% 880 833 -47 -4.3 -42.7 292 0.4 0.5
US24713EAC12 DELPHI CORP DLPH 5.875 05/15/2019 2.8 201303 B2 11.9 13.0 9% 285 216 -69 -26.8 -42.2 80 0.3 0.6
US952845AC98 WEST FRASER TIMB WFTCN 5.200 10/15/2014 1.5 200904 B1 23.6 21.7 -8% 230 184 -46 -4.3 -41.7 49 0.1 0.6
US05070GAA67 AUDATEX NORTH AM SLH 6.750 06/15/2018 2.1 201107 B1 29.6 44.8 51% 354 308 -46 -4.3 -41.7 98 0.1 0.6
US302941AJ84 FTI CONSULTING FCN 6.750 10/01/2020 4.9 201109 B4 6.7 7.1 6% 410 358 -52 -13.6 -38.4 126 0.7 0.6
US131477AE19 CALUMET SPECIAL CLMT 9.375 05/01/19 3.2 201202 B2 9.4 13.4 43% 556 492 -64 -26.8 -37.2 127 0.8 0.6
US554783AK62 MACMILLN BLOEDEL WY 7.700 02/15/2026 8.9 201001 B6 0.8 0.6 -21% 307 266 -41 -4.4 -36.6 197 1.6 0.9
US156700AJ51 CENTURYLINK INC CTL 5.000 02/15/2015 1.9 201105 B1 13.3 11.6 -12% 214 175 -39 -4.3 -34.7 43 0.2 0.7
US88362RAC16 THERMON INDUSTRI THR 9.500 05/01/17 1.1 201110 B1 72.0 101.2 41% 360 322 -38 -4.3 -33.7 86 0.1 0.4
US302941AK57 FTI CONSULTING FCN 6.000 11/15/2022 7.1 201212 B6 3.0 2.9 -2% 376 340 -36 -4.4 -31.6 148 1.2 0.6
US23327BAJ26 DJO FINANCE LLC ENMC 8.750 03/15/2018 2.7 201303 B2 19.1 22.2 16% 493 436 -57 -26.8 -30.2 77 0.4 0.5
US459745GM14 INTL LEASE FIN AIG 4.875 04/01/2015 2.0 201205 B1 13.4 12.1 -10% 246 212 -34 -4.3 -29.7 48 0.3 0.5
US75886AAE82 REGENCY ENERGY RGNC 6.875 2/01/2018 2.8 201211 B2 8.7 10.4 19% 352 296 -56 -26.8 -29.2 142 0.4 0.6
US65548QAA22 NORBORD DELAWARE NFCN 6.450 02/15/2017 3.4 201212 B2 5.6 5.3 -6% 356 300 -56 -26.8 -29.2 110 0.7 0.6
US29250RAK23 ENBRIDGE ENERGY EEP 8.050 10/01/2017 3.8 201207 B3 5.8 5.1 -13% 421 371 -50 -21.0 -29.0 248 0.5 0.6
US29270UAN54 ENERGY PARTNERS EPL 8.250 02/15/2018 3.8 201301 B3 5.4 6.1 13% 629 579 -50 -21.0 -29.0 205 1.3 0.6
US475793AA37 JELD-WEN ESCROW JELDWN 12.250 10/15/2017 1.5 201111 B1 34.9 34.5 -1% 439 406 -33 -4.3 -28.7 106 0.1 0.6
US26883DAA63 EPL OIL & GAS EPL 8.250 02/15/2018 3.8 201301 B3 5.5 6.1 11% 635 586 -49 -21.0 -28.0 205 1.3 0.6
US810186AH90 SCOTTS MIRACLE SMG 7.250 01/15/2018 1.2 201004 B1 39.4 33.8 -14% 353 321 -32 -4.3 -27.7 102 0.1 0.6
US29444UAJ51 EQUINIX INC EQIX 8.125 3/01/2018 1.0 201202 B1 12.2 2.3 -81% 114 83 -31 -4.3 -26.7 76 0.0 0.7
US527288BD58 LEUCADIA NATL LUK 8.125 09/15/2015 2.3 200810 B1 11.9 19.5 64% 249 218 -31 -4.3 -26.7 61 0.2 0.6
US811904AK78 SEACOR HOLDINGS CKH 7.375 10/01/2019 5.1 201108 B4 6.2 6.1 0% 511 472 -39 -13.6 -25.4 146 0.9 0.6
Alpha Factor Spread EDFPerformance in March 2013

Generating Portfolio Outperformance Using Fair Value Spreads, April 2013 68
Appendix II
List of bonds in the HY portfolio
FVS
ISIN Issuer name bond details Dur.
When
the bond
entered
the
portfolio
Dur
(Buckets)
Beginnin
gEnd Chg
Beginnin
gEnd Chg
Avg
Chg by
Bucket -
Index
Column
N-OFVS CEDF LGD
US422248AA22 HEALTH NET INC HNT 6.375 06/01/2017 3.7 200710 B3 3.2 3.2 0% 440 394 -46 -21.0 -25.0 133 1.8 0.5
US21036PAF53 CONSTELLATION BR STZ 7.250 05/15/2017 3.6 200807 B3 25.8 24.2 -6% 321 275 -46 -21.0 -25.0 54 0.2 0.6
US125577BA39 CIT GROUP INC CIT 5.250 04/01/2014 1.0 201203 B1 21.1 16.1 -23% 144 115 -29 -4.3 -24.7 5 0.1 0.5
US962166AS33 WEYERHAEUSER CO WY 7.125 07/15/2023 7.8 200909 B6 0.9 0.8 -11% 280 251 -29 -4.4 -24.6 175 1.3 0.9
US929160AP49 VULCAN MATERIALS VMC 10.125 12/15/2015 2.4 201204 B1 12.5 12.9 4% 411 383 -28 -4.3 -23.7 94 0.4 0.6
US21036PAG37 CONSTELLATION BR STZ 8.375 12/15/2014 1.7 200801 B1 50.1 47.9 -4% 206 178 -28 -4.3 -23.7 39 0.1 0.6
US747262AA15 QVC INC QVCN 7.500 0/01/2019 2.0 201205 B1 48.2 46.2 -4% 277 251 -26 -4.3 -21.7 59 0.1 0.6
US315292AM45 FERRELLGAS LP FGP 6.500 05/01/2021 6.0 201109 B5 2.3 1.6 -30% 480 449 -31 -11.3 -19.7 191 2.0 0.6
US256677AA32 DOLLAR GENERAL DG 4.125 07/15/2017 4.0 201209 B3 15.1 13.7 -9% 210 170 -40 -21.0 -19.0 39 0.2 0.6
US896818AF89 TRIUMPH GROUP TGI 8.625 07/15/2018 1.5 201011 B1 52.3 63.2 21% 308 286 -22 -4.3 -17.7 77 0.1 0.4
US058498AN67 BALL CORP BLL 7.375 9/01/2019 1.8 200909 B1 24.1 31.2 29% 221 200 -21 -4.3 -16.7 88 0.1 0.6
US35802XAF06 FRESENIUS MED FMEGR 5.875 01/31/2022 7.1 201206 B6 6.9 5.9 -15% 295 274 -21 -4.4 -16.6 70 0.5 0.7
US428302AD52 HEXION US FIN HXN 6.625 04/15/2020 5.5 201302 B4 0.8 4.0 385% 568 538 -30 -13.6 -16.4 109 10.5 0.5
US665828AD13 NORTHERN TIER EN NTI 7.125 11/15/2020 5.6 201301 B5 1.0 11.8 1110% 495 469 -26 -11.3 -14.7 96 6.9 0.6
US126634AA21 CVR REF/COFF FIN CVI 6.500 11/01/2022 7.0 201301 B6 1.8 1.6 -12% 466 447 -19 -4.4 -14.6 190 2.6 0.6
US29444UAK25 EQUINIX INC EQIX 7.000 07/15/2021 5.2 201202 B4 8.8 9.4 7% 361 333 -28 -13.6 -14.4 106 0.4 0.7
US217203AE82 COPANO ENERGY CPNO 7.125 04/01/2021 4.2 201106 B3 4.5 5.0 11% 252 217 -35 -21.0 -14.0 99 0.5 0.6
US27876GBH02 ECHOSTAR DBS DISH 7.750 05/31/2015 2.1 201205 B1 8.2 9.7 18% 241 223 -18 -4.3 -13.7 66 0.3 0.7
US459745FW05 INTL LEASE FIN AIG 8.625 09/15/2015 2.2 201205 B1 11.4 11.1 -3% 267 250 -17 -4.3 -12.7 59 0.3 0.5
US35803QAA58 FRESENIUS MED FMEGR 5.750 02/15/2021 6.5 201206 B6 8.4 7.4 -12% 301 285 -16 -4.4 -11.6 64 0.4 0.7
US35802XAD57 FRESENIUS MED FMEGR 5.625 07/31/2019 5.5 201206 B4 12.3 10.7 -14% 309 284 -25 -13.6 -11.4 53 0.3 0.7
US45169UAC99 IGATE CORP IGTE 9.000 05/01/2016 1.9 201208 B1 9.1 9.6 6% 439 424 -15 -4.3 -10.7 146 0.5 0.6
US30218AAB89 EXPRESS LLC EXPR 8.750 03/01/2018 1.0 201103 B1 24.1 19.6 -19% 341 326 -15 -4.3 -10.7 125 0.1 0.6
US88160QAB95 TES LOG LP/CORP TLLP 5.875 10/01/2020 5.7 201211 B5 3.3 5.1 55% 375 354 -21 -11.3 -9.7 138 1.1 0.6
US45974VB494 INTL LEASE FIN AIG 5.650 06/01/2014 1.2 201208 B1 20.0 20.9 4% 179 165 -14 -4.3 -9.7 27 0.1 0.5
US552081AD31 LYONDELLBASELL LYO 6.000 11/15/2021 7.0 201211 B6 2.3 2.8 21% 210 196 -14 -4.4 -9.6 82 0.9 0.6
US03077JAA88 AMERIGAS FINANCE APU 6.750 05/20/2020 5.0 201204 B4 6.6 6.6 0% 394 371 -23 -13.6 -9.4 114 0.7 0.6
US964152AB83 WHITE MOUNTAINS WTM 7.506 06/30/2017 3.7 201205 B3 29.4 27.1 -8% 564 534 -30 -21.0 -9.0 189 0.2 0.5
US18538RAE36 CLEARWATER PAPER CLW 7.125 11/01/2018 2.6 201303 B2 10.5 14.5 38% 361 326 -35 -26.8 -8.2 130 0.4 0.6
US864486AE55 SUBURBAN PROPANE SPH 7.500 10/01/2018 2.5 201301 B2 17.8 21.1 19% 407 372 -35 -26.8 -8.2 125 0.3 0.6
US26885GAA76 ERA GROUP INC CKH 7.750 12/15/2022 6.7 201301 B6 4.3 5.0 17% 574 562 -12 -4.4 -7.6 184 1.4 0.6
US84763BAA44 SPEC BND ES CORP SPB 6.375 11/15/2020 5.6 201212 B5 3.4 4.6 34% 384 366 -18 -11.3 -6.7 107 2.2 0.4
US35804GAF54 FRESENIUS US FIN FREGR 9.000 7/15/2015 2.2 201105 B1 30.8 30.4 -1% 228 217 -11 -4.3 -6.7 23 0.1 0.7
US35802XAA19 FRESENIUS MED FMEGR 6.500 09/15/2018 4.6 201206 B4 17.3 14.4 -17% 301 281 -20 -13.6 -6.4 43 0.2 0.7
US893647AP24 TRANSDIGM INC TDG 7.750 12/15/2018 2.5 201110 B1 27.8 32.2 16% 376 366 -10 -4.3 -5.7 72 0.2 0.4
US237266AD36 DARLING INTL DAR 8.500 12/15/2018 1.9 201109 B1 16.3 18.4 13% 265 256 -9 -4.3 -4.7 101 0.2 0.6
Alpha Factor Spread EDFPerformance in March 2013

Generating Portfolio Outperformance Using Fair Value Spreads, April 2013 69
Appendix II
List of bonds in the HY portfolio FVS
ISIN Issuer name bond details Dur.
When
the bond
entered
the
portfolio
Dur
(Buckets)
Beginnin
gEnd Chg
Beginnin
gEnd Chg
Avg
Chg by
Bucket -
Index
Column
N-OFVS CEDF LGD
US435765AD40 HOLLY ENERGY PAR HEP 8.250 03/15/18 1.1 201109 B1 64.6 66.5 3% 358 349 -9 -4.3 -4.7 107 0.1 0.6
US84763BAC00 SPEC BND ES CORP SPB 6.625 11/15/2022 6.6 201212 B6 2.4 3.3 36% 369 360 -9 -4.4 -4.6 117 2.8 0.4
US125581GM42 CIT GROUP INC CIT 5.000 05/15/2017 3.8 201206 B3 4.8 4.2 -11% 278 254 -24 -21.0 -3.0 53 0.9 0.5
US421924BG51 HEALTHSOUTH CORP HLS 8.125 02/15/2020 3.2 201003 B2 6.4 7.7 20% 427 398 -29 -26.8 -2.2 194 0.5 0.7
US55342UAD63 MPT OP PTNR/FINL MPW 6.375 02/15/2022 6.2 201301 B5 2.4 3.6 53% 365 352 -13 -11.3 -1.7 162 1.0 0.9
US058498AQ98 BALL CORP BLL 5.750 05/15/2021 5.0 201102 B4 5.8 8.0 37% 268 253 -15 -13.6 -1.4 107 0.5 0.6
US78401FAD96 SBA TELECOM INC SBAC 8.250 08/15/2019 1.8 201203 B1 23.3 29.5 27% 331 326 -5 -4.3 -0.7 119 0.1 0.7
US110394AE39 BRISTOW GROUP IN BRS 6.250 10/15/2022 6.6 201212 B6 2.3 3.4 47% 335 330 -5 -4.4 -0.6 148 1.3 0.6
US896818AG62 TRIUMPH GROUP TGI 4.875 04/01/2021 6.6 201303 B6 4.9 5.9 21% 331 326 -5 -4.4 -0.6 107 1.0 0.4
US030981AG93 AMERIGAS PARTNER APU 6.250 08/20/2019 4.5 201109 B4 7.6 7.9 5% 380 366 -14 -13.6 -0.4 108 0.6 0.6
US552704AB48 MEG ENERGY CORP MEGCN 6.375 01/30/2023 7.0 201301 B6 1.8 1.7 -6% 405 401 -4 -4.4 0.4 173 2.1 0.6
US248019AQ46 DELUXE CORP DLX 6.000 11/15/2020 5.9 201301 B5 2.2 2.5 17% 431 421 -10 -11.3 1.3 210 1.5 0.7
US03077JAB61 AMERIGAS FINANCE APU 7.000 05/20/2022 6.1 201206 B5 4.7 4.7 0% 404 394 -10 -11.3 1.3 129 1.0 0.6
US81725WAF05 SENSATA TECH BV ST 6.500 05/15/2019 3.8 201212 B3 24.4 35.5 45% 364 345 -19 -21.0 2.0 71 0.3 0.4
US864486AC99 SUBURBAN PROPANE SPH 7.375 03/15/2020 3.8 201008 B3 10.0 11.3 13% 433 414 -19 -21.0 2.0 143 0.5 0.6
US169905AD87 CHOICE HOTELS CHH 5.700 08/28/2020 6.2 201208 B5 1.6 1.5 -4% 299 290 -9 -11.3 2.3 154 1.4 0.6
US532716AS62 LIMITED BRANDS LTD 7.000 05/01/2020 5.7 201111 B5 3.4 3.0 -11% 327 318 -9 -11.3 2.3 112 1.0 0.6
US532716AL10 LIMITED BRANDS LTD 5.250 11/01/2014 1.6 200901 B1 10.3 9.9 -5% 152 150 -2 -4.3 2.3 43 0.2 0.6
US929160AR05 VULCAN MATERIALS VMC 7.500 06/15/2021 6.4 201301 B5 1.4 1.5 8% 355 347 -8 -11.3 3.3 190 1.9 0.6
US913456AG47 UNIVERSAL CORP UVV 6.250 12/01/2014 1.7 201005 B1 14.6 14.6 0% 148 147 -1 -4.3 3.3 50 0.1 0.6
US494553AC44 KINDER MORGAN KMI 5.150 03/01/2015 1.9 201104 B1 17.3 23.6 37% 173 172 -1 -4.3 3.3 24 0.1 0.6
US52471TAA51 LEGACY RES/FIN C LGCY 8.000 12/01/2020 5.5 201301 B5 1.9 2.0 4% 610 603 -7 -11.3 4.3 226 3.4 0.6
US681936AZ39 OMEGA HEALTHCARE OHI 5.875 03/15/2024 7.0 201301 B6 1.1 0.8 -27% 286 286 0 -4.4 4.4 153 1.4 0.9
US117043AE96 BRUNSWICK CORP BC 7.375 09/01/2023 7.5 201203 B6 1.6 2.0 23% 469 469 0 -4.4 4.4 176 4.9 0.4
US532716AU19 LIMITED BRANDS LTD 5.625 02/15/2022 7.2 201204 B6 2.2 2.0 -8% 324 324 0 -4.4 4.4 132 1.4 0.6
US82967NAG34 SIRIUS XM RADIO SIRI 5.250 08/15/2022 7.2 201301 B6 1.9 2.9 54% 321 321 0 -4.4 4.4 147 1.3 0.7
US530715AD31 LIBERTY MEDIA LIBERT 8.500 07/15/2029 9.3 200702 B6 8.7 8.5 -2% 502 502 0 -4.4 4.4 100 0.8 0.6
US14987BAC72 CC HOLDINGS GS V CCI 3.849 04/15/2023 8.5 201302 B6 6.3 6.3 0% 193 194 1 -4.4 5.4 51 0.4 0.5
US48123VAB80 J2 GLOBAL COMM JCOM 8.000 08/01/2020 5.3 201303 B4 6.5 7.7 18% 555 547 -8 -13.6 5.6 149 0.9 0.7
US27876GAY44 ECHOSTAR DBS DISH 6.625 10/01/2014 1.5 201208 B1 11.1 14.3 29% 205 207 2 -4.3 6.3 53 0.2 0.7
US254067AN14 DILLARDS INC DDS 7.000 12/01/2028 9.8 200810 B6 1.6 1.5 -6% 413 415 2 -4.4 6.4 205 2.1 0.6
US67059TAC99 NUSTAR LOGISTICS NSUS 4.750 02/01/2022 7.3 201210 B6 2.6 2.8 6% 352 354 2 -4.4 6.4 136 1.3 0.6
US254067AH46 DILLARDS INC DDS 7.130 08/01/2018 4.6 200706 B4 5.0 4.8 -5% 339 332 -7 -13.6 6.6 121 0.7 0.6
US32055RAR84 FIRST IND LP FR 5.950 05/15/2017 3.7 201202 B3 11.8 17.5 48% 328 314 -14 -21.0 7.0 58 0.3 0.9
US532716AR89 LIMITED BRANDS LTD 8.500 06/15/2019 5.0 201012 B4 4.5 4.1 -9% 337 331 -6 -13.6 7.6 101 0.9 0.6
US444454AA09 HUGHES SATELLITE SATS 7.625 06/15/2021 6.3 201206 B5 2.9 4.0 41% 408 405 -3 -11.3 8.3 153 1.4 0.6
Alpha Factor Spread EDFPerformance in March 2013

Generating Portfolio Outperformance Using Fair Value Spreads, April 2013 70
Appendix II
List of bonds in the HY portfolio FVS
ISIN Issuer name bond details Dur.
When
the bond
entered
the
portfolio
Dur
(Buckets)
Beginnin
gEnd Chg
Beginnin
gEnd Chg
Avg
Chg by
Bucket -
Index
Column
N-OFVS CEDF LGD
US421924BH35 HEALTHSOUTH CORP HLS 7.250 10/01/2018 2.5 201105 B1 8.2 9.9 21% 379 383 4 -4.3 8.3 167 0.4 0.7
US21036PAH10 CONSTELLATION BR STZ 6.000 05/01/2022 7.2 201301 B6 5.9 6.7 12% 312 316 4 -4.4 8.4 93 0.6 0.6
US00508XAF15 ACTUANT CORP ATU 5.625 06/15/2022 6.8 201301 B6 7.5 10.5 40% 335 339 4 -4.4 8.4 99 0.8 0.4
US125577BC94 CIT GROUP INC CIT 6.625 04/01/2018 4.3 201203 B3 3.7 3.2 -12% 293 281 -12 -21.0 9.0 69 1.1 0.5
US03232PAA66 AMSURG CORP AMSG 5.625 11/30/2020 5.7 201301 B5 3.2 3.3 3% 332 330 -2 -11.3 9.3 124 1.0 0.7
US893647AQ07 TRANSDIGM INC TDG 5.500 10/15/2020 5.7 201211 B5 5.8 6.2 6% 341 339 -2 -11.3 9.3 88 1.0 0.4
US444454AB81 HUGHES SATELITE SATS 6.500 06/15/2019 5.2 201206 B4 3.5 4.9 40% 372 368 -4 -13.6 9.6 135 1.1 0.6
US92552VAF76 VIASAT INC VSAT 6.875 06/15/2020 5.2 201210 B4 7.4 10.3 38% 423 419 -4 -13.6 9.6 124 0.6 0.6
US25470XAB10 DISH DBS CORP DISH 7.875 09/01/2019 5.3 201206 B4 2.0 2.7 37% 353 350 -3 -13.6 10.6 169 1.3 0.7
US058498AR71 BALL CORP BLL 5.000 03/15/2022 7.3 201204 B6 3.4 4.5 34% 281 288 7 -4.4 11.4 116 0.8 0.6
US40537QAA85 HALCON RESOURCES HALCON 9.750 07/15/2020 4.7 201210 B4 0.7 2.2 223% 636 634 -2 -13.6 11.6 349 7.0 0.6
US530715AJ01 LIBERTY MEDIA LIBERT 8.250 02/01/2030 9.6 200702 B6 7.8 7.8 0% 479 487 8 -4.4 12.4 102 0.8 0.6
US131477AH40 CALUMET SPECIAL CLMT 9.625 08/01/2020 4.6 201301 B4 5.1 6.9 35% 570 569 -1 -13.6 12.6 144 1.4 0.6
US32055RAN70 FIRST IND LP FR 5.750 01/15/2016 2.6 201204 B2 18.7 27.3 46% 306 292 -14 -26.8 12.8 39 0.2 0.9
US483007AE05 KAISER ALUMINUM KALU 8.250 06/01/2020 4.5 201301 B3 3.0 4.3 43% 452 444 -8 -21.0 13.0 213 1.3 0.6
US49456AAA16 KINDER MORGAN KMI 6.000 01/15/2018 4.3 201104 B3 8.4 11.3 35% 294 286 -8 -21.0 13.0 68 0.4 0.6
US23918KAL26 DAVITA INC DVA 6.375 11/01/2018 1.4 201101 B1 79.1 78.7 -1% 306 315 9 -4.3 13.3 51 0.0 0.7
US23918KAP30 DAVITA INC DVA 5.750 08/15/2022 7.0 201212 B6 7.0 6.3 -11% 338 347 9 -4.4 13.4 84 0.5 0.7
US21871DAC74 CORELOGIC INC CLGX 7.250 06/01/2021 5.0 201301 B4 3.7 3.4 -7% 368 368 0 -13.6 13.6 163 0.9 0.6
US78401FAE79 SBA TELECOM INC SBAC 5.750 07/15/2020 5.7 201211 B5 4.2 4.9 18% 370 373 3 -11.3 14.3 134 0.8 0.7
US570362AB92 MARITIME & NORTH MNPIPE 7.500 05/31/2014 1.2 201301 B1 106.5 131.1 23% 343 353 10 -4.3 14.3 8 0.0 0.6
US156686AJ67 CENTURY TEL ENTP CTL 7.200 12/01/2025 8.4 201108 B6 1.8 2.0 15% 470 480 10 -4.4 14.4 205 2.2 0.7
US21036PAD06 CONSTELLATION BR STZ 7.250 9/01/2016 3.1 200701 B2 27.3 29.5 8% 274 262 -12 -26.8 14.8 50 0.1 0.6
US30257GAA94 FPL ENERGY NATL FPL 5.608 03/10/2024 3.7 201112 B3 23.4 22.7 -3% 570 564 -6 -21.0 15.0 67 0.3 0.6
US929160AM18 VULCAN MATERIALS VMC 10.375 12/15/2018 4.4 201301 B3 7.0 7.7 10% 595 590 -5 -21.0 16.0 145 1.1 0.6
US629377BT80 NRG ENERGY INC NRG 6.625 03/15/2023 6.7 201301 B6 0.8 0.8 -7% 382 394 12 -4.4 16.4 185 3.7 0.6
US315295AE59 FERRELLGAS FGP 8.625 6/15/2020 5.2 201008 B4 5.4 4.3 -20% 709 712 3 -13.6 16.6 174 1.6 0.6
US37185LAB80 GENESIS ENERGY GELX 7.875 12/15/2018 2.6 201201 B2 50.8 63.9 26% 389 379 -10 -26.8 16.8 83 0.1 0.6
US25470XAE58 DISH DBS CORP DISH 6.750 06/01/2021 6.4 201301 B5 1.3 1.9 48% 364 370 6 -11.3 17.3 201 1.8 0.7
US796038AA56 SAMSON INVESTMEN SAIVST 9.750 02/15/2020 4.7 201205 B4 4.2 22.1 425% 721 725 4 -13.6 17.6 80 2.4 0.6
US37185LAD47 GENESIS ENERGY GEL 5.750 02/15/2021 6.2 201303 B5 10.2 12.4 21% 371 378 7 -11.3 18.3 112 0.4 0.6
US78388JAP12 SBA COMMUNICATIO SBAC 5.625 10/01/2019 5.3 201211 B4 5.3 6.0 12% 394 399 5 -13.6 18.6 124 0.7 0.7
US84762LAJ44 SPECTRUM BRANDS SPB 6.750 03/15/2020 4.4 201205 B3 5.1 6.2 24% 387 385 -2 -21.0 19.0 101 1.5 0.4
US284902AC70 ELDORADO CORP ELDCN 6.125 12/15/2020 5.9 201301 B5 1.8 1.5 -13% 402 410 8 -11.3 19.3 160 2.3 0.6
US125581GE26 CIT GROUP INC CIT 4.750 02/15/2015 1.9 201203 B1 10.7 12.1 14% 176 191 15 -4.3 19.3 16 0.3 0.5
US055381AS68 BE AEROSPACE BEAV 5.250 04/01/2022 6.7 201204 B6 2.2 2.9 32% 299 314 15 -4.4 19.4 155 1.0 0.6
Alpha Factor Spread EDFPerformance in March 2013

Generating Portfolio Outperformance Using Fair Value Spreads, April 2013 71
Appendix II
List of bonds in the HY portfolio
FVS
ISIN Issuer name bond details Dur.
When
the bond
entered
the
portfolio
Dur
(Buckets)
Beginnin
gEnd Chg
Beginnin
gEnd Chg
Avg
Chg by
Bucket -
Index
Column
N-OFVS CEDF LGD
US058498AP16 BALL CORP BLL 6.750 09/15/2020 3.2 201009 B2 13.0 17.8 36% 257 250 -7 -26.8 19.8 98 0.2 0.6
US226373AF52 CRSTWD PART/FIN CMLP 7.750 04/01/2019 4.3 201212 B3 6.0 6.3 6% 574 573 -1 -21.0 20.0 132 1.2 0.6
US156700AQ94 CENTURYLINK INC CTL 5.150 06/15/2017 3.8 201108 B3 5.8 6.5 11% 321 320 -1 -21.0 20.0 90 0.6 0.7
US27876GBE70 ECHOSTAR DBS DISH 7.125 02/01/2016 2.7 201205 B2 6.2 7.8 27% 271 265 -6 -26.8 20.8 84 0.4 0.7
US335934AA33 FIRST QUANTUM FMCN 7.250 10/15/2019 5.1 201301 B4 3.8 4.4 14% 611 619 8 -13.6 21.6 196 1.8 0.6
US471109AE80 JARDEN CORP JAH 6.125 11/15/2022 5.5 201212 B4 3.5 4.5 29% 285 293 8 -13.6 21.6 132 0.7 0.6
US49455WAD83 KINDER MORGAN KMI 5.700 01/05/2016 2.6 201104 B2 13.3 17.9 35% 212 207 -5 -26.8 21.8 36 0.2 0.6
US98372PAJ75 XL GROUP PLC XL 6.500 04/15/2017 3.5 201206 B2 11.1 12.0 8% 665 661 -4 -26.8 22.8 244 0.7 0.5
US156700AR77 CENTURYLINK INC CTL 6.450 06/15/2021 6.5 201110 B5 2.3 2.7 18% 400 413 13 -11.3 24.3 165 1.5 0.7
US785583AG03 SABINE PASS LNG LNG 7.500 11/30/2016 3.2 201111 B2 10.3 6.7 -34% 535 533 -2 -26.8 24.8 173 0.5 0.6
US747262AE37 QVC INC QVCN 7.375 0/15/2020 3.3 201205 B2 28.3 30.4 8% 311 309 -2 -26.8 24.8 67 0.1 0.6
US05508RAD89 B&G FOODS INC BGF 7.625 01/15/2018 1.0 201201 B1 36.3 34.8 -4% 326 348 22 -4.3 26.3 121 0.1 0.6
US37045XAD84 GEN MOTORS FIN GM 4.750 08/15/2017 4.0 201211 B3 4.9 5.3 9% 300 306 6 -21.0 27.0 72 0.8 0.6
US109043AG42 BRIGGS&STRATTON BGG 6.875 12/15/2020 6.2 201201 B5 3.8 5.8 54% 352 368 16 -11.3 27.3 125 1.6 0.4
US60877UBA43 MOMENTIVE PERFOR MOMENT 10.000 10/15/2020 5.0 201302 B4 1.5 8.1 453% 864 878 14 -13.6 27.6 103 9.8 0.5
US929160AK51 VULCAN MATERIALS VMC 7.000 06/15/2018 4.5 201301 B3 2.7 3.2 18% 324 331 7 -21.0 28.0 144 1.1 0.6
US79546VAJ52 SALLY HLD/SAL CA SBH 5.750 06/01/2022 6.6 201206 B6 3.9 4.6 17% 318 342 24 -4.4 28.4 118 0.8 0.6
US681904AM08 OMNICARE INC OCR 7.750 06/01/2020 3.4 201009 B2 10.0 12.8 28% 363 366 3 -26.8 29.8 118 0.4 0.6
US435765AE23 HOLLY ENERGY PAR HEP 6.500 03/01/2020 4.9 201204 B4 5.6 5.8 4% 384 403 19 -13.6 32.6 141 0.7 0.6
US879369AB25 TELEFLEX INC TFX 6.875 06/01/2019 3.6 201107 B3 19.6 23.2 18% 356 370 14 -21.0 35.0 102 0.2 0.7
US471109AD08 JARDEN CORP JAH 7.500 01/15/2020 3.0 201212 B2 16.9 21.5 27% 370 380 10 -26.8 36.8 102 0.3 0.6
US099599AJ16 BORDEN INC HXN 7.875 02/15/2023 6.3 201205 B5 1.4 7.3 412% 1,045 1,072 27 -11.3 38.3 124 12.1 0.5
US718592AK49 PHILLIPS-VAN HEU PVH 7.375 05/15/2020 3.1 201008 B2 14.2 14.7 4% 277 292 15 -26.8 41.8 91 0.2 0.6
US23918KAM09 DAVITA INC DVA 6.625 11/01/2020 3.6 201012 B3 20.7 19.1 -8% 304 326 22 -21.0 43.0 68 0.2 0.7
US15721AAC71 CEVA GROUP PLC TNTLOG 11.625 10/01/2016 2.3 201301 B1 83.9 82.2 -2% 906 945 39 -4.3 43.3 85 0.2 0.6
US88947EAH36 TOLL BR FIN CORP TOL 8.910 10/15/2017 3.8 201205 B3 4.4 5.1 14% 242 269 27 -21.0 48.0 91 0.5 0.6
US37045XAB29 GEN MOTORS FIN GM 6.750 06/01/2018 4.5 201206 B3 3.3 4.0 23% 280 312 32 -21.0 53.0 84 1.0 0.6
US60877UAW71 MOMENTIVE PERFOR MOMENT 9.000 01/15/2021 5.1 201208 B4 2.2 12.7 468% 1,281 1,321 40 -13.6 53.6 104 9.9 0.5
US615394AJ24 MOOG INC MOG 7.250 6/15/2018 0.3 200909 B1 20.7 46.7 126% 221 278 57 -4.3 61.3 120 0.1 0.4
US29264FAG19 ENDO PHARMA HLDG ENDP 7.000 07/15/2019 3.9 201201 B3 2.3 1.9 -17% 383 432 49 -21.0 70.0 184 1.3 0.7
US293791AV15 ENTERPRISE PRODU EPD 8.375 08/01/2016 5.7 201207 B5 3.2 39.8 1131% 245 314 69 -11.3 80.3 186 0.3 0.6
US67051XAA28 NUFARM AUS LTD NUFARM 6.375 10/15/2019 5.0 201301 B4 5.0 3.5 -30% 409 481 72 -13.6 85.6 132 0.9 0.6
US26613TAC45 DUPONT FABROS TE DFT 8.500 12/15/2017 0.8 201009 B1 24.9 39.1 57% 255 346 91 -4.3 95.3 61 0.1 0.9
US293791AW97 ENTERPRISE PRODU EPD 7.034 01/15/2018 8.2 201205 B6 0.4 16.9 4263% 175 269 94 -4.4 98.4 163 0.5 0.6
US04878QAR48 ATLANTIC POWER ATPCN 9.000 11/15/2018 3.1 201210 B2 2.5 0.1 -98% 580 687 107 -26.8 133.8 251 2.1 0.6US29379VAN38 ENTERPRISE PRODU EPD 7.000 06/01/2017 8.5 201208 B6 2.0 46.1 2156% 265 428 163 -4.4 167.4 195 0.5 0.6
Alpha Factor Spread EDFPerformance in March 2013

Generating Portfolio Outperformance Using Fair Value Spreads, April 2013 72
© 2013 Moody’s Analytics, Inc. and/or its licensors and aff iliates (collectively, “MOODY’S”). All rights reserved. ALL INFORMATION CONTAINED HEREIN IS PROTECTED BY
COPYRIGHT LAW AND NONE OF SUCH INFORMATION MAY BE COPIED OR OTHERWISE REPRODUCED, REPACKAGED, FURTHER TRANSMITTED, TRANSFERRED,
DISSEMINATED, REDISTRIBUTED OR RESOLD, OR STORED FOR SUBSEQUENT USE FOR ANY SUCH PURPOSE, IN WHOLE OR IN PART, IN ANY FORM OR MANNER OR
BY ANY MEANS WHATSOEVER, BY ANY PERSON WITHOUT MOODY’S PRIOR WRITTEN CONSENT. All information contained herein is obtained by MOODY’S from sources
believed by it to be accurate and reliable. Because of the possibility of human or mechanical error as w ell as other factors, however, all information contained herein is provided “AS IS” w ithout warranty of any kind. Under no circumstances shall MOODY’S have any liability to any person or entity for (a) any loss or damage in w hole or in part caused by, resulting
from, or relating to, any error (negligent or otherw ise) or other circumstance or contingency within or outside the control of MOODY’S or any of its directors, off icers, employees or
agents in connection w ith the procurement, collection, compilation, analysis, interpretation, communication, publication or delivery of any such information, or (b) any direct, indirect,
special, consequential, compensatory or incidental damages w hatsoever (including without limitation, lost profits), even if MOODY’S is advised in advance of the possibility of such
damages, resulting from the use of or inability to use, any such information. The ratings, f inancial reporting analysis, projections, and other observations, if any, constituting part of the information contained herein are, and must be construed solely as, statements of opinion and not statements of fact or recommendations to purchase, sell or hold any securities.
NO WARRANTY, EXPRESS OR IMPLIED, AS TO THE ACCURACY, TIMELINESS, COMPLETENESS, MERCHANTABILITY OR FITNESS FOR ANY PARTICULAR PURPOSE OF
ANY SUCH RATING OR OTHER OPINION OR INFORMATION IS GIVEN OR MADE BY MOODY’S IN ANY FORM OR MANNER WHATSOEVER. Each rating or other opinion must
be w eighed solely as one factor in any investment decision made by or on behalf of any user of the information contained herein, and each such user must accordingly make its ow n
study and evaluation of each security and of each issuer and guarantor of, and each provider of credit support for, each security that it may consider purchasing, holding, or selling.