
Generalized Application of the Project Definition Rating ... · Generalized Application of the...
19
Generalized Application of the Project Definition Rating Index Sarel J Lotz Manager: Systems Engineering, ArioGenix [email protected]; 0824554726 Copyright © 2015 by SJ Lotz. Published and used by INCOSE with permission. Abstract. Incomplete or poor project scope 1 definition is widely accepted as one of the leading causes of project failure to deliver on the agreed cost, schedule and required operational capabilities. This is a well-accepted fact in the construction industry especially in the case of capital projects 2 . The construction, mining, power generation and the space industries all have made a concerted effort to mitigate these project risks by determining the maturity of the project scope definition during the initial phases of the project generally referred to as Front-end-loading (FEL). A tool referred to as the Project Definition Rating Index (PDRI) was developed to address scope risk for construction projects [1]. This paper proposes that the PDRI methodology can be applied to projects other than construction projects through tailoring of the index to suit the project type. Introduction ‘Does this project sound familiar? The project has vaguely-written scope definitions; there are problems in gathering user requirements; there is pressure to execute before the project is adequately defined; there is no rigorous scope management. This is one of the classic cases of project failure waiting to happen. It may sound trite, yet project scope must be clear, concise, and unambiguous. It must be clearly and commonly understood by project stakeholders, team members, and executives alike.’ [2] The CHAOS Report of 2003 [3] presents results of a study conducted by the Standish Group on IT projects: • 31.1% of IT projects will be cancelled before they ever get completed. • 52.7% of IT projects will cost 189% of their original estimates. • On the success side, the average is only 16.2% for software projects that are completed on-time and on-budget. In the larger companies, the news is even worse: only 9% of their projects come in on-time and on-budget'. From the Chaos Report of 2014 [4]: • About 21% of IT projects are cancelled before completion (-9% compared to 2004) • About 42% of IT projects are challenged (-10% compared to 2004) • About 37% of IT projects are completed on-time and on-budget (+11% compared to 2004) 1 The work performed to deliver a product, service, or result with the specified features and functions. A Guide to the Project Management Body of Knowledge (PMBOK® Guide) - Fifth Edition. 2 A long-term investment made in order to build upon, add or improve on a capital-intensive project. A capital project is any undertaking which requires the use of notable amounts of capital, both financial and labor, to undertake and complete. Capital projects are often defined by their large scale and large cost relative to other investments requiring less planning and resources. http://www.investopedia.com/terms/c/capital-project.asp
Transcript of Generalized Application of the Project Definition Rating ... · Generalized Application of the...
G e n e r a l i z e d A p p l i c a t i o n o f t h e P r o j e c t
D e f i n i t i o n R a t i n g I n d e x Sarel J Lotz
Manager: Systems Engineering, ArioGenix [email protected]; 0824554726
Copyright © 2015 by SJ Lotz. Published and used by INCOSE with permission.
Abstract. Incomplete or poor project scope1 definition is widely accepted as one of the leading causes of project failure to deliver on the agreed cost, schedule and required operational capabilities. This is a well-accepted fact in the construction industry especially in the case of capital projects2. The construction, mining, power generation and the space industries all have made a concerted effort to mitigate these project risks by determining the maturity of the project scope definition during the initial phases of the project generally referred to as Front-end-loading (FEL). A tool referred to as the Project Definition Rating Index (PDRI) was developed to address scope risk for construction projects [1].
This paper proposes that the PDRI methodology can be applied to projects other than construction projects through tailoring of the index to suit the project type.
Introduction
‘Does this project sound familiar? The project has vaguely-written scope definitions; there are problems in gathering user requirements; there is pressure to execute before the project is adequately defined; there is no rigorous scope management. This is one of the classic cases of project failure waiting to happen. It may sound trite, yet project scope must be clear, concise, and unambiguous. It must be clearly and commonly understood by project stakeholders, team members, and executives alike.’ [2] The CHAOS Report of 2003 [3] presents results of a study conducted by the Standish Group on IT projects:
• 31.1% of IT projects will be cancelled before they ever get completed. • 52.7% of IT projects will cost 189% of their original estimates. • On the success side, the average is only 16.2% for software projects that are completed
on-time and on-budget. In the larger companies, the news is even worse: only 9% of their projects come in on-time and on-budget'.
From the Chaos Report of 2014 [4]: • About 21% of IT projects are cancelled before completion (-9% compared to 2004) • About 42% of IT projects are challenged (-10% compared to 2004) • About 37% of IT projects are completed on-time and on-budget (+11% compared to 2004)
1 The work performed to deliver a product, service, or result with the specified features and functions. A Guide to the Project Management Body of Knowledge (PMBOK® Guide) - Fifth Edition. 2 A long-term investment made in order to build upon, add or improve on a capital-intensive project. A capital project is any undertaking which requires the use of notable amounts of capital, both financial and labor, to undertake and complete. Capital projects are often defined by their large scale and large cost relative to other investments requiring less planning and resources. http://www.investopedia.com/terms/c/capital-project.asp
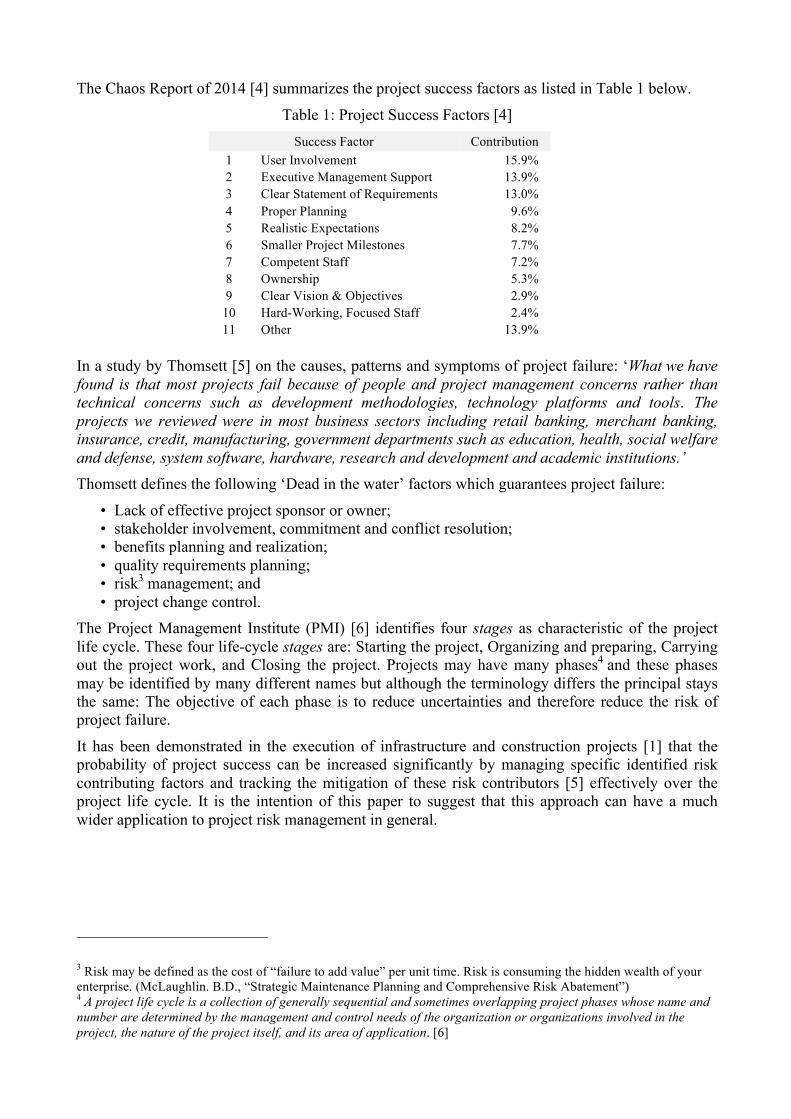
The Chaos Report of 2014 [4] summarizes the project success factors as listed in Table 1 below.
Table 1: Project Success Factors [4] Success Factor Contribution
1 User Involvement 15.9% 2 Executive Management Support 13.9% 3 Clear Statement of Requirements 13.0% 4 Proper Planning 9.6% 5 Realistic Expectations 8.2% 6 Smaller Project Milestones 7.7% 7 Competent Staff 7.2% 8 Ownership 5.3% 9 Clear Vision & Objectives 2.9%
10 Hard-Working, Focused Staff 2.4% 11 Other 13.9%
In a study by Thomsett [5] on the causes, patterns and symptoms of project failure: ‘What we have found is that most projects fail because of people and project management concerns rather than technical concerns such as development methodologies, technology platforms and tools. The projects we reviewed were in most business sectors including retail banking, merchant banking, insurance, credit, manufacturing, government departments such as education, health, social welfare and defense, system software, hardware, research and development and academic institutions.’ Thomsett defines the following ‘Dead in the water’ factors which guarantees project failure:
• Lack of effective project sponsor or owner; • stakeholder involvement, commitment and conflict resolution; • benefits planning and realization; • quality requirements planning; • risk3 management; and • project change control.
The Project Management Institute (PMI) [6] identifies four stages as characteristic of the project life cycle. These four life-cycle stages are: Starting the project, Organizing and preparing, Carrying out the project work, and Closing the project. Projects may have many phases4 and these phases may be identified by many different names but although the terminology differs the principal stays the same: The objective of each phase is to reduce uncertainties and therefore reduce the risk of project failure.
It has been demonstrated in the execution of infrastructure and construction projects [1] that the probability of project success can be increased significantly by managing specific identified risk contributing factors and tracking the mitigation of these risk contributors [5] effectively over the project life cycle. It is the intention of this paper to suggest that this approach can have a much wider application to project risk management in general.
3 Risk may be defined as the cost of “failure to add value” per unit time. Risk is consuming the hidden wealth of your enterprise. (McLaughlin. B.D., “Strategic Maintenance Planning and Comprehensive Risk Abatement”) 4 A project life cycle is a collection of generally sequential and sometimes overlapping project phases whose name and number are determined by the management and control needs of the organization or organizations involved in the project, the nature of the project itself, and its area of application. [6]
Background
Construction Industry Institute (CII) Research Team 268 [7], based at the University of Texas, USA, was given the task to complete the development of the PDRI tool [Front End Planning tool] for infrastructure projects5.
The CII research team was to develop a tool that would significantly enhance the project team environment in the infrastructure6 industry by doing the following:
• Improve predictability of project parameters. • Reduce the cost of design and construction. • Preserve schedule. • Reduce risk during project execution. • Improve project team alignment and communication. • Assure customer satisfaction. • Improve the probability of a successful project.
The PDRI is essentially a risk management tool that identifies and measures risks related to project scope definition in support of the Project Manager. Research conducted by the CII Pre-Project Planning Research Team [8] indicates that well-performed pre-project planning can:
• reduce total project design and construction costs by as much as 20 percent (versus authorization estimate),
• reduce total project design and construction schedule by as much as 39 percent (versus authorization estimate),
• improve project predictability in terms of cost, schedule, and operating performance, • increase the chance of the project meeting environmental and social goals.
The Construction Industry Institute (CII) has benchmarked over $96 billion in capital projects [10], showing up to:
• 25% Cost Savings • 17% Schedule Reduction
The results obtained through applying the PDRI methodology is well proven [1], [7] and it is clear that infrastructure type projects benefits from this approach by reducing project risks significantly and thus increase the probability of project success.
The US DOE [11], NASA [12], ESKOM [13], Chang et al [14] and Project Auditors, LLC [18] have developed similar indexes based on the PDRI methodology.
5 “An infrastructure project is defined as a capital project that provides transportation, transmission, distribution, collection or other capabilities supporting commerce or interaction of goods, service, or people. Infrastructure projects generally impact multiple jurisdictions, stakeholder groups and/or a wide area. They are characterized as projects with a primary purpose that is integral to the effective operation of a system. These collective capabilities provide a service and are made up of nodes and vectors into a grid or system (e.g., pipelines (vectors) connected with a water treatment plant (node))”[7] 6 A long-term investment made in order to build upon, add or improve on a capital-intensive project. A capital project is any undertaking which requires the use of notable amounts of capital, both financial and labor, to undertake and complete. Capital projects are often defined by their large scale and large cost relative to other investments requiring less planning and resources.
Project Definition Rating Methodology
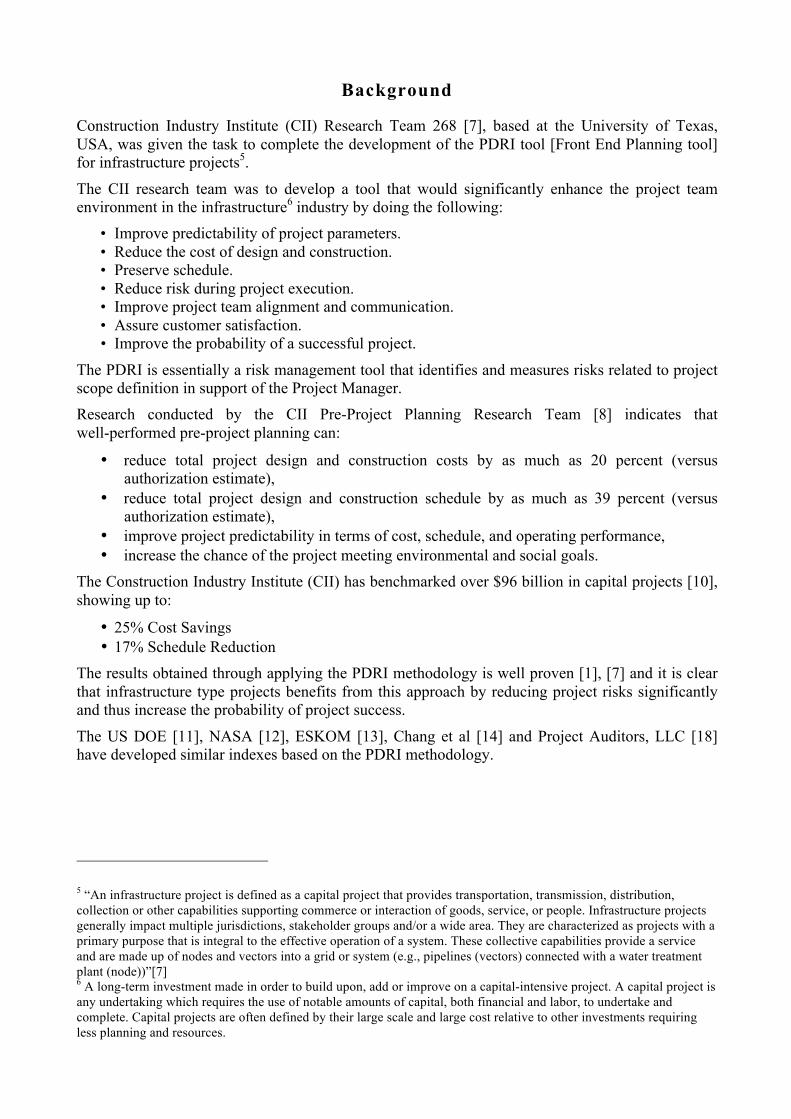
Construction Industry Institute A summary of the different PDRIs and its application, as developed by CII [1], are depicted in the Table 2 [7] below. Typically when the interest is a new processing plant the Industrial PDRI is the one to use, the Building PDRI applies to a new office block or equivalent and the Infrastructure PDRI would be suitable when a new bridge, pipeline or transmission line is to be designed and constructed.
Table 2: Considerations selecting a PDRI index [7]
PDRI
Characteristic Industrial Building Infrastucture
Primary Designer Process Engineer Architect Civil Engineer
Interface with the Public Minimal Moderate Extensive
Primary Cost Piping & Mechanical Equipment
Building & Related Systems
Earthwork, Structures, Materials
Installed Equipment Cost Extensive Moderate Minimal
Land Cost Low to Moderate Variable Moderate - High
The PDRI consists of three sections, each section are made-up by a number of categories and each category by a number of elements, e.g. for the infrastructure PDRI [9]:
I. Basis of Project Decision: Why do the project, what value will be the added by doing the project.
II. Basis of Design: What must be done, the design, the requirements, technologies, all to do with engineering
III. Execution Approach: How will it be ensured that the project is properly managed during execution
Figure 1 depicts a partial hierarchy of the infrastructure PDRI demonstrating the breakdown of Section, Category and Element of the Basis of Design.
PDRI
Section IBasis of Project Decision
Section IIIExecution Approach
Section IIBasis of Design
Category FSite Information
Category HAssociated Structures
and Equipment
Category GLocation and
Geometry
Element G1Schematic Layouts
Element G3Cross-Section
Elements
Element G2Horizontal & Vertical
Alignment Figure 1: Partial Hierarchy of the Infrastructure PDRI [8]
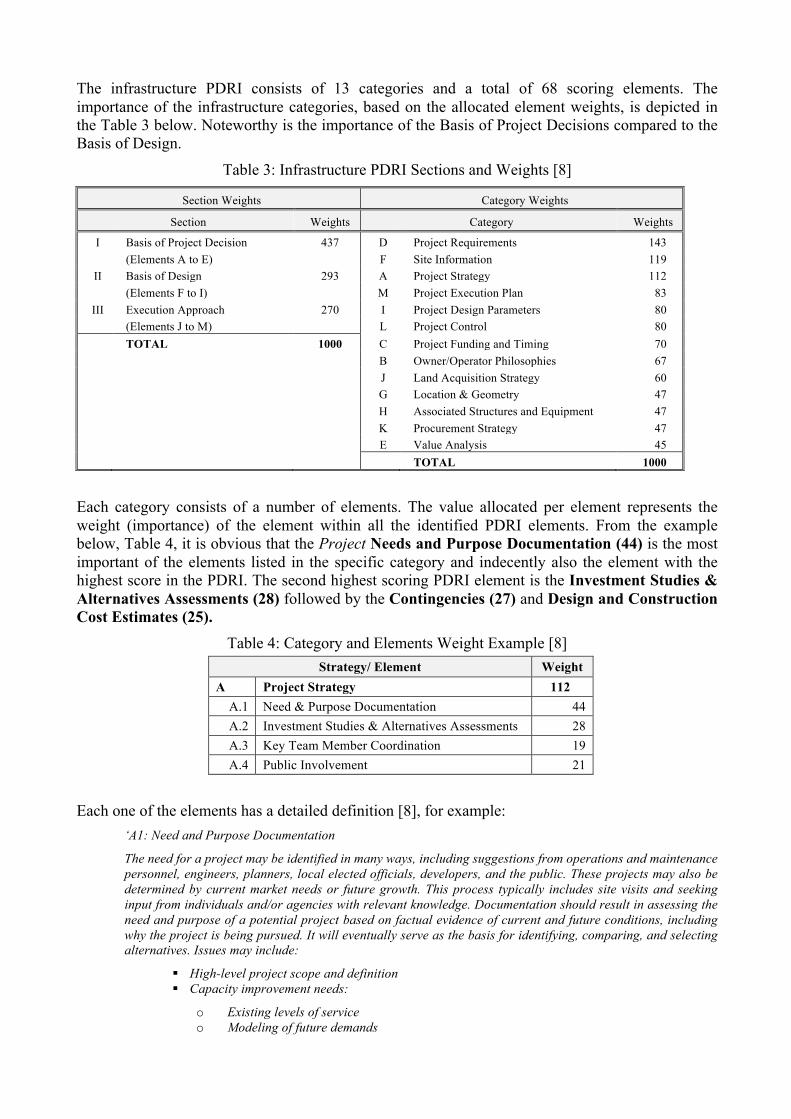
The infrastructure PDRI consists of 13 categories and a total of 68 scoring elements. The importance of the infrastructure categories, based on the allocated element weights, is depicted in the Table 3 below. Noteworthy is the importance of the Basis of Project Decisions compared to the Basis of Design.
Table 3: Infrastructure PDRI Sections and Weights [8]
Section Weights Category Weights
Section Weights Category Weights
I Basis of Project Decision 437 D Project Requirements 143 (Elements A to E) F Site Information 119
II Basis of Design 293 A Project Strategy 112 (Elements F to I) M Project Execution Plan 83
III Execution Approach 270 I Project Design Parameters 80 (Elements J to M) L Project Control 80 TOTAL 1000 C Project Funding and Timing 70
B Owner/Operator Philosophies 67
J Land Acquisition Strategy 60
G Location & Geometry 47
H Associated Structures and Equipment 47
K Procurement Strategy 47
E Value Analysis 45 TOTAL 1000
Each category consists of a number of elements. The value allocated per element represents the weight (importance) of the element within all the identified PDRI elements. From the example below, Table 4, it is obvious that the Project Needs and Purpose Documentation (44) is the most important of the elements listed in the specific category and indecently also the element with the highest score in the PDRI. The second highest scoring PDRI element is the Investment Studies & Alternatives Assessments (28) followed by the Contingencies (27) and Design and Construction Cost Estimates (25).
Table 4: Category and Elements Weight Example [8] Strategy/ Element Weight
A Project Strategy 112 A.1 Need & Purpose Documentation 44 A.2 Investment Studies & Alternatives Assessments 28 A.3 Key Team Member Coordination 19 A.4 Public Involvement 21
Each one of the elements has a detailed definition [8], for example: ‘A1: Need and Purpose Documentation
The need for a project may be identified in many ways, including suggestions from operations and maintenance personnel, engineers, planners, local elected officials, developers, and the public. These projects may also be determined by current market needs or future growth. This process typically includes site visits and seeking input from individuals and/or agencies with relevant knowledge. Documentation should result in assessing the need and purpose of a potential project based on factual evidence of current and future conditions, including why the project is being pursued. It will eventually serve as the basis for identifying, comparing, and selecting alternatives. Issues may include:
§ High-level project scope and definition § Capacity improvement needs:
o Existing levels of service o Modeling of future demands
o Trend analysis and forecasted growth
§ Profitability or benefit analysis …….’ Each element is allocated a weight, based on industry inputs [8], representing its importance for the type of project, for example the category weights for:
• Infrastructure Projects
o Basis of Project Decision = ~44% o Basis of Design = ~29% o Execution Approach = ~27%
and
• Industrial Projects o Basis of Project Decision = ~50% o Basis of Design = ~42% o Execution Approach = ~8%
and
• Building Projects o Basis of Project Decision = ~41% o Basis of Design = ~43% o Execution Approach = ~16%
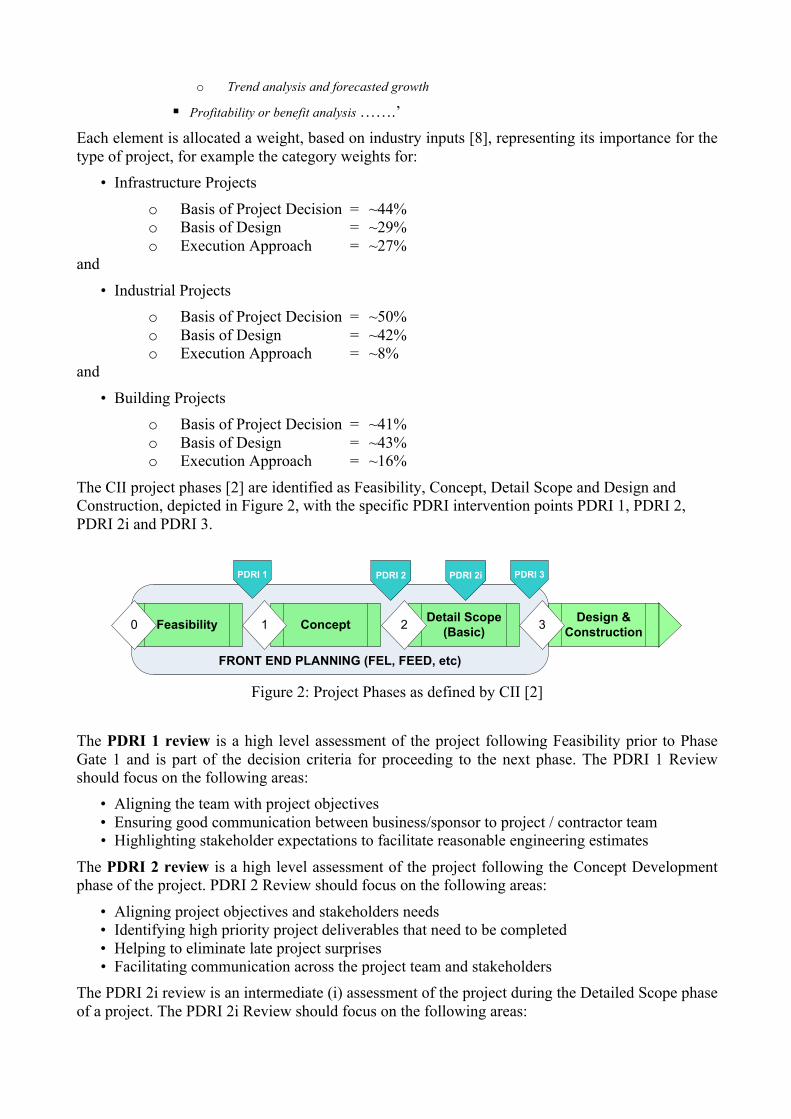
The CII project phases [2] are identified as Feasibility, Concept, Detail Scope and Design and Construction, depicted in Figure 2, with the specific PDRI intervention points PDRI 1, PDRI 2, PDRI 2i and PDRI 3.
FRONT END PLANNING (FEL, FEED, etc)
Feasibility0 Concept1 Detail Scope(Basic)2 Design &
Construction3
PDRI 1 PDRI 2 PDRI 2i PDRI 3
Figure 2: Project Phases as defined by CII [2]
The PDRI 1 review is a high level assessment of the project following Feasibility prior to Phase Gate 1 and is part of the decision criteria for proceeding to the next phase. The PDRI 1 Review should focus on the following areas:
• Aligning the team with project objectives • Ensuring good communication between business/sponsor to project / contractor team • Highlighting stakeholder expectations to facilitate reasonable engineering estimates
The PDRI 2 review is a high level assessment of the project following the Concept Development phase of the project. PDRI 2 Review should focus on the following areas:
• Aligning project objectives and stakeholders needs • Identifying high priority project deliverables that need to be completed • Helping to eliminate late project surprises • Facilitating communication across the project team and stakeholders
The PDRI 2i review is an intermediate (i) assessment of the project during the Detailed Scope phase of a project. The PDRI 2i Review should focus on the following areas:
• Assuring alignment of project objectives and stakeholders needs • Confirming that resources are properly deployed to get the largest value for the time and
effort being applied • Verifying scope in relation to the original project goals • Identifying and planning remaining activities to achieve the level of detail necessary to
complete front end planning in preparation for Phase Gate 3.
The PDRI 3 review is typically the final assessment of the project at the end of front end project planning prior to Phase Gate 3.
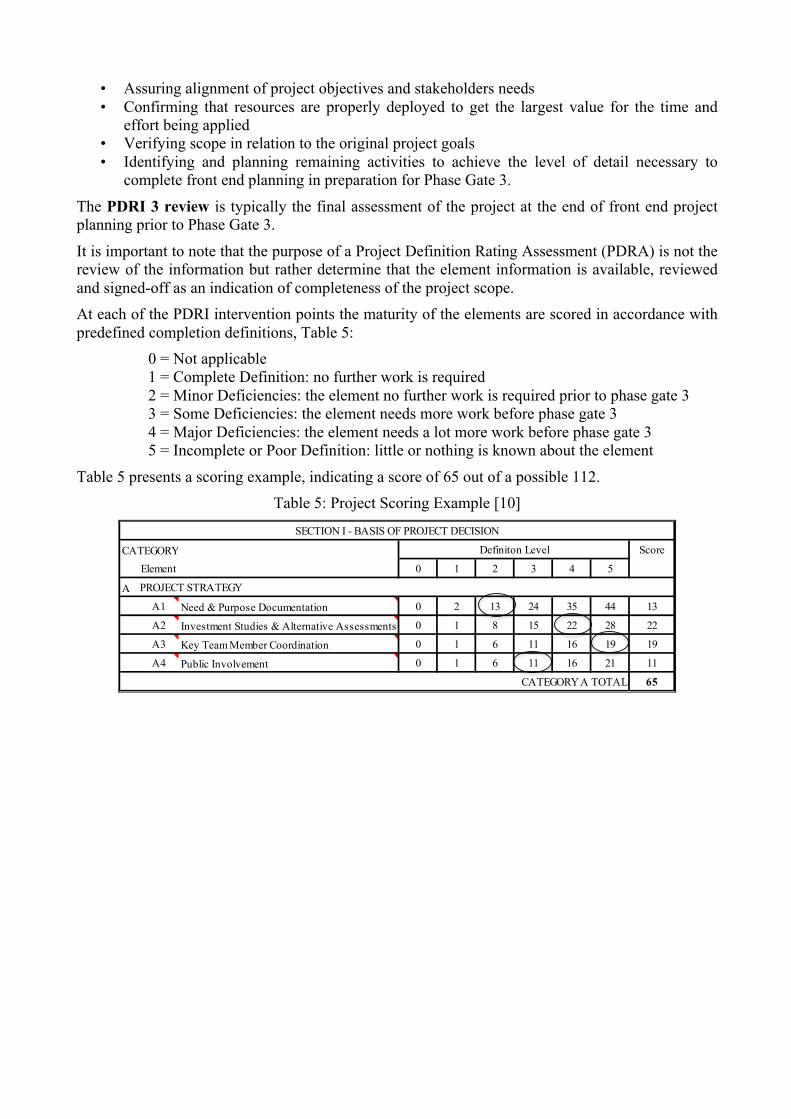
It is important to note that the purpose of a Project Definition Rating Assessment (PDRA) is not the review of the information but rather determine that the element information is available, reviewed and signed-off as an indication of completeness of the project scope. At each of the PDRI intervention points the maturity of the elements are scored in accordance with predefined completion definitions, Table 5:
0 = Not applicable 1 = Complete Definition: no further work is required 2 = Minor Deficiencies: the element no further work is required prior to phase gate 3 3 = Some Deficiencies: the element needs more work before phase gate 3 4 = Major Deficiencies: the element needs a lot more work before phase gate 3 5 = Incomplete or Poor Definition: little or nothing is known about the element
Table 5 presents a scoring example, indicating a score of 65 out of a possible 112. Table 5: Project Scoring Example [10]
CATEGORY Score
Element 0 1 2 3 4 5
A PROJECT STRATEGY
A1 Need & Purpose Documentation 0 2 13 24 35 44 13
A2 Investment Studies & Alternative Assessments 0 1 8 15 22 28 22
A3 Key Team Member Coordination 0 1 6 11 16 19 19
A4 Public Involvement 0 1 6 11 16 21 11
65
SECTION I - BASIS OF PROJECT DECISION
Definiton Level
CATEGORY A TOTAL
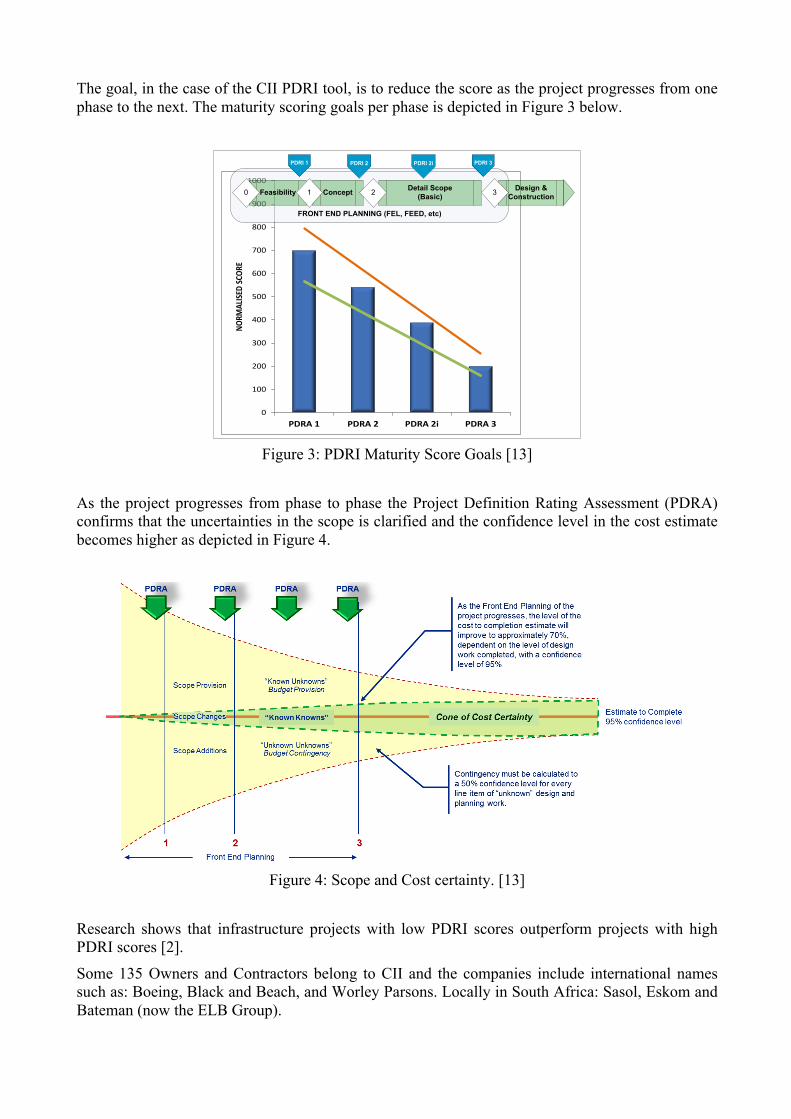
The goal, in the case of the CII PDRI tool, is to reduce the score as the project progresses from one phase to the next. The maturity scoring goals per phase is depicted in Figure 3 below.
0
100
200
300
400
500
600
700
800
900
1000
PDRA 1 PDRA 2 PDRA 2i PDRA 3
NORM
ALISED
SCOR
E
FRONT END PLANNING (FEL, FEED, etc)
Feasibility0 Concept1 Detail Scope(Basic)2 Design &
Construction3
PDRI 1 PDRI 2 PDRI 2i PDRI 3
Figure 3: PDRI Maturity Score Goals [13]
As the project progresses from phase to phase the Project Definition Rating Assessment (PDRA) confirms that the uncertainties in the scope is clarified and the confidence level in the cost estimate becomes higher as depicted in Figure 4.
Figure 4: Scope and Cost certainty. [13]
Research shows that infrastructure projects with low PDRI scores outperform projects with high PDRI scores [2].
Some 135 Owners and Contractors belong to CII and the companies include international names such as: Boeing, Black and Beach, and Worley Parsons. Locally in South Africa: Sasol, Eskom and Bateman (now the ELB Group).
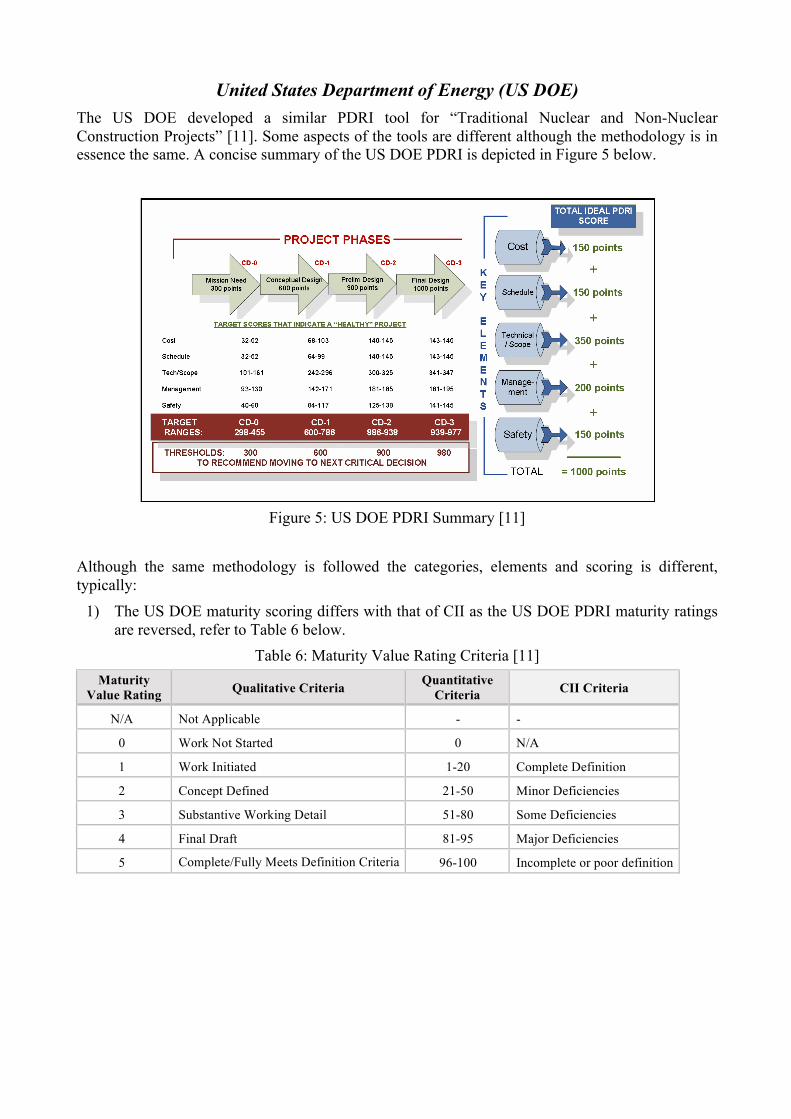
United States Department of Energy (US DOE) The US DOE developed a similar PDRI tool for “Traditional Nuclear and Non-Nuclear Construction Projects” [11]. Some aspects of the tools are different although the methodology is in essence the same. A concise summary of the US DOE PDRI is depicted in Figure 5 below.
Figure 5: US DOE PDRI Summary [11]
Although the same methodology is followed the categories, elements and scoring is different, typically:
1) The US DOE maturity scoring differs with that of CII as the US DOE PDRI maturity ratings are reversed, refer to Table 6 below.
Table 6: Maturity Value Rating Criteria [11]
Maturity Value Rating Qualitative Criteria Quantitative
Criteria (%
Complete)
CII Criteria
N/A Not Applicable - -
0 Work Not Started 0 N/A
1 Work Initiated 1-20 Complete Definition
2 Concept Defined 21-50 Minor Deficiencies
3 Substantive Working Detail 51-80 Some Deficiencies
4 Final Draft 81-95 Major Deficiencies
5 Complete/Fully Meets Definition Criteria 96-100 Incomplete or poor definition
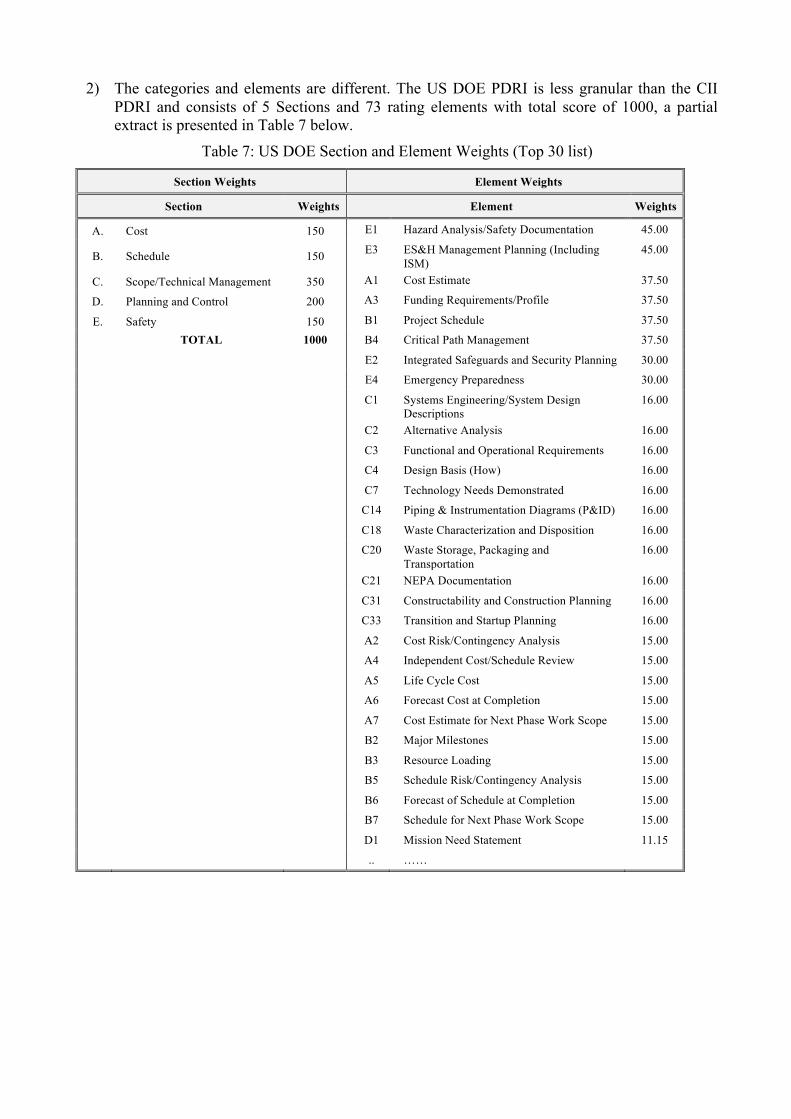
2) The categories and elements are different. The US DOE PDRI is less granular than the CII PDRI and consists of 5 Sections and 73 rating elements with total score of 1000, a partial extract is presented in Table 7 below.
Table 7: US DOE Section and Element Weights (Top 30 list)
Section Weights Element Weights
Section Weights Element Weights
A. Cost 150 E1 Hazard Analysis/Safety Documentation 45.00
B. Schedule 150 E3 ES&H Management Planning (Including ISM)
45.00
C. Scope/Technical Management 350 A1 Cost Estimate 37.50
D. Planning and Control 200 A3 Funding Requirements/Profile 37.50
E. Safety 150 B1 Project Schedule 37.50
TOTAL 1000 B4 Critical Path Management 37.50
E2 Integrated Safeguards and Security Planning 30.00
E4 Emergency Preparedness 30.00
C1 Systems Engineering/System Design Descriptions
16.00
C2 Alternative Analysis 16.00
C3 Functional and Operational Requirements 16.00
C4 Design Basis (How) 16.00
C7 Technology Needs Demonstrated 16.00
C14 Piping & Instrumentation Diagrams (P&ID) 16.00
C18 Waste Characterization and Disposition 16.00
C20 Waste Storage, Packaging and Transportation
16.00
C21 NEPA Documentation 16.00
C31 Constructability and Construction Planning 16.00
C33 Transition and Startup Planning 16.00
A2 Cost Risk/Contingency Analysis 15.00
A4 Independent Cost/Schedule Review 15.00
A5 Life Cycle Cost 15.00
A6 Forecast Cost at Completion 15.00
A7 Cost Estimate for Next Phase Work Scope 15.00
B2 Major Milestones 15.00
B3 Resource Loading 15.00
B5 Schedule Risk/Contingency Analysis 15.00
B6 Forecast of Schedule at Completion 15.00
B7 Schedule for Next Phase Work Scope 15.00
D1 Mission Need Statement 11.15
.. ……
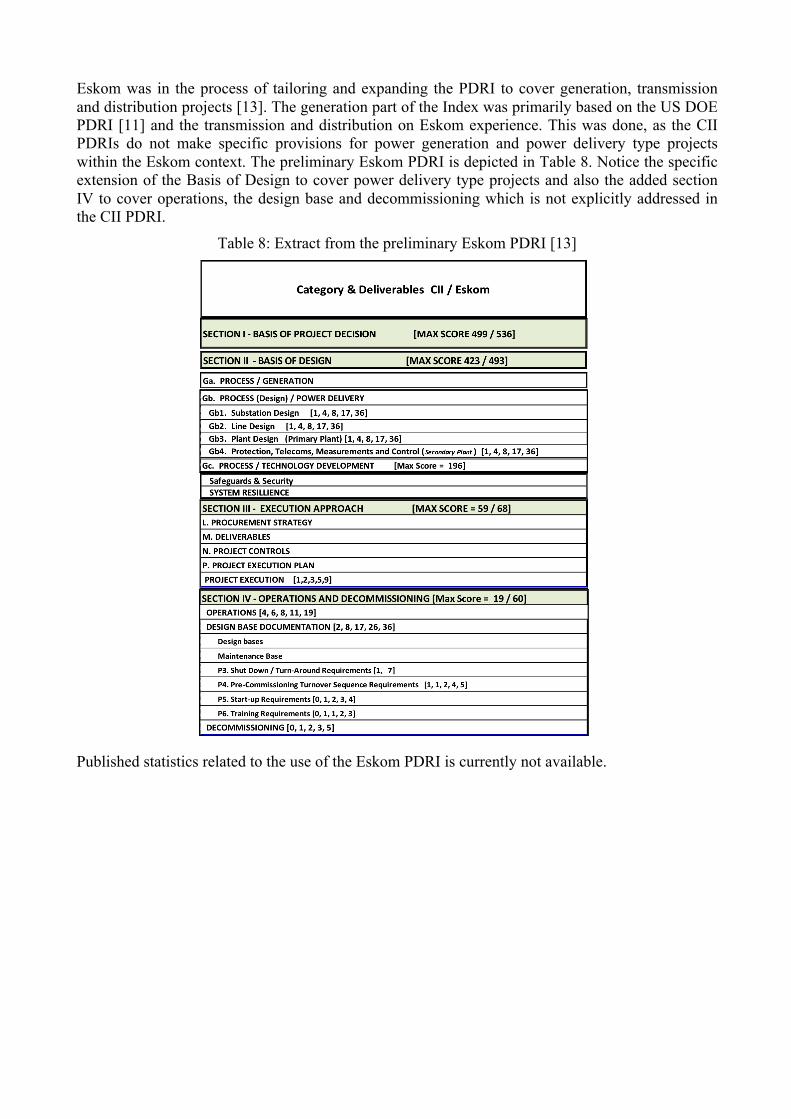
Eskom was in the process of tailoring and expanding the PDRI to cover generation, transmission and distribution projects [13]. The generation part of the Index was primarily based on the US DOE PDRI [11] and the transmission and distribution on Eskom experience. This was done, as the CII PDRIs do not make specific provisions for power generation and power delivery type projects within the Eskom context. The preliminary Eskom PDRI is depicted in Table 8. Notice the specific extension of the Basis of Design to cover power delivery type projects and also the added section IV to cover operations, the design base and decommissioning which is not explicitly addressed in the CII PDRI.
Table 8: Extract from the preliminary Eskom PDRI [13]
Published statistics related to the use of the Eskom PDRI is currently not available.
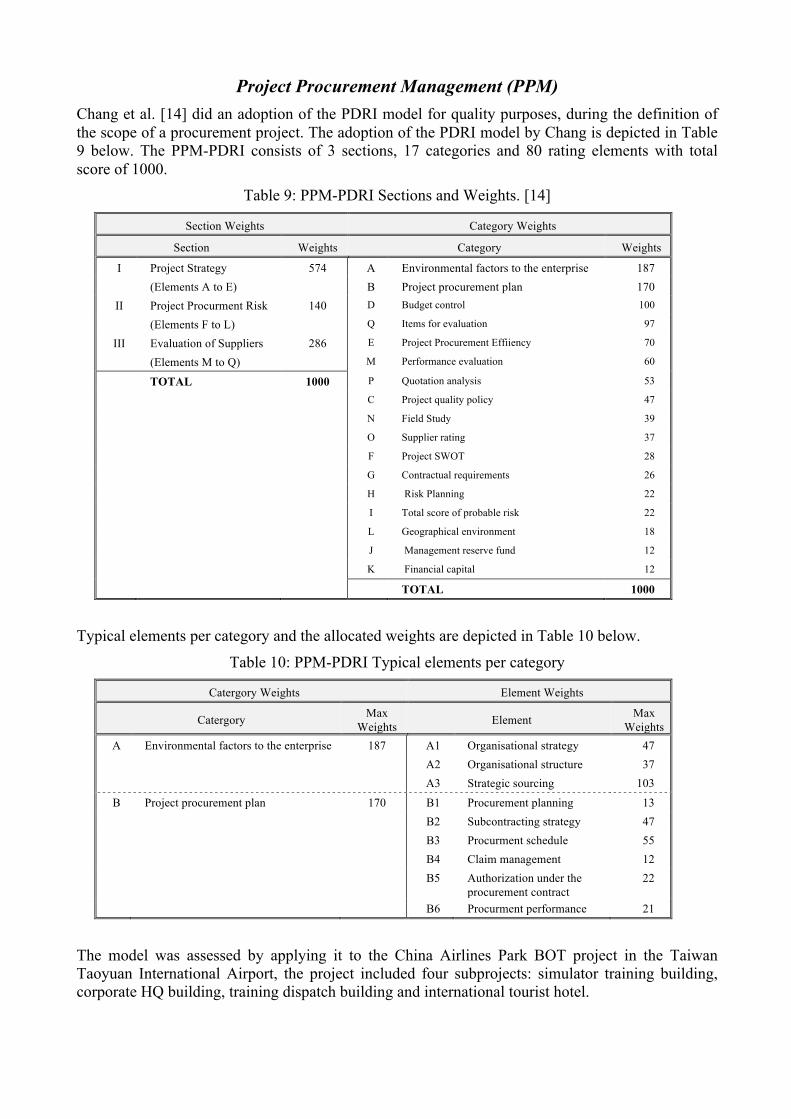
Project Procurement Management (PPM) Chang et al. [14] did an adoption of the PDRI model for quality purposes, during the definition of the scope of a procurement project. The adoption of the PDRI model by Chang is depicted in Table 9 below. The PPM-PDRI consists of 3 sections, 17 categories and 80 rating elements with total score of 1000.
Table 9: PPM-PDRI Sections and Weights. [14]
Section Weights Category Weights
Section Weights Category Weights
I Project Strategy 574 A Environmental factors to the enterprise 187 (Elements A to E) B Project procurement plan 170
II Project Procurment Risk 140 D Budget control 100
(Elements F to L) Q Items for evaluation 97
III Evaluation of Suppliers 286 E Project Procurement Effiiency 70
(Elements M to Q) M Performance evaluation 60
TOTAL 1000 P Quotation analysis 53
C Project quality policy 47
N Field Study 39
O Supplier rating 37
F Project SWOT 28
G Contractual requirements 26
H Risk Planning 22
I Total score of probable risk 22
L Geographical environment 18
J Management reserve fund 12
K Financial capital 12
TOTAL 1000
Typical elements per category and the allocated weights are depicted in Table 10 below.
Table 10: PPM-PDRI Typical elements per category
Catergory Weights Element Weights
Catergory Max Weights Element Max
Weights A Environmental factors to the enterprise 187 A1 Organisational strategy 47 A2 Organisational structure 37 A3 Strategic sourcing 103
B Project procurement plan 170 B1 Procurement planning 13 B2 Subcontracting strategy 47 B3 Procurment schedule 55 B4 Claim management 12 B5 Authorization under the
procurement contract 22
B6 Procurment performance 21
The model was assessed by applying it to the China Airlines Park BOT project in the Taiwan Taoyuan International Airport, the project included four subprojects: simulator training building, corporate HQ building, training dispatch building and international tourist hotel.
Based on the criterion that the project scope definition should score < 200 points the assessment score was 176 points. The actual project cost was 3% below the budget, the actual progress was 4% ahead of schedule and the change orders were controlled within 5% of the budget.
The results of the model assessment indicates that the PPM-PDRI model provides a quantitative method to measure and improve the scope of project procurement in terms of cost, schedule, change orders, construction quality and material quality and effectively improves the performance of project quality management. Chang presents an excellent adoption of the PDRI in support of project procurement management.
Preliminary Design Rating Index (PDRI) for ICT Projects Gumz [17] present a preliminary model PDRI for Information and Communications Technology (ICT) projects. The model was adopted by a large U.S. utility (power generation plants) in response to the question: Can we make a PDRI for ICT projects? It is not clear what the current status of the model is and if it were verified and the following caveats are mentioned:
• Research not yet done for a broad group of companies, • the template may need to be calibrated for a specific environment and • the value to the project may vary.
The index focuses on the following four areas:
• Size/staffing/users/interfaces • Structure/process change • Technology • Risk
The index consists of 21 questions with weights:
• Score: 21 (perfect) to 514 (VERY risky) • Low: < 140 M: 140-166 High > 166
Typical questions proposed are: 1. Total system and programming man-hours for the system:
a. 100 to 3 000; Risk Score = 1 b. 3 000 to 15 000; Risk Score = 2 c. 15 000 to 30 000; Risk Score = 3 d. >30000. Risk Score = 4
2. System development duration estimate in calendar time a. < 12 months; Risk Score = 1 b. 13 to 24 months Risk Score = 2 c. > 24 months Risk Score = 3
3. Who will perform the work a. Mostly on-site Risk Score = 1 b. Significant portions on site Risk Score = 2 c. Mostly off-site Risk Score = 3
4. Number of non IT departments involved in the system a. One Risk Score = 1 b. Two Risk Score = 2 c. Three Risk Score = 3
For the complete list of questions refer to Gumz [17].
In a paper published on the Project Auditors LLC web site [18], Gumz makes the following statement: ‘Improper scope definition is a common problem on projects. Various terms are used to describe this issue. These terms include scope creep, inadequate scope definition, poor front-end planning and so
forth. The problem with defining scope is that it is not always obvious that the problem exists - or how to correct it. Measuring the number of change requests on a project and whether the number is increasing or decreasing is sometimes used as a metric. But what would be really useful is a metric that would indicate scope needs to be defined further before problems start occurring AND indicate the area requiring further examination.’
In the author’s opinion such a tool already exist in the PDRI.
Discussion and Application
In the previous section the PDRI was discussed in detail and it was also shown that it is recognized that the methodology, although developed for the construction industry, may be applied to other types of projects. The question that one may ask is: Is there a need for such a tool like the PDRI in support of project management to enhance the probability of project success? Specifically in Africa and maybe closer to home, in South Africa. So what is happening in Africa?
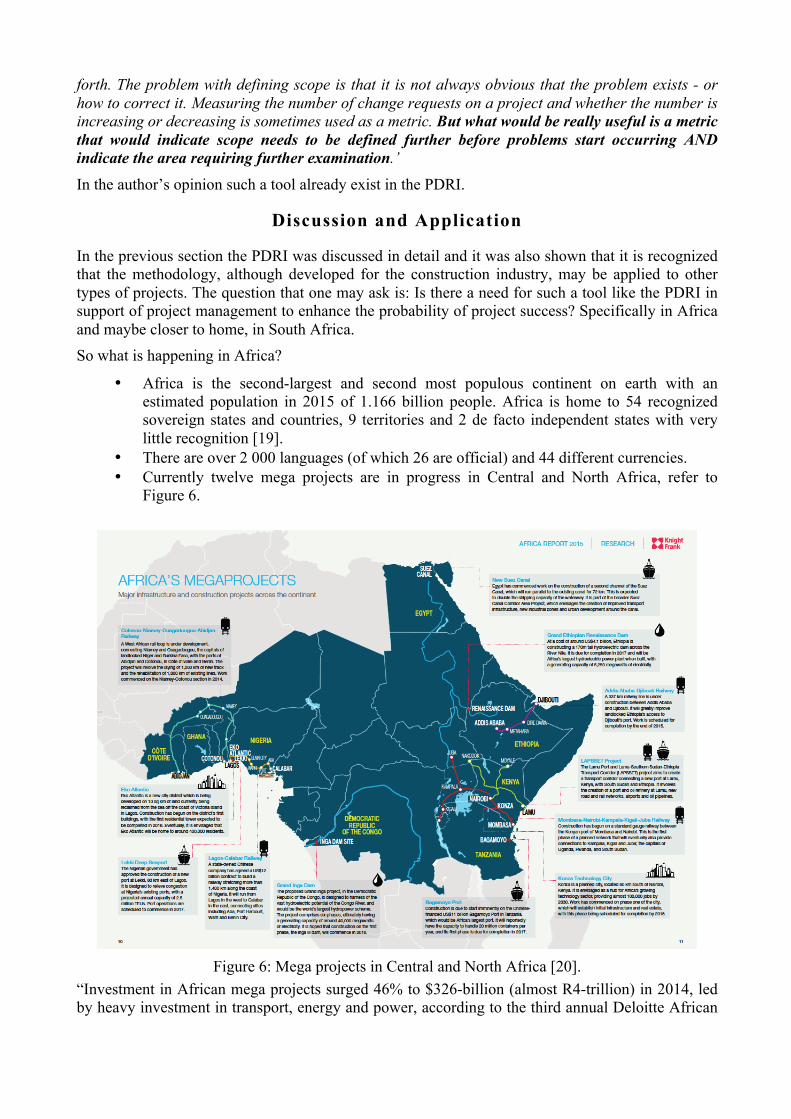
• Africa is the second-largest and second most populous continent on earth with an estimated population in 2015 of 1.166 billion people. Africa is home to 54 recognized sovereign states and countries, 9 territories and 2 de facto independent states with very little recognition [19].
• There are over 2 000 languages (of which 26 are official) and 44 different currencies. • Currently twelve mega projects are in progress in Central and North Africa, refer to
Figure 6.
Figure 6: Mega projects in Central and North Africa [20].
“Investment in African mega projects surged 46% to $326-billion (almost R4-trillion) in 2014, led by heavy investment in transport, energy and power, according to the third annual Deloitte African
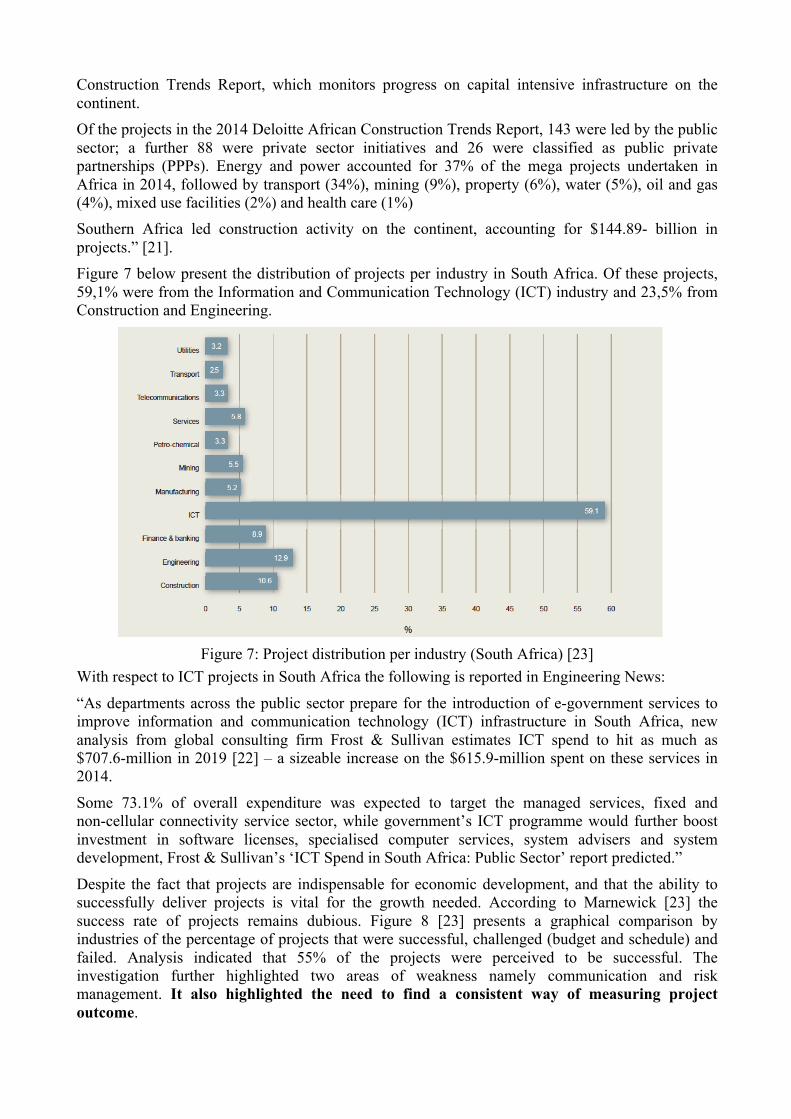
Construction Trends Report, which monitors progress on capital intensive infrastructure on the continent. Of the projects in the 2014 Deloitte African Construction Trends Report, 143 were led by the public sector; a further 88 were private sector initiatives and 26 were classified as public private partnerships (PPPs). Energy and power accounted for 37% of the mega projects undertaken in Africa in 2014, followed by transport (34%), mining (9%), property (6%), water (5%), oil and gas (4%), mixed use facilities (2%) and health care (1%) Southern Africa led construction activity on the continent, accounting for $144.89- billion in projects.” [21]. Figure 7 below present the distribution of projects per industry in South Africa. Of these projects, 59,1% were from the Information and Communication Technology (ICT) industry and 23,5% from Construction and Engineering.
Figure 7: Project distribution per industry (South Africa) [23]
With respect to ICT projects in South Africa the following is reported in Engineering News:
“As departments across the public sector prepare for the introduction of e-government services to improve information and communication technology (ICT) infrastructure in South Africa, new analysis from global consulting firm Frost & Sullivan estimates ICT spend to hit as much as $707.6-million in 2019 [22] – a sizeable increase on the $615.9-million spent on these services in 2014.
Some 73.1% of overall expenditure was expected to target the managed services, fixed and non-cellular connectivity service sector, while government’s ICT programme would further boost investment in software licenses, specialised computer services, system advisers and system development, Frost & Sullivan’s ‘ICT Spend in South Africa: Public Sector’ report predicted.”
Despite the fact that projects are indispensable for economic development, and that the ability to successfully deliver projects is vital for the growth needed. According to Marnewick [23] the success rate of projects remains dubious. Figure 8 [23] presents a graphical comparison by industries of the percentage of projects that were successful, challenged (budget and schedule) and failed. Analysis indicated that 55% of the projects were perceived to be successful. The investigation further highlighted two areas of weakness namely communication and risk management. It also highlighted the need to find a consistent way of measuring project outcome.
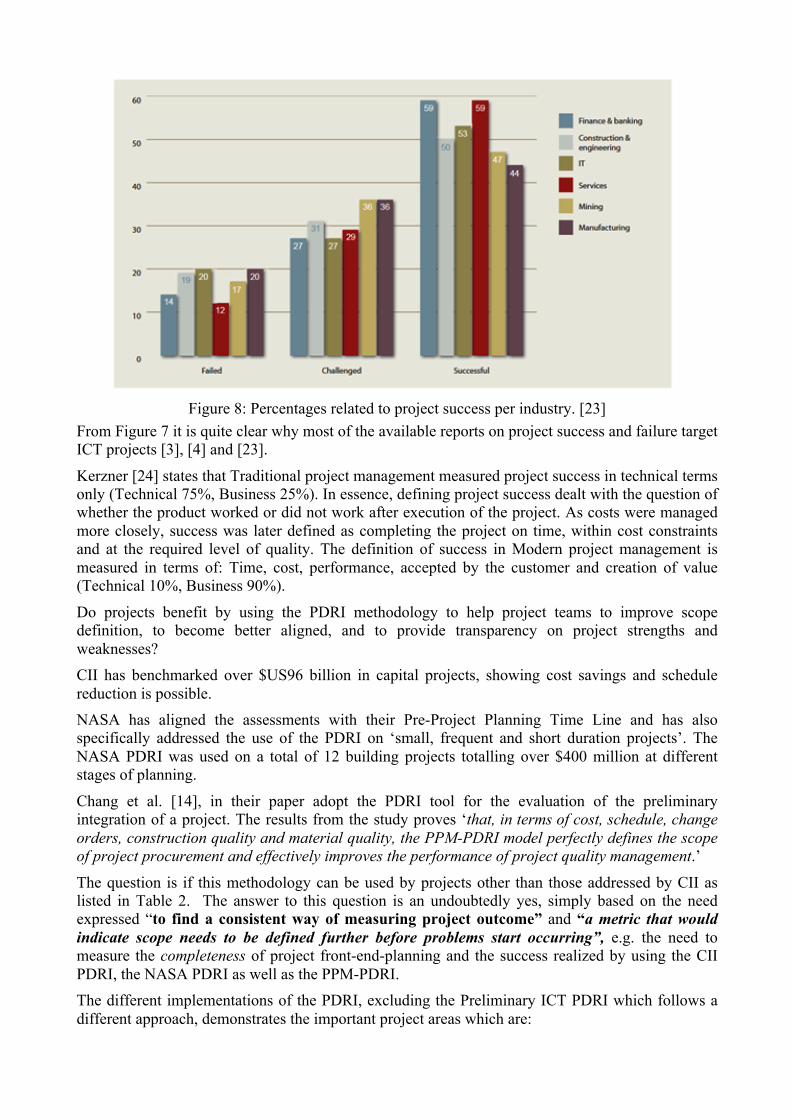
Figure 8: Percentages related to project success per industry. [23]
From Figure 7 it is quite clear why most of the available reports on project success and failure target ICT projects [3], [4] and [23].
Kerzner [24] states that Traditional project management measured project success in technical terms only (Technical 75%, Business 25%). In essence, defining project success dealt with the question of whether the product worked or did not work after execution of the project. As costs were managed more closely, success was later defined as completing the project on time, within cost constraints and at the required level of quality. The definition of success in Modern project management is measured in terms of: Time, cost, performance, accepted by the customer and creation of value (Technical 10%, Business 90%).
Do projects benefit by using the PDRI methodology to help project teams to improve scope definition, to become better aligned, and to provide transparency on project strengths and weaknesses? CII has benchmarked over $US96 billion in capital projects, showing cost savings and schedule reduction is possible. NASA has aligned the assessments with their Pre-Project Planning Time Line and has also specifically addressed the use of the PDRI on ‘small, frequent and short duration projects’. The NASA PDRI was used on a total of 12 building projects totalling over $400 million at different stages of planning.
Chang et al. [14], in their paper adopt the PDRI tool for the evaluation of the preliminary integration of a project. The results from the study proves ‘that, in terms of cost, schedule, change orders, construction quality and material quality, the PPM-PDRI model perfectly defines the scope of project procurement and effectively improves the performance of project quality management.’
The question is if this methodology can be used by projects other than those addressed by CII as listed in Table 2. The answer to this question is an undoubtedly yes, simply based on the need expressed “to find a consistent way of measuring project outcome” and “a metric that would indicate scope needs to be defined further before problems start occurring”, e.g. the need to measure the completeness of project front-end-planning and the success realized by using the CII PDRI, the NASA PDRI as well as the PPM-PDRI. The different implementations of the PDRI, excluding the Preliminary ICT PDRI which follows a different approach, demonstrates the important project areas which are:
1) The requirements for the project, which form the basis for project decisions – why do it, 2) the project technical requirements – what to do; and 3) the project execution approach – how to do.
With these three areas forming the basic sections of a PDRI the challenge would be to tailor or generalize section 2, the Basis of Design, in such a way that it can be applied to projects in general or be tailored for a specific industry. Listed below is a possible breakdown of a PDRI that may be applicable to development of engineering projects typically found in the military, transport or utilities industries.
Section 1: Basis of Project Decision, which could include the following: Project Objectives; Key Project Assumptions; Level 1 milestones and deliverables; Cost Estimate (Class 1) [15]; Funding Requirements and Strategy; Risk Profile; Project Strategy; etc. Section 2: Basis of Design, which could include the following: Operational and Functional Requirements; Operator / Owner Philosophies (typical RAMI); Operating and Maintenance Requirements; Safety Requirements; Environmental Constraints; Technology Maturity and Readiness; Design criteria; Alternatives / Trade-off analysis; Value Engineering; Design Analysis: FMECA / HAZOPS / …; Specifications; etc. Section 3: Project Execution Approach, which could include the following: Cost Management; Schedule Management; Planning and Controls.
For ICT projects one may also have to expand section 3 to cater for ICT specific critical success factors. The allocated values of the elements of each category should be based on the general importance of the element in the overall index. These values should be developed with inputs from the industry similar to the approach followed by CII.
Conclusion
Gumz [18] states that the primary benefit of PDRI is to simplify complexity and provide an understandable, numeric score that is actionable. Gumz further lists a number of general benefits:
• It is a checklist that a project team can use to determine key areas are addressed when defining the project scope
• It provides standardized scope definition terminology • It is a standard tool for rating the completeness of the project scope definition package to
facilitate risk assessment and prediction of escalation ideally reducing disputes • It provides a means to monitor progress at various stages during the front-end planning /
front-end loading efforts • It is a tool that aids in communication, facilitates conversation, and promotes alignment
between owners and design contractors by highlighting poorly defined areas in a scope definition package
• It provides a mechanism for project team members to recognize and reconcile differences using a common basis for project evaluation
• It can be used as a training tool for organizations and individuals throughout the industry to understand the importance of certain aspects of a project
• It can be used for benchmarking to compare performance of past projects, either within the organization and externally, in order to predict the probability of success on future projects
• A significant feature of the tool is that it can be used on projects regardless of size. Elements that are not applicable to a specific project can be zeroed out, thus eliminating them from the final scoring calculation.
Gumz [18] concludes that the PDRI as a tool is quite suited for other types of projects, such as New Product Development (NPD) for example.
Based on the information presented in this paper it is concluded that:
• PDRI is a ‘Best Practice Tool’ designed and proven to increase the probability of success of capital projects.
• The PDRI approach is accepted and used with success by a number local and international companies.
• There is scope for the development of PDRI indexes that can be applied to projects other than those identified by CII, NASA and US DOE as demonstrated by the PPM-PDRI and the Preliminary ICT PDRI.
• It is demonstrated the PDRI model can be tailored to effectively suit different types of projects. The crux is in the index, the identification of the elements and the allocation of weights to these elements based on its importance in the overall index or for the specific project type.
• There exist a need to measure project definition maturity and prevent probable risks events from materializing.
Future Work
The following future work is proposed to verify the applicability and usefulness of a general system / product development PDRI tool.
1. The identification of the elements per category for each of the three sections for engineering product development. The allocation of element values of each category should be based on the general importance of the element in the index with respect to the specific type of project, the element will differ for a mechanical design compared to an electronic or ICT development project. These values should be developed with inputs from the industry. A nine-step procedure to develop the elements of a PDRI tool is presented by Fageha and Aibinu [16] in a ‘study aimed at investigating the ideal involvement of stakeholders when measuring the level of project scope definition completeness.’
2. Development of a generic PDRI software tool with the option of selecting the index depending on the project type. The tool should provide the capability to store the data of consecutive assessments of the same project. The tool should also track the project success / fail history as input to continuous tool improvement.
References
[1] Gibson, G.E., Dumont, P.R., Fish, J.R. “Scope Management Using Project Definition Rating Index”. Journal of Management in Engineering / September/October 1997.
[2] An Oracle White Paper. 2011. “Why Projects Fail: Avoiding the Classic Pitfalls.” [3] The Standish Group Report. 2003. Chaos
[4] The Standish Group Report. 2014. Chaos [5] Thomsett, R. Project Pathology,
http://www.thomsett.com.au/library/item/project-pathology. [6] Project Management Institute, Inc., “A Guide to the Project Management Body of
Knowledge (PMBOK Guide)”, 4th ed. (Newtown Square, PA: Project Management Institute, Inc., 2008), 11–16.
[7] Bingham, E., 2010. “Development of the Project Definition Rating Index (PDRI) for Infrastructure Projects”.
[8] Construction Industry Institute, “PDRI: Project Definition Rating Index – Infrastructure Projects, Implementation Resource 268-2 Version 1.1”, August 2012.
[9] Construction Industry Institute, RS39-1 – Pre-Project Planning: Beginning a Project the Right Way.
[10] Research Summary 268-1a, Construction Industry Institute, 2013. “Assessment of Effective Front End Planning Processes”.
[11] DOE G 413.3-12. 2010. “Project Definition Rating Index Guide for Traditional Nuclear and Non-Nuclear Construction Projects”.
[12] NASA. 2000. “PDRI Project Definition Rating Index Use on NASA Facilities”. [13] Du Plooy, D., 2013. “Innovation in Capital Power Projects Development.”
[14] Chang. A., Chou. C., Lin. J., “To Enhance Quality Control by Using PDRI to Define Scope of Project Procurement.”
[15] Journal of Quality Vol. 21, No. 4 (2014) AACE International Recommended Practice No. 56R-08. (2012). “Cost estimate classification system – as applied for the building and general construction industries.”
[16] Fageha1, M.K., and Aibinu., A.A., 2014. “A Procedure for Involving Stakeholders when Measuring Project Scope Definition Completeness at Pre-project Planning Stage.” AIPM National 2014 Conference Proceedings.
[17] Gumz, J., 2010. “The Art & Science of Estimation.” Project Auditors, LLC Presentation
[18] Gumz, J., “PDRI: Project Definition Rating Index: What is PDRI and why should I care?” http://www.projectauditors.com/Papers/PDRI_Reducing_Scope_Creep_in_Construction.php
[19] “Africa Population 2015”. http://worldpopulationreview.com/continents/africa-population/
[20] Knight Frank Research, 2015. “Africa Report”. [21] Investment in African mega projects on the boil, March 2015.
http://www.southafrica.info/africa/megaprojects-100315.htm#.Vb0ZiPmqpBe [22] Public ICT spend to hit $707.6m by 2019 – report, June 2015.
http://www.engineeringnews.co.za/article/public-ict-spend-to-hit-7076m-by-2019-report-2015-07-10
[23] Marnewick, C. et al, December 2013. “Prosperus Report, The African Edition. Project Management Maturity Vs. Project Outcomes In Africa”, ISBN: 978-0-620-56906-4.
[24] Kerzner, H., 2013. “Managing Challenging Projects and Creating Effective Project Metrics”.
Biography
Sarel Lotz received a B Eng (Mechanical) from Stellenbosch University, Masters in Aerodynamics from Cranfield Institute of Technology, Diploma in Systems Engineering from University of Pretoria and a Diploma in Pressurized Water Reactor Technology from North-West University. He has more than 30 years of engineering experience of which the last 24 years was that of a practicing system engineer in the defence, commercial, mining, nuclear and power generation industries. He has been involved in aeronautical research, aircraft maintenance, business process development, technical management of development projects, project definition maturity tools development and assessment, system development, system modelling and analysis, system design, system testing and qualification, system certification and plant systems development and integration.