GENERAL SUMMARY QUARTERLY REVIEW SUMMARY QUARTERLY REVIEW November 2016 . 2 ... SEVIS by the Numbers...
24
1 SEVIS BY THE NUMBERS GENERAL SUMMARY QUARTERLY REVIEW November 2016
Transcript of GENERAL SUMMARY QUARTERLY REVIEW SUMMARY QUARTERLY REVIEW November 2016 . 2 ... SEVIS by the Numbers...
1
SEVIS BY THE NUMBERS GENERAL SUMMARY QUARTERLY REVIEW
November 2016
2
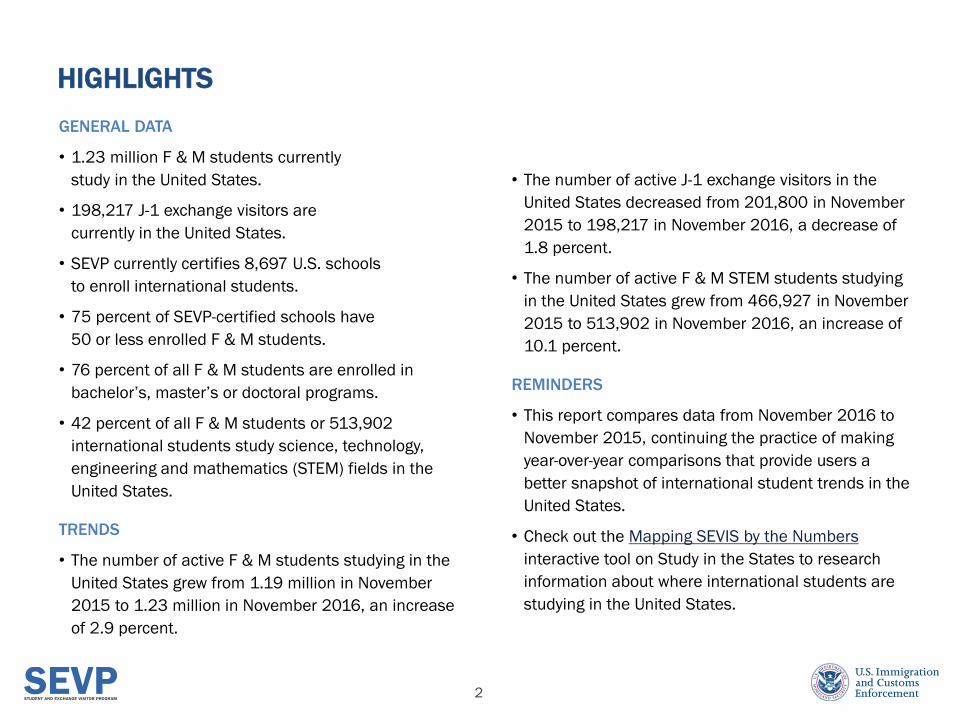
GENERAL DATA
• 1.23 million F & M students currently
study in the United States.
• 198,217 J-1 exchange visitors are
currently in the United States.
• SEVP currently certifies 8,697 U.S. schools
to enroll international students.
• 75 percent of SEVP-certified schools have
50 or less enrolled F & M students.
• 76 percent of all F & M students are enrolled in
bachelor’s, master’s or doctoral programs.
• 42 percent of all F & M students or 513,902
international students study science, technology,
engineering and mathematics (STEM) fields in the
United States.
TRENDS
• The number of active F & M students studying in the
United States grew from 1.19 million in November
2015 to 1.23 million in November 2016, an increase
of 2.9 percent.
• The number of active J-1 exchange visitors in the
United States decreased from 201,800 in November
2015 to 198,217 in November 2016, a decrease of
1.8 percent.
• The number of active F & M STEM students studying
in the United States grew from 466,927 in November
2015 to 513,902 in November 2016, an increase of
10.1 percent.
REMINDERS
• This report compares data from November 2016 to
November 2015, continuing the practice of making
year-over-year comparisons that provide users a
better snapshot of international student trends in the
United States.
• Check out the Mapping SEVIS by the Numbers
interactive tool on Study in the States to research
information about where international students are
studying in the United States.
HIGHLIGHTS
3
I. INTRODUCTION: What is the Student and Exchange Visitor Program?
II. DEFINITIONS: What Do These Terms Mean?
III. GENERAL OVERVIEW: School and International Student Data
IV. STUDENTS: F-1 & M-1 International Student Data
V. SCHOOLS: SEVP-certified School Data
VI. STEM DATA: International Student Data
4
7
8
9
14
18
TABLE OF CONTENTS
4
INTRODUCTION WHAT IS THE STUDENT AND EXCHANGE VISITOR PROGRAM?
SEVP, a program within the U.S. Immigration and Customs Enforcement, acts as a bridge for government
organizations that have an interest in information on nonimmigrants whose primary reason for coming to
the United States is to be students.
On behalf of the U.S. Department of Homeland Security (DHS), SEVP manages schools, international
students in the F & M visa classifications and their dependents.
The U.S. Department of State manages exchange visitor programs, nonimmigrant exchange visitors in the J
visa classification and their dependents. Both SEVP and the Department of State use the Student and
Exchange Visitor Information System (SEVIS) to track and monitor schools; exchange visitor programs; and
F, M and J nonimmigrants while they visit the United States and participate in the U.S. education system.
5
INTRODUCTION WHAT IS THE STUDENT AND EXCHANGE VISITOR INFORMATION SYSTEM?
SEVIS is the web-based system that DHS uses to maintain information on SEVP-certified schools and the F
& M students who come to the United States to attend those schools. SEVIS also maintains information on
Department of State-designated exchange visitor program sponsors and J-1 visa exchange visitor program
participants. It is a critical tool in SEVP’s mission to protect national security while supporting the legal
entry of the more than one million F, M and J nonimmigrants to the United States for education and
cultural exchange.
6
INTRODUCTION WHAT IS SEVIS BY THE NUMBERS?
SEVIS by the Numbers is a quarterly report that highlights international student and exchange visitor trends
and information using data from SEVIS, which SEVP uses to track and monitor the status and activities of
international students and exchange visitors who enter the United States.
The report highlights key SEVIS data in an engaging way to illustrate trends, values and information on
international students studying in the United States.
This report uses real-time SEVIS data from Nov. 7, 2016.
7
DEFINITIONS WHAT DO THESE TERMS MEAN?
• NONIMMIGRANT – Person entering the United States to visit, study or work (depending on the type of
visa) temporarily, but not to stay permanently in the United States.
• F-1 NONIMMIGRANT STUDENT – Nonimmigrant status conferred on a student pursuing a full program
of study in a college, university, seminary, conservatory, academic high school, private elementary
school, other academic school or language training program in the United States that is SEVP-certified
to enroll F and/or M students.
• M-1 NONIMMIGRANT STUDENT – Nonimmigrant status conferred on a foreign national pursuing a full
program of study at an SEVP-certified vocational school or other recognized non-academic school
(other than in language training programs).
• J-1 EXCHANGE VISITOR – Foreign national selected by a Department of State-designated program to
participate in an exchange visitor program.
8
GENERAL OVERVIEW SCHOOL AND INTERNATIONAL STUDENT DATA
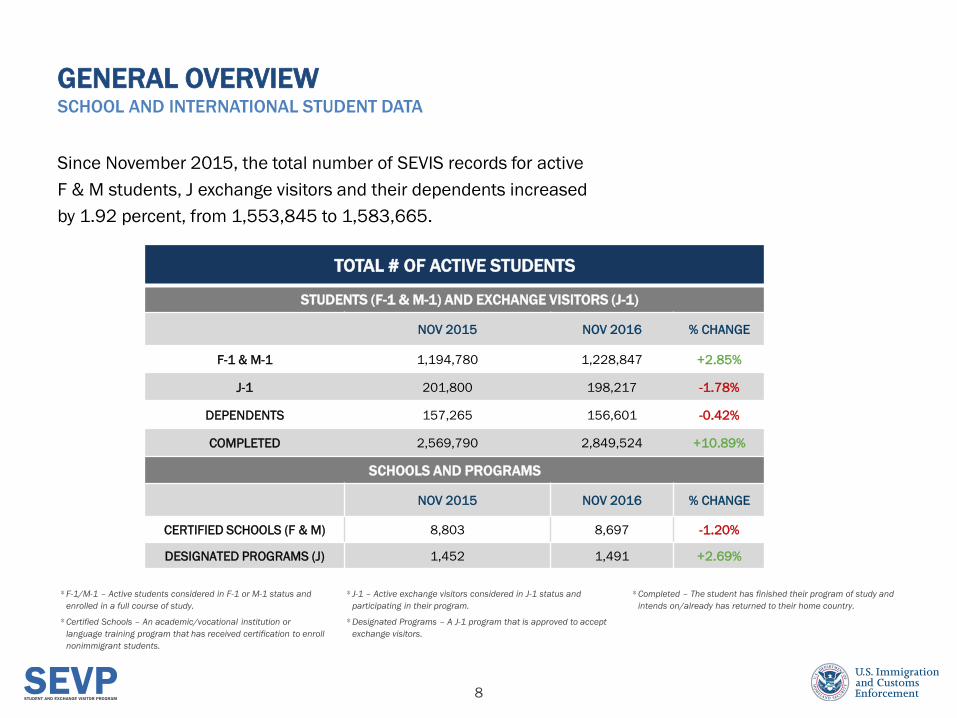
Since November 2015, the total number of SEVIS records for active
F & M students, J exchange visitors and their dependents increased
by 1.92 percent, from 1,553,845 to 1,583,665.
*F-1/M-1 – Active students considered in F-1 or M-1 status and
enrolled in a full course of study.
*Certified Schools – An academic/vocational institution or
language training program that has received certification to enroll
nonimmigrant students.
* J-1 – Active exchange visitors considered in J-1 status and
participating in their program.
*Designated Programs – A J-1 program that is approved to accept
exchange visitors.
*Completed – The student has finished their program of study and
intends on/already has returned to their home country.
TOTAL # OF ACTIVE STUDENTS
STUDENTS (F-1 & M-1) AND EXCHANGE VISITORS (J-1)
NOV 2015 NOV 2016 % CHANGE
F-1 & M-1 1,194,780 1,228,847 +2.85%
J-1 201,800 198,217 -1.78%
DEPENDENTS 157,265 156,601 -0.42%
COMPLETED 2,569,790 2,849,524 +10.89%
SCHOOLS AND PROGRAMS
NOV 2015 NOV 2016 % CHANGE
CERTIFIED SCHOOLS (F & M) 8,803 8,697 -1.20%
DESIGNATED PROGRAMS (J) 1,452 1,491 +2.69%
9
STUDENTS
v
10
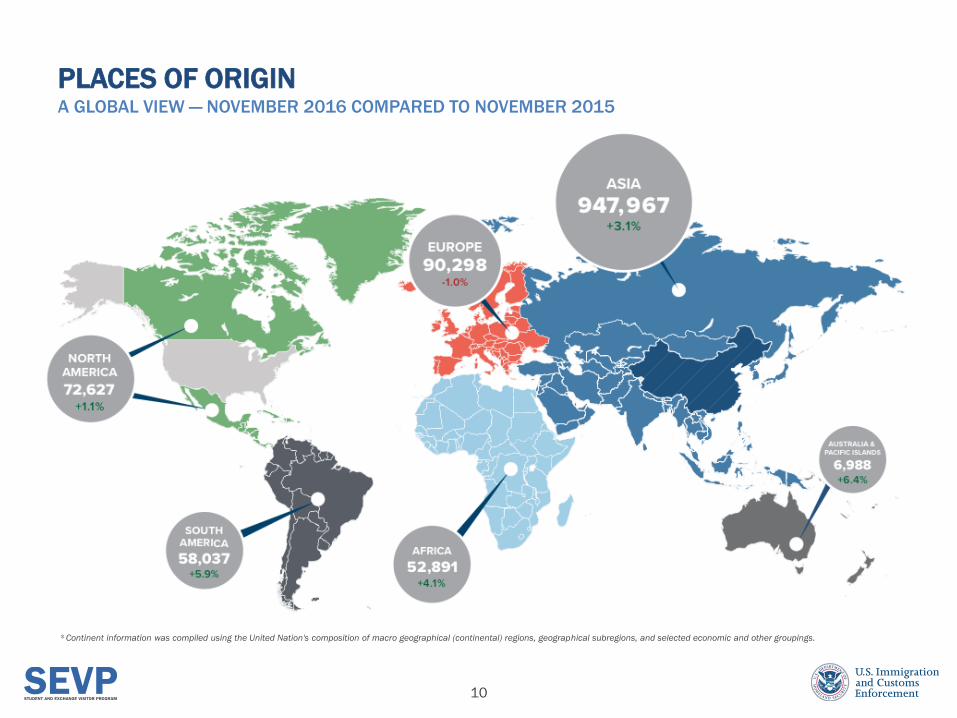
PLACES OF ORIGIN A GLOBAL VIEW — NOVEMBER 2016 COMPARED TO NOVEMBER 2015
*Continent information was compiled using the United Nation's composition of macro geographical (continental) regions, geographical subregions, and selected economic and other groupings.
11
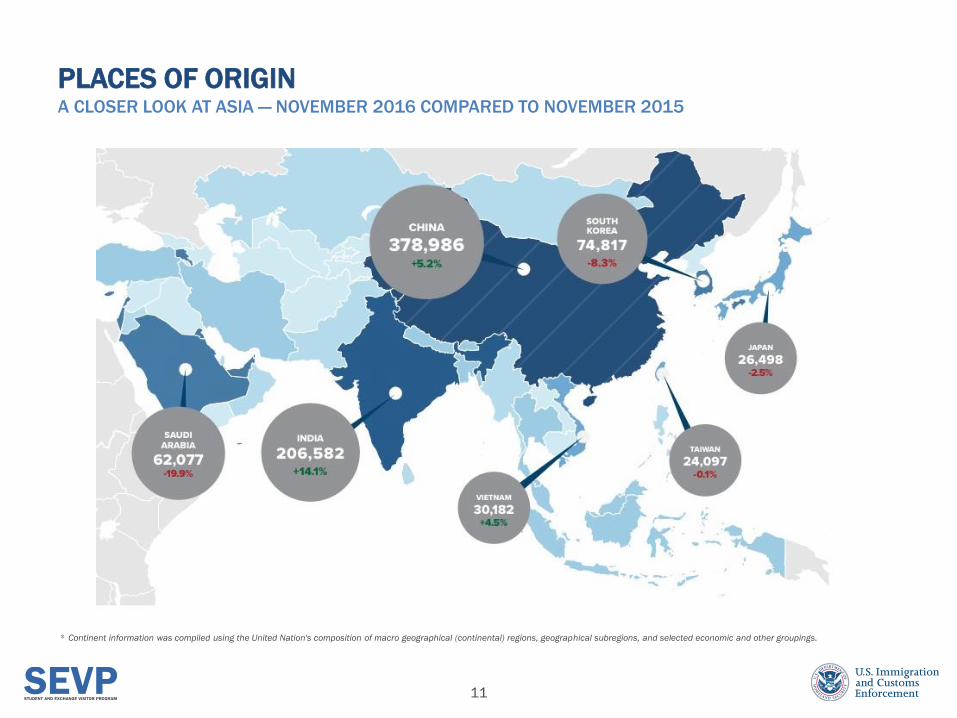
PLACES OF ORIGIN A CLOSER LOOK AT ASIA — NOVEMBER 2016 COMPARED TO NOVEMBER 2015
* Continent information was compiled using the United Nation's composition of macro geographical (continental) regions, geographical subregions, and selected economic and other groupings.
12
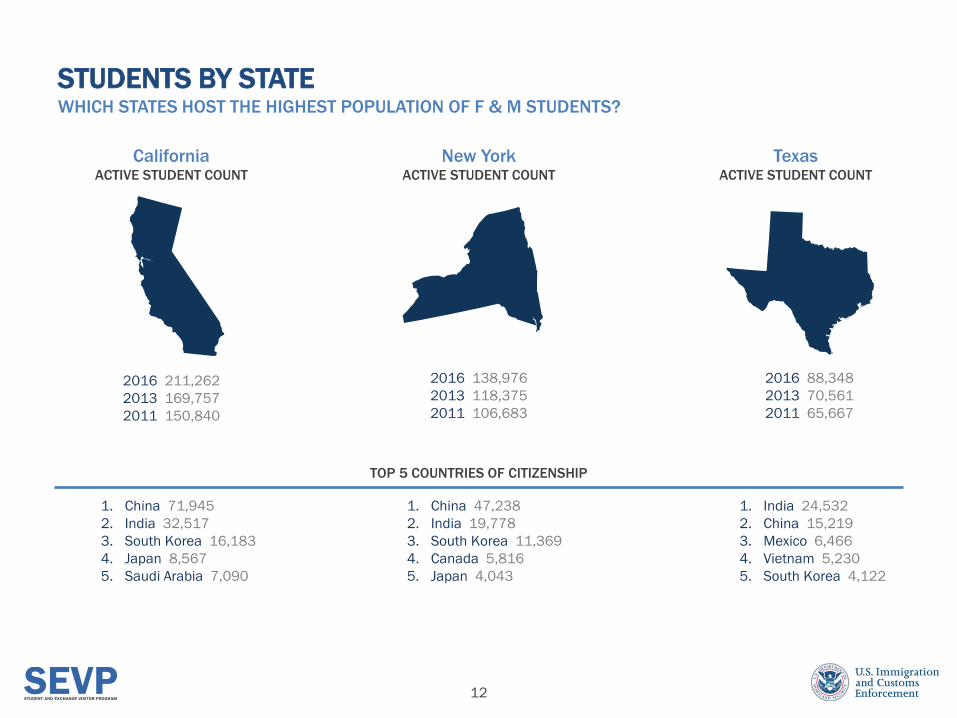
2016 211,262
2013 169,757
2011 150,840
1. China 71,945
2. India 32,517
3. South Korea 16,183
4. Japan 8,567
5. Saudi Arabia 7,090
2016 138,976
2013 118,375
2011 106,683
1. China 47,238
2. India 19,778
3. South Korea 11,369
4. Canada 5,816
5. Japan 4,043
2016 88,348
2013 70,561
2011 65,667
1. India 24,532
2. China 15,219
3. Mexico 6,466
4. Vietnam 5,230
5. South Korea 4,122
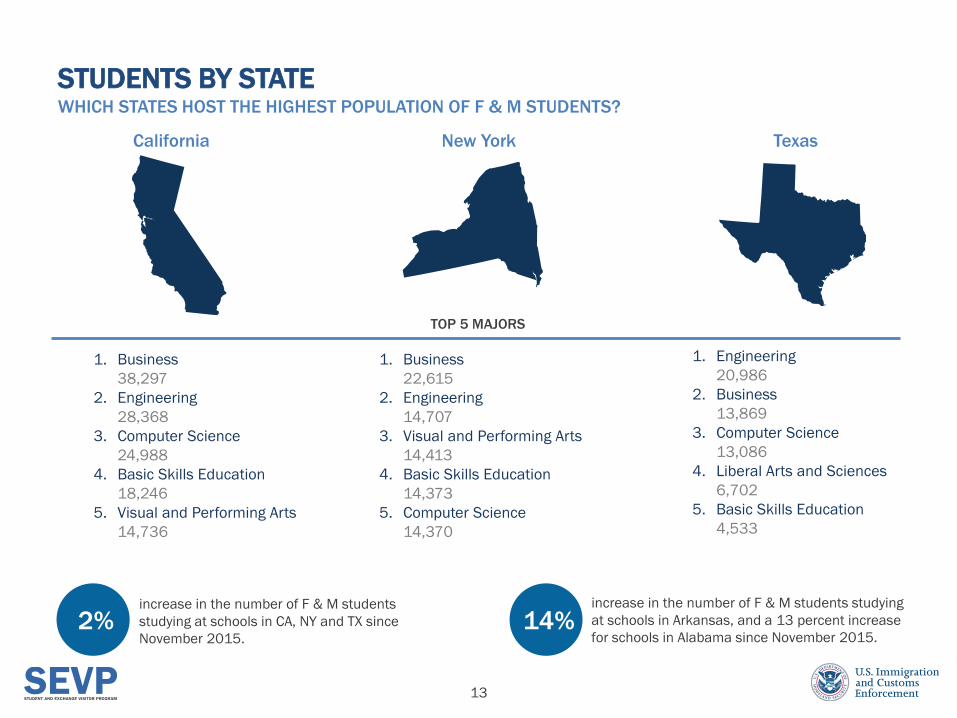
STUDENTS BY STATE WHICH STATES HOST THE HIGHEST POPULATION OF F & M STUDENTS?
TOP 5 COUNTRIES OF CITIZENSHIP
ACTIVE STUDENT COUNT ACTIVE STUDENT COUNT ACTIVE STUDENT COUNT
California New York Texas
13
increase in the number of F & M students studying
at schools in Arkansas, and a 13 percent increase
for schools in Alabama since November 2015.
increase in the number of F & M students
studying at schools in CA, NY and TX since
November 2015.
1. Business
38,297
2. Engineering
28,368
3. Computer Science
24,988
4. Basic Skills Education
18,246
5. Visual and Performing Arts
14,736
STUDENTS BY STATE WHICH STATES HOST THE HIGHEST POPULATION OF F & M STUDENTS?
1. Business
22,615
2. Engineering
14,707
3. Visual and Performing Arts
14,413
4. Basic Skills Education
14,373
5. Computer Science
14,370
1. Engineering
20,986
2. Business
13,869
3. Computer Science
13,086
4. Liberal Arts and Sciences
6,702
5. Basic Skills Education
4,533
2% 14%
TOP 5 MAJORS
California New York Texas
14
SCHOOLS
v
15
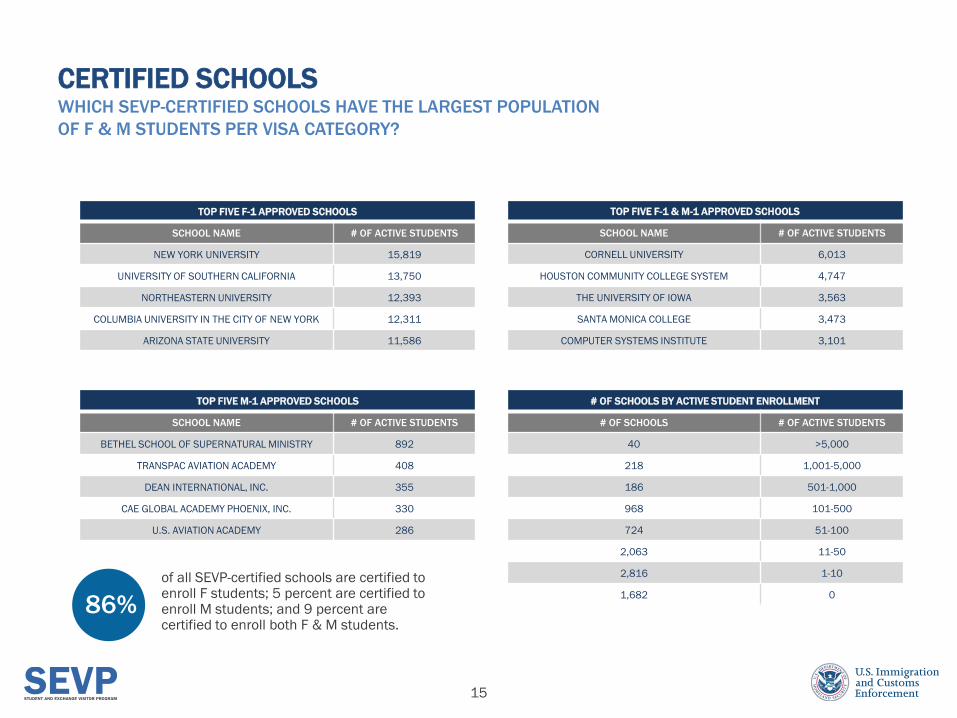
CERTIFIED SCHOOLS WHICH SEVP-CERTIFIED SCHOOLS HAVE THE LARGEST POPULATION
OF F & M STUDENTS PER VISA CATEGORY?
# OF SCHOOLS BY ACTIVE STUDENT ENROLLMENT
# OF SCHOOLS # OF ACTIVE STUDENTS
40 >5,000
218 1,001-5,000
186 501-1,000
968 101-500
724 51-100
2,063 11-50
2,816 1-10
1,682 0
TOP FIVE M-1 APPROVED SCHOOLS
SCHOOL NAME # OF ACTIVE STUDENTS
BETHEL SCHOOL OF SUPERNATURAL MINISTRY 892
TRANSPAC AVIATION ACADEMY 408
DEAN INTERNATIONAL, INC. 355
CAE GLOBAL ACADEMY PHOENIX, INC. 330
U.S. AVIATION ACADEMY 286
TOP FIVE F-1 & M-1 APPROVED SCHOOLS
SCHOOL NAME # OF ACTIVE STUDENTS
CORNELL UNIVERSITY 6,013
HOUSTON COMMUNITY COLLEGE SYSTEM 4,747
THE UNIVERSITY OF IOWA 3,563
SANTA MONICA COLLEGE 3,473
COMPUTER SYSTEMS INSTITUTE 3,101
TOP FIVE F-1 APPROVED SCHOOLS
SCHOOL NAME # OF ACTIVE STUDENTS
NEW YORK UNIVERSITY 15,819
UNIVERSITY OF SOUTHERN CALIFORNIA 13,750
NORTHEASTERN UNIVERSITY 12,393
COLUMBIA UNIVERSITY IN THE CITY OF NEW YORK 12,311
ARIZONA STATE UNIVERSITY 11,586
of all SEVP-certified schools are certified to enroll F students; 5 percent are certified to enroll M students; and 9 percent are certified to enroll both F & M students.
86%
16
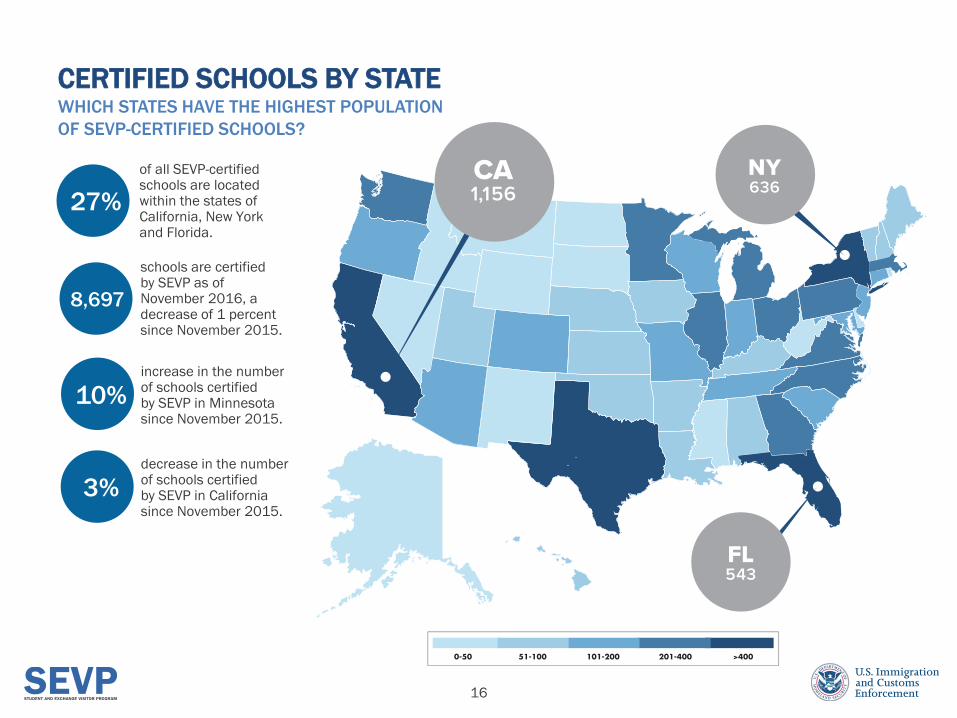
CERTIFIED SCHOOLS BY STATE WHICH STATES HAVE THE HIGHEST POPULATION
OF SEVP-CERTIFIED SCHOOLS?
schools are certified by SEVP as of November 2016, a decrease of 1 percent since November 2015.
of all SEVP-certified schools are located within the states of California, New York and Florida.
27%
8,697
increase in the number of schools certified by SEVP in Minnesota since November 2015.
10%
decrease in the number of schools certified by SEVP in California since November 2015.
3%
17
ACTIVE STUDENT COUNT
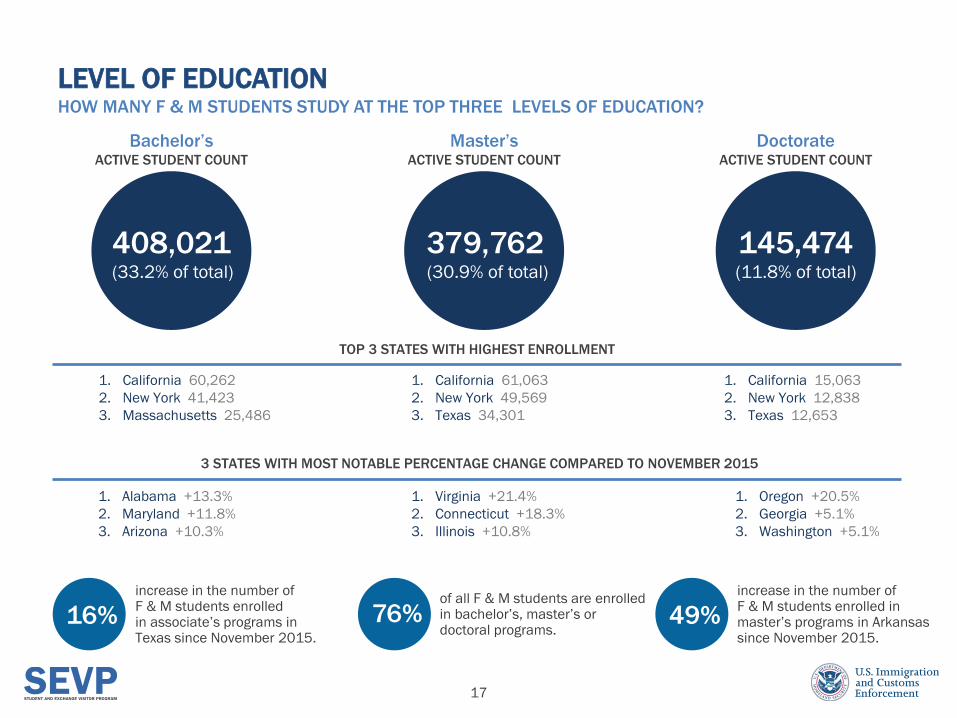
LEVEL OF EDUCATION HOW MANY F & M STUDENTS STUDY AT THE TOP THREE LEVELS OF EDUCATION?
increase in the number of F & M students enrolled in master’s programs in Arkansas since November 2015.
increase in the number of F & M students enrolled in associate’s programs in Texas since November 2015.
16% 49%
ACTIVE STUDENT COUNT ACTIVE STUDENT COUNT
of all F & M students are enrolled in bachelor’s, master’s or doctoral programs.
76%
1. California 60,262
2. New York 41,423
3. Massachusetts 25,486
1. California 61,063
2. New York 49,569
3. Texas 34,301
1. California 15,063
2. New York 12,838
3. Texas 12,653
Bachelor’s Master’s Doctorate
TOP 3 STATES WITH HIGHEST ENROLLMENT
3 STATES WITH MOST NOTABLE PERCENTAGE CHANGE COMPARED TO NOVEMBER 2015
1. Alabama +13.3%
2. Maryland +11.8%
3. Arizona +10.3%
1. Virginia +21.4%
2. Connecticut +18.3%
3. Illinois +10.8%
1. Oregon +20.5%
2. Georgia +5.1%
3. Washington +5.1%
408,021 (33.2% of total)
379,762 (30.9% of total)
145,474 (11.8% of total)
18
STEM DATA
v
19
STEM FIELDS OF STUDY
STEM programs are popular at American colleges and universities. Graduates from these programs are
important to innovation and job creation in the United States.
An F-1 and/or M-1 student can find STEM programs at all educational levels. Many colleges and universities
offer programs in these fields at both the undergraduate and graduate levels. Community colleges also have
a variety of STEM programs in which a student may enroll.
STEM programs are classified according to the Classification of Instructional Programs codes developed by
the U.S. Department of Education's National Center for Education Statistics.
20
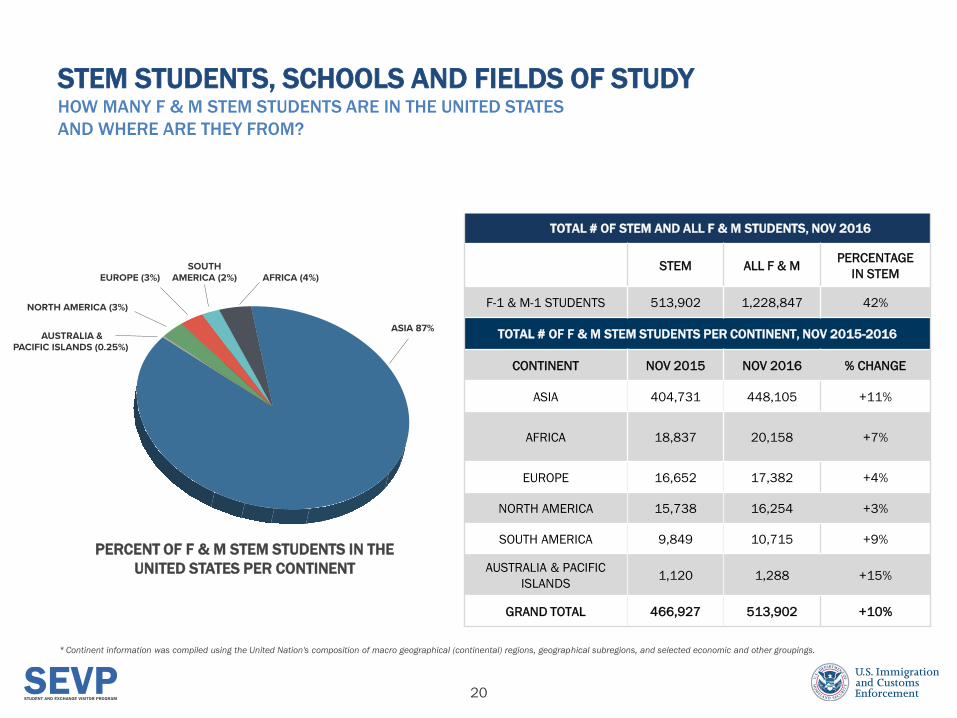
TOTAL # OF STEM AND ALL F & M STUDENTS, NOV 2016
STEM ALL F & M PERCENTAGE
IN STEM
F-1 & M-1 STUDENTS 513,902 1,228,847 42%
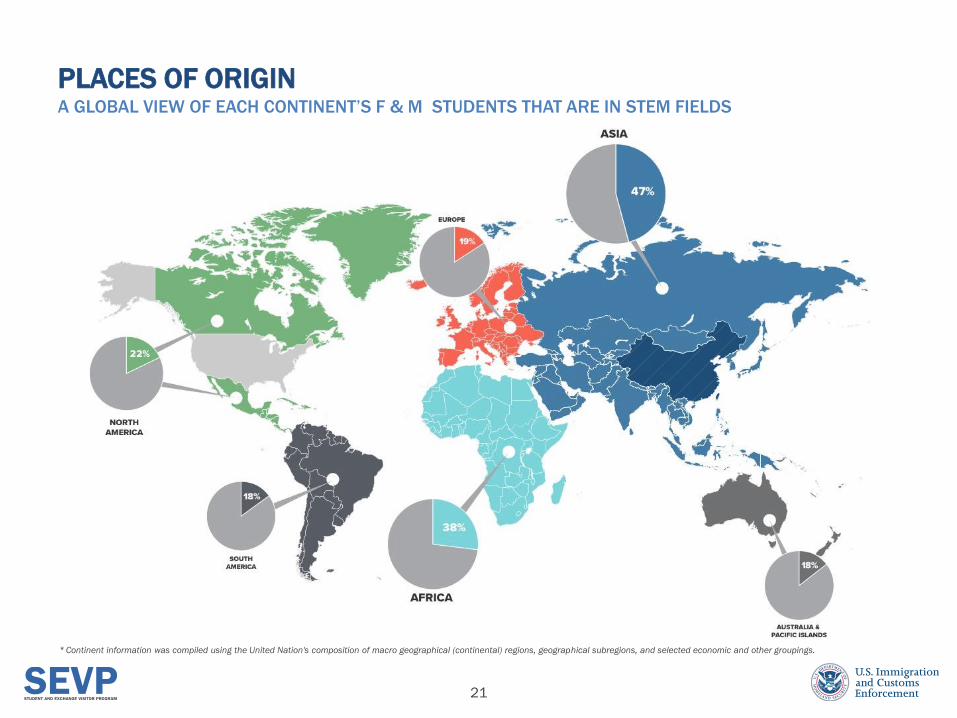
TOTAL # OF F & M STEM STUDENTS PER CONTINENT, NOV 2015-2016
CONTINENT NOV 2015 NOV 2016 % CHANGE
ASIA 404,731 448,105 +11%
AFRICA 18,837 20,158 +7%
EUROPE 16,652 17,382 +4%
NORTH AMERICA 15,738 16,254 +3%
SOUTH AMERICA 9,849 10,715 +9%
AUSTRALIA & PACIFIC
ISLANDS 1,120 1,288 +15%
GRAND TOTAL 466,927 513,902 +10%
PERCENT OF F & M STEM STUDENTS IN THE
UNITED STATES PER CONTINENT
STEM STUDENTS, SCHOOLS AND FIELDS OF STUDY HOW MANY F & M STEM STUDENTS ARE IN THE UNITED STATES
AND WHERE ARE THEY FROM?
* Continent information was compiled using the United Nation's composition of macro geographical (continental) regions, geographical subregions, and selected economic and other groupings.
21
PLACES OF ORIGIN A GLOBAL VIEW OF EACH CONTINENT’S F & M STUDENTS THAT ARE IN STEM FIELDS
* Continent information was compiled using the United Nation's composition of macro geographical (continental) regions, geographical subregions, and selected economic and other groupings.
22
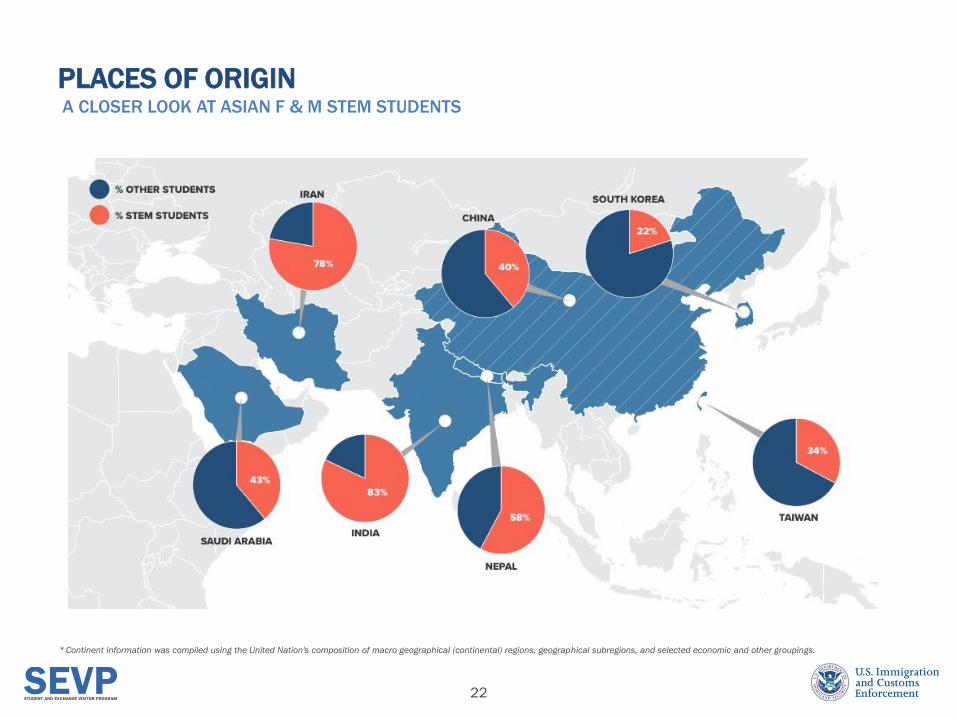
PLACES OF ORIGIN A CLOSER LOOK AT ASIAN F & M STEM STUDENTS
* Continent information was compiled using the United Nation's composition of macro geographical (continental) regions, geographical subregions, and selected economic and other groupings.
23
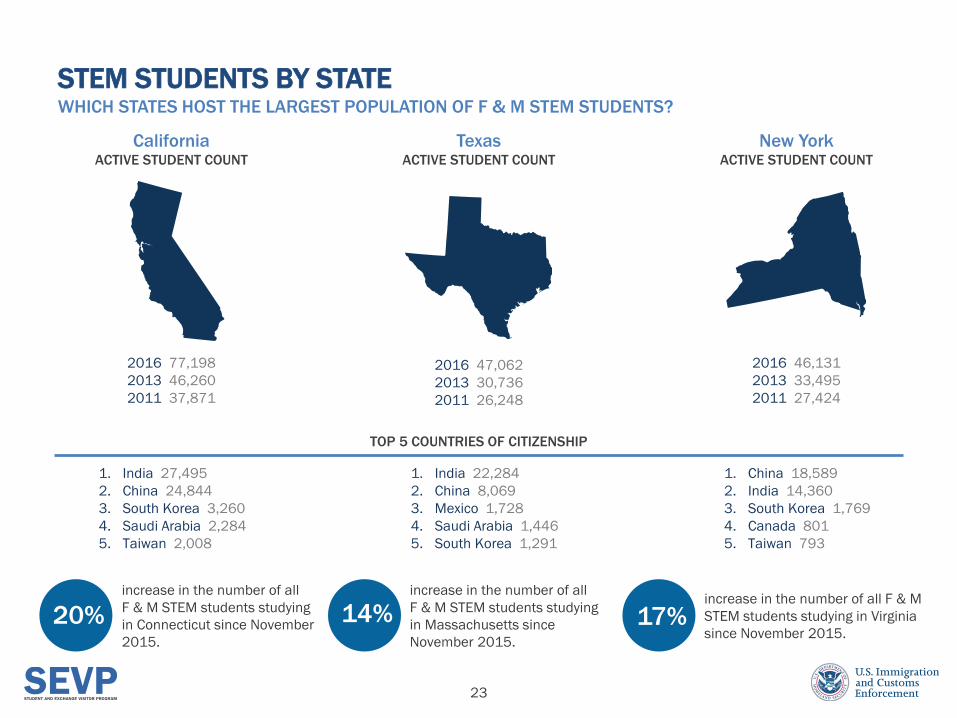
2016 77,198
2013 46,260
2011 37,871
2016 47,062
2013 30,736
2011 26,248
2016 46,131
2013 33,495
2011 27,424
STEM STUDENTS BY STATE WHICH STATES HOST THE LARGEST POPULATION OF F & M STEM STUDENTS?
TOP 5 COUNTRIES OF CITIZENSHIP
ACTIVE STUDENT COUNT ACTIVE STUDENT COUNT ACTIVE STUDENT COUNT
California Texas New York
increase in the number of all F & M
STEM students studying in Virginia
since November 2015.
increase in the number of all
F & M STEM students studying
in Connecticut since November
2015.
20% 17%
increase in the number of all
F & M STEM students studying
in Massachusetts since
November 2015.
14%
1. India 27,495
2. China 24,844
3. South Korea 3,260
4. Saudi Arabia 2,284
5. Taiwan 2,008
1. India 22,284
2. China 8,069
3. Mexico 1,728
4. Saudi Arabia 1,446
5. South Korea 1,291
1. China 18,589
2. India 14,360
3. South Korea 1,769
4. Canada 801
5. Taiwan 793
24
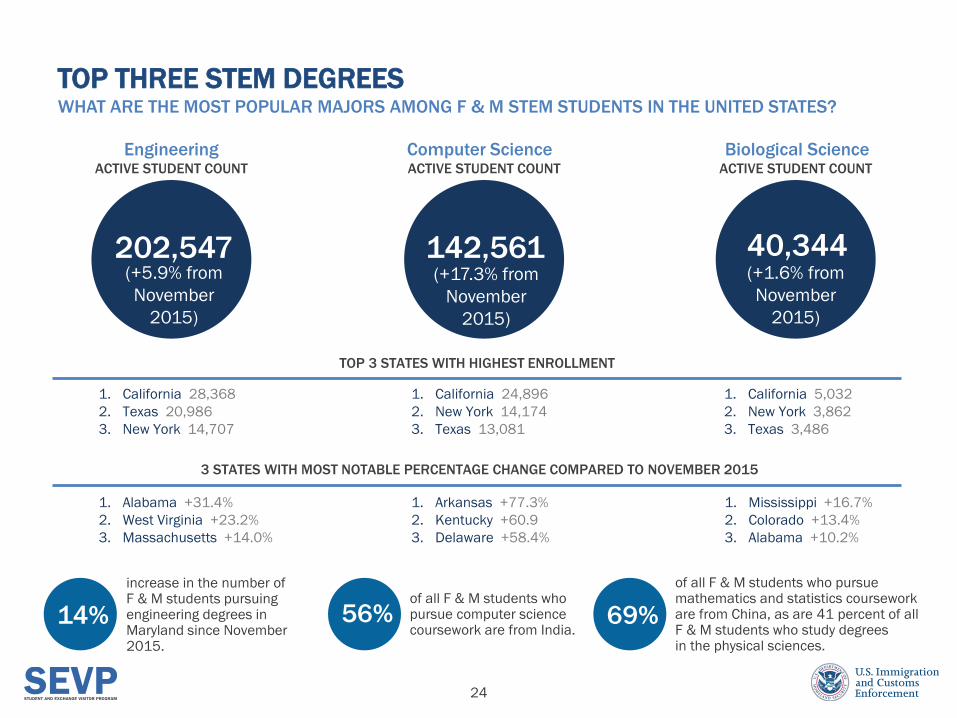
TOP THREE STEM DEGREES WHAT ARE THE MOST POPULAR MAJORS AMONG F & M STEM STUDENTS IN THE UNITED STATES?
ACTIVE STUDENT COUNT
of all F & M students who pursue mathematics and statistics coursework are from China, as are 41 percent of all F & M students who study degrees in the physical sciences.
increase in the number of F & M students pursuing engineering degrees in Maryland since November 2015.
14% 69%
ACTIVE STUDENT COUNT ACTIVE STUDENT COUNT
of all F & M students who pursue computer science coursework are from India.
56%
1. California 28,368
2. Texas 20,986
3. New York 14,707
1. California 24,896
2. New York 14,174
3. Texas 13,081
1. California 5,032
2. New York 3,862
3. Texas 3,486
Engineering Computer Science Biological Science
TOP 3 STATES WITH HIGHEST ENROLLMENT
3 STATES WITH MOST NOTABLE PERCENTAGE CHANGE COMPARED TO NOVEMBER 2015
1. Alabama +31.4%
2. West Virginia +23.2%
3. Massachusetts +14.0%
1. Arkansas +77.3%
2. Kentucky +60.9
3. Delaware +58.4%
1. Mississippi +16.7%
2. Colorado +13.4%
3. Alabama +10.2%
202,547 (+5.9% from
November
2015)
142,561 (+17.3% from
November
2015)
40,344 (+1.6% from
November
2015)