GENERAL ARTICLE Big DataAnalytics - ias
22
695 RESONANCE August 2016 GENERAL ARTICLE Big Data Analytics V Rajaraman Keywords Big data, data science, fourth paradigm, MapReduce, Hadoop. V Rajaraman is at the Indian Institute of Science, Bengaluru. Several generations of scientists and engineers in India have learnt computer science using his lucidly written textbooks on programming and computer fundamentals. His current research interests are parallel computing and history of computing. The volume and variety of data being generated using com- puters is doubling every two years. It is estimated that in 2015, 8 Zettabytes (Zetta=10 21 ) were generated which consisted mostly of unstructured data such as emails, blogs, Twitter, Facebook posts, images, and videos. This is called big data. It is possible to analyse such huge data collections with clusters of thousands of inexpensive computers to discover patterns in the data that have many applications. But analysing massive amounts of data available in the Internet has the potential of impinging on our privacy. Inappropriate analysis of big data can lead to misleading conclusions. In this article, we explain what is big data, how it is analysed, and give some case studies illustrating the potentials and pitfalls of big data analytics. Introduction I got an email from my brother-in-law, who was to visit me, giving his travel schedule with flight details. He was staying with me for a few days. On the day of his departure, I got a message from Google on my smart phone that he should be leaving my home at 8.30 pm as his plane was delayed by 55 minutes and it will take 41 minutes for him to reach the airport from my home as no traffic snarls were reported. I was shocked. How did Google know that my brother-in-law was staying with me, which flight he was taking, where my home was, traffic conditions, and flight infor- mation? I then realized that Google was performing big data analysis on the data it had gathered from the emails we exchanged about the flights my brother-in-law was taking, informing that he will be staying with me, along with GPS (Global Positioning System) data and Google map co-ordinates to find the location of my smart phone which it guessed was my home, and real-time data from the airline’s database on the flight’s delay. On the one hand, it was nice to be told when my brother-in-law should leave
Transcript of GENERAL ARTICLE Big DataAnalytics - ias
695RESONANCE August 2016
GENERAL ARTICLE
Big Data Analytics
V Rajaraman
KeywordsBig data, data science, fourthparadigm, MapReduce, Hadoop.
V Rajaraman is at theIndian Institute of Science,
Bengaluru. Severalgenerations of scientistsand engineers in Indiahave learnt computerscience using his lucidlywritten textbooks onprogramming and
computer fundamentals.His current researchinterests are parallel
computing and history ofcomputing.
The volume and variety of data being generated using com-puters is doubling every two years. It is estimated that in 2015,8 Zettabytes (Zetta=1021) were generated which consistedmostly of unstructured data such as emails, blogs, Twitter,Facebook posts, images, and videos. This is called big data. Itis possible to analyse such huge data collections with clustersof thousands of inexpensive computers to discover patterns inthe data that have many applications. But analysing massiveamounts of data available in the Internet has the potential ofimpinging on our privacy. Inappropriate analysis of big datacan lead to misleading conclusions. In this article, we explainwhat is big data, how it is analysed, and give some case studiesillustrating the potentials and pitfalls of big data analytics.
Introduction
I got an email frommy brother-in-law, whowas to visit me, givinghis travel schedule with flight details. He was staying with me fora few days. On the day of his departure, I got a message fromGoogle on my smart phone that he should be leaving my home at8.30 pmas his planewas delayed by 55 minutes and it will take 41minutes for him to reach the airport from my home as no trafficsnarls were reported. I was shocked. How did Google know thatmy brother-in-law was staying with me, which flight he wastaking, where my home was, traffic conditions, and flight infor-mation? I then realized that Google was performing big dataanalysis on the data it had gathered from the emails we exchangedabout the flights my brother-in-law was taking, informing that hewill be staying with me, along with GPS (Global PositioningSystem) data and Google map co-ordinates to find the location ofmy smart phone which it guessed was my home, and real-timedata from the airline’s database on the flight’s delay. On the onehand, it was nice to be told when my brother-in-law should leave
696 RESONANCE August 2016
GENERAL ARTICLE
our house and not waste time at the airport. On the other hand, Iwas concerned that I had lost my privacy. Google was reading allmy emails and knew where I lived. This is the power of big dataanalytics. It is a double-edged sword.
There are other situations that you would have encountered if youshop using thewebsites of e-commerce companies such as Flipkartor Amazon. The web portals remember what items you boughtduring the past fewmonths, and even suggest that you buy a knifesharpener (with picture and prices) when you place an order for aknife. If you order a book it will give you a list of other books youwould probably like to buy as some other buyers with taste similarto yours have bought.
These are two typical examples of the power of big data analytics.By now you will be wondering what big data analytics is all aboutand how does it do what seems like magic. The purpose of thisarticle is to explain the technology behind big data analytics andthe pros and cons of using this tool.
What is Big Data?
There are several definitions of big data which look at it fromdifferent points of view. We give some of them here:
Mills et al [1] define big data as:
Big data is a term that is used to describe data that is high volume,high velocity, and/or high variety; requires new technologies andtechniques to capture, store, and analyze it; and is used toenhance decision making, provide insight and discovery, andsupport and optimize processes.
National Institute of Standards and Technology, USA [2] definesbig data as:
Big data is where the data volume, acquisition velocity, or datarepresentation limits the ability to perform effective analysisusing traditional relational approaches or requires the use ofsignificant scaling (more nodes) for efficient processing.
697RESONANCE August 2016
GENERAL ARTICLE
Ward andBarker [3] after surveying twelve definitions byGartner,Microsoft, Oracle, Intel etc., distil them and define big data as:
Big data is a term describing the storage and analysis of largeand/or complex data sets using a series of techniques including,but not limited to: NoSQL, MapReduce, and machine learning.
(see Box 1 for an explanation of NoSQL. We discuss MapReducelater in this article. A Glossary on p.715 of the article providesquick reference to new terminology used in this article)
An analysis of these definitions shows that all of them emphasizethe massiveness of the data which the term implies, its variety andrate of change and that the data need to be analysed to gain insightinto what it implies. In addition, the analysis needs new tools andmassive computing resources.
Data Science, of which big data analytics is an important compo-nent, has ushered in the fourth paradigm1 [4] in science. Twoearlier paradigms were theoretical science and experimental sci-ence. This was followed in the last two decades by a thirdparadigm, simulation. The advent of high performance computersimulations reduced the number of experiments conducted toauthenticate a hypothesis and led to the field of computationalscience. The latest, namely, the fourth paradigm has been en-abled by Data Science. The fourth paradigm is data-driven
All definitions of bigdata emphasize themassiveness of thedata which the termimplies, its variety andrate of change andthat the data need tobe analysed to gaininsight into what itimplies. In addition,the analysis needsnew tools andmassive computingresources.
1 Paradigm refers to a philo-sophical/theoretical framework.
Box 1. What is NoSQL?
Traditionally data bases of computers were used primarily to store data appropriate for business dataprocessing. From the late 70’s data was organized as tables with each row containing a key and attributesof a data item e.g., item code as key, with item name, quantity in stock, price per item etc. This was calledRelational Data Base Management System (RDBMS). A query language called SQL (Structured QueryLanguage) was standardised and widely used to retrieve relevant data from relational data bases. With theadvent of new variety of data such as documents, images, audio etc., in which data grows and shrinksdynamically, the organization and retrieval of data required a different approach. This led to thedevelopment of NoSQL (for Not SQL) which are different database storage structures (non-relational)with a more flexible querying to retrieve data. Some examples of NoSQL database organizations areMongo DB and Cassandra. (See SQL Vs NoSQL – What you need to know – www.dataconomy.com/sql-vs-nosql-need-know/)
698 RESONANCE August 2016
GENERAL ARTICLE
discovery of new hypotheses which may lead to the formulationof novel theories. SeeBox2 for elaborationofData Science andDataScientist.
Returning to our example, the recommendation by Amazon that Iwould be interested in certain types of books based on my pastpurchases and also the buying pattern of persons with “similartaste” was enabled by analysing massive amount of data whichAmazon’s computers had gathered from millions of customers.This is a typical recommendation system. The recommendationthat my brother-in-law should leave for the airport at a specifiedtime was also based on the analysis of a variety of data, namelyemails, GPS data, Google maps, and airline’s database collectedover an extended period. Discovering patterns in massive data ofdiverse varieties to formulate new theories is the essence of thefourth paradigm. One has to be cautious in relying entirely on bigdata analysis to formulate theories, as we will see later in thisarticle.
5 ‘V’s of Big Data
The term big data emphasises volume or size. Size is a relativeterm. In the 1960s, 20Megabytes was considered large. Now datais not considered big unless it is several hundred Petabytes (Peta= 1015 ). Size is not the only property used to describe big data. In
Box 2. Data Science and Data Scientist
Data Science is a field of study concerned with the collection, cleaning, and anonymising (if required) largequantities of data of diverse variety relevant for solving real-life problems and analysing them to initiatemeaningful actions. A data scientist normally works as a member of an inter-disciplinary group and buildsmodels and develops algorithms to extract meaningful relations or inferences which would normally beused to build a data product. A data scientist should know how to use the tools of statistics, machinelearning, software engineering, visualisation, and should have an education in a discipline such as lifesciences, physical sciences, chemical sciences, social sciences, or engineering. A data scientist requiresskills to communicate in clear language and use visualization tools, when necessary, to convey to the teamthe implications derived from data to enable data-driven decision making*.
* C O’Neil and R Schutt, Doing Data Science, O’Reilly Media, 2013.
The fourthparadigm is data-driven discovery ofnew hypotheses
which may lead tothe formulation ofnovel theories.
699RESONANCE August 2016
GENERAL ARTICLE
addition to volume which we expand on, there are other importantproperties that we will discuss in what follows:
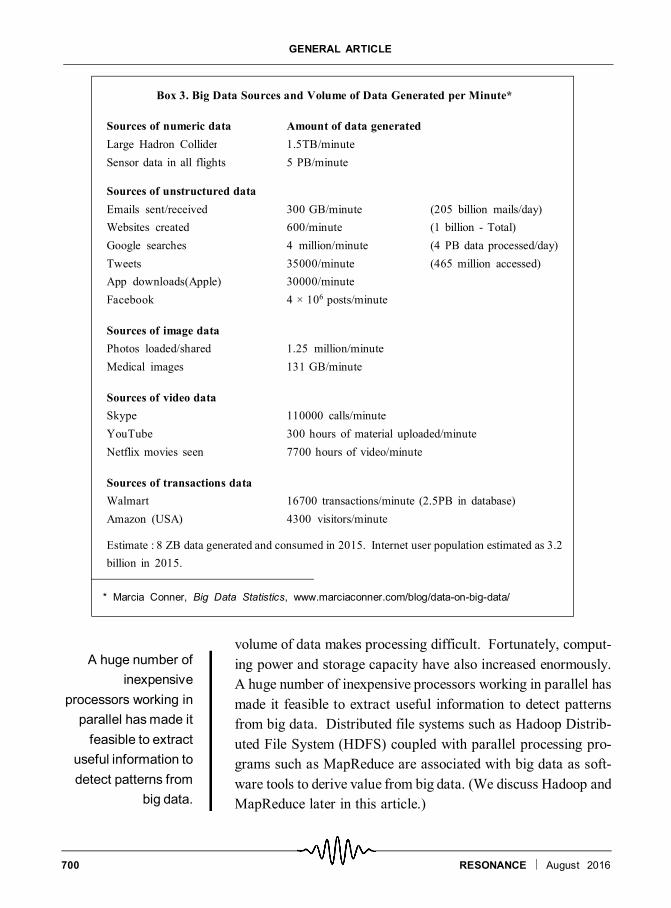
Volume: Amount of global digital data created, replicated, andconsumed in 2013 was estimated by the International Data Cor-poration (a company which publishes research reports) as 4.4Zettabytes (ZB) (Zetta = 1021). It is doubling every 2 years. By2015, digital data grew to 8 ZB and is expected to grow to 12 ZBin 2016. To give an idea of a ZB, it is the storage required to store200 billion high definition movies which will take a person 24million years to watch! In Box 3 we tabulate some of the big datasources and the volume of data generated.
Variety: In the 1960s, the predominant data types were numbersand text. Today, in addition to numbers and text, there are image,audio, and video data. Large Hadron Collider (LHC), earth andpolar observations generate mainly numeric data. Word proces-sors, emails, tweets, blogs, and other social media generateprimarily unstructured textual data. Medical images and billionsof photographs which people take using their mobile phones areimage data. Surveillance cameras and movies produce videodata. Music sites store audio data. Most data in the 80s werestructured and organized as tables with keys. Today they areunstructured and multimedia data often used together.
Velocity: Data in conventional databases used to change slowly.Now most data are real time. For example, phone conversations,data acquired from experiments, data sent by sensors, data ex-changed using the Internet, and stock price data are all real time.Large amounts of data are transient and need to be analysed as andwhen they are generated. They become irrelevant fast.
Veracity: A lot of data generated are noisy, e.g., data fromsensors. Data are often incorrect. For example, many websitesyou access may not have the correct information. It is difficult tobe absolutely certain about the veracity of big data.
Value: Data by itself is of no value unless it is processed to obtaininformation using which one may initiate actions. The large
Size is not the onlyproperty used todescribe big data.In addition, otherproperties areVolume, Variety,Velocity,Veracityand Value – called5 ‘V’s of big data.
700 RESONANCE August 2016
GENERAL ARTICLE
volume of data makes processing difficult. Fortunately, comput-ing power and storage capacity have also increased enormously.A huge number of inexpensive processors working in parallel hasmade it feasible to extract useful information to detect patternsfrom big data. Distributed file systems such as Hadoop Distrib-uted File System (HDFS) coupled with parallel processing pro-grams such as MapReduce are associated with big data as soft-ware tools to derive value from big data. (We discuss Hadoop andMapReduce later in this article.)
Box 3. Big Data Sources and Volume of Data Generated per Minute*
Sources of numeric data Amount of data generatedLarge Hadron Collider 1.5TB/minuteSensor data in all flights 5 PB/minute
Sources of unstructured dataEmails sent/received 300 GB/minute (205 billion mails/day)Websites created 600/minute (1 billion - Total)Google searches 4 million/minute (4 PB data processed/day)Tweets 35000/minute (465 million accessed)App downloads(Apple) 30000/minuteFacebook 4 × 10⁶ posts/minute
Sources of image dataPhotos loaded/shared 1.25 million/minuteMedical images 131 GB/minute
Sources of video dataSkype 110000 calls/minuteYouTube 300 hours of material uploaded/minuteNetflix movies seen 7700 hours of video/minute
Sources of transactions dataWalmart 16700 transactions/minute (2.5PB in database)Amazon (USA) 4300 visitors/minute
Estimate : 8 ZB data generated and consumed in 2015. Internet user population estimated as 3.2billion in 2015.
* Marcia Conner, Big Data Statistics, www.marciaconner.com/blog/data-on-big-data/
A huge number ofinexpensive
processors working inparallel hasmade itfeasible to extract
useful information todetect patterns from
big data.
701RESONANCE August 2016
GENERAL ARTICLE
Analysing Big Data
Data analytics is concerned with extraction of actionable knowl-edge and insights from big data. This is done by hypothesisformulation that is often based on conjectures gathered fromexperience and discovering (sometimes serendipitously) correla-tions among variables. There are four types of data analytics.They are:
Descriptive Analytics: This essentially tells what happened inthe past and presents it in an easily understandable form. Datagathered is organized as bar charts, graphs, pie charts, maps,scatter diagrams, etc., for easy visualization which gives insightinto what the data implies. This form of data presentation is oftencalled a dash board, mimicking the dashboard of a car which givesinformation on speed, engine status, petrol left in the tank,distance travelled etc. A typical example of descriptive analyticsis presentation of population census data which classifies popula-tion across a country by sex, age groups, education, income,population density and similar parameters.
Predictive Analytics: It extrapolates from available data and tellswhat is expected to happen in the near future. The tools used forextrapolation are time series analysis using statistical methods,neural networks, and machine learning algorithms. One majoruse of predictive analytics is in marketing by comprehendingcustomers’ needs and preferences. An example is the advertise-ment on socks that appears when you buy shoes from an e-shop.Another common use is in managing election campaigns bycollecting variety of data such as composition of electorates invarious locations, perception of their requirements such as infra-structure and local issues.
Exploratory or Discovery Analytics: This finds unexpected rela-tionships among parameters in collections of big data. Collectionof data from a variety of sources and analyzing them providesadditional opportunities for insights and serendipitous discovery.One of the major applications is discovering patterns in
Data analytics isconcerned withextraction ofactionableknowledge andinsights from bigdata.
PredictiveAnalyticsextrapolates fromavailable data andtells what isexpected to happenin the near future.
DiscoveryAnalyticsfinds unexpectedrelationships amongparameters incollections of bigdata.
702 RESONANCE August 2016
GENERAL ARTICLE
customers’ behaviour by companies using their feedback, tweets,blogs. Facebook data, emails, sales trends etc. Based on thecustomers’ behaviour it may be possible for companies to foretelltheir actions such as renewing magazine subscription, changingmobile phone service provider, cancelling a hotel reservation. Acompany may then come up with an attractive offer to try andchange the customer’s anticipated action.
Prescriptive analytics: This identifies, based on data gathered,opportunities to optimize solutions to existing problems. In otherwords, the analysis tells us what to do to achieve a goal. One ofthe common uses is in airlines’ pricing of seats based on historicaldata of travel patterns, popular origins and destinations, majorevents, holidays, etc., to maximize profit.
Examples of Big Data Analytics
In this section, nine examples of use of big data analytics in avariety of applications are outlined:
1. Predicting whether a wait-listed train ticket will be con-firmed: India has one of the largest railway networks in theworld. It runs around 8500 trains each day and there are around7000 railway stations of which about 300 are major stations. 20million passengers travel on a given day. The total number ofreserved seats/berths issued every day is around 250,000 andreservation can be made 60 days in advance. The allocation ofreserved seats is very complicated. There are quotas for VIPs,ladies, emergency travel, handicapped persons etc. There are alsoquotas for starting and intermediate stations. Besides these, thereare ‘Tatkal’ berths available at a higher cost for last minutereservations. A person reserving berths/seats well ahead of timewould normally get confirmed berths/seats. Else, he or she wouldget a RAC (Reservation against Cancellation) or a wait-listedticket. A passenger with a wait-listed ticket would like to knowthe probability of getting the ticket confirmed.
The problem of predicting this is very complicated as it depends
Prescriptiveanalyticsidentifiesopportunities to
optimizesolutionsto existing
problems, basedon data gathered.
703RESONANCE August 2016
GENERAL ARTICLE
on several factors such as weekends, festivals, night train, startingor intermediate station, etc. A company in the travel businessgathered data on 10 million reservations on various trains over aperiod of 2 years. The data gathered was on wait-listed ticketsand those which got confirmed. Using the data and complexanalytics, which took into account all the constraints noted above,the company was able to predict with 90 to 95% accuracy theprobability that a wait-listed ticket with a given waiting listnumber in a given class of travel on a specified train from a givenstarting station on a given date would lead to a confirmed reserva-tion or not. The algorithm required machine learning based onpast big data collection [5].
2. Success in matching men and women in a matrimonial site:With the advent of the Internet, the method of finding potentialmarriage partners has undergone a big change. There are over adozen matrimonial sites in India such as Shaadi.com andMatrimony.com. The competition among them is intense. It ispredicted that by 2017, the turnover of matrimony sites willexceed Rs.150 billion. Matrimony.com is one of the largest sites.Around 8000 applicants register on this website every day. Nearly1500 successful matches resulting in marriages are reportedevery day to the site. Prospective applicants are from variouscountries in the world and Non-Resident Indians from 150 coun-tries register on this site. The major goal of this marriage site isto assist applicants to properly enter their profiles. The companyemploys over 2000 enquiry assistants who attend to 300,000telephone calls, SMSs, and emails every day from the applicants.The customer support team visits applicants to verify their cre-dentials. Data is gathered on pairs of applicants who corre-sponded.
The major aim of collecting all the data and analysing them is tomaximise matchmaking success by modifying the profile form ofapplicants with mandatory and optional fields. Analysing the datait has gathered, the company has found that women are moreinterested in hobbies of their prospective partners rather thantheir aspirations. Another surprising fact that has emerged is that
A company in thetravel businessgathered data on 10million reservationson various trains overa period of 2 yearson wait-listed andconfirmed tickets.Using the data andcomplex analytics,the company wasable to predict with90 to 95% accuracythe probability that await-listed ticketwould lead to aconfirmedreservation or not.
The major goal of thismarriage site is toassist applicants toproperly enter theirprofiles to maximisematchmakingsuccess by modifyingthe profile form ofapplicantswithmandatory andoptional fields.
704 RESONANCE August 2016
GENERAL ARTICLE
the women prefer non-smokers, smokers, and social smokers inthat order rather than non-smokers, social smokers, and smokers.By using big data analytics, the company expects to increase theirmatchmaking success by ten to fifteen percent in the near future.
3. Introducing a new coffee type: A coffee shop with a numberof branches located all over the country was introducing a newvariety of coffee and wanted to know the reaction of its consum-ers. As soon as they introduced the new coffee variety, theystarted monitoring the social media: twitter, blogs, and coffeedrinkers’ groups for the reaction of customers. By noon theydiscovered that most people who tasted the new variety liked itbut were unhappy about the high price. The shops were asked tolower the price and within hours they found that the negativeperception (monitored on Twitter etc) almost disappeared. Themain advantage of almost real-time monitoring of consumerreactions is the ability to take a quick decision leading to bettersales and profit.
4. Use of big data and neural networks in playing GO, a boardgame [6]: GO2, a board game, is 2500 years old (probablyinvented in China) and is popular in East Asia. GO is played bytwo players who compete by moving white and black polishedstones on a 19 × 19 grid. The player who controls the maximumterritory on the board at the end of the game is declared thewinner. There are 250 possible moves in a given board position.A new position has another 250 possible moves. It has beenpointed out that there are more possible moves in a GO game thanatoms in the Universe. Beating a human at GO was one of themost challenging problems in Artificial Intelligence (AI) as it isnot possible to analyse each possible move in a reasonable timeeven by the fastest supercomputer. The strategy used by a com-puter to play chess is largely brute force as in chess at any givenboard position there are only 35 possible moves and the conse-quence of executing all these moves can be analysed in a reason-able time by a fast computer such as IBM’s Deep Bluesupercomputer3. But a similar brute force will not work in playingGO. A clever approach to learn the strategy of moving polished
2 See www.kiseido.com to findout how to play GO.
3 KS R Anjaneyulu, Resonance,Vol.2, No.7, pp.89–90, 1997.
Themain advantageof almost real-time
monitoring ofconsumer reactionsis the ability to take a
quick decisionleading to bettersales and profit.
Beating a human atGO was one of themost challenging
problems in ArtificialIntelligence (AI) as it
is not possible toanalyse each possiblemove in a reasonable
time even by thefastest
supercomputer.
705RESONANCE August 2016
GENERAL ARTICLE
stone at any given board position to capture maximum territory inthe long run is needed. Many AI researchers felt that it wasimpossible for a computer to beat a human champion.
InMarch 2016, a computer program calledAlphaGO defeated theGO world champion Lee Sedol by 4 games to 1. AlphaGO wasdeveloped by Deep Mind, a British company specialising in AIsoftware that was acquired by Google. AlphaGO used a techniquein AI called ‘deep learning’ which relies on neural networks. Aneural network consists of a network of simulated web of neuronsas in a human brain [7]. Neural networks analyze huge amountsof data and attempt to learn a particular task. For example, ifenough photographs of automobiles of different shapes and sizesare shown to a neural network, it adjusts itself to learn to recog-nize automobiles. With increasing speed of computers, learningusing neural network has now become a standard tool of AI.Around 30 million moves were used to train AlphaGO’s neuralnetwork to play GO. This was the initial step. To hone the skillof AlphaGO the developers of the software made AlphaGO playwith itself. This led to a vast collection of moves which could beused to train AlphaGO further. The most significant aspect ofAlphaGO program is that unlike earlier game playing programs ituses big data analytics. The data from millions of GO games areused to assist machine learning techniques to beat the worldchampion.
5. Transportation and logistics: Public road transport compa-nies are using RFID (Radiofrequency Identification) and GPS totrack buses and arrive at realistic schedules. Data on number ofpassengers using the buses in different routes are used to optimizebus routes and the frequency of trips. A real-time systemhas beenimplemented to facilitate a passenger to get information on whento expect the next bus which will take him/ her to the desireddestination.
6. Elections: Political parties in India mine data on votersentiments in all constituencies. This is done by combining socialnetwork communications, personal interviews, and voter
In March 2016, acomputer programcalledAlphaGOdefeated the GOworld champion LeeSedol by 4 games to1 using a techniquein AI called ‘deeplearning’ which relieson neural networks.
Political parties inIndia mine data onvoter sentiments in allconstituencies bycombining socialnetworkcommunications,personal interviews,and votercompositions to detectlocal issues in additionto national issues.
706 RESONANCE August 2016
GENERAL ARTICLE
compositions to detect local issues in addition to national issues.These affect the decisions taken by voters to vote for a candidatebelonging to a political party. This data is used to campaign indiverse constituencies besides raising funds. Information Tech-nology professionals are being employed by political parties inboth state and national elections.
7. Public utilities: Utilities such as water supply organizationsare placing sensors in the pipelines to monitor flow of water in thecomplex water supply networks. It is reported in the Press thatBangalore Water Supply and Sewage Board is implementing areal-time monitoring system to detect leakages, illegal connec-tions and remotely control valves to ensure equitable supply ofwater to different areas of the city, reducing the need for valveoperators.
8. Computer/mobile phone based game developers: RelianceCommunications in India employs over 600 game developers andcreates games for over 2000 different types of devices. Thecompany collects data on active users of each game every day,repeat users, those who drop out, and user comments aboutgames. Over 30 million records are collected each day. Based onthis data, they improve popular games and withdraw games thatare less played.
9. Aviation industry: An Airbus A350 plane uses 6000 sensorsacross the plane. There are sensors in the wings, landing gear,engine, air conditioning system and other critical areas. Each dayaround 300 GB data is collected and analysed primarily to opti-mize engine performance to minimize fuel consumption. An-other important application is predictive analytics is, as to whena critical component may fail (based on past performance data)and replacing it. Another important analytics is to decide howmany critical components are to be stocked. It is reported thatthere is a lead time of over 3 months to obtain some critical spareparts. The need for big data analytics in planes is bound toincrease. The next generation Airbus A380 will carry 1000passengers. It will have 10, 000 sensors in each wing giving real
Each day, around300 GB of data iscollected by Airbusto optimize engineperformance andtominimize fuelconsumption.
707RESONANCE August 2016
GENERAL ARTICLE
time data. In addition, there will be sensors in engines and othersubsystems. Smarter aircrafts will be analysing big data in realtime.
Hardware and Software Systems for Analysing Big Data
We saw in the last section that an enormous amount of data fromvarious sources are needed to solve many interesting problems.Analysing big data is essential to recognize patterns in datacollections and based on that initiate meaningful actions. Thechallenge in analysing big data is the sheer size of data, variety,and the need quite often to analyse the data in real time. Fortu-nately, the processing power of computers is doubling every twoyears and the storage capacity too is doubling every 15 months,both without any increase in cost. Parallel processing of datausing thousands of inexpensive commodity processors (e.g., thoseused in desktop PCs) is eminently suitable for analysing big data.Chunks of big data can be processed independently and simulta-neously by a large number of computers and the results combinedto solvemany problems. Wewill illustrate this later in this sectionwith an example.
Hadoop System
Hadoop is the name (see Box 4) of a software system developedto process big data. It is open source software written in a highlevel programming language (Java) and the source code is freelyavailable for download from the Internet. The development ofHadoop was funded by Apache Software Foundation.
Parallel processing ofdata using thousandsof inexpensivecommodityprocessors iseminently suitable foranalysing big data.Chunks of big datacan be processedindependently andsimultaneously by alarge number ofcomputers and theresults combined tosolvemany problems.
Box 4. Origin of the Name Hadoop
A system for big data analysis was developed by Doug Cuttingand Mike Cafarella and released in 2006. When the time came toname it, Doug Cutting remembered that his young son had namedhis cuddly toy elephant Hadoop. The toy was flexible and largeand Doug Cutting jocularly suggested that the software system benamed Hadoop as it is easy to pronounce and could be used as aunique search term in Google. Mike Cafarella readily agreed.
Figure A. Picture of soft toy elephantsnamed Hadoop.

708 RESONANCE August 2016
GENERAL ARTICLE
Hadoop system [8] is designed to be used withlarge clusters (of the order of thousands) of com-modity processors each with both local mainmemory and large secondary memory (normallydisks). It consists of two major parts: one part forstoring files to be processed and the other to pro-cess in parallel the data stored in these files. Theyare called Hadoop Distributed File System (HDFS)
and MapReduce respectively. HDFS is modelled after Google filesystem andMapReduce was also originally developed by Google asa proprietary system. The idea came fromMap andReduce functionsused in a very old programming language called LISP4.
Two facts which were important considerations during the designwere:
i) When thousands of low-cost commodity processors and disksare used, the probability of one or more processors/disks failing ishigh. Thus the design has to be fault tolerant.
ii) If the system has to be widely used, the complexity of howfaults are handled by the system should be hidden from users. Inother words, a user should assume that the system is fault free.In Figure 1 we give a simple block diagram of the Hadoop System.
Yahoo uses over 42,000 computers each with a local disk in itsHadoop installation. This gives an idea of the size of Hadoopsystems.
Hadoop Distributed File System (HDFS): HDFS is designed tostore large files in which data is written once and read manytimes. Files are split and stored as 64 bytes or 128 bytes blocks.Three sets of blocks of the same file are stored in three differentcomputers (which may be in different racks), to tolerate faults.The HDFS system works in a master–slave mode. The masterprocess is executed in a node (i.e., a computer) called Name node.The Name node maintains information about files such as filenames, where they are stored, their attributes, etc., so that it has aglobal view of the file system. The Name node is vital as the whole
Figure 1. A simplified blockdiagram of Hadoop.
4 V Rajaraman, John McCarthy– Father of Artificial IntelligenceResonance, Vol.19, No.3,pp.198– 207, 2014.Harish Karnick, LISP, Reso-nance, Vol.19, No.3, pp. 208–221, 2014.
709RESONANCE August 2016
GENERAL ARTICLE
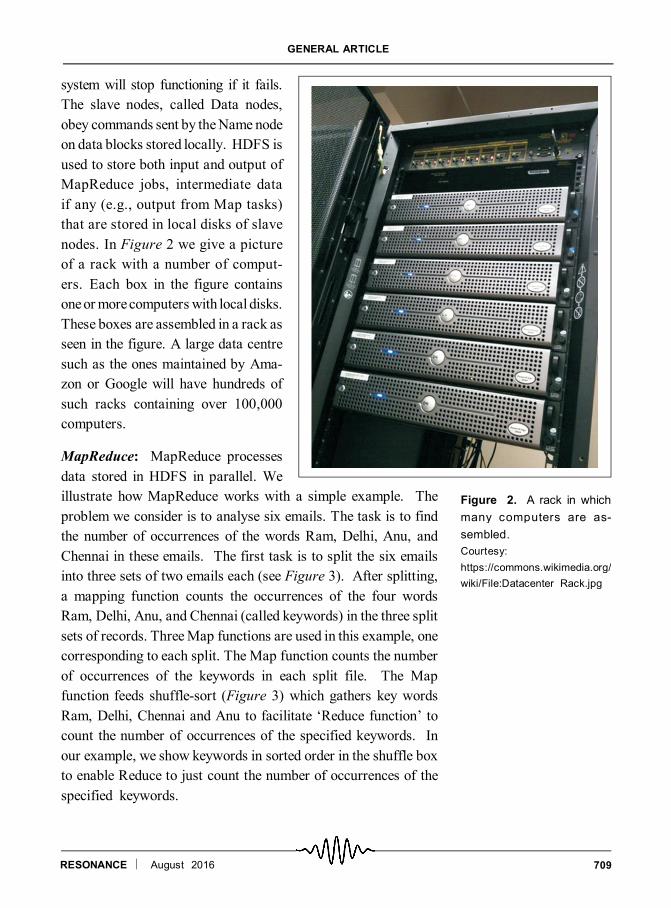
system will stop functioning if it fails.The slave nodes, called Data nodes,obey commands sent by theName nodeon data blocks stored locally. HDFS isused to store both input and output ofMapReduce jobs, intermediate dataif any (e.g., output from Map tasks)that are stored in local disks of slavenodes. In Figure 2 we give a pictureof a rack with a number of comput-ers. Each box in the figure containsoneormorecomputers with local disks.These boxes are assembled in a rack asseen in the figure. A large data centresuch as the ones maintained by Ama-zon or Google will have hundreds ofsuch racks containing over 100,000computers.
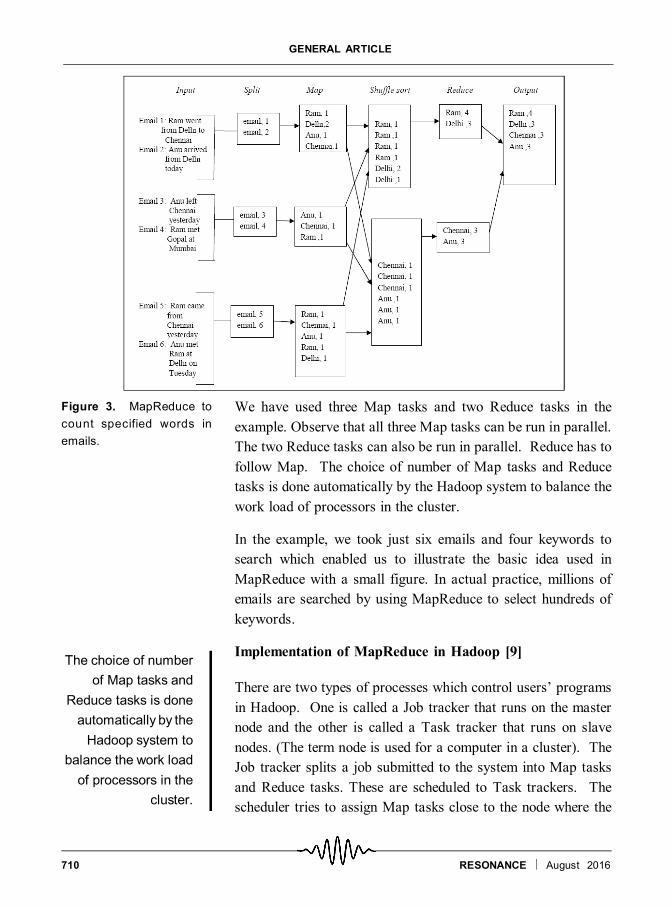
MapReduce: MapReduce processesdata stored in HDFS in parallel. Weillustrate how MapReduce works with a simple example. Theproblem we consider is to analyse six emails. The task is to findthe number of occurrences of the words Ram, Delhi, Anu, andChennai in these emails. The first task is to split the six emailsinto three sets of two emails each (see Figure 3). After splitting,a mapping function counts the occurrences of the four wordsRam, Delhi, Anu, and Chennai (called keywords) in the three splitsets of records. ThreeMap functions are used in this example, onecorresponding to each split. The Map function counts the numberof occurrences of the keywords in each split file. The Mapfunction feeds shuffle-sort (Figure 3) which gathers key wordsRam, Delhi, Chennai and Anu to facilitate ‘Reduce function’ tocount the number of occurrences of the specified keywords. Inour example, we show keywords in sorted order in the shuffle boxto enable Reduce to just count the number of occurrences of thespecified keywords.
Figure 2. A rack in whichmany computers are as-sembled.Courtesy:https://commons.wikimedia.org/wiki/File:Datacenter Rack.jpg
710 RESONANCE August 2016
GENERAL ARTICLE
We have used three Map tasks and two Reduce tasks in theexample. Observe that all three Map tasks can be run in parallel.The two Reduce tasks can also be run in parallel. Reduce has tofollow Map. The choice of number of Map tasks and Reducetasks is done automatically by the Hadoop system to balance thework load of processors in the cluster.
In the example, we took just six emails and four keywords tosearch which enabled us to illustrate the basic idea used inMapReduce with a small figure. In actual practice, millions ofemails are searched by using MapReduce to select hundreds ofkeywords.
Implementation of MapReduce in Hadoop [9]
There are two types of processes which control users’ programsin Hadoop. One is called a Job tracker that runs on the masternode and the other is called a Task tracker that runs on slavenodes. (The term node is used for a computer in a cluster). TheJob tracker splits a job submitted to the system into Map tasksand Reduce tasks. These are scheduled to Task trackers. Thescheduler tries to assign Map tasks close to the node where the
Figure 3. MapReduce tocount specified words inemails.
The choice of numberof Map tasks and
Reduce tasks is doneautomatically by theHadoop system to
balance the work loadof processors in the
cluster.
711RESONANCE August 2016
GENERAL ARTICLE
requisite data is located. The Job tracker monitors the tasks thatrun on slave nodes. When a Task tracker has no work to do, theJob tracker picks a new task from the queue and assigns it to thatTask tracker. When a Reduce task is to be performed it isassigned to a Task tracker which has completed the appropriateMap task. The Job tracker waits for a response from a Tasktracker (called a heart-beat signal) before any more tasks areassigned to it. Due to the fact that inexpensive nodes are used asTask trackers in the cluster, there is high probability that one ofthem would fail. Thus, there must be a mechanism to handle afailed Task tracker. The system does it by transferring a taskassigned to a failed Task tracker to a healthy node. The fact thata node has failed is detected by the Job tracker if it does notreceive a task completion signal from the Task tracker to which ithad assigned the task. If a Task tracker, for some reason, per-forms an assigned task slowly, the run time system of Hadoopsends the same task to another node (called a Backup task). TheJob tracker takes the results from the Task tracker which finishesfirst and aborts the other. The complexity of fault handling ishidden from the user.
Citizens and Big Data Analytics
At the beginning of this article we mentioned that big dataanalytics is like a double-edged sword. While it does provideuseful information to citizens it also leads to loss of privacy. Onecan, of course, use privacy settings or encrypt all emails but manyusers do not know how to do it. Vast amounts of medical data ofindividuals may be analysed and may lead to better diagnosis andtreatment if properly used but has the potential of irresponsibleuse. There is no legislation in India which protects privacy ofindividuals who use social media extensively. Email, Twittermessages, and Facebook data would allow unscrupulous organi-zations to ‘profile’ individuals. There has been extensive debateon this point. Many countries have privacy laws which requireanonymizing before citizens’ data is put in the public domain.
A simple anonymizing technique used in medical databases is to
The fact that anode has failed isdetected by theJob tracker if itdoes not receive atask completionsignal from theTask tracker towhich it hadassigned the task.
Vast amounts ofmedical data ofindividualsmay beanalysed and maylead to betterdiagnosis andtreatment ifproperly used buthas the potential ofirresponsible use.

712 RESONANCE August 2016
GENERAL ARTICLE
remove the name of a patient and substitute it with a number.More complex anonymization methods have been used. How-ever, it is reported in the literature [10] that no anonymization toolis foolproof. A determined hacker who has access to publiclyavailable data can, by combining many such data bases and usingeducated guesses, construct the details of a particular person’sprivate confidential data. Does it mean that medical data ofpopulations, for example, should not be put in a publicly availabledatabase? This would be counterproductive as analysis of largequantities of medical data could potentially lead to better healthcare to citizens. There are also large quantities of other data oncitizens as well as other entities collected by governments. It isargued that if free access to such data is made available (aftersuitable anonymization even though it may not be foolproof) itcould help social scientists and other researchers to suggestimproved governance. There are also movements all over theworld on the rights of citizens to have access to data collectedusing their tax money. Transparency leads to better governance.Open data initiatives have appeared all over the world. India’sOpen Governance Initiative may be found from the URLhttps://data.gov.in/about-us. There are also committeespromoting easy access to data of relevance to citizens(http://datameet.org). With the availability of large amountsof data and ease of processing, big data analytics will have avery beneficial impact on our daily lives provided analysis iscarried out with care.
Big Data – Need to be Cautious
It is dangerous to implicitly trust the results obtained from bigdata analytics. Often it is assumed that big data collected includeall data points relevant to the problem. Many believe that with alldata the “numbers speak for themselves” and that correlationsamong data tell all we need to know about systems. This is farfrom true as data collected can seldom be all data. We use a fewexamples to illustrate this.
In Boston, the Mayor of the city wanted to use big data analytics
There are also largequantities of data oncitizens as well as
other entities collectedby governments. It is
argued that if freeaccess to such data ismadeavailable (after
suitableanonymizationeventhough it may not be
foolproof) it could helpsocial scientists andother researchers tosuggest improved
governance.
It is dangerous toimplicitly trust the
results obtained frombig data analytics.Often it is assumed
that big data collectedinclude all data points
relevant to theproblem. This is farfrom true as data
collected can seldombe all data.
713RESONANCE August 2016
GENERAL ARTICLE
to find the potholes in the roads which need to be filled. Anapplication was developed which used data from the accelerom-eter in the smart phone of a road user to detect bumps in a road andautomatically sent a message to a command centre giving thelocation coordinates where the car bumped due to a pothole.Messages were sent to all mobile phone owners in Boston areaand they were requested to download the free app on their smartphones to assist the city engineers in identifying potholes toenable them to be promptly filled. The city’s Mayor announcedthat they found an inexpensive way using data analytics to fillpotholes. As it turned out only the young affluent citizens withsmart phones downloaded the app and the potholes in affluentareas of Boston were detected and filled. From poorer areas(which probably had more potholes) only few messages came asmost of the population in these areas did not have smart phonesand even among those who had them, many did not download theapp with the result that most potholes remained.
Another example is the programs used to predict the results ofelections. The forecasts are often way off the mark due to poorsampling. It is impossible to collect data from all voters after theyvote to get an accurate prediction. It is essential to use goodstatistical analysis methods developed over many years to pickdiverse samples to get near accurate prediction.There is also atendency to correlate often unrelated data from collections of bigdata to predict outcomes of games. A recent example is thepublication of tables in many newspapers predicting the outcomeof World Cup T20 cricket matches by correlating performance ofplayers, scores, toss winning, etc. of two teams which were oftenlaughable.
Google Flu Trends Program
Many of us use Google search engine to obtain information usefulin our daily lives. For example, when we fall ill we use Google tofind information about symptoms, medicines, side effect etc. Weoften use Google for available hotels when we plan a trip. Googlesurmised that their users’ searches reflect trends in illness, travel,
Programs used topredict the resultsof elections areoften way off themark due to poorsampling.
714 RESONANCE August 2016
GENERAL ARTICLE
fashions, product sales, and may even be able to anticipate theresults of elections. In 2008 Google’s analysts explored whetherdetecting frequently used search terms could forecast the spreadof flu in USA. Google’s assumption was that when persons fall illwith symptoms of flu they would use Google’s search engine andtype terms relevant to flu symptoms. This would give Google animmediate signal on the prevalence of flu in a specified geo-graphical area of USA. When Google started its investigation, theCentre for Disease Control and Prevention (CDC), a departmentof the US Government, was tracking the occurrence of flu indifferent areas by collecting data from doctors, hospitals, andpharmacies. Data collection is time consuming and thus there wasa delay in detecting the spread of flu.
Google published a paper in the journal Nature demonstratingthat by examining search terms used by people in Google searchesand tuning them with the flu tracking information provided byCDC it could provide an accurate estimate of the prevalence of fluin different areas of USA two weeks ahead of CDC. Google’s flutrends program was used all over the world by Google giving notonly flu trends but also predicting the spread of dengue fever. Themethodology used by Google was a spectacular demonstration ofthe power of big data analytics in prediction until it miserablyfailed in 2013. In 2013, Google’s Flu Trends over predicted theprevalence of flu by 140%. The possible reason may be theappearance of several scary stories in the media about a fluepidemic which provoked many healthy persons to search for flusymptoms using Google which misled Google’s algorithm. IfGoogle had correlated flu symptoms with search for sale ofmedicines in pharmacies and prescriptions given by doctors, theincorrect prediction may not have happened. In 2015, Googlestoppedgiving flu trends information. Ananalysis onwhyGoogle’sFlu Trends failed may be found in an article published in thejournal Science [11].
Conclusions
The availability of huge amount of data and the ease of analysing
Theavailability ofhuge amount of data
and the ease ofanalysing them withsoftware tools and
large cluster ofcomputers has
numerous uses andis bound to changethe way we solvemany problems.
However, big dataanalytics can lead to
misuse unlesscitizensare vigilant.
Themethodologyused by Google was a
spectaculardemonstration of thepower of big data
analytics in predictionuntil it miserably failed
in 2013.
715RESONANCE August 2016
GENERAL ARTICLE
them with software tools and large cluster of computers hasnumerous uses and is bound to change the way we solve manyproblems. This has been amply demonstrated with some ex-amples in this article. However, big data analytics can lead tomisuse unless citizens are vigilant. Blind reliance on big dataanalytics without clear thinking on the relevance of the data,veracity of data, and meaningful correlations of variables maylead to incorrect and misleading results. Once should not ignoreyears of research donebystatisticians on pickingunbiased samples,error estimates, and testing hypotheses with data.
GLOSSARY
Big Data: It is a very large collection of structured, semi-structured, and unstructured data that may changerapidly. It is analysed using large clusters of computers to reveal patterns, trends, and correlations which maybe used for making informed decisions. (See text for three formal definitions).
5 Vs of Big Data: Five important properties of big data. They are huge Volume, large Variety, high Velocity,acceptable Veracity, i.e., trustworthy, and good Value for decision making when appropriately processed.
Data Science: See Box 2 on page 698.
Fourth Paradigm: Data driven discovery of new hypotheses which may lead to the formulation of noveltheories
Hadoop: It is an Open-Source, Java-based programming framework sponsored by Apache software foundationfor storing large data sets in a distributed computing environment. It runs applications on clusters of thousandsof commodity hardware and has the ability to handle virtually limitless concurrent tasks.
HDFS: Hadoop Distributed File System is a highly fault-tolerant distributed file system designed for very largedata sets to be deployed on huge clusters of low-cost computers. It provides high throughput access toapplication data to programs running on clusters.
Machine Learning: It is a branch of Artificial Intelligence (AI). By providing large data sets to computers weendow them with the ability to learn without explicitly programming them. The learning is adaptive and adaptswhen new data is provided. In 1959, Arthur Samuel defined machine learning as a “Field of study that givescomputers the ability to learn without being explicitly programmed”.
MapReduce: It is a parallel programming model in which data to be processed is split into a number of setswhich are distributed to individual computers in a large cluster of computers. Each computer processes the dataassigned to it simultaneously and independently using identical programs. The results are then gathered by amaster processor.
NoSQL: See Box 1 on page 697 for definition.
716 RESONANCE August 2016
GENERAL ARTICLE
Suggested Reading
[1] H J Watson, Tutorial: Big data analytics: Concepts, technologies, andapplications, Communication of the Association for Information Systems,Vol.34, Article 65, pp.124–168, 2014.
[2] NIST definition of big data and data science, www.101.datascience.community/2015/nist-defines-big-data-and-data-science.
[3] J S Ward and A Baker, A Survey of Big Data Definitions, arxiv.org/abs/1309.5821 VI.
[4] T Hey, S Tansley and K Tolle (Editors), The Fourth Paradigm – Data-Intensive Scientific Discovery,Microsoft Research, Richmond,WA., USA,2009.
[5] R P Srikant, 8 Innovative examples of big data usage in India, Dataquest,August 20, 2016.
[6] C Metz, In a huge breakthrough, Google’s AI beats a top player at thegame of GO, www.wired.com/2016/01/in-a-huge-breakthrough-googles-ai-beats-a-GO-champion/
[7] M H Hassoun, Fundamentals of Artificial Neural Networks, Prentice-Hallof India, 1998.
[8] Big Data Hadoop Tutorial, www.tutorial point.com/hadoop/hadooptutorial.pdf
[9] V Rajaraman and C Siva Ram Murthy, Parallel Computers: Architectureand Programming, 2nd Edition, Chapter 6, PHI Learning, New Delhi,2016.
[10] S Smith, Data privacy: Now you see me; New model of data sharing:Modern governance and statisticians, Significance, Vol.11, No.4, pp.10–17,Oct 2014.Available atURL:http://onlinelibrary.wiley.com/doi/10.1111/j.1740-9713.2014.00762.x/full
[11] D Lazer, et al, The parable of Google Flu: Traps in big data analysis,Science, Vol.343, April 2014.
Address for CorrespondenceV Rajaraman
Supercomputer Educationand Research Centre
Indian Institute of ScienceBengaluru 560 012, India.Email: [email protected]
Acknowledgements
I thank Dr S Ramani, Dr Radha Balakrishnan and the anonymousreferee of this article for their critical comments and suggestionswhich improved it.