Simulación numérica de tsunamis generados por avalanchas ...

ESCUELA TÉCNICA SUPERIOR DE INGENIEROS DE
MINAS Y ENERGÍA
Titulación: Grado en Ingeniería en la Tecnología Minera
Especialización: Mineralurgia y Metalurgia
PROYECTO FIN DE GRADO
DEPARTAMENTO DE INGENIERÍA GEOLÓGICA Y MINERA
Generación de un código para la simulación
numérica de tratamientos térmicos en barras
metálicas con condiciones de contorno tipo Dirichlet
Inés García Garrosa
50248393V
FEBRERO 2018

TITULACIÓN: GRADO EN INGENIERÍA EN TECNOLOGÍA
MINERA PLAN: 2010
Autorizo la presentación del proyecto
Generación de un código para la simulación numérica de
tratamientos térmicos en barras metálicas con condiciones de
contorno tipo Dirichlet
Realizado por
Dña. Inés García Garrosa
Dirigido por
D. Antonio Ruiz Perea
Firmado: Prof. D. Antonio Ruiz Perea
Fecha:…………………

I
AGRADECIMIENTOS
Me gustaría poder agradecer a mi tutor Don Antonio Ruiz Perea por haber estado a mi
lado y enseñarme tanto acerca de la programación y el hacerme mejor persona
enseñándome valores. Me gustaría agradecerle su profesionalidad, su paciencia y sobre
todo el saber comprenderme en cada momento.
Quiero agradecerle a mi madre el haber estado a mi lado apoyándome día y noche,
animándome a seguir en mis peores momentos, recordándome que algún día lo
conseguiría si quería.
También a mis compañeros de clase con los que he disfrutado de tan buenos momentos y
me han ayudado muchísimo a conseguir mis metas y objetivos.
Por último, agradecer a los profesores que han hecho mi estancia en escuela mucho más
agradable gracias a sus sonrisas y por su apoyo incondicional.

II
INDICE
MEMORIA
1 OBJETIVOS Y ALCANCE.........................................................................................2
2 INTRODUCCIÓN ........................................................................................................3
2.1 Ecuación diferencial parcial lineal ...........................................................................3
2.2 Solución de una ecuación en derivadas parciales ...................................................4
2.3 Separación de variables ............................................................................................4
2.4 Principio de superposición ........................................................................................5
2.5 Clasificación de las ecuaciones .................................................................................5
3 ECUACIÓN DE CALOR ............................................................................................6
4 CONDICIONES EN LA FRONTERA .......................................................................7
5 PLANTEAMIENTO GENERAL DEL PROBLEMA ..............................................8
6 SIMULACIÓN DEL PROBLEMA FÍSICO REAL .................................................8
6.1 Problema aproximado ...............................................................................................9
7 CÓDIGO DEL SIMULADOR ..................................................................................11
7.1 Desarrollo del programa .........................................................................................11
7.1.1 Elección del lenguaje de programación ..............................................................12
7.1.2 Desarrollo de una aplicación Visual Basic .........................................................13
7.1.3 Características del lenguaje de programación ...................................................15
7.2 Algoritmo del programa ......................................................................................16
7.3 Resultados ................................................................................................................17
1. COSTES DEL PROYECTO .............................................................................47
1.1 Costes de ingeniería .............................................................................................47
1.2 Costes de material ................................................................................................49
1.3 Costes totales ........................................................................................................50
ANEXO A: PROGRAMACIÓN DE FORMULARIOS ........................................53
Formulario inicio .......................................................................................................53
Formulario desarrollo teórico...................................................................................55
Formulario problema aproximado en los puntos interiores ..................................56
Formulario problema aproximado en los puntos interiores ..................................57
Formulario problema aproximado en los puntos interiores ..................................58
Formulario problema aproximado en los puntos interiores ..................................58
Formulario estabilidad ..............................................................................................60
Formulario de cálculo en los 6 primeros instantes .................................................69
Formulario simulación ..............................................................................................82

III

IV
FIGURAS
Figura 3-1: Gráfica de la barra ....................................................................................... 6
Figura 6-1: Plantilla de cálculo ..................................................................................... 11
Figura 6-2: Ejemplo gráfico del uso de la plantilla. ...................................................... 11
Figura 7-1: Algoritmo del simulador. ............................................................................ 16
Figura 7-2: Formulario de inicio- Primer botón. .......................................................... 17
Figura 7-3: Formulario de inicio - Enunciado. ............................................................. 17
Figura 7-4: Formulario de inicio - Problema matemático. ........................................... 18
Figura 7-5: Formulario de teoría I ................................................................................ 19
Figura 7-6: Formulario de teoría II ............................................................................... 19
Figura 7-7: Formulario de teoría III ............................................................................. 20
Figura 7-8: Formulario de teoría IV .............................................................................. 20
Figura 7-9: Formulario de inicio- segundo botón. ........................................................ 21
Figura 7-10: Formulario Estabilidad - Primer botón ................................................... 21
Figura 7-11: Formulario Estabilidad – Puntos a estudiar. ........................................... 22
Figura 7-12: Formulario Estabilidad – Valores Frontera Izquierda. ........................... 22
Figura 7-13: Formulario Estabilidad – Gráfica Frontera Izquierda. ........................... 23
Figura 7-14: Formulario Estabilidad – Gráfica Frontera Izquierda que no Cumple
estabilidad. ..................................................................................................................... 23
Figura 7-15: Formulario Estabilidad – Valores Centro de la varilla. .......................... 24
Figura 7-16: Formulario Estabilidad- Gráfica Errónea Centro varilla. ...................... 24
Figura 7-17: Formulario Estabilidad- Gráfica centro varilla. ...................................... 25
Figura 7-18: Formulario Estabilidad- Valores Frontera Derecha. .............................. 25
Figura 7-19: Formulario Estabilidad – Gráfica Frontera Derecha. ............................. 26
Figura 7-20: Formulario Inicio- Tercer Botón .............................................................. 26
Figura 7-21: Formulario Cálculo Inicial- Primer botón. .............................................. 27
Figura 7-22: Formulario Cálculo Inicial- Introducción valores. .................................. 27
Figura 7-23: Formulario Cálculo Inicial- Instante inicial . .......................................... 28
Figura 7-24: Formulario Cálculo Inicial- Valores Instante I ........................................ 28
Figura 7-25: Formulario Cálculo Inicial- Valores y botón Instante II ......................... 29
Figura 7-26: Formulario Cálculo Inicial- Valores y botón Instante III ........................ 29
Figura 7-27: Formulario Cálculo Inicial- Valores y botón Instante IV. ....................... 30
Figura 7-28: Formulario Cálculo Inicial- Valores y botón Instante V .......................... 30
Figura 7-29: Formulario Cálculo Inicial- Valores y botón Instante VI ........................ 31
Figura 7-30: Formulario Inicio-Cuarto botón ............................................................... 31
Figura 7-31: Formulario Cálculo Instantáneo- Primer botón ...................................... 32
Figura 7-32: Formulario Cálculo Instantáneo- Introducción Valores .......................... 32
Figura 7-33: Formulario Cálculo Instantáneo- Segundo botón. ................................... 33
Figura 7-34: Formulario Cálculo Instantáneo- Valores Instante.................................. 33
Figura 7-35: Formulario Cálculo Instantáneo- Solución Gráfica I .............................. 34
Figura 7-36: Formulario Cálculo Instantáneo- Solución Gráfica II. ............................ 34
Figura 7-37: Formulario Cálculo Instantáneo- Solución Gráfica III ........................... 35
Figura 7-38: Formulario Cálculo Instantáneo- Solución Gráfica IV ............................ 35
Figura 7-39: Formulario Cálculo Instantáneo- Solución Gráfica V ............................. 36
Figura 7-40: Formulario Cálculo Instantáneo- Botonoes Finales ................................ 36

V
Figura 7-41: Formulario Inicio-Quinto botón ............................................................... 37
Figura 7-42: Formulario Simulación Global- Primer botón. ........................................ 37
Figura 7-43: Formulario Simulación Global- Valores .................................................. 38
Figura 7-44: Formulario Simulación Global- Inicio Gráfica........................................ 39
Figura 7-45: Formulario Simulación Global- Enfriamiento parcial I. ......................... 39
Figura 7-46: Formulario Simulación Global- Enfriamiento parcial II. ........................ 40
Figura 7-47: Formulario Simulación Global- Enfrimiaiento final. ............................... 40
Figura 7-48: Formulario Simulación Global- Final. ..................................................... 41
Figura 7-49: Formulario Inicio-Sexto botón ................................................................. 41
Figura 7-50: Formulario Simulación Individual- Primer botón.................................... 42
Figura 7-51: Formulario Simulación Individual- Valores............................................. 42
Figura 7-52: Formulario Simulación Individual- Representación gráfica.................... 43
Figura 7-53: Formulario Simulación Individual- Representación gráfica I. ................ 43
Figura 7-54: Formulario Simulación Individual- Representación gráfica II. ............... 44
Figura 7-55: Formulario Simulación Individual- Representación gráfica III............... 44
Figura 7-56: Formulario Simulación Individual- Representación gráfica IV. .............. 45

VI
RESUMEN Y ABSTRACT
El objetivo de este proyecto es la simulación numérica basada en el comportamiento de
una barra metálica. Esta barra está aislada térmicamente en su contorno y sometida a un
enfriamiento en sus extremos por un medio a una temperatura conocida.
Matemáticamente, se modeliza mediante una ecuación en derivadas parciales de tipo
parabólico, tomando como variables el espacio y el tiempo. El tipo de condiciones serán
condiciones de contorno tipo Dirichlet en ambos extremos; y condiciones iniciales que
dieron comienzo al proceso. Para obtener soluciones, se han generado algoritmos en
diferencias finitas centrales, asumiendo que el espacio es discretizable. Para el correcto
funcionamiento del método, el algoritmo tiene que ser estable y tener consistencia. La
programación y salida de resultados se ha realizado con Visual Studio 13.0 y la
programación de objetos con Visual Basic .Net
The aim of this project is the numerical simulation based on the performance of a metal
bar. This bar is thermally isolated from the borderline and in contact with a medium which
temperature is known. Mathematically, this phenomenon is modeled using an equation in
parabolic partial derivatives with time and spatial variables. This equation was
accompanied by boundary conditions Type Dirichlet on both sides; and initial conditions
which start the process. To obtain results, algorithms was being generated on central finite
differences, accepting that the space is discrete. For the correct run of the method, the
algorithm has to be stable and consistent. The programming and output results were made
with Visual Studio 13.0 and the object programming with Visual Basic.Net

Generación de un código para la simulación
numérica de tratamientos térmicos en barras
metálicas con condiciones de contorno tipo
Dirichlet
DOCUMENTO 1: MEMORIA

2
1 OBJETIVOS Y ALCANCE
El objetivo de este proyecto es la simulación numérica del fenómeno físico de enfriar una
barra de metal inicialmente a 80ºC hasta los 20ºC, encontrándose su cara lateral aislada
térmicamente y ambos extremos en contacto con el medio a 20ºC.
Sirviéndonos como herramienta principal el programa Visual Basic 13.0 y utilizando
ecuaciones en derivadas parciales con el método de diferencias finitas centrales y
progresivas, se ha programado un algoritmo con el que se han obtenido resultados
numéricos del fenómeno. Dichos resultados, se han representado gráficamente, para su
correcta compresión y análisis.
Para la correcta simulación numérica, el estudio se ha sido dividido en tres etapas: estudio
físico, estudio matemático y programación.
La primera de ellas es estudiar el problema físico, siendo en este caso de carácter
dinámico, ya que varía durante el tiempo. Una vez que el proceso físico es conocido es
necesario modelizarlo matemáticamente, adaptando ecuaciones hasta lograr la correcta
descripción del proceso.
Las ecuaciones que mejor se adaptan son ecuaciones en derivadas parciales de tipo
parabólico con condiciones contorno iniciales prefijadas y conocidas. A continuación, se
desarrolla el problema de forma aproximada mediante métodos numéricos, en este caso
diferencias finitas centrales para la variable x (espacial) y progresivas para la variable t
(temporal), y se estudia la estabilidad del método.
Para finalizar, se crea el código computacional, utilizando algoritmos programados en
objetos, utilizando Visual Studio 13.0.
Como resultado de esta simulación numérica se ha conseguido una progresión del flujo
de calor en el espacio y en el tiempo tal y como describe el método Jominy.

3
2 INTRODUCCIÓN
En esta introducción se explicarán las ecuaciones diferenciales(ED) que son necesarias
para lel estudio matemático de este proyecto.
Las ecuaciones diferenciales (ED) relacionan las derivadas de una función con la función
de la que procede dicha derivada. Se pueden dividir en: ecuaciones diferenciales parciales
(EDP) y ecuaciones diferenciales ordinarias (EDO).
Las ecuaciones diferenciales ordinarias (EDO) se caracterizan por tener una variable
independiente y sus derivadas, a diferencia de las ecuaciones diferenciales parciales
(EDP) se caracterizan por depender de más de una variable.
Las ecuaciones diferenciales parciales (EDP), al igual que las ecuaciones diferenciales
ordinarias (EDO), se clasifican en lineales y no lineales. Tanto en las EDO como en las
EDP lineal la variable dependiente y sus derivadas parciales aparecen sólo en la primera
potencia. Las utilizadas para este proyecto son EDP lineales y de segundo orden por lo
que son en las que explicaré en esta introducción.
2.1 Ecuación diferencial parcial lineal
Si establecemos que u es la variable dependiente y x e y las variables independientes,
entonces la forma general de una ecuación en derivadas parciales de segundo orden
queda definida por:
2 2 2
2 2· · · · · ·u ,
·
u u u u uA B C D E F G
x x y y x y
( 2-1)
donde los coeficientes A, B, C,D,E,F y G son constantes o funciones de x y de y .
Cuando , 0G x y , se dice que 1 es homogénea. Si no fuera así, entonces es no
homogénea.
Es decir:
2 2
2 20
u u
x y
( 2-2)

4
y
2
2·
u ux y
x y
( 2-3)
Siendo la primera homogénea y la segunda no homogénea.
2.2 Solución de una ecuación en derivadas parciales
La solución de una ecuación diferencial en derivadas parciales del tipo lineal (2-1) es una
función ,u x y de dos variables independientes. Esta función tiene solución en alguna
región del plano xy en el cual la ecuación se satisface.
Nos enfocaremos en determinar las soluciones particulares de algunas derivadas parciales
lineales en vez de encontrar las soluciones generales. El motivo de esta simplificación es
que esta búsqueda de soluciones generales no siempre es fácil y los resultados pueden no
ser útiles.
2.3 Separación de variables
El método de separación de variables tiene como objetivo encontrar una solución
particular en forma del producto de dos funciones. una función dependiente de x y una
función dependiente de y.
, · .u x y X x Y y ( 2-1)
Gracias a esta suposición, se puede reducir una EDP lineal de dos variables en dos EDO,
siempre y cuando la ecuación lo permita. Con este objetivo como premisa, se llega a la
siguiente conclusión:
2 2
2 2' , ', '' , '',
u u u uX Y XY X Y XY
x y x y
( 2-2)
donde las primas expresan la diferenciación ordinaria.

5
2.4 Principio de superposición
El teorema del principio de superposición sostiene que:
Si 1 2, , ..., ku u u son las soluciones de una ecuación diferencial parcial lineal homogénea,
entonces la combinación lineal
1 1 2 2· · ... · ,k ku c u c u c u ( 2-1)
donde las , 1, 2, ..., ic i k son constantes, es también una solución.
Suponiendo que siempre que exista un conjunto infinito 1 2 3, , ,...u u u de soluciones de
una ecuación lineal homogénea, se podrá construir otra solución u formando la serie
infinita.
1
·k k
k
u c u
(2-2)
donde las , 1, 2, ...kc k son constantes.
2.5 Clasificación de las ecuaciones
Una ecuación diferencial parcial lineal de segundo orden en dos variables independientes
con coeficientes constantes puede clasificarse en tres tipos, dependiendo del valor de cada
uno de los coeficientes (A, B, C, siendo estos siempre distintos a 0) en relación con ellos
mismo.
La ecuación diferencial parcial lineal de segundo orden
2 2 2
2 2· · · · · · 0,
·
u u u u uA B C D E F u
x x y y x y
( 2-1)
Donde A, B, C, D, E y F son constantes reales, se dice que es
2 si 4· · 0,B AC hiperbólica ( 2-2)
2 si 4· · 0,B AC parabólica ( 2-3)
2 si 4· · 0,B AC elíptica ( 2-4)

6
3 ECUACIÓN DE CALOR
Se considera una barra de longitud L , aislada en su cara lateral, entre los puntos
localizados en el eje x , es decir entre 0x y x L . Cuando la barra comience a
enfriarse, se supone que el movimiento tiene lugar en el plano xy de tal manera que cada
punto de la barra se mueve en dirección perpendicular al eje x, produciéndose vibraciones
transversales. Además de esta premisa se supone que:
La superficie lateral, o curva, de la varilla se encuentra aislada.
El extremo izquierdo y derecho se encuentran a una temperatura de 20ºC para
valores de t >0.
Dentro de la varilla el flujo de calor tiene lugar sólo en la dirección X.
No se está generando calor dentro de la varilla.
La varilla es homogénea, es decir su masa por unidad de volumen es constante.
La varilla inicialmente está a una temperatura de 80ºC.
FIGURA 3-1: GRÁFICA BARRA.
Donde nuestra ecuación diferencial parcial viene dada por:
2
2, 0
U Ux L
t x
( 3-1)
Con unas condiciones iniciales que vienen dadas por:
U ,0 =80 ; 0 x x L ( 3-2)

7
4 CONDICIONES EN LA FRONTERA
La barra de la Figura 3-1 está asegurada al eje x en 0x y x L en todo momento.
Interpretamos lo anterior mediante las dos condiciones de frontera (CF):
0, 20u t ( 4-1)
Observese que en este contexto la función f es continua en (3-5) y, en consecuencia:
0t
0 20f ( 4-2)
( ) 20f L
( 4-3)
En general, existen tres tipos de condiciones de frontera. En una frontera, podemos
especificar los valores de uno de los siguientes formatos:
, , o · ,u u
i u ii iii h un n
donde h es una constante.
Siendo u n la derivada normal de u es decir la derivada direccional de u en la
dirección perpendicular a la frontera. Las condiciones frontera del primer tipo i se llama
condición de Dirichlet y son las que tiene nuestro problema. Una condición de frontera
del segundo tipo ii es la condición de Neumann, y una condición de frontera del tercer
tipo iii se conoce como condición de Robín.
En este caso:
,
0L t
u
n
( 4-4)

8
5 PLANTEAMIENTO GENERAL DEL PROBLEMA
El planteamiento general del problema comienza con la igualdad entre la derivada parcial
respecto el tiempo y la derivada segunda de U respecto a x .
2
2, 0 , 0
U Ux L t
t x
( 5-1)
Con condiciones contorno tipo Direchlet:
0, 20; u t
( 0-2)
, 20; u L t
( 0-3)
Condición inicial:
x,0 80u
( 0-4)
6 SIMULACIÓN DEL PROBLEMA FÍSICO REAL
La simulación del problema consiste en calcular y representar gráficamente en los
distintos instantes de tiempo, el comportamiento térmico de una barra metálica que tiene
una longitud de 80 centímetros. Esta barra se deja enfriar manteniendo sus bordes a 20ºC
y dejándose enfriar lentamente al estar aislada térmicamente en su superficie lateral.
El comportamiento físico de la curva de enfriamiento de la barra metálica tiene las
siguientes condiciones iniciales:
U ,0 80 ; 0 x x L (6-1)
Donde:
L : Longitud total de la barra metálica, objeto de estudio.
x : Punto del eje x (abscisas).
t : Instante de tiempo en el que se desarrollan los cálculos.

9
6.1 Problema aproximado
Desarrollando la función ,u x t por Taylor en su variable espacial:
2 2 3 3 4 4
2 3 4( , ) ( , ) · · · · .....
1! 2! 3! 4!
h U h U h U h UU x h t U x t
x x x x
(6-1)
2 2 3 3 4 4
2 3 4U( , ) ( , ) · · · · .....
1! 2! 3! 4!
h U h U h U h Ux h t U x t
x x x x
( 6-3)
2 2
2U( , ) ( , ) 2·U( , ) 2· ·
2!
h Ux h t U x h t x t Residuo
x
( 6-4)
Donde:
h : Es el paso espacial.
Residuo : Es
4 4
42· · .....
4!
h U
x
.
Despejando:
2
2 2
U( , ) 2·U( , ) ( , )U x h t x t U x h t
x h
( 6-5)
Si x <> i , t <> j
21, , 1,
2 2
2·ui j i j i ju uU
x h
( 6-6)
Para la variable temporal:
2( , ) ·( , ) · 0U
u x t k U x t K kt
( 6-7)
Donde:

10
k : Es el paso temporal.
Residuo : Es
2 2
22· · .....
2!
k u
t
Despejando:
( , ) ( , )U u x t k u x t
t k
( 6-8)
Si x <> i , t <> j
, 1 ,ui j i juU
t k
( 6-9)
La ecuación del problema aproximado será:
, 1 , 1, , 1,
2
u 2·ui j i j i j i j i ju u u
k h
( 6-10)
Operando:
, 1 , 1 1, , 1,2·( 2·u )i j i j i j i j i j
ku u u u
h ( 6-11)
, 1 , 1, , 1,u ·( 2·u )i j i j i j i j i ju u u ( 6-12)
Donde:
2
k; 0.5
h ( 6-13)
Despejando
, 1 1, , 1,· (1 2· )u ·i j i j i j i ju u u ( 6-14)

11
Siendo (6-14) la ecuación del problema aproximado.
Para simplificar el proceso se realizará un esquema de cálculo:
FIGURA 6-1: PLANTILLA DE CÁLCULO.
Para obtener el valor, utilizando el esquema:
FIGURA 6-2: EJEMPLO GRÁFICO DEL USO DE LA PLANTILLA.
7 CÓDIGO DEL SIMULADOR
7.1 Desarrollo del programa
Para realizar esta simulación se ha usado Visual Basic, un lenguaje de programación de
alto nivel desarrollado por Alan Cooper para Microsoft en 1991.Visual Basic es un
dialecto de Basic que necesita una o más librerías de entorno dinámico conocidas como
bibliotecas DDL. La principal misión de este programa fue facilitar la tarea de escribir

12
otros programas informáticos. Con este programa se logró crear un software para el
entorno Windows de fácil aprendizaje.
Para poder usar Visual Basic es necesario tener conocimientos básicos de programación
orientada a objetos y estar familiarizado con el entorno de Microsoft Windows y saber
trabajar con el Administrador de tareas de Windows (taskmgr.exe) y con el Administrador
de archivos (explorer.exe).
7.1.1 Elección del lenguaje de programación
Los lenguajes informáticos pueden ser de alto nivel o de bajo nivel. Los lenguajes de alto
nivel son aquellos en los que la comunicación hombre máquina ser realiza con frases
entendibles por la máquina. Estos lenguajes se caracterizan por ser sencillos en
comparación con los de bajo nivel los cuales la comunicación hombre maquina se hace
mediante 0 o 1 (lenguaje binario). Como ventaja, los lenguajes de bajo nivel son más
rápidos que los de bajo nivel.
La Interfaz Gráfica de Usuario (IGU) o Graphical User Interface (GUI) es un programa
informático que actúa como interfaz de usuario. Estos programas permiten una
comunicación hombre máquina de forma sencilla mediante el uso de imágenes y objetos.
Con ello se consigue que los usuarios puedan aprender más rápido a usar los Personal
Computers, al no tener que aprender comandos para hacer cualquier función por básica
que sea. El sistema operativo por excelencia que se caracterizan por el uso de comandos
es MS-DOS. A su diferencia la interfaz gráfica de Windows está organizado en ventanas
por las cuales el usuario se mueve de una a otra con el ratón.
El entorno Windows fue una gran revolución ya que aparte de ahorrar tiempo al no tener
que escribir comandos, se consiguió llegar a más sectores de la sociedad. A parte de
tiempo, gracias al entorno Windows se consigue ahorros de dinero y mejores
rendimientos, al ser un sistema operativo mucho más intuitivo al ser más fácil de
interpretar y manipular gracias a su entorno gráfico.
La programación de Windows era compleja y se hacía en C, que es un lenguaje que
necesita a programadores especializados. Para acercarse más al usuario y permitir que
este pudiera programar sus equipos, se desarrolla Visual Basic, programa orientado a
objetos (POO), Los programas orientados a objetos se basan en el principio de la

13
abstracción que hace que se pueda pasar de los programas clásicos a los orientados a
objetos, los cuales son de sencillo su manejo. Los programas orientados a objetos innovan
la forma de obtener resultados. Esta innovación se basa en la herencia, cohesión,
polimorfismo, acoplamiento y encapsulamiento principalmente. Los conceptos de estos
programas se desarrollan en Simula 67, programa que en sus inicios fue diseñado para
realizar simulaciones.
Visual Basic se caracteriza por permitir elaborar desde pequeños proyectos hasta
softwares complejos. La programación se realiza por medio de objetos en formularios
ligados entre si y la ligazón entre diferentes formularios. Para evitar errores en la escritura
de código, este programa posee un sistema exhaustivo de búsqueda de errores y
corrección de los mismos, reduciendo enormemente el tiempo perdido en comparación
con otros programas que hay que buscar el error de forma manual. Tras cada avance en
la escritura de la aplicación pueden observarse los efectos de los cambios a través de la
función denominada Depuración, en la que se simula el código escrito hasta ese
momento.
Visual Basic está influenciado por Basic y a partir del 2002, con la introducción de las
plataformas .NET framwork, se comienza a usar el paradigma orientado a objetos
haciéndolo multiplataforma. De esta manera se crea Visual Basic.NET que utiliza el
entorno integrado de Microsoft Visual Studio.
7.1.2 Desarrollo de una aplicación Visual Basic
La característica que diferencia VB.NET de cualquier otra herramienta de programación
es la facilidad de aprender su leguaje y lo rápido que se consiguen resultados. De esta
forma, fácilmente se puede diseñar una pantalla. Se dibuja con este programa como si se
haría sobre papel, ya que al ser todo grafico es así de fácil e intuitivo. Una vez realizada
la pantalla, que por defecto incluye los controles minimizar, maximizar y cerrar (aunque
se pueden deshabilitar), los botones, cajas de texto y controles reconocen acciones del
usuario automáticamente, como pueden ser el movimiento del cursor o bien pulsar (hacer
clic) sobre los botones. Esto significa que el diseño de la pantalla es fácil y no se ha de
recurrir a códigos para colocar un determinado objeto en una posición.
Una vez escrita la parte grafica comienza lo que se denomina la “escritura” del programa.
Para que los controles hagan una determinada acción, hay que escribir código en ellos,
14
describiendo las acciones y las respuestas que se desean tras un clic sobre un botón o bien
tras pulsar un CheckBox. Visual Basic es como una caja de herramientas, donde se
colocan todas en su lugar adecuado y después se describe su función en concreto.
Escribiendo un código en el interior de cada módulo se consigue una elaboración simple
y ordenada de las acciones que realiza cada control.
En la etapa de depuración del código, Visual Basic interpreta el código en forma de
módulos y subrutinas. A diferencia de otros lenguajes en los que el código se interpreta
de arriba hacia abajo, pudiendo el consumidor del programa VB.NET decidir qué eventos
van a suceder antes o después y no el programador, que únicamente debe preocuparse por
el correcto funcionamiento de todas las partes.
Los pasos necesarios para llevar a buen puerto un proyecto a través de este lenguaje se
describen a continuación:
a) Diseño gráfico de las ventanas que usará el usuario final, incluyendo
en ellas todos los controles.
b) Decidir los eventos a los que responderá cada control y el
procedimiento que resultará de la activación de dichos eventos.
c) Codificar cada uno de los procedimientos anteriormente elaborados.
d) Desarrollar los procedimientos auxiliares necesarios para la perfecta
funcionalidad de la aplicación.
El modo en que un proyecto VB.NET responde a la simulación o la ejecución de su código
sigue este patrón:
a) Revisa todos los formularios del proyecto y sus respectivos
controles. Revisa cómo se encuentran ligados entre ellos controles y
formularios.
b) Inicia la aplicación contrastando los procedimientos ligados al
evento Load de la ventana principal. En caso de no existir se
mantiene a la espera.
c) Al ejecutar un evento, entendiendo por este una acción tipo clic sobre
un botón, un doble clic sobre cualquier control, revisa en el código
si existe un procedimiento de actuación en relación a este.

15
d) En caso de que exista dicho procedimiento lo ejecuta y se mantiene
a la espera del siguiente evento, en caso de no haber procedimiento
se mantiene a la espera.
Este comportamiento lo mantiene hasta que se cierra el formulario, momento en que cesa
la ejecución de los procesos de esa ventana.
7.1.3 Características del lenguaje de programación
Visual Basic permite añadir a los formularios una variedad de controles como menús,
cajas de texto (TextBoxes), botones de órdenes y de opción (Buttons) para realizar
elecciones, barras de desplazamiento Horizontal y Vertical (HScrollBar y VScrollBar),
cajas de listados (ListBoxes) y cajas de archivos y directorios (TreeView). También se
pueden utilizar mallados en los que volcar bases de datos y posteriormente mostrarlos
ordenadamente de igual manera que se observan en las hojas de cálculo (p.e. Microsoft
Office Excel o Access), así como enlazar con otras aplicaciones del entorno Windows.
Este lenguaje de programación posee importantes particularidades como por ejemplo las
sentencias gráficas, acceso a avanzadas y eficaces librerías matemáticas, gran versatilidad
en el manejo de bases de datos de múltiples procedencias. Lo que hace a esta aplicación
tener una compatibilidad y versatilidad muy altas.
Dado a su estructura modular, es mucho más sencillo la elaboración de programas, en los
que un módulo erróneo no implica necesariamente un obstáculo catastrófico en la
ejecución de la aplicación. Un módulo, se resume a una porción relativamente minúscula
y manipulable de todo el código de programación, por lo que el programador también
tiene cierta facilidad para poder subsanar dicho error.
Un programa desarrollado en VB es por tanto un conjunto de módulos independientes
cuyos procedimientos no interfieren en las restantes partes si no se encuentran ligados
entre sí. De este modo, se centra el esfuerzo en la manera en que cada módulo responde,
y en cómo se interrelacionan todos ellos.

16
7.2 Algoritmo del programa
FIGURA 7-1: ALGORITMO DEL SIMULADOR.
17
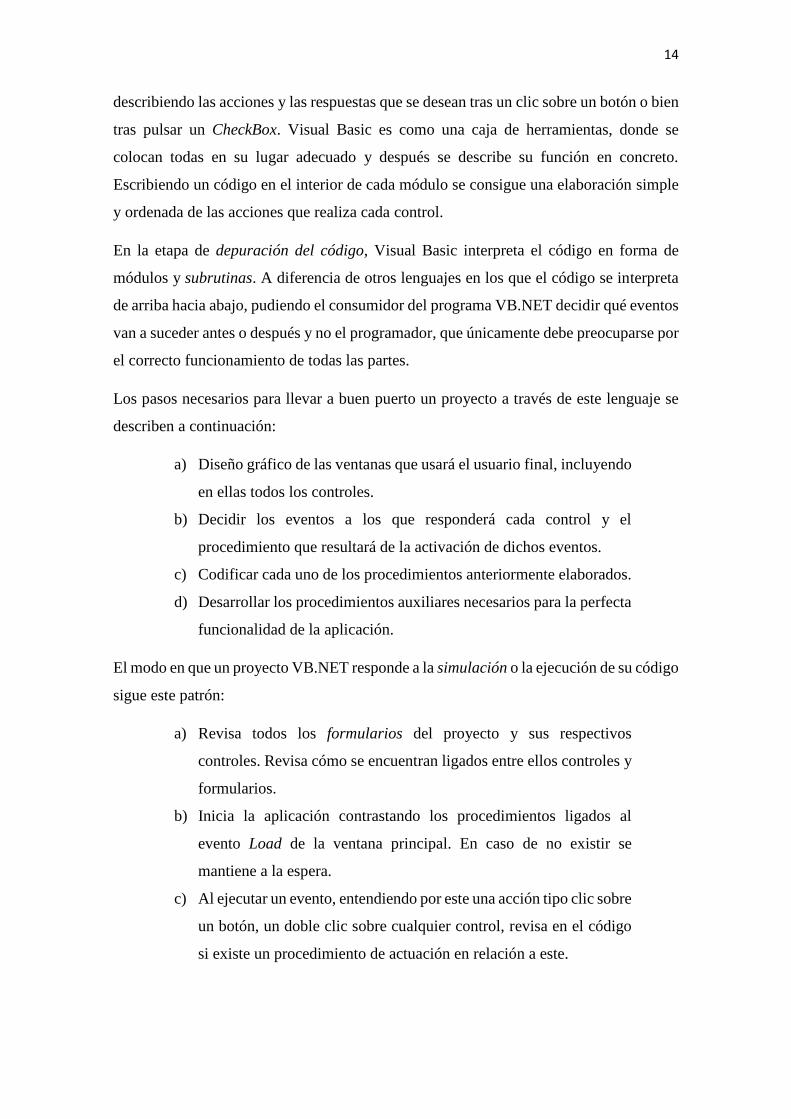
7.3 Resultados
Según iniciamos la aplicación, la primera ventana que se nos mostrará será la siguiente:
FIGURA 7-2: FORMULARIO DE INICIO- PRIMER BOTÓN.
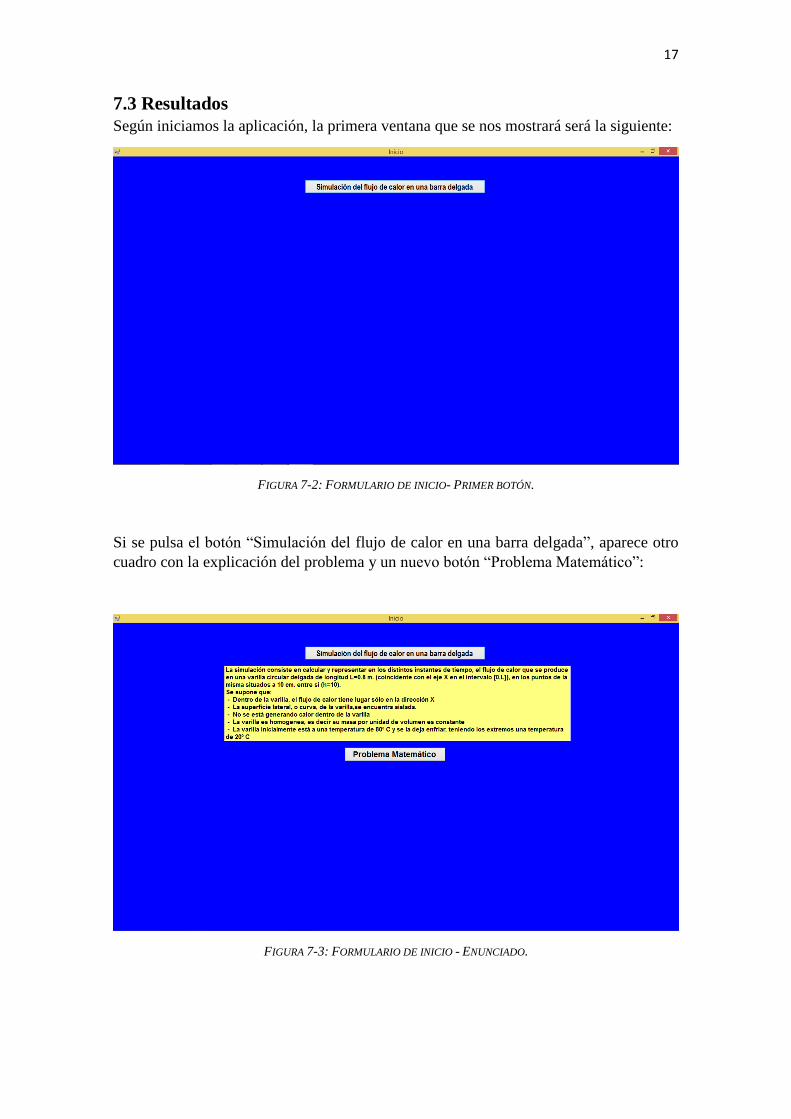
Si se pulsa el botón “Simulación del flujo de calor en una barra delgada”, aparece otro
cuadro con la explicación del problema y un nuevo botón “Problema Matemático”:
FIGURA 7-3: FORMULARIO DE INICIO - ENUNCIADO.

18
Al hacer clic sobre el nuevo botón, muestra nuestro problema de forma gráfica conjunto
a la expresión matemática en ecuaciones derivadas parciales que resuelvería el problema
de manera exacta y sus respectivas condiciones iniciales y de contorno. A continuación,
aparecen seis nuevos botones: “Teoría”, “Estabilidad del método”, “Cálculo inicial”,
“Cálculo Instantáneo”, “Simulación Global”, “simulación Individual” y “Salir”.
FIGURA 7-4: FORMULARIO DE INICIO - PROBLEMA MATEMÁTICO.
El primer control “Teoría” enlaza con los formularios que contienen toda la base teórica
de cálculo del problema matemático. Las ventanas que nos encontramos en este caso son
las siguientes:

19
FIGURA 7-5: FORMULARIO DE TEORÍA I.
Para pasar de la primera a la segunda se pulsa el botón “siguiente”.
FIGURA 7- 6: FORMULARIO DE TEORÍA II.
Con el resto de pantallas para pasar a la siguiente se operará de forma análoga y se podrá
ver el desarrollo completo de la solución.

20
FIGURA 7- 7: FORMULARIO DE TEORÍA III.
FIGURA 7- 8: FORMULARIO DE TEORÍA IV.
Para salir del problema matemático se pulsará el botón “inicio”. Sin embargo, si queremos
salir del programa, se pulsará el botón “salir”
Al pulsar el botón inicio, nos redirigirá el programa al primer formulario, en el cual
apreciaremos la descripción del problema con los posibles seis botones más el botón de
salir.

21
FIGURA 7- 9: FORMULARIO INICIO-SEGUNDO BOTÓN.
El control “Estabilidad del método” redirige al usuario a un nuevo formulario donde
podemos observar las condiciones iniciales de nuestra barra a estudiar:
FIGURA 7-10: FORMULARIO ESTABILIDAD – PRIMER BOTÓN.
Con un simple clic sobre el botón superior “Estabilidad” nos muestra tres controles
nuevos.

22
FIGURA 7-11: FORMULARIO ESTABILIDAD- PUNTOS A ESTUDIAR.
Si pulsamos el primer control “Puntos Frontera izquierda” nos emerge una ventana
donde tenemos que introducir el valor de λ siempre valores menor o igual que 0,5.
Figura 7-12: Formulario Estabilidad- Valores Frontera Izquierda.
Una vez introducido el valor, debemos pulsar el botón “Aceptar” y nos aparecerá una
gráfica donde en cada instante de tiempo nos muestra la temperatura que la barra tenga.

23
FIGURA 7-13: FORMULARIO ESTABILIDAD – GRÁFICA FRONTERA IZQUIERDA.
Además de un cuadro en la parte superior derecha de la pantalla donde nos dice si es
estable nuestro método o no, en el caso de no ser estable, el cuadro se coloreará de rojo.
En los laterales, para este caso al ser condiciones contorno tipo Dirichlet, será estable ya
que nunca habrá que calcularla en ningún instante del tiempo, al venir esta
predeterminada en las condiciones de tipo contorno.
FIGURA 7-14: FORMULARIO ESTABILIDAD – GRÁFICA FRONTERA IZQUIERDA QUE NO CUMPLE ESTABILIDAD.
Si pulsamos el segundo botón “Puntos centro de la varilla” nos vuelve a aparecer una
ventana emergente donde introducir el valor de λ para el estudio de la estabilidad.

24
FIGURA 7-15: FORMULARIO ESTABILIDAD- VALORES CENTRO DE LA VARILLA.
Si introducimos un valor para 0,5 y pulsamos “Aceptar” nos aparecerá una nueva
ventana donde nos indica que debemos introducir valores para 0,5 y que el Factor
Estabilidad para ese valor no es estable.
FIGURA 7-16: FORMULARIO ESTABILIDAD- GRÁFICA ERRÓNEA CENTRO VARILLA.
Volviendo a pulsar el botón “Puntos centro varilla” e introducido el valor λ, siempre
valores menores o igual a 0,5 , pulsaremos “Aceptar” y nos mostrará de nuevo una
gráfica donde aparece la curva de estabilidad de la barra para el centro de la varilla.

25
FIGURA 7-17: FORMULARIO ESTABILIDAD- GRÁFICA CENTRO VARILLA.
Por último, dentro de este formulario, pulsaremos el botón “Puntos Frontera derecha” y
al hacerlo nos emergerá una ventana pidiéndonos que introduzcamos el valor para λ.
FIGURA 7-18: FORMULARIO ESTABILIDAD- VALORES FRONTERA DERECHA.
Pulsando sobre el comando “Aceptar” aparecerá representada gráficamente la curva de la
barra en cada instante de tiempo, posición y temperatura.

26
FIGURA 7-19: FORMULARIO ESTABILIDAD- GRÁFICA FRONTERA DERECHA.
Pulsaremos el botón de inicio que nos redirigirá al formulario de Inicio.
FIGURA 7-20: FORMULARIO INICIO-TERCER BOTÓN.
En nuestro formulario de inicio, pulsaremos el botón “Cálculo inicial” que nos llevará a
un nuevo formulario donde nos aparecerá el siguiente botón.

27
FIGURA 7-21: FORMULARIO CÁLCULO INICIAL – PRIMER BOTÓN.
Pulsaremos el único botón que nos aparece y nos saldrá una ventana emergente donde
deberemos introducir nuestro valor para el factor de estabilidad.
FIGURA 7-22: FORMULARIO CÁLCULO INICIAL- INTRODUCCIÓN VALORES.
Una vez introducido, pincharemos sobre “Aceptar” y nos aparecerá un cuadro con el
siguiente texto: “Instante 0”.

28
FIGURA 7-23: FORMULARIO CÁLCULO INICIAL- INSTANTE INICIAL.
Pincharemos sobre dicho botón “Instante 0” y nos aparecerá una gráfica que nos indica
la temperatura de la barra desde la frontera izquierda hasta la frontera derecha en función
de seis posiciones equidistantes. A su vez nos aparece un nuevo botón “Instante I”.
FIGURA 7-24: FORMULARIO CÁLCULO INICIAL- VALORES INSTANTE I.
Pulsando sobre el botón “Instante I” nos ocurre lo mismo que en el caso anterior. Nos
calcula para ese instante de tiempo, la temperatura de la barra en función de la posición.
Nos aparece un nuevo cuadro “Instante II”.

29
FIGURA 7-25: FORMULARIO CÁLCULO INICIAL- VALORES Y BOTÓN INSTANTE II.
Pulsando sobre “Instante II” nos calcula la temperatura y posición en la barra además de
aparecer un nuevo botón “Instante III”. El factor de estabilidad, es el introducido al
principio para todo el proceso de cálculo.
Figura 7-26: Formulario Cálculo Inicial- Valores y botón Instante III.
Clicaremos sobre “Instante III” y nos calculará la posición temperatura para ese instante
de tiempo en todas las posiciones de la barra. Al igual que en los casos anteriores, se
mantendrá el factor de estabilidad introducido al principio. A su vez nos aparecerá un
nuevo botón “Instante IV”.

30
FIGURA 7-27: FORMULARIO CÁLCULO INICIAL- VALORES Y BOTÓN INSTANTE IV.
Haciendo clic sobre el botón “instante IV”, nos aparecerán los resultados de la posición
y temperatura en la barra, así como un nuevo botón “Instante V”.
FIGURA 7-28: FORMULARIO CÁLCULO INICIAL- VALORES Y BOTÓN INSTANTE V.
Pincharemos sobre ese botón y nos mostrará el resultado para ese instante de tiempo. Si
leemos el gráfico de arriba abajo por columnas, los valores nos informarán de como se
ha ido enfriando la varilla. Además, se mostrará un cuadro nuevo “Volver a inicio”.

31
FIGURA 7-29: FORMULARIO CÁLCULO INICIAL- VALORES Y BOTÓN INSTANTE VI.
Pincharemos sobre el botón “Volver a inicio” y nos devolverá a nuestro formulario de
inicio.
Figura 7-30: Formulario Inicio Cuarto Botón.
Estando en el formulario de “Inicio” pincharemos sobre el botón “Cálculo Instantáneo”
y nos aparecerá un nuevo formulario.

32
FIGURA 7-31: FORMULARIO CÁLCULO INSTANTÁNEO- PRIMER BOTÓN.
Pulsaremos dicho botón y nos aparece un cuadro emergente donde nos pide introducir el
valor de λ, valores menores o iguales 0,5
FIGURA 7-32: FORMULARIO CÁLCULO INSTANTÁNEO- INTRODUCCIÓN VALORES.
Introducido nuestro λ. Pulsaremos el comando “Aceptar” y nos aparecerá un nuevo botón
“Instante de cálculo”.

33
FIGURA 7-33: FORMULARIO CÁLCULO INSTANTÁNEO- SEGUNDO BOTÓN.
Clicaremos sobre ese nuevo botón y nos aparece una ventana emergente donde nos pide
que introduzcamos el valor del instante en el que queremos que nos calcule.
FIGURA 7-34: FORMULARIO CÁLCULO INSTANTÁNEO. VALORES INSTANTE.
Pulsando “Aceptar” nos aparece una gráfica que nos muestra el resultado para ese instante
de tiempo. Mostrando la posición de la barra y la temperatura que tiene en esa posición y
para el instante introducido.

34
FIGURA 7-35: FORMULARIO CÁLCULO INSTANTÁNEO- SOLUCIÓN GRÁFICA I.
Si queremos volver a calcular otro instante de tiempo, volveremos a pulsar el botón
“Instante de cálculo” y nos volverá a aparecer una ventana emergente donde nos pide que
introduzcamos el valor del instante nuevo.
FIGURA 7-36: FORMULARIO CÁLCULO INSTANTÁNEO- SOLUCIÓN GRÁFICA II.
Una vez introducido pulsaremos “Aceptar” y nos mostrará de nuevo la gráfica en función
de la posición, instante y temperatura con los valores nuevos.

35
FIGURA 7-37: FORMULARIO CÁLCULO INSTANTÁNEO- SOLUCIÓN GRÁFICA III.
En la Figura 7-37 se muestra como la barra se ha ido enfriando de forma que los
puntos que se encuentran a menos de 0,01 unidades del valor tomado como frío, en este
caso 20ºC, tendrán su representación gráfica en color azul.
FIGURA 7-38: FORMULARIO CÁLCULO INSTANTÁNEO- SOLUCIÓN GRÁFICA IV.
De forma anologa sucede con la Figura 7-38 en la que sólo se encuentra el punto
central en un valor igual a 20,01ºC

36
FIGURA 7-39: FORMULARIO CÁLCULO INSTANTÁNEO- SOLUCIÓN GRÁFICA V.
En la Figura 7-39 la barra se encunetra en su totalidad a 20ºC con un error menor a
0,01ºC. Las representaciones gráficas de las curvas a penas varían entre los últimos
casos ya que al ser un método estable se va enfriando de forma gradual, y los saltos que
el algoritmo realiza para llegar al resutado final cada vez son menores, lo que significa
que cuanto más cerca se encuentra de la temperatura final, el programa llega a ella de
una manera más lenta. Este fenómeno también ocurre en la realidad.
De nuevo, tendremos tres opciones; seguir calculando los valores para instantes diferentes
o bien pulsar “Inicio” o “Salir”.
FIGURA 7-40: FORMULARIO CÁLCULO INSTANTÁNEO- BOTONES FINALES
Pulsaremos el botón “Inicio” y nos devolverá a nuestro formulario de inicio, dónde
procederemos a pinchar sobre el siguiente botón.
En el caso de ue se pinchara sobre el botón “Salir” el programa se cerraría por completo.

37
FIGURA 7-41: FORMULARIO DE INICIO- QUINTO BOTÓN.
Dentro de nuestro formulario de inicio clicaremos sobre el botón “Simulación Global”
que nos derivará a un nuevo formulario donde nos aparecerá el siguiente botón
FIGURA 7-42: FORMULARIO SIMULACIÓN GLOBAL- PRIMER BOTÓN.

38
Pincharemos sobre el botón que nos aparece “Simulación Numérica y Gráfica” y nos
aparecerá una ventana emergente donde nos pide que introduzcamos el valor de λ.
Siempre valores 1
2 .
FIGURA 7-43: FORMULARIO SIMULACIÓN GLOBAL- VALORES.
Una vez introducido, pulsaremos “Aceptar” y nos mostrará gráficamente las curvas que
genera nuestra barra en función de la temperatura que va adquiriendo al enfriarse.

39
FIGURA 7-44: FORMULARIO SIMULACIÓN GLOBAL- INICIO GRÁFICA.
A medida que se va enfriando la barra, nos aparecen las curvas generadas y el dibujo de
nuestra barra va cambiando de color, indicándonos en qué momento se produce el
enfriamiento.
Figura 7-45: Formulario simulación global- Enfriamiento parcial I.

40
Figura 7-46: Formulario simulación global- Enfriamiento parcial II.
Hasta que se produce el enfriamiento total de la barra
FIGURA 7-47: FORMULARIO SIMULACIÓN GLOBAL- ENFRIAMIENTO FINAL.
Para volver a nuestro formulario de inicio pulsaremos el botón de “Inicio” o bien si
queremos salir del programa pulsaremos “Salir”:

41
FIGURA 7-48: FORMULARIO SIMULACIÓN GLOBAL- FINAL.
Pulsaremos el botón de inicio y volveremos a nuestro formulario de inicio.
FIGURA 7-49: FORMULARIO INICIO-SEXTO BOTÓN.
Dentro de nuestro formulario de inicio pulsaremos nuestro penúltimo botón “Simulación
individual” que nos llevará a un nuevo formulario donde nos aparecerá un botón con el
nombre de “Simulación”

42
FIGURA 7-50: FORMULARIO SIMULACIÓN INDIVIDUAL- PRIMER BOTÓN.
Si pulsamos dicho botón, nos aparece una ventana emergente que nos pide que
introduzcamos el valor de λ. Valores 1
2
FIGURA 7-51: FORMULARIO SIMULACIÓN INDIVIDUAL- VALORES.
Introducido el valor de λ y pulsado “Aceptar” nos muestra una gráfica con las curvas que
va generando nuestra barra al enfriarse. Empezará como nos muestra la gráfica con la
temperatura inicial que poseía, 80ºC

43
FIGURA 7-52: FORMULARIO SIMULACIÓN INDIVIDUAL- REPRESENTACIÓN GRÁFICA.
La barra sigue enfriándose y generando nuevas curvas de enfriamiento.
FIGURA 7-53: FORMULARIO SIMULACIÓN INDIVIDUAL- REPRESENTACIÓN GRÁFICA I.
Como observamos sólo nos muestra la curva de enfriamiento generada para ese instante
de tiempo, en esa posición. No se van acumulando la representación del resto de las
curvas.

44
FIGURA 7-54: FORMULARIO SIMULACIÓN INDIVIDUAL- REPRESENTACIÓN GRÁFICA II.
A medida que la barra se va enfriando y por lo tanto acercándose a su temperatura final.
Podemos observar como las curvas generadas no son tan pronunciadas, si no que se van
manteniendo constantes.
Figura 7-55: Formulario Simulación Individual- Representación gráfica III.
Hasta que se obtiene el enfriamiento total de la barra. Mostrándose la temperatura final
de 20ºC y el tiempo que ha tardado en templarse.

45
FIGURA 7-56: FORMULARIO SIMULACIÓN INDIVIDUAL- REPRESENTACIÓN GRÁFICA IV.
Generación de un código para la simulación
numérica de tratamientos térmicos en barras
metálicas con condiciones de contorno tipo
Dirichlet

46
DOCUMENTO 2: ESTUDIO ECONÓMICO

47
1. COSTES DEL PROYECTO
Dentro de este apartado se describen los costes asociados a la elaboración del proyecto
incluyendo un presupuesto realizado en base a los costes de ingeniería y material.
1.1 Costes de ingeniería En este apartado se contemplan los costes asociados al capital humano en función del
número de horas invertidas en la realización del proyecto. Formulando un cálculo
obtendremos las horas invertidas para la realización de este proyecto. En primer lugar,
analizamos el periodo que ha consumido la finalización del estudio matemático. En
segundo lugar, el tiempo invertido en tareas computacionales. Las tareas computacionales
se diferenciarán del mecanografiado y escritura del presente documento, puesto se tratará
en un apartado diferente.
Procediendo de la manera descrita en el párrafo anterior podemos distinguir los
siguientes puntos:
Dedicación al estudio matemático: 280 horas.
Dedicación a la implementación computacional: 310 horas.
Dedicación al preparado del documento y mecanografiado: 125 horas.
Los costes de cada uno de los periodos expuestos son:
Ingeniero Superior (estudio matemático): 80 €/h.
Programador (implementación): 80 €/h.
Redactor (preparado y mecanografiado): 40 €/h.
Los resultados para cada parte son las que se indican a continuación:
1. Estudio matemático:
280 horas x 80 €/hora = 22 400 €
2. Desarrollo del programa:
310 horas x 80 €/hora = 24 800 €
3. Mecanografiado y preparación:
125 horas x 30 €/hora = 5 000 €
TOTAL, COSTES DE INGENIERÍA: 52 200 €

48

49
1.2 Costes de material Dentro de los costes de material se incluyen los costes relacionados con el hardware, así
como el software consumido y material de oficina empleado.
Dentro del grupo hardware se distinguen, la CPU y todos los elementos que se requieren
para correr la simulación. En el caso del software, se encuentran los programas
informáticos, como puedan ser Visual Basic 2013, Paquete Microsoft Office, etc. En la
categoría de material de oficina, encontramos tinta de impresora, pendrive,
documentación, papel, etc.
Quedando así la relación de gastos:
Hardware:
1. Ordenador tipo Asus: 600€
2. Impresora HP Color LaserJet Pro M252dw: 200€
Software:
3. Microsoft Visual Basic 2013: 0€
4. Microsoft Office 2013 Professional: 500 €
Material de oficina:
5. Material: 500 €
TOTAL COSTES DE MATERIAL: 1800 €

50
1.3 Costes totales
TOTAL COSTES DE INGENIERÍA: 52 200 €
TOTAL COSTES DE MATERIAL: 1 800 €
COSTE TOTAL DEL PROYECTO: 54 000 €

51
SIMULACIÓN NUMÉRICA DE TRATAMIENTOS
TÉRMICOS EN BARRAS METÁLICAS
DOCUMENTO 3: ANEXOS

52
ANEXO A: PROGRAMA

53
PROGRAMACIÓN DE FORMULARIOS
Formulario inicio
Public Class Inicio
Private Sub Button8_Click(ByVal sender As System.Object, ByVal e As
System.EventArgs) Handles Button8.Click
Simulacionunitaria.Show()
End Sub
Private Sub Button7_Click(ByVal sender As System.Object, ByVal e As
System.EventArgs) Handles Button7.Click
Label2.Visible = True
Button4.Visible = True
End Sub
Private Sub Button4_Click(ByVal sender As System.Object, ByVal e As
System.EventArgs) Handles Button4.Click
PictureBox4.Visible = True
Button1.Visible = True
Button8.Visible = True
Button10.Visible = True
Button3.Visible = True
Button9.Visible = True
Button2.Visible = True
Button5.Visible = True
End Sub

54
Private Sub Button10_Click(ByVal sender As System.Object, ByVal e As
System.EventArgs) Handles Button10.Click
Simulacion.Show()
End Sub
Private Sub Button1_Click(ByVal sender As System.Object, ByVal e As
System.EventArgs) Handles Button1.Click
T1.Show()
End Sub
Private Sub Button3_Click(sender As Object, e As EventArgs) Handles
Button3.Click
Form2.Show()
End Sub
Private Sub Inicio_Load(sender As Object, e As EventArgs) Handles MyBase.Load
'=============================================================
'Centrar el groupBox cuando se maximiza el Formulario a pantalla completa
'============================================================
PictureBox4.Anchor = AnchorStyles.Bottom And AnchorStyles.Left And
AnchorStyles.Right And AnchorStyles.Top
Label2.Anchor = AnchorStyles.Bottom And AnchorStyles.Left And
AnchorStyles.Right And AnchorStyles.Top
Button1.Anchor = AnchorStyles.Bottom And AnchorStyles.Left And
AnchorStyles.Right And AnchorStyles.Top
Button2.Anchor = AnchorStyles.Bottom And AnchorStyles.Left And
AnchorStyles.Right And AnchorStyles.Top
Button4.Anchor = AnchorStyles.Bottom And AnchorStyles.Left And
AnchorStyles.Right And AnchorStyles.Top
Button3.Anchor = AnchorStyles.Bottom And AnchorStyles.Left And
AnchorStyles.Right And AnchorStyles.Top
Button7.Anchor = AnchorStyles.Bottom And AnchorStyles.Left And
AnchorStyles.Right And AnchorStyles.Top
Button8.Anchor = AnchorStyles.Bottom And AnchorStyles.Left And
AnchorStyles.Right And AnchorStyles.Top
Button10.Anchor = AnchorStyles.Bottom And AnchorStyles.Left And
AnchorStyles.Right And AnchorStyles.Top
Button9.Anchor = AnchorStyles.Bottom And AnchorStyles.Left And
AnchorStyles.Right And AnchorStyles.Top
Button5.Anchor = AnchorStyles.Bottom And AnchorStyles.Left And
AnchorStyles.Right And AnchorStyles.Top
'============================
'Para maximizar el Formulario
'============================
Me.WindowState = FormWindowState.Maximized
End Sub
Private Sub Button9_Click(sender As Object, e As EventArgs) Handles
Button9.Click
End
End Sub

55
Private Sub Button2_Click(sender As Object, e As EventArgs) Handles
Button2.Click
Estabilidad.Show()
End Sub
Private Sub Button5_Click(sender As Object, e As EventArgs) Handles
Button5.Click
simulacion1.Show()
End Sub
End Class
Formulario desarrollo teórico
Public Class T1
Private Sub T1_Load(sender As Object, e As EventArgs) Handles MyBase.Load
'=============================================================
'Centrar el groupBox cuando se maximiza el Formulario a pantalla completa
'=============================================================
PictureBox1.Anchor = AnchorStyles.Bottom And AnchorStyles.Left And
AnchorStyles.Right And AnchorStyles.Top
Button1.Anchor = AnchorStyles.Bottom And AnchorStyles.Left And
AnchorStyles.Right And AnchorStyles.Top
'============================
'Para maximizar el Formulario
'============================
Me.WindowState = FormWindowState.Maximized
End Sub

56
Private Sub Button1_Click(ByVal sender As System.Object, ByVal e As
System.EventArgs) Handles Button1.Click
T2.Show()
End Sub
End Class
Formulario problema aproximado en los puntos interiores
Public Class T2
Private Sub Button1_Click(ByVal sender As System.Object, ByVal e As
System.EventArgs) Handles Button1.Click
T3.Show()
End Sub
Private Sub T2_Load(sender As Object, e As EventArgs) Handles MyBase.Load
'=============================================================
'Centrar el groupBox cuando se maximiza el Formulario a pantalla completa
'==============================================================
PictureBox1.Anchor = AnchorStyles.Bottom And AnchorStyles.Left And
AnchorStyles.Right And AnchorStyles.Top
Button1.Anchor = AnchorStyles.Bottom And AnchorStyles.Left And
AnchorStyles.Right And AnchorStyles.Top
'============================
'Para maximizar el Formulario

57
'============================
Me.WindowState = FormWindowState.Maximized
End Sub
End Class
Formulario problema aproximado en los puntos interiores
Public Class T3
Private Sub Button1_Click(ByVal sender As System.Object, ByVal e As
System.EventArgs) Handles Button1.Click
T4.Show()
End Sub
Private Sub T3_Load(sender As Object, e As EventArgs) Handles MyBase.Load
'==============================================================
'Centrar el groupBox cuando se maximiza el Formulario a pantalla completa
'==============================================================
PictureBox1.Anchor = AnchorStyles.Bottom And AnchorStyles.Left And
AnchorStyles.Right And AnchorStyles.Top
Button1.Anchor = AnchorStyles.Bottom And AnchorStyles.Left And
AnchorStyles.Right And AnchorStyles.Top
'============================
'Para maximizar el Formulario
'============================
Me.WindowState = FormWindowState.Maximized
End Sub
End Class

58
Formulario problema aproximado en los puntos interiores
Public Class T4
Private Sub Button1_Click(ByVal sender As System.Object, ByVal e As
System.EventArgs) Handles Button1.Click
T5.Show()
End Sub
Private Sub T4_Load(sender As Object, e As EventArgs) Handles MyBase.Load
'==============================================================
'Centrar el groupBox cuando se maximiza el Formulario a pantalla completa
'==============================================================
PictureBox1.Anchor = AnchorStyles.Bottom And AnchorStyles.Left And
AnchorStyles.Right And AnchorStyles.Top
Button1.Anchor = AnchorStyles.Bottom And AnchorStyles.Left And
AnchorStyles.Right And AnchorStyles.Top
'============================
'Para maximizar el Formulario
'============================
Me.WindowState = FormWindowState.Maximized
End Sub
End Class
Formulario problema aproximado en los puntos interiores

59
Public Class T5
Private Sub Button1_Click(ByVal sender As System.Object, ByVal e As
System.EventArgs) Handles Button1.Click
T4.Close()
T3.Close()
T2.Close()
T1.Close()
Inicio.Show()
Close()
End Sub
Private Sub T5_Load(sender As Object, e As EventArgs) Handles MyBase.Load
'==============================================================
'Centrar el groupBox cuando se maximiza el Formulario a pantalla completa
'==============================================================
PictureBox1.Anchor = AnchorStyles.Bottom And AnchorStyles.Left And
AnchorStyles.Right And AnchorStyles.Top
Button1.Anchor = AnchorStyles.Bottom And AnchorStyles.Left And
AnchorStyles.Right And AnchorStyles.Top
Button2.Anchor = AnchorStyles.Bottom And AnchorStyles.Left And
AnchorStyles.Right And AnchorStyles.Top
'============================
'Para maximizar el Formulario
'============================
Me.WindowState = FormWindowState.Maximized
End Sub
Private Sub Button2_Click(sender As Object, e As EventArgs) Handles
Button2.Click

60
End
End Sub
End Class
Formulario estabilidad
Public Class Estabilidad
Dim u(9, 2000) As Single
Public landa As Single
Public t As Single
Public temp As Single
Public m As Single
Public h As Single
Public k As Single
Public c As Single
Public Um As Single
Public a As Single
Public b As Single
Public n As Single
Public x1 As Single
Public x2 As Single
Public y1 As Single
Public h1 As Single
Public scl As Single
Public yL As Single
Public xr As Single
Public yr As Single
Public ar As Single

61
Public br As Single
Dim mover As Integer
Dim xg(2000)
Dim p(2000)
Private Sub Estabilidad_Load(sender As Object, e As EventArgs) Handles
MyBase.Load
'==============================================================
'Centrar el groupBox cuando se maximiza el Formulario a pantalla completa
'==============================================================
Panel1.Anchor = AnchorStyles.Bottom And AnchorStyles.Left And
AnchorStyles.Right And AnchorStyles.Top
Panel2.Anchor = AnchorStyles.Bottom And AnchorStyles.Left And
AnchorStyles.Right And AnchorStyles.Top
Panel3.Anchor = AnchorStyles.Bottom And AnchorStyles.Left And
AnchorStyles.Right And AnchorStyles.Top
Panel4.Anchor = AnchorStyles.Bottom And AnchorStyles.Left And
AnchorStyles.Right And AnchorStyles.Top
Panel5.Anchor = AnchorStyles.Bottom And AnchorStyles.Left And
AnchorStyles.Right And AnchorStyles.Top
Panel6.Anchor = AnchorStyles.Bottom And AnchorStyles.Left And
AnchorStyles.Right And AnchorStyles.Top
Button3.Anchor = AnchorStyles.Bottom And AnchorStyles.Left And
AnchorStyles.Right And AnchorStyles.Top
Button1.Anchor = AnchorStyles.Bottom And AnchorStyles.Left And
AnchorStyles.Right And AnchorStyles.Top
Button4.Anchor = AnchorStyles.Bottom And AnchorStyles.Left And
AnchorStyles.Right And AnchorStyles.Top
Label1.Anchor = AnchorStyles.Bottom And AnchorStyles.Left And
AnchorStyles.Right And AnchorStyles.Top
Label4.Anchor = AnchorStyles.Bottom And AnchorStyles.Left And
AnchorStyles.Right And AnchorStyles.Top
Label16.Anchor = AnchorStyles.Bottom And AnchorStyles.Left And
AnchorStyles.Right And AnchorStyles.Top
PictureBox1.Anchor = AnchorStyles.Bottom And AnchorStyles.Left And
AnchorStyles.Right And AnchorStyles.Top
'============================
'Para maximizar el Formulario
'============================
Me.WindowState = FormWindowState.Maximized
End Sub
Private Sub Button1_Click(sender As Object, e As EventArgs) Handles
Button1.Click
Label16.Visible = True
Panel6.Visible = True
End Sub
Private Sub Cajas1()
TextBox37.Text = Math.Round(u(0, 0), 3)

62
TextBox36.Text = Math.Round(u(0, 1), 3)
TextBox35.Text = Math.Round(u(0, 2), 3)
TextBox34.Text = Math.Round(u(0, 3), 3)
TextBox33.Text = Math.Round(u(0, 4), 3)
TextBox27.Text = Math.Round(u(0, 5), 3)
TextBox25.Text = Math.Round(u(0, 6), 3)
TextBox23.Text = Math.Round(u(0, 7), 3)
TextBox21.Text = Math.Round(u(0, 8), 3)
Label32.Text = "u(0,0)"
Label38.Text = "u(0,1)"
Label40.Text = "u(0,2)"
Label41.Text = "u(0,3)"
Label24.Text = "u(0,4)"
Label39.Text = "u(0,5)"
Label37.Text = "u(0,6)"
Label28.Text = "u(0,7)"
Label22.Text = "u(0,8)"
Panel3.Visible = True
End Sub
Private Sub Cajas2()
TextBox37.Text = Math.Round(u(4, 0), 3)
TextBox36.Text = Math.Round(u(4, 1), 3)
TextBox35.Text = Math.Round(u(4, 2), 3)
TextBox34.Text = Math.Round(u(4, 3), 3)
TextBox33.Text = Math.Round(u(4, 4), 3)
TextBox27.Text = Math.Round(u(4, 5), 3)
TextBox25.Text = Math.Round(u(4, 6), 3)
TextBox23.Text = Math.Round(u(4, 7), 3)
TextBox21.Text = Math.Round(u(4, 8), 3)
Label32.Text = "u(4,0)"
Label38.Text = "u(4,1)"
Label40.Text = "u(4,2)"
Label41.Text = "u(4,3)"
Label24.Text = "u(4,4)"
Label39.Text = "u(4,5)"
Label37.Text = "u(4,6)"
Label28.Text = "u(4,7)"
Label22.Text = "u(4,8)"
Panel3.Visible = True
End Sub
Private Sub Cajas3()
TextBox37.Text = Math.Round(u(8, 0), 3)
TextBox36.Text = Math.Round(u(8, 1), 3)
TextBox35.Text = Math.Round(u(8, 2), 3)
TextBox34.Text = Math.Round(u(8, 3), 3)
TextBox33.Text = Math.Round(u(8, 4), 3)

63
TextBox27.Text = Math.Round(u(8, 5), 3)
TextBox25.Text = Math.Round(u(8, 6), 3)
TextBox23.Text = Math.Round(u(8, 7), 3)
TextBox21.Text = Math.Round(u(8, 8), 3)
Label32.Text = "u(8,0)"
Label38.Text = "u(8,1)"
Label40.Text = "u(8,2)"
Label41.Text = "u(8,3)"
Label24.Text = "u(8,4)"
Label39.Text = "u(8,5)"
Label37.Text = "u(8,6)"
Label28.Text = "u(8,7)"
Label22.Text = "u(8,8)"
Panel3.Visible = True
End Sub
Private Sub Button3_Click(sender As Object, e As EventArgs) Handles
Button3.Click
End
End Sub
Private Sub Button4_Click(sender As Object, e As EventArgs) Handles
Button4.Click
Inicio.Show()
Close()
End Sub
Private Sub calculo()
'===========================================================
'Programacion de las condiciones iniciales y de la plantilla
'===========================================================
h = 0.1
'landa = 0.25 'Para que el método sea estable
k = landa * (h ^ 2)
'-----------Condiciones iniciales-----------
For j = 0 To 2000
If j = 0 Then
For i = 0 To 8
u(i, j) = 80
Next
'----------------Plantilla-----------
Else
For i = 0 To 8
If i = 0 Then
u(i, j) = 20
ElseIf i = 8 Then
u(i, j) = 20
Else

64
u(i, j) = landa * u(i - 1, j - 1) + (1 - 2 * landa) * u(i, j - 1) + landa * u(i +
1, j - 1)
End If
Next
End If
Next
End Sub
Private Sub dibujo1()
'==================================================
Panel1.Visible = True
Label1.Visible = True
'==================================================
' Dibujo del Panel con la gráfica en su interior
'==================================================
Dim Pantalla As Bitmap
Pantalla = New Bitmap(Panel1.Width, Panel1.Height)
Dim g As Graphics
g = Graphics.FromImage(Pantalla)
Panel1.BackgroundImage = Pantalla
y1 = Panel1.Height - 0 'Es la recta horizontal inferior del panel
x1 = Panel1.Width - 691 'coincide con la longitud de la linea lineshape3
x2 = Panel1.Width - 0 'Es la recta vertical derecha del panel
scl = 3 ' escala
a = 0
b = 0.8
h = 0.1
n = (b - a) / h
h1 = (x2 - x1) / n 'variacion de punto apunto en la recta x
For i = 0 To n
xg(i) = x1 + i * h1
Next
'==================================================
' Fin del dibujo dentro del Panel
'==================================================
m = 0
Dim Puntos11() As Point = {New Point(xg(0), y1 - (u(0, m) * scl)), New
Point(xg(1), y1 - (u(0, m + 1) * scl)), New Point(xg(2), y1 - (u(0, m + 2) * scl)), New
Point(xg(3), y1 - (u(0, m + 3) * scl)), New Point(xg(4), y1 - (u(0, m + 4) * scl)), New
Point(xg(5), y1 - (u(0, m + 5) * scl)), New Point(xg(6), y1 - (u(0, m + 6) * scl)), New
Point(xg(7), y1 - (u(0, m + 7) * scl)), New Point(xg(8), y1 - (u(0, m + 8) * scl))}
'Dim Puntos12() As Point = {New Point(xg(0), y1 - (u(4, m) * scl)), New
Point(xg(1), y1 - (u(4, m + 1) * scl)), New Point(xg(2), y1 - (u(4, m + 2) * scl)), New
Point(xg(3), y1 - (u(4, m + 3) * scl)), New Point(xg(4), y1 - (u(4, m + 4) * scl)), New
Point(xg(5), y1 - (u(4, m + 5) * scl)), New Point(xg(6), y1 - (u(4, m + 6) * scl)), New
Point(xg(7), y1 - (u(4, m + 7) * scl)), New Point(xg(8), y1 - (u(4, m + 8) * scl))}
'Dim Puntos13() As Point = {New Point(xg(0), y1 - (u(8, m) * scl)), New
Point(xg(1), y1 - (u(8, m + 1) * scl)), New Point(xg(2), y1 - (u(8, m + 2) * scl)), New
Point(xg(3), y1 - (u(8, m + 3) * scl)), New Point(xg(4), y1 - (u(8, m + 4) * scl)), New

65
Point(xg(5), y1 - (u(8, m + 5) * scl)), New Point(xg(6), y1 - (u(8, m + 6) * scl)), New
Point(xg(7), y1 - (u(8, m + 7) * scl)), New Point(xg(8), y1 - (u(8, m + 8) * scl))}
Dim Pen As New Pen(Color.Black, 2)
g.DrawLines(Pen, Puntos11)
Button3.Visible = True
Button4.Visible = True
Label4.Visible = True
End Sub
Private Sub dibujo2()
'==================================================
Panel1.Visible = True
Label1.Visible = True
'==================================================
' Dibujo del Panel con la gráfica en su interior
'==================================================
Dim Pantalla As Bitmap
Pantalla = New Bitmap(Panel1.Width, Panel1.Height)
Dim g As Graphics
g = Graphics.FromImage(Pantalla)
Panel1.BackgroundImage = Pantalla
y1 = Panel1.Height - 0 'Es la recta horizontal inferior del panel
x1 = Panel1.Width - 691 'coincide con la longitud de la linea lineshape3
x2 = Panel1.Width - 0 'Es la recta vertical derecha del panel
scl = 3 ' escala
a = 0
b = 0.8
h = 0.1
n = (b - a) / h
h1 = (x2 - x1) / n 'variacion de punto apunto en la recta x
For i = 0 To n
xg(i) = x1 + i * h1
Next
'==================================================
' Fin del dibujo dentro del Panel
'==================================================
m = 0
'Dim Puntos11() As Point = {New Point(xg(0), y1 - (u(0, m) * scl)), New
Point(xg(1), y1 - (u(0, m + 1) * scl)), New Point(xg(2), y1 - (u(0, m + 2) * scl)), New
Point(xg(3), y1 - (u(0, m + 3) * scl)), New Point(xg(4), y1 - (u(0, m + 4) * scl)), New
Point(xg(5), y1 - (u(0, m + 5) * scl)), New Point(xg(6), y1 - (u(0, m + 6) * scl)), New
Point(xg(7), y1 - (u(0, m + 7) * scl)), New Point(xg(8), y1 - (u(0, m + 8) * scl))}
Dim Puntos12() As Point = {New Point(xg(0), y1 - (u(4, m) * scl)), New
Point(xg(1), y1 - (u(4, m + 1) * scl)), New Point(xg(2), y1 - (u(4, m + 2) * scl)), New
Point(xg(3), y1 - (u(4, m + 3) * scl)), New Point(xg(4), y1 - (u(4, m + 4) * scl)), New
Point(xg(5), y1 - (u(4, m + 5) * scl)), New Point(xg(6), y1 - (u(4, m + 6) * scl)), New
Point(xg(7), y1 - (u(4, m + 7) * scl)), New Point(xg(8), y1 - (u(4, m + 8) * scl))}

66
'Dim Puntos13() As Point = {New Point(xg(0), y1 - (u(8, m) * scl)), New
Point(xg(1), y1 - (u(8, m + 1) * scl)), New Point(xg(2), y1 - (u(8, m + 2) * scl)), New
Point(xg(3), y1 - (u(8, m + 3) * scl)), New Point(xg(4), y1 - (u(8, m + 4) * scl)), New
Point(xg(5), y1 - (u(8, m + 5) * scl)), New Point(xg(6), y1 - (u(8, m + 6) * scl)), New
Point(xg(7), y1 - (u(8, m + 7) * scl)), New Point(xg(8), y1 - (u(8, m + 8) * scl))}
Dim Pen As New Pen(Color.Black, 2)
g.DrawLines(Pen, Puntos12)
Button3.Visible = True
Button4.Visible = True
Label4.Visible = True
End Sub
Private Sub dibujo3()
'==================================================
Panel1.Visible = True
Label1.Visible = True
'==================================================
' Dibujo del Panel con la gráfica en su interior
'==================================================
Dim Pantalla As Bitmap
Pantalla = New Bitmap(Panel1.Width, Panel1.Height)
Dim g As Graphics
g = Graphics.FromImage(Pantalla)
Panel1.BackgroundImage = Pantalla
y1 = Panel1.Height - 0 'Es la recta horizontal inferior del panel
x1 = Panel1.Width - 691 'coincide con la longitud de la linea lineshape3
x2 = Panel1.Width - 0 'Es la recta vertical derecha del panel
scl = 3 ' escala
a = 0
b = 0.8
h = 0.1
n = (b - a) / h
h1 = (x2 - x1) / n 'variacion de punto apunto en la recta x
For i = 0 To n
xg(i) = x1 + i * h1
Next
'==================================================
' Fin del dibujo dentro del Panel
'==================================================
m = 0
'Dim Puntos11() As Point = {New Point(xg(0), y1 - (u(0, m) * scl)), New
Point(xg(1), y1 - (u(0, m + 1) * scl)), New Point(xg(2), y1 - (u(0, m + 2) * scl)), New
Point(xg(3), y1 - (u(0, m + 3) * scl)), New Point(xg(4), y1 - (u(0, m + 4) * scl)), New
Point(xg(5), y1 - (u(0, m + 5) * scl)), New Point(xg(6), y1 - (u(0, m + 6) * scl)), New
Point(xg(7), y1 - (u(0, m + 7) * scl)), New Point(xg(8), y1 - (u(0, m + 8) * scl))}
'Dim Puntos12() As Point = {New Point(xg(0), y1 - (u(4, m) * scl)), New
Point(xg(1), y1 - (u(4, m + 1) * scl)), New Point(xg(2), y1 - (u(4, m + 2) * scl)), New

67
Point(xg(3), y1 - (u(4, m + 3) * scl)), New Point(xg(4), y1 - (u(4, m + 4) * scl)), New
Point(xg(5), y1 - (u(4, m + 5) * scl)), New Point(xg(6), y1 - (u(4, m + 6) * scl)), New
Point(xg(7), y1 - (u(4, m + 7) * scl)), New Point(xg(8), y1 - (u(4, m + 8) * scl))}
Dim Puntos13() As Point = {New Point(xg(0), y1 - (u(8, m) * scl)), New
Point(xg(1), y1 - (u(8, m + 1) * scl)), New Point(xg(2), y1 - (u(8, m + 2) * scl)), New
Point(xg(3), y1 - (u(8, m + 3) * scl)), New Point(xg(4), y1 - (u(8, m + 4) * scl)), New
Point(xg(5), y1 - (u(8, m + 5) * scl)), New Point(xg(6), y1 - (u(8, m + 6) * scl)), New
Point(xg(7), y1 - (u(8, m + 7) * scl)), New Point(xg(8), y1 - (u(8, m + 8) * scl))}
Dim Pen As New Pen(Color.Black, 2)
g.DrawLines(Pen, Puntos13)
Button3.Visible = True
Button4.Visible = True
Label4.Visible = True
End Sub
Private Sub Button2_Click(sender As Object, e As EventArgs) Handles
Button2.Click
For j = 0 To 8
u(0, j) = 0
Next
landa = InputBox("Introducir el valor de landa" & vbCrLf & "0,5 ; 0,45 ; 0,4 ; ...",
"Estudio de la Estabilidad del Método")
calculo()
dibujo1()
Cajas1()
If u(0, 0) >= u(0, 1) And u(0, 1) >= u(0, 2) And u(0, 2) >= u(0, 3) And u(0, 3) >=
u(0, 4) And u(0, 4) >= u(0, 5) And u(0, 5) >= u(0, 6) And u(0, 6) >= u(0, 7) And u(0, 7)
>= u(0, 8) Then
Panel2.Visible = True
Panel2.BackColor = Color.Aqua
Label18.Text = "Método Estable (Frontera izquierda)" & " ; F.E=" & landa
Else
Panel2.Visible = True
Panel2.BackColor = Color.Red
Label18.Text = "Método Inestable (Frontera izquierda)" & " ; F.E=" & landa
MsgBox("Introducir un valor de landa menor")
End If
'MsgBox("u(0, 0)=" & u(0, 0) & "u(0, 1)=" & u(0, 1) & "u(0, 2)=" & u(0, 2) &
"u(0, 3)=" & u(0, 3))
End Sub
Private Sub Button5_Click(sender As Object, e As EventArgs) Handles
Button5.Click
For j = 0 To 8
u(4, j) = 0
Next

68
landa = InputBox("Introducir el valor de landa" & vbCrLf & "0,5 ; 0,45 ; 0,4 ; ...",
"Estudio de la Estabilidad del Método")
calculo()
dibujo2()
Cajas2()
If u(4, 0) >= u(4, 1) And u(4, 1) >= u(4, 2) And u(4, 2) >= u(4, 3) And u(4, 3) >=
u(4, 4) And u(4, 4) >= u(4, 5) And u(4, 5) >= u(4, 6) And u(4, 6) >= u(4, 7) And u(4, 7)
>= u(4, 8) Then
Panel4.Visible = True
Panel4.BackColor = Color.Aqua
Label19.Text = "Método Estable (Puntos centrales)" & " ; F.E=" & landa
Else
Panel4.Visible = True
Panel4.BackColor = Color.Red
Label19.Text = "Método Inestable (Puntos centrales)" & " ; F.E=" & landa
MsgBox("Introducir un valor de landa menor")
End If
'MsgBox("u(4, 0)=" & u(4, 0) & "u(4, 1)=" & u(4, 1) & "u(4, 2)=" & u(4, 2) &
"u(4, 3)=" & u(4, 3))
End Sub
Private Sub Button6_Click(sender As Object, e As EventArgs) Handles
Button6.Click
For j = 0 To 8
u(8, j) = 0
Next
landa = InputBox("Introducir el valor de landa" & vbCrLf & "0,5 ; 0,45 ; 0,4 ; ...",
"Estudio de la Estabilidad del Método")
calculo()
dibujo3()
Cajas3()
If u(8, 0) >= u(8, 1) And u(8, 1) >= u(8, 2) And u(8, 2) >= u(8, 3) And u(8, 3) >=
u(8, 4) And u(8, 4) >= u(8, 5) And u(8, 5) >= u(8, 6) And u(8, 6) >= u(8, 7) And u(8, 7)
>= u(8, 8) Then
Panel5.Visible = True
Panel5.BackColor = Color.Aqua
Label20.Text = "Método Estable (Frontera derecha)" & " ; F.E=" & landa
Else
Panel5.Visible = True
Panel5.BackColor = Color.Red
Label20.Text = "Método Inestable (Frontera derecha)" & " ; F.E=" & landa
MsgBox("Introducir un valor de landa menor")
End If
'MsgBox("u(8, 0)=" & u(8, 0) & "u(8, 1)=" & u(8, 1) & "u(8, 2)=" & u(8, 2) &
"u(8, 3)=" & u(0, 3))
End Sub

69
End Class
Formulario de cálculo en los 6 primeros instantes
Public Class Form2
Dim u(9, 2000) As Single
Public landa As Single
Public t As Single
Public temp As Single
Public m As Single
Public tol As Single
Public h As Single
Public k As Single
Public c As Single
Public Um As Single
Private Sub calculo()
'===========================================================
'Programacion de las condiciones iniciales y de la plantilla
'===========================================================
h = 0.1
'landa = 0.25 'Para que el método sea estable
k = landa * (h ^ 2)
'-----------Condiciones iniciales-----------
For j = 0 To 1500
If j = 0 Then
For i = 0 To 8
u(i, j) = 80
Next

70
'----------------Plantilla-----------
Else
For i = 0 To 8
If i = 0 Then
u(i, j) = 20
ElseIf i = 8 Then
u(i, j) = 20
Else
u(i, j) = landa * u(i - 1, j - 1) + (1 - 2 * landa) * u(i, j - 1) + landa * u(i +
1, j - 1)
End If
Next
End If
Next
End Sub
Private Sub Button1_Click(sender As Object, e As EventArgs) Handles
Button1.Click
Panel1.Visible = True
Label55.Visible = True
Label56.Visible = True
Label57.Visible = True
Label58.Visible = True
Label58.Text = landa
Button2.Visible = True
calculo()
TextBox10.Text = Math.Round(u(0, 0), 4)
TextBox9.Text = Math.Round(u(1, 0), 4)
TextBox8.Text = Math.Round(u(2, 0), 4)
TextBox7.Text = Math.Round(u(3, 0), 4)
TextBox6.Text = Math.Round(u(4, 0), 4)
TextBox5.Text = Math.Round(u(5, 0), 4)
TextBox4.Text = Math.Round(u(6, 0), 4)
TextBox3.Text = Math.Round(u(7, 0), 4)
TextBox2.Text = Math.Round(u(8, 0), 4)
End Sub
Private Sub Button2_Click(sender As Object, e As EventArgs) Handles
Button2.Click
Button3.Visible = True
calculo()
TextBox12.Text = Math.Round(u(0, 1), 4)
TextBox22.Text = Math.Round(u(1, 1), 4)
TextBox32.Text = Math.Round(u(2, 1), 4)
TextBox31.Text = Math.Round(u(3, 1), 4)
TextBox30.Text = Math.Round(u(4, 1), 4)
TextBox29.Text = Math.Round(u(5, 1), 4)
TextBox28.Text = Math.Round(u(6, 1), 4)
TextBox26.Text = Math.Round(u(7, 1), 4)
TextBox24.Text = Math.Round(u(8, 1), 4)

71
End Sub
Private Sub Button3_Click(sender As Object, e As EventArgs) Handles
Button3.Click
Button4.Visible = True
calculo()
TextBox1.Text = Math.Round(u(0, 2), 4)
TextBox11.Text = Math.Round(u(1, 2), 4)
TextBox19.Text = Math.Round(u(2, 2), 4)
TextBox18.Text = Math.Round(u(3, 2), 4)
TextBox17.Text = Math.Round(u(4, 2), 4)
TextBox16.Text = Math.Round(u(5, 2), 4)
TextBox15.Text = Math.Round(u(6, 2), 4)
TextBox14.Text = Math.Round(u(7, 2), 4)
TextBox13.Text = Math.Round(u(8, 2), 4)
End Sub
Private Sub Button4_Click(sender As Object, e As EventArgs) Handles
Button4.Click
Button5.Visible = True
calculo()
TextBox20.Text = Math.Round(u(0, 3), 4)
TextBox21.Text = Math.Round(u(1, 3), 4)
TextBox36.Text = Math.Round(u(2, 3), 4)
TextBox35.Text = Math.Round(u(3, 3), 4)
TextBox34.Text = Math.Round(u(4, 3), 4)
TextBox33.Text = Math.Round(u(5, 3), 4)
TextBox27.Text = Math.Round(u(6, 3), 4)
TextBox25.Text = Math.Round(u(7, 3), 4)
TextBox23.Text = Math.Round(u(8, 3), 4)
End Sub
Private Sub Button5_Click(sender As Object, e As EventArgs) Handles
Button5.Click
Button6.Visible = True
calculo()
TextBox37.Text = Math.Round(u(0, 4), 4)
TextBox38.Text = Math.Round(u(1, 4), 4)
TextBox45.Text = Math.Round(u(2, 4), 4)
TextBox44.Text = Math.Round(u(3, 4), 4)
TextBox43.Text = Math.Round(u(4, 4), 4)
TextBox42.Text = Math.Round(u(5, 4), 4)
TextBox41.Text = Math.Round(u(6, 4), 4)
TextBox40.Text = Math.Round(u(7, 4), 4)
TextBox39.Text = Math.Round(u(8, 4), 4)
End Sub
Private Sub Button6_Click(sender As Object, e As EventArgs) Handles
Button6.Click
Button7.Visible = True

72
calculo()
TextBox46.Text = Math.Round(u(0, 5), 4)
TextBox47.Text = Math.Round(u(1, 5), 4)
TextBox54.Text = Math.Round(u(2, 5), 4)
TextBox53.Text = Math.Round(u(3, 5), 4)
TextBox52.Text = Math.Round(u(4, 5), 4)
TextBox51.Text = Math.Round(u(5, 5), 4)
TextBox50.Text = Math.Round(u(6, 5), 4)
TextBox49.Text = Math.Round(u(7, 5), 4)
TextBox48.Text = Math.Round(u(8, 5), 4)
End Sub
Private Sub Button7_Click(sender As Object, e As EventArgs) Handles
Button7.Click
Close()
Inicio.Show()
End Sub
Private Sub Form2_Load(sender As Object, e As EventArgs) Handles MyBase.Load
'==============================================================
'Centrar el groupBox cuando se maximiza el Formulario a pantalla completa
'==============================================================
Panel1.Anchor = AnchorStyles.Bottom And AnchorStyles.Left And
AnchorStyles.Right And AnchorStyles.Top
Label2.Anchor = AnchorStyles.Bottom And AnchorStyles.Left And
AnchorStyles.Right And AnchorStyles.Top
Button1.Anchor = AnchorStyles.Bottom And AnchorStyles.Left And
AnchorStyles.Right And AnchorStyles.Top
Button2.Anchor = AnchorStyles.Bottom And AnchorStyles.Left And
AnchorStyles.Right And AnchorStyles.Top
Button4.Anchor = AnchorStyles.Bottom And AnchorStyles.Left And
AnchorStyles.Right And AnchorStyles.Top
Button3.Anchor = AnchorStyles.Bottom And AnchorStyles.Left And
AnchorStyles.Right And AnchorStyles.Top
Button5.Anchor = AnchorStyles.Bottom And AnchorStyles.Left And
AnchorStyles.Right And AnchorStyles.Top
Button6.Anchor = AnchorStyles.Bottom And AnchorStyles.Left And
AnchorStyles.Right And AnchorStyles.Top
Button7.Anchor = AnchorStyles.Bottom And AnchorStyles.Left And
AnchorStyles.Right And AnchorStyles.Top
Button8.Anchor = AnchorStyles.Bottom And AnchorStyles.Left And
AnchorStyles.Right And AnchorStyles.Top
Label55.Anchor = AnchorStyles.Bottom And AnchorStyles.Left And
AnchorStyles.Right And AnchorStyles.Top
Label56.Anchor = AnchorStyles.Bottom And AnchorStyles.Left And
AnchorStyles.Right And AnchorStyles.Top

73
Label57.Anchor = AnchorStyles.Bottom And AnchorStyles.Left And
AnchorStyles.Right And AnchorStyles.Top
Label58.Anchor = AnchorStyles.Bottom And AnchorStyles.Left And
AnchorStyles.Right And AnchorStyles.Top
'Para maximizar el Formulario
'============================
Me.WindowState = FormWindowState.Maximized
End Sub
Private Sub Button8_Click(sender As Object, e As EventArgs) Handles
Button8.Click
Panel1.Visible = False
botones()
cajas()
landa = InputBox("Introducir el Factor de Estabilidad:" & vbCrLf & "0,5 ; 0,45 ;
0,4 ; ...", "Cálculo Inicial")
Button1.Visible = True
End Sub
Private Sub botones()
Button1.Visible = False
Button2.Visible = False
Button3.Visible = False
Button4.Visible = False
Button5.Visible = False
Button6.Visible = False
Button7.Visible = False
Label55.Visible = False
Label56.Visible = False
Label57.Visible = False
Label58.Visible = False
End Sub
Private Sub cajas()
TextBox10.Text = 0
TextBox9.Text = 0
TextBox8.Text = 0
TextBox7.Text = 0
TextBox6.Text = 0
TextBox5.Text = 0
TextBox4.Text = 0
TextBox3.Text = 0
TextBox2.Text = 0
TextBox12.Text = 0
TextBox22.Text = 0
TextBox32.Text = 0
TextBox31.Text = 0
TextBox30.Text = 0

74
TextBox29.Text = 0
TextBox28.Text = 0
TextBox26.Text = 0
TextBox24.Text = 0
TextBox1.Text = 0
TextBox11.Text = 0
TextBox19.Text = 0
TextBox18.Text = 0
TextBox17.Text = 0
TextBox16.Text = 0
TextBox15.Text = 0
TextBox14.Text = 0
TextBox13.Text = 0
TextBox20.Text = 0
TextBox21.Text = 0
TextBox36.Text = 0
TextBox35.Text = 0
TextBox34.Text = 0
TextBox33.Text = 0
TextBox27.Text = 0
TextBox25.Text = 0
TextBox23.Text = 0
TextBox37.Text = 0
TextBox38.Text = 0
TextBox45.Text = 0
TextBox44.Text = 0
TextBox43.Text = 0
TextBox42.Text = 0
TextBox41.Text = 0
TextBox40.Text = 0
TextBox39.Text = 0
TextBox46.Text = 0
TextBox47.Text = 0
TextBox54.Text = 0
TextBox53.Text = 0
TextBox52.Text = 0
TextBox51.Text = 0
TextBox50.Text = 0
TextBox49.Text = 0
TextBox48.Text = 0
End Sub
End Class
Calculo instantaneo

75
Public Class Simulacionunitaria
Dim u(9, 2000) As Single
Public landa As Single
Public t As Single
Dim p(2000)
Public n As Single
Public x1 As Single
Public x2 As Single
Public y1 As Single
Public h1 As Single
Public scl As Single
Public h As Single
Public k As Single
Public c As Single
Public Um As Single
Public a As Single
Public b As Single
Public yL As Single
Public xr As Single
Public yr As Single
Public xr1 As Single
Public yr1 As Single
Public xr2 As Single
Public yr2 As Single
Public ar As Single
Public br As Single
Dim xg(2000)
Private Sub Form3_Load(sender As Object, e As EventArgs) Handles MyBase.Load

76
'=============================================================
'Centrar el groupBox cuando se maximiza el Formulario a pantalla completa
'==============================================================
PictureBox2.Anchor = AnchorStyles.Bottom And AnchorStyles.Left And
AnchorStyles.Right And AnchorStyles.Top
PictureBox1.Anchor = AnchorStyles.Bottom And AnchorStyles.Left And
AnchorStyles.Right And AnchorStyles.Top
Panel3.Anchor = AnchorStyles.Bottom And AnchorStyles.Left And
AnchorStyles.Right And AnchorStyles.Top
Button4.Anchor = AnchorStyles.Bottom And AnchorStyles.Left And
AnchorStyles.Right And AnchorStyles.Top
Button3.Anchor = AnchorStyles.Bottom And AnchorStyles.Left And
AnchorStyles.Right And AnchorStyles.Top
Button1.Anchor = AnchorStyles.Bottom And AnchorStyles.Left And
AnchorStyles.Right And AnchorStyles.Top
Button2.Anchor = AnchorStyles.Bottom And AnchorStyles.Left And
AnchorStyles.Right And AnchorStyles.Top
Label43.Anchor = AnchorStyles.Bottom And AnchorStyles.Left And
AnchorStyles.Right And AnchorStyles.Top
Label42.Anchor = AnchorStyles.Bottom And AnchorStyles.Left And
AnchorStyles.Right And AnchorStyles.Top
Label3.Anchor = AnchorStyles.Bottom And AnchorStyles.Left And
AnchorStyles.Right And AnchorStyles.Top
Label4.Anchor = AnchorStyles.Bottom And AnchorStyles.Left And
AnchorStyles.Right And AnchorStyles.Top
'============================
'Para maximizar el Formulario
'============================
Me.WindowState = FormWindowState.Maximized
End Sub
Private Sub Datos()
'===========================================================
'Programacion de las condiciones iniciales y de la plantilla
'===========================================================
h = 0.1
'landa = 0.25 'Para que el método sea estable
k = landa * (h ^ 2)
'-----------Condiciones iniciales-----------
For j = 0 To 2000
If j = 0 Then
For i = 0 To 8
u(i, j) = 80
Next
'----------------Plantilla-----------
Else
For i = 0 To 8

77
If i = 0 Then
u(i, j) = 20
ElseIf i = 8 Then
u(i, j) = 20
Else
u(i, j) = landa * u(i - 1, j - 1) + (1 - 2 * landa) * u(i, j - 1) + landa * u(i +
1, j - 1)
End If
Next
End If
Next
End Sub
Private Sub Button4_Click(sender As Object, e As EventArgs) Handles
Button4.Click
landa = InputBox("Introducir el valor de landa" & vbCrLf & "0,5 ; 0,45 ; 0,4 ; ...",
"Cálculo instantaneo")
Button2.Visible = True
End Sub
Private Sub Button3_Click(sender As Object, e As EventArgs) Handles
Button3.Click
End
End Sub
Private Sub Button1_Click(sender As Object, e As EventArgs) Handles
Button1.Click
Inicio.Show()
Close()
End Sub
Private Sub Button2_Click(sender As Object, e As EventArgs) Handles
Button2.Click
Datos()
PictureBox2.Visible = True
t = InputBox("Introducir el valor del paso de calculo", "Intervalos con números
naturales 0, 1, 2,....")
Label43.Visible = True
Label42.Visible = True
Label42.Text = t
Label1.Visible = True
Label2.Visible = True
Label2.Text = Math.Round(t * k, 3)
Button3.Visible = True
Button1.Visible = True
TextBox37.Text = Math.Round(u(0, t), 3)
TextBox36.Text = Math.Round(u(1, t), 3)
TextBox35.Text = Math.Round(u(2, t), 3)
TextBox34.Text = Math.Round(u(3, t), 3)
TextBox33.Text = Math.Round(u(4, t), 3)
TextBox27.Text = Math.Round(u(5, t), 3)

78
TextBox25.Text = Math.Round(u(6, t), 3)
TextBox23.Text = Math.Round(u(7, t), 3)
TextBox21.Text = Math.Round(u(8, t), 3)
Panel3.Visible = True
'==============================================================
Dim Pantalla1 As Bitmap
Pantalla1 = New Bitmap(PictureBox2.Width, PictureBox2.Height)
Dim g1 As Graphics
g1 = Graphics.FromImage(Pantalla1)
PictureBox2.Image = Pantalla1
yL = PictureBox2.Height - 60 'Es la y de la linea que cambia de color y tiene
grosor 50
ar = 691 ' ancho del rectangulo gris
br = 100 'alto del rectandulo gris
Dim rectangulo0 As Rectangle = New Rectangle(New Point(PictureBox2.Width -
745, yL - 50), New Size(ar, br))
g1.FillRectangle(Brushes.LightBlue, rectangulo0)
Dim linea2 As Pen = New Pen(Color.Red, 50)
Dim Puntos0a() As Point = {New Point(PictureBox2.Width - 745, yL), New
Point(PictureBox2.Width - 54, yL)}
g1.DrawLines(linea2, Puntos0a)
Label43.Visible = True
Label42.Visible = True
Label42.Text = t
Label4.Visible = True
Label3.Visible = True
Label3.Text = landa
'==============================================================
If u(4, t) < 20.009 Then
Dim Puntos0() As Point = {New Point(PictureBox2.Width - 745, yL), New
Point(PictureBox2.Width - 745 + 86.375, yL)}
Dim Puntos1() As Point = {New Point(PictureBox2.Width - 745 + 86.375, yL),
New Point(PictureBox2.Width - 745 + 86.375 + 86.375, yL)}
Dim Puntos2() As Point = {New Point(PictureBox2.Width - 745 + 86.375 +
86.375, yL), New Point(PictureBox2.Width - 745 + 86.375 + 86.375 + 86.375, yL)}
Dim Puntos3() As Point = {New Point(PictureBox2.Width - 745 + 86.375 +
86.375 + 86.375, yL), New Point(PictureBox2.Width - 745 + 86.375 + 86.375 + 86.375
+ 86.375, yL)}
Dim Puntos4() As Point = {New Point(PictureBox2.Width - 745 + 86.375 +
86.375 + 86.375 + 86.375, yL), New Point(PictureBox2.Width - 745 + 86.375 + 86.375
+ 86.375 + 86.375 + 86.375, yL)}

79
Dim Puntos5() As Point = {New Point(PictureBox2.Width - 745 + 86.375 +
86.375 + 86.375 + 86.375 + 86.375, yL), New Point(PictureBox2.Width - 745 + 86.375
+ 86.375 + 86.375 + 86.375 + 86.375 + 86.375, yL)}
Dim Puntos6() As Point = {New Point(PictureBox2.Width - 745 + 86.375 +
86.375 + 86.375 + 86.375 + 86.375 + 86.375, yL), New Point(PictureBox2.Width - 745
+ 86.375 + 86.375 + 86.375 + 86.375 + 86.375 + 86.375 + 86.375, yL)}
Dim Puntos7() As Point = {New Point(PictureBox2.Width - 745 + 86.375 +
86.375 + 86.375 + 86.375 + 86.375 + 86.375 + 86.375, yL), New
Point(PictureBox2.Width - 745 + 86.375 + 86.375 + 86.375 + 86.375 + 86.375 + 86.375
+ 86.375 + 86.375, yL)}
Dim linea As Pen = New Pen(Color.Blue, 50)
g1.DrawLines(linea, Puntos0)
g1.DrawLines(linea, Puntos1)
g1.DrawLines(linea, Puntos2)
g1.DrawLines(linea, Puntos3)
g1.DrawLines(linea, Puntos4)
g1.DrawLines(linea, Puntos5)
g1.DrawLines(linea, Puntos6)
g1.DrawLines(linea, Puntos7)
ElseIf u(3, t) < 20.009 Then
Dim Puntos0() As Point = {New Point(PictureBox2.Width - 745, yL), New
Point(PictureBox2.Width - 745 + 86.375, yL)}
Dim Puntos1() As Point = {New Point(PictureBox2.Width - 745 + 86.375, yL),
New Point(PictureBox2.Width - 745 + 86.375 + 86.375, yL)}
Dim Puntos2() As Point = {New Point(PictureBox2.Width - 745 + 86.375 +
86.375, yL), New Point(PictureBox2.Width - 745 + 86.375 + 86.375 + 86.375, yL)}
Dim Puntos3() As Point = {New Point(PictureBox2.Width - 745 + 86.375 +
86.375 + 86.375, yL), New Point(PictureBox2.Width - 745 + 86.375 + 86.375 + 86.375
+ 86.375, yL)}
Dim Puntos4() As Point = {New Point(PictureBox2.Width - 745 + 86.375 +
86.375 + 86.375 + 86.375, yL), New Point(PictureBox2.Width - 745 + 86.375 + 86.375
+ 86.375 + 86.375 + 86.375, yL)}
Dim Puntos5() As Point = {New Point(PictureBox2.Width - 745 + 86.375 +
86.375 + 86.375 + 86.375 + 86.375, yL), New Point(PictureBox2.Width - 745 + 86.375
+ 86.375 + 86.375 + 86.375 + 86.375 + 86.375, yL)}
Dim Puntos6() As Point = {New Point(PictureBox2.Width - 745 + 86.375 +
86.375 + 86.375 + 86.375 + 86.375 + 86.375, yL), New Point(PictureBox2.Width - 745
+ 86.375 + 86.375 + 86.375 + 86.375 + 86.375 + 86.375 + 86.375, yL)}
Dim Puntos7() As Point = {New Point(PictureBox2.Width - 745 + 86.375 +
86.375 + 86.375 + 86.375 + 86.375 + 86.375 + 86.375, yL), New
Point(PictureBox2.Width - 745 + 86.375 + 86.375 + 86.375 + 86.375 + 86.375 + 86.375
+ 86.375 + 86.375, yL)}
Dim linea As Pen = New Pen(Color.Blue, 50)
g1.DrawLines(linea, Puntos0)
g1.DrawLines(linea, Puntos1)

80
g1.DrawLines(linea, Puntos2)
g1.DrawLines(linea, Puntos5)
g1.DrawLines(linea, Puntos6)
g1.DrawLines(linea, Puntos7)
ElseIf u(2, t) < 20.009 Then
Dim Puntos0() As Point = {New Point(PictureBox2.Width - 745, yL), New
Point(PictureBox2.Width - 745 + 86.375, yL)}
Dim Puntos1() As Point = {New Point(PictureBox2.Width - 745 + 86.375, yL),
New Point(PictureBox2.Width - 745 + 86.375 + 86.375, yL)}
Dim Puntos2() As Point = {New Point(PictureBox2.Width - 745 + 86.375 +
86.375, yL), New Point(PictureBox2.Width - 745 + 86.375 + 86.375 + 86.375, yL)}
Dim Puntos3() As Point = {New Point(PictureBox2.Width - 745 + 86.375 +
86.375 + 86.375, yL), New Point(PictureBox2.Width - 745 + 86.375 + 86.375 + 86.375
+ 86.375, yL)}
Dim Puntos4() As Point = {New Point(PictureBox2.Width - 745 + 86.375 +
86.375 + 86.375 + 86.375, yL), New Point(PictureBox2.Width - 745 + 86.375 + 86.375
+ 86.375 + 86.375 + 86.375, yL)}
Dim Puntos5() As Point = {New Point(PictureBox2.Width - 745 + 86.375 +
86.375 + 86.375 + 86.375 + 86.375, yL), New Point(PictureBox2.Width - 745 + 86.375
+ 86.375 + 86.375 + 86.375 + 86.375 + 86.375, yL)}
Dim Puntos6() As Point = {New Point(PictureBox2.Width - 745 + 86.375 +
86.375 + 86.375 + 86.375 + 86.375 + 86.375, yL), New Point(PictureBox2.Width - 745
+ 86.375 + 86.375 + 86.375 + 86.375 + 86.375 + 86.375 + 86.375, yL)}
Dim Puntos7() As Point = {New Point(PictureBox2.Width - 745 + 86.375 +
86.375 + 86.375 + 86.375 + 86.375 + 86.375 + 86.375, yL), New
Point(PictureBox2.Width - 745 + 86.375 + 86.375 + 86.375 + 86.375 + 86.375 + 86.375
+ 86.375 + 86.375, yL)}
Dim linea As Pen = New Pen(Color.Blue, 50)
g1.DrawLines(linea, Puntos0)
g1.DrawLines(linea, Puntos1)
g1.DrawLines(linea, Puntos6)
g1.DrawLines(linea, Puntos7)
ElseIf u(1, t) < 20.009 Then
Dim Puntos0() As Point = {New Point(PictureBox2.Width - 745, yL), New
Point(PictureBox2.Width - 745 + 86.375, yL)}
Dim Puntos1() As Point = {New Point(PictureBox2.Width - 745 + 86.375, yL),
New Point(PictureBox2.Width - 745 + 86.375 + 86.375, yL)}
Dim Puntos2() As Point = {New Point(PictureBox2.Width - 745 + 86.375 +
86.375, yL), New Point(PictureBox2.Width - 745 + 86.375 + 86.375 + 86.375, yL)}
Dim Puntos3() As Point = {New Point(PictureBox2.Width - 745 + 86.375 +
86.375 + 86.375, yL), New Point(PictureBox2.Width - 745 + 86.375 + 86.375 + 86.375
+ 86.375, yL)}
Dim Puntos4() As Point = {New Point(PictureBox2.Width - 745 + 86.375 +
86.375 + 86.375 + 86.375, yL), New Point(PictureBox2.Width - 745 + 86.375 + 86.375
+ 86.375 + 86.375 + 86.375, yL)}

81
Dim Puntos5() As Point = {New Point(PictureBox2.Width - 745 + 86.375 +
86.375 + 86.375 + 86.375 + 86.375, yL), New Point(PictureBox2.Width - 745 + 86.375
+ 86.375 + 86.375 + 86.375 + 86.375 + 86.375, yL)}
Dim Puntos6() As Point = {New Point(PictureBox2.Width - 745 + 86.375 +
86.375 + 86.375 + 86.375 + 86.375 + 86.375, yL), New Point(PictureBox2.Width - 745
+ 86.375 + 86.375 + 86.375 + 86.375 + 86.375 + 86.375 + 86.375, yL)}
Dim Puntos7() As Point = {New Point(PictureBox2.Width - 745 + 86.375 +
86.375 + 86.375 + 86.375 + 86.375 + 86.375 + 86.375, yL), New
Point(PictureBox2.Width - 745 + 86.375 + 86.375 + 86.375 + 86.375 + 86.375 + 86.375
+ 86.375 + 86.375, yL)}
Dim linea As Pen = New Pen(Color.Blue, 50)
g1.DrawLines(linea, Puntos0)
g1.DrawLines(linea, Puntos7)
End If
'**********************************************************************
'**********************************************************************
PictureBox1.Visible = True
Dim Pantalla As Bitmap
' Es necesario crear primeramente un PictureBox, en el cual no trabajaremos
directamente con el, si no solo mostraremos el Bitmap de pantalla
Pantalla = New Bitmap(PictureBox1.Width, PictureBox1.Height)
' Podemos usar varias alternativas, entre ellas pintar directamente en el Bitmap de
trabajo, en este caso es Pantalla, o usando funciones especificas de dibujo que trae
Graphics
Dim g As Graphics
g = Graphics.FromImage(Pantalla)
'====================================
xr1 = PictureBox1.Width - 692 '799-50
yr1 = PictureBox1.Height - 0 '500-50
xr2 = PictureBox1.Width - 0
x1 = xr1
x2 = xr2
y1 = yr1
scl = 4 ' escala
a = 0
b = 0.8
h = 0.1
n = (b - a) / h
h1 = (x2 - x1) / n 'variacion de punto a punto en la recta x
For i = 0 To n
xg(i) = x1 + i * h1
Next
Dim Puntos11b() As Point = {New Point(xr1, yr1), New Point(xr2, yr1)}

82
Dim Puntos11() As Point = {New Point(xg(0), y1 - (u(0, t) * scl)), New
Point(xg(1), y1 - (u(1, t) * scl)), New Point(xg(2), y1 - (u(2, t) * scl)), New Point(xg(3),
y1 - (u(3, t) * scl)), New Point(xg(4), y1 - (u(4, t) * scl)), New Point(xg(5), y1 - (u(5, t)
* scl)), New Point(xg(6), y1 - (u(6, t) * scl)), New Point(xg(7), y1 - (u(7, t) * scl)), New
Point(xg(8), y1 - (u(8, t) * scl))}
Dim Pen As New Pen(Color.Red, 1)
Dim Pen1 As New Pen(Color.Blue, 1)
g.DrawLines(Pen, Puntos11b)
g.DrawLines(Pen1, Puntos11)
PictureBox1.Image = Pantalla
End Sub
End Class
Formulario simulación

83
Public Class Simulacion
Dim u(9, 2000) As Single
Public landa As Single
Public t As Single
Public temp As Single
Public m As Single
Public tol As Single
Public h As Single
Public k As Single
Public c As Single
Public Um As Single
Public a As Single
Public b As Single
Public n As Single
Public x1 As Single
Public x2 As Single
Public y1 As Single
Public h1 As Single
Public scl As Single
Public yL As Single
Public xr As Single
Public yr As Single
Public ar As Single
Public br As Single
Dim mover As Integer
Dim xg(2000)
Dim p(2000)
Private Sub Datos()
'===========================================================
'Programacion de las condiciones iniciales y de la plantilla
'===========================================================
h = 0.1
'landa = 0.25 'Para que el método sea estable
k = landa * (h ^ 2)
'-----------Condiciones iniciales-----------
For j = 0 To 2000
If j = 0 Then
For i = 0 To 8
u(i, j) = 80
Next
'----------------Plantilla-----------
Else
For i = 0 To 8
If i = 0 Then
u(i, j) = 20
ElseIf i = 8 Then
u(i, j) = 20

84
Else
u(i, j) = landa * u(i - 1, j - 1) + (1 - 2 * landa) * u(i, j - 1) + landa * u(i +
1, j - 1)
End If
Next
End If
Next
'**********************************************************************
End Sub
Private Sub Panel()
TextBox37.Text = Math.Round(u(0, t), 3)
TextBox36.Text = Math.Round(u(1, t), 3)
TextBox35.Text = Math.Round(u(2, t), 3)
TextBox34.Text = Math.Round(u(3, t), 3)
TextBox33.Text = Math.Round(u(4, t), 3)
TextBox27.Text = Math.Round(u(5, t), 3)
TextBox25.Text = Math.Round(u(6, t), 3)
TextBox23.Text = Math.Round(u(7, t), 3)
TextBox21.Text = Math.Round(u(8, t), 3)
Panel3.Visible = True
End Sub
Private Sub Timer1_Tick(sender As Object, e As EventArgs) Handles Timer1.Tick
Datos()
yL = 112 'Para subir o bajar la barra con el aislante
xr = 150
yr = 213
ar = 691 '716 '=841-150+25
br = 100
Dim rectangulo0 As Rectangle = New Rectangle(New Point(xr, yL - 50), New
Size(ar, br))
Me.CreateGraphics.FillRectangle(Brushes.LightBlue, rectangulo0)
Dim Puntos0a() As Point = {New Point(150, yL), New Point(841, yL)}
Dim linea2 As Pen = New Pen(Color.Red, 50)
Me.CreateGraphics.DrawLines(linea2, Puntos0a)
Select Case t
Case 0 To 2000
Label43.Visible = True
Label42.Visible = True
Label42.Text = t
Label1.Visible = True
Label2.Visible = True
Label2.Text = Math.Round(t * k, 3)
Label5.Visible = True
Label5.BackColor = Color.LightBlue
Label6.Visible = True
Label6.BackColor = Color.LightBlue

85
Panel()
If t > 2001 Then
Timer1.Enabled = False
End If
If u(4, t) < 20.009 Then
Dim Puntos0() As Point = {New Point(150, yL), New Point(236.375, yL)}
Dim Puntos1() As Point = {New Point(236.375, yL), New Point(322.75,
yL)}
Dim Puntos2() As Point = {New Point(322.75, yL), New Point(409.125,
yL)}
Dim Puntos3() As Point = {New Point(409.125, yL), New Point(495.5,
yL)}
Dim Puntos4() As Point = {New Point(495.5, yL), New Point(581.875,
yL)}
Dim Puntos5() As Point = {New Point(581.875, yL), New Point(668.25,
yL)}
Dim Puntos6() As Point = {New Point(668.25, yL), New Point(754.625,
yL)}
Dim Puntos7() As Point = {New Point(754.625, yL), New Point(841, yL)}
Dim linea As Pen = New Pen(Color.Blue, 50)
Me.CreateGraphics.DrawLines(linea, Puntos0)
Me.CreateGraphics.DrawLines(linea, Puntos1)
Me.CreateGraphics.DrawLines(linea, Puntos2)
Me.CreateGraphics.DrawLines(linea, Puntos3)
Me.CreateGraphics.DrawLines(linea, Puntos4)
Me.CreateGraphics.DrawLines(linea, Puntos5)
Me.CreateGraphics.DrawLines(linea, Puntos6)
Me.CreateGraphics.DrawLines(linea, Puntos7)
Timer1.Enabled = False
ElseIf u(3, t) < 20.009 Then
Dim Puntos0() As Point = {New Point(150, yL), New Point(236.375, yL)}
Dim Puntos1() As Point = {New Point(236.375, yL), New Point(322.75,
yL)}
Dim Puntos2() As Point = {New Point(322.75, yL), New Point(409.125,
yL)}
Dim Puntos3() As Point = {New Point(409.125, yL), New Point(495.5,
yL)}
Dim Puntos4() As Point = {New Point(495.5, yL), New Point(581.875,
yL)}
Dim Puntos5() As Point = {New Point(581.875, yL), New Point(668.25,
yL)}
Dim Puntos6() As Point = {New Point(668.25, yL), New Point(754.625,
yL)}
Dim Puntos7() As Point = {New Point(754.625, yL), New Point(841, yL)}
Dim linea As Pen = New Pen(Color.Blue, 50)

86
Me.CreateGraphics.DrawLines(linea, Puntos0)
Me.CreateGraphics.DrawLines(linea, Puntos1)
Me.CreateGraphics.DrawLines(linea, Puntos2)
Me.CreateGraphics.DrawLines(linea, Puntos5)
Me.CreateGraphics.DrawLines(linea, Puntos6)
Me.CreateGraphics.DrawLines(linea, Puntos7)
ElseIf u(2, t) < 20.009 Then
Dim Puntos0() As Point = {New Point(150, yL), New Point(236.375, yL)}
Dim Puntos1() As Point = {New Point(236.375, yL), New Point(322.75,
yL)}
Dim Puntos2() As Point = {New Point(322.75, yL), New Point(409.125,
yL)}
Dim Puntos3() As Point = {New Point(409.125, yL), New Point(495.5,
yL)}
Dim Puntos4() As Point = {New Point(495.5, yL), New Point(581.875,
yL)}
Dim Puntos5() As Point = {New Point(581.875, yL), New Point(668.25,
yL)}
Dim Puntos6() As Point = {New Point(668.25, yL), New Point(754.625,
yL)}
Dim Puntos7() As Point = {New Point(754.625, yL), New Point(841, yL)}
Dim linea As Pen = New Pen(Color.Blue, 50) 'lalinea es un lapiz que pinta
en azul y espesor 10
Me.CreateGraphics.DrawLines(linea, Puntos0)
Me.CreateGraphics.DrawLines(linea, Puntos1)
Me.CreateGraphics.DrawLines(linea, Puntos6)
Me.CreateGraphics.DrawLines(linea, Puntos7)
ElseIf u(1, t) < 20.009 Then
Dim Puntos0() As Point = {New Point(150, yL), New Point(236.375, yL)}
Dim Puntos1() As Point = {New Point(236.375, yL), New Point(322.75,
yL)}
Dim Puntos2() As Point = {New Point(322.75, yL), New Point(409.125,
yL)}
Dim Puntos3() As Point = {New Point(409.125, yL), New Point(495.5,
yL)}
Dim Puntos4() As Point = {New Point(495.5, yL), New Point(581.875,
yL)}
Dim Puntos5() As Point = {New Point(581.875, yL), New Point(668.25,
yL)}
Dim Puntos6() As Point = {New Point(668.25, yL), New Point(754.625,
yL)}
Dim Puntos7() As Point = {New Point(754.625, yL), New Point(841, yL)}
Dim linea As Pen = New Pen(Color.Blue, 50)
Me.CreateGraphics.DrawLines(linea, Puntos0)
Me.CreateGraphics.DrawLines(linea, Puntos7)

87
Label4.Visible = True
End If
t = t + 1
End Select
End Sub
Private Sub Button1_Click(sender As Object, e As EventArgs) Handles
Button1.Click
landa = InputBox("Introducir el valor de landa" & vbCrLf & "0,5 ; 0,45 ; 0,4 ; ...",
"Cálculo Global")
Timer1.Enabled = True
Timer2.Enabled = True
Button2.Visible = True
Button3.Visible = True
Button4.Visible = True
Label57.Visible = True
Label58.Visible = True
Label58.Text = landa
End Sub
Private Sub Button2_Click(sender As Object, e As EventArgs) Handles
Button2.Click
Timer1.Enabled = False
Timer2.Enabled = False
End Sub
Private Sub datosgrafica()
x1 = 150 'punto origen de la recta
x2 = 841 'punto final de la recta
y1 = 506 'valor de la y en la recta
scl = 4 ' escala
a = 0
b = 0.8
h = 0.1
n = (b - a) / h
h1 = (x2 - x1) / n 'variacion de punto apunto en la recta x
For i = 0 To n
xg(i) = x1 + i * h1
Next
End Sub
Private Sub Timer2_Tick(sender As Object, e As EventArgs) Handles Timer2.Tick
Datos()
datosgrafica()
Label3.Visible = True
LineShape5.Visible = True

88
LineShape6.Visible = True
LineShape7.Visible = True
If m > 2000 Then
Timer2.Enabled = False
End If
Select Case m
Case 0
Dim Puntos11() As Point = {New Point(xg(0), y1 - (u(0, m) * scl)), New
Point(xg(1), y1 - (u(1, m) * scl)), New Point(xg(2), y1 - (u(2, m) * scl)), New
Point(xg(3), y1 - (u(3, m) * scl)), New Point(xg(4), y1 - (u(4, m) * scl)), New
Point(xg(5), y1 - (u(5, m) * scl)), New Point(xg(6), y1 - (u(6, m) * scl)), New
Point(xg(7), y1 - (u(7, m) * scl)), New Point(xg(8), y1 - (u(8, m) * scl))}
Dim Pen As New Pen(Color.Blue, 1)
p(m) = Puntos11
Me.CreateGraphics.DrawLines(Pen, p(m))
Case 1 To 2000
Dim Puntos11() As Point = {New Point(xg(0), y1 - (u(0, m) * scl)), New
Point(xg(1), y1 - (u(1, m) * scl)), New Point(xg(2), y1 - (u(2, m) * scl)), New
Point(xg(3), y1 - (u(3, m) * scl)), New Point(xg(4), y1 - (u(4, m) * scl)), New
Point(xg(5), y1 - (u(5, m) * scl)), New Point(xg(6), y1 - (u(6, m) * scl)), New
Point(xg(7), y1 - (u(7, m) * scl)), New Point(xg(8), y1 - (u(8, m) * scl))}
Dim Pen As New Pen(Color.Blue, 1)
Dim Pen1 As New Pen(Color.OrangeRed, 1)
p(m) = Puntos11
Me.CreateGraphics.DrawLines(Pen1, p(m - 1))
Me.CreateGraphics.DrawLines(Pen, p(m))
End Select
m = m + 1
End Sub
Private Sub Button3_Click(sender As Object, e As EventArgs) Handles
Button3.Click
End
End Sub
Private Sub Button4_Click(sender As Object, e As EventArgs) Handles
Button4.Click
Inicio.Show()
Close()
End Sub
End Class
Formulario simulación 1

89
Public yr As Single
Public h As Single
Public k As Single
Public c As Single
Public Um As Single
Public t As Single
Public landa As Single
Public a As Single
Public b As Single
Public n As Single
Public x1 As Single
Public x2 As Single
Public y1 As Single
Public h1 As Single
Public scl As Single
Dim mover As Integer
Dim u(9, 6000) As Single
Dim xg(100)
Dim p(1000)
Private Sub Simulacion1_Load(sender As Object, e As EventArgs) Handles
MyBase.Load
'==============================================================
'Centrar el groupBox cuando se maximiza el Formulario a pantalla completa
'==============================================================
Panel1.Anchor = AnchorStyles.Bottom And AnchorStyles.Left And
AnchorStyles.Right And AnchorStyles.Top
Panel3.Anchor = AnchorStyles.Bottom And AnchorStyles.Left And
AnchorStyles.Right And AnchorStyles.Top
Button2.Anchor = AnchorStyles.Bottom And AnchorStyles.Left And
AnchorStyles.Right And AnchorStyles.Top

90
Button3.Anchor = AnchorStyles.Bottom And AnchorStyles.Left And
AnchorStyles.Right And AnchorStyles.Top
Button1.Anchor = AnchorStyles.Bottom And AnchorStyles.Left And
AnchorStyles.Right And AnchorStyles.Top
Button4.Anchor = AnchorStyles.Bottom And AnchorStyles.Left And
AnchorStyles.Right And AnchorStyles.Top
Label43.Anchor = AnchorStyles.Bottom And AnchorStyles.Left And
AnchorStyles.Right And AnchorStyles.Top
Label42.Anchor = AnchorStyles.Bottom And AnchorStyles.Left And
AnchorStyles.Right And AnchorStyles.Top
Label3.Anchor = AnchorStyles.Bottom And AnchorStyles.Left And
AnchorStyles.Right And AnchorStyles.Top
Label4.Anchor = AnchorStyles.Bottom And AnchorStyles.Left And
AnchorStyles.Right And AnchorStyles.Top
Label57.Anchor = AnchorStyles.Bottom And AnchorStyles.Left And
AnchorStyles.Right And AnchorStyles.Top
Label58.Anchor = AnchorStyles.Bottom And AnchorStyles.Left And
AnchorStyles.Right And AnchorStyles.Top
'============================
'Para maximizar el Formulario
'============================
Me.WindowState = FormWindowState.Maximized
End Sub
Private Sub Datos()
'===========================================================
'Programacion de las condiciones iniciales y de la plantilla
'===========================================================
h = 0.1
'landa = 0.25 'Para que el método sea estable
k = landa * (h ^ 2)
'-----------Condiciones iniciales-----------
For j = 0 To 2000
If j = 0 Then
For i = 0 To 8
u(i, j) = 80
Next
'----------------Plantilla-----------
Else
For i = 0 To 8
If i = 0 Then
u(i, j) = 20
ElseIf i = 8 Then
u(i, j) = 20
Else
u(i, j) = landa * u(i - 1, j - 1) + (1 - 2 * landa) * u(i, j - 1) + landa * u(i +
1, j - 1)
End If
Next
End If
Next

91
End Sub
Private Sub Panel()
TextBox37.Text = Math.Round(u(0, t), 3)
TextBox36.Text = Math.Round(u(1, t), 3)
TextBox35.Text = Math.Round(u(2, t), 3)
TextBox34.Text = Math.Round(u(3, t), 3)
TextBox33.Text = Math.Round(u(4, t), 3)
TextBox27.Text = Math.Round(u(5, t), 3)
TextBox25.Text = Math.Round(u(6, t), 3)
TextBox23.Text = Math.Round(u(7, t), 3)
TextBox21.Text = Math.Round(u(8, t), 3)
Panel3.Visible = True
Button1.Visible = True
Button3.Visible = True
Button4.Visible = True
End Sub
Private Sub Button2_Click(sender As Object, e As EventArgs) Handles
Button2.Click
landa = InputBox("Introducir el valor de landa" & vbCrLf & "0,5 ; 0,45 ; 0,4 ; ...",
"Simulacion Individual")
Timer1.Enabled = True
Label57.Visible = True
Label58.Visible = True
Label58.Text = landa
Panel1.Visible = True
End Sub
Private Sub Button3_Click(sender As Object, e As EventArgs) Handles
Button3.Click
Timer1.Enabled = False
End Sub
Private Sub Timer1_Tick(sender As Object, e As EventArgs) Handles Timer1.Tick
Datos()
'==================================================
Dim Pantalla As Bitmap
Pantalla = New Bitmap(Panel1.Width, Panel1.Height)
Dim g As Graphics
g = Graphics.FromImage(Pantalla)
Panel1.BackgroundImage = Pantalla
'=================================================
y1 = Panel1.Height - 0 'Es la recta horizontal inferior del panel
x1 = Panel1.Width - 691 'coincide con la longitud de la linea lineshape3
x2 = Panel1.Width - 0 'Es la recta vertical derecha del panel
scl = 5 ' escala
a = 0
b = 0.8
h = 0.1
n = (b - a) / h
h1 = (x2 - x1) / n 'variacion de punto apunto en la recta x

92
For i = 0 To n
xg(i) = x1 + i * h1
Next
Select Case t
Case 0
Panel()
Dim Puntos11() As Point = {New Point(xg(0), y1 - (u(0, t) * scl)), New
Point(xg(1), y1 - (u(1, t) * scl)), New Point(xg(2), y1 - (u(2, t) * scl)), New Point(xg(3),
y1 - (u(3, t) * scl)), New Point(xg(4), y1 - (u(4, t) * scl)), New Point(xg(5), y1 - (u(5, t)
* scl)), New Point(xg(6), y1 - (u(6, t) * scl)), New Point(xg(7), y1 - (u(7, t) * scl)), New
Point(xg(8), y1 - (u(8, t) * scl))}
Dim Pen1 As New Pen(Color.Blue, 2)
g.DrawLines(Pen1, Puntos11)
Label1.Visible = True
Label2.Visible = True
Label2.Text = Math.Round(t * k, 3)
Label43.Visible = True
Label42.Visible = True
Label42.Text = t
Label3.Visible = True
Case 1
Panel()
Dim Puntos11() As Point = {New Point(xg(0), y1 - (u(0, t) * scl)), New
Point(xg(1), y1 - (u(1, t) * scl)), New Point(xg(2), y1 - (u(2, t) * scl)), New Point(xg(3),
y1 - (u(3, t) * scl)), New Point(xg(4), y1 - (u(4, t) * scl)), New Point(xg(5), y1 - (u(5, t)
* scl)), New Point(xg(6), y1 - (u(6, t) * scl)), New Point(xg(7), y1 - (u(7, t) * scl)), New
Point(xg(8), y1 - (u(8, t) * scl))}
Dim Pen1 As New Pen(Color.Blue, 2)
g.DrawLines(Pen1, Puntos11)
Label1.Visible = True
Label2.Visible = True
Label2.Text = Math.Round(t * k, 3)
Label43.Visible = True
Label42.Visible = True
Label42.Text = t
Case 2
Panel()
Dim Puntos11() As Point = {New Point(xg(0), y1 - (u(0, t) * scl)), New
Point(xg(1), y1 - (u(1, t) * scl)), New Point(xg(2), y1 - (u(2, t) * scl)), New Point(xg(3),
y1 - (u(3, t) * scl)), New Point(xg(4), y1 - (u(4, t) * scl)), New Point(xg(5), y1 - (u(5, t)
* scl)), New Point(xg(6), y1 - (u(6, t) * scl)), New Point(xg(7), y1 - (u(7, t) * scl)), New
Point(xg(8), y1 - (u(8, t) * scl))}
Dim Pen1 As New Pen(Color.Blue, 2)
g.DrawLines(Pen1, Puntos11)
Label1.Visible = True

93
Label2.Visible = True
Label2.Text = Math.Round(t * k, 3)
Label43.Visible = True
Label42.Visible = True
Label42.Text = t
Case 3
Panel()
Dim Puntos11() As Point = {New Point(xg(0), y1 - (u(0, t) * scl)), New
Point(xg(1), y1 - (u(1, t) * scl)), New Point(xg(2), y1 - (u(2, t) * scl)), New Point(xg(3),
y1 - (u(3, t) * scl)), New Point(xg(4), y1 - (u(4, t) * scl)), New Point(xg(5), y1 - (u(5, t)
* scl)), New Point(xg(6), y1 - (u(6, t) * scl)), New Point(xg(7), y1 - (u(7, t) * scl)), New
Point(xg(8), y1 - (u(8, t) * scl))}
Dim Pen1 As New Pen(Color.Blue, 2)
g.DrawLines(Pen1, Puntos11)
Label1.Visible = True
Label2.Visible = True
Label2.Text = Math.Round(t * k, 3)
Label43.Visible = True
Label42.Visible = True
Label42.Text = t
Case 4 To 2000
Panel()
Dim Puntos11() As Point = {New Point(xg(0), y1 - (u(0, t) * scl)), New
Point(xg(1), y1 - (u(1, t) * scl)), New Point(xg(2), y1 - (u(2, t) * scl)), New Point(xg(3),
y1 - (u(3, t) * scl)), New Point(xg(4), y1 - (u(4, t) * scl)), New Point(xg(5), y1 - (u(5, t)
* scl)), New Point(xg(6), y1 - (u(6, t) * scl)), New Point(xg(7), y1 - (u(7, t) * scl)), New
Point(xg(8), y1 - (u(8, t) * scl))}
Dim Pen1 As New Pen(Color.Blue, 2)
g.DrawLines(Pen1, Puntos11)
Label1.Visible = True
Label2.Visible = True
Label2.Text = Math.Round(t * k, 3)
Label43.Visible = True
Label42.Visible = True
Label42.Text = t
If u(4, t) < 20.009 Then
Timer1.Enabled = False
Label4.Visible = True
End If
End Select
t = t + 1
End Sub
Private Sub Button4_Click(sender As Object, e As EventArgs) Handles
Button4.Click
End
End Sub

94
Private Sub Button1_Click(sender As Object, e As EventArgs) Handles
Button1.Click
Inicio.Show()
Close()
End Sub
End Class