Gene Expression Profiling in Behcet s Disease Indicates an ...
19
Research Article Gene Expression Profiling in Behcet’s Disease Indicates an Autoimmune Component in the Pathogenesis of the Disease and Opens New Avenues for Targeted Therapy Antonio Puccetti , 1,2 Piera Filomena Fiore , 1 Andrea Pelosi , 1 Elisa Tinazzi, 3 Giuseppe Patuzzo, 3 Giuseppe Argentino, 3 Francesca Moretta, 3 Claudio Lunardi , 3 and Marzia Dolcino 3 1 Immunology Area, Pediatric Hospital Bambino Gesù, Viale San Paolo 15, 00146 Rome, Italy 2 Department of Experimental Medicine, Section of Histology, University of Genova, Via G.B. Marsano 10, 16132 Genova, Italy 3 Department of Medicine, University of Verona, Piazzale L.A. Scuro 10, 37134 Verona, Italy Correspondence should be addressed to Marzia Dolcino; [email protected] Received 3 January 2018; Accepted 26 February 2018; Published 24 April 2018 Academic Editor: Marcella Reale Copyright © 2018 Antonio Puccetti et al. This is an open access article distributed under the Creative Commons Attribution License, which permits unrestricted use, distribution, and reproduction in any medium, provided the original work is properly cited. Behçet disease (BD) is a chronic inflammatory multisystem disease characterized by oral and genital ulcers, uveitis, and skin lesions. Disease etiopathogenesis is still unclear. We aim to elucidate some aspects of BD pathogenesis and to identify specific gene signatures in peripheral blood cells (PBCs) of patients with active disease using novel gene expression and network analysis. 179 genes were modulated in 10 PBCs of BD patients when compared to 10 healthy donors. Among differentially expressed genes the top enriched gene function was immune response, characterized by upregulation of Th17-related genes and type I interferon- (IFN-) inducible genes. Th17 polarization was confirmed by FACS analysis. The transcriptome identified gene classes (vascular damage, blood coagulation, and inflammation) involved in the pathogenesis of the typical features of BD. Following network analysis, the resulting interactome showed 5 highly connected regions (clusters) enriched in T and B cell activation pathways and 2 clusters enriched in type I IFN, JAK/STAT, and TLR signaling pathways, all implicated in autoimmune diseases. We report here the first combined analysis of the transcriptome and interactome in PBCs of BD patients in the active stage of disease. This approach generates useful insights in disease pathogenesis and suggests an autoimmune component in the origin of BD. 1. Introduction Behçet disease (BD) is a chronic multisystem disease mainly characterized by mucous-cutaneous lesions such as oral and genital ulcers, erythema nodosum-like lesions, and papulo- pustular lesions, and by uveitis. Moreover, manifestations of vascular, articular, neurologic, urogenital, gastrointestinal, pulmonary, and cardiac involvement may occur. BD was first described by Hulusi Behçet in 1937 as a tri- symptom complex represented by recurrent aphthous sto- matitis, genital ulcers, and uveitis. The diagnosis of the disease is still based on clinical criteria since universally accepted pathognomonic laboratory tests are lacking. An international study group on Behcet’s disease has recently revised the criteria for classification/diagnosis of BD [1]. There are sporadic cases of BD all around the world, but it is most frequently seen along the ancient Silk Route, with a prevalence of 14–20/100,000 inhabitants. According to epi- demiological studies, the disease is most prevalent in coun- tries located between 30 and 45 ° north latitude through the Mediterranean Basin, the Middle East and Far East regions such as China and Japan [2]. The interaction between a complex genetic background and both innate and adaptive immune systems leads to the clinical features of the disease. The presence of familiar cases in 10% of the patients, the particular geographic distribution Hindawi Journal of Immunology Research Volume 2018, Article ID 4246965, 18 pages https://doi.org/10.1155/2018/4246965
Transcript of Gene Expression Profiling in Behcet s Disease Indicates an ...

Research ArticleGene Expression Profiling in Behcet’s Disease Indicates anAutoimmune Component in the Pathogenesis of the Disease andOpens New Avenues for Targeted Therapy
Antonio Puccetti ,1,2 Piera Filomena Fiore ,1 Andrea Pelosi ,1 Elisa Tinazzi,3
Giuseppe Patuzzo,3 Giuseppe Argentino,3 Francesca Moretta,3 Claudio Lunardi ,3
and Marzia Dolcino 3
1Immunology Area, Pediatric Hospital Bambino Gesù, Viale San Paolo 15, 00146 Rome, Italy2Department of Experimental Medicine, Section of Histology, University of Genova, Via G.B. Marsano 10, 16132 Genova, Italy3Department of Medicine, University of Verona, Piazzale L.A. Scuro 10, 37134 Verona, Italy
Correspondence should be addressed to Marzia Dolcino; [email protected]
Received 3 January 2018; Accepted 26 February 2018; Published 24 April 2018
Academic Editor: Marcella Reale
Copyright © 2018 Antonio Puccetti et al. This is an open access article distributed under the Creative Commons AttributionLicense, which permits unrestricted use, distribution, and reproduction in any medium, provided the original work isproperly cited.
Behçet disease (BD) is a chronic inflammatory multisystem disease characterized by oral and genital ulcers, uveitis, and skin lesions.Disease etiopathogenesis is still unclear. We aim to elucidate some aspects of BD pathogenesis and to identify specific genesignatures in peripheral blood cells (PBCs) of patients with active disease using novel gene expression and network analysis. 179genes were modulated in 10 PBCs of BD patients when compared to 10 healthy donors. Among differentially expressed genesthe top enriched gene function was immune response, characterized by upregulation of Th17-related genes and type Iinterferon- (IFN-) inducible genes. Th17 polarization was confirmed by FACS analysis. The transcriptome identified geneclasses (vascular damage, blood coagulation, and inflammation) involved in the pathogenesis of the typical features of BD.Following network analysis, the resulting interactome showed 5 highly connected regions (clusters) enriched in T and B cellactivation pathways and 2 clusters enriched in type I IFN, JAK/STAT, and TLR signaling pathways, all implicated inautoimmune diseases. We report here the first combined analysis of the transcriptome and interactome in PBCs of BD patientsin the active stage of disease. This approach generates useful insights in disease pathogenesis and suggests an autoimmunecomponent in the origin of BD.
1. Introduction
Behçet disease (BD) is a chronic multisystem disease mainlycharacterized by mucous-cutaneous lesions such as oral andgenital ulcers, erythema nodosum-like lesions, and papulo-pustular lesions, and by uveitis. Moreover, manifestationsof vascular, articular, neurologic, urogenital, gastrointestinal,pulmonary, and cardiac involvement may occur.
BD was first described by Hulusi Behçet in 1937 as a tri-symptom complex represented by recurrent aphthous sto-matitis, genital ulcers, and uveitis. The diagnosis of thedisease is still based on clinical criteria since universallyaccepted pathognomonic laboratory tests are lacking. An
international study group on Behcet’s disease has recentlyrevised the criteria for classification/diagnosis of BD [1].
There are sporadic cases of BD all around the world, butit is most frequently seen along the ancient Silk Route, with aprevalence of 14–20/100,000 inhabitants. According to epi-demiological studies, the disease is most prevalent in coun-tries located between 30 and 45° north latitude through theMediterranean Basin, the Middle East and Far East regionssuch as China and Japan [2].
The interaction between a complex genetic backgroundand both innate and adaptive immune systems leads to theclinical features of the disease. The presence of familiar casesin 10% of the patients, the particular geographic distribution
HindawiJournal of Immunology ResearchVolume 2018, Article ID 4246965, 18 pageshttps://doi.org/10.1155/2018/4246965

and the high frequency of HLA-B51, a split antigen of HLA-B5, among a wide range of ethnic populations favours therole of genetic factors in the pathogenesis of the disease, butit remains poorly understood [3]. Non-HLA genes alsocontribute to the development of BD [3]. Genome-wide asso-ciation studies have shown that polymorphisms in genesencoding for cytokines, activator factors, and chemokinesare associated with increased BD susceptibility. Among cyto-kines, IL-10 polymorphisms cause a reduction of the serumlevel of IL-10, an inhibitory cytokine that regulates innateand adaptive immune responses; on the other hand, IL-23receptor polymorphism, which reduces its ability to respondto IL-23 stimulation, is associated with protection from BD[3–5]. Recent data also reported associations with CCR1,STAT4, and KLRC4 encoding a chemokine receptor, a tran-scription factor implicated in IL-12 and IL-23 signaling and anatural killer receptor, respectively [6, 7]. Moreover, suscep-tibility genes implicating the innate immune response tomicrobial exposure have recently been identified by Immu-nochip analysis [8].
Increased Th1, CD4+, and CD8+ T cell, γδ+ T cell, andneutrophil activities were found both in the serum and ininflamed tissues of BD patients, which suggests that innateand adaptive immunities are involved together in the patho-genesis of BD [2, 9]. Similar to other autoimmune disorders,BD shows Th1-type cytokine profiles. IL-2- and interferon-(INF-) γ-producing T cells were increased in patients withactive BD, while IL-4-producing T cells were lower than incontrols [10]. Recent findings have shown that Th17 mayplay an important role in the pathogenesis of the disease [2,11]. This hypothesis is supported by the observation of highIL-21 and IL-17 levels in sera of patients affected by BD withneurologic involvement [12, 13]. Another study showed thatTh17/Th1 ratio in peripheral blood of patients with BD washigher than those of healthy controls, whereas the Th1/Th2and Th17/Th2 ratios were similar among the two groups.Patients with uveitis or folliculitis had higher Th17/Th1 ratiocompared with patients without these manifestations [14,15]. Further investigation is required in order to betterunderstand the role of the immune system in BD andwhether the polarization towards a Th1/Th17 pathway mayplay a critical role in BD pathogenesis.
In this study, we used a gene array strategy to identifytranscriptional profiles of PBCs obtained from patients withactive BD. Using this approach, we think we have been ableto shed a new light on some aspects of the disease pathogen-esis by dissecting different aspects of this complex pathologyin order to better clarify the role of the immune system in BD.
2. Patients and Methods
2.1. Patients. We studied a cohort of 51 patients (16 malesand 35 females, mean age: 37± 11 years) affected by BD,attending the Unit of Autoimmune Diseases at the UniversityHospital in Verona, Italy.
All patients fulfilled the International Criteria for BehçetDisease (ICBD): oral aphthosis, genital ulcers, and ocularlesions were each given 2 points, whereas 1 point wasassigned to each of skin lesions, vascular manifestations,
and neurological manifestations. A patient scoring 4 pointsor above was classified as having BD [16, 17].
At enrollment, none of the patients had active infectionsor was affected by malignancies.
A group of 10 subjects with BD was selected within theentire cohort of BD patients and utilized for the gene arraystudy. The clinical features of the patients are reported inTable 1 that also includes a description of the BD patientsselected for the gene array study.
A written informed consent was obtained from all theparticipants of the study. The study was approved by localEthical Committee of the Azienda Ospedaliera Universitariaof Verona, Verona, Italy. All investigations have beenconducted according to the principles expressed in theHelsinki declaration.
2.2. Gene Array. Blood sample collection was prepared usingPAXgene Blood RNA tubes (PreAnalytiX, Hombrechtikon,Switzerland), and total RNA was extracted by following themanufacturer’s instructions. cRNA preparation, samplehybridization, and scanning were performed as recom-mended by the Affymetrix (Affymetrix, Santa Clara, CA,USA) supplied protocols and by the Cogentech Affymetrixmicroarray unit (Campus IFOM IEO, Milan, Italy) usingHuman Genome U133A 2.0 (HG-U133A 2.0) GeneChip(Affymetrix). For gene expression profile analysis, wefollowed the methods of Dolcino et al. [18]. Trancripts withan expression level at least 2.0 fold different in the test sampleversus control sample (p ≤ 0 01) were functionally classifiedaccording to the Gene Ontology (GO) annotations and sub-mitted to the pathway analysis using the PANTHER expres-sion analysis tools (http://pantherdb.org/) [19]. Theenrichment of all pathways associated with the differentiallyexpressed genes compared to the distribution of genes repre-sented on the Affymetrix HG-U133A microarray was ana-lyzed, and p values≤ 0.05, calculated by the binomialstatistical test, were considered as significant enrichment.
2.3. Protein-Protein Interaction (PPI) Network Constructionand Network Clustering. The search tool for the retrieval ofinteracting genes (STRING version 1.0; http://string-db.org/)is an online database which includes experimental as well aspredicted interaction information and comprises >1100completely sequenced organisms [20]. DEGs were directlymapped to the STRING database for acquiring significantprotein-protein interaction (PPI) pairs from a range ofsources, including data from experimental studies and dataretrieved by text mining and homology searches [21]. PPIpairs with the combined score of ≥0.7 were retained for theconstruction of the PPI network.
The graph-based Markov clustering algorithm (MCL)allows the visualization of high-flow regions (clusters/mod-ules) separated by boundaries with no flow, containing geneproducts that are expected to be involved in the same (orsimilar) biological processes [22].
In order to detect highly connected subgraphs (areas),the MCL algorithm was applied to the protein interactomegraph.
2 Journal of Immunology Research

Cytoscape software [22] was used to visualize all theconstructed networks.
2.4. PBMCs Isolation. PBMCs were obtained from 30 healthydonors and 30 patients affected by BD through a density-gradient centrifugation on Lymphoprep (Nycomed Pharma,Oslo, NO) at 800×g. Cells were washed twice with PBSand counted using acridine orange (Thermo Fisher Scien-tific, Waltham, MA, USA), considering only viable cells forFACS analyses.
2.5. FACS Analysis. Cell samples were treated by followingthe methods of Dolcino et al. [18]. Cells were stimulated overnight with Dynabeads Human T-Activator CD3/CD28(Life Technologies, Carlsbad, CA, USA). The detection ofIL-17 production was analyzed using the IL-17 SecretionAssay (Miltenyi Biotec, Bergisch Gladbach), following themanufacturer’s instruction as described in the methods ofDolcino et al. [18].
2.6. Real-Time RT-PCR. Total RNA was isolated from PBCusing TRIzol Reagent (Invitrogen, Carlsbad, CA, USA), fol-lowing the manufacturer’s instructions. PCR was performedby following the methods of Dolcino et al. [18]. Predesigned,
gene-specific primers and probe sets for each gene (CCL2,CXCL2, ICAM1, and IL-8) were obtained from Assay-on-Demand Gene Expression Products (Applied Biosystems).
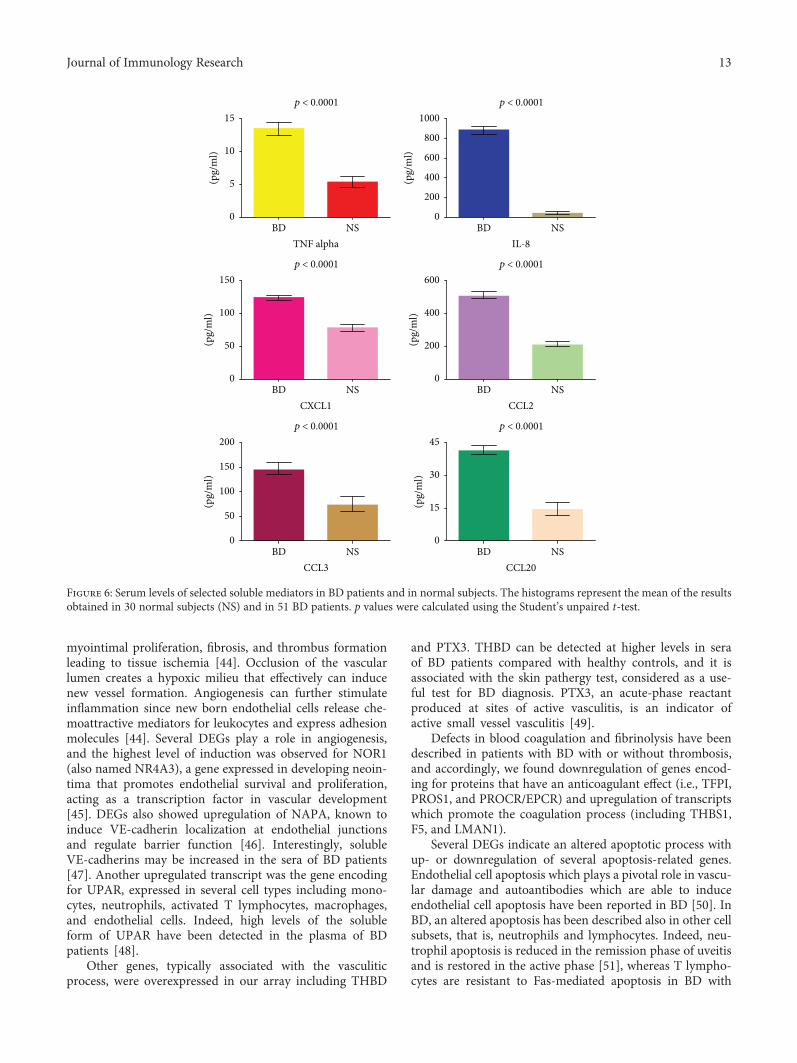
2.7. Detection of Soluble Mediators in Sera of BD Patients andHealthy Controls. Serum levels of TNF alpha, IL-8, CXCL1,CCL2, CCL3, and CCL20 were detected using commerciallyavailable ELISAkits (Quantikine, R&DSystems,Minneapolis,MN,USA), according to themanufacturer’s instructions in 51BD patients when compared to the 30 normal healthy donors.
2.8. Statistical Analysis. Statistical testing was performedusing SPSS Statistics 2 software (IBM, United States). Dataobtained from the analysis of the soluble mediators and fromthe analysis of IL-17-positive CD4+ T cells in PBMCs wereanalyzed using the Student’s unpaired t-test.
3. Results
3.1. Gene Array Analysis. In order to identify specific genesignatures typically associated with BD, we compared thegene expression profiles of 10 PBC samples obtained from10 individual BD patients with 10 PBC samples obtainedfrom healthy age- and sex-matched donors.
Table 1: Clinical features of the patients with BD included in the study.
Patients 51 (100%)
SexMale 16 (31%)
Female 35 (68%)
Clinical features
Aphthous stomatitis 51 (100%)
Genital ulcers 34 (66%)
Erythema nodosum-like lesions 7 (13%)
Papulopustular lesion 37 (72%)
Uveitis 5 (9%)
Epididymitis 3 (5%)
Neurological symptoms 8 (14%)
Vasculitis 6 (12%)
Joints manifestations 43 (84%)
Gastrointestinal involvement 3 (5%)
Association with HLA-B51 32 (62%)
Patients utilised for gene array study 10 (100%)
SexMale 6
Female 4
Clinical features
Aphthous stomatitis 10 (100%)
Genital ulcers 4 (40%)
Erythema nodosum-like lesions 1 (10%)
Papulopustular lesion 8 (80%)
Uveitis 1 (10%)
Epididymitis 0
Neurological symptoms 1 (10%)
Vasculitis 3 (30%)
Joint manifestation 8 (80%)
Gastrointestinal involvement 0
Association with HLA-B51 7 (70%)
3Journal of Immunology Research

We found that 179 modulated genes complied with theBonferroni-corrected p value criterion (p ≤ 0 01) and the foldchange criterion (FC≥2), showing robust and statistically sig-nificant variation between healthy controls and BD PBC. Inparticular, 160 and 19 transcripts resulted to be up- anddownregulated, respectively.
Figure 1(a) is a hierarchical cluster diagram representingthe signal intensity of DEGs across samples; the heat mapshows a different gene expression profile between BDpatients and healthy donors that clearly separates the two setsof specimens.
Figure 1(b) shows a functional classification of all DEGsaccording to the Gene Ontology (GO) terms.
The Gene Ontology analysis showed that the vast major-ity of the regulated transcripts can be ascribed to biologicalprocesses that may play a role in BD, including inflamma-tion, immune response, apoptosis, blood coagulation, vascu-lar damage, and cell proliferation. Table 2 shows a detailedselection of DEGs within the abovementioned processes.The table also includes GenBank accession numbers and foldchanges. The complete list of modulated genes can be foundin Supplementary Table 1.
Interestingly, regulated transcripts are distributed in genecategories that control different biological processes. How-ever, the functional classes which show the highest enrich-ment in modulated genes are immune response (71/179)and inflammation (55/179).
Among genes ascribed to the immune response, twentyTh17-lymphocyte-related genes were upregulated includinginterleukin 6 signal transducer, IL6ST, chemokine (C-Cmotif) ligand 20, CCL20, suppressor of cytokine signaling3, SOCS3, chemokine (C-X-C motif) ligand 1, CXCL1,chemokine (C-X-C motif) ligand 2, CXCL2, chemokine(C-X-C motif) ligand 3, CXCL3, inducible T cell costimu-lator, ICOS, intercellular adhesion molecule 1, ICAM1,interleukin 8, IL-8, interleukin 1 beta, and IL-1B (see alsoTable 2). Some genes involved in B cell activity (CD83molecule, CD72 molecule, Fc receptor-like 2, FCRL2, andSAM domain, SH3 domain and nuclear localization signals1 (SAMSN1)) are modulated in patients’ samples, indicat-ing a concomitant activation of this lymphocyte cell subsetin BD.
Several upregulated genes play a role in innate immunityand are expressed in neutrophils (i.e., defensin, alpha 1,DEFA1, Fc fragment of IgA, receptor, and FCAR), dendriticcells (i.e., Dab, mitogen-responsive phosphoprotein, andhomolog 2 DAB2), and in macrophages (adaptor-relatedprotein complex 2, mu 1 subunit, and AP2M1).
In agreement with the typical presence of a markedinflammatory response in BD, we also observed overex-pression of several proinflammatory transcripts. Theupregulated genes comprise IL-8, IL-1B, CXCL2, CXCL1,CXCL3, interleukin 1, alpha (IL-1A), tumor necrosis factor(TNF), and oxidized low-density lipoprotein (lectin-like)receptor 1 (OLR1/LOX1).
Remarkably, in these two functional classes, weobserved that a large number of genes are involved in well-known signaling networks that have been associated withautoimmune diseases.
These signal cascades include: (1) the interferon-alpha(IFN-A) pathway also named “type I interferon signature”[23], (2) the Toll-like receptor (TLR) signaling network,and (3) the JAK/STAT signaling pathway.
In particular, 9 type I interferon-inducible genes (IFIG)were upregulated (Table 2), thus showing the presence ofan IFN type I signature, typically present in autoimmune dis-eases such as systemic lupus erythematosus (SLE), rheuma-toid arthritis (RA), Crohn’s disease, and Sjogren syndrome(SS) [24–30].
Twelve DEGs belong to the TLR signaling cascade(Table 2) which is thought to play a role in the onset of sev-eral autoimmune diseases and has been also implicated in thepathogenesis of BD [31–34].
Eight upregulated genes belong to the JAK/STAT signal-ing pathway, and interestingly, an increased JAK/STAT sig-naling has been associated with almost every autoimmunedisease [35].
Moreover, activation of the JAK/STAT signaling pathwayhas been observed in monocytes and CD4+ T cells of patientswith BD [36].
Several genes involved in apoptosis and/or in apoptosisregulation were modulated in BD samples including myeloidcell leukemia sequence 1 (BCL2-related), MCL-1, BCL2-like11, BCL2L11, immediate early response 3, IER3 and ZFP36ring finger protein-like 2, and ZFP36L2.
Cell proliferation was also deregulated, and we foundmodulation of several transcripts including BTG family,member 2, BTG2, epiregulin, EREG, proline-rich coiled-coil2C (PRRC2), phosphatase, tensin homolog pseudogene 1(PTENP1), and amyloid beta (A4) precursor-like protein 2(APLP2).
Endothelial dysfunction and altered coagulation aretypical features of BD vasculitis, and consistently withthese aspects of the disease, several genes involved in vas-cular damage are modulated in BD specimens, includingthrombospondin 1, THBS1; protein S alpha, PROS1; plas-minogen activator, urokinase receptor, PLAU-UPAR;thrombomodulin, THBD; and vascular endothelial growthfactor A, VEGFA.
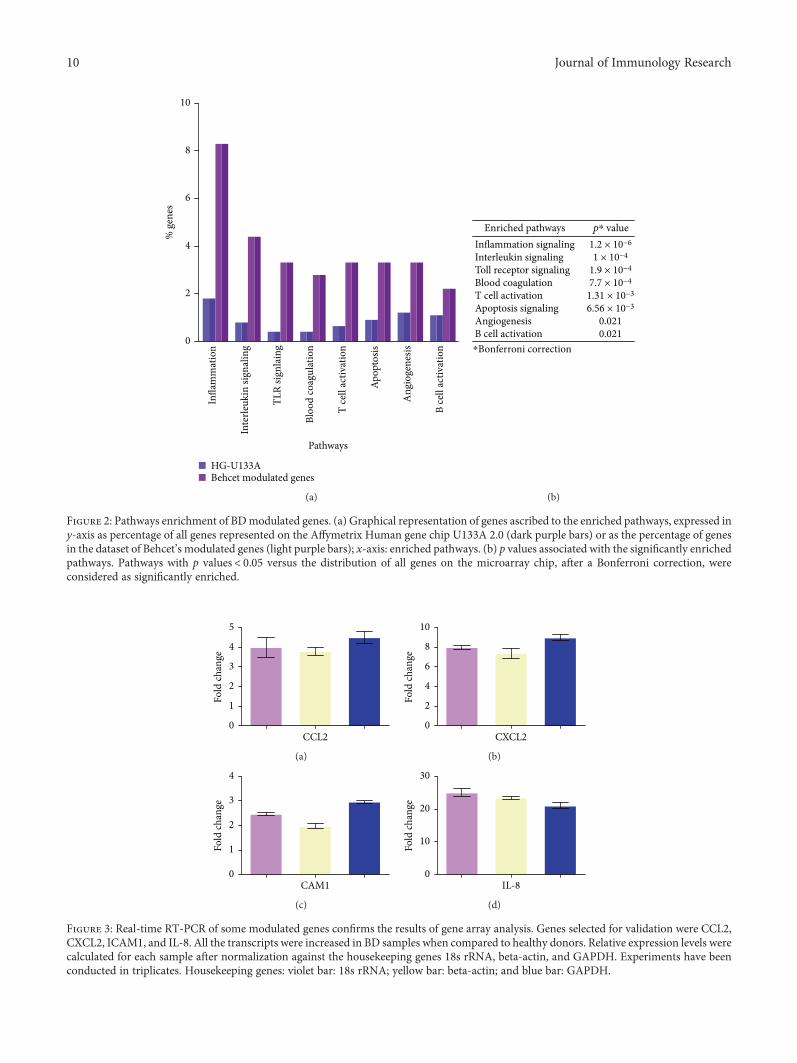
The 179 DEGs were then submitted to a pathway analysisusing the PANTHER expression analysis tool and function-ally annotated according to canonical pathways. Eightcanonical pathways were found to be significantly overrepre-sented among the differentially expressed genes, and inflam-mation was the most enriched pathways, followed byinterleukin signaling, Toll-like receptor signaling, bloodcoagulation, T cell activation, apoptosis, angiogenesis, andthe B cell activation pathway (Figure 2).
The modulation of some genes showed by gene arrayanalysis was validated by Q-PCR (Figure 3).
3.2. PPI Network Analysis. The gene expression profiling ofBD PBC was then complemented by the study of functionalinteractions between DEGs’ protein products.
To this aim, an interaction network was constructedupon the 179 DEGs, using the STRING data mining toolfor retrieving well-documented connections between pro-teins. The obtained protein-protein interaction (PPI)
4 Journal of Immunology Research

Normal donorsBehcet
ND
1N
D2
ND
3N
D4
ND
5N
D6
ND
7N
D8
ND
9N
D10
DB1
DB2
DB3
DB4
DB5
DB6
DB7
DB8
DB9
DB1
0
(a)
ApoptosisCell proliferationImmune responseTLR signalingType I interferon signaling
JAK/STAT signalingInflammationVascular damageBlood coagulationRNA processing
DNA processingTranslationMiscellaneous
(b)
Figure 1: Modulated genes in PBCs of 10 BD patients and their functional classification. Heat map of significantly modulated genes (a). Eachrow represents a gene, each column shows the expression of selected genes in each individual sample. Blue-violet indicates genes that areexpressed at lower levels when compared with the mean value of the control subjects, orange-red indicates genes that are expressed athigher levels when compared to the control means, and yellow indicates genes whose expression levels are similar to the control mean.Panel (b) shows the functional categorization of BD modulated genes according to GO terms. In the legend, the gene classes are listed in aclock-wise order starting at the “12 o’clock” position.
5Journal of Immunology Research
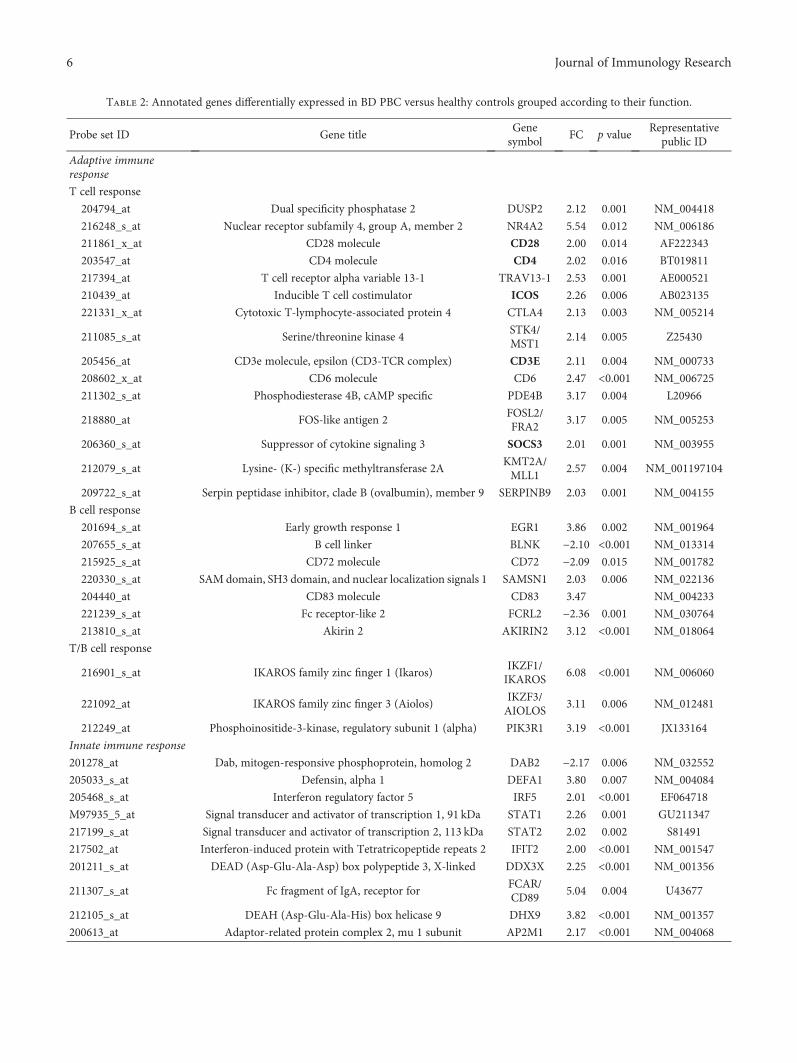
Table 2: Annotated genes differentially expressed in BD PBC versus healthy controls grouped according to their function.
Probe set ID Gene titleGenesymbol
FC p valueRepresentative
public ID
Adaptive immuneresponse
T cell response
204794_at Dual specificity phosphatase 2 DUSP2 2.12 0.001 NM_004418
216248_s_at Nuclear receptor subfamily 4, group A, member 2 NR4A2 5.54 0.012 NM_006186
211861_x_at CD28 molecule CD28 2.00 0.014 AF222343
203547_at CD4 molecule CD4 2.02 0.016 BT019811
217394_at T cell receptor alpha variable 13-1 TRAV13-1 2.53 0.001 AE000521
210439_at Inducible T cell costimulator ICOS 2.26 0.006 AB023135
221331_x_at Cytotoxic T-lymphocyte-associated protein 4 CTLA4 2.13 0.003 NM_005214
211085_s_at Serine/threonine kinase 4STK4/MST1
2.14 0.005 Z25430
205456_at CD3e molecule, epsilon (CD3-TCR complex) CD3E 2.11 0.004 NM_000733
208602_x_at CD6 molecule CD6 2.47 <0.001 NM_006725
211302_s_at Phosphodiesterase 4B, cAMP specific PDE4B 3.17 0.004 L20966
218880_at FOS-like antigen 2FOSL2/FRA2
3.17 0.005 NM_005253
206360_s_at Suppressor of cytokine signaling 3 SOCS3 2.01 0.001 NM_003955
212079_s_at Lysine- (K-) specific methyltransferase 2AKMT2A/MLL1
2.57 0.004 NM_001197104
209722_s_at Serpin peptidase inhibitor, clade B (ovalbumin), member 9 SERPINB9 2.03 0.001 NM_004155
B cell response
201694_s_at Early growth response 1 EGR1 3.86 0.002 NM_001964
207655_s_at B cell linker BLNK −2.10 <0.001 NM_013314
215925_s_at CD72 molecule CD72 −2.09 0.015 NM_001782
220330_s_at SAM domain, SH3 domain, and nuclear localization signals 1 SAMSN1 2.03 0.006 NM_022136
204440_at CD83 molecule CD83 3.47 NM_004233
221239_s_at Fc receptor-like 2 FCRL2 −2.36 0.001 NM_030764
213810_s_at Akirin 2 AKIRIN2 3.12 <0.001 NM_018064
T/B cell response
216901_s_at IKAROS family zinc finger 1 (Ikaros)IKZF1/IKAROS
6.08 <0.001 NM_006060
221092_at IKAROS family zinc finger 3 (Aiolos)IKZF3/AIOLOS
3.11 0.006 NM_012481
212249_at Phosphoinositide-3-kinase, regulatory subunit 1 (alpha) PIK3R1 3.19 <0.001 JX133164
Innate immune response
201278_at Dab, mitogen-responsive phosphoprotein, homolog 2 DAB2 −2.17 0.006 NM_032552
205033_s_at Defensin, alpha 1 DEFA1 3.80 0.007 NM_004084
205468_s_at Interferon regulatory factor 5 IRF5 2.01 <0.001 EF064718
M97935_5_at Signal transducer and activator of transcription 1, 91 kDa STAT1 2.26 0.001 GU211347
217199_s_at Signal transducer and activator of transcription 2, 113 kDa STAT2 2.02 0.002 S81491
217502_at Interferon-induced protein with Tetratricopeptide repeats 2 IFIT2 2.00 <0.001 NM_001547
201211_s_at DEAD (Asp-Glu-Ala-Asp) box polypeptide 3, X-linked DDX3X 2.25 <0.001 NM_001356
211307_s_at Fc fragment of IgA, receptor forFCAR/CD89
5.04 0.004 U43677
212105_s_at DEAH (Asp-Glu-Ala-His) box helicase 9 DHX9 3.82 <0.001 NM_001357
200613_at Adaptor-related protein complex 2, mu 1 subunit AP2M1 2.17 <0.001 NM_004068
6 Journal of Immunology Research

Table 2: Continued.
Probe set ID Gene titleGenesymbol
FC p valueRepresentative
public ID
NK cell response
215339_at Natural killer-tumor recognition sequence NKTR 2.15 0.001 NM_005385
211242_x_atKiller cell immunoglobulin-like receptor, two domains, long
cytoplasmic tail, 4KIR2DL4 2.00 0.004 AF276292
216552_x_atKiller cell immunoglobulin-like receptor, two domains, short
cytoplasmic tail, 4KIR2DS4 2.08 0.002 NM_001281972
209722_s_at Serpin peptidase inhibitor, clade B (ovalbumin), member 9 SERPINB9 2.03 0.001 NM_004155
Adaptive/innate immuneresponse
204863_s_atInterleukin 6 signal transducer (gp130, oncostatin M
receptor)IL6ST 4.44 0.005 AB102799
211192_s_at CD84 molecule CD84 2.32 0.002 AF054818
213810_s_at Akirin 2 AKIRIN2 3.12 0.001 AW007137
209722_s_at Serpin peptidase inhibitor, clade B (ovalbumin), member 9 SERPINB9 2.03 0.001 NM_004155
221491_x_at Major histocompatibility complex, class II, DR beta 1 HLA-DRB1 2.19 <0.001 U65585
213494_s_at YY1 transcription factor YY1 2.00 0.006 NM_003403
Toll-like receptorssignaling
205067_at Interleukin 1, beta IL-1B 6.32 0.001 NM_000576
206676_at Carcinoembryonic antigen-related cell adhesion molecule 8 CEACAM8 5.07 0.003 M33326
204924_at Toll-like receptor 2 TLR2 2.00 0.015 NM_003264
221060_s_at Toll-like receptor 4 TLR4 2.10 0.001 NM_003266
211027_s_atInhibitor of kappa light polypeptide gene enhancer in B cells,
kinase betaIKBKB/IKKb
2.33 <0.001 AY663108
213281_at Jun protooncogene JUN/AP1 4.51 0.011 NM_002228
206035_at V-rel reticuloendotheliosis viral oncogene homolog REL/c-REL 2.56 0.005 NM_002908
217738_at Nicotinamide phosphoribosyltransferase NAMPT 2.64 0.008 NM_005746
216450_x_at Heat shock protein 90 kDa beta (Grp94), member 1HSP90B1/GP96
3.24 <0.001 NM_003299
214370_at S100 calcium binding protein A8 S100A8 3.85 <0.001 NM_002964
211016_x_at Heat shock 70 kDa protein 4 HSPA4 2.25 <0.001 NM_002154
211622_s_at ADP-ribosylation factor 3 ARF3 2.12 <0.001 M33384
Type I interferonsignaling
205468_s_at Interferon regulatory factor 5 IRF5 2.01 <0.001 EF064718
M97935_5_at Signal transducer and activator of transcription 1, 91 kDa STAT1 2.26 0.001 GU211347
217199_s_at Signal transducer and activator of transcription 2, 113 kDa STAT2 2.02 0.002 S81491
216598_s_at Chemokine (C-C motif) ligand 2 CCL2 2.00 0.002 S69738
210001_s_at Suppressor of cytokine signaling 1 SOCS1 2.16 0.012 AB005043
207433_at Interleukin 10 IL-10 2.16 <0.001 NM_000572
210512_s_at Vascular endothelial growth factor A VEGFA 2.01 0.003 AF022375
217502_at Interferon-induced protein with tetratricopeptide repeats 2 IFIT2 2.00 <0.001 NM_001547
201211_s_at DEAD (Asp-Glu-Ala-Asp) box polypeptide 3, X-linked DDX3X 2.25 <0.001 NM_001356
JAK/STAT signaling
M97935_5_at Signal transducer and activator of transcription 1, 91 kda STAT1 2.26 0.001 GU211347
217199_s_at Signal transducer and activator of transcription 2, 113 kda STAT2 2.02 0.002 S81491
204863_s_atInterleukin 6 signal transducer(gp130, oncostatin M receptor)
IL6ST 4.44 0.005 AB102799
207433_at Interleukin 10 IL-10 2.16 <0.001 NM_000572
7Journal of Immunology Research

Table 2: Continued.
Probe set ID Gene titleGenesymbol
FC p valueRepresentative
public ID
217489_s_at Interleukin 6 receptor IL6R 2.03 0.011 S72848
212249_at Phosphoinositide-3-kinase, regulatory subunit 1 (alpha) PIK3R1 3.19 <0.001 JX133164
210001_s_at Suppressor of cytokine signaling 1 SOCS1 2.16 0.012 AB005043
206360_s_at Suppressor of cytokine signaling 3 SOCS3 2.01 0.001 NM_003955
Inflammatory response
207113_s_at Tumor necrosis factor TNF 2.00 0.008 NM_000594
211506_s_at Interleukin 8 IL-8 10.44 0.013 AF043337
207433_at Interleukin 10 IL-10 2.16 <0.001 NM_000572
205067_at Interleukin 1, beta IL-1B 6.32 0.001 NM_000576
217489_s_at Interleukin 6 receptor IL6R 2.03 0.011 S72848
209774_x_at Chemokine (C-X-C motif) ligand 2 CXCL2 5.75 0.007 M57731
201939_at Polo-like kinase 2 PLK2 6.20 0.012 NM_006622
204470_at Chemokine (C-X-C motif) ligand 1 CXCL1 4.64 0.003 NM_001511
207850_at Chemokine (C-X-C motif) ligand 3 CXCL3 3.53 0.015 NM_002090
210118_s_at Interleukin 1, alpha IL-1A 3.93 0.001 M15329
203751_x_at Jun D protooncogene JUND 3.39 0.008 NM_005354
216598_s_at Chemokine (C-C motif) ligand 2 CCL2 2.00 0.002 S69738
205476_at Chemokine (C-C motif) ligand 20 CCL20 2.23 0.011 NM_004591
205114_s_at Chemokine (C-C motif) ligand 3 CCL3 2.21 0.007 NM_002983
210001_s_at Suppressor of cytokine signaling 1 SOCS1 2.16 0.012 AB005043
212190_at Serpin peptidase inhibitor, clade e, member 2 SERPINE2 −2.14 0.003 NM_006216
211919_s_at Chemokine (C-X-C motif) receptor 4 CXCR4 2.06 0.008 AF348491
205099_s_at Chemokine (C-C motif) receptor 1 CCR1 2.14 0.002 NM_001295
207075_at NLR family, pyrin domain containing 3 NLRP3 2.15 0.011 NM_004895
203591_s_at Colony-stimulating factor 3 receptor CSF3R 1.89 0.012 NM_000760
215485_s_at Intercellular adhesion molecule 1 ICAM1 2.04 0.015 NM_000201
209701_at Endoplasmic reticulum aminopeptidase 1 ERAP1 2.44 <0.001 NM_016442
216243_s_at Interleukin 1 receptor antagonist IL-1RN 2.26 0.008 NM_173842
202643_s_at Tumor necrosis factor, alpha-induced protein 3 TNFAIP3 2.15 0.012 NM_001270508
201044_x_at Dual specificity phosphatase 1 DUSP1 4.71 0.013 NM_004417
210004_at Oxidized low-density lipoprotein (lectin-like) receptor 1OLR1/LOX1
4.13 0.002 AF035776
214370_at S100 calcium binding protein A8 S100A8 3.85 <0.001 AW238654
213281_at Jun protooncogene JUN/AP1 4.51 0.011 NM_002228
216450_x_at Heat shock protein 90 kDa beta (Grp94), member 1HSP90B1/GP96
3.24 <0.001 NM_003299
Vascular damage
Blood coagulation
204614_at Serpin peptidase inhibitor, clade B (ovalbumin), member 2 SERPINB2 3.96 0.013 NM_002575
202833_s_at Serpin peptidase inhibitor, clade A, member 1 SERPINA1 2.25 <0.001 NM_000295
207808_s_at Protein S alpha PROS1 −2.16 0.002 NM_000313
201110_s_at Thrombospondin 1 THBS1 5.08 0.001 NM_003246
204713_s_at Coagulation factor V (proaccelerin, labile factor) F5 2.53 0.001 NM_000130
203294_s_at Lectin, mannose binding, 1 LMAN1 2.50 <0.001 U09716
213258_atTissue factor pathway inhibitor
(lipoprotein-associated coagulation inhibitor)TFPI −2.53 0.001 BF511231
203650_at Protein C receptor, endothelial PROCR −2.67 0.001 NM_006404
8 Journal of Immunology Research

network comprised 172 genes (nodes) and 2583 pairs ofinteractions (edges) (see Supplementary Figure 1).
When we performed a topological analysis of the PPI net-work using the Cytoscape software, we found that the num-ber of interactions in which the products of the 71“immune response genes” (see Supplementary Table 1) wereinvolved, accounted for the vast majority (70%) of connec-tions present in the whole network (1819/2583).
Given the high connectivity (i.e., number of connections)of the immune response gene products, we decided toperform an additional network analysis that focused on thesegene products, thinking that they could be more informative.
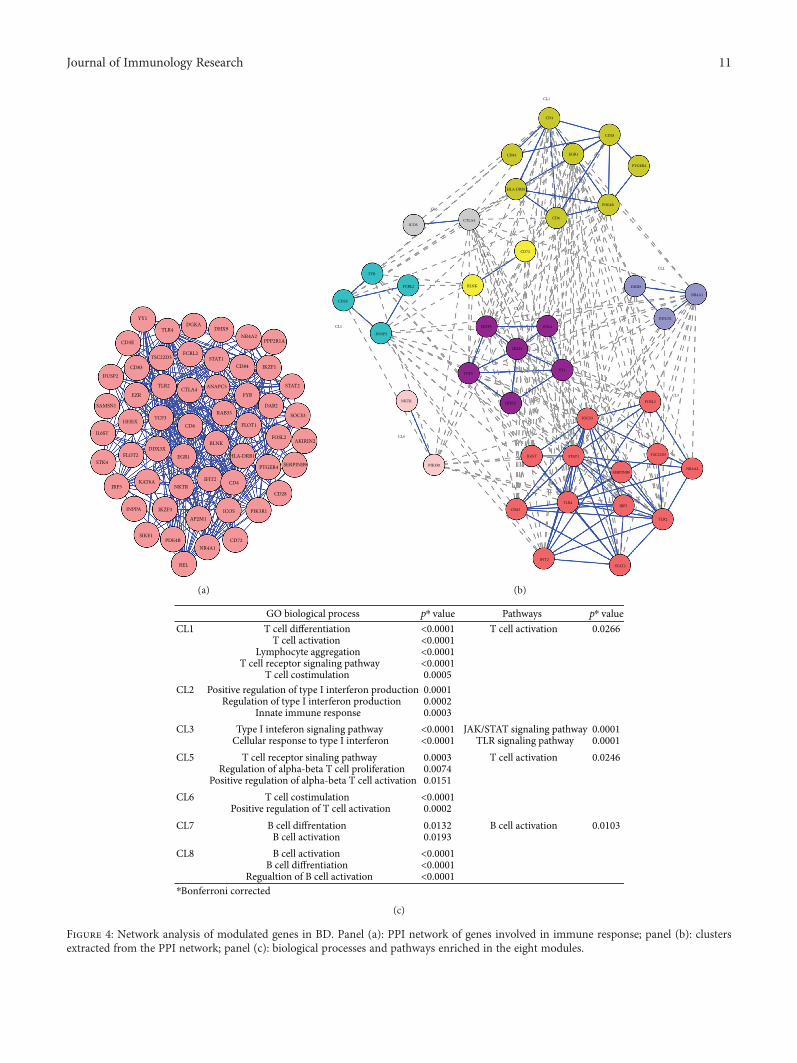
We found that 55 proteins were linked into acomplex network accounting for 307 pairs of interactions.Figure 4(a) shows a graphical representation of thePPI network.
A clustering analysis was then carried out to detect clus-ters (modules) of proteins to which most of the interactions
converged (“high flow areas”) using the MCL algorithm,and we identified eight clusters that collectively accountedfor 40 nodes and 242 edges (Figure 4(b)).
We next performed a functional enrichment analysis toidentify association of genes, in each cluster, with different“GO terms” and pathways.
The significantly enriched categories for each cluster areshown in Figure 4(c).
Interestingly, five out of eight clusters (CL1, CL5, CL6,CL7, and CL8) were representative of the adaptiveimmune response.
In particular, three clusters (CL1, CL5, and CL6) showeda statistically significant enrichment in “T cell-related” genecategories and included several genes typically associatedwith T cell-mediated immune responses such as: CD3E,CD4, CD6, CD28, CTLA4, and DUSP2.
The most enriched GO biological processes (GO-BP) inthese clusters were: “T cell differentiation” and “T cell
Table 2: Continued.
Probe set ID Gene titleGenesymbol
FC p valueRepresentative
public ID
Angiogenesis
211924_s_at Plasminogen activator, urokinase receptorPLAUR/UPAR
3.42 0.007 NM_002659
207329_at Matrix metallopeptidase 8 (neutrophil collagenase) MMP8 2.42 0.012 NM_002424
210512_s_at Vascular endothelial growth factor A VEGFA 2.01 0.003 AF022375
209959_at Nuclear receptor subfamily 4, group A, member 3NR4A3/NOR1
5.69 <0.001 U12767
208751_at N-Ethylmaleimide-sensitive factor attachment protein, alpha NAPA 2.56 0.001 XM_011527436
Vasculitis
203887_s_at Thrombomodulin THBD 2.00 0.015 NM_000361
206157_at Pentraxin 3, long PTX3 2.22 0.001 NM_002852
218880_at FOS-like antigen 2FOSL2/FRA2
3.17 0.005 NM_005253
Apoptosis
M97935_5_at Signal transducer and activator of transcription 1, 91 kDa STAT1 2.26 0.001 GU211347
200796_s_at Myeloid cell leukemia sequence 1 (BCL2-related) MCL1 8.02 <0.001 AF118124
200664_s_at DnaJ (Hsp40) homolog, subfamily B, member 1DNAJB1/HSP40
2.20 0.010 NM_006145
208536_s_at BCL2-like 11 (apoptosis facilitator) BCL2L11 2.38 0.001 NM_006538
213606_s_at Rho GDP dissociation inhibitor (GDI) alpha ARHGDIA 2.30 <0.001 NM_001185077
219228_at Zinc finger protein 331ZNF331/RITA
2.50 0.004 NM_018555
209722_s_at Serpin peptidase inhibitor, clade b (ovalbumin), member 9 SERPINB9 2.03 0.001 NM_004155
201631_s_at Immediate early response 3 IER3 2.85 0.001 NM_003897
201367_s_at ZFP36 ring finger protein-like 2 ZFP36L2 9.07 <0.001 NM_006887
Cell proliferation
201235_s_at BTG family, member 2 BTG2 4.53 <0.001 U72649
205767_at Epiregulin EREG 3.51 0.013 NM_001432
214052_x_at Proline-rich coiled-coil 2CPRRC2C/XTP2
3.11 <0.001 NM_015172
208701_at Amyloid beta (A4) precursor-like protein 2 APLP2 2.64 <0.001 NM_001642
217494_s_at Phosphatase and tensin homolog pseudogene 1 PTENP1 3.11 0.001 AF040103
Bold characters indicate TH17-related genes.
9Journal of Immunology Research
Infla
mm
atio
n
Inte
rleuk
in si
gnal
ing
TLR
signl
aing
Bloo
d co
agul
atio
n
T ce
ll ac
tivat
ion
Apop
tosis
Ang
ioge
nesis
B ce
ll ac
tivat
ion
Pathways
0
2
4
6
8
10
% g
enes
HG-U133ABehcet modulated genes
(a)
⁎Bonferroni correction
Enriched pathways p⁎ value1.2 × 10−6
1 × 10⁻⁴
1.9 × 10⁻⁴
7.7 × 10⁻⁴
1.31 × 10⁻³
6.56 × 10⁻³
0.0210.021
Inflammation signalingInterleukin signalingToll receptor signalingBlood coagulationT cell activationApoptosis signalingAngiogenesisB cell activation
(b)
Figure 2: Pathways enrichment of BDmodulated genes. (a) Graphical representation of genes ascribed to the enriched pathways, expressed iny-axis as percentage of all genes represented on the Affymetrix Human gene chip U133A 2.0 (dark purple bars) or as the percentage of genesin the dataset of Behcet’s modulated genes (light purple bars); x-axis: enriched pathways. (b) p values associated with the significantly enrichedpathways. Pathways with p values< 0.05 versus the distribution of all genes on the microarray chip, after a Bonferroni correction, wereconsidered as significantly enriched.
CCL20
1
2
3
4
5
Fold
chan
ge
(a)
CXCL20
2
4
6
8
10
Fold
chan
ge
(b)
CAM10
1
2
3
4
Fold
chan
ge
(c)
IL-80
10
20
30
Fold
chan
ge
(d)
Figure 3: Real-time RT-PCR of some modulated genes confirms the results of gene array analysis. Genes selected for validation were CCL2,CXCL2, ICAM1, and IL-8. All the transcripts were increased in BD samples when compared to healthy donors. Relative expression levels werecalculated for each sample after normalization against the housekeeping genes 18s rRNA, beta-actin, and GAPDH. Experiments have beenconducted in triplicates. Housekeeping genes: violet bar: 18s rRNA; yellow bar: beta-actin; and blue bar: GAPDH.
10 Journal of Immunology Research
YY1
TLR4DGKA
DHX9NR4A2
PPP2R1A
STAT2
IKZF1CD84STAT1
FCRL2TSC22D3
CD83
CD3E
CTLA4TLR2
EZR
DUSP2
SAMSN1
TCF3HHEX
IL6ST
DDX3XFLOT2
STK4
CD6
EGR1
BLNK
RAB35
FYBANAPC5
DAB2
SOCS3
FOSL2
FLOT1
HLA-DRB1
PTGER4 SERPINB9
AKIRIN2
CD28
CD4IFIT2
ICOS PIK3R1
CD72NR4A1
REL
AP2M1
PDE4B
NKTRKAT6A
IKZF3
SIKE1
INPPA
IRF5
(a)
CL5
CD3E
TYB
FCRL2
DUSP2
CL4
PIK3R1
NKTR HHEX
TCF3YY1
STK4
IKZF1
IKZF3
CL8
BLNK
CL7CD72
CL6
ICOSCTLA4 CD6
HLA-DRB1
PDE4B
PTGER4
CD28
EGR1
CD4
CD84
CL1
CL2
DHX9
NR4A1
DDX3X
CL3FOSL2
SOCS3
NR4A2
TSC22D3
SERPINB9
TLR2
IRF5
STAT1IL6ST
TLR4
STAT2IFIT2
CD83
(b)
GO biological process p⁎ value p
⁎ valuePathwaysCL1
CL2
CL3
CL5
CL6
CL7
CL8
⁎Bonferroni corrected
T cell differentiationT cell activation
Lymphocyte aggregationT cell receptor signaling pathway
T cell costimulationPositive regulation of type I interferon production
Regulation of type I interferon productionInnate immune response
Type I inteferon signaling pathwayCellular response to type I interferon
T cell receptor sinaling pathwayRegulation of alpha-beta T cell proliferation
Positive regulation of alpha-beta T cell activationT cell costimulation
Positive regulation of T cell activationB cell diffrentation
B cell activationB cell activation
B cell diffrentiationRegualtion of B cell activation
<0.0001<0.0001<0.0001<0.00010.00050.00010.00020.0003
<0.0001<0.00010.00030.00740.0151
<0.00010.00020.01320.0193
<0.0001<0.0001<0.0001
T cell activation
JAK/STAT signaling pathwayTLR signaling pathway
T cell activation
B cell activation
0.0266
0.00010.00010.0246
0.0103
(c)
Figure 4: Network analysis of modulated genes in BD. Panel (a): PPI network of genes involved in immune response; panel (b): clustersextracted from the PPI network; panel (c): biological processes and pathways enriched in the eight modules.
11Journal of Immunology Research
activation” (CL1), “T cell receptor signaling pathway” (CL5),“T cell costimulation”, and “positive regulation of T cell acti-vation” (CL6). The most enriched pathway was the “T cellactivation pathway” (CL1 and CL5).
Two clusters (CL7 and CL8) included DEGs typicallyassociated with B cell functions (i.e., CD72). These clusterswere significantly enriched in the GO-BP “B cell differentia-tion” (CL7) and “B cell activation” (CL7, CL8). Moreover,the B cell activation pathway was the top enriched pathwayin cluster 7.
Several DEGs involved in the innate immune response(i.e., HDX9, DDX3X, SOCS3, STAT1, IRF5, IFIT2, andSTAT2) were present in clusters CL2 and CL3. Interestingly,they were significantly enriched in functions of “positive reg-ulation of type I interferon production” (CL2) and “type Iinterferon signaling pathway” (CL3), further confirming thepresence of a type I interferon signature, typically associatedwith several autoimmune diseases. Moreover, genes in cluster3 were significantly involved with the JAK/STAT signalingpathway (p = 0 0001) and the TLR signaling pathway (p =0 0001), both implicated with the development of autoim-mune diseases [31, 35]. Noteworthy, seven Th17-relatedproteins (CD28, CD4, ICOS, CD3E, YY1, TLR4, and IL6ST)were represented in the abovementioned clusters (CL1, CL3,CL5, CL6, and CL8). Finally, no significant GO-BP or path-way was identified in cluster CL4.
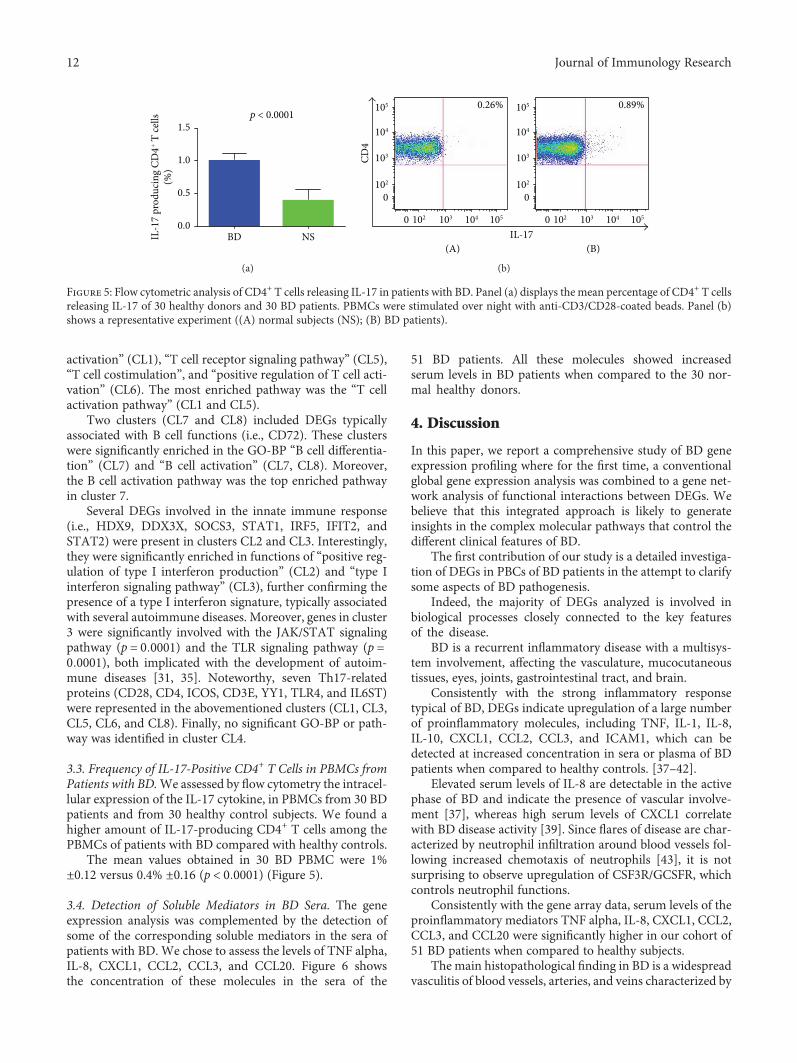
3.3. Frequency of IL-17-Positive CD4+ T Cells in PBMCs fromPatients with BD.We assessed by flow cytometry the intracel-lular expression of the IL-17 cytokine, in PBMCs from 30 BDpatients and from 30 healthy control subjects. We found ahigher amount of IL-17-producing CD4+ T cells among thePBMCs of patients with BD compared with healthy controls.
The mean values obtained in 30 BD PBMC were 1%±0.12 versus 0.4% ±0.16 (p < 0 0001) (Figure 5).
3.4. Detection of Soluble Mediators in BD Sera. The geneexpression analysis was complemented by the detection ofsome of the corresponding soluble mediators in the sera ofpatients with BD. We chose to assess the levels of TNF alpha,IL-8, CXCL1, CCL2, CCL3, and CCL20. Figure 6 showsthe concentration of these molecules in the sera of the
51 BD patients. All these molecules showed increasedserum levels in BD patients when compared to the 30 nor-mal healthy donors.
4. Discussion
In this paper, we report a comprehensive study of BD geneexpression profiling where for the first time, a conventionalglobal gene expression analysis was combined to a gene net-work analysis of functional interactions between DEGs. Webelieve that this integrated approach is likely to generateinsights in the complex molecular pathways that control thedifferent clinical features of BD.
The first contribution of our study is a detailed investiga-tion of DEGs in PBCs of BD patients in the attempt to clarifysome aspects of BD pathogenesis.
Indeed, the majority of DEGs analyzed is involved inbiological processes closely connected to the key featuresof the disease.
BD is a recurrent inflammatory disease with a multisys-tem involvement, affecting the vasculature, mucocutaneoustissues, eyes, joints, gastrointestinal tract, and brain.
Consistently with the strong inflammatory responsetypical of BD, DEGs indicate upregulation of a large numberof proinflammatory molecules, including TNF, IL-1, IL-8,IL-10, CXCL1, CCL2, CCL3, and ICAM1, which can bedetected at increased concentration in sera or plasma of BDpatients when compared to healthy controls. [37–42].
Elevated serum levels of IL-8 are detectable in the activephase of BD and indicate the presence of vascular involve-ment [37], whereas high serum levels of CXCL1 correlatewith BD disease activity [39]. Since flares of disease are char-acterized by neutrophil infiltration around blood vessels fol-lowing increased chemotaxis of neutrophils [43], it is notsurprising to observe upregulation of CSF3R/GCSFR, whichcontrols neutrophil functions.
Consistently with the gene array data, serum levels of theproinflammatory mediators TNF alpha, IL-8, CXCL1, CCL2,CCL3, and CCL20 were significantly higher in our cohort of51 BD patients when compared to healthy subjects.
The main histopathological finding in BD is a widespreadvasculitis of blood vessels, arteries, and veins characterized by
p < 0.0001
BD NS0.0
0.5
1.0
1.5
IL-1
7 pr
oduc
ing
CD4+ T
cells
(%)
(a)
0.26% 0.89%
IL-17
CD4
105
105
104
104
103
103
102
102
0
0
105
105
104
104
103
103
102
102
0
0
(A) (B)
(b)
Figure 5: Flow cytometric analysis of CD4+ T cells releasing IL-17 in patients with BD. Panel (a) displays the mean percentage of CD4+ T cellsreleasing IL-17 of 30 healthy donors and 30 BD patients. PBMCs were stimulated over night with anti-CD3/CD28-coated beads. Panel (b)shows a representative experiment ((A) normal subjects (NS); (B) BD patients).
12 Journal of Immunology Research
myointimal proliferation, fibrosis, and thrombus formationleading to tissue ischemia [44]. Occlusion of the vascularlumen creates a hypoxic milieu that effectively can inducenew vessel formation. Angiogenesis can further stimulateinflammation since new born endothelial cells release che-moattractive mediators for leukocytes and express adhesionmolecules [44]. Several DEGs play a role in angiogenesis,and the highest level of induction was observed for NOR1(also named NR4A3), a gene expressed in developing neoin-tima that promotes endothelial survival and proliferation,acting as a transcription factor in vascular development[45]. DEGs also showed upregulation of NAPA, known toinduce VE-cadherin localization at endothelial junctionsand regulate barrier function [46]. Interestingly, solubleVE-cadherins may be increased in the sera of BD patients[47]. Another upregulated transcript was the gene encodingfor UPAR, expressed in several cell types including mono-cytes, neutrophils, activated T lymphocytes, macrophages,and endothelial cells. Indeed, high levels of the solubleform of UPAR have been detected in the plasma of BDpatients [48].
Other genes, typically associated with the vasculiticprocess, were overexpressed in our array including THBD
and PTX3. THBD can be detected at higher levels in seraof BD patients compared with healthy controls, and it isassociated with the skin pathergy test, considered as a use-ful test for BD diagnosis. PTX3, an acute-phase reactantproduced at sites of active vasculitis, is an indicator ofactive small vessel vasculitis [49].
Defects in blood coagulation and fibrinolysis have beendescribed in patients with BD with or without thrombosis,and accordingly, we found downregulation of genes encod-ing for proteins that have an anticoagulant effect (i.e., TFPI,PROS1, and PROCR/EPCR) and upregulation of transcriptswhich promote the coagulation process (including THBS1,F5, and LMAN1).
Several DEGs indicate an altered apoptotic process withup- or downregulation of several apoptosis-related genes.Endothelial cell apoptosis which plays a pivotal role in vascu-lar damage and autoantibodies which are able to induceendothelial cell apoptosis have been reported in BD [50]. InBD, an altered apoptosis has been described also in other cellsubsets, that is, neutrophils and lymphocytes. Indeed, neu-trophil apoptosis is reduced in the remission phase of uveitisand is restored in the active phase [51], whereas T lympho-cytes are resistant to Fas-mediated apoptosis in BD with
p < 0.0001 p < 0.0001
p < 0.0001 p < 0.0001
p < 0.0001 p < 0.0001
0
5
10
15
(pg/
ml)
0
200
400
600
800
1000
(pg/
ml)
0
200
400
600
(pg/
ml)
0
50
100
150
(pg/
ml)
0
15
30
45
(pg/
ml)
0
50
100
150
200
(pg/
ml)
TNF alphaNSBD
IL-8NSBD
CXCL1NSBD
CCL2NSBD
CCL3NSBD
CCL20NSBD
Figure 6: Serum levels of selected soluble mediators in BD patients and in normal subjects. The histograms represent the mean of the resultsobtained in 30 normal subjects (NS) and in 51 BD patients. p values were calculated using the Student’s unpaired t-test.
13Journal of Immunology Research
active uveitis [52]. On the contrary, an excessive expressionof FasL on skin-infiltrating lymphocytes and the presenceof apoptotic cells in the skin lesions have been also reported[53], suggesting that lymphocytes expressing increased levelsof FasL may have a role in the development of BD skinlesions. Among genes that control cell proliferation, weobserved overexpression of the gene EREG1, which plays anautocrine role in the proliferation of corneal epithelial cells[54], and APLP2 gene, involved in corneal epithelial woundhealing [55]. In this regard, it is worthwhile mentioning thatkeratitis can be one of the ocular manifestations of BD.
Several aspects of BD are typical of an immune-mediateddisease, but whether BD is an autoimmune or an autoinflam-matory disease is still debated. A great number of DEGs(71/179) are involved in the immune response, and themajor-ity of these genes can be ascribed to the adaptive immuneresponse. In particular, DEGs indicate a T cell response witha prevailing upregulation of many TH17-related genes.
In this regard, it is worthwhile mentioning that Th17 cellshave been associated with the pathogenesis of several auto-immune diseases including psoriasis, RA, and SLE [56–58].Noteworthy, the involvement of this T cell subset in the path-ogenesis of BD has been suggested, since Th17-related cyto-kines are considerably increased in BD and peripheralblood Th17/Th1 ratio is significantly higher in patients withactive BD compared to healthy controls [11].
To further validate our data on overexpression of theTh17 pathway in our cohort of patients, we analyzed thepresence of IL-17-producing CD4+ T cells and found a signif-icantly increased percentage of these cells in PBCs of patientswith BD when compared with healthy donors.
Among DEGs regulating B cell responses, we observedoverexpression of SAMSN1, a transcript induced upon B cellactivation [59], and EGR1, involved in the differentiationprogram of B cells into plasma cells, whereas the inhibitoryreceptor CD72 that downmodulates B cell receptor (BCR)signaling was downregulated. All together, these data indi-cate the activation of the B cell immune response and (auto)-antibody production suggesting a possible role of these cellsin BD pathogenesis.
Other genes associated with the adaptive immuneresponse include ICOS, SOCS3, and HLA-DRB1. Interest-ingly, a high expression of ICOS on CD4+ T cells has beendescribed in BD patients with active uveitis, suggesting a rolein the pathogenesis of uveitis, possibly through upregulationof IFN-g, IL-17, and TNF [60].
An increased expression of SOCS3, a regulator of theJAK/STAT pathway of cytokine induction, has beenobserved in all patients with BD irrespective of disease activ-ity [61], and polymorphisms of HLA-DRB1 alleles have beenassociated with BD [62].
In addition, it is worthwhile mentioning that DEGs ofthe adaptive immune response include transcripts alreadyassociated with the development of autoimmune diseases,including CTLA4, MST1, CD6, and the abovementionedSOCS3 [63–66].
We observed that several upregulated genes, includingIRF5, IFIT2, DDX3X, STAT1, and STAT2 participate to typeI interferon and JAK/STAT signaling pathways.
As already mentioned, type I interferon signaling is asso-ciated with autoimmune diseases including SLE, RA, Sjog-ren’s syndrome, and Crohn’s disease [24–30].
In this regard, the copresence of type I IFN signaling andTh17-related genes suggests an autoimmune component inthe origin of BD, since a synergy between IFN and Th17 path-ways is commonly involved in autoimmunity [24–30, 67–69].
Moreover, the JAK/STAT signaling is activated in BD [36]and this pathway has been associated with the development ofsystemic autoimmune diseases such as SLE and RA [70].
Our dataset indicates also the overexpression of severalgenes belonging to the TLR pathway. Growing body of evi-dence suggests the association between TLRs and autoimmu-nity. Indeed, the expression of TLRs in B cells is required forthe synthesis of most of the SLE-associated autoantibodies[71]. Moreover, in RA, extracellular ligands can enhancethe production of the proinflammatory mediators IL6 andIL-17 in human synoviocytes and in PBCs [72]. In addition,in systemic sclerosis activation of TLR4 on the surface offibroblasts contributes to the upregulation of profibrotic che-mokines [73]. Finally, stimulation of TLR2 induces the pro-duction of IL-23 and IL-17 cytokines from the PBCs ofpatients affected by Sjogren’s syndrome [74].
TLR2 and TLR4 have been shown to be overexpressed inPBCs from patients with eye involvement [72] and in buccalmucosal biopsies and in PBCs obtained from patients withflare of the disease [32]. Noteworthy, both TLR2 and TLR4were upregulated in our array, in accordance with the abovereported data [32, 72].
Pathway analysis may help to elucidate the pathogenesisof complex or multifactorial diseases, such as BD, that areoften caused by a mixture of abnormalities of correlated tran-scripts or biological pathways [75]. To this aim, we mappedour DEGs onto canonical pathways to identify signaling cas-cades which were overrepresented in our dataset.
Interestingly, pathway enrichment analysis revealed thatinflammation, IL, TLR, blood coagulation, T cell activation,apoptosis, angiogenesis, and B cell activation signaling path-ways were the most enriched in BD transcriptoma, furtherconfirming their crucial role in the disease pathogenesis.
Thanks to our global analysis we have identified modu-lated genes involved in biological processes that could reca-pitulate most of the typical features of BD. Indeed, themajority of DEGs were involved in immune response andinflammation; moreover, we observed the activation of path-ways (i.e., JAK/STAT and TLRs) and the presence of signa-tures (i.e., type I interferon and TH17 cell) typicallyassociated with an autoimmune response, thus suggestingan autoimmune component in the origin of BD.
We carried our analysis in order to highlight key DEGsfunctionally collaborating in networks that could be involvedin the disease onset and progression.
Indeed, in the second part of our study, instead of lookingat single component of biological processes, we aim to studythe interactions among the protein products of DEGs by anetwork analysis.
A network representation is an intriguing way to studythe complex dynamic of disease-associated molecular inter-actions, and in this perspective, disorders can be considered
14 Journal of Immunology Research

in view of disturbances of molecular networks [76]. Interest-ingly, we observed that the protein products of genes ascribedto the immune response showed the highest degree of con-nectivity in the whole network of DEGs products, thus indi-cating a preeminent role of this gene category in driving theglobal gene expression profiles in BD pathogenesis. Then,we focused our attention on the PPI network specificallyobtained from the immune response gene products, since ithas been described that deregulation of genes, encoding forhighly interactive proteins, interferes with physiologicalprocesses and that molecules involved in diseases develop-ment show a high attitude to interact with each other [77].The clustering analysis of this sub-network helped us tofurther prioritize deregulated gene products that were placedin “highest connectivity areas” (clusters) of the network,where the hubs of biological process regulation are usuallypositioned [78].
In most of the clusters, we found an enrichment inmolecular pathways of B and T cell-mediated adaptiveimmune response, thus suggesting a leading role of theadaptive immunity in the pathogenesis of BD. Moreover,DEGs in these classes included genes associated with theTh17 cell response.
Interestingly, we also observed that the molecules presentin the few clusters enriched in innate immune response wereinvolved in molecular signalings known to play a role inautoimmune diseases including JAK/STAT, TLRs, and typeI interferon signaling.
These findings support that the disease may be sustainedby an autoimmune process and are not in contrast with thehypothesis of an autoinflammatory component in the originof BD.
The network analysis emphasizes the crucial role playedby the molecular pathways emerged from our first globalgene expression study in BD pathogenesis. Indeed, the mole-cules that participate to these signaling pathways are concen-trated in areas (clusters) of the whole network that displaythe highest density of connection between genes, thus indi-cating their prominent role in the disease.
Through this analysis, we believe that we could identifypathogenically meaningful interactions that would have beenhidden in the whole native dataset and that may be stronglyassociated with BD. Moreover, we provide evidence, at leastat a level of gene expression, that BD may have an autoim-mune origin.
Finally, we believe that our data can provide a deeperinsight into BD pathogenesis, highlighting crucial molecularpathways including IL-17, IL-6, and JAK/STAT pathwaysthat may be targeted by biological drugs and by novel thera-peutical strategies.
Conflicts of Interest
The authors declare that they have no conflicts of interest.
Authors’ Contributions
Antonio Puccetti, Claudio Lunardi, and Marzia Dolcino con-ceived and designed the experiments. Piera Filomena Fiore,
Andrea Pelosi, and Giuseppe Argentino performed theexperiments. Marzia Dolcino and Andrea Pelosi analyzedthe data. Elisa Tinazzi, Giuseppe Patuzzo, and FrancescaMoretta selected the patients and contributed reagents.Marzia Dolcino wrote the paper with inputs from ClaudioLunardi and Antonio Puccetti. Antonio Puccetti, PieraFilomena Fiore, Andrea Pelosi, Claudio Lunardi, and MarziaDolcino contributed equally to this paper.
Supplementary Materials
Supplementary 1. Supplementary Table 1: annotated genesdifferentially expressed in BD PBCs versus healthy controlsgrouped according to their function.
Supplementary 2. Supplementary Figure 1: PPI network ofmodulated genes in BD PBCs.
References
[1] International Team for the Revision of the InternationalCriteria for Behçet's Disease (ITR-ICBD), F. Davatchi,S. Assaad-Khalil et al., “The International Criteria for Behçet’sDisease (ICBD): a collaborative study of 27 countries on thesensitivity and specificity of the new criteria,” Journal of theEuropean Academy of Dermatology and Venereology, vol. 28,no. 3, pp. 338–347, 2014.
[2] E. Alpsoy, “Behçet’s disease: a comprehensive review with afocus on epidemiology, etiology and clinical features, andmanagement of mucocutaneous lesions,” The Journal of Der-matology, vol. 43, no. 6, pp. 620–632, 2016.
[3] L. T. Morton, D. Situnayake, and G. R. Wallace, “Genetics ofBehçet’s disease,” Current Opinion in Rheumatology, vol. 28,no. 1, pp. 39–44, 2016.
[4] N. Mizuki, A. Meguro, M. Ota et al., “Genome-wide associa-tion studies identify IL23R-IL12RB2 and IL10 as Behçet’sdisease susceptibility loci,” Nature Genetics, vol. 42, no. 8,pp. 703–706, 2010.
[5] E. F. Remmers, F. Cosan, Y. Kirino et al., “Genome-wideassociation study identifies variants in the MHC class I, IL10,and IL23R-IL12RB2 regions associated with Behçet’s disease,”Nature Genetics, vol. 42, no. 8, pp. 698–702, 2010.
[6] I. Fresko, “15th International Congress on Behçet’s Disease,”Clinical and Experimental Rheumatology, vol. 30, 3 Supple-ment 72, pp. S118–S128, 2012.
[7] M. Takeuchi, D. L. Kastner, and E. F. Remmers, “The immu-nogenetics of Behçet’s disease: a comprehensive review,” Jour-nal of Autoimmunity, vol. 64, pp. 137–148, 2015.
[8] M. Takeuchi, N. Mizuki, A. Meguro et al., “Dense genotypingof immune-related loci implicates host responses to microbialexposure in Behçet’s disease susceptibility,” Nature Genetics,vol. 49, no. 3, pp. 438–443, 2017.
[9] H. Direskeneli, H. Fujita, and C. A. Akdis, “Regulation of TH17and regulatory T cells in patients with Behçet disease,” TheJournal of Allergy and Clinical Immunology, vol. 128, no. 3,pp. 665-666, 2011.
[10] N. Sugi-Ikai, M. Nakazawa, S. Nakamura, S. Ohno, andM. Minami, “Increased frequencies of interleukin-2- andinterferon-gamma-producing T cells in patients with activeBehçet’s disease,” Investigative Ophthalmology & VisualScience, vol. 39, no. 6, pp. 996–1004, 1998.
15Journal of Immunology Research
[11] K. Hamzaoui, “Th17 cells in Behçet’s disease: a new immuno-regulatory axis,” Clinical and Experimental Rheumatology,vol. 29, 4 Supplement 67, pp. S71–S76, 2011.
[12] G. Geri, B. Terrier, M. Rosenzwajg et al., “Critical role of IL-21in modulating TH17 and regulatory T cells in Behçet disease,”The Journal of Allergy and Clinical Immunology, vol. 128, no. 3,pp. 655–664, 2011.
[13] S. Y. Na, M. J. Park, S. Park, and E. S. Lee, “Up-regulation ofTh17 and related cytokines in Behçet’s disease correspondingto disease activity,” Clinical and Experimental Rheumatology,vol. 31, 3 Supplement 77, pp. S32–S40, 2013.
[14] J. Kim, J. A. Park, E. Y. Lee, Y. J. Lee, Y. W. Song, and E. B. Lee,“Imbalance of Th17 to Th1 cells in Behçet’s disease,” Clinicaland Experimental Rheumatology, vol. 28, 4 Supplement 60,pp. S16–S19, 2010.
[15] M. C. Mat, A. Sevim, I. Fresko, and Y. Tuzun, “Behçet’s diseaseas a systemic disease,” Clinics in Dermatology, vol. 32, no. 3,pp. 435–442, 2014.
[16] H. Yazici and Y. Yazici, “Criteria for Behçet’s disease withreflections on all disease criteria,” Journal of Autoimmunity,vol. 48-49, pp. 104–107, 2014.
[17] F. Davatchi, C. Chams-Davatchi, H. Shams et al., “Behcet’sdisease: epidemiology, clinical manifestations, and diagnosis,”Expert Review of Clinical Immunology, vol. 13, no. 1, pp. 57–65, 2017.
[18] M. Dolcino, A. Ottria, A. Barbieri et al., “Gene expressionprofiling in peripheral blood cells and synovial membranesof patients with psoriatic arthritis,” PLoS One, vol. 10, no. 6,article e0128262, 2015.
[19] H. Mi and P. Thomas, “Panther pathway: an ontology-based pathway database coupled with data analysis tools,”Methods in Molecular Biology, vol. 563, pp. 123–140,2009.
[20] A. Franceschini, D. Szklarczyk, S. Frankild et al., “String v9.1:protein-protein interaction networks, with increased coverageand integration,” Nucleic Acids Research, vol. 41, no. D1,pp. D808–D815, 2013.
[21] L. J. Jensen, M. Kuhn, M. Stark et al., “STRING 8—a globalview on proteins and their functional interactions in 630organisms,” Nucleic Acids Research, vol. 37, Supplement 1,pp. D412–D416, 2009.
[22] G. D. Bader and C. W. Hogue, “An automated method forfinding molecular complexes in large protein interactionnetworks,” BMC Bioinformatics, vol. 4, no. 1, p. 2, 2003.
[23] L. Ronnblom and M. L. Eloranta, “The interferon signature inautoimmune diseases,” Current Opinion in Rheumatology,vol. 25, no. 2, pp. 248–253, 2013.
[24] R. A. Gordon, G. Grigoriev, A. Lee, G. D. Kalliolias, and L. B.Ivashkiv, “The interferon signature and STAT1 expression inrheumatoid arthritis synovial fluid macrophages are inducedby tumor necrosis factor α and counter-regulated by the syno-vial fluid microenvironment,”Arthritis & Rheumatism, vol. 64,no. 10, pp. 3119–3128, 2012.
[25] A. Nzeusseu Toukap, C. Galant, I. Theate et al., “Identificationof distinct gene expression profiles in the synovium of patientswith systemic lupus erythematosus,” Arthritis & Rheumatism,vol. 56, no. 5, pp. 1579–1588, 2007.
[26] R. M. Thurlings, M. Boumans, J. Tekstra et al., “Relationshipbetween the type I interferon signature and the response torituximab in rheumatoid arthritis patients,” Arthritis & Rheu-matism, vol. 62, no. 12, pp. 3607–3614, 2010.
[27] H. G. Raterman, S. Vosslamber, S. de Ridder et al., “The inter-feron type I signature towards prediction of non-response torituximab in rheumatoid arthritis patients,” Arthritis Research& Therapy, vol. 14, no. 2, p. R95, 2012.
[28] F. Moschella, G. F. Torelli, M. Valentini et al., “Cyclophospha-mide induces a type I interferon-associated sterile inflamma-tory response signature in cancer patients’ blood cells:implications for cancer chemoimmunotherapy,” Clinical Can-cer Research, vol. 19, no. 15, pp. 4249–4261, 2013.
[29] N. I. Maria, Z. Brkic, M.Waris et al., “MxA as a clinically appli-cable biomarker for identifying systemic interferon type I inprimary Sjögren’s syndrome,” Annals of the Rheumatic Dis-eases, vol. 73, no. 6, pp. 1052–1059, 2014.
[30] G. Caignard, M. Lucas-Hourani, K. P. Dhondt et al., “The Vprotein of Tioman virus is incapable of blocking type I inter-feron signaling in human cells,” PLoS One, vol. 8, no. 1, articlee53881, 2013.
[31] E. Gianchecchi and A. Fierabracci, “Gene/environment inter-actions in the pathogenesis of autoimmunity: new insights onthe role of Toll-like receptors,” Autoimmunity Reviews,vol. 14, no. 11, pp. 971–983, 2015.
[32] N. Seoudi, L. A. Bergmeier, E. Hagi-Pavli, D. Bibby, M. A. Cur-tis, and F. Fortune, “The role of TLR2 and 4 in Behçet’s diseasepathogenesis,” Innate Immunity, vol. 20, no. 4, pp. 412–422,2014.
[33] X. Liu, C. Wang, Z. Ye, A. Kijlstra, and P. Yang, “Higherexpression of Toll-like receptors 2, 3, 4, and 8 in ocular Beh-cet’s disease,” Investigative Ophthalmology & Visual Science,vol. 54, no. 9, pp. 6012–6017, 2013.
[34] J. Fang, L. Chen, J. Tang et al., “Association between copynumber variations of TLR7 and ocular Behçet’s disease in aChinese Han population,” Investigative Ophthalmology &Visual Science, vol. 56, no. 3, pp. 1517–1523, 2015.
[35] K. Hirahara, D. Schwartz, M. Gadina, Y. Kanno, and J. J.O'Shea, “Targeting cytokine signaling in autoimmunity: backto the future and beyond,” Current Opinion in Immunology,vol. 43, pp. 89–97, 2016.
[36] A. Tulunay, M. G. Dozmorov, F. Ture-Ozdemir et al., “Activa-tion of the JAK/STAT pathway in Behcet’s disease,” Genes &Immunity, vol. 16, no. 2, p. 176, 2015.
[37] S. P. K. Durmazlar, G. B. Ulkar, F. Eskioglu, S. Tatlican,A. Mert, and A. Akgul, “Significance of serum interleukin-8levels in patients with Behcet’s disease: high levels may indicatevascular involvement,” International Journal of Dermatology,vol. 48, no. 3, pp. 259–264, 2009.
[38] B. Turan, H. Gallati, H. Erdi, A. Gürler, B. A. Michel, and P. M.Villiger, “Systemic levels of the T cell regulatory cytokines IL-10 and IL-12 in Bechçet’s disease; soluble TNFR-75 as a bio-logical marker of disease activity,” The Journal of Rheumatol-ogy, vol. 24, no. 1, pp. 128–132, 1997.
[39] Y. Kato and T. Yamamoto, “Serum levels of GRO-α are ele-vated in association with disease activity in patients with Beh-çet’s disease,” International Journal of Dermatology, vol. 51,no. 3, pp. 286–289, 2012.
[40] H. T. E. Ozer, E. Erken, R. Gunesacar, and O. Kara, “SerumRANTES, MIP-1α, and MCP-1 levels in Behçet’s disease,”Rheumatology International, vol. 25, no. 6, pp. 487-488, 2005.
[41] K. Saglam, I. M. Yilmaz, A. Saglam, M. Ulgey, F. Bulucu, andY. Baykal, “Levels of circulating intercellular adhesionmolecule-1 in patients with Behçet’s disease,” RheumatologyInternational, vol. 21, no. 4, pp. 146–148, 2002.
16 Journal of Immunology Research

[42] N. Düzgün, E. Ayaşlioğlu, H. Tutkak, and O. T. Aydintuğ,“Cytokine inhibitors: soluble tumor necrosis factor recep-tor 1 and interleukin-1 receptor antagonist in Behçet’sdisease,” Rheumatology International, vol. 25, no. 1, pp. 1–5,2005.
[43] F. S. Neves and F. Spiller, “Possible mechanisms of neutrophilactivation in Behçet’s disease,” International Immunopharma-cology, vol. 17, no. 4, pp. 1206–1210, 2013.
[44] N. Maruotti, F. P. Cantatore, B. Nico, A. Vacca, and D. Ribatti,“Angiogenesis in vasculitides,” Clinical and ExperimentalRheumatology, vol. 26, no. 3, pp. 476–483, 2008.
[45] Y. Zhao and D. Bruemmer, “NR4A orphan nuclear receptors:transcriptional regulators of gene expression in metabolismand vascular biology,” Arteriosclerosis, Thrombosis, andVascular Biology, vol. 30, no. 8, pp. 1535–1541, 2010.
[46] A. V. Andreeva, M. A. Kutuzov, R. Vaiskunaite et al., “Gα12interaction with αSNAP induces VE-cadherin localization atendothelial junctions and regulates barrier function,” Journalof Biological Chemistry, vol. 280, no. 34, pp. 30376–30383,2005.
[47] T. Chen, Z. P. Guo, N. Cao, S. Qin, M. M. Li, and R. Z. Jia,“Increased serum levels of soluble vascular endothelial-cadherin in patients with systemic vasculitis,” RheumatologyInternational, vol. 34, no. 8, pp. 1139–1143, 2014.
[48] G. Saylam Kurtipek, R. Kesli, F. Tuncez Akyurek, F. Akyurek,A. Ataseven, and Y. Terzi, “Plasma-soluble urokinase plasmin-ogen activator receptor (suPAR) levels in Behçet’s disease andcorrelation with disease activity,” International Journal ofRheumatic Diseases, vol. 21, no. 4, pp. 866–870, 2018.
[49] F. Fazzini, G. Peri, A. Doni et al., “PTX3 in small-vessel vascu-litides: an independent indicator of disease activity producedat sites of inflammation,” Arthritis & Rheumatism, vol. 44,no. 12, pp. 2841–2850, 2001.
[50] P. Margutti, P. Matarrese, F. Conti et al., “Autoantibodies tothe C-terminal subunit of RLIP76 induce oxidative stress andendothelial cell apoptosis in immune-mediated vasculardiseases and atherosclerosis,” Blood, vol. 111, no. 9,pp. 4559–4570, 2008.
[51] K. Fujimori, K. Oh-i, M. Takeuchi et al., “Circulating neutro-phils in Behçet disease is resistant for apoptotic cell death inthe remission phase of uveitis,” Graefe's Archive for Clinicaland Experimental Ophthalmology, vol. 246, no. 2, pp. 285–290, 2008.
[52] P. Yang, L. Chen, H. Zhou et al., “Resistance of lympho-cytes to Fas-mediated apoptosis in Behçet’s disease andVogt-Koyangi-Harada syndrome,” Ocular Immunology andInflammation, vol. 10, no. 1, pp. 47–52, 2002.
[53] S. Wakisaka, Y. Takeba, S. Mihara et al., “Aberrant Fas ligandexpression in lymphocytes in patients with Behçet’s disease,”International Archives of Allergy and Immunology, vol. 129,no. 2, pp. 175–180, 2002.
[54] S. Morita, Y. Shirakata, A. Shiraishi et al., “Human cornealepithelial cell proliferation by epiregulin and its cross-induction by other EGF family members,” Molecular Vision,vol. 13, pp. 2119–2128, 2007.
[55] J. Guo, G. Thinakaran, Y. Guo, S. S. Sisodia, and F. X. Yu, “Arole for amyloid precursor-like protein 2 in corneal epithelialwound healing,” Investigative Ophthalmology & VisualScience, vol. 39, no. 2, pp. 292–300, 1998.
[56] N. Rother and J. van der Vlag, “Disturbed T cell signaling andaltered Th17 and regulatory T cell subsets in the pathogenesis
of systemic lupus erythematosus,” Frontiers in Immunology,vol. 6, p. 610, 2015.
[57] E. Lubberts, “The IL-23–IL-17 axis in inflammatory arthritis,”Nature Reviews Rheumatology, vol. 11, no. 10, p. 562, 2015.
[58] M. Diani, G. Altomare, and E. Reali, “T helper cell subsets inclinical manifestations of psoriasis,” Journal of ImmunologyResearch, vol. 2016, Article ID 7692024, 7 pages, 2016.
[59] M. von Holleben, A. Gohla, K. P. Janssen, B. M. Iritani, andS. Beer-Hammer, “Immunoinhibitory adapter protein Srchomology domain 3 lymphocyte protein 2 (SLy2) regulatesactin dynamics and B cell spreading,” The Journal of BiologicalChemistry, vol. 286, no. 15, pp. 13489–13501, 2011.
[60] Y. Usui, M. Takeuchi, N. Yamakawa et al., “Expression andfunction of inducible costimulator on peripheral blood CD4+
T cells in Behçet’s patients with uveitis: a new activitymarker?,” Investigative Ophthalmology & Visual Science,vol. 51, no. 10, pp. 5099–5104, 2010.
[61] M. Hamedi, L. A. Bergmeier, E. Hagi-Pavli, S. R. Vartoukian,and F. Fortune, “Differential expression of suppressor of cyto-kine signalling proteins in Behçet’s disease,” ScandinavianJournal of Immunology, vol. 80, no. 5, pp. 369–376, 2014.
[62] Y. B. Shang, et al.N. Zhai, J. P. Li et al., “Study on associationbetween polymorphism of HLA-DRB1 alleles and Behçet’sdisease,” Journal of the European Academy of Dermatologyand Venereology, vol. 23, no. 12, pp. 1419–1422, 2009.
[63] D. Saverino, R. Simone, M. Bagnasco, and G. Pesce, “Thesoluble CTLA-4 receptor and its role in autoimmune diseases:an update,” Autoimmunity Highlights, vol. 1, no. 2, pp. 73–81,2010.
[64] K. V. Salojin, B. D. Hamman, W. C. Chang et al., “Geneticdeletion of Mst1 alters T cell function and protects againstautoimmunity,” PLoS One, vol. 9, no. 5, article e98151, 2014.
[65] M. Pinto and A. M. Carmo, “CD6 as a therapeutic target inautoimmune diseases: successes and challenges,” BioDrugs,vol. 27, no. 3, pp. 191–202, 2013.
[66] Y. Liang, W. D. Xu, H. Peng, H. F. Pan, and D. Q. Ye, “SOCSsignaling in autoimmune diseases: molecular mechanismsand therapeutic implications,” European Journal of Immunol-ogy, vol. 44, no. 5, pp. 1265–1275, 2014.
[67] A. Ambrosi, A. Espinosa, and M. Wahren-Herlenius, “IL-17: anew actor in IFN-driven systemic autoimmune diseases,”European Journal of Immunology, vol. 42, no. 9, pp. 2274–2284, 2012.
[68] R. C. Axtell, B. A. de Jong, K. Boniface et al., “T helper type 1and 17 cells determine efficacy of interferon-β in multiple scle-rosis and experimental encephalomyelitis,” Nature Medicine,vol. 16, no. 4, pp. 406–412, 2010.
[69] Z. Brkic, O. B. Corneth, C. G. van Helden-Meeuwsen et al., “T-helper 17 cell cytokines and interferon type I: partners in crimein systemic lupus erythematosus?,” Arthritis Research & Ther-apy, vol. 16, no. 2, p. R62, 2014.
[70] J. J. O'Shea and R. Plenge, “JAK and STAT signaling moleculesin immunoregulation and immune-mediated disease,” Immu-nity, vol. 36, no. 4, pp. 542–550, 2012.
[71] D. H. Kono, R. Baccala, and A. N. Theofilopoulos, “TLRsand interferons: a central paradigm in autoimmunity,” Cur-rent Opinion in Immunology, vol. 25, no. 6, pp. 720–727,2013.
[72] Y. Liu, H. Yin, M. Zhao, and Q. Lu, “TLR2 and TLR4 in auto-immune diseases: a comprehensive review,” Clinical Reviewsin Allergy & Immunology, vol. 47, no. 2, pp. 136–147, 2014.
17Journal of Immunology Research
[73] S. Fineschi, L. Goffin, R. Rezzonico et al., “Antifibroblast anti-bodies in systemic sclerosis induce fibroblasts to produce pro-fibrotic chemokines, with partial exploitation of Toll-likereceptor 4,” Arthritis & Rheumatism, vol. 58, no. 12,pp. 3913–3923, 2008.
[74] S. K. Kwok, M. L. Cho, Y. M. Her et al., “TLR2 ligation inducesthe production of IL-23/IL-17 via IL-6, STAT3 and NF-κBpathway in patients with primary Sjogren’s syndrome,” Arthri-tis Research & Therapy, vol. 14, no. 2, p. R64, 2012.
[75] L. Li, H. Yu, Y. Jiang et al., “Genetic variations of NLR familygenes in Behcet’s disease,” Scientific Reports, vol. 6, no. 1,article 20098, 2016.
[76] A. del Sol, R. Balling, L. Hood, and D. Galas, “Diseases asnetwork perturbations,” Current Opinion in Biotechnology,vol. 21, no. 4, pp. 566–571, 2010.
[77] A. L. Barabasi, N. Gulbahce, and J. Loscalzo, “Networkmedicine: a network-based approach to human disease,”Nature Reviews Genetics, vol. 12, no. 1, pp. 56–68, 2011.
[78] A. Polo, A. Crispo, P. Cerino et al., “Environment and bladdercancer: molecular analysis by interaction networks,” Oncotar-get, vol. 8, no. 39, pp. 65240–65252, 2017.
18 Journal of Immunology Research

Stem Cells International
Hindawiwww.hindawi.com Volume 2018
Hindawiwww.hindawi.com Volume 2018
MEDIATORSINFLAMMATION
of
EndocrinologyInternational Journal of
Hindawiwww.hindawi.com Volume 2018
Hindawiwww.hindawi.com Volume 2018
Disease Markers
Hindawiwww.hindawi.com Volume 2018
BioMed Research International
OncologyJournal of
Hindawiwww.hindawi.com Volume 2013
Hindawiwww.hindawi.com Volume 2018
Oxidative Medicine and Cellular Longevity
Hindawiwww.hindawi.com Volume 2018
PPAR Research
Hindawi Publishing Corporation http://www.hindawi.com Volume 2013Hindawiwww.hindawi.com
The Scientific World Journal
Volume 2018
Immunology ResearchHindawiwww.hindawi.com Volume 2018
Journal of
ObesityJournal of
Hindawiwww.hindawi.com Volume 2018
Hindawiwww.hindawi.com Volume 2018
Computational and Mathematical Methods in Medicine
Hindawiwww.hindawi.com Volume 2018
Behavioural Neurology
OphthalmologyJournal of
Hindawiwww.hindawi.com Volume 2018
Diabetes ResearchJournal of
Hindawiwww.hindawi.com Volume 2018
Hindawiwww.hindawi.com Volume 2018
Research and TreatmentAIDS
Hindawiwww.hindawi.com Volume 2018
Gastroenterology Research and Practice
Hindawiwww.hindawi.com Volume 2018
Parkinson’s Disease
Evidence-Based Complementary andAlternative Medicine
Volume 2018Hindawiwww.hindawi.com
Submit your manuscripts atwww.hindawi.com