Gender Considerations in Decision-making in Rural Nigeria ...
Gender differentiated asset dynamics in Northern Nigeria Andrew Dillon and Esteban J. Quiñones
ESA Working Paper No. 11-06
March 2011
Agricultural Development Economics Division
The Food and Agriculture Organization of the United Nations
www.fao.org/economic/esa
1
Gender differentiated asset dynamics in Northern Nigeria1
November 2010
Andrew Dillon and Esteban J. Quiñones
International Food Policy Research Institute
[email protected] and [email protected]
Abstract: This paper examines gender differentiated asset dynamics over a 20 year period (1988-2008) in Northern Nigeria. The paper first examines the state of the literature on poverty dynamics, especially with respect to gender differences and agriculture. We then present new evidence to investigate whether there has been a catch-up effect for women in agricultural households who had initially low assets in 1988 and whether asset inequality within households is predicted by initial assets. The household survey conducted in Kaduna State, Nigeria tracked individuals from 200 households originally surveyed in 1988 to their households in 2008, a total of 576 additional households owing to splits. Household-level assets such as livestock holdings and household capital capture different dimensions of the household’s portfolio of wealth, including gender differentiated shares of assets such as livestock and household capital. The analysis finds that women’s assets grow more slowly than men’s assets over a long time horizon. The mechanism through which differential asset stocks grew over the twenty year period is related to the relative prices of the assets in the gender differentiated portfolio. Men, who primarily held livestock, benefited from large price increases in livestock. Women’s assets, which were primarily held as goods, both durables and jewellery, had much smaller price increases. The increased price of livestock may have been driven by the expansion of cultivated land in the villages, which increased demand for bullocks to plough. We find some suggestive evidence that these price fluctuations reinforced gender asset inequality within households for both types of assets considered.
Key words: gender, women, agriculture, asset accumulation, asset dynamics, livestock, Nigeria, household behaviour, panel data
JEL codes: Q12, O13, J16, D90
Acknowledgements: We are grateful to Practical Sampling International for assistance in collecting the 2008 data, especially Taofeeq Akinremi, Moses Shola and Tokbish Yohannah and the IFPRI-Nigeria office. Christopher Udry provided public access to the 1988 data. Sheu Salau provided excellent research assistance in the field and preparation of the data. The paper benefited from helpful comments and discussion with Agnes Quisumbing and John Hoddinott. We also acknowledge the helpful comments from participants at the SOFA writers’ workshop, Sept. 2009, Rome. All errors remain the responsibility of the authors.
1 The research presented in this background paper to The State of Food and Agriculture 2010-2011, “Women in agriculture: closing the gender gap in development” was funded by FAO with additional support for data collection from the International Food Policy Research Institute. The report is to be released on March 7 2011 and will be available at http://www.fao.org/publications/sofa/en/.
2
ESA Working Papers represent work in progress and are circulated for discussion and comment. Views and opinions expressed here are those of the authors, and do not represent official positions of the Food and Agriculture Organization of the United Nations (FAO). The designations employed and the presentation of material in this information product do not imply the expression of any opinion whatsoever on the part of FAO concerning the legal status of any country, territory, city or area or of its authorities, or concerning the delimitation of its frontiers or boundaries.
1
Introduction
Poverty dynamics reveal critical information regarding the transition paths that households
experience moving out of or slipping into poverty over a given time horizon. Much recent
attention in the poverty dynamics literature has focused on asset dynamics (see for example
Addison et al., 2009; Carter and Barrett, 2006, and; Baulch and Hoddinott, 2000). Carter and
Barrett (2006) provide a recent overview of the evolution of the poverty dynamics literature,
categorizing poverty measures in four generations: i) static income or expenditure poverty, ii)
dynamic income or expenditure poverty, iii) static asset poverty, and iv) dynamic asset
poverty. Assets are a particularly important indicator of household welfare as asset stocks
fluctuate less widely than consumption or income measures.2
Comprehending poverty dynamics is a critical component of understanding the relationship
between gender and agriculture. Gender differences in asset holdings potentially affect
women’s welfare, especially women in agricultural households, for two important reasons.
First, participation in agriculture is a defining feature of many poor households throughout the
world (Banerjee and Duflo, 2007). Understanding poverty dynamics in this sector is therefore
critical for improving welfare levels of all people in the sector including women. Second, we
know that women are particularly disadvantaged in agriculture because they have less access
to land (Meinzen-Dick et al., 1997 and Gregorio et al., 2008) and have less access to inputs
on their plots than men. This creates lower productivity on their plots relative to men because
In a recent review of the poverty
dynamics literature, Addison et al. (2009) identify several gaps in the literature including
longer time horizon analysis to investigate inter-generational poverty dynamics, especially
from a gender disaggregated perspective. However, few studies present results of gender
differentiated asset dynamics, with the notable exceptions of Antanopoulos and Floro (2005),
Deere and Doss (2006), and Quisumbing (2009a and 2009b), owing to the paucity of
longitudinal gender disaggregated asset data. This paper contributes to the literature by
investigating asset dynamics by gender over a 20 year period and applying new econometric
techniques that improve the quality of regression estimates by minimizing cluster correlated
regression errors, which can be problematic when dealing with a small number of clusters.
2 In addition, it should be noted that including assets into welfare measurement incorporates the vital dimension of production because income and consumption flows are typically generated by asset stocks (Addison et al., 2009).
2
of this inefficient input allocation within their households (Udry, 1996 and Duflo and Udry,
2004).
In this paper, we take a multi-dimensional approach to illustrate how asset stocks of
agricultural households have changed over time and been divided inter-generationally over a
20 year period in four villages in Northern Nigeria. Our two primary questions examine: a)
‘What role do initial household endowments have on men’s and women’s future asset stocks
in terms of both levels of assets held and differences in the growth rate of assets?’, and; b)
‘What role do initial household endowments have on men’s and women’s future
intrahousehold inequality?’.
A collection of studies investigating initial asset endowments in Sub-Saharan Africa
demonstrates how initial endowment levels are essential to generating higher returns and
improved welfare over time (see Peters, 2006; Barrett et al., 2001; Adato et al., 2006; Barrett
et al., 2006a; Barrett et al., 2006b; Whitehead, 2006, and; Little et al., 2006). In addition,
existing evidence illustrates the presence of intrahousehold inequalities and their problematic
nature in rural, agricultural contexts (see Thomas, 1997; Hoddinott and Haddad, 1995;
Quisumbing and de la Brière, 2000; Dey Abbas, 1981 and 1997’; Udry, 1996, and; Akresh,
2005, amongst others). However, studies that address the long-run role of initial endowments
on asset stocks for men and women separately, instead of the aggregate household, are scarce.
We find that women’s assets grow more slowly compared with men’s assets over a long time
horizon. The mechanism through which asset stocks grew over the twenty year period is
related to the relative prices of the assets in gender differentiated portfolios. Men who
primarily held livestock saw large price increases in the value of their assets, and also held
assets that biologically multiply (such as livestock). Women’s assets on the other hand were
primarily held as goods, both durables and jewellery, whose value increased marginally. The
price of livestock may have been driven by expansion of arable land in the villages and the
intensification of agriculture, which in turn increased demand for bullocks to plough. This
reinforces gender asset inequality within households for both types of assets considered, as
recent studies, such as Quisumbing and Baulch (2009) among others, show. Our findings
differ from Quisumbing and Baulch (2009) with respect to the mechanism through which
gender-differentiated asset inequality is perpetuated. The authors identify access to well-
functioning labour and capital markets as critical mechanisms for explaining long run asset
accumulation, particularly for non-land asset growth. In contrast, our hypothesis is that
3
changes in the relative returns to asset prices, especially livestock prices, may lead to
differential returns to men’s and women’s assets.3
In addition to our findings on gender differentiated asset dynamics, the paper carefully
considers the problem of within group correlation which may bias the standard errors of our
estimates, especially with small numbers of clusters. The issue of small numbers of clusters in
panel surveys is not uncommon. In our review of panel data sets that followed households
over at least a 10 year period, we find that sample sizes range from 51 and 55 households in
Moser and Felton (2009) and Lybbert et al. (2004), respectively, to 1 477 households in the
Ethiopian Rural Household Survey.
4
In the second section of this paper, we review the studies that use panel data to understand the
stylized facts about asset dynamics drawing on the review pieces by both Addison et al.
(2009), Carter and Barrett (2006) and Baulch and Hoddinott (2000). We then briefly review
the few studies that investigate poverty dynamics with emphasis on gender differences over
longer time horizons. In the third section, we outline the econometric strategy that we employ
to answer the two central questions of this study. The fourth section describes the data
collected by the authors to create a 20 year panel survey from households in Northern Nigeria.
We discuss the tracking process whereby we traced individuals from households surveyed in
1988 to their current households in 2008 within the original survey villages. The fifth section
describes the descriptive statistics and key variables used in the analysis. The sixth section
presents our empirical results and the last section concludes.
Following Cameron et al. (2008), we correct for
potential biases in standard errors by employing the wild bootstrap, which has been shown to
perform well with small numbers of clusters, to test whether our key parameter estimates are
significantly different than zero.
3 Quisumbing and Baulch (2009) also suggest that the exclusion of women in labour markets and other market activities creates gender specific livelihood pathways, which can reinforce gender non-land household asset imbalances. 4 In ascending order, we find a heterogeneous distribution of panel sample sizes of at least 10 years from around the globe. Examples of smaller sample sizes include 51 households collected over a 26 year period (Moser and Felton, 2009), 55 households over 17 years (Lybbert et al., 2004), 89 households over 13 years (Barrett et al., 2006), and 155 households over 18 years (Scott, 2000). This is followed by a sample size of 257 households collected over an 18 year period (Quisumbing and McNiven, 2007), 360 households over 17 years (Hoddinott, 2006), and 400 households over 15 years (Gunning et al., 2000). The sample size of the panel data used for this study, 576 households collected over a 20 year period, is next, followed by 713 households over 13 years (Beegle et al., 2006), and 957 households over 20 years (Quisumbing, 2009). Lastly, the largest panel data set identified in our review consists of 1,477 households collected over a 10 year period (Dercon et al., 2009).
4
Poverty Dynamics: literature review
Several papers have recently reviewed the poverty dynamics literature including Addison et
al. (2009), Carter and Barrett (2006) and Baulch and Hoddinott (2000). This review outlines
papers in this literature that are of particular importance to understanding linkages between
poverty dynamics, gender and agriculture. Baulch and Hoddinott (2000), in their review of 14
poverty assessments using panel data, provide a valuable study of poverty measures that
incorporate the dimension of time. The authors demonstrate that transitory poverty is often the
largest share of poor households at a given time period. In particular, they disaggregate
poverty status into three categories – “always”, “sometimes” and “never” – to show that using
conventional poverty indicators with only one observed cross-section provides a false sense of
reality in terms of poverty, especially with respect to poverty persistence and mobility. This is
confirmed by Foster (2009) and Calvo and Dercon (2009) who introduce the element of time
into conventional measures (using panel data) and find considerably different estimates of
poverty in Argentina and Ethiopia, respectively. As such, it is worth reiterating “…that if
policy continues as it has to date, treating the chronic poor as being like the transient poor but
a little bit ‘further behind’, that hundreds of millions of people are likely to stay poor and
many of those yet to be born will spend their lives in poverty” (p. 401, Hulme, 2003).
Perhaps one of the most important facets of incorporating time into poverty assessments is
that it enables the analysis of inter-generational transmission of poverty. For instance, using
panel data, Günther and Klasen (2009) demonstrate that although income poverty has fallen
considerably in Vietnam, young people in households with low education among older
members often end up having low education themselves. Similarly, using panel data,
Quisumbing (2009) illustrates that inter-generational asset transfers, particularly human and
physical capital, can create or stifle pathways out of poverty in the Philippines.
Inter-generational poverty transmission is influenced both by the overall trajectory of a
household’s welfare, which is related to its endowment accumulation; the returns to it and the
incidence of major internal (household) or external (shock) events. A number of studies
showed that key internal events, such as illness, malnutrition or high funeral expenses, at
critical times in the life cycle, especially during early life, can have irreversible effects on
individual capabilities and long term effects on poverty and wages (see Loury, 1981; Strauss
and Thomas, 1998; Alderman et al., 2006, and; Hoddinott et al., 2008). The use of panel data,
5
as shown by Krishna (2009), provides a more nuanced evaluation of poverty because it
accounts for the impacts of predictable lifecycle events and the sustained effects of major
external events, such as droughts. Moreover, being able to identify the determinants of inter-
generational poverty transmission provides policy makers with crucial information for
designing effective poverty reduction interventions.
Returns to household endowments are also powerful determinants of welfare. Barrett et al.
(2006a) point out that households who can take advantage of opportunities, generally those
who are better off and well positioned, experience higher returns. In Malawi, Peters (2006)
demonstrates that the liberalization of tobacco production primarily benefited farmers who
were better positioned in the beginning in terms of land, labour and credit. Increased
endowments helped this subset of the population join growers’ clubs and access preferable
world prices. In Cote d’Ivoire, Barrett et al. (2001) show that the ability of households to take
advantage of non-farm and emerging opportunities, especially those facilitated by
macroeconomic policy adjustments, is predicated by ex-ante conditions. In particular, the
authors show that households with greater initial skills and land endowments benefit
disproportionately compared with their poorer counterparts. In South Africa Adato et al.,
(2006) find that privileged households were best able to capitalize on the economic
opportunities resulting from the end of apartheid. They also show that wealthier households
are more effective in using social capital to take advantage of improved production
technologies and higher return livelihoods; for poorer households, social capital is insufficient
to overcome a lack of productive asset holdings.
Moreover, Barrett et al. (2006b) illustrate that wealthier households in Madagascar were
better able to adopt enhanced production technology, considerably boosting crop yields.
Disadvantaged households, on the other hand, were effectively prevented from taking up such
technology owing to their relative lack of credit, insurance and labour. In addition, Whitehead
(2006), in a study on Ghanaian agriculture, demonstrates that farmers with greater initial
stocks of land, livestock and male labour are able to take advantage of new high-value crops
and improved ploughing technology. Those with lower endowments produced lower yields
and accessed inferior terms of trade, compared with their wealthier counterparts, leading to
less wealth accumulation. Further, Little et al. (2006) find that pre-drought livestock
ownership in Ethiopia leads to more rapid post-shock recovery and improved wealth. This is
consistent with the results for Kenya presented by Barrett et al., (2006b). As such, it becomes
6
clear that initial endowment levels are strong predictors of improved welfare over time across
a wide variety of circumstances.
In addition to increasing the likelihood of adopting agricultural technology and increasing
welfare after shocks occur, a number of studies suggest that returns to endowments may play
an integral role in defining asset accumulation (Baulch and Hoddinnott, 2000; Gunning et al.,
2000; Maluccio et al., 2000; Glewwe and Hall, 1998, and; Lanjouw and Stern, 1993).
Gunning et al., (2000) and Maluccio et al., (2000) specifically show how large exogenous
events, such as resettlement of households in Zimbabwe or the abolition of apartheid in South
Africa, can have more significant effects on returns than small, continuous improvements in
asset stocks. More importantly, it is clear that poverty measures derived from panel data,
which allow for the consideration of initial endowments, asset accumulation and varying
returns to endowments, provide an enhanced, more nuanced understanding of poverty.
Given the benefits of relying on assets to measure welfare and changes in poverty, a number
of studies have emerged that focus on long-run asset dynamics. Carter and Barrett (2006)
suggest locally increasing returns at the microeconomic level, due to returns to scale, sunk
costs to productivity and risk rationing, indicating a positive relationship between asset levels
and marginal returns to assets. Considering this, and using panel data to incorporate the
dimension of time, Quisumbing (2009) shows that inter-generationally transferred assets
increase current consumption and asset levels (though they do not always prevent against
chronic poverty). The positive inter-generational relationship is consistent with findings from
Behrman and Taubman (1985 and 1990) showing that in the United States parents’ income is
positively associated with children’s future earnings.
Yet despite the fact that women generally have lower asset endowments, it has been
illustrated that increasing women’s resources has uniquely beneficial effects on household
outcomes (Deere and Doss, 2006). Thomas (1997), using data from Brazil, shows that women
spend considerably more on education, health and household services, which leads to higher
per capita calorie intake and income, compared with their male counterparts. Interestingly,
this large dichotomy in gender income effects is reduced when only considering households
in which both mother and father participate in the labour market. These findings correspond
closely with those from Hoddinott and Haddad (1995) in Côte d’Ivoire and Quisumbing and
de la Brière (2000) in Bangladesh.
7
With respect to agriculture, differences in bargaining power within households affect
productive resource allocation, especially levels of input use and productivity on male and
female plots. Dey Abbas (1997) highlights the role that gender asymmetries play in
diminishing female productivity, particularly in limiting their ability to adopt productivity-
enhancing technologies (also see Guyer, 1981 and 1986; Sen, 1985; Roberts, 1988 and 1991, and;
Whitehead, 1990, amongst others). Dey Abbas draws attention to a program in The Gambia
focused on boosting agricultural productivity via the introduction of advanced technology. In the
process of trying to boost agricultural productivity, the project also motivated men to take
advantage of women’s relatively weaker land rights in order to shift control of unexpectedly
promising land and crops to their own control.
By ignoring gender asymmetries in the intrahousehold resource allocation process,
particularly those related to agricultural production, the intervention actually weakened the
bargaining position (and welfare) of women in the household. This unintended, negative
consequence on women’s rights and welfare, which was exacerbated by the pre-existing
bargaining parameters as well as a combination of agricultural productivity and gender
asymmetries, has also been observed elsewhere. For instance, studies in Cameroon (Jones,
1986), Kenya (Hanger and Morris, 1973; Bevan et al., 1989), The Gambia (Dey Abbas,
1981), and Burkina Faso (McMillan, 1987) demonstrate how asymmetrical intrahousehold
resource allocation mechanisms, coupled with agricultural productivity and gender
imbalances, have led to tepid adoption of productivity enhancing technologies or higher value
crops and, subsequently, lower agricultural output for women.
Although there is a lack of recent empirical evidence analyzing gender differences in the use
of production inputs, tools, and equipment, a recent review of the literature by Peterman et al.,
(2010a) indicates that 19 of 24 relevant studies do identify that men have higher mean access
to specific agricultural resources than women, although the impact of this disparity on output
and productivity varies. For instance, in Malawi, Gilbert, Sakala, and Benson (2002) show
that asymmetric fertilizer use by gender does exist and explain that this is because women
have less access to it. In the case of Uganda, Nkedi-Kizza et al., (2002) demonstrate that there
is no difference in soil fertility across male and female owned plots, but do find that lower
yields for female-owned plots are likely due to a lack of fertilizer, extension, and so forth.
Moreover, in Zimbabwe, Horrel and Krishnan (2007) show that the difference in agricultural
productivity can be significantly explained by the differences in farm machinery use by
gender.
8
In Benin, Kinkingninhoun-Mêdagbé et al., (2008) also find significant gender differences in
pesticide use in a small study of rice farmers and largely attribute these to gender
discrimination. Furthermore, in Malawi, Uttaro (2002) show that one of the reasons why
women have less access to agricultural resources, like fertilizer and seeds, is due to the
unfavourable prices that are available to them. In the case of Zimbabwe, Horrell and Krishnan
(2007) indicate that women receive lower prices and have less access to desirable selling
consortiums. For example, in Nigeria Sanginga et al., (2007) find that females farmers are
less likely to plant improved soybean seeds partially because male farmers have superior
access to market opportunities and therefore have more money to spend on hiring labor.
In Botswana, Oladele and Monkhei (2008) suggest that this dichotomy is also an issue with
livestock when they find that men are significantly more likely to own cattle, donkeys, and
horses, as opposed to women who are significantly more likely to own goats that are less
valuable for powering plows and producing manure fertilizer. Similarly, in Ethiopia, Pender
and Gebremedhin (2006) show a negative association between the use of oxen and female
household heads and that when factors like labor and oxen use are held constant crop yields
for female headed households are 42 percent lower than for male headed households. Lastly,
Peterman et al., (2010b) note that gender differences in quantity and quality of agricultural
inputs, cultural norms, as well as prices of inputs and credit, are defining factors for
agricultural production differences between men and women.
In summary, the literature makes it apparent that analysis of long term asset dynamics is
essential for understanding household welfare. Moreover, it is evident that at the household
level, as is typical in poverty analysis, is insufficient for appropriate programme design given
intrahousehold inequalities. Furthermore, these studies suggest that an important gap exists in
the literature in terms of understanding long-run gender disaggregated asset dynamics,
especially in agricultural households. In order to bridge this gap, we estimate the effects of
household endowments on future asset holdings by gender over a time horizon of 20 years.
The next section delineates our econometric strategy to achieve this objective.
Econometric Strategy
The econometric strategy to identify the effects of initial household endowments on future
gender differentiated asset levels draws on the poverty dynamics literature in which lagged
9
assets, households and village characteristics determine future asset stocks, subject to
stochastic shocks over time. In our analysis, we consider two types of assets: the value of
household capital and livestock holdings. We use household assets in 1988 as our measure of
initial endowments and estimate the impact of these initial endowments on future gender
disaggregated asset stocks in 2008; controlling for household characteristics including
household composition, age of the household head, education level of head of household,
initial landholdings and village indicators to capture variation in village characteristics.
Equation 1 specifies the econometric relationship to be estimated in levels of assets, while
Equation 2 specifies the relationship in natural logs.
(1) thvhhgh XAssetsAssets ,,1988,1988,2008,, ln εβα ++=
(2) , ,2008 ,1988 ,1988 , ,ln ln lnh g h h v h tAssets Assets Xα β ε= + +
The asset variables are specified for each household h, by gender g in the specified year. For
both these equations, we are primarily concerned with the sign of α. If α > 1 in equation 1,
then this implies positive asset accumulation over time, whereas in equation 2 if α > 0, then
gender differentiated asset growth out of initial assets is positive. We also control in these
regressions for a set of household level covariates, X, which include the household head’s age
and education; household composition including the number of men, women and dependents;
and land holdings. The error term is composed of unobservable variation in villages (v) and
households (h) over time (t). To control for village level unobservables, we include village
indicators in the regression.
In equations 1 and 2, we first estimate each of these equations by gender. Then we restrict the
data to a subsample of “original” households to estimate whether these longer-established
households have different asset dynamics than the pooled set of both original and split
households. We define an original household as a household who was originally interviewed
in 1988 and that resides in the same location with at least one of the following members who
was previously interviewed: the household head, the household head’s spouse or the oldest
adult male of the household head. We define split households as households that split from
the originally interviewed household and that consist of at least one person who was previously
included in an original household, but who no longer resides in the original household; having
formed a new household. We discuss attrition and the distribution of original and split households
in the next section.
10
The second set of equations that we estimate investigates intrahousehold inequality of assets.
Using the share of women’s assets relative to men’s, we again estimate the effect of
household assets in 1988 on gender differentiated asset shares in 2008, controlling for initial
household characteristics. Equation 3 specifies the relationship in natural logs.
(3) thvhhgh XAssetsAssetshare ,,1988,1988,2008,, lnln εβα ++=
The interpretation of α is similar to that of equation 1 and 2 with the significant difference that
α now represents the elasticity of female asset shares in 2008 with respect to initial assets in
1988. We control for the same set of covariates X as in equations 1 and 2, as well as include
village indicators to control for village level unobservables.
A key econometric issue that we address in all regression specifications is the correction of
the standard errors for within-group dependence. Heteroskedastic-robust standard errors are
commonly calculated following White (1980). However, a large literature illustrates that
cluster robust standard errors might be downward biased, if the number of clusters in the
sample is small (Moulton, 1986 and 1990; Angrist and Lavy, 2002; Bertrand et al. 2004, and;
Donald and Lang, 2007). This is because inference is based on the asymptotic assumption that
the number of clusters tends to infinity. Cameron et al. (2008) illustrate that wild bootstrap
methods perform particularly well in estimating standard estimates with small numbers of
clusters5
vv uu ˆˆ =∗
. Following their approach, we first estimate in the original sample the standard
errors, coefficient estimates and residuals imposing the null hypothesis. We then resample
with replacement from the original sample residual vectors, with probability 0.5 and
vv uu ˆˆ −=∗ with probability 0.5, to construct a pseudo-sample of { }),ˆ(),...,,ˆ( 11 vv XyXy ∗∗ where
the subscript V is the number of village clusters and ∗∗ +′= vvv uXy ˆˆˆ β . Wald statistics are then
estimated for the unrestricted, original sample and the pseudo-sample with the null hypothesis
imposed. In our analysis, we calculate the wild bootstrap standard errors and present the p
value of the hypothesis test that the coefficient is statistically different from zero using the
wild bootstrapped standard errors. This test provides additional econometric evidence that the
results are econometrically meaningful despite the small number of clusters in the sample.
5 The wild bootstrap was developed by Wu (1986), Liu (1988) and Mammen (1993).
11
Data Description
In 1988, a small scale household survey was undertaken with 200 households in four rural
villages near the town of Zaria, Kaduna State6
After the tracking exercise was completed, the survey design was undertaken and field work
was scheduled to commence in November 2008, which corresponded closely to Round 7 of
the original field work in 1988
. The data produced a rich set of information
over the survey period on informal transactions, household welfare, and production activities,
among other topics. In May 2008, a tracking survey was undertaken by the authors to
determine whether it would be possible 20 years later to follow-up with some of the
individuals that were originally surveyed. In combination with the many qualitative
interviews that we held with village leaders and residents during the tracking survey, detailed
information on the individuals from households previously surveyed in 1988-89 was collected
to identify previously surveyed households and households that had divided to establish new
households over the 20 year period. Roster data from the 1988 survey were used to confirm
members of the household, ages and relationships between household members. Many of the
survey respondents in 1988 remained in the village after marriage and formed new
households. This is especially true for brothers who divided family assets after they were
married. For the purposes of the tracking, one brother, usually the eldest, was classified as
remaining resident in the household, while younger siblings formed their own households, if
they remained in the village. Of the original households that could potentially be tracked, at
least one member was resident in 169 households, or 84.5 percent over the 20 years. Village
leaders and residents were willing participants in the tracking exercise. Many former
respondents had kept certificates of appreciation or photographs from the previous survey
team.
7
6 This work was led by Christopher Udry who was hosted by Amadou Bello University in Zaria.
. In addition to following closely the ordering, sequencing and
phrasing of questions from the original survey, the field work was organized to replicate as
closely as possible the careful interviewing strategy described in Udry (1990) whereby male
enumerators interviewed the male head and female enumerators interviewed the female head
in the household. An intensive field testing and enumerator training was conducted to assure
uniform implementation of the questionnaire in the field. Households were re-interviewed if
there was at least one individual from the original survey in a household. In total, 169
7 The 1988 data is drawn from a nine round survey conducted over a one year period.
12
households of the 200 original households were tracked from the data set in 1988, and 407
household that split from these original households were tracked within the survey villages.
Therefore, there are 576 households in the 2008 re-survey.
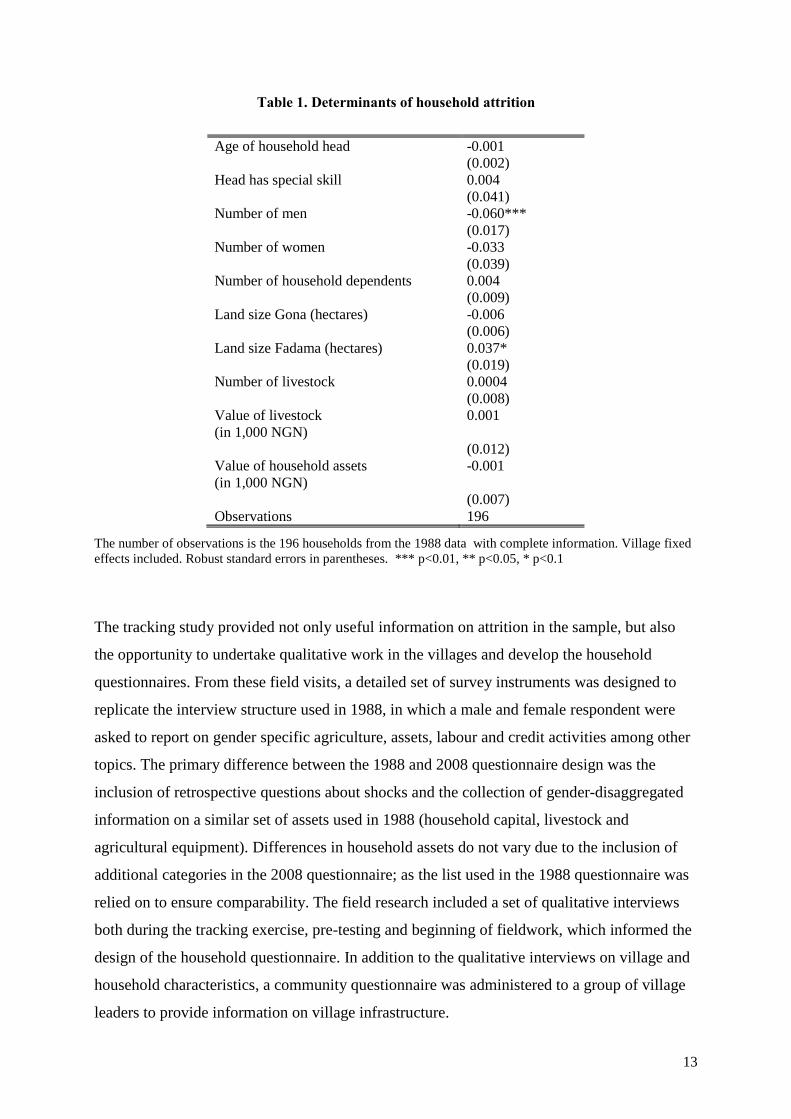
Table 1 presents evidence regarding the factors of attrition in the data set. Of the original
households, 84.5 percent were found and re-surveyed in the follow-up 2008 survey. The
attrition rate in the sample is within the bounds of attrition found in other panel surveys
reviewed by Alderman et al., (2001). In analysing the factors that could predict attrition from
the household’s 1988 characteristics, we find few significant variables that predict attrition.
Common sources of selection bias in other studies include wealth or household
demographics8, which may downwardly bias estimates. We include in the attrition regression
explanatory variables including the age of the household head, the household head’s
occupation, household composition, land size among types of land (gona and fadama land9
8 Education levels are very low in this sample, so concerns about higher attrition rates among educated households are not relevant for this sample. We do include a variable that measures whether any household member has special skills that may be rewarded differentially in the labour market. In the estimates in Table 1, we find no effect of special skills on attrition.
),
number of livestock, value of livestock, and household assets. Among these variables, there is
a negative correlation with the number of men in the household and attrition, while there is a
positive correlation with the amount of fadama land owned in 1988 and attrition. While the
positive correlation between fadama land and attrition may mean that wealthier households
were more likely to attrite, none of the other asset variables (livestock, assets, gona land)
confirm this hypothesis.
9 Gona land is highland and is generally considered less valuable than fadama land, which is defined as a lowland area that retains water throughout a longer period of the planting and growing season.
13
Table 1. Determinants of household attrition
Age of household head -0.001 (0.002) Head has special skill 0.004 (0.041) Number of men -0.060*** (0.017) Number of women -0.033 (0.039) Number of household dependents 0.004 (0.009) Land size Gona (hectares) -0.006 (0.006) Land size Fadama (hectares) 0.037* (0.019) Number of livestock 0.0004 (0.008) Value of livestock (in 1,000 NGN)
0.001
(0.012) Value of household assets (in 1,000 NGN)
-0.001
(0.007) Observations 196
The number of observations is the 196 households from the 1988 data with complete information. Village fixed effects included. Robust standard errors in parentheses. *** p<0.01, ** p<0.05, * p<0.1
The tracking study provided not only useful information on attrition in the sample, but also
the opportunity to undertake qualitative work in the villages and develop the household
questionnaires. From these field visits, a detailed set of survey instruments was designed to
replicate the interview structure used in 1988, in which a male and female respondent were
asked to report on gender specific agriculture, assets, labour and credit activities among other
topics. The primary difference between the 1988 and 2008 questionnaire design was the
inclusion of retrospective questions about shocks and the collection of gender-disaggregated
information on a similar set of assets used in 1988 (household capital, livestock and
agricultural equipment). Differences in household assets do not vary due to the inclusion of
additional categories in the 2008 questionnaire; as the list used in the 1988 questionnaire was
relied on to ensure comparability. The field research included a set of qualitative interviews
both during the tracking exercise, pre-testing and beginning of fieldwork, which informed the
design of the household questionnaire. In addition to the qualitative interviews on village and
household characteristics, a community questionnaire was administered to a group of village
leaders to provide information on village infrastructure.
14
Udry (1990) provides his detailed observations on the survey villages compared with other
anthropological work that had been conducted in the area by David Norman and co-authors
(1972 and 1976). The predominant crops (maize, guinea corn and rice) cultivated by these
rural, agricultural households remained similar to those cultivated in 1988, with the exception
of tobacco, sorghum and cotton which are rarely grown in the villages. The timing of planting
and harvest seasons in the villages has also remained invariant over time. Dry season farming
is still prevalent in the survey villages and irrigation on household plots greatly expanded.
Electricity is now found in three of the four villages through the use of motorized generators
and electric lines, but well water is still the primary source of drinking water in three of the
villages with the fourth having access to a hand pump. Households reported, as in 1988, that
savings in the form of livestock, agricultural equipment and grains were their primary means
of storing wealth, although village leaders also reported a higher prevalence of mutual savings
or adashi groups in three of the four survey villages, as well as increased use of savings
accounts in commercial banks.
Descriptive Statistics
Following much of the literature on poverty dynamics, we take a multidimensional approach
to measuring asset dynamics as assets may differ with respect to liquidity and productive use.
We define livestock and household capital in a count index for household capital and in
Tropical Livestock Units (TLU) for livestock, as well as the value of these holdings. The
items listed in the livestock TLU index are identical to the 1988 survey data. The household
list of durables only differs by a few items that did not exist as a household durable in 1988
households such as DVD and videos, but that are a distinguishing feature of increased
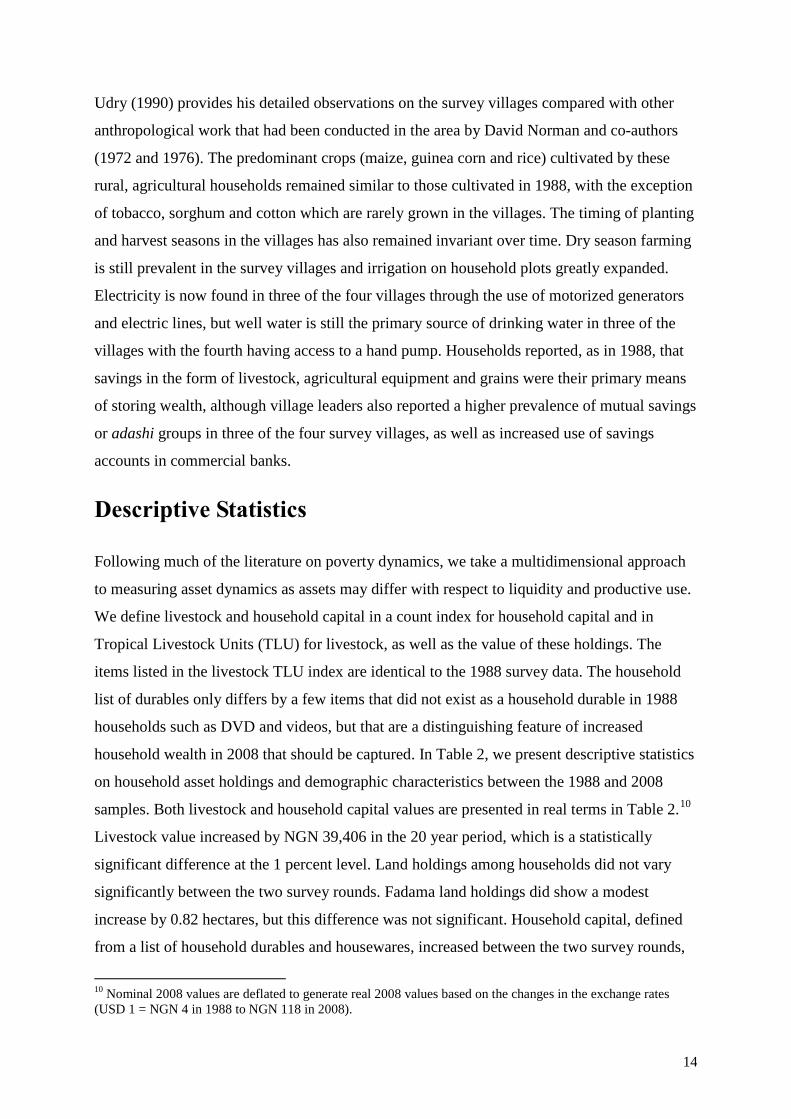
household wealth in 2008 that should be captured. In Table 2, we present descriptive statistics
on household asset holdings and demographic characteristics between the 1988 and 2008
samples. Both livestock and household capital values are presented in real terms in Table 2.10
10 Nominal 2008 values are deflated to generate real 2008 values based on the changes in the exchange rates (USD 1 = NGN 4 in 1988 to NGN 118 in 2008).
Livestock value increased by NGN 39,406 in the 20 year period, which is a statistically
significant difference at the 1 percent level. Land holdings among households did not vary
significantly between the two survey rounds. Fadama land holdings did show a modest
increase by 0.82 hectares, but this difference was not significant. Household capital, defined
from a list of household durables and housewares, increased between the two survey rounds,
15
increasing by 1,975 real NGN which was also statistically significant. Household
demographic characteristics, including the age of the household head and the number of wives
in the household, did not differ among the two survey rounds, assuaging concerns that the
sample may be biased by the aging of the full sample. However, the number of men included
in the household decreased between 1988 and 2008 by 0.58 persons, while the number of
dependents increased in the sample households by 1.87 dependents.
Table 2. Differences in household assets and demographics in 1988 and 2008
Variable 1988 Mean 2008 Mean Difference in means
Livestock value 1,960 41,365 39,406***
Household capital value 1,113 3,088 1,975***
Gona land size 3.17 3.18 0.01
Fadama land size 0.44 1.26 0.82
Household head age 39.83 40.55 0.72
Household head primary school attendance
0.14 0.44 0.31***
Number of household wives 1.49 1.54 0.06
Number of household men 2.48 1.90 -0.58***
Number of household dependents 3.60 5.47 1.87***
Observations 200 576
Statistitical significance between means is indicated by the following: *** p<0.01, ** p<0.05, * p<0.1. Nominal 2008 values are deflated to generate real 2008 values based on the changes in exchange rates (USD 1 = NGN 4 in 1988 to NGN 118 in 2008).
From both our qualitative work and the survey data, there appears to be an expansion of land
(on the aggregate level) in these four villages, which may be related to the population
pressures experienced resulting from growth over time. Although the change in average
household land size varies across the four villages, the increase in total land cultivated is
consistent across villages in 2008 on a scale of two to four times values from 1988 among
those who own land. It should also be pointed out that while essentially 100 percent of
households reported land ownership in 1988, this percentage is closer to 60 percent in 2008.
The increase in reported landlessness in 2008, which is distributed across all four villages,
likely reflects not only land constraints related to population growth, but also a shift from
agricultural to non-farm activities for some households. It also represents a shift to more
16
intensive cultivation techniques as the amount of irrigated land in the villages has increased.
Statistically significant differences are not observed in key household characteristics, such as
head age, size, number of wives, education and so forth, when comparing the landless with
landed groups in 2008.
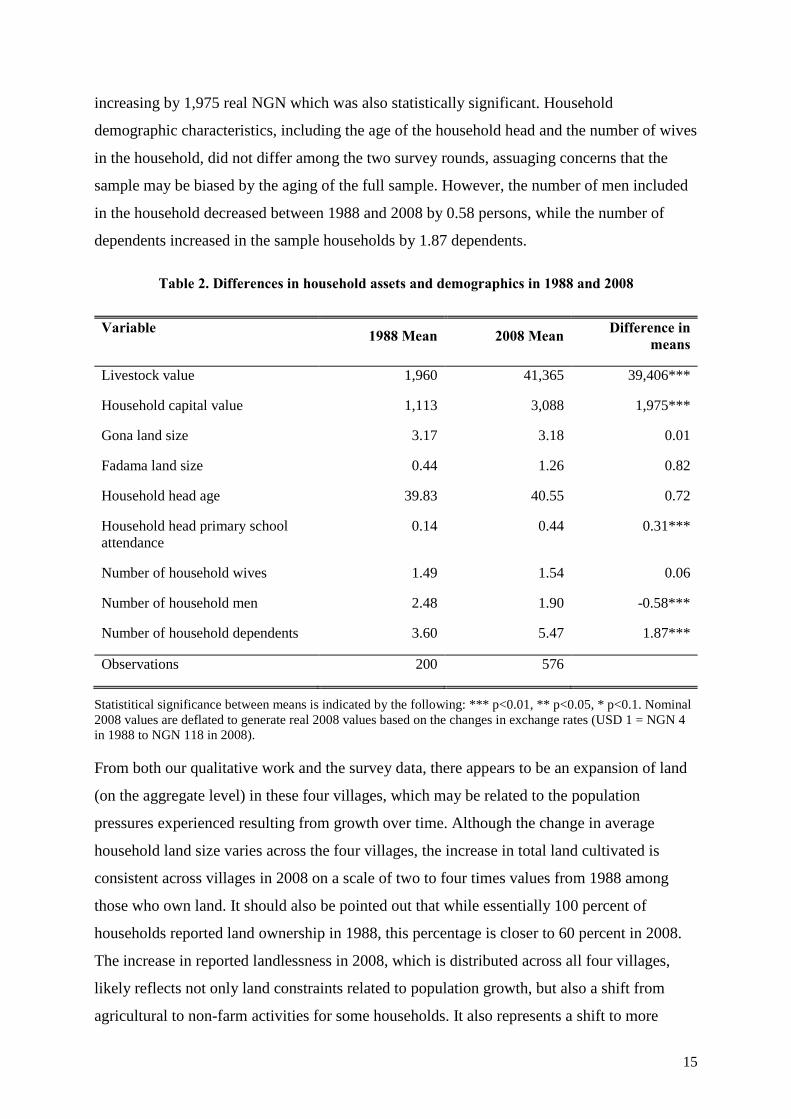
There has been considerable change in both livestock and household capital over time, but
more so for livestock. In Table 3, we present livestock holdings and value over time,
disaggregated by gender in 2008. From 1988, the index of livestock holdings in TLU has
grown noticeably for both men and women, indicating a sizeable increase across the two
groups. In terms of livestock values, substantial growth is, once again, present for both men
and women over the two decades. That being said, the value of men’s livestock holdings is
estimated to be roughly over 200 percent than that of women in 2008. The increase in both the
number of livestock and especially the value of livestock appear to have disproportionately
favoured the asset accumulation of men. This is because women who own livestock tend to
own smaller animals such as poultry whereas men own larger draft animals.
Table 3. Livestock holdings and value in 1988 and 2008
1988 Household Assets
Male Assets in 2008 Households
Female Assets in 2008 Households
Mean Std. Dev Mean Std Dev Mean Std Dev.
Livestock Index (in TLU)
2.7 5.08 7.79 18.96 6.07 9.82
Livestock Value (in NGN)
1,960 4,005 27,889 56,849 13,476 30,130
Observations 169 576 576
Nominal 2008 values are deflated to generate real 2008 values based on the changes in exchange rates (USD 1 = NGN 4 in 1988 to NGN 118 in 2008).
Further analysis of livestock changes are shown in Table 4, which illustrates the change in
median values over time of the five most common types of livestock. Distinctions between
nominal and real values in 2008 suggest that for some types of livestock, such as fowl, goats,
sheep and donkeys, the real change has not been nearly as large when compared with cows
and bulls. Given that cows and bulls are predominantly owned by males for use in field
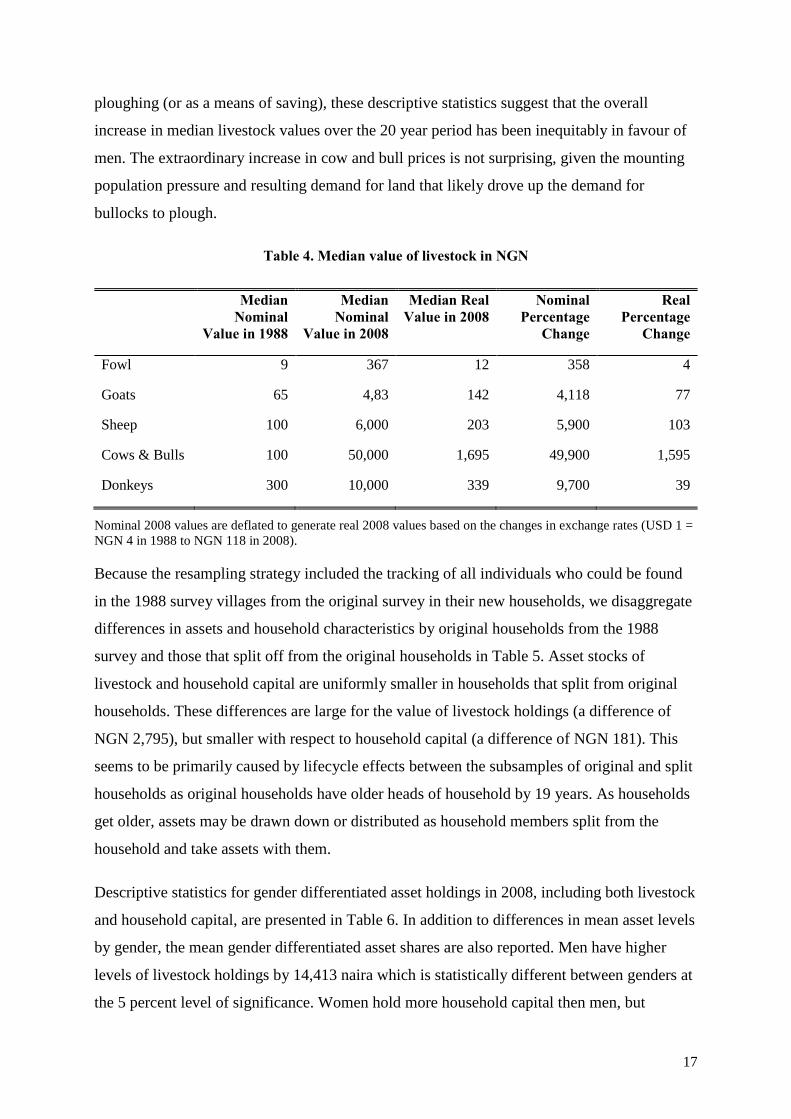
17
ploughing (or as a means of saving), these descriptive statistics suggest that the overall
increase in median livestock values over the 20 year period has been inequitably in favour of
men. The extraordinary increase in cow and bull prices is not surprising, given the mounting
population pressure and resulting demand for land that likely drove up the demand for
bullocks to plough.
Table 4. Median value of livestock in NGN
Median Nominal
Value in 1988
Median Nominal
Value in 2008
Median Real Value in 2008
Nominal Percentage
Change
Real Percentage
Change
Fowl 9 367 12 358 4
Goats 65 4,83 142 4,118 77
Sheep 100 6,000 203 5,900 103
Cows & Bulls 100 50,000 1,695 49,900 1,595
Donkeys 300 10,000 339 9,700 39
Nominal 2008 values are deflated to generate real 2008 values based on the changes in exchange rates (USD 1 = NGN 4 in 1988 to NGN 118 in 2008).
Because the resampling strategy included the tracking of all individuals who could be found
in the 1988 survey villages from the original survey in their new households, we disaggregate
differences in assets and household characteristics by original households from the 1988
survey and those that split off from the original households in Table 5. Asset stocks of
livestock and household capital are uniformly smaller in households that split from original
households. These differences are large for the value of livestock holdings (a difference of
NGN 2,795), but smaller with respect to household capital (a difference of NGN 181). This
seems to be primarily caused by lifecycle effects between the subsamples of original and split
households as original households have older heads of household by 19 years. As households
get older, assets may be drawn down or distributed as household members split from the
household and take assets with them.
Descriptive statistics for gender differentiated asset holdings in 2008, including both livestock
and household capital, are presented in Table 6. In addition to differences in mean asset levels
by gender, the mean gender differentiated asset shares are also reported. Men have higher
levels of livestock holdings by 14,413 naira which is statistically different between genders at
the 5 percent level of significance. Women hold more household capital then men, but
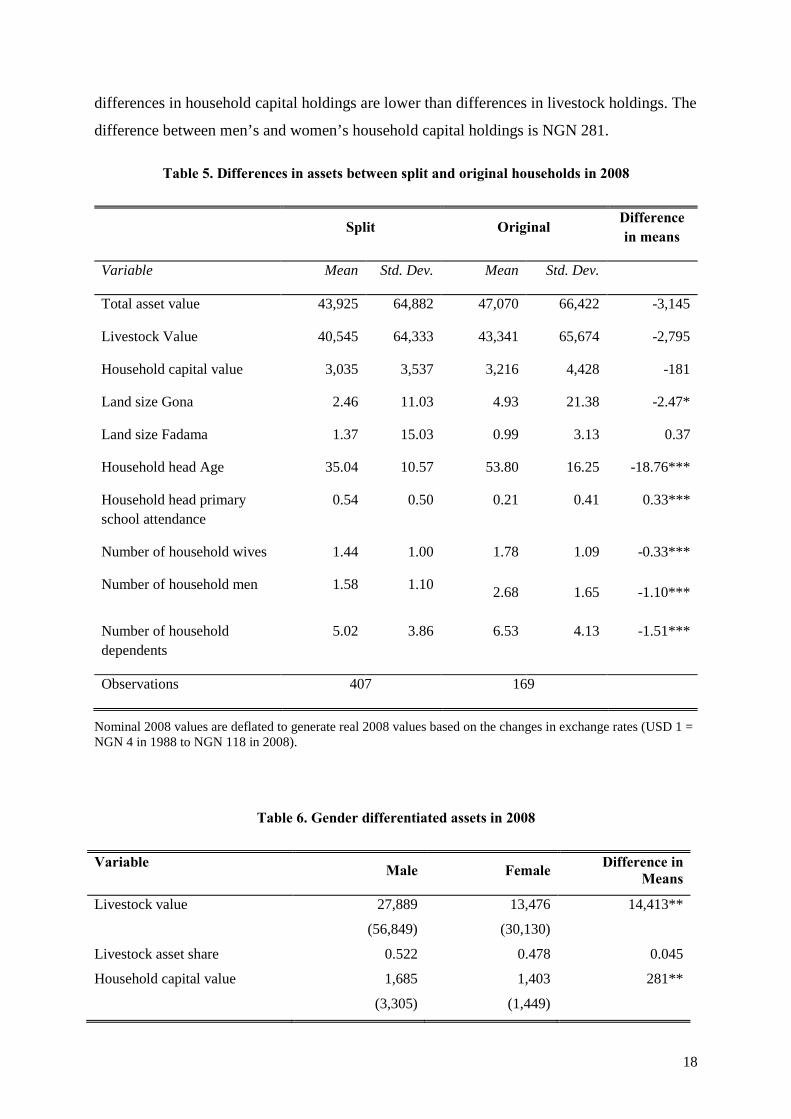
18
differences in household capital holdings are lower than differences in livestock holdings. The
difference between men’s and women’s household capital holdings is NGN 281.
Table 5. Differences in assets between split and original households in 2008
Split Original Difference in means
Variable Mean Std. Dev. Mean Std. Dev.
Total asset value 43,925 64,882 47,070 66,422 -3,145
Livestock Value 40,545 64,333 43,341 65,674 -2,795
Household capital value 3,035 3,537 3,216 4,428 -181
Land size Gona 2.46 11.03 4.93 21.38 -2.47*
Land size Fadama 1.37 15.03 0.99 3.13 0.37
Household head Age 35.04 10.57 53.80 16.25 -18.76***
Household head primary school attendance
0.54 0.50 0.21 0.41 0.33***
Number of household wives 1.44 1.00 1.78 1.09 -0.33***
Number of household men 1.58 1.10 2.68 1.65 -1.10***
Number of household dependents
5.02 3.86 6.53 4.13 -1.51***
Observations 407 169
Nominal 2008 values are deflated to generate real 2008 values based on the changes in exchange rates (USD 1 = NGN 4 in 1988 to NGN 118 in 2008).
Table 6. Gender differentiated assets in 2008
Variable Male Female Difference in Means
Livestock value 27,889 13,476 14,413**
(56,849) (30,130)
Livestock asset share 0.522 0.478 0.045
Household capital value 1,685 1,403 281**
(3,305) (1,449)
19
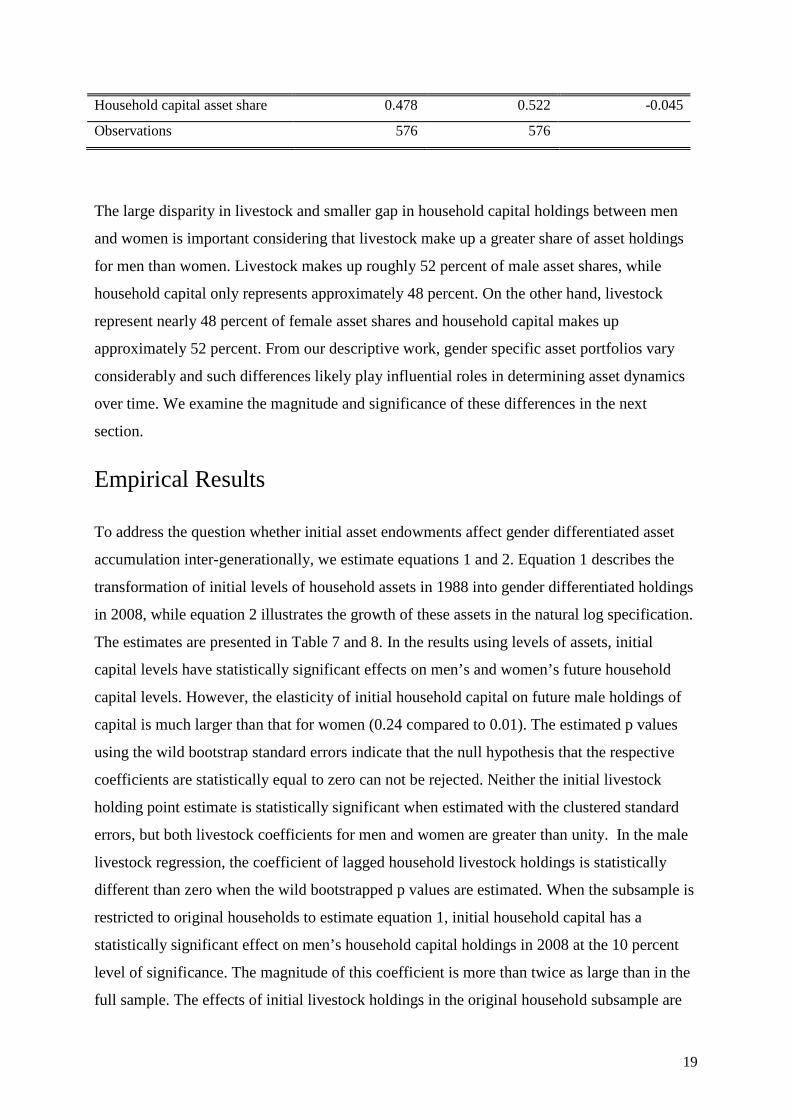
Household capital asset share 0.478 0.522 -0.045
Observations 576 576
The large disparity in livestock and smaller gap in household capital holdings between men
and women is important considering that livestock make up a greater share of asset holdings
for men than women. Livestock makes up roughly 52 percent of male asset shares, while
household capital only represents approximately 48 percent. On the other hand, livestock
represent nearly 48 percent of female asset shares and household capital makes up
approximately 52 percent. From our descriptive work, gender specific asset portfolios vary
considerably and such differences likely play influential roles in determining asset dynamics
over time. We examine the magnitude and significance of these differences in the next
section.
Empirical Results
To address the question whether initial asset endowments affect gender differentiated asset
accumulation inter-generationally, we estimate equations 1 and 2. Equation 1 describes the
transformation of initial levels of household assets in 1988 into gender differentiated holdings
in 2008, while equation 2 illustrates the growth of these assets in the natural log specification.
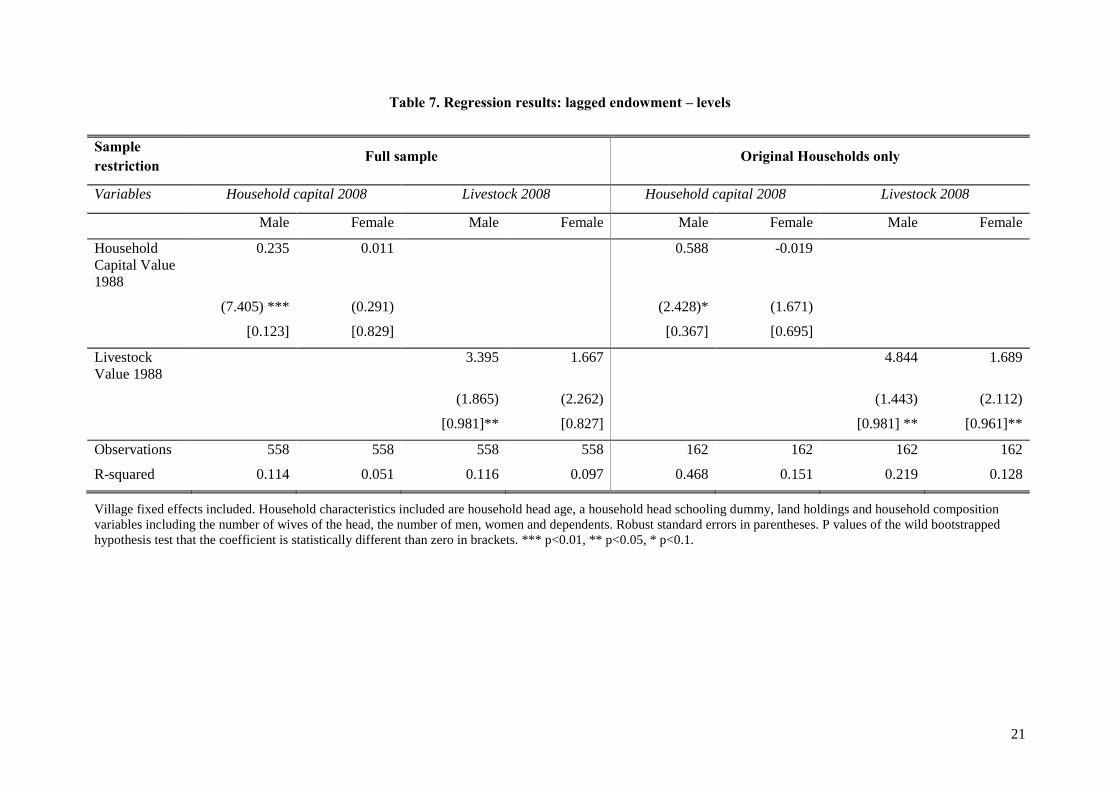
The estimates are presented in Table 7 and 8. In the results using levels of assets, initial
capital levels have statistically significant effects on men’s and women’s future household
capital levels. However, the elasticity of initial household capital on future male holdings of
capital is much larger than that for women (0.24 compared to 0.01). The estimated p values
using the wild bootstrap standard errors indicate that the null hypothesis that the respective
coefficients are statistically equal to zero can not be rejected. Neither the initial livestock
holding point estimate is statistically significant when estimated with the clustered standard
errors, but both livestock coefficients for men and women are greater than unity. In the male
livestock regression, the coefficient of lagged household livestock holdings is statistically
different than zero when the wild bootstrapped p values are estimated. When the subsample is
restricted to original households to estimate equation 1, initial household capital has a
statistically significant effect on men’s household capital holdings in 2008 at the 10 percent
level of significance. The magnitude of this coefficient is more than twice as large than in the
full sample. The effects of initial livestock holdings in the original household subsample are

20
similar, but slightly greater, to those found in the full sample of households. In both the male
and female livestock regressions, the lagged household livestock coefficient is statistically
different from zero at the 5 percent level of significance.
21
Table 7. Regression results: lagged endowment – levels
Sample restriction
Full sample Original Households only
Variables Household capital 2008 Livestock 2008 Household capital 2008 Livestock 2008
Male Female Male Female Male Female Male Female
Household Capital Value 1988
0.235 0.011 0.588 -0.019
(7.405) *** (0.291) (2.428)* (1.671)
[0.123] [0.829] [0.367] [0.695]
Livestock Value 1988
3.395 1.667 4.844 1.689
(1.865) (2.262) (1.443) (2.112)
[0.981]** [0.827] [0.981] ** [0.961]**
Observations 558 558 558 558 162 162 162 162
R-squared 0.114 0.051 0.116 0.097 0.468 0.151 0.219 0.128
Village fixed effects included. Household characteristics included are household head age, a household head schooling dummy, land holdings and household composition variables including the number of wives of the head, the number of men, women and dependents. Robust standard errors in parentheses. P values of the wild bootstrapped hypothesis test that the coefficient is statistically different than zero in brackets. *** p<0.01, ** p<0.05, * p<0.1.
22
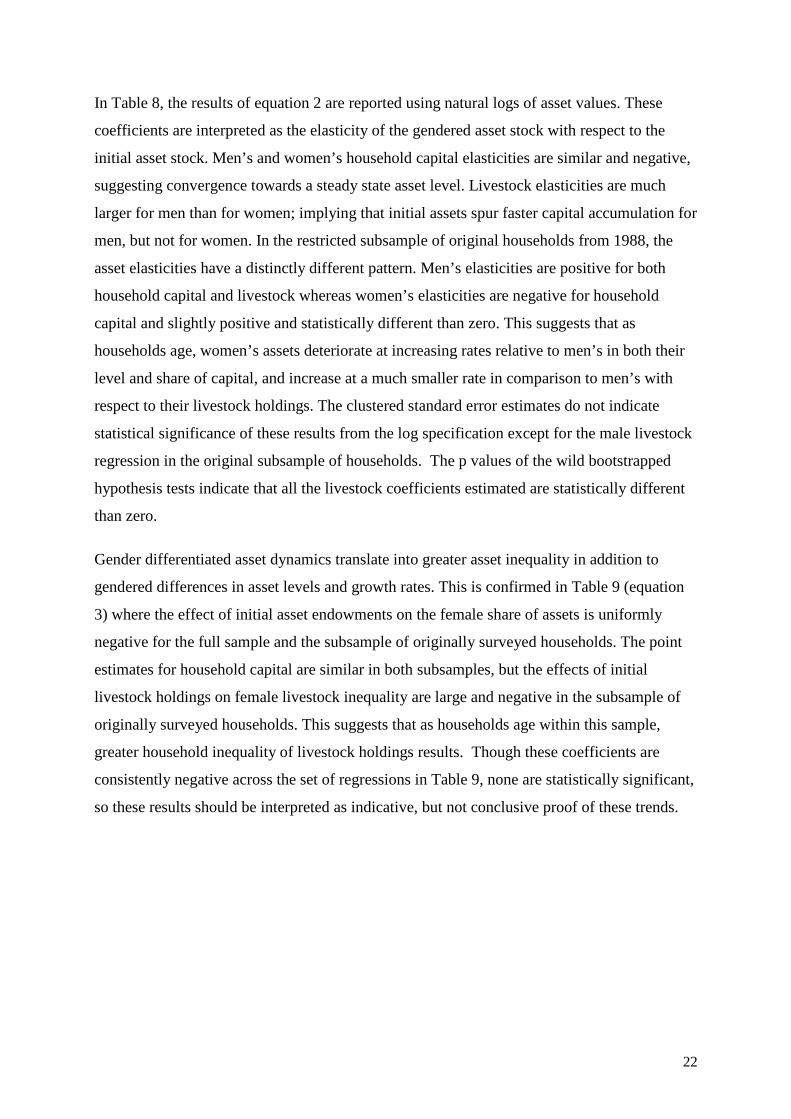
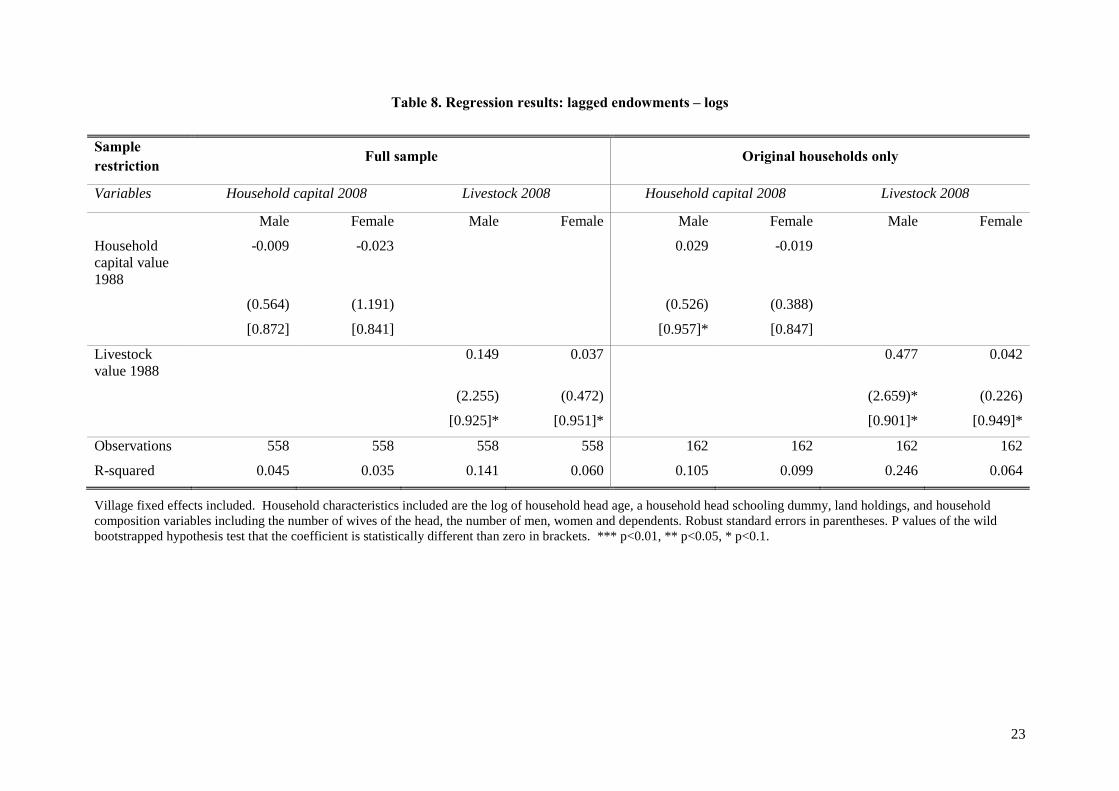
In Table 8, the results of equation 2 are reported using natural logs of asset values. These
coefficients are interpreted as the elasticity of the gendered asset stock with respect to the
initial asset stock. Men’s and women’s household capital elasticities are similar and negative,
suggesting convergence towards a steady state asset level. Livestock elasticities are much
larger for men than for women; implying that initial assets spur faster capital accumulation for
men, but not for women. In the restricted subsample of original households from 1988, the
asset elasticities have a distinctly different pattern. Men’s elasticities are positive for both
household capital and livestock whereas women’s elasticities are negative for household
capital and slightly positive and statistically different than zero. This suggests that as
households age, women’s assets deteriorate at increasing rates relative to men’s in both their
level and share of capital, and increase at a much smaller rate in comparison to men’s with
respect to their livestock holdings. The clustered standard error estimates do not indicate
statistical significance of these results from the log specification except for the male livestock
regression in the original subsample of households. The p values of the wild bootstrapped
hypothesis tests indicate that all the livestock coefficients estimated are statistically different
than zero.
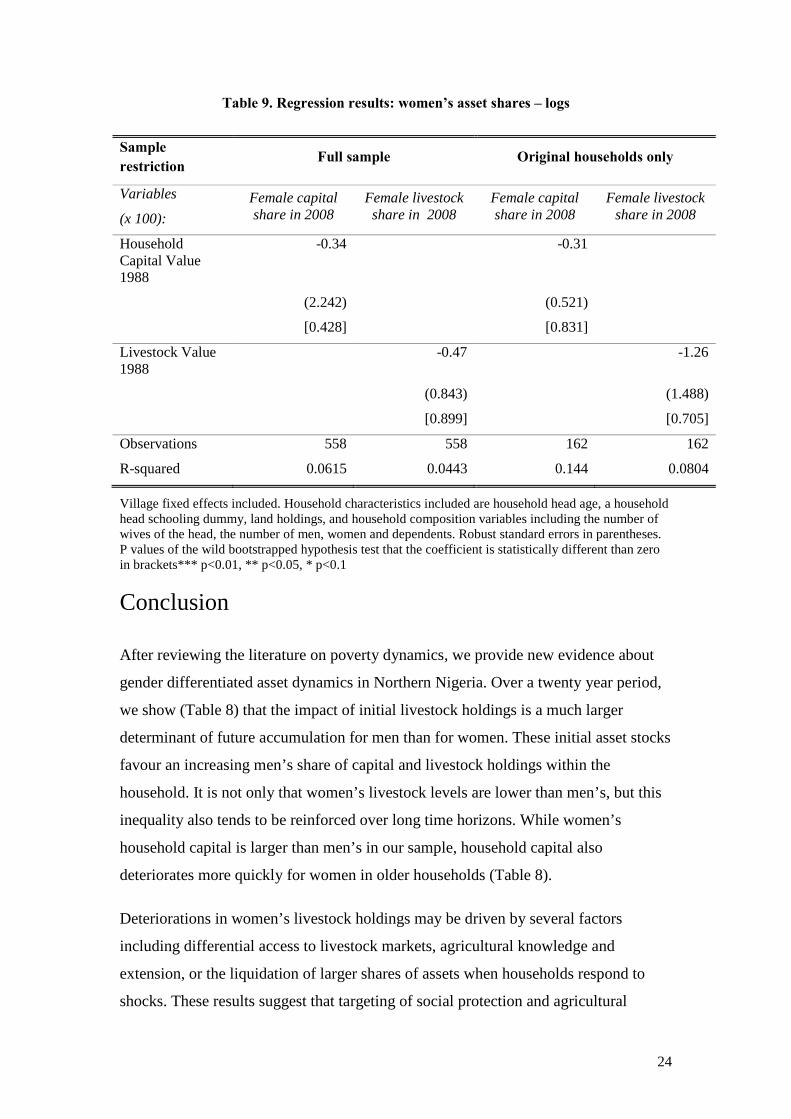
Gender differentiated asset dynamics translate into greater asset inequality in addition to
gendered differences in asset levels and growth rates. This is confirmed in Table 9 (equation
3) where the effect of initial asset endowments on the female share of assets is uniformly
negative for the full sample and the subsample of originally surveyed households. The point
estimates for household capital are similar in both subsamples, but the effects of initial
livestock holdings on female livestock inequality are large and negative in the subsample of
originally surveyed households. This suggests that as households age within this sample,
greater household inequality of livestock holdings results. Though these coefficients are
consistently negative across the set of regressions in Table 9, none are statistically significant,
so these results should be interpreted as indicative, but not conclusive proof of these trends.
23
Table 8. Regression results: lagged endowments – logs
Sample restriction
Full sample Original households only
Variables Household capital 2008 Livestock 2008 Household capital 2008 Livestock 2008
Male Female Male Female Male Female Male Female
Household capital value 1988
-0.009 -0.023 0.029 -0.019
(0.564) (1.191) (0.526) (0.388)
[0.872] [0.841] [0.957]* [0.847]
Livestock value 1988
0.149 0.037 0.477 0.042
(2.255) (0.472) (2.659)* (0.226)
[0.925]* [0.951]* [0.901]* [0.949]*
Observations 558 558 558 558 162 162 162 162
R-squared 0.045 0.035 0.141 0.060 0.105 0.099 0.246 0.064
Village fixed effects included. Household characteristics included are the log of household head age, a household head schooling dummy, land holdings, and household composition variables including the number of wives of the head, the number of men, women and dependents. Robust standard errors in parentheses. P values of the wild bootstrapped hypothesis test that the coefficient is statistically different than zero in brackets. *** p<0.01, ** p<0.05, * p<0.1.
24
Table 9. Regression results: women’s asset shares – logs
Sample restriction
Full sample Original households only
Variables
(x 100): Female capital share in 2008
Female livestock share in 2008
Female capital share in 2008
Female livestock share in 2008
Household Capital Value 1988
-0.34 -0.31
(2.242) (0.521)
[0.428] [0.831]
Livestock Value 1988
-0.47 -1.26
(0.843) (1.488)
[0.899] [0.705]
Observations 558 558 162 162
R-squared 0.0615 0.0443 0.144 0.0804
Village fixed effects included. Household characteristics included are household head age, a household head schooling dummy, land holdings, and household composition variables including the number of wives of the head, the number of men, women and dependents. Robust standard errors in parentheses. P values of the wild bootstrapped hypothesis test that the coefficient is statistically different than zero in brackets*** p<0.01, ** p<0.05, * p<0.1
Conclusion
After reviewing the literature on poverty dynamics, we provide new evidence about
gender differentiated asset dynamics in Northern Nigeria. Over a twenty year period,
we show (Table 8) that the impact of initial livestock holdings is a much larger
determinant of future accumulation for men than for women. These initial asset stocks
favour an increasing men’s share of capital and livestock holdings within the
household. It is not only that women’s livestock levels are lower than men’s, but this
inequality also tends to be reinforced over long time horizons. While women’s
household capital is larger than men’s in our sample, household capital also
deteriorates more quickly for women in older households (Table 8).
Deteriorations in women’s livestock holdings may be driven by several factors
including differential access to livestock markets, agricultural knowledge and
extension, or the liquidation of larger shares of assets when households respond to
shocks. These results suggest that targeting of social protection and agricultural
25
extension programs, especially for elderly women in agricultural households, is
important to increase and protect the assets of women. These types of interventions in
rural agricultural households can have a large impact on moving households out of
poverty and achieving international targets for poverty reduction.
The results from the levels, logs and asset shares specifications suggest gender
differentiated asset dynamics over generations. The mechanisms through which
gender asset inequality is reinforced over generations may differ depending on the
economic environment. Combining both our qualitative and quantitative analysis,
increased growth of population among the survey villages has increased the value of
land and intensified cultivation within the villages. This increased demand for land
caused some households to move out of agriculture, as evidenced by the larger share
of households reporting no land holdings in the 2008 survey, but also increased
demand for draft animals as an input into the agricultural production process. As the
survey villages remain primarily rural agricultural villages, even after 20 years,
changes in the labour markets have been moderate, especially as men continue to
work in some secondary agricultural wage labour jobs during planting or harvest
season, but these jobs are restricted for women. Therefore, the mechanism through
which gender asset inequality was reinforced intra-generationally has been through
changes in the relative prices of men’s and women’s assets. From a policy
perspective, increasing access for women to a diversified asset portfolio is a critical
component of rural poverty alleviation, so that women as well as men may share in
the returns to assets. If women are able to capture the gains of asset price increases
over time, their ability to liquidate assets in response to shocks could greatly improve
rural welfare.
Bibliography
Adato, M., M.R. Carter, J., and May. 2006. Exploring poverty traps and social exclusion in South Africa using qualitative and quantitative data. Journal of Development Studies, Vol. 42(2): 226-247. Addison, T., D. Hulme, and R. Kanbur. 2009. Poverty Dynamics: Measurement and Understanding from an Interdisciplinary Perspective. Oxford: Oxford University Press. Akresh, R. 2005. Understanding Pareto Inefficient Intrahousehold Allocations. IZA Discussion Papers 1858, Institute for the Study of Labor (IZA). Alderman, H., J. Hoddinott, and B. Kinsey. 2006. Long term consequences of early childhood malnutrition. Oxford Economic Papers, Vol. 58(3): 450-474.
26
Angrist, J. and V. Lavy. 2002. The Effect of High School Matriculation Awards: Evidence from Randomized Trials. Working Paper, Massachusetts Institute of Technology.
Antanopolous, R. and M.S. Floro. 2005. Asset ownership along gender lines: Evidence from Thailand. Levy Economics Institute Working Paper No. 418, Annandale-on-Hudson, New York: Levy Economics Institute.
Banerjee, A. and E. Duflo. 2007. The Economic Lives of the Poor. Journal of Economic Perspectives, American Economic Association, Vol. 21(1), pages 141-168, Winter. Barrett, C.B., M. Bezuneh, and A. Aboud. 2001. Income diversification, poverty traps and policy shocks in Côte d’Ivoire and Kenya. Food Policy, Vol. 26: 367–84. Barrett, C., M. Carter, M., and P. Little. 2006a. Understanding and reducing persistent poverty in Africa: Introduction to a special issue, Journal of Development Studies, Vol. 42(2): 167-177. Barrett, C., P. Marenya, J. Mcpeack, B. Mintern, F. Murithi, W. Oluocj-Kosura, F. Place, J. Randrianarisoa, J. Rasambainarivo, and J. Wangila. 2006b. Welfare dynamics in rural Kenya and Madagascar. Journal of Development Studies, Vol. 42(2): 248-277. Baulch, B. and J. Hoddinott. 2000. Economic Mobility and Poverty Dynamics in Developing Countries: Introduction to a Special Issue, Journal of Development Studies, Vol. 36 (1): 1- 24. Beegle, K., J. De Weerdt, and S. Dercon. 2006. Kagera Health and Development Survey 2004 Basic Information Document. mimeo. Washington, D.C.: The World Bank. Behrman, J.R. and P. Taubman. 1985. Intergenerational Earnings Mobility in Earnings in the US: Some Estimates and a Test of Becker’s Intergenerational Endowments Model. Review of Economics and Statistics, Vol. 67(1): 144-151. Behrman, J.R. and P. Taubman. 1990. The Intergenerational Correlation between Children’s Adult Earnings and their Parents‟ Income: Results from the Michigan Panel Survey of Income Dynamics, Review of Income and Wealth, Vol. 36(2): 115- 127. Betrand, M., E. Duflo, and S. Mullainathan. 2004. How Much Should We Trust
Differences-in-Differences Estimates? The Quarterly Journal of Economics, Vol. 119(1): 249-275.
Bevan, D.L., P. Collier, and J.W. Gunning. 1989. Peasants and governments: An economic analysis. Oxford: Oxford University Press. Calvo, C. and S. Dercon. 2009. Chronic Poverty and All That: The Measurement of Poverty over Time. In Poverty Dynamics: Measurement and Understanding from an Interdisciplinary Perspective, ed. Addison, T., D. Hulme and R. Kanbur. Oxford: Oxford University Press. Cameron, A. C., J.B. Gelbach, and D. Miller. 2008. Bootstrap-Based Improvements for Inference with Clustered Errors. The Review of Economics and Statistics, Vol. 90(3): 414–427. Carter, M.R. and C.B. Barrett. 2006. The Economics of Poverty Traps and Persistent Poverty: An Asset-Based Approach. Journal of Development Studies, Vol. 42 (2): 178-199. Dercon, S., D.O. Gilligan, J. Hoddinott, and W. Woldehanna. 2009. The Impact of Agricultural Extension and Roads on Poverty and Consumption Growth in Fifteen Ethiopian Villages. American Journal of Agricultural Economics, Vol. 91(4): 1007- 1021. Deere, C.D., and C.R. Doss. 2006. The Gender Asset Gap: What do we know and why does
it matter? Feminist Economics, Vol. 12(1-2): 1-50. Dey Abbas, J. 1981. Gambian women: Unequal partners in rice development projects? Journal of Development Studies, Vol. 17 (3): 109-122. Dey Abbas, J. 1997. Gender asymmetries in intrahousehold resource allocation in Sub Saharan Africa: Some policy implications for land and labor productivity. In Intrahousehold resource allocation in developing countries: Models, methods, and policy, ed. L. Haddad, J. Hoddinott, and H. Alderman. Baltimore, Md., U.S.A.: Johns Hopkins University Press for the International Food Policy Research Institute. Donald, S. and K. Lang. 2007. Inference with Difference-in-Differences and Other Panel
27
Data. The Review of Economics and Statistics, Vol. 89(2): 221-233. Duflo, E. and C. Udry. 2004. Intrahousehold Resource Allocation in Cote d'Ivoire: Social Norms, Separate Accounts and Consumption Choices, NBER Working Papers 10498, National Bureau of Economic Research, Inc. Foster, J. 2009. A Class of Chronic Poverty Measures. In Poverty Dynamics: Measurement and Understanding from an Interdisciplinary Perspective, ed. Addison, T., D. Hulme, and R. Kanbur. Oxford: Oxford University Press. Gilbert, R. A., W.D. Sakala, and T.D. Benson. 2002. Gender analysis of a nationwide
cropping system trial survey in Malawi. African Studies Quarterly, Vol. 6 (1). Glewwe, P. and G. Hall. 1998. Are Some Groups More Vulnerable to Macroeconomic Shocks Than Others? Hypothesis Tests Based on Panel Data from Peru. The Journal of Development Economics, Vol.56(1): 181-206. Gregorio, M. D., K. Hagedorn, M. Kirk, B. Korf, N. McCarthy, R. Meinzen-Dick, and B. Swallow. 2008. Property rights, collective Action, and poverty: The role of institutions for poverty reduction, CAPRi working papers 81, International Food Policy Research Institute (IFPRI). Gunning, J.W., J. Hoddinott, B. Kinsey, and T. Owens. 2000. Revisiting forever gained: Income dynamics in the resettlement areas of Zimbabwe, 1983–96. Journal of Development Studies, Vol.36 (6): 131-154. Günther, I. and S. Klasen. 2009. Measuring Chronic Non-Income Poverty. In Poverty Dynamics: Measurement and Understanding from an Interdisciplinary Perspective, ed. Addison, T., D. Hulme, and R. Kanbur. Oxford: Oxford University Press. Guyer, J. 1981. Household and community in African studies. African Studies Review, Vol. 24 (2/3): 87-137. Guyer, J. 1986. Intrahousehold processes and farming systems research: Perspectives from anthropology. In Understanding Africa’s rural households and farming systems, ed. J.L. Moock. Boulder, Colorado, U.S.A. and London: Westview. Hanger, J., and J. Moris. 1973. Women and the household economy. In Mwea: An irrigated rice settlement in Kenya, ed. R. Chambers and J. Moris. Munich: Weltforum Verlag. Hoddinott, J. 2006. Shocks and their consequences across and within households in Rural Zimbabwe. Journal of Development Studies, Vol. 42(2): 301-321. Hoddinott, J., and L. Haddad. 1995. Does Female Income Share Influence Household Expenditures? Evidence from Cote D’Ivoire. Oxford Bulletin of Economic and Statistics, Vol. 57 (1): 77-96. Hoddinott, J., J. Maluccio, J. Behrman,, R. Flores, and R. Martorell. 2008. Effect of a nutrition intervention during early childhood on economic productivity in Guatemalan adults. The Lancet, Vol. 371 (9610): 411-416. Horrell, S., and P. Krishnan. 2007. Poverty and productivity in female-headed households in
Zimbabwe. Journal of Development Studies, Vol. 43(8): 1351–1380. Hulme, D. 2003. Chronic Poverty and Development Policy: An introduction. World Development, Vol. 31(3): 399-402. Lybbert, T.J., C.B. Barrett, S. Desta, and D.L. Coppock. 2004. Stochastic Wealth Dynamics and Risk Management among a Poor Population. The Economic Journal, Vol. 114 (October): 750-777. Jones, C. 1986. Intrahousehold bargaining in response to the introduction of new crops: A case study from North Cameroon. In Understanding Africa’s rural households and farming systems, ed. J.L. Moock. Boulder, Colorado: U.S.A. and London: Westview. Kinkingninhoun-Mêdagbé, F. M., A. Diagne, F. Simtowe, A.R. Agboh-Noameshie, and
P.Y. Adegbola. 2008. Gender discrimination and its impact on income, productivity and technical efficiency: Evidence from Benin. Agriculture and Human Values, Vol. 27 (1): 57–69.
Krishna, A. 2009. Subjective Assessments, Participatory Methods and Poverty Dynamics: The Stages of Progress Method. In Poverty Dynamics: Measurement and Understanding from an Interdisciplinary Perspective, ed. Addison, T., D. Hulme, and R. Kanbur. Oxford: Oxford University Press.
28
Lanjouw, P. and N. Stern. 1993. Agricultural Change and Inequality in Palanpur, 1957-84, in K. Hoff, A. Braverman and J. Stiglitz. Eds. The Economics of Rural Organization, Oxford: Oxford University Press. Little, P.D., M.P. Stone, T. Mogues, A.P. Castro, and W. Negatu. 2006. “Moving in place‟: Drought and poverty dynamics in South Wollo, Ethiopia. Journal of Development Studies, Vol. 42 (2): 200-225. Liu, R. Y. 1988. Bootstrap procedure under some non-I.I.D. models. Annals of Statistics Vol. 16: 1696-1708. Loury, G. 1981. Intergenerational transfers and the distribution of earnings. Econometrica, Vol. 49(4): 843-867. Maluccio, J., L. Haddad, and J. May. 2000. Social capital and household welfare in South Africa, 1993–98. Journal of Development Studies, Vol. 36(6): 54-81. Mammen, E. 1993. Bootstrap and wild bootstrap for high dimensional linear models. Annals of Statistics, Vol. 21: 255-285. McMillan, D.E. 1987. Monitoring the evolution of household economic systems over time in farming systems research. Development and Chance, Vol. 18(2): 295-314. Meinzen-Dick, R., L.R. Brown, H.S. Feldstein, and A.R. Quisumbing. 1997. Gender, property rights, and natural resources. World Development, Vol. 25(8): 1303-1315. Moser, C. and A. Felton, A. 2009. The Construction of an Asset Index: Measuring Asset Accumulation in Ecuador. In Poverty Dynamics: Measurement and Understanding from an Interdisciplinary Perspective, ed. Addison, T., D. Hulme, and R. Kanbur. Oxford: Oxford University Press. Moulton, B. 1986. Random Group Effects and the Precision of Regression Estimates.
Journal of Econometrics, Vol. 32(3): 385-397. Moulton, B. 1990. An Illustration of a Pitfall in Estimating the Effects of Aggregate
Variables on Micro Units. Review of Economics and Statistics, Vol. 72(2): 334-338. Nkedi-Kizza, P., J. Aniku, K. Awuma, and C.H. Gladwin. 2002. Gender and soil fertility in
Uganda: A comparison of soil fertility indicators for women and men’s agricultural plots. African Studies Quarterly, Vo. 6(1 & 2).
Norman, D. 1972. An Economic Survey of Three Villages in Zaria Province: 2. Input-Output Study, Vols. i. text and ii. Basic Data and Survey Forms, Ahmadu Bello, University, Samaru Miscellaneous Paper 37. Zaria, Nigeria. Processed. Norman, D., J. Fine, A. Goddard, W. Kroeker, and D. Pryor, D. 1976. A Socio-Economic Survey of Three Villages in the Sokoto Close-Settled Zone, Ahmadu Bello University, Samaru Miscellaneous Paper 64. Zaria, Nigeria. Processed. Oladele, O., and M. Monkhei. 2008. Gender ownership patterns of livestock in Botswana,
Livestock Research for Rural Development, Vol. 20(10). Pender, J., and B. Gebremedhin. 2006. Land management, crop production and household
income in the highlands of Tigray, northern Ethiopia: An econometric analysis. In Pender, J., F. Place, and S. Ehui. Eds. Strategies for sustainable land management in the East African highlands. IFPRI, Washington, D.C.
Peterman, A., J. Behrman, and A.R. Quisumbing. 2010a. A Review of Empirical Evidence on Gender Differences in Nonland Agricultural Inputs, Technology, and Services in Developing Countries, IFPRI Discussion Paper 00975, IFPRI, Washington, D.C.
Peterman, A., A.R. Quisumbing, J. Behrman, and E. Nkonya. 2010b. Understanding Gender Differences in Agricultural Productivity in Uganda and Nigeria, IFPRI Discussion Paper 01003, IFPRI, Washington, D.C.
Peters, P E. 2006. Rural income and poverty in a time of radical change in Malawi. Journal of Development Studies, Vol. 42(2): 322-345. Quisumbing, A.R. 2009a. Intergenerational transfers and the intergenerational transmission of
poverty in Bangladesh: preliminary results from a longitudinal study of rural households, Chronic Poverty Research Center, Working Paper No. 117. Manchester, UK: Institute for Development Policy and Management, University of Manchester.
Quisumbing, A.R. 2009b. Do Men and Women Accumulate Assets in Different Ways? Evidence from Rural Bangladesh, State of Food and Agriculture (SOFA) 2010
29
Background Paper. Rome, Italy: Food and Agriculture Organization (FAO). Quisumbing, A.R. and B. Baulch. 2009. Assets and poverty traps in rural Bangladesh, Chronic Poverty Research Center, Working Paper No. 143. Manchester, UK: Institute for Development Policy and Management, University of Manchester. Quisumbing, A.R. and D. de la Brière. 2000. Women’s Assets and Intrahousehold Allocation in Bangladesh: Testing Measures of Bargaining Power, FCND Discussion Paper 86, IFPRI, Washington, D.C. Quisumbing, A.R. and S. McNiven. 2007. Moving Forward, Looking Back: The Impact of Migration and Remittances on Assets, Consumption, and Credit Constraints in the Rural Philippines, FAO-ESA Working Paper No. 07-05. Roberts, P. 1988. Rural women’s access to labor in West Africa. In Stichter, S.B. and J.L. Parpart. Eds. Patriarchy and class: African women in the home and the work force. Boulder, Colorado, U.S.A. and London: Westview. Roberts, P. 1991. Anthropological perspective on the household, IDS Bulletin, Vol. 22 (1): 60-66. Sanginga, P. C., Adesina, A. A., Manyong,O. Otite, V. M., and Dashiell, K. E. (2007) Social
impact of soybean in Nigeria’s southern Guinea savanna, Ibadan, Nigeria: International Institute of Tropical Agriculture.
Scott, C, D. 2000. Mixed fortunes: A study of poverty mobility among small farm households in Chile, 1968–86. Journal of Development Studies, Vol. 36(6): 155-180. Sen, A.K. 1985. Women, technology, and sexual divisions. Trade and Development, Vol. 6: 195-213. Strauss, J. and D. Thomas. 1998. Health, nutrition and economic development. Journal of Economic Literature, Vol. 36(2): 766-817. Thomas, D. 1997. Income, Expenditures, and Health Outcomes: Evidence on Intrahousehold Resource Allocation. In Haddad, L., J. Hoddinott, and H. Alderman. Eds. Intrahousehold resource allocation in developing countries: Models, methods, and policy. Baltimore, Md., U.S.A.: Johns Hopkins University Press for the International Food Policy Research Institute. Udry, C. 1990. Credit Markets in Northern Nigeria: Credit as Insurance in a Rural Economy. World Bank Economic Review, Vol. 4(3): 251-69. Udry, C. 1996. Gender, Agricultural Production, and the Theory of the Household. Journal of Political Economy, Vol. 104(5): 1010-1046. Uttaro, P. 2002. Diminishing choices: Gender, small bags of fertilizer, and household food
security decisions in Malawi. African Studies Quarterly, Vol. 6 (1). White, H. 1980. A heteroskedasticity-consistent covariance matrix estimator and a
direct test for heteroskedasticity. Econometrica, Vol. 48: 817-838. Whitehead, A. 1990. Rural women and food production in Sub-Saharan Africa. In Drèze, J. and A. Sen. Eds. The political economy of hunger, Vol. 1. Oxford: Clarendon. Whitehead, A. 2006. Persistent poverty in North East Ghana. Journal of Development Studies, Vol. 42 (2): 278-300. Wu, C. F. G. 1986. Jacknife, Bootstrap and other Resampling Methods in Regression Analysis. Annals of Statistics, Vol. 14: 1261-1295.
ESA Working Papers WORKING PAPERS The E SA Working P apers ar e pr oduced by t he A griculture and E conomic
Development Analysis Division (ESA) of the Economic and Social Department of the
United Nations Food and Agriculture Organization (FAO). The series presents ESA’s
ongoing r esearch. W orking paper s ar e c irculated t o s timulate di scussion
and comments. They are made available to the public through the Division’s website.
The a nalysis and c onclusions are t hose of t he a uthors an d do n ot i ndicate
concurrence by FAO.
AGRICULTURAL DEVELOPMENT ECONOMICS Agricultural Development Economics (ESA) i s F AO’s f ocal poi nt for ec onomic
research and policy analysis on issues relating to world food security and sustainable
development. E SA c ontributes t o t he g eneration o f k nowledge and ev olution o f
scientific t hought on hunger a nd poverty al leviation t hrough i ts economic s tudies
publications w hich i nclude t his w orking paper s eries as w ell as per iodic a nd
occasional publications.
Agricultural Development Economics (ESA)
The Food and Agriculture Organization Viale delle Terme di Caracalla
00153 Rome, Italy
Contact: Office of the Director
Telephone: +39 06 57054368 Facsimile: + 39 06 57055522
Website: www.fao.org/economic/esa e-mail: [email protected]