Gear Shift Modeling and Analysis for Automatic …...2 | Gear Shift Modeling and Analysis for...
8
TM Gear Shift Modeling and Analysis for Automatic Transmissions in MapleSim
Transcript of Gear Shift Modeling and Analysis for Automatic …...2 | Gear Shift Modeling and Analysis for...

TM
Gear Shift Modeling and Analysis for Automatic Transmissions in MapleSim
2 | Gear Shift Modeling and Analysis for Automatic Transmissions in MapleSim
Gear Shift Process in Automatic Transmissions Gear shifting in vehicles with automatic transmissions is an important topic in the automotive powertrain industry, as evidenced by the sheer number of studies published over the past few decades [1, 2, 3].
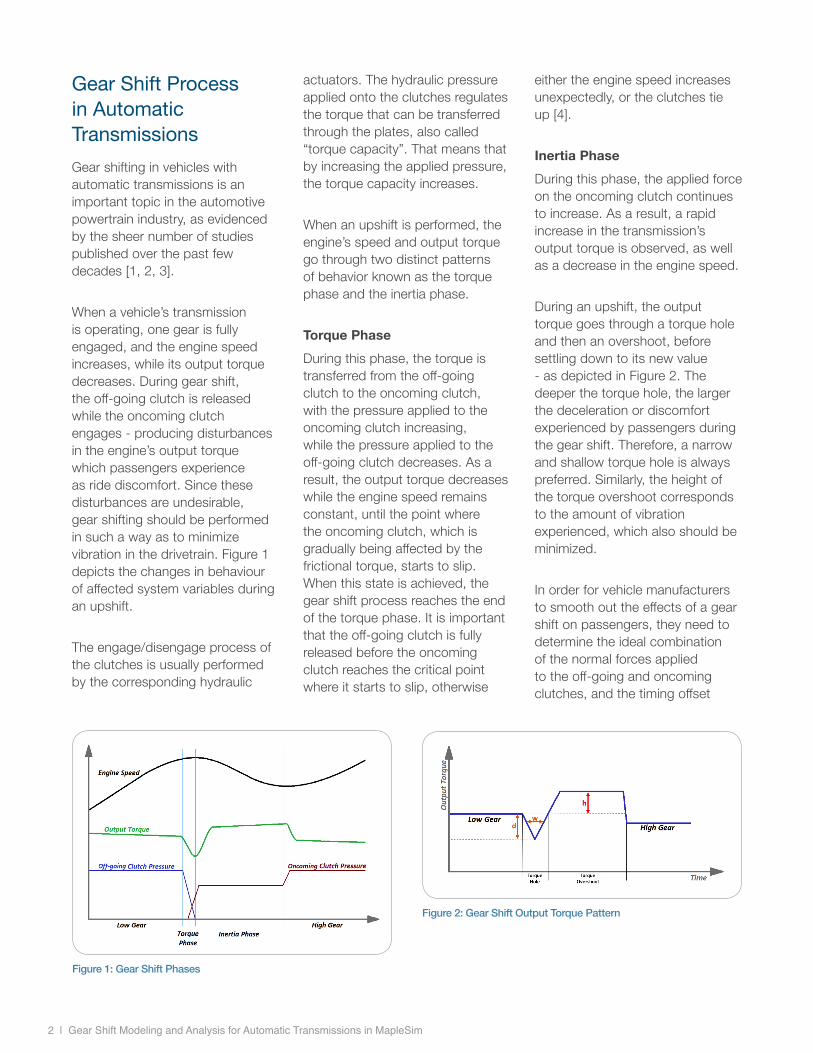
When a vehicle’s transmission is operating, one gear is fully engaged, and the engine speed increases, while its output torque decreases. During gear shift, the off-going clutch is released while the oncoming clutch engages - producing disturbances in the engine’s output torque which passengers experience as ride discomfort. Since these disturbances are undesirable, gear shifting should be performed in such a way as to minimize vibration in the drivetrain. Figure 1 depicts the changes in behaviour of affected system variables during an upshift.
The engage/disengage process of the clutches is usually performed by the corresponding hydraulic
actuators. The hydraulic pressure applied onto the clutches regulates the torque that can be transferred through the plates, also called “torque capacity”. That means that by increasing the applied pressure, the torque capacity increases.
When an upshift is performed, the engine’s speed and output torque go through two distinct patterns of behavior known as the torque phase and the inertia phase.
Torque PhaseDuring this phase, the torque is transferred from the off-going clutch to the oncoming clutch, with the pressure applied to the oncoming clutch increasing, while the pressure applied to the off-going clutch decreases. As a result, the output torque decreases while the engine speed remains constant, until the point where the oncoming clutch, which is gradually being affected by the frictional torque, starts to slip. When this state is achieved, the gear shift process reaches the end of the torque phase. It is important that the off-going clutch is fully released before the oncoming clutch reaches the critical point where it starts to slip, otherwise
either the engine speed increases unexpectedly, or the clutches tie up [4].
Inertia PhaseDuring this phase, the applied force on the oncoming clutch continues to increase. As a result, a rapid increase in the transmission’s output torque is observed, as well as a decrease in the engine speed.
During an upshift, the output torque goes through a torque hole and then an overshoot, before settling down to its new value - as depicted in Figure 2. The deeper the torque hole, the larger the deceleration or discomfort experienced by passengers during the gear shift. Therefore, a narrow and shallow torque hole is always preferred. Similarly, the height of the torque overshoot corresponds to the amount of vibration experienced, which also should be minimized.
In order for vehicle manufacturers to smooth out the effects of a gear shift on passengers, they need to determine the ideal combination of the normal forces applied to the off-going and oncoming clutches, and the timing offset
Figure 1: Gear Shift Phases
Figure 2: Gear Shift Output Torque Pattern

between the two events. Given the wide range of values that these variables can take, manufacturers need to be able to quickly and safely experiment with multiple permutations to determine the optimum.
This is facilitated with a tool such as MapleSim™ the multidomain physical modeling and simulation tool from Maplesoft™. Using MapleSim, developers can create high fidelity models of their transmission system with full access to system parameters, run simulations with varying parameter values, and observe the resulting behavior.
In this paper, we use MapleSim to explore the effects of the different parameters within the transmission system on gear shift quality. The first step is to create a fully-parameterized system model using components from the standard 1-D Mechanical Library and Maplesoft Driveline Library [5].
Model Development Figure 3 shows the physical model of the gear shift system, consisting of two sets of clutches and gears, a simple engine model, a load, and inertia components. The two clutches and the ideal gears are connected in parallel, and represent the first and second gears of the automatic transmission model. This parallel combination is connected to the engine on the left, and the load on the right.
The Clutch component models the friction torque that is calculated based on the activation signal, maximum normal force and the velocity-dependent coefficient of friction [6].
The Ideal Gear component models an ideal gearbox with one driving shaft and one driven shaft that has no inertia, elasticity, damping, or backlash.
The Engine component uses a lookup table for torque vs. engine speed data [6].
The Dynamometer component provides a resistive load at the end of a powertrain. It has rotary inertia as well as linear and quadratic damping.
Some of the system parameters are listed in Table 1.
Figure 3: Model diagram for shifting simulations
Table 1: Model Specifications
Parameter Unit Value
Dynamometer Inertia kg.m2 250
Linear damping coefficient N.s/m 0.01
Non-linear damping coefficient N.s/m 0.001
Engine Minimum Operational Speed rpm 800
Maximum Operational Speed rpm 7000
Gear Ratios Low Gear - 3.841
High Gear - 2.352
Final Drive - 3.692

Clutch Timings InvestigationsGiven that ride discomfort is a function of gear shift quality, which itself is dependent on clutch engage/disengage timings, simulations were run to investigate the effects of varying this timing offset.
Two sets of conditions are considered:
• Changing the rate of pressure drop for the off-going clutch, while the rate of pressure increase for the on coming clutch is kept constant
• Changing the rate of pressure increase for the oncoming clutch, while the rate of pressure drop for the off-going clutch is kept constant
Simulations performed here consider a single gear shift from first to second gear, with the throttle set to 40%.
Effects of the timing of the off-going clutch pressureFor the first set of experiments, the normal force to the oncoming clutch was applied over a fixed duration of time, while the time taken to reduce the off-going clutch pressure was varied.
The solid red line in Figure 4 shows the response of the system when the off-going clutch pressure was released in 0.6 seconds. In this case, the minimum output torque in the torque hole stage was 325 Nm, and the maximum output torque in the torque overshoot stage was 655 Nm, as shown in Figure 5.
The dotted blue lines in Figure 4 and Figure 5 show the response when the time taken to release the off-going clutch is extended to 1.5 seconds. This leads to minimum and maximum torque values of 225 Nm and 575 Nm respectively. Notice how the output torque dramatically bottoms out to its lowest value – this is due
to incomplete disengagement of the off-going clutch pressure. This means that both the off-going and oncoming clutches are semi-engaged, which produces reverse torque, which is ultimately experienced as passenger discomfort.
Effects of the timing of the oncoming clutch pressureHere, the pressure applied to the off-going clutch was released over a fixed duration of time, while the time taken to apply pressure onto the oncoming clutch was varied.
Recall that the difference in output torque during the transmission up-shift process affects the amount of vibration and shock experienced by the passengers. Therefore, the larger the increase in the torque overshoot, the more intense the vibration. So, by controlling the torque overshoot, gear shift vibration can be reduced, thereby improving shift quality.
Figure 4: Normal force diagram for slow and fast off-going clutch disengagement
4 | Gear Shift Modeling and Analysis for Automatic Transmissions in MapleSim
Figure 5: Output torque diagram for slow and fast off-going clutch disengagement

i. Analysis of the oncoming clutch pressure timing on the torque phase
The blue dotted line in Figure 6 shows how the force applied to the oncoming clutch increases over time. As the pressure applied to the off-going clutch decreases, there comes a point when the transmission is unable to transfer sufficient torque, resulting in a large torque hole, as seen in Figure 7.
The solid red line shows the result of modifying the timing of the pressure applied to the oncoming clutch – causing it to increase at a higher rate, such that the off-going clutch is not yet fully released. In this case, the torque produced by
the oncoming higher gear has a counteracting reverse effect on the off-going lower gear transferred torque, as illustrated in Figure 7.
The results show that the torque output of the transmission is significantly influenced by the frictional pressure of the clutches during this changeover period. These effects are mostly visible during the torque phase, and less so during the inertia phase.
ii. Analysis of the oncoming clutch pressure timing on the inertia phase
For this analysis, the time taken to apply pressure and engage the oncoming clutch was varied. The effect of the oncoming clutch
engagement timing on the inertia phase was then investigated.
The solid red line shows the case where the oncoming clutch is engaged over a period of 0.75 seconds, which is considerably higher than the rate used in the previous test. This fast change produces a high torque overshoot, resulting in passenger discomfort, as seen in Figure 9.
The dotted blue line shows the case where the pressure on the oncoming clutch is applied more smoothly over an extended period of time without any noticeable different effect on the output torque, especially in the inertia phase.
Figure 6: Normal force diagram for slow and fast oncoming clutch engagement
Figure 7: Output torque diagram for slow and fast oncoming clutch engagement
Figure 8: Normal force diagram for short and long period of oncoming clutch engagement
Figure 9: Output torque diagram for short and long period of oncoming clutch engagement

In this case, the clutch continues to slip until the applied pressure exceeds the critical point where the oncoming clutch becomes fully engaged.
Gear Shift Quality Analysis Through tight integration, MapleSim is able to take advantage of the symbolic and numeric computation capabilities of Maple, to analyze multidomain models. Using API commands, users can interact with the MapleSim model for exploration and batch analysis.
Figure 10 shows a Maple worksheet linked to the gear shifting simulation model described above, while Figure 11 shows an example API command. Here the user is using the “GetParameters” command to extract all system parameters for further analysis.
A key feature of Maple is the ability to compile the model while keeping user-defined parameters symbolic. This enables the compiled model to be quickly simulated for different
sets of parameters. Figure 12 shows the command for compiling the model created for this paper, where the parameter “delta” was kept symbolic, with a default value of zero.
Another API command that was executed during these experiments is “ParameterSweep”, which performs a parameter sweep of a MapleSim model. In this case, the sweeping parameter was the variable “delta”, which
was used to define the timings of the ramp input blocks for the oncoming clutch force. Figure 13 shows the syntax to set the range of the sweeping parameter from -0.5 to 0.25, for 10 evenly distributed points.
The normal force applied to the oncoming clutch for all ten sweep points was then displayed on the same plot for easy comparison.The corresponding range of output torque is shown in Figure 14.
6 | Gear Shift Modeling and Analysis for Automatic Transmissions in MapleSim
Figure 10: Maple worksheet interface for MapleSim
Figure 11: Maple API command – GetParameters
Figure 12: Maple API command – GetCompiledProc
Figure 13: Maple API command – ParameterSweep
Figure 14: Output torque diagram for sweeping parameter of the oncoming clutch force
Interested in learning more about MapleSim? Visit www.maplesim.com
ConclusionThe model discussed in this paper was created with MapleSim, and used to investigate the effects of changes in the applied pressure on the quality of an automatic transmission’s gear shift process. A simple dynamic physical model of an automatic transmission was created to evaluate all required forces and motion characteristics of the system during the shift process. Gear shift quality was assessed by setting different timing sequences for the engage/disengage process of the frictional components (pressure on the clutches), during the upshift process. The output torque of the transmission was analyzed under two conditions, with the timing to apply/remove pressure from the clutches being different in both cases.
Slowly applying pressure to the high gear resulted in extended use of the low gear clutch to sustain the missing frictional torque, which consequently results in more wear. A drop in the transferred torque can also be observed, if the high gear clutch does not engage before the low gear clutch becomes fully disengaged. On the other hand, reverse torque can be produced if the pressure is supplied to the high gear clutch too quickly causing it to fully engage before the low gear clutch is fully disengaged.
Experiments showed that changes in clutch pressure do not have a significant effect on the inertia phase. However during the torque phase, vibrations in the drivetrain, which lead to discomfort, are directly attributed to clutch pressures. Shift quality during this phase can be improved by a dedicated controller that adjusts the clutch pressures.
An analysis tool was therefore developed, to facilitate the selection of parameter values. The use of an automated tool makes it easy for the user to simulate the model repeatedly, with different sets of parameter values. This enables an engineer to make an informed decision about which combination of values to assign to the timings of the oncoming and off-going clutches.
References
[1] X. Chen, G. Li, L. Zhang and S. Liu, “Study of Shock Control of Gear-shifting in Automatic transmission,” Advanced Materials Research, Vols. 490-495, pp. 890-894, 2012.
[2] D.-H. Kim, J.-O. Hahn, B.-K. Shin and K.-I. Lee, “Adaptive Compensation Control of Vehicle Automatic Transmissions for Smooth Shift Transients Based on Intelligent Supervisor,” KSME International Journal, vol. 15, no. 11, pp. 1472-1481, 2001.
[3] K.-L. Kuo, “Simulation and Analysis of the Shift Process for an Automatic Transmission,” World Academy of Science, Engineering and Technology, International Science Index, vol. 5, no. 4, pp. 310-316, 2011.
[4] S. Bai, J. Maguire and H. Peng, Dynamic Analysis and Control System Design of Automatic Transmission, Warrendale: SAE International, 2013.
[5] “Maplesoft, MapleSim Driveline Library,” 2015. [Online]. Available: http://www.maplesoft.com/products/toolboxes/driveline/.
[6] Maplesoft, “Transmission Modeling and Simulation with MapleSim,” 2012. [Online]. Available: http://www.maplesoft.com/contact/webforms/whitepapers/transmissionmodeling.aspx.
[7] P. Samanuhut, “Modeling and Control of Automatic Transmission with Planetary Gears for Shift Quality,” Arlington, 2011.

www.maplesoft.com | [email protected]© Maplesoft, a division of Waterloo Maple Inc., 2015. Maplesoft, Maple, and MapleSim are trademarks of Waterloo Maple Inc.
All other trademarks are the property of their respective owners.
A C y b e r n e t G r o u p C o m p a n y