Gemmel v. Immelt, No. 650780 2018, 2019 BL 264106 (Sup. Ct ...

GE Works J.R. Immelt Chairman & CEO December 18, 2013
Caution Concerning Forward-Looking Statements: This document contains “forward-looking statements” – that is, statements related to future, not past, events. In this context, forward-looking statements often address our expected future business and financial performance and financial condition, and often contain words such as “expect,” “anticipate,” “intend,” “plan,” “believe,” “seek,” “see,” or “will.” Forward-looking statements by their nature address matters that are, to different degrees, uncertain. For us, particular uncertainties that could cause our actual results to be materially different than those expressed in our forward-looking statements include: current economic and financial conditions, including volatility in interest and exchange rates, commodity and equity prices and the value of financial assets; potential market disruptions or other impacts arising in the United States or Europe from developments in sovereign debt situations; the impact of conditions in the financial and credit markets on the availability and cost of General Electric Capital Corporation’s (GECC) funding and on our ability to reduce GECC’s asset levels as planned; the impact of conditions in the housing market and unemployment rates on the level of commercial and consumer credit defaults; changes in Japanese consumer behavior that may affect our estimates of liability for excess interest refund claims (GE Money Japan); pending and future mortgage securitization claims and litigation in connection with WMC, which may affect our estimates of liability, including possible loss estimates; our ability to maintain our current credit rating and the impact on our funding costs and competitive position if we do not do so; the adequacy of our cash flow and earnings and other conditions which may affect our ability to pay our quarterly dividend at the planned level or to repurchase shares at the planned level; GECC’s ability to pay dividends to GE at the planned level; our ability to convert pre-order commitments into orders; the level of demand and financial performance of the major industries we serve, including, without limitation, air and rail transportation, energy generation, real estate and healthcare; the impact of regulation and regulatory, investigative and legal proceedings and legal compliance risks, including the impact of financial services regulation; our capital allocation plans, as such plans may change and affect planned share repurchases and strategic actions, including acquisitions, joint ventures and dispositions; our success in completing announced transactions and integrating acquired businesses; our ability to complete the staged exit from our North American Retail Finance business as planned; the impact of potential information technology or data security breaches; and numerous other matters of national, regional and global scale, including those of a political, economic, business and competitive nature. These uncertainties may cause our actual future results to be materially different than those expressed in our forward-looking statements. We do not undertake to update our forward-looking statements. “This document may also contain non-GAAP financial information. Management uses this information in its internal analysis of results and believes that this information may be informative to investors in gauging the quality of our financial performance, identifying trends in our results and providing meaningful period-to-period comparisons. For a reconciliation of non-GAAP measures presented in this document, see the accompanying supplemental information posted to the investor relations section of our website at www.ge.com.” “In this document, “GE” refers to the Industrial businesses of the Company including GECC on an equity basis. “GE (ex. GECC)” and/or “Industrial” refer to GE excluding Financial Services.” GE’s Investor Relations website at www.ge.com/investor and our corporate blog at www.gereports.com, as well as GE’s Facebook page and Twitter accounts, contain a significant amount of information about GE, including financial and other information for investors. GE encourages investors to visit these websites from time to time, as information is updated and new information is posted.

2 JRI December Analyst 12-18-13
Overview
Completing strong 2013 … solid 4Q with increasing organic growth and margin expansion
GE executing plan for more valuable earnings growth: 70% Industrial earnings by 2015 … planning exit of N.A. Retail in an efficient way
Strong competitive advantages build toward ~4-7% organic growth in 2014 + Leadership in technology, growth markets, and services
Programmatic cost out and simplification driving margin improvement + ~70 bps. margin growth in 2013 … sustained growth year by year … target
~17% segment margins by 2016
Balanced capital allocation with significant cash returned to shareholders + Returning $18B to investors in 2013 + Modest increase in payout ratio for 2014 … 16% dividend increase
1
2
3
4
5

3 JRI December Analyst 12-18-13
GE macro outlook
+ U.S. economy continues to strengthen
+ Europe still sluggish
+ Growth markets invest in infrastructure
+ Inflation still tame
+ Fiscal/regulatory volatility
+ GE macro themes intact
G
G
G Y
R Y
Consumer based … slightly better demand for credit
Stable … multiple geographic segments
China … resource rich investing in industrialization … some volatility
Positive value gap
Governments redoing budgets
Core drivers are positive
Environment more positive … volatility remains
Y
G Y

4 JRI December Analyst 12-18-13
2013 operating framework 2013E
Double-digit growth in second half as planned
Originations at high returns
Continued portfolio rebalancing; lower ENI
Planning for ~$3.3B including $0.3B GECC preferred
and Avio acquisition-related charges
Planning Industrial CFOA & GE Capital dividends
($17-20B) offset by ~$3.2B taxes related to NBCU exit
Industrial segment organic near 2%; GE Capital
revenues 0-(5)%
2013 drivers
Industrial +/++
GE Capital +
Corporate -
Total operating earnings +/++
CFOA excl. NBCU-related tax $17-20B
CFOA incl. NBCU-related tax $14-17B
Total revenues 0-5%
Operating earnings
Total framework remains unchanged
5 JRI December Analyst 12-18-13
G
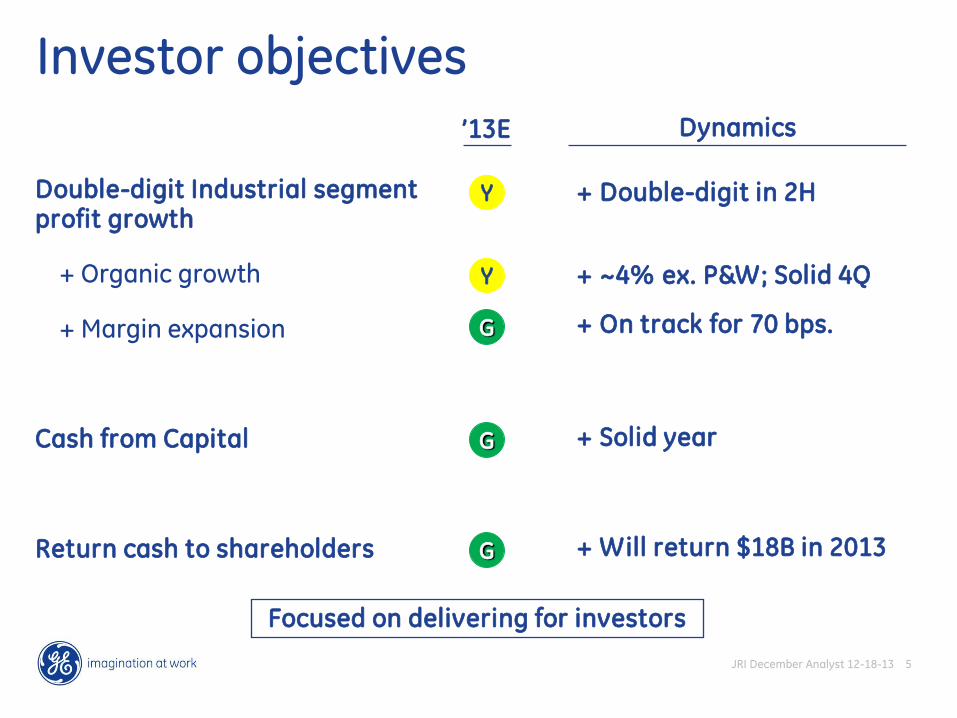
Investor objectives
Double-digit Industrial segment profit growth
+ Organic growth
+ Margin expansion
Cash from Capital
Return cash to shareholders
’13E
Focused on delivering for investors
Y
Y
G
G
Dynamics
+ Double-digit in 2H
+ ~4% ex. P&W; Solid 4Q
+ On track for 70 bps.
+ Solid year
+ Will return $18B in 2013

6 JRI December Analyst 12-18-13
A valuable company Higher P/E earnings growth
+/++
+ +
'13E '14F '15F
1 Extending competitive advantage 2 Substantial cash to allocate 3
~$62B
~5%
Technical leadership
~$170B
~$1B+
Services expansion
+ Portfolio of leading businesses … growing adjacencies
+ Complementary commercial finance
+ Expanding margins and returns
+ Execute on N.A. Retail transaction
Very strong company … well-positioned for future
~17%
Global acceleration
Growth ’10-’13E
$3B+
++
Restructuring SG&A out
Simplification
$2.5B+
+
Industrial
CFOA > NI
growth
++
2014 CFOA
Low parent
net debt
2013
capital
allocation
$18B
>9.5%
++
$25-30B Strong
GE Capital
+
EPS growth
Acq.
$9B
Return to shareholders
% Ind’l. ~55 ~60 ~70
~$11B
Cash
~$11B
LT debt 2013-2014
Equip. backlog
R&D/ revenue
Backlog Analytics 2014
T1C CP
Retail gain
7 JRI December Analyst 12-18-13
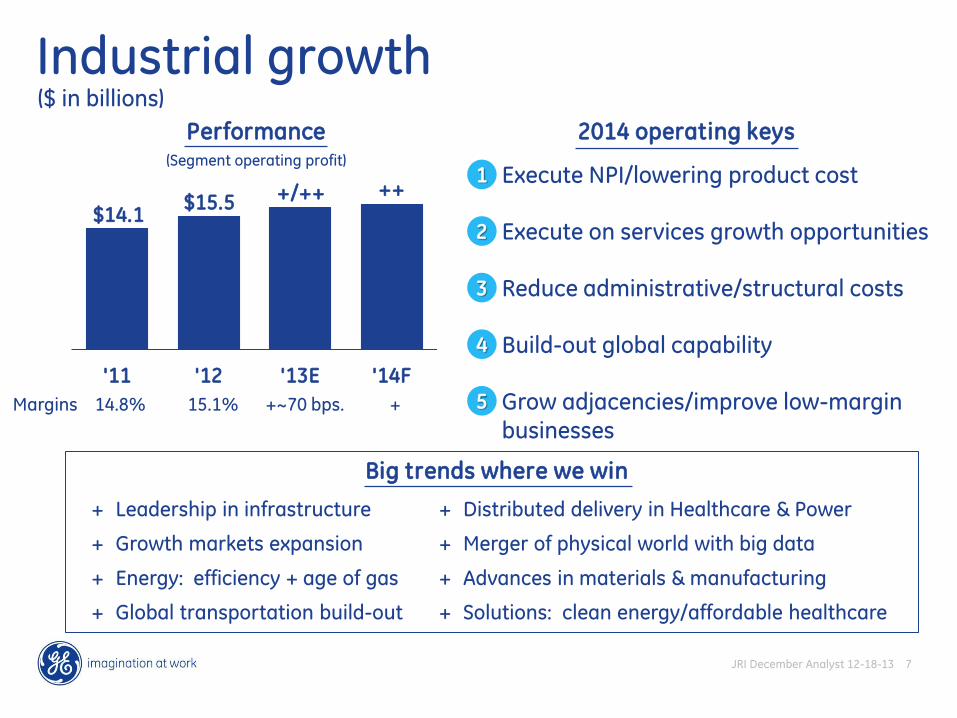
Industrial growth
2014 operating keys
Execute NPI/lowering product cost
Execute on services growth opportunities
Reduce administrative/structural costs
Build-out global capability
Grow adjacencies/improve low-margin businesses
'11 '12 '13E '14F
Performance (Segment operating profit)
$14.1 $15.5
++ +/++
($ in billions)
Margins 14.8% 15.1% +~70 bps. +
1
2
3
4
5
+ Leadership in infrastructure
+ Growth markets expansion
+ Energy: efficiency + age of gas
+ Global transportation build-out
+ Distributed delivery in Healthcare & Power
+ Merger of physical world with big data
+ Advances in materials & manufacturing
+ Solutions: clean energy/affordable healthcare
Big trends where we win

8 JRI December Analyst 12-18-13
2000 2008 2013E
GE in Oil & Gas
Industry drivers
$2
Where we are now
$10
~$20 Orders ($B)
+ 30% growth in R&D
+ GRC in Oklahoma City and Rio
+ Launch solutions
+ GE depth … gas turbines, compression, materials
1
GE advanced technology &
services leader
+ Capital intensity
+ Tougher environments
+ Productivity – mature fields
+ LNG growth
+ Localization
+ Regulatory & safety
LNG systems
Subsea systems
Drilling & production
Enhanced recovery
Services & solutions
Growth in technical intensity Aviation execution comes to Oil & Gas
How GE can lead
Lead with technology & services
2 Build out local customer capabilities
+ Localize service + production
+ Expansions in Africa, Russia, ASEAN
+ Customer … global account structure
3 Improve execution
+ Product structuring
+ Process & IT
investments
Late backlog
Product complexity
Uptime
Margins
~$900B market @ ~7% growth

9 JRI December Analyst 12-18-13
Strategic position
Leading specialty finance lender … focused on products & geographies that matter to mid-market customers
2013E 2014F 2015F 2016F
ENI-b) ~$385 =/- ~$300-350 +
$7.7+ ~$7
~$5 + N.A. Retail
Non-core
Core
#1: Aircraft lending & leasing
#1: Healthcare finance
#1: Mid-market sponsor
#1: Equipment finance
#1: Flow retail (CDF)
#1: Franchise
#1: Europe receivables finance
#3: Commercial real estate lender
#4: Corporate finance
Pivot to growth
Return capital to parent
Maintain strong reg. capital & liquidity
Grow in line with Industrial at attractive returns
Continue to diversify funding
Focused on helping middle market customers grow
GE Capital – going forward
($ in billions) In line with Industrial
Leading businesses Earnings-a)
(a - Earnings from continuing operations attributable to GECC (b - ex. Cash (c - Assumes no tax reform and extension of AFE benefits
Early read -c)

10 JRI December Analyst 12-18-13
GE strategy Premier infrastructure company
+ Technical leadership & scale
+ Growth market capabilities … breadth & depth
+ Services driving customer outcomes through analytics
+ Culture of simplification … low cost + speed Valuable specialty finance
30%
70%
Enterprise advantages
Strategic execution
Organic growth Margins Capital allocation
'12 '13E '14F
8%
~4-7%
~2%
'12 '13E '14F
15.1% + ~15.8%
'11-'13E '14F-'16F
~$84 ~$90
Industrial ROTC
'13E '16F
15%+ ~17%

11 JRI December Analyst 12-18-13
Technical leadership Investment ($B)
$16 ~$17
’10-’12 ’13E-’15F
% revenue 5-6 ~5 GRC pushes capabilities rapidly across the Company
Execution on big and complex systems … technical scale (i.e., engines)
Foundation of materials, modeling, and manufacturing science
Strong linkage with customers and partners
Product management tools to integrate gaps and simplification
1
2
3
4
5
Why we win
Value creation
• Broad and deep technical reach… ability to spread ideas
• Deep technical foundation … not going to be beaten in our key markets
• Unique global footprint (5 GRC network)
• Investment required … now in the run rate
Material science (GRC)
Power gen (P&W)
Electrification (EM)
Diagnostics/sensors (HC)
12 JRI December Analyst 12-18-13
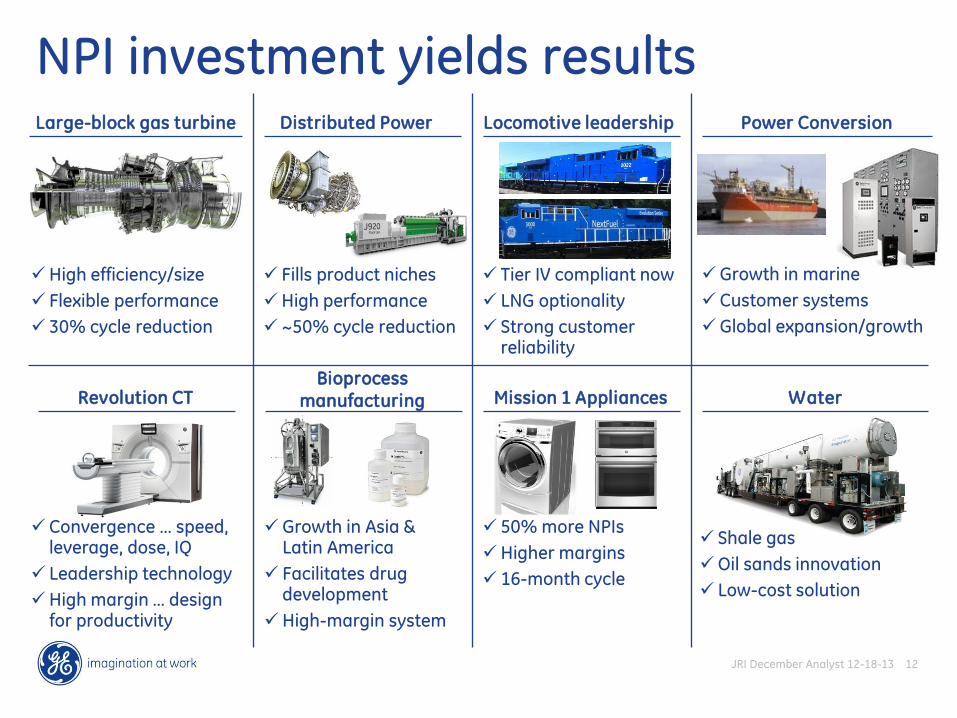
NPI investment yields results Large-block gas turbine Distributed Power Locomotive leadership Power Conversion
Revolution CT Bioprocess
manufacturing Mission 1 Appliances
High efficiency/size
Flexible performance
30% cycle reduction
Fills product niches
High performance
~50% cycle reduction
Tier IV compliant now
LNG optionality
Strong customer reliability
Convergence … speed, leverage, dose, IQ
Leadership technology
High margin … design for productivity
Growth in Asia & Latin America
Facilitates drug development
High-margin system
50% more NPIs
Higher margins
16-month cycle
Growth in marine
Customer systems
Global expansion/growth
Water
Shale gas
Oil sands innovation
Low-cost solution

13 JRI December Analyst 12-18-13
GE wins in Aviation
Generational leadership
GEnx LEAP & Passport GE9X
2011 2015-2016 2020
Lead in this cycle
Composite fan Compressor Lean combustion Ceramic-matrix composites (CMCs)
Composite fan blade Most advanced compressor
Lowest NOx and carbon emissions
Most advanced materials
Built on exclusive GE technology
1 Advanced materials + Ceramic matrix composites
+ Advanced coatings
2 Manufacturing methods + Additive leadership
+ Automation/robotics
+ New processes
3 Learning curve speed + Improve cycle
+ Manufacturing ramp + Design tools
4 Increasing content + Avio ahead of plan
+ New engines … GE value
Growing margins
Fuel burn Competitive advantage
Backlog IB growth
+10%+
+
~$100B ~46k
~13k
’20 ’00
$40B wins at Dubai Air Show
(a - Wins by GE ~$27B, CFMI ~$13B (b - LEAP is a trademark of CFMI, a 50-50 JV between SNECMA and GE (c - represents installed base of GE and partners (e.g. CFMI, IEA) engines (d - includes technologies developed with/by partners
-b)
-d)
-a)
-c)

14 JRI December Analyst 12-18-13
Healthcare: winning with NPI
Reliable execution
80+
NPI/year NPI margin Development cycle
Segments served
~5 pts. 5 months less 100+ countries
Clinical innovation Academic
leadership
Disease focus
Value execution Lower price Applications
Global expansion Localized
Products for rural
development
Customer workflow Remote usage Lower opex
Way to grow in a volatile global market
Clinical segmentation
PET/MR
3T Value
China
LCM
AWB
Logiq
Korea
V-scan

15 JRI December Analyst 12-18-13
Services growth
'12 '13E '14F
Revenue ($B)
$43
+
+
Why we win
Margin (%)
Value creation
+
• GE has large installed base
• We have lead in Services … positions us on the same side as the customer
• Investing in analytics will take this to a new level … customer outcomes
• Every industrial company will become an analytical company … GE leads
Backlog + ~$170 $157
Deep domain expertise around assets and usage
Long-term focus on repair technology and field productivity
Investment in analytics: asset and operations optimization
Renewed focus on mature fleets
~$170B of CSA backlog … win-win economics
+ 29 1
2
3
4
5
+
Physical Analytical

16 JRI December Analyst 12-18-13
Services 2.0 + Industrial Internet
~$170B
GE domain
CSA backlog
+ Smart machines
+ Deep domain
+ Customer linkage
$20B
Customer outcomes
Power of 1% productivity
+ Uptime
+ Efficiency
+ Utilization
+ Waste
+ Safety
No unplanned downtime
Analytical COE
+ Organic build
+ Shared capability
+ Predix platform
+ Best partners
Launch offerings in 6 weeks
Progress so far
Investor payback
'13E '14F
~$600
$1,000+ Orders ($MM)
Cumulative launches 24 40+
Asset optimization
Drilling iBox
Power-up Wind
Low dose CT
Operations optimization
Flight efficiency svc.
Rail Connect
Centricity 360
GE assets
Enterprise
Growth $/IB +3-5%
Increase service margins
Grow software from $4B
(2012) to $6B (2015)
1
2
3
PredictivityTM launches
Understand the physical asset
+
1% of revenue = ~$150MM op. profit

17 JRI December Analyst 12-18-13
Power & Water growing $/IB P&W: Advanced gas path
Expanded operating envelope
Ambient Temperature
Ou
tpu
t (M
W)
AGP hardware
PredictivityTM software delivers:
Value of upgraded HW
Additional value of SW
More output on cold days
7FA.03 baseline
Benefits for GE & customer
19 ~50 + ’12 ’13E ’14F
AGP sales (#) Customer outcomes
• Output • Reliability
$/IB
• Flexibility • Efficiency
Higher ROI
Hardware & software

18 JRI December Analyst 12-18-13
RailConnect driving outcomes
Transportation services backlog up $1B+ Growth in $/IB … +8% in 2013 Programs with most customers … growing globally

19 JRI December Analyst 12-18-13
(a - Citi Research May 2013. … Citi estimates Population Health Tech. market segment could exceed $60B by 2025
• Large IB of post-processing imaging tools
• Imaging as a service opex model
• Drives significant radiology productivity
& new use cases
• Comprehensive applications: Surveillance, disease management & population health
• Supplements EMR … integrates clinical, payer,
and financial data
• Double-digit growth … pipeline ~$700MM
Organic IT growth of 10%+ in 2014
Cloud Imaging: Centricity 360TM
Unlocking power of the cloud … imaging
storage, exchange & advanced analytics
… ~$2B segment by ’18, growing 25%+
Population Health:
Risk taken on by providers new tools
and processes required … $30-60B segment by 2025-a)
GE + Microsoft JV
Healthcare growing IT/software
GE PredictivityTM
Solution

20 JRI December Analyst 12-18-13
Innovation margin Physical tools Analytical tools
Hours
Cu
mu
la
tive
W
ea
r Severe
Non-Severe
Remote & continuous monitoring for Subsea
technology … drives service value & customer uptime
At one airline, time-on-wing segmentation drives $20MM additional margin & higher asset utilization
Fuel efficiency data & models can capture 1-3%
savings per airline
Technology is key to sustainable Services margin growth
>50% of parts can be repaired vs. new; drives
service margin and improves cycle
Mobility tools are achieving 5-10% labor productivity + better uptime for customers
Improve wind output by 3% through combination
of controls + software

21 JRI December Analyst 12-18-13
Winning in growth regions
'12 '13E '14F
Growth market orders ($B)
$11
$41
+/++ ++
Querétaro
engineering center
Sell in 160 countries … play at scale in most
First mover in localization … build capacity
Best customers and partners
Lower cost through ‘multi-modal’ sites + engineering centers
Use our breadth to offer new market solutions
1
2
3
4
5
Value creation
• Consistent investment in growth regions … through the cycles
• Under John’s leadership we have the broadest, most integrated market footprint … lead competition
• Results … 17% AAGR since 2010
+
Why we win
Dubai Air Show
CFM56 is a CFMI (a 50/50 JV with GE and Snecma) engine

22 JRI December Analyst 12-18-13
'12 '13E '14F '20F
Orders trajectory
Mega themes
Environment/gas conversion
Universal healthcare
Mass transportation
Move up technology value chain
Aviation
• Leading massive transportation trend
•Develop business aviation
•Grow services + partnerships
•Promote clean & distributed power
•Power conversion & efficiency
• Localize capability
•Grow distribution
•Service footprint expansion
Power & Water & EM
Healthcare
Significant GE opportunity in current 5-year plan
($ in billions)
~$6 ~$8
++
China growth
++
++
++
++
Oil & Gas ++ •Technology for shale & LNG
•Pipeline development
’20F
’20F
’20F
’20F
By 2020 … revenue in these segments should
double
23 JRI December Analyst 12-18-13
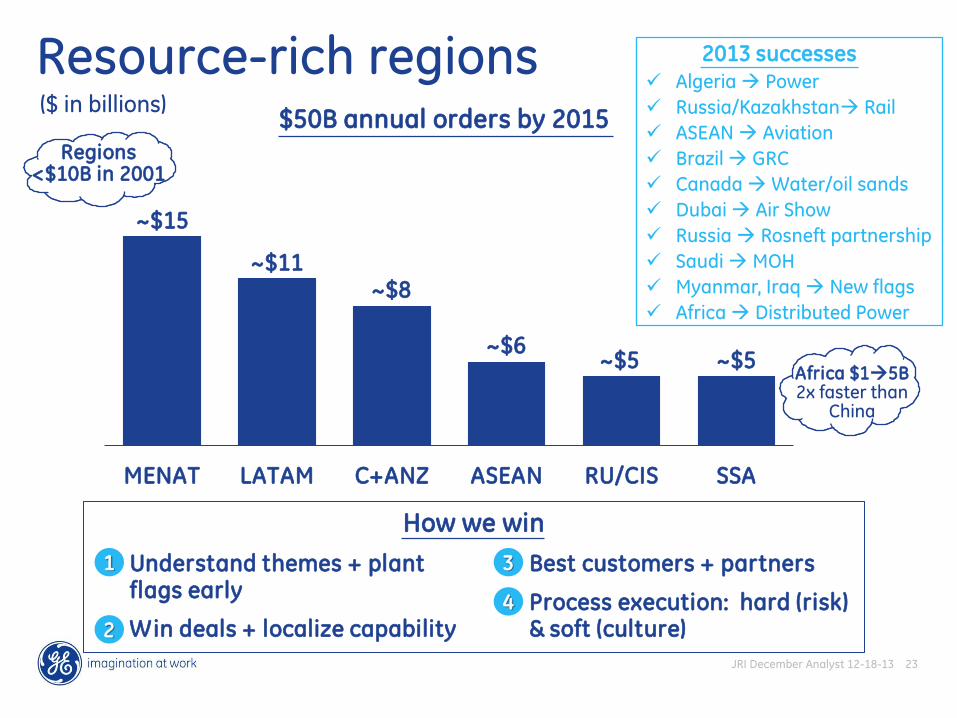
Resource-rich regions
MENAT LATAM C+ANZ ASEAN RU/CIS SSA
~$15
~$11 ~$8
~$6 ~$5 ~$5
Africa $15B 2x faster than
China
Regions <$10B in 2001
Understand themes + plant flags early
Win deals + localize capability
Best customers + partners
Process execution: hard (risk) & soft (culture)
How we win
1
2
3
4
$50B annual orders by 2015
2013 successes Algeria Power
Russia/Kazakhstan Rail
ASEAN Aviation
Brazil GRC
Canada Water/oil sands
Dubai Air Show
Russia Rosneft partnership
Saudi MOH
Myanmar, Iraq New flags
Africa Distributed Power
($ in billions)

24 JRI December Analyst 12-18-13
Best global cost Engineering centers Shared services
• Engineering productivity … can build out globally
• Specific industry focus & competencies … O&G, primary care, shale gas, unconventional fuels
• Global innovation, local solutions
Manufacturing
• India … Phase 1 complete – 30% cost out – Aviation, Wind, M&C, DP
• Oil & Gas … services expansion
• New investments … Russia, Brazil, Saudi, Nigeria
Poland Vietnam
Innovate & speed Better outcomes +
lower cost
Chengdu
Localization
Querétaro
India
• Global operations approach to enabling functions
– Enterprise standards – One team – Accountability
• Multi-functional approach to achieve scale
'11 Today Future
~25% ~35%
~65%
Enabling function penetration
~40%
~35% ~40%
% of developed market costs
~45%
Angola
Low-cost Localization

25 JRI December Analyst 12-18-13
Speed & simplification
'12 '13E '14F '16F
15.1%
~15.8% +
Dynamics
Simplification ++ Driven by restructuring and SG&A reductions
$1.5B structural SG&A cost out in ’13 …
~$1B in ’14
Value gap + Continued focus on price & material deflation
Mix – Growth in equipment > services
R&D =/+ Continued technology investments
Other – Wage inflation
2014E
vs. 2013E ~17%
Sustainable
• Make “administration” a source of scale (G&A)
• Move with speed on all elements
of product cost and margin
• Intense focus on market success
… and customer processes
• Strong IT foundation … mobility
Segment margins
26 JRI December Analyst 12-18-13
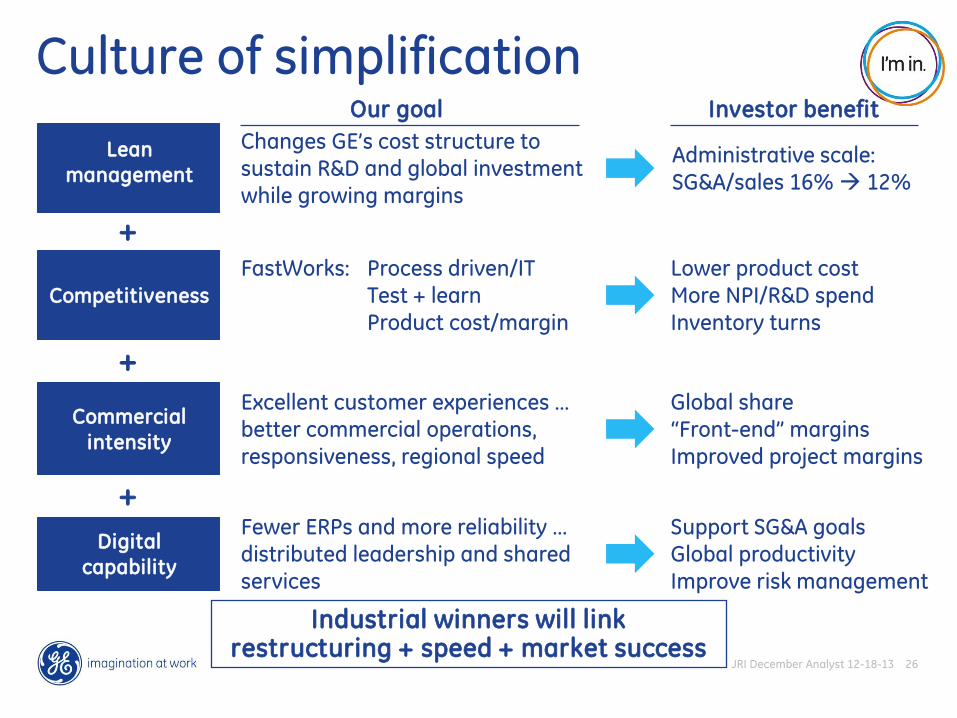
Culture of simplification
Industrial winners will link restructuring + speed + market success
Investor benefit
Administrative scale: SG&A/sales 16% 12%
Lower product cost More NPI/R&D spend Inventory turns
Global share “Front-end” margins Improved project margins
Support SG&A goals Global productivity Improve risk management
Changes GE’s cost structure to sustain R&D and global investment while growing margins
FastWorks: Process driven/IT Test + learn Product cost/margin
Excellent customer experiences … better commercial operations, responsiveness, regional speed
Fewer ERPs and more reliability … distributed leadership and shared services
Our goal
Lean
management
Competitiveness
Commercial
intensity
Digital
capability
+
+
+

27 JRI December Analyst 12-18-13
Simplification execution
Targeting best-in-class Industrial cost structure & margins
% of sales
SG&A
Industrial profile
17.5% 15.5-16%
~14%
'12 '13E '14F '16F
$17.7
−
($ in billions)
Simplification goals & drivers
−
~12% −
Shared services
30 pts.
Consolidate supply chain
15%
Fewer ERPs
80%
Fewer P&Ls
30%
Smaller HQ
45%
Lower indirect spend
10%+

28 JRI December Analyst 12-18-13
Value gap & product cost ($ in millions)
Value gap
'11 '12 '13E '14F
$(720)
$333 +
++
Growing equipment margin
+ Expecting positive price dynamics
+ Still a decent inflation environment
+ Focus restructuring and FastWorks
Environment
Product structuring + simplification
(Oil & Gas, Healthcare, Distributed Power) X : 1
Engineering speed & productivity
(Aviation, Power Gen, Appliances) X : 2
Manufacturing technology + productivity
(Aviation, Power Gen, Energy Management) X : 3
Sourcing competitiveness
(Transportation, Healthcare) X : 4
Product reliability & quality
(All) X : 5

29 JRI December Analyst 12-18-13
ERP 1 ERP 1 ERP 1
FastWorks NPI: Diesel engine
Inventory cycle: Oil & Gas ERP: Transportation
See next page
ERP 1 ERP 1 ERP A
ERP 1 ERP 1 ERP A 1 ERP
Legacy 2013 2016
# ERPs 20 6 1 common standard
Better front-end capability Supply chain speed, inventory management Standard integration to shared service apps
• Winning In Subsea program driving ITO and OTR process upgrades
• Established integrated project planning to pace operations
Trees testing & assembly cycle time reduced from 6 to 4 months
Project cycle time 4 months from ~7.5 months
Product introduction acceleration
Launch in 18 months @
30% of original development cost estimate ’12 Today
1.5 yrs.
Engineering productivity: Aviation
• Achieved 2x engineering productivity in two years
On time delivery of engines
First time yield
Reduction of testing
Digital tools
Development cycle
2011 2013E
2
7
NPI execution (# NPIs)

30 JRI December Analyst 12-18-13
Capital allocation
2010-2013E: $83B-a)
Dividend
$26
Organic
growth $15
M&A
$23 Buyback
$19
Disciplined + balanced allocation
Effective allocation of capital
GE Capital very strong
Solid capex discipline + Simplification (IT) & GGO set standards + Multi-modal investments
Dividend remains source of value for majority of investor base
Steady progress on share count reduction … ~10% from ’12–’15
Acquisition discipline … leverage strength, we create the value and market systems, cost synergies, margin improvement … don’t pay for the “rollups”
Make choices … NBCU, N.A. Retail, others
($ in billions)
Technology + globalization
43% payout
Avg. price $21.20
$1-4B deal size …
funded with $24B in dispositions
1
2
3
4
5
6
(a - Excludes cash held at parent

31 JRI December Analyst 12-18-13
Organic investment in innovation, productivity, global growth
Attractive dividend … let payout increase modestly for a time
Reduce float to ≤9.5B shares … capital efficient
Acquisitions in the ~$1-4B range … stay focused on building out strengths
Available cash Capital allocation
~$90B
N.A. Retail Finance
GECC dividends
Industrial CFOA/ balance sheet efficiency
Parent cash
’14F-’16F
~$90B
Buyback/M&A/ N.A. Retail exchange
GE dividend
Parent cash, organic growth & operating needs
’14F-’16F
Going forward: Capital allocation
Capital allocation priorities

32 JRI December Analyst 12-18-13
2014 business summary
Power & Water − +
Oil & Gas ++ ++ Energy Mgmt. +/++ ++ Aviation ++ ++
Healthcare + +/++ Transportation ++ −
Appl. & Lighting ++ ++ Capital ~$7.7B+ ~$7B
Play through industry cycles while developing leading technology … capture Services & Distributed Power opportunities & position for gas cycle
A leading OEM in high-growth industry … continue to invest & differentiate with NPI and execution Significant growth opportunity … restructure to improve margins Commercial & technology success … build out supply chain & expand adjacencies ... play through sequestration
Developed markets remain challenging … deliver in growth regions … lower cost position improves margins Strong global position … North America & mining slower
North American consumer recovery, Lighting challenging Execute N.A. Retail, pivot to growth in mid-market + verticals
Earnings
’14F ’13E

33 JRI December Analyst 12-18-13
'13E '14F
Power & Water
+
Delivering operating profit growth through tough cycle
+ Shift of demand to developing markets + Continued natural gas growth
+ Renewables PTC clarity in 2014
– Slow developed markets with high
reserve margins
Environment
–
– +/++
Revenue
Op.
profit
+ Diverse technology & solutions … broad & deep … growing orders (‘13 HDGT 110-120)
+ Strong services model … ~65,000 units in installed base & growing
+ Continued focus on simplification, driving base cost productivity
+ Distributed Power and Water executing
– Mix impact from Wind … Europe remains tough
Investing in globalization/product leadership
Operating dynamics

34 JRI December Analyst 12-18-13
Oil & Gas
'13E '14F
++
GE position continues to improve
+ Developing breakthrough technologies … add R&D to acquisitions
+ Continue to improve project execution
+ Global services growth … data & analytics capabilities drive enhanced
productivity
– High demand for industry expertise … global battle for talent … execution requirements high
Building out global footprint … improving our own execution
+ Strong market growth
+ Increasing capital & technology
intensity
+ Growth in unconventional fuels
– Inflation & industry supply chain
Environment
++
++
++
Revenue
Op.
profit
Operating dynamics

35 JRI December Analyst 12-18-13
+
'13E '14F
Energy Management
++
Building a competitive business … lots of room for improvement
+ Strong backlog in Power Conversion
+ Partnering with XD in China to expand global T&D business
+ Driving margin expansion … streamlining footprint & infrastructure
+ Add value across GE segments
– Scale disadvantages
Simplification & improved cost competitiveness a must
Environment
+/++
+ Oil & gas and marine demand
+ Renewables & distributed
generation growth + Aging infrastructure
– U.S. utility & Europe slow
+ Revenue
Op.
profit
Operating dynamics

36 JRI December Analyst 12-18-13
Appliances & Lighting
+ +
+ Continue to invest in Appliance products and U.S. manufacturing
+ Global LED adoption accelerating … N.A. consumer shifting to more energy efficient lighting
+ Additional simplification across portfolio … more restructuring ahead as technology changes
– Competitive market with strong retail customers and distribution
Maintain margin & NPI focus
+ U.S. housing continues to improve
+ Strong global shift to energy efficient
lighting
− Professional non-LED market slowing
Environment
Revenue
Op.
profit
++
++
Earnings & margin growth
'13E '14F
Operating dynamics

37 JRI December Analyst 12-18-13
'13E '14F
Transportation
– ++
Managing cycle through cost out, new products & geographic expansion
+ Build backlog … international growth key
+ Invest for the future … Tier 4 emissions, LNG, underground mining
+ Grow Services footprint … RailConnect360TM
+ Drive factory productivity & deflation
– Sluggish N.A. demand and regulatory transition
Simplify structure and reduce SG&A in a tough cycle
+ Strong global pipeline
– Slow recovery of N. America coal
– Continued softness in mining industry
Environment
+ – Revenue
Op.
profit
Operating dynamics

38 JRI December Analyst 12-18-13
+
'13E '14F
Healthcare
+/++
Earnings growth through simplification & product leadership
+ Drive software solutions to enable services
growth
+ Leading product portfolios with clinical &
economic relevance … big ’14 launches
+ Winning in emerging markets … investing in capabilities to respond to local needs
+ Capture bio-pharma demand growth
– Reimbursement cuts & budget constraints …
more volume of procedures at lower prices
Simplifying structure for cost out while investing
in growth regions
+ Growth markets continue to expand
+ Customers still respect technology
= U.S. healthcare reform still challenged
= Europe slowly stabilizing
Environment
+
+ Revenue
Op.
profit
Operating dynamics

39 JRI December Analyst 12-18-13
+ +/++
'13E '14F
Aviation
++
Positioned for continued growth into the future
+ Technology innovation for next generation platforms
+ Large installed base & profitable services backlog … driving customer productivity through data & analytics
+ Strong supply chain momentum … footprint expansion, technology & vertical integration to support volume ramp
+ Spares recovery continues
– Military shipments down
Manage engine development & launch costs
+ Continued growth in passenger traffic
+ Freight returning to modest growth
+ Strong airline profitability
– Military budget pressure continues
Environment
++
Revenue
Op.
profit
Operating dynamics

40 JRI December Analyst 12-18-13
GE Capital
Partner with Industrial to grow … vertical alignment
Return $20-30B to parent
Returns on tangible equity > cost of equity
Deliver ~30% of GE’s net income
Pivot to growth in line with Industrial
Focusing GE Capital on the middle market and verticals connected to GE Capitalizing on GE strengths & our competitive advantages
Value to GE
2013E 2014F 2015F
~$7.7+ ~$7
~$5
($ in billions)
Early read
Earnings-a)
(a - Earnings from continuing operations attributable to GECC (b - Assumes no tax reform and extension of AFE benefits
-b)

41 JRI December Analyst 12-18-13
2014 operating framework 2014F
Strong Industrial segment growth
Margin expansion
Phase 1 of N.A. Retail transaction & lower CRE gains
Position core portfolio for growth
Planning for ~$500MM in Corporate expense
Offset by loss of NBCU JV income (1Q’13)
Restructuring > gains
Positive impact of share reduction
Planning strong Industrial CFOA; GE Capital dividends below 2013 levels
Industrial segment organic 4-7%; GE Capital 0-(5)%
2014 drivers
Industrial ++
GE Capital ~$7B
Corporate −
Total operating earnings +
CFOA $14-17B
Total revenues 0-5%
Operating earnings
Strong Industrial segment outlook Significant restructuring to drive margins
42 JRI December Analyst 12-18-13
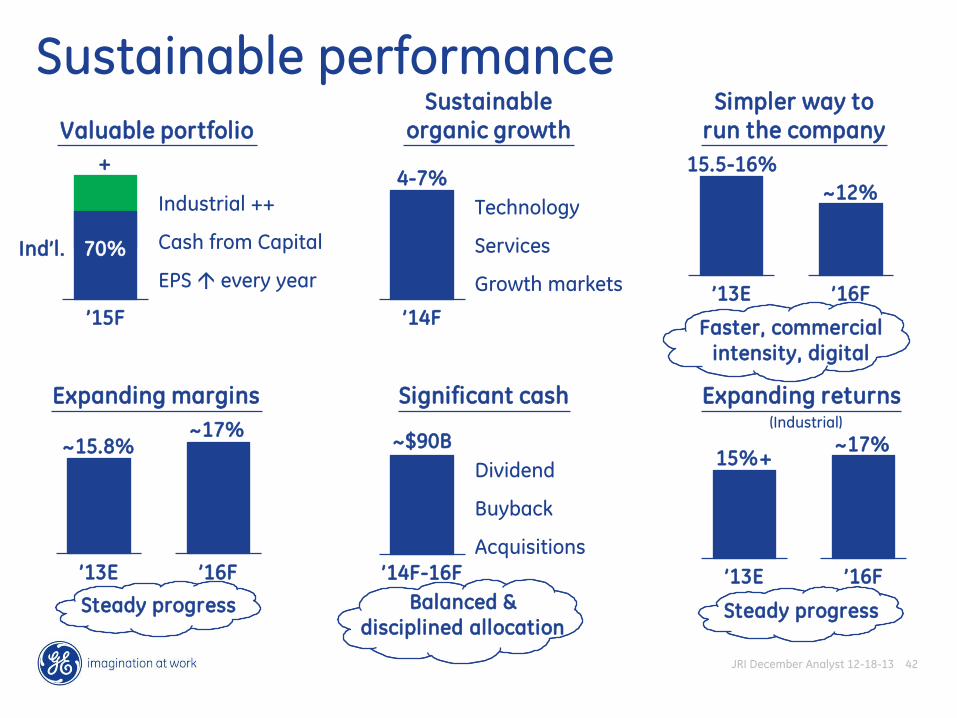
Sustainable performance
Valuable portfolio
Sustainable organic growth
Ind’l. 70%
+
’15F
Industrial ++
Cash from Capital
EPS every year
4-7%
’14F
Technology
Services
Growth markets
Simpler way to run the company
Significant cash Expanding returns
15%+
’13E ’16F
~17%
Steady progress
~$90B
’14F-16F
Dividend
Buyback
Acquisitions
15.5-16%
’13E ’16F
~12%
Faster, commercial
intensity, digital
(Industrial)
Expanding margins
~15.8%
’13E ’16F
~17%
Steady progress Balanced &
disciplined allocation

43 JRI December Analyst 12-18-13
Leadership
Linkage
+ EPS and Industrial %
+ Cash and ROTC
EPS growth
Cash generation
Grow % Industrial earnings
Increase ROTC/margins
Compensation drivers Culture drivers
Simplification Customer Day
Lean structure
Speed & competitiveness
Commercial intensity
Digital foundation