GE 1Q 2017 EARNINGS · PDF fileG 1 2017 ARNINGS APRIL 21, 2017 2 GE is continuing its...
12
The first quarter was a strong start to the year with organic revenues* +7%, orders +10%, and Industrial operating margin* +130 bps. We delivered $0.21 of Industrial operating + Verticals* earnings per share, flat as reported, but +12% excluding gains and restructuring.* We returned $4.4 billion to shareowners through dividends and buyback. Industrial operating cash flows* were negative $1.6 billion driven primarily by an increase in working capital and timing of billings on our long-term equipment and service contracts. We expect cash flows to improve throughout the remainder of the year, with no change to our full year cash flow framework. We reaffirm our 2017 operating framework for Industrial operating + Verticals EPS,* organic revenue growth* and Industrial operating margin* expansion. —Jeff Immelt, Chairman and CEO GE 1Q 2017 EARNINGS APRIL 21, 2017 EARNINGS/EPS REVENUES MARGINS CONTINUING OPS/EPS -a) NET EARNINGS/EPS -a) TOTAL REVENUES INDUSTRIAL MARGIN $0.9B EPS: $0.10, +233% $0.6B EPS: $0.07, +$0.08 $27.7B (1)% 6.0% (40) bps INDUSTRIAL OPERATING + VERTICALS/EPS INDUSTRIAL SEGMENT ORGANIC REVENUES INDUSTRIAL OP MARGIN -b) $1.8B EPS: $0.21, 0% $26.0B +7% 12.6% +130 bps -a) Amounts attributable to GE common shareowners -b) Excludes gains and restructuring and other items * Non-GAAP measure We present both GAAP and non-GAAP measures to provide investors with additional information. The non-GAAP measures are focused on our ongoing operations and may exclude the effects of gains/losses on business dispositions, non-operating pension costs, and restructuring & other charges. See pages 7-12 for reconciliations between these GAAP and non-GAAP measures and the specific reasons why we provide these non-GAAP measures. GAAP NON- GAAP Continuing operations EPS (GAAP) of $0.10, +233% Industrial operating + Verticals EPS (non-GAAP) of $0.21, 0% Industrial segment revenues +1%, +7% organically;* and operating profit +9%, +15% organically* Backlog $324 billion, +3% vs 1Q’16; Orders +10% Returned $4.4 billion in cash to shareowners; $2.3 billion through buyback BACKLOG ORDERS GE CFOA CASH TO SHAREOWNERS $0.4B $2.0 $7.5 $7.9B (95)% GE Capital dividend Industrial CFOA* 1Q’16 1Q’17 $2.0 $7.5 $0.4 $(1.6) 1Q’17 1Q’16 $25.7B $12.3 $12.4 $13.4 $23.5B +10% Equipment Services $11.0 1Q’17 1Q’16 $324.3B $228.2 $240.4 $87.9 $316.1B +3% Equipment Services $83.9 $4.4B 1Q’17 $2.3 BILLION THROUGH BUYBACK GE 1Q 2017 EARNINGS
Transcript of GE 1Q 2017 EARNINGS · PDF fileG 1 2017 ARNINGS APRIL 21, 2017 2 GE is continuing its...

The first quarter was a strong start to the year with organic revenues* +7%, orders +10%, and Industrial operating margin* +130 bps. We delivered $0.21 of Industrial operating + Verticals* earnings per share, flat as reported, but +12% excluding gains and restructuring.* We returned $4.4 billion to shareowners through dividends and buyback. Industrial operating cash flows* were negative $1.6 billion driven primarily by an increase in working capital and timing of billings on our long-term equipment and service contracts. We expect cash flows to improve throughout the remainder of the year, with no change to our full year cash flow framework. We reaffirm our 2017 operating framework for Industrial operating + Verticals EPS,* organic revenue growth* and Industrial operating margin* expansion. —Jeff Immelt, Chairman and CEO
GE 1Q 2017 EARNINGS APRIL 21, 2017
EARNINGS/EPS REVENUES MARGINS
CONTINUING OPS/EPS-a)
NET EARNINGS/EPS-a)
TOTAL REVENUES
INDUSTRIAL MARGIN
$0.9BEPS: $0.10, +233%
$0.6BEPS: $0.07, +$0.08
$27.7B(1)%
6.0%(40) bps
INDUSTRIAL OPERATING + VERTICALS/EPS
INDUSTRIAL SEGMENT ORGANIC REVENUES
INDUSTRIAL OP MARGIN-b)
$1.8BEPS: $0.21, 0%
$26.0B+7%
12.6%+130 bps
-a) Amounts attributable to GE common shareowners -b) Excludes gains and restructuring and other items * Non-GAAP measure
We present both GAAP and non-GAAP measures to provide investors with additional information. The non-GAAP measures are focused on our ongoing operations and may exclude the effects of gains/losses on business dispositions, non-operating pension costs, and restructuring & other charges. See pages 7-12 for reconciliations between these GAAP and non-GAAP measures and the specific reasons why we provide these non-GAAP measures.
GAAP
NON- GAAP
Continuing operations EPS (GAAP) of $0.10, +233% Industrial operating + Verticals EPS (non-GAAP) of $0.21, 0%
Industrial segment revenues +1%, +7% organically;* and operating profit +9%, +15% organically* Backlog $324 billion, +3% vs 1Q’16; Orders +10%
Returned $4.4 billion in cash to shareowners; $2.3 billion through buyback
BACKLOGORDERSGE CFOA CASH TO SHAREOWNERS
$0.4B
$2.0
$7.5
$7.9B
(95)%
GE Capital dividend Industrial CFOA*
1Q’16 1Q’17
$2.0
$7.5
$0.4$(1.6) 1Q’171Q’16
$25.7B
$12.3
$12.4 $13.4
$23.5B
+10%
Equipment Services
$11.0
1Q’171Q’16
$324.3B
$228.2 $240.4
$87.9$316.1B
+3%
Equipment Services
$83.9
$4.4B1Q’17
$2.3 BILLION THROUGH BUYBACK
GE 1Q 2017 EARNINGS

GE 1Q 2017 EARNINGS APRIL 21, 2017
2
GE is continuing its portfolio transformation and investing in innovations in GE Digital and GE Additive. Our planned combination of GE Oil & Gas and Baker Hughes-a) remains on track, and we expect the deal to close in mid-2017. We are executing a $2 billion cost out program over 2017 and 2018 to deliver more value to our customers, shareowners, and employees. — Jeff Immelt, Chairman and CEO
INDUSTRIAL DEAL HIGHLIGHTS
POWER:
• Two HA gas turbine orders with our first in China. 30 HA units in backlog
• Order for three F gas turbines, three steam turbines, three HRSGs, and other equipment for Bechtel to help power New York’s Cricket Valley Energy Center
• Announced $3.4 billion sale of GE Water to Suez, expected to close by mid-2017-a)
RENEWABLE ENERGY:
• Closed $1.65 billion LM Wind Power acquisition in 2Q’17
• Signed agreement to supply 58 GE 3.4MW wind turbines to Silverton Wind Farm, sixth largest in Australia
• Selected to deliver three Haliade turbines in China; first to supply for offshore projects on 3 continents (Europe, Asia, North America)
OIL & GAS:
• Launched LM9000 turbine using GE Aviation technology to deliver higher performance and lower emissions
• Selected to provide eight Integrated Compressor Line units to Open Grid Europe and Trans Austria Gasleitung GmbH
HEALTHCARE:
• Acquired U.K.’s Monica Healthcare to enhance mobile and digital offerings
• Announced $40 million capacity expansion at MR production plant in South Carolina
• Won ~$40 million contract to supply multi-modal equipment and solutions to Hainan Tumor Hospital in China
TRANSPORTATION:
• Signed agreement with DB Cargo to digitize 250 non-GE locomotives with GE’s Predix APM
• Delivered 25 GE Evo Series locomotives to Pakistan Railways
• Won order for 22 Tier 4 locomotives from a Class 1 North American customer
ENERGY CONNECTIONS:
• Partnered with Noble Corporation to deploy marine Asset Performance Management, aiming for a 20% reduction in operational expenditures on select Noble rigs
AVIATION:
• Won $2 billion valued commitment-b) from Singapore Airlines for 45 GE9X engines
• LEAP engine orders and commitments reached 12,200; world’s fastest-selling jet engine
• LEAP-1B powered Boeing 737MAX achieved FAA certification
• Acquired AirVault to digitally manage asset lifecycles and maintenance
GLOBAL GROWTH:
• Launched first UAE microfactory for the region with GE Additive, Mubadala, and Dubai Future Foundation
CURRENT, POWERED BY GE:
• GE and City of San Diego announced a $30 million investment to deploy world’s largest smart city sensor platform
• Announced 13 new solar projects to provide 17MW of clean energy across 5 U.S. states
DIGITAL:
• Developers on Predix: 26,000+
• Total Digital orders: ~$950 million, + 7%
• Completed acquisition of ServiceMax for $0.9 billion
• Announced the release of a comprehensive APM solution, powered by Meridium and Predix, to help reduce unplanned downtime
CAPITAL:
• Enabled $2.2 billion of industrial orders in 1Q’17
GE CAPITAL HIGHLIGHTS
-a) Subject to customary closing conditions, including approval by regulators and for Baker Hughes, approval by Baker Hughes shareholders-b) Valued at list price* Non-GAAP measure
• Closed $7 billion of asset sales in 1Q’17, reaching $198 billion since GE Capital Exit Plan originally announced; all major transactions are completed
• Exited consolidated supervision by the U.K. Prudential Regulation Authority
• $2 billion of dividends paid to GE in 1Q’17 and additional $2 billion dividend in April 2017
GE CAPITAL EARNINGS (LOSS) WALK 1Q’17
Verticals $535MMOther Continuing $(582)MM
Capital $(47)MMDiscontinued operations $(242)MM
GE Capital $(290)MM

GE 1Q 2017 EARNINGS APRIL 21, 2017
3
Related charts are now posted on our website for your review prior to the call.
www.ge.com/investor
First-quarter results webcast at 8:30 a.m. ET today
In this document, we sometimes use information derived from consolidated financial data but not presented in our financial statements prepared in accordance with U.S. generally accepted accounting principles (GAAP). Certain of these data are considered “non-GAAP financial measures” under the U.S. Securities and Exchange Commission rules. These non-GAAP financial measures supplement our GAAP disclosures and should not be considered an alternative to the GAAP measure. We have referred to:
• Industrial operating and GE Capital earnings (loss) from continuing operations and EPS
• Industrial operating + Verticals earnings and EPS• Industrial operating + Verticals earnings and EPS excluding gains
and restructuring• Industrial operating profit margin (excluding certain items)• Industrial segment organic revenues • Industrial segment organic operating profit• Industrial cash flows from operating activities (Industrial CFOA)• 2017 operating framework including 2017 Industrial operating
+ Verticals EPS targets
The reasons we use these non-GAAP financial measures and the reconciliation to their most directly comparable GAAP financial measure are included in the accompanying tables, which include information integral to assessing the Company’s financial position, operating performance and cash flows.
NOTE: Amounts reported in billions in graphs within this release are computed based on the amounts in millions. As a result, the sum of the components reported in billions may not equal the total amount reported in billions due to rounding. Certain columns and rows within the tables may not add due to the use of rounded numbers. Percentages presented are calculated from the underlying numbers in millions.
Caution Concerning Forward-Looking Statements:This document contains “forward-looking statements” — that is, statements related to future events that by their nature address matters that are, to different degrees, uncertain. For details on the uncertainties that may cause our actual future results to be materially different than those expressed in our forward-looking statements, visit http://www.ge.com/investor-relations/disclaimer-caution-concerning-forward-looking-statements as well as our annual reports on Form 10-K and quarterly reports on Form 10-Q. We do not undertake to update our forward-looking statements. This document also includes certain forward-looking projected financial information that is based on current estimates and forecasts. Actual results could differ materially.
General Electric Capital Corporation (GECC) was merged into GE in 2015 and our financial services business is now operated by GE Capital Global Holdings LLC (GECGH). In this document, we refer to GECC and GECGH as “GE Capital.” We refer to the industrial businesses of the Company including GE Capital on an equity basis as “GE.” “GE (ex-GE Capital)” and /or “Industrial” refer to GE excluding GE Capital.
Investor Contact: Matt Cribbins, 617.443.3400 [email protected]
Media Contact: Jennifer Erickson, 646.682.5620 [email protected]
GE’s Investor Relations website at www.ge.com/investor-relations and our corporate blog at www.gereports.com, as well as GE’s Facebook page and Twitter accounts, and other social media, including @GE_Reports, contain a significant amount of information about GE, including financial and other information for investors. GE encourages investors to visit these websites from time to time, as information is updated and new information is posted.

GE 1Q 2017 EARNINGS APRIL 21, 2017
4
GENERAL ELECTRIC COMPANY CONDENSED STATEMENT OF EARNINGS (LOSS) (UNAUDITED) Consolidated GE(a) Financial Services (GE Capital) Three months ended March 31 2017 2016 V% 2017 2016 V% 2017 2016 V% Revenues and other income Sales of goods and services $ 25,228 $ 25,314 -% $ 25,392 $ 25,407 -% $ 29 $ 25 16% Other income 168 9 137 92 - - GE Capital earnings (loss) from continuing operations - - (47) (892) - - GE Capital revenues from services 2,264 2,522 - - 2,652 2,860 Total revenues and other income 27,660 27,845 (1)% 25,481 24,607 4% 2,681 2,885 (7)% Costs and expenses Cost of sales 20,359 20,362 19,974 19,891 585 589 Selling, general and administrative expenses 4,506 4,608 4,020 3,982 574 874 Interest and other financial charges 1,139 1,736 564 440 812 1,430 Investment contracts, insurance losses and insurance annuity benefits 634 642 - - 636 671 Other costs and expenses 190 259 - - 214 268 Total costs and expenses 26,829 27,606 (3)% 24,558 24,313 1% 2,820 3,833 (26)% Earnings (loss) from continuing operations before income taxes 832 238 F 923 294 F (139) (948) 85% Benefit (provision) for income taxes (16) 177 (143) (164) 128 341 Earnings (loss) from continuing operations 816 415 97% 780 130 F (11) (608) 98% Earnings (loss) from discontinued operations, net of taxes (239) (308) (239) (309) (242) (308) Net earnings (loss) 577 107 F 541 (178) F (253) (916) 72% Less net earnings (loss) attributable to noncontrolling interests (76) (121) (78) (117) 2 (4) Net earnings (loss) attributable to the Company 653 228 F 619 (61) F (256) (912) 72% Preferred stock dividends (34) (289) - - (34) (289) Net earnings (loss) attributable to GE common shareowners $ 619 $ (61) F $ 619 $ (61) F $ (290) $ (1,201) 76% Amounts attributable to GE common shareowners: Earnings (loss) from continuing operations $ 816 $ 415 97% $ 780 $ 130 F $ (11) $ (608) 98% Less net earnings (loss) attributable to noncontrolling interests, continuing operations (76) (122) (78) (117) 2 (4) Earnings (loss) from continuing operations attributable to the Company 892 537 66% 858 248 F (13) (603) 98% Preferred stock dividends (34) (289) - - (34) (289) Earnings (loss) from continuing operations attributable to GE common shareowners 858 248 F 858 248 F (47) (892) 95% Earnings (loss) from discontinued operations, net of taxes (239) (308) (239) (309) (242) (308) Less net earnings (loss) attributable to noncontrolling interests, discontinued operations - - - - - - Net earnings (loss) attributable to GE common shareowners $ 619 $ (61) F $ 619 $ (61) F $ (290) $ (1,201) 76% Per-share amounts - earnings (loss) from continuing operations Diluted earnings (loss) per share $ 0.10 $ 0.03 F Basic earnings (loss) per share $ 0.10 $ 0.03 F Per-share amounts - net earnings (loss) Diluted earnings (loss) per share $ 0.07 $ (0.01) F Basic earnings (loss) per share $ 0.07 $ (0.01) F Total average equivalent shares Diluted 8,811 9,383 (6)% Basic 8,714 9,288 (6)% Dividends declared per common share $ 0.24 $ 0.23 4% (a) Represents the adding together of all affiliated companies except GE Capital, which is presented on a one-line basis.
Amounts may not add due to rounding. Dollar amounts and share amounts in millions; per-share amounts in dollars.
“GE Capital” means GE Capital Global Holdings, LLC (GECGH) and its predecessor General Electric Capital Corporation (GECC) and all of their affiliates and associated companies. Separate information is shown for “GE” and “Financial Services (GE Capital).” Transactions between GE and GE Capital have been eliminated from the “Consolidated” column. See Note 1 to the 2016 consolidated financial statements at www.ge.com/ar2016 for further information about consolidation matters.

GE 1Q 2017 EARNINGS APRIL 21, 2017
5
GENERAL ELECTRIC COMPANY SUMMARY OF OPERATING SEGMENTS (UNAUDITED)
Three months ended March 31 (Dollars in millions) 2017 2016 V% Revenues(a) Power $ 6,089 $ 5,204 17 % Renewable Energy 2,044 1,669 22 % Oil & Gas 3,001 3,314 (9)% Aviation 6,804 6,262 9 % Healthcare 4,291 4,183 3 % Transportation 1,039 981 6 % Energy Connections & Lighting(b) 2,747 4,256 (35)% Total industrial segment revenues 26,016 25,869 1 % Capital 2,681 2,885 (7)% Total segment revenues 28,697 28,754 - % Corporate items and eliminations(a) (1,037) (909) Consolidated revenues and other income from continuing operations $ 27,660 $ 27,845 (1)% Segment profit (loss)(a) Power $ 797 $ 573 39 % Renewable Energy 107 83 29 % Oil & Gas 207 308 (33)% Aviation 1,684 1,524 10 % Healthcare 643 631 2 % Transportation 156 164 (5)% Energy Connections & Lighting(b) 28 31 (10)% Total industrial segment profit 3,622 3,314 9 % Capital (47) (892) 95 % Total segment profit (loss) 3,575 2,422 48 % Corporate items and eliminations(a) (2,009) (1,571) GE interest and other financial charges (564) (440) GE provision for income taxes (143) (164) Earnings (loss) from continuing operations attributable to GE common shareowners 858 248 F Earnings (loss) from discontinued operations, net of taxes (239) (308) 22 % Less net earnings attributable to noncontrolling interests, discontinued operations - - - % Earnings (loss) from discontinued operations, net of tax and noncontrolling interest (239) (309) 23 % Consolidated net earnings (loss) attributable to GE common shareowners $ 619 $ (61) F (a) Segment revenues include revenues and other income related to the segment. Segment profit excludes results reported as discontinued
operations and material accounting changes, the portion of earnings or loss attributable to noncontrolling interests of consolidated subsidiaries, and as such only includes the portion of earnings or loss attributable to our share of the consolidated earnings or loss of consolidated subsidiaries. Segment profit excludes or includes interest and other financial charges and income taxes according to how a particular segment’s management is measured – excluded in determining segment profit, which we sometimes refer to as “operating profit,” for Power, Renewable Energy, Oil & Gas, Aviation, Healthcare, Transportation and Energy Connections & Lighting; included in determining segment profit, which we sometimes refer to as “net earnings,” for Capital. Certain corporate costs, such as shared services, employee benefits and information technology are allocated to our segments based on usage. A portion of the remaining corporate costs are allocated based on each segment’s relative net cost of operations. Total industrial segment revenues and profit include the sum of our seven industrial reporting segments without giving effect to the elimination of transactions among such segments. Total segment revenues and profit include the sum of our seven industrial segments and one financial services segment, without giving effect to the elimination of transactions among such segments. We believe that this provides investors with a view as to the results of all of our segments, without inter-segment eliminations and corporate items.
(b) Beginning in the third quarter of 2016, the former Energy Connections and Appliances & Lighting segments are presented as one reporting segment called Energy Connections & Lighting. This segment includes the historical results of the Appliances business prior to its sale in June 2016.
Amounts may not add due to rounding

GE 1Q 2017 EARNINGS APRIL 21, 2017
6
GENERAL ELECTRIC COMPANY CONDENSED STATEMENT OF FINANCIAL POSITION (UNAUDITED)
Consolidated GE(a) Financial Services (GE Capital) March 31, December 31, March 31, December 31, March 31, December 31,
(Dollars in billions) 2017 2016 2017 2016 2017 2016 Assets Cash and marketable securities(b) $ 83.5 $ 92.4 $ 8.1 $ 10.7 $ 75.4 $ 81.8 Receivables 21.7 24.1 12.6 12.7 - - Inventories 22.7 22.4 22.6 22.3 0.1 0.1 GE Capital financing receivables - net 12.2 12.2 - - 23.9 26.0 Property, plant & equipment - net 49.0 50.5 19.0 19.1 31.0 32.2 Receivable from GE Capital (debt assumption) - - 50.3 58.8 - - Investment in GE Capital - - 22.8 24.7 - - Goodwill & intangible assets 86.8 86.9 84.2 84.2 2.7 2.7 Contract assets 27.4 25.2 27.4 25.2 - - Other assets 34.4 35.0 18.5 18.7 24.6 25.4 Assets of businesses held for sale 4.1 1.7 3.8 1.6 - - Assets of discontinued operations 9.8 14.8 - - 9.8 14.8 Total assets $ 351.6 $ 365.2 $ 269.2 $ 277.9 $ 167.3 $ 183.0 Liabilities and equity Borrowings(c) $ 128.7 $ 136.2 $ 74.0 $ 79.3 $ 106.1 $ 117.3 Investment contracts, insurance liabilities and insurance annuity benefits 26.3 26.1 - - 26.9 26.5 Non-current compensation and benefits 43.0 43.8 42.1 42.8 1.0 1.0 Other liabilities 71.5 73.8 73.1 74.9 8.5 9.0 Liabilities of businesses held for sale 1.1 0.7 1.1 0.7 - - Liabilities of discontinued operations 1.7 4.2 - - 1.7 4.1 Redeemable noncontrolling interest 3.1 3.0 3.1 3.0 - - GE shareowners' equity 74.5 75.8 74.5 75.8 22.8 24.7 Noncontrolling interests 1.6 1.7 1.4 1.4 0.3 0.3 Total liabilities and equity $ 351.6 $ 365.2 $ 269.2 $ 277.9 $ 167.3 $ 183.0 (a) Represents the adding together of all affiliated companies except GE Capital, which is presented on a one-line basis. (b) At March 31, 2017, GE Capital maintained liquidity sources of $43.4 billion that consisted of cash and equivalents of $33.7 billion, high-quality
investments of $8.9 billion and cash and equivalents of $0.8 billion classified as assets of discontinued operations. Additionally, at March 31, 2017, GE has $20 billion of committed unused credit lines. Credit lines maintained at GE Company since December 2015, but can be drawn and lent to GE Capital upon request.
(c) GE Capital borrowings includes commercial paper of $5 billion for both periods ended March 31, 2017, and December 31, 2016. Amounts may not add due to rounding
“GE Capital” means GE Capital Global Holdings, LLC (GECGH) and its predecessor General Electric Capital Corporation (GECC) and all of their affiliates and associated companies. Separate information is shown for “GE” and “Financial Services (GE Capital).” Transactions between GE and GE Capital have been eliminated from the “Consolidated” column. See Note 1 to the 2016 consolidated financial statements at www.ge.com/ar2016 for further information about consolidation matters.

GE 1Q 2017 EARNINGS APRIL 21, 2017
7
GENERAL ELECTRIC COMPANY Financial Measures That Supplement GAAP
We sometimes use financial measures derived from consolidated financial information but not presented in our financial statements prepared in accordance with U.S. generally accepted accounting principles (GAAP). Certain of these are considered “non-GAAP financial measures” under the U.S. Securities and Exchange Commission rules. The following non-GAAP financial measures supplement our GAAP disclosures and should not be considered an alternative to the GAAP measure. Industrial operating and GE Capital earnings (loss) from continuing operations and EPS
Industrial operating + Verticals earnings and EPS (and excluding gains and restructuring)
Industrial operating profit and operating profit margin (excluding certain items)
Industrial segment organic revenues
Industrial segment organic operating profit Industrial cash flows from operating activities (Industrial CFOA) 2017 operating framework including 2017 Industrial operating + Verticals EPS target
The reasons we use these non-GAAP financial measures and the reconciliations to their most directly comparable GAAP financial measures follow. Certain columns, rows or percentages within these reconciliations may not add or recalculate due to the use of rounded numbers. Totals and percentages presented are calculated from the underlying numbers in millions.

GE 1Q 2017 EARNINGS APRIL 21, 2017
8
INDUSTRIAL OPERATING AND GE CAPITAL EARNINGS (LOSS) FROM CONTINUING OPERATIONS AND EPS Three months ended March 31 (Dollars in millions; except per share amounts) 2017 2016 V% Consolidated earnings from continuing operations attributable to GE common shareowners (GAAP) $ 858 $ 248 F Non-operating pension costs 578 512 Tax effect on non-operating pension costs(a) (202) (179) Adjustment: non-operating pension costs (net of tax) 376 333 Operating earnings (Non-GAAP) $ 1,234 $ 581 F Adjustment: GE Capital (loss) from continuing operations attributable to GE common shareowners (47) (892) Industrial operating earnings (Non-GAAP) $ 1,281 $ 1,473 (13)% Earnings (loss) per share (EPS) - diluted(b) Consolidated EPS from continuing operations attributable to GE common shareowners (GAAP) $ 0.10 $ 0.03 F Adjustment: non-operating pension costs (net of tax) 0.04 0.04 Operating EPS (Non-GAAP) 0.14 0.06 F Adjustment: GE Capital EPS from continuing operations attributable to GE common shareowners (GAAP) (0.01) (0.10) 90% Industrial operating EPS (Non-GAAP) $ 0.14 $ 0.16 (13)% (a) The tax effect on non-operating pension costs was calculated using a 35% U.S. federal statutory tax rate, based on its applicability to such
cost. (b) Earnings (loss) per-share amounts are computed independently. As a result, the sum of per-share amounts may not equal the total.
Operating earnings (loss) excludes non-service related pension costs of our principal pension plans comprising interest cost, expected return on plan assets and amortization of actuarial gains/losses. The service cost, prior service cost and any curtailment gain or loss components of our principal pension plans are included in operating earnings. We believe that these components of pension cost better reflect the ongoing service-related costs of providing pension benefits to our employees. As such, we believe that our measure of operating earnings (loss) provides management and investors with a useful measure of the operational results of our business. Other components of GAAP pension cost are mainly driven by capital allocation decisions and market performance, and we manage these separately from the operational performance of our businesses. Neither GAAP nor operating pension costs are necessarily indicative of the current or future cash flow requirements related to our pension plans. We believe that this measure, considered along with the corresponding GAAP measure, provides management and investors with additional information for comparison of our operating results to the operating results of other companies. We also believe that presenting operating earnings separately for our industrial businesses provides management and investors with useful information about the relative size of our industrial and financial services businesses in relation to the total company.

GE 1Q 2017 EARNINGS APRIL 21, 2017
9
INDUSTRIAL OPERATING + VERTICALS EARNINGS AND EPS (AND EXCLUDING GAINS AND RESTRUCTURING) Three months ended March 31 (Dollars in millions; except per share amounts) 2017 2016 V% GE Capital earnings (loss) from continuing operation attributable to GE common shareowners (GAAP) $ (47) $ (892) 95% Adjustment: GE Capital other continuing earnings (loss) (Other Capital) (582) (1,389) Verticals earnings(a) $ 535 $ 496 8% Industrial operating earnings (Non-GAAP) 1,281 $ 1,473 (13)% Industrial operating earnings + Verticals earnings (Non-GAAP) $ 1,816 $ 1,970 (8)% Adjustment: Gains (net of tax) 1 38 Adjustment: Restructuring (net of tax) (714) (483) Industrial operating earnings + Verticals earnings, excluding gains & restructuring (Non-GAAP) $ 2,529 2,415 5% Earnings (loss) per share (EPS) - diluted(b)
GE Capital EPS from continuing operation attributable to GE common shareowners (GAAP) (0.01) (0.10) 90% Adjustment: GE Capital other continuing EPS (Other Capital EPS) (0.07) (0.15) 53% Verticals EPS $ 0.06 $ 0.05 20%
Industrial operating EPS (Non-GAAP) 0.14 0.16 Industrial operating + Verticals EPS (Non-GAAP) $ 0.21 $ 0.21 -% Adjustment: Gains (net of tax) per share - - Adjustment: Restructuring (net of tax) per share (0.08) (0.05) Industrial operating earnings + Verticals earnings EPS, excluding gains & restructuring per share (Non-GAAP) $ 0.29 $ 0.26 12% (a) Verticals include businesses expected to be retained (GECAS, Energy Financial Services, Industrial Finance, and run-off Insurance), including
allocated corporate after tax costs of $25 million in both the three months ended March 31, 2017 and 2016. (b) Earnings-per-share amounts are computed independently. As a result, the sum of per-share amounts may not equal the total.
As described above, Verticals represents the GE Capital businesses that we expect to retain. We believe that presenting Industrial operating + Verticals earnings-per-share amounts provides management and investors with a useful measure to evaluate the performance of the businesses we expect to retain after the disposition of most of our financial services business. We have also presented our Industrial operating + Verticals earnings and EPS excluding gains and restructuring and other charges. We believe that Industrial operating + Verticals earnings and EPS adjusted for these items are meaningful measures because they increase the comparability of period-to-period results.

GE 1Q 2017 EARNINGS APRIL 21, 2017
10
INDUSTRIAL OPERATING PROFIT AND OPERATING PROFIT MARGIN (EXCLUDING CERTAIN ITEMS) Three months ended March 31 (Dollars in millions) 2017 2016 Revenues GE total revenues and other income $ 25,481 $ 24,607 Less: GE Capital earnings (loss) from continuing operations (47) (892) GE revenues and other income excluding GE Capital earnings (loss) (Industrial revenues) (GAAP) $ 25,528 $ 25,499 Less: gains on disposals 2 59 Adjusted Industrial revenues (Non-GAAP) $ 25,526 $ 25,440 Costs GE total costs and expenses $ 24,558 $ 24,313 Less: GE interest and other financial charges 564 440 Industrial costs excluding interest and other financial charges (GAAP) $ 23,994 $ 23,873 Less: non-operating pension costs 578 512 Less: restructuring and other charges 1,020 686 Less: noncontrolling interests 78 117 Adjusted Industrial costs (Non-GAAP) $ 22,318 $ 22,558 Industrial profit (GAAP) $ 1,534 $ 1,626 Industrial margins (GAAP) 6.0% 6.4% Industrial operating profit (Non-GAAP) $ 3,208 $ 2,883 Industrial operating profit margins (Non-GAAP) 12.6% 11.3% We have presented our Industrial operating profit and operating profit margin excluding gains, non-operating pension costs, restructuring and other charges, and noncontrolling interests. We believe that Industrial operating profit and operating profit margin adjusted for these items are meaningful measures because they increase the comparability of period-to-period results. INDUSTRIAL SEGMENT ORGANIC REVENUES Three months ended March 31 (Dollars in millions) 2017 2016 V% Industrial segment revenues (GAAP) $ 26,016 $ 25,869 1% Adjustments: Acquisitions 132 1 Business dispositions 10 1,556 Currency exchange rates (108) - Industrial segment organic revenues (Non-GAAP) $ 25,981 $ 24,312 7% Organic revenue growth measures revenue growth excluding the effects of acquisitions, business dispositions and currency exchange rates. We believe that this measure provides management and investors with a more complete understanding of underlying operating results and trends of established, ongoing operations by excluding the effect of acquisitions, dispositions and currency exchange, which activities are subject to volatility and can obscure underlying trends. We also believe that presenting organic revenue growth separately for our industrial businesses provides management and investors with useful information about the trends of our industrial businesses and enables a more direct comparison to other non-financial businesses and companies. Management recognizes that the term "organic revenue growth" may be interpreted differently by other companies and under different circumstances. Although this may have an effect on comparability of absolute percentage growth from company to company, we believe that these measures are useful in assessing trends of the respective businesses or companies and may therefore be a useful tool in assessing period-to-period performance trends.
GE 1Q 2017 EARNINGS APRIL 21, 2017
11
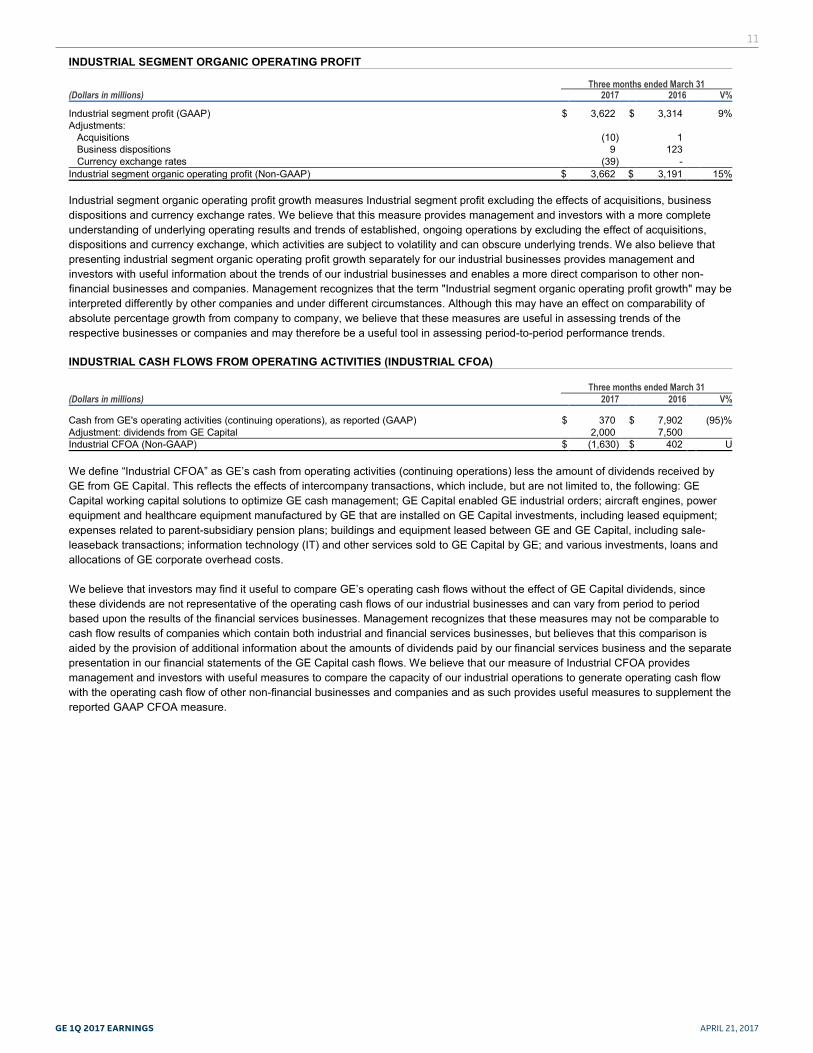
INDUSTRIAL SEGMENT ORGANIC OPERATING PROFIT Three months ended March 31 (Dollars in millions) 2017 2016 V% Industrial segment profit (GAAP) $ 3,622 $ 3,314 9% Adjustments: Acquisitions (10) 1 Business dispositions 9 123 Currency exchange rates (39) - Industrial segment organic operating profit (Non-GAAP) $ 3,662 $ 3,191 15% Industrial segment organic operating profit growth measures Industrial segment profit excluding the effects of acquisitions, business dispositions and currency exchange rates. We believe that this measure provides management and investors with a more complete understanding of underlying operating results and trends of established, ongoing operations by excluding the effect of acquisitions, dispositions and currency exchange, which activities are subject to volatility and can obscure underlying trends. We also believe that presenting industrial segment organic operating profit growth separately for our industrial businesses provides management and investors with useful information about the trends of our industrial businesses and enables a more direct comparison to other non-financial businesses and companies. Management recognizes that the term "Industrial segment organic operating profit growth" may be interpreted differently by other companies and under different circumstances. Although this may have an effect on comparability of absolute percentage growth from company to company, we believe that these measures are useful in assessing trends of the respective businesses or companies and may therefore be a useful tool in assessing period-to-period performance trends. INDUSTRIAL CASH FLOWS FROM OPERATING ACTIVITIES (INDUSTRIAL CFOA) Three months ended March 31 (Dollars in millions) 2017 2016 V% Cash from GE's operating activities (continuing operations), as reported (GAAP) $ 370 $ 7,902 (95)% Adjustment: dividends from GE Capital 2,000 7,500 Industrial CFOA (Non-GAAP) $ (1,630) $ 402 U We define “Industrial CFOA” as GE’s cash from operating activities (continuing operations) less the amount of dividends received by GE from GE Capital. This reflects the effects of intercompany transactions, which include, but are not limited to, the following: GE Capital working capital solutions to optimize GE cash management; GE Capital enabled GE industrial orders; aircraft engines, power equipment and healthcare equipment manufactured by GE that are installed on GE Capital investments, including leased equipment; expenses related to parent-subsidiary pension plans; buildings and equipment leased between GE and GE Capital, including sale-leaseback transactions; information technology (IT) and other services sold to GE Capital by GE; and various investments, loans and allocations of GE corporate overhead costs. We believe that investors may find it useful to compare GE’s operating cash flows without the effect of GE Capital dividends, since these dividends are not representative of the operating cash flows of our industrial businesses and can vary from period to period based upon the results of the financial services businesses. Management recognizes that these measures may not be comparable to cash flow results of companies which contain both industrial and financial services businesses, but believes that this comparison is aided by the provision of additional information about the amounts of dividends paid by our financial services business and the separate presentation in our financial statements of the GE Capital cash flows. We believe that our measure of Industrial CFOA provides management and investors with useful measures to compare the capacity of our industrial operations to generate operating cash flow with the operating cash flow of other non-financial businesses and companies and as such provides useful measures to supplement the reported GAAP CFOA measure.

GE 1Q 2017 EARNINGS APRIL 21, 2017
12
2017 OPERATING FRAMEWORK INCLUDING 2017 INDUSTRIAL OPERATING + VERTICALS EPS TARGET 2017 Industrial operating + Verticals EPS Target $1.60-1.70 Items not included in non-GAAP metric:
1) Non-operating pension cost, which we estimate to be approximately $(0.16) – (0.17) per share. 2) Capital Other continuing earnings (excluding Verticals), which we estimate to be approximately $(0.03) – (0.12) per share.
This amount is affected by, among other things: • The timing of when, and the amount by which, the Company pays down GE Capital’s outstanding debt; and • The timing and magnitude of the remaining costs associated with GE Capital’s Exit Plan.
Note: The company cannot provide an equivalent GAAP EPS guidance range without unreasonable effort because of the uncertainty of the amount and timing of events affecting earnings as we execute the GE Capital Exit Plan. Although we have attempted to estimate GE Capital’s Other continuing earnings for the purpose of explaining the probable significance of this component, as described under number 2, this calculation involves a number of unknown variables, resulting in a GAAP range that we believe is too large and variable to be meaningful.
It is also impractical to provide a reconciliation for our organic revenue, Industrial operating margin expansion and Free Cash Flow plus Dispositions targets as these involve a number of unknown variables including the effects of future acquisitions, dispositions, restructuring activities, property plant and equipment purchases and dispositions and currency exchange.