GDAE6210IDB - Solar PV in Brazil, Market Outlook to 2025 … · Solar PV in Brazil, Market Outlook...
22
Solar PV in Brazil, Market Outlook to 2025 - Capacity, Generation, Levelized Cost of Energy (LCOE), Investment Trends, Regulations and Company Profiles GDAE6210IDB/Published DEC 2012 © GlobalData. This report is a licensed product and is not to be photocopied Page (1) Solar PV in Brazil, Market Outlook to 2025 - Capacity, Generation, Levelized Cost of Energy (LCOE), Investment Trends, Regulations and Company Profiles Reference Code: GDAE6210IDB Publication Date: December 2012
Transcript of GDAE6210IDB - Solar PV in Brazil, Market Outlook to 2025 … · Solar PV in Brazil, Market Outlook...

Solar PV in Brazil, Market Outlook to 2025 - Capacity, Generation, Levelized Cost of
Energy (LCOE), Investment Trends, Regulations and Company Profiles
GDAE6210IDB/Published DEC 2012
© GlobalData. This report is a licensed product and is not to be photocopied Page (1)
Solar PV in Brazil, Market Outlook to 2025 - Capacity, Generation, Levelized Cost of Energy (LCOE), Investment Trends, Regulations and Company Profiles
Reference Code: GDAE6210IDB
Publication Date: December 2012

Table Of Contents
Solar PV in Brazil, Market Outlook to 2025 - Capacity, Generation, Levelized Cost of
Energy (LCOE), Investment Trends, Regulations and Company Profiles
GDAE6210IDB/Published DEC 2012
© GlobalData. This report is a licensed product and is not to be photocopied Page (2)
1 Table of Contents
1 Table of Contents 2
1.1 List of Tables 6
1.2 List of Figures 7
2 Executive Summary 9
2.1 Global Carbon Emissions Continue to Increase in 2010-2011 after a Slight Dip in 2009 9
2.2 Global Power Market – Increasing Focus on Clean Technologies 9
2.3 Government Support will continue to Foster the Growth of Global Renewable Power Market 9
2.4 Global Solar Photovoltaic (PV) Market Will Sustain its Growth Momentum 9
2.5 Hydropower is the Largest Power Generating Source in the Country 10
2.6 Electricity Prices in Brazil are among the Highest in the World 10
2.7 Brazil Aims to add another 10% of Electricity from Renewable Sources by 2020 11
2.8 Brazil Solar PV Market in its Nascent Stage of Development 11
3 Introduction 12
3.1 Carbon Emissions, Global, 2001-2011 12
3.2 Primary Energy Consumption, Global, 2001-2025 14
3.3 Report Guidance 16
4 Renewable Power Market, Global, 2001-2025 18
4.1 Renewable Power Market, Global, Overview 18
4.2 Renewable Power Market, Global, Cumulative Installed Capacity, MW, 2001-2025 19
4.3 Renewable Power Market, Global, Power Generation, GWh, 2001-2025 21
4.4 Renewable Power Market, Global, Cumulative Installed Capacity Split by Source Type, %, 2011
23
4.5 Renewable Power Market, Global, Net Capacity Additions by Source Type, MW, 2011-2025 24
4.6 Renewable Power Market, Global, Comparison among Power Sources 25

Table Of Contents
Solar PV in Brazil, Market Outlook to 2025 - Capacity, Generation, Levelized Cost of
Energy (LCOE), Investment Trends, Regulations and Company Profiles
GDAE6210IDB/Published DEC 2012
© GlobalData. This report is a licensed product and is not to be photocopied Page (3)
5 Solar PV Market, Global, 2001-2025 26
5.1 Solar PV Market, Global, Overview 26
5.2 Solar PV Market, Global, Installed Capacity, MW, 2001-2025 27
5.3 Solar PV Market, Global, Power Generation, GWh, 2001-2025 29
5.4 Solar PV Market, Global, Cumulative Installed Capacity Growth by Region, MW, 2011-2025 30
5.5 Solar PV Market, Global, Cumulative Installed Capacity Split by Country, %, 2011 31
5.6 Solar PV Market, Global, Net Capacity Additions in Major Countries, MW, 2011-2025 32
5.7 Solar PV Market, Global, Comparison between Key Countries 33
5.8 Solar PV Market, Global, Investment Trends, $m, 2012-2025 34
5.9 Solar PV Market, Global, Cost Analysis 35
5.9.1 Solar PV Market, Global, Cost Break-up of a Grid Connected PV System, 2011 35
5.9.2 Solar PV Market, Global, Cost Break-up of an Off-grid PV System, 2011 36
5.10 Solar PV Market, Global, LCOE in Major Countries, $/kWh, 2011 37
5.11 Solar PV Market, Global, Trade Flow Analysis of PV Modules 38
5.12 Solar PV Market, Global, Major Debt Providers, 2011 39
6 Power Market, Brazil, 2001-2025 40
6.1 Power Market, Brazil, Overview 40
6.2 Power Market, Brazil, Cumulative Installed Capacity, MW, 2001-2025 41
6.3 Power Market, Brazil, Cumulative Installed Capacity by Fuel Type, MW, 2001-2025 43
6.4 Power Market, Brazil, Power Generation by Fuel Type, GWh, 2001-2025 45
6.5 Power Market, Brazil, Net Capacity Additions by Source Type, MW, 2011-2025 47
6.6 Power Market, Brazil, Comparison of Power Sources, 2011 48
7 Renewable Power Market, Brazil, 2001-2025 49
7.1 Renewable Power Market, Brazil, Overview 49
7.2 Renewable Power Market, Brazil, Cumulative Installed Capacity by Source Type, MW, 2001-
2025 49
Table Of Contents
Solar PV in Brazil, Market Outlook to 2025 - Capacity, Generation, Levelized Cost of
Energy (LCOE), Investment Trends, Regulations and Company Profiles
GDAE6210IDB/Published DEC 2012
© GlobalData. This report is a licensed product and is not to be photocopied Page (4)
7.3 Renewable Power Market, Brazil, Cumulative Installed Capacity Split by Source Type, %, 2011
and 2025 51
7.4 Renewable Power Market, Brazil, Power Generation by Source Type, GWh, 2001-2025 52
7.5 Renewable Power Market, Brazil, Net Capacity Additions by Source Type, MW, 2011-2025 54
7.6 Renewable Power Market, Brazil, Comparison of Renewable Power Sources 55
7.7 Renewable Power Market, Brazil, LCOE Comparison, $/kWh, 2011 56
8 Solar PV Market, Brazil, 2001-2025 57
8.1 Solar PV Market, Brazil, Overview 57
8.2 Solar PV Market, Brazil, Installed Capacity, MW, 2001-2025 57
8.3 Solar PV Market, Brazil, Power Generation, GWh, 2001-2025 59
8.4 Solar PV Market, Brazil, Segmentation by On-grid and Off-grid, %, 2001-2011 61
8.5 Solar PV Market, Brazil, Investment Trends, 2011-2025 66
8.6 Solar PV Market, Brazil, Export and Import of Modules, $m, 2006-2011 68
8.7 Solar PV Market, Brazil, Carbon Savings, ‘000 Tons, 2001-2025 69
8.8 Solar PV Market, Brazil, Average Number of homes powered, 2001-2025 71
8.9 Solar PV Market, Brazil, LCOE, $/kWh, 2011-2025 72
9 Wind Power Market, Brazil, Deal Analysis 75
9.1 Wind Power Market, Brazil, Deal Value vs. Deal Volume, 2004-2011 75
9.2 Wind Power Market, Brazil, Split by Deal Type, %, 2011 76
9.3 Wind Power Market, Brazil, Asset Finance Deals, Brazil Power Market vs. Global, 2007-2011 77
9.4 Wind Power Market, Brazil, Asset Finance Deals, Comparison Among Various Renewable
Energy Sources, 2011 78
10 Renewable Energy Policy Framework, Brazil 79
10.1 Financial Incentives and Policy Support for Renewable Energy Sources, Brazil, Major Policies
79
10.1.1 Program of Incentives for Alternative Electricity Sources – Programa de Incentivo a Fontes
Alternativas de Energia Elétrica – PROINFA 79
10.1.2 Alternative Energy Auction LFA-2010 and Reserve Energy Auction LER-2010 86

Table Of Contents
Solar PV in Brazil, Market Outlook to 2025 - Capacity, Generation, Levelized Cost of
Energy (LCOE), Investment Trends, Regulations and Company Profiles
GDAE6210IDB/Published DEC 2012
© GlobalData. This report is a licensed product and is not to be photocopied Page (5)
10.1.3 Brazil National Climate Change Plan 86
10.1.4 Luz Para Todos (Light for All) Electrification Program 87
10.1.5 National Biodiesel Program (PNPB) 88
11 Wind Power Market, Brazil, Company Profiles 89
11.1 Company Snapshot: Enercon GmbH 89
11.1.1 Enercon GmbH, Company Overview 89
11.1.2 Enercon GmbH, Business Overview 90
11.1.3 Enercon GmbH, Major Products and Services 91
11.1.4 Enercon GmbH, SWOT Analysis 91
11.1.5 Enercon GmbH, Locations and Subsidiaries 96
11.2 Company Snapshot: Suzlon Energy Limited 99
11.2.1 Suzlon Energy Limited, Company Overview 99
11.2.2 Suzlon Energy Limited, Business Overview 99
11.2.3 Suzlon Energy Limited, Major Products and Services 100
11.2.4 Suzlon Energy Limited, Key Financial Performance 101
11.2.5 Suzlon Energy Limited, SWOT Analysis 102
11.2.6 Suzlon Energy Limited, Locations and Subsidiaries 105
11.3 Company Snapshot: Enel Green Power S.p.A. 110
11.3.1 Enel Green Power S.p.A., Company Overview 110
11.3.2 Enel Green Power S.p.A., Business Overview 110
11.3.3 Enel Green Power S.p.A., Major Products and Services 111
11.3.4 Enel Green Power S.p.A., Key Financial Performance 112
11.3.5 Enel Green Power S.p.A., Locations and Subsidiaries 113
11.4 Company Snapshot: Elecnor SA 114
11.4.1 Elecnor SA, Company Overview 114
11.4.2 Elecnor SA, Major Products and Services 115
11.4.3 Elecnor SA, Key Financial Performance 116
11.4.4 Elecnor SA, Locations and Subsidiaries 117
12 Appendix 120
12.1 Abbreviations 120
12.2 Market Definitions 121
12.3 Methodology 122
12.3.1 Secondary Research 122
12.3.2 Primary Research 122
12.3.3 Modeling and Forecasting 122
12.3.4 Market Estimates and Assumptions 123
12.3.5 Disclaimer 124

Table Of Contents
Solar PV in Brazil, Market Outlook to 2025 - Capacity, Generation, Levelized Cost of
Energy (LCOE), Investment Trends, Regulations and Company Profiles
GDAE6210IDB/Published DEC 2012
© GlobalData. This report is a licensed product and is not to be photocopied Page (6)
1.1 List of Tables
Table 1: Carbon Emissions, Global, MMT, 2001-2011 ............................................................................................................. 13
Table 2: Primary Energy Consumption, Global, Mtoe, 2001-2025 .......................................................................................... 15
Table 3: Renewable Power Market, Global, Cumulative Installed Capacity by Fuel Type, MW, 2001–2025 ................. 20
Table 4: Renewable Power Market, Global, Power Generation by Fuel Type, GWh, 2001–2025 ................................... 22
Table 5: Renewable Power Market, Global, Cumulative Installed Capacity Split by Source Type, %, 2001–2025 ...... 23
Table 6: Renewable Power Market, Global, Net Capacity Additions by Source Type, MW, 2011–2025 ........................ 24
Table 7: Renewable Power Market, Global, Comparison among Power Sources ............................................................... 25
Table 8: Solar PV Market, Global, Installed Capacity, MW, 2001–2025 ................................................................................ 28
Table 9: Solar PV Market, Global, Power Generation, GWh, 2001–2025 ............................................................................. 30
Table 10: Solar PV Market, Global, Cumulative Installed Capacity Split by Country, %, 2011 ........................................... 32
Table 11: Solar PV Market, Global, Net Capacity Additions in Major Countries, MW, 2011–2025 ..................................... 33
Table 12: Solar PV Market, Global, New Investment, $m, 2012-2025 ..................................................................................... 34
Table 13: Solar PV Market, Global, Cost Break-up of a Grid Connected PV System, %, 2011 .......................................... 35
Table 14: Solar PV Market, Global, Cost Break-up of an Off-grid PV System, %, 2011 ....................................................... 36
Table 15: Solar PV Market, Global, LCOE in Major Countries, $/kWh, 2011 .......................................................................... 37
Table 16: Solar PV Market, Global, Import and Export of Modules, $m, 2007–2011 ............................................................ 38
Table 17: Power Market, Brazil, Cumulative Installed Capacity, MW, 2001–2025 ................................................................ 42
Table 18: Power Market, Brazil, Cumulative Installed Capacity by Fuel Type, MW, 2001–2025 ........................................ 44
Table 19: Power Market, Brazil, Power Generation by Fuel Type, GWh, 2001–2025 .......................................................... 46
Table 20: Power Market, Brazil, Net Capacity Additions by Source Type, MW, 2011–2025 ............................................... 47
Table 21: Power Market, Brazil, Comparison Between Power Sources, 2011–2025 ............................................................ 48
Table 22: Renewable Power Market, Brazil, Cumulative Installed Capacity, MW, 2001–2025 ........................................... 50
Table 23: Renewable Power Market, Brazil, Cumulative Installed Capacity Split by Source Type, %, 2011 and 2025 . 51
Table 24: Renewable Power Market, Brazil, Power Generation by Source Type, GWh, 2001–2025 ................................ 53
Table 25: Renewable Power Market, Brazil, Net Capacity Additions by Source Type, MW, 2011–2025 .......................... 54
Table 26: Renewable Power Market, Brazil, Comparison of Renewable Power Sources, 2011 ......................................... 55
Table 27: Solar PV Market, India, Installed Capacity, MW, 2001–2025 ................................................................................... 58
Table 28: Solar PV Market, Brazil, Power Generation, GWh, 2001-2025 ............................................................................... 60
Table 29: Solar PV Market, Brazil, Cumulative Capacity Segmentation by On-grid and Off-grid, MW, 2001-2011 ........ 62
Table 30: Solar PV Market, Brazil, Annual Additions Segmentation by On-grid and Off-grid, MW, 2001-2011 ............... 63
Table 31: Solar PV Market, Brazil, Cumulative Capacity Segmentation by On-grid and Off-grid, %, 2001-2011 ............ 64
Table 32: Solar PV Market, Brazil, Annual Additions Segmentation by On-grid and Off-grid, %, 2001-2011 ................... 65
Table 33: Solar PV Market, Brazil, Capital Expenditure and New Investments, $/kW and $m, 2011-2025 ...................... 67
Table 34: Solar PV Market, Brazil, Trade Flow, $m, 2001-2011 ............................................................................................... 68
Table 35: Solar PV Market, Brazil, Carbon savings, ‘000 Tons, 2001-2025 ........................................................................... 70
Table 36: Solar PV Market, Brazil, Average Number of Homes Powered, 2001-2025 ......................................................... 72
Table 37: Solar PV Market, Brazil, Assumptions for LCOE Calculation ................................................................................... 73
Table 38: Solar PV Market, Brazil, LCOE, $/kWh, 2011-2025 ................................................................................................... 74
Table 39: Wind Power Market, Brazil, Deal Value Vs. Deal Volume, 2004-2011 ................................................................... 75
Table 40: Wind Power Market, Brazil, Split by Deal Type, %, 2011 ......................................................................................... 76
Table 41: Wind Power Market, Brazil, Asset Finance Deals, Brazil vs. Global, 2007-2011 ................................................. 77

Table Of Contents
Solar PV in Brazil, Market Outlook to 2025 - Capacity, Generation, Levelized Cost of
Energy (LCOE), Investment Trends, Regulations and Company Profiles
GDAE6210IDB/Published DEC 2012
© GlobalData. This report is a licensed product and is not to be photocopied Page (7)
Table 42: Wind Power Market, Brazil, Asset Finance Deals, Comparison Among Various Renewable Energy Sources, 2011 78
Table 43: PROINFA Implementation Under Phase One, Brazil, BID code 06/04 for 3,300 MW, 2006-2011 ................... 81
Table 44: PROINFA, Brazil, A-3 Energy Auctions, 2011............................................................................................................. 82
Table 45: PROINFA, Brazil, A-3 Energy Auctions, Technology Share by Investments, 2011 ............................................. 83
Table 46: PROINFA, Brazil, A-5 Energy Auctions, 2011............................................................................................................. 84
Table 47: PROINFA, Brazil, A-5 Energy Auctions, Technology Share by Investments, 2011 ............................................. 85
Table 48: Enercon GmbH, Major Products and Services ........................................................................................................... 91
Table 49: Enercon GmbH, SWOT Analysis ................................................................................................................................... 92
Table 50: Enercon GmbH, Other Locations and Subsidiaries ................................................................................................... 97
Table 51: Suzlon Energy Limited, Major Products and Services ............................................................................................. 100
Table 52: Suzlon Energy Limited, SWOTAnalysis ..................................................................................................................... 102
Table 53: Suzlon Energy Limited, Other Locations and Subsidiaries ..................................................................................... 106
Table 54: Enel Green Power S.p.A., Major Products and Services ........................................................................................ 111
Table 55: Enel Green power S.p.A., Other Locations and Subsidiaries ............................................................................... 113
Table 56: Elecnor SA, Major Products and Services ................................................................................................................. 115
Table 57: Elecnor, SA, Other Locations and Subsidiaries ........................................................................................................ 117
Table 58: Abbreviations ................................................................................................................................................................... 120
Table 59: LCOE Calculation, Discount Rates by Technology .................................................................................................. 123
1.2 List of Figures
Figure 1: Solar PV Market, Global, Cumulative Installed Capacity, MW, 2001-2025 ........................................................... 10
Figure 2: Solar PV Market, Brazil, Cumulative Installed Capacity, MW, 2001–2025 ............................................................ 11
Figure 3: Carbon Emissions, Global, MMT, 2001-2011 ............................................................................................................. 13
Figure 4: Primary Energy Consumption, Global, Mtoe, 2001-2025 .......................................................................................... 14
Figure 5: Renewable Power Market, Global, Cumulative Installed Capacity by Fuel Type MW, 2001–2025 .................. 19
Figure 6: Renewable Power Market, Global, Power Generation by Fuel Type, GWh, 2001–2025 ................................... 21
Figure 7: Renewable Power Market, Global, Cumulative Installed Capacity Split by Source Type, %, 2011 and 2025 23
Figure 8: Renewable Power Market, Global, Net Capacity Additions by Source Type, MW, 2011–2025 ........................ 24
Figure 9: Renewable Power Market, Global, Comparison among Power Sources ............................................................... 25
Figure 10: Solar PV Market, Global, Installed Capacity, MW, 2001–2025 ................................................................................ 27
Figure 11: Solar PV Market, Global, Power Generation, GWh, 2001–2025 ............................................................................. 29
Figure 12: Solar PV Market, Global, Cumulative Installed Capacity Growth by Region, MW, 2011-2025 .......................... 31
Figure 13: Solar PV Market, Global, Cumulative Installed Capacity Split by Country, %, 2011 ........................................... 31
Figure 14: Solar PV Market, Global, Net Capacity Additions in Major Countries, MW, 2011–2025 ..................................... 32
Figure 15: Solar PV Market, Global, Comparison Between Key Countries .............................................................................. 33
Figure 16: Solar PV Power Market, Global, New Investment, $m, 2012-2025 ........................................................................ 34
Figure 17: Solar PV Market, Global, Cost Break-up of a Grid Connected PV System, %, 2011 .......................................... 35
Figure 18: Solar PV Market, Global, Cost Break-up of an Off-grid PV System, %, 2011 ....................................................... 36
Figure 19: Solar PV Market, Global, LCOE in Major Countries, $/kWh, 2011 .......................................................................... 37
Figure 20: Solar PV Market, Global, Import and Export of Modules, $m, 2007–2011 ............................................................ 38
Figure 21: Solar PV Market, Global, Trade Flow of Modules, 2011 ........................................................................................... 39
Table Of Contents
Solar PV in Brazil, Market Outlook to 2025 - Capacity, Generation, Levelized Cost of
Energy (LCOE), Investment Trends, Regulations and Company Profiles
GDAE6210IDB/Published DEC 2012
© GlobalData. This report is a licensed product and is not to be photocopied Page (8)
Figure 22: Solar PV Market, Global, Major Debt Providers, 2011 .............................................................................................. 39
Figure 23: Power Market, Brazil, Cumulative Installed Capacity, MW, 2001–2025 ................................................................ 41
Figure 24: Power Market, Brazil, Cumulative Installed Capacity by Fuel Type, MW, 2001–2025 ........................................ 43
Figure 25: Power Market, Brazil, Power Generation by Fuel Type, GWh, 2001–2025 .......................................................... 45
Figure 26: Power Market, Brazil, Net Capacity Additions by Source Type, MW, 2011–2025 ............................................... 47
Figure 27: Power Market, Brazil, Comparison Between Power Sources, 2011–2025 ............................................................ 48
Figure 28: Renewable Power Market, Brazil, Cumulative Installed Capacity, MW, 2001–2025 ........................................... 50
Figure 29: Renewable Power Market, Brazil, Cumulative Installed Capacity Split by Source Type, %, 2011 and 2025 . 51
Figure 30: Renewable Power Market, Brazil, Power Generation by Source Type, MW, 2001–2025 .................................. 52
Figure 31: Renewable Power Market, Brazil, Net Capacity Additions by Source Type, MW, 2011–2025 .......................... 54
Figure 32: Renewable Power Market, Brazil, Comparison of Renewable Power Sources, 2011 ......................................... 55
Figure 33: Renewable Power Market, Brazil, LCOE Comparison, $/kWh, 2011 ..................................................................... 56
Figure 34: Solar PV Market, Brazil, Installed Capacity, MW, 2001-2025 .................................................................................. 57
Figure 35: Solar PV Market, Brazil, Power Generation, GWh, 2001-2025 ............................................................................... 59
Figure 36: Solar PV Market, Brazil, Cumulative Capacity Segmentation by On-grid and Off-grid, MW, 2001-2011 ........ 62
Figure 37: Solar PV Market, Brazil, Annual Additions Segmentation by On-grid and Off-grid, MW, 2001-2011 ............... 63
Figure 38: Solar PV Market, Brazil, Cumulative Capacity Segmentation by On-grid and Off-grid, %, 2001-2011 ............ 64
Figure 39: Solar PV Market, Brazil, Annual Additions Segmentation by On-grid and Off-grid, %, 2001-2011 ................... 65
Figure 40: Solar PV Market, Brazil, Capital Expenditure and New Investments, $/kW and $m, 2011-2025 ...................... 66
Figure 41: Solar PV Market, Brazil, Trade Flow, $m, 2001-2011 ............................................................................................... 68
Figure 42: Solar PV Market, Brazil, Carbon Savings, ‘000 Tons 2001-2025 ............................................................................ 69
Figure 43: Solar PV Market, Brazil, Average Number of Homes Powered, 2001-2025 ......................................................... 71
Figure 44: Solar PV Market, Brazil, LCOE, $/kWh, 2011-2025 ................................................................................................... 73
Figure 45: Wind Power Market, Brazil, Deal Value vs. Deal Volume, 2004-2011 ................................................................... 75
Figure 46: Wind Power Market, Brazil, Split by Deal Type, %, 2011 ......................................................................................... 76
Figure 47: Wind Power Market, Brazil, Asset Finance Deals, Brazil vs. Global, 2007-2011 ................................................. 77
Figure 48: Wind Power Market, Brazil, Asset Finance Deals, Comparison Among Various Renewable Energy Sources, 2011 78
Figure 49: Renewable Power Market, Brazil, Impact Analysis of Policies, 1974-2012 ........................................................... 79
Figure 50: PROINFA, Brazil, A-3 Energy Auctions, 2011............................................................................................................. 82
Figure 51: PROINFA, Brazil, A-3 Energy Auctions, Technology Share by Investments, 2011 ............................................. 83
Figure 52: PROINFA, Brazil, A-5 Energy Auctions, 2011............................................................................................................. 84
Figure 53: PROINFA, Brazil, A-5 Energy Auctions, Technology Share by Investments, 2011 ............................................. 85
Figure 54: Wind Power Market, Brazil, Presence of Companies Across Wind Value Chain ................................................. 89
Figure 55: Suzlon Energy Limited, Key Financial Performance ................................................................................................ 101
Figure 56: Enel Green Power S.p.A., Key Financial Performance ........................................................................................... 112
Figure 57: Elecnor SA, Key Financial Performance .................................................................................................................... 116

Solar PV in Brazil
Solar PV in Brazil, Market Outlook to 2025 - Capacity, Generation, Levelized Cost of
Energy (LCOE), Investment Trends, Regulations and Company Profiles
GDAE6210IDB/Published DEC 2012
© GlobalData. This report is a licensed product and is not to be photocopied Page (9)
2 Executive Summary
2.1 Global Carbon Emissions Continue to Increase in 2010-2011 after a Slight Dip in 2009
2.2 Global Power Market – Increasing Focus on Clean Technologies
2.3 Government Support will continue to Foster the Growth of Global Renewable Power Market
.
2.4 Global Solar Photovoltaic (PV) Market Will Sustain its Growth Momentum
Solar PV in Brazil
Solar PV in Brazil, Market Outlook to 2025 - Capacity, Generation, Levelized Cost of
Energy (LCOE), Investment Trends, Regulations and Company Profiles
GDAE6210IDB/Published DEC 2012
© GlobalData. This report is a licensed product and is not to be photocopied Page (10)
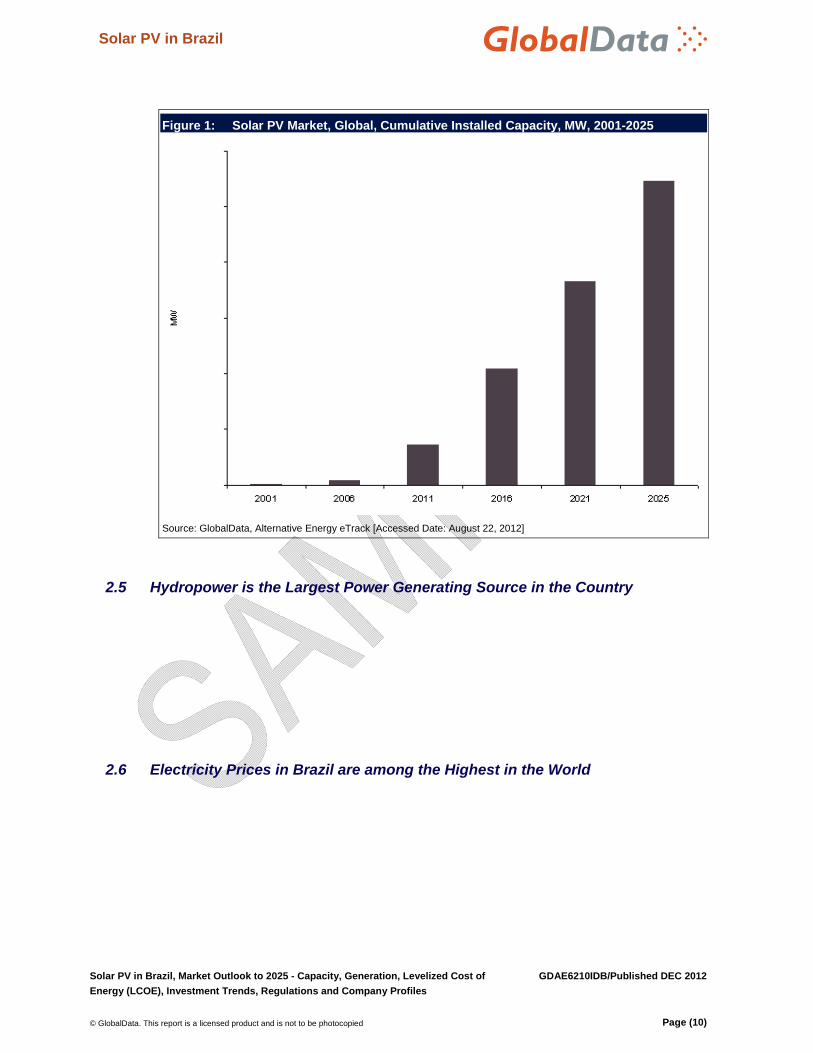
Figure 1: Solar PV Market, Global, Cumulative Installed Capacity, MW, 2001-2025
Source: GlobalData, Alternative Energy eTrack [Accessed Date: August 22, 2012]
2.5 Hydropower is the Largest Power Generating Source in the Country
2.6 Electricity Prices in Brazil are among the Highest in the World
Solar PV in Brazil
Solar PV in Brazil, Market Outlook to 2025 - Capacity, Generation, Levelized Cost of
Energy (LCOE), Investment Trends, Regulations and Company Profiles
GDAE6210IDB/Published DEC 2012
© GlobalData. This report is a licensed product and is not to be photocopied Page (11)
2.7 Brazil Aims to add another 10% of Electricity from Renewable Sources by 2020
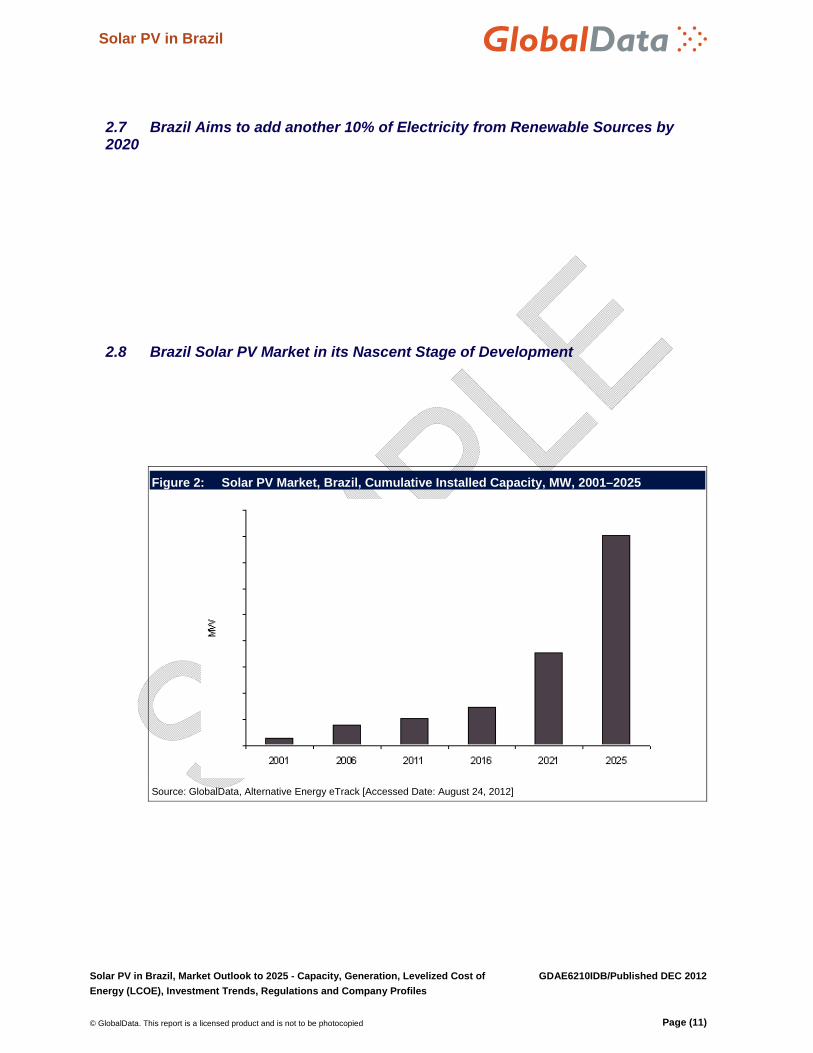
2.8 Brazil Solar PV Market in its Nascent Stage of Development
Figure 2: Solar PV Market, Brazil, Cumulative Installed Capacity, MW, 2001–2025
Source: GlobalData, Alternative Energy eTrack [Accessed Date: August 24, 2012]

Solar PV in Brazil
Solar PV in Brazil, Market Outlook to 2025 - Capacity, Generation, Levelized Cost of
Energy (LCOE), Investment Trends, Regulations and Company Profiles
GDAE6210IDB/Published DEC 2012
© GlobalData. This report is a licensed product and is not to be photocopied Page (16)
3.3 Report Guidance
The report begins with an executive summary which gives a snapshot of solar PV market in
Brazil.
The “Introduction” section provides an overview on carbon emissions and energy consumption
pattern in the world.
The “Renewable Power Market, Global” section provides an overview of renewable energy
sources such as solar, wind, geothermal and biopower. The section provides historical (2001-
2011) and forecast (2012-2025) cumulative installed capacity and generation data. The section
also provides information on installed capacity split by source type, net capacity additions by
source type and cross country comparison.
The “Solar PV Market, Global” section gives a holistic overview of the global solar PV market
along with historical (2001-2011) and forecast (2012-2025) installed capacity and generation
data. The section covers cumulative installed capacity split by region and by key countries in
2011. The section also provides net installed capacity additions in major countries (2011-2025),
cross country comparison, investment trends, cost break-up of a PV system, LCOE comparison
among major countries, trade flow analysis of PV modules and major debt providers for solar PV
projects in 2011.
The “Power Market, Brazil” section provides an overview of the overall power market in Brazil.
The section provides historical (2001-2011) and forecast (2012-2025) installed capacity and
generation data for conventional thermal, nuclear, hydro and renewable sources. The section
covers installed capacity by fuel type, net capacity additions by source type and comparison
among various power generating sources.
The “Renewable Power Market, Brazil” section gives an overview of the renewable power
market in Brazil. The section provides historical (2001-2011) and forecast (2012-2025) installed
capacity and generation data for wind, solar PV, solar thermal, biogas and biomass. The section
covers installed capacity by source type, net capacity additions by source type, comparison of
various renewable power sources on the basis of installed capacity and growth rate. The section
also provides LCOE comparison among various renewable power sources such as wind, solar,
biomass and small hydro in 2011.
The “Solar PV Market, Brazil” chapter provides detail analysis on the solar PV market in the
country. The section provides historical (2004-2011) and forecast (2012-2025) installed capacity
and generation data. The chapter covers cumulative and annual installations by grid
connectivity, investment trends, export and import of modules, carbon savings, homes powered
and LCOE.
The “Solar PV Market, Brazil, Deal Analysis” section provides trend analysis of the total
investments in Brazil solar PV industry. The chapter provides data on deal value versus deal
volume for 2004-2011. The section also provides split by deal type and asset finance deals
information.
The “Renewable Energy Regulatory Framework, Brazil” chapter gives an in depth understanding
of the renewable energy policy framework in the country and government support provided for
renewables in general and solar PV in particular.

Solar PV in Brazil
Solar PV in Brazil, Market Outlook to 2025 - Capacity, Generation, Levelized Cost of
Energy (LCOE), Investment Trends, Regulations and Company Profiles
GDAE6210IDB/Published DEC 2012
© GlobalData. This report is a licensed product and is not to be photocopied Page (17)
The “Solar PV Market, Brazil, Company Profiles” section provides value chain analysis of solar
PV industry in Brazil. The chapter also provides company snapshots of major market
participants in the country.

Solar PV in Brazil
Solar PV in Brazil, Market Outlook to 2025 - Capacity, Generation, Levelized Cost of
Energy (LCOE), Investment Trends, Regulations and Company Profiles
GDAE6210IDB/Published DEC 2012
© GlobalData. This report is a licensed product and is not to be photocopied Page (57)
8 Solar PV Market, Brazil, 2001-2025
8.1 Solar PV Market, Brazil, Overview
8.2 Solar PV Market, Brazil, Installed Capacity, MW, 2001-2025
Figure 34: Solar PV Market, Brazil, Installed Capacity, MW, 2001-2025
Source: GlobalData, Alternative Energy eTrack [Accessed Date: July 9, 2012]

Solar PV in Brazil
Solar PV in Brazil, Market Outlook to 2025 - Capacity, Generation, Levelized Cost of
Energy (LCOE), Investment Trends, Regulations and Company Profiles
GDAE6210IDB/Published DEC 2012
© GlobalData. This report is a licensed product and is not to be photocopied Page (58)
Table 27: Solar PV Market, India, Installed Capacity, MW, 2001–2025
Year Annual Installed Capacity
(MW)Cumulative Installed
Capacity (MW) Y-o-Y Growth Rate
Source: GlobalData, Alternative Energy eTrack [Accessed on July 17, 2012]

Solar PV in Brazil
Solar PV in Brazil, Market Outlook to 2025 - Capacity, Generation, Levelized Cost of
Energy (LCOE), Investment Trends, Regulations and Company Profiles
GDAE6210IDB/Published DEC 2012
© GlobalData. This report is a licensed product and is not to be photocopied Page (59)
8.3 Solar PV Market, Brazil, Power Generation, GWh, 2001-2025
Figure 35: Solar PV Market, Brazil, Power Generation, GWh, 2001-2025
Source: GlobalData, Alternative Energy eTrack [Accessed Date: July 9, 2012]

Solar PV in Brazil
Solar PV in Brazil, Market Outlook to 2025 - Capacity, Generation, Levelized Cost of
Energy (LCOE), Investment Trends, Regulations and Company Profiles
GDAE6210IDB/Published DEC 2012
© GlobalData. This report is a licensed product and is not to be photocopied Page (60)
Table 28: Solar PV Market, Brazil, Power Generation, GWh, 2001-2025
Year Generation (GWh)
Source: GlobalData, Alternative Energy eTrack [Accessed on July 17, 2012]

Appendix
Solar PV in Brazil, Market Outlook to 2025 - Capacity, Generation, Levelized Cost of
Energy (LCOE), Investment Trends, Regulations and Company Profiles
GDAE6210IDB/Published DEC 2012
© GlobalData. This report is a licensed product and is not to be photocopied Page (120)
12 Appendix
12.1 Abbreviations
Table 58: Abbreviations
Acronym Expanded Form
$ US Dollar
ANEEL Agencia Nacional de Energia Eletrica
AWEA American Wind Energy Association
bn Billion
CAGR Cumulative Annual Growth Rate
CHP Combined Heat and Power
CSP Concentrated Solar Power
CWET Center for Wind Energy Technologies
FIT Feed in Tariff
GW Gigawatt
GWEC Global Wind Energy Council
GWh Gigawatt Hour
IEA International Energy Agency
INR Indian National Rupee
IPP Independent Power Producer
ISP Independent Service Providers
kT Kilo Tons
ktoe Kilo Tons of Oil Equivalent
kW Kilowatt
kWh Kilowatt Hour
LCOE Levelized Cost of Energy
m Million
mT Million Tons
MW Megawatt
O&M Operation and Maintenance
OEM Original Equipment Manufacturer
PTC Production Tax Credit
PV Photovoltaic
ROE Return on Equity
TWh Terawatt Hour
UK United Kingdom
US United States
WRD Wobben Research & Development
Y-O-Y Year on Year
Source: GlobalData

Appendix
Solar PV in Brazil, Market Outlook to 2025 - Capacity, Generation, Levelized Cost of
Energy (LCOE), Investment Trends, Regulations and Company Profiles
GDAE6210IDB/Published DEC 2012
© GlobalData. This report is a licensed product and is not to be photocopied Page (121)
12.2 Market Definitions
Historic Period: 2001-2011
Forecast Period: 2012-2025
Global Wind Power Market includes North America, Europe, Asia-Pacific, South and Central
America, Middle East and Africa and Others.
North America Wind Power Market includes The US and Canada.
Europe Wind Power Market includes Austria, Belgium, Bulgaria, Czech Republic, Denmark,
Estonia, Finland, France, Germany, Greece, Ireland, Italy, Latvia, Lithuania, the Netherlands,
Norway, Poland, Portugal, Romania, Russian Federation, Spain, Sweden, Switzerland, Turkey,
Ukraine and the UK.
Asia-Pacific Wind Power Market includes Australia, China, India, Indonesia, Japan, New Zealand,
Pakistan, Philippines, Republic of Korea and Thailand.
South and Central America Wind Power Market includes Argentina, Brazil, Chile, Columbia and
Mexico.
Middle East and Africa Wind Power Market includes Egypt, Iran (Islamic Republic of Iran), Israel,
Morocco and South Africa.
Others include Rest of Europe, Rest of Asia-Pacific, Rest of South and Central America, Rest of
Middle East and Africa.
Power Market includes Thermal Conventional (Coal, Gas and Oil), Nuclear, Large Hydro & Pump
Storage and Renewables.
Renewable Power Market: Wind (Onshore and Offshore), Solar PV, CSP, Biomass, Biogas,
Geothermal and Small Hydro.
Small Hydro: Classification of small hydro power is as follows –
Project size of <= 30 MW is considered as small hydro in countries such as Brazil, Japan,
Mexico, Venezuela, and the US.
Project size of <= 50 MW is considered as small hydro in countries such as Canada and
China.
Project size of <= 25 MW is considered as small hydro in India.
Project size of <= 10 MW is considered as small hydro in European countries.
Import and Export: The data for wind turbines is sourced from UN Comtrade through HS code
850231. The data for solar modules is sourced from UN Comtrade through HS code 854140.

Appendix
Solar PV in Brazil, Market Outlook to 2025 - Capacity, Generation, Levelized Cost of
Energy (LCOE), Investment Trends, Regulations and Company Profiles
GDAE6210IDB/Published DEC 2012
© GlobalData. This report is a licensed product and is not to be photocopied Page (122)
12.3 Methodology
GlobalData’s dedicated research and analysis teams consist of experienced professionals with a
pedigree in marketing and market research, a background in consulting, and advanced statistical
expertise in the energy industry.
GlobalData’s research methodology for the hydro report mainly consists of primary and secondary
research.
12.3.1 Secondary Research
The research process begins with exhaustive secondary research on internal and external
sources being carried out to source qualitative and quantitative information relating to each
market.
The secondary research sources that are typically referred to include, but are not limited to:
Company websites, annual reports, financial reports, whitepapers, news and press
releases.
Industry trade journals, magazines and other literature.
Industry associations, energy agencies and other government bodies.
Internal proprietary databases such as our alternative energy eTrack and power
eTrack.
12.3.2 Primary Research
GlobalData conducts extensive primary interviews with industry participants and
commentators in order to validate its data and analysis. A typical research interview fulfills the
following functions:
To get the interviewee’s perspective on installed capacities, capacity utilization rates,
market share, market trends, growth trends, and future outlook
Helps in validating and strengthening the secondary research findings
Further develops the analysis team’s expertise and market understanding
Primary research involves e-mail interactions, telephonic interviews as well as face-to-face
interviews for each market, category, segment and sub-segment across geographies. Primary
respondents include key representatives of companies across the industry value chain.
12.3.3 Modeling and Forecasting
To forecast installed capacity and generation, we use in-house models to forecast the data.
Historic data and the analysis of trends within it form the basis of all forecasting methodology.
Various qualitative and quantitative factors are usually taken into account for estimating future
growth. The forecast data is validated through industry experts across the value chain.

Appendix
Solar PV in Brazil, Market Outlook to 2025 - Capacity, Generation, Levelized Cost of
Energy (LCOE), Investment Trends, Regulations and Company Profiles
GDAE6210IDB/Published DEC 2012
© GlobalData. This report is a licensed product and is not to be photocopied Page (123)
12.3.4 Market Estimates and Assumptions
The following are the datapoints that are estimated or sourced through primary and secondary
research.
12.3.4.1 LCOE Calculation
Capital Cost – The capital costs of various technologies have been collected from secondary
sources, such as energy agencies and asset finance deals from the internal databases
(alternative energy eTrack; power eTrack). Capital costs have been forecasted based on the
opinions obtained from industry experts and used to calculate base-case LCOE.
Capacity Factor – Capacity factor for a technology has been estimated from installed capacity
and generation of a technology in the country. Capacity forecasts have been done based on
opinions obtained from industry experts. Thus obtained, the capacity factor is used to calculate
base-case LCOE.
Discount Rate – The discount rate is based on technological risk factors.
Table 59: LCOE Calculation, Discount Rates by Technology
Technology Discount Rate @ Low LCOE Case
Discount Rate @ Base LCOE Case
Discount Rate @ High LCOE Case
Wind 5% 6.5% 8%
Solar PV 5% 6.5% 8%
Biomass 5% 6% 7%
Small Hydro 5% 6% 7%
Source: GlobalData
Fuel Cost – Information on fuel cost for biomass power is sourced from industry associations
and government agencies. Biopellets is considered as feedstock to calculate fuel cost for
biomass power LCOE calculations. Data has been collected for the last 20 years and
forecasted through to 2025 based on the trends observed in historic data.
O&M Cost – O&M cost has been taken as percentage of capital cost. The percentage taken
depends on the technology.
Life Period of Power Plants – Generally accepted life span of a power plant in the industry has
been considered for calculating LCOE for all technologies.
12.3.4.2 Investments
Investments are calculated on the basis of annual capacity additions in each year and capital cost.
12.3.4.3 Carbon Savings and Number of Homes Powered
Carbon savings (in million tons or in thousand tons) and number of homes powered is calculated
for each renewable power source on the basis of project level information available for active and
upcoming plants in the assets database of alternative energy eTrack or industry associations or
trade publications.

Appendix
Solar PV in Brazil, Market Outlook to 2025 - Capacity, Generation, Levelized Cost of
Energy (LCOE), Investment Trends, Regulations and Company Profiles
GDAE6210IDB/Published DEC 2012
© GlobalData. This report is a licensed product and is not to be photocopied Page (124)
12.3.5 Disclaimer
All Rights Reserved.
No part of this publication may be reproduced, stored in a retrieval system or transmitted in any
form by any means, electronic, mechanical, photocopying, recording or otherwise, without the prior
permission of the publisher, GlobalData.