
GC/MS Assays for Abused Drugs in Body Fluids, 32 - National
214
GC/MS ASSAYS FOR ABUSED DRUGS IN BODY FLUIDS U.S. DEPARTMENT OF HEALTH AND HUMAN SERVICES • Public Health Service • Alchol, Drug Abuse, and Mental Health Administration
Transcript of GC/MS Assays for Abused Drugs in Body Fluids, 32 - National

GC/MS ASSAYSFOR ABUSEDDRUGS INBODY FLUIDS
U.S. DEPARTMENT OF HEALTH AND HUMAN SERVICES • Public Health Service • Alchol, Drug Abuse, and Mental Health Administration
GC/MS Assaysfor Abused Drugsin Body Fluids
Rodger L. Foltz, Ph.D.Center for Human ToxicologyUniversity of UtahSalt Lake City, Utah 64112
Allison F. Fentiman, Jr., Ph.D.Ruth B. FoltzBattelle Columbus LaboratoriesColumbus, Ohio 43201
NIDA Research Monograph 32
August 1980
DEPARTMENT OF HEALTH AND HUMAN SERVICESPublic Health ServiceAlcohol, Drug Abuse, and Mental Health Administration
National Institute on Drug AbuseDivision of Research5600 Fishers LaneRockville, Maryland 20857
For sale by the Superintendent of Documents, U.S. Government Printing OfficeWashington, D.C. 20402
The NIDA Research Monograph series is prepared by the Division of Researchof the National Institute on Drug Abuse. Its primary objective is to providecritical reviews of research problem areas and techniques, the content ofstate-of-the- art conferences, integrative research reviews and significantoriginal research. Its dual publication emphasis is rapid and targeteddissemination to the scientific and professional community.
Editorial Advisory BoardAvram Goldstein, M.D.
Addiction Research FoundationPalo Alto, California
Jerome Jaffe, M.D.College of Physicians and SurgeonsColumbia University, New York
Reese T. Jones, M.D.Langley Porter Neuropsychiatric InstituteUniversity of CaliforniaSan Francisco, California
William McGlothlin, Ph.D.Department of Psychology, UCLALos Angeles, California
Jack Mendelson, M.D.Alchol and Drug Abuse Research CenterHarvard Medical SchoolMclean HospitalBelmont, Massachusetts
Helen Nowlis, Ph.D.Office of Drug Education, DHHS Washington, D.C.
Lee Robins, Ph.D.Washington University School of MedicineSt. Louis, Missouri
NIDA Research Monograph seriesWilliam Pollin, M.D.DIRECTOR, NIDAMarvin Snyder, Ph.D.DIRECTOR, DIVISION OF RESEARCH, NIDARobert C. Petersen, Ph.D.EDITOR-IN-CHIEFEleanor W. WaldropMANAGING EDITOR
Parklawn Building, 5600 Fishers Lane, Rockville, Maryland 20857
GC/MS Assaysfor Abused Drugsin Body Fluids

ACKNOWLEDGMENTS
Support for the development and evaluation of the GC/MSassays described in this monograph and the preparationof the manuscript was provided by the National Instituteon Drug Abuse, contracts ADM 45-74-140, HSM 42-72-183,and 271-77-3419 to Battelle Columbus Laboratories, andcontract 271-80-3719 to the Center for Human Toxicology,and by the Insurance Institute for Highway Safety, proj-ect 6762 at the Center for Human Toxicology.
The United States Government does not endorse orfavor any specific commercial product, commodity, orsupplier. Trade or proprietary names and names ofsuppliers appearing in this publication are used onlybecause they are considered essential in the contextof the information presented.
Library of Congress catalog card number 80-600143
DHHS publication number (ADM) 80-1014Printed 1980
NIDA Research Monographs are indexed in the Index Medicus.They are selectively included in the coverage of BiosciencesInformation Service, Chemical Abstracts, Current Contents,Psychological Abstracts, and Psychopharmocology abstracts.
i v
Foreword
This monograph presents a collection of methods for the quanti-tative analysis of several important drugs of abuse by the tech-nique of gas chromatography-mass spectrometry (GC/MS). The ma-terial is arranged textbook fashion, by chapters on specificdrugs, to assist researchers in setting up GC/MS assay proceduresin their own laboratories.
These assays are particularly suited to basic studies on thepharmacology and pharmacokinetics of drugs of abuse. Forensictoxicology, which sometimes requires the highly sensitive andspecific sample analysis provided by GC/MS, is another importantarea of application. Even when an alternate method such as immu-noassay is available for such analyses, GC/MS is often the onlymeans of providing a confirmation assay. The sensitivity andspecificity of GC/MS are especially critical to studies on theimpact of drugs on traffic safety. In addition, demand for leg-islation relating to drugs and highway safety is increasing, andenforcement of such laws will necessitate appropriate sample assays.
The unique characteristics of the GC/MS analytical method make itthe only means of determining drug levels under certain circum-stances. The inherent complexity of the technique, however, oftendissuades investigators from embarking on studies that involveits use. At a time when basic questions underlying drug abusecall for increasingly sophisticated methods of data acquisition,this monograph should provide the information needed to makeone of these procedures easier to establish and to encourage newareas of research.
Marvin Snyder, Ph. D.Director, Division of ResearchNational Institute on Drug Abuse
v

Preface
Soon after the establishment of the National Institute on DrugAbuse in 1974, the development of an analytical program empha-sizing gas chromatography/mass spectrometry (GC/MS) was initiated.A major part of this program was directed at the development,testing, and eventual publication of GC/MS methods suitable for anumber of abused drugs of interest to this Institute. It wasfelt that by making available carefully described quantitative pro-cedures for these drugs, more researchers would be encouraged tomove into several critically important areas of investigation.
A major segment of this development and testing program was carriedout by Battelle (Columbus Laboratories and at the Center for HumanToxicology at the University of Utah. These GC/MS methods empha-size chemical ionization techniques which frequently offer signifi-cant advantages in sensitivity and specificity over techniques ofelectron impact ionization.
Each of the techniques described in this monograph has been fieldtested by one or more independent laboratories in order to optimizeboth the procedure itself and the clarity of its presentation.This field testing was carried out by Battelle and consisted ofsending the participating laboratories a series of known standardsamples along with the information brochures included herein aschapters. The participating laboratories then set up the methodin their own facilities and analyzed the spiked samples. Problemswith either the instructional material or the method allowedBattelle to make many improvements to insure the highest probabilityof an inexperienced lab’s success with one of these assays.
This monograph represents the combined efforts of many individualsand has evolved to its present state over several years. We hopethat it will save research investigators valuable time in estab-lishing quantitative essays of these drugs in their own laboratories.The basic principles of GC/MS quantitative analysis as presentedhere should be useful in setting up procedures for other drugs aswell.
Richard L. Hawks , Ph.D.Division of Research
v i i

Contents
Foreword . . . . . . . . . . . . . . . . . . . . . . . . . . . . vMarvin Snyder
Preface . . . . . . . . . . . . . . . . . . . . . . . . . . . viiRichard L. Hawks
Chapter 1
Chapter 2
Chapter 3
Chapter 4
Chapter 5
Chapter 6
Chapter 7
Chapter 8
Chapter 9
Chapter 10
Chapter 11
Chapter 12
Chapter 13
Introduction . . . . . . . . . . . . . . . . . . . . 1
Experimental Considerations and Operations Commonto All of the Assays . . . . . . . . . . . . . . . . 5
Phencyclidine(PCP) . . . . . . . . . . . . . . . . 2 5
Methaqualone . . . . . . . . . . . . . . . . . . . .39
Methadone . . . . . . . . . . . . . . . . . . . . .51
-Tetrahydrocannabinol (THC) and Two of ItsMetabolites, 11-Hydroxy- -THC and 11-Nor-9-Carboxy-
-THC . . . . . . . . . . . . . . . . . . . . . . .62
Cocaine and Its Major Metabolite, Benzoylecgonine . 90
Morphine . . . . . . . . , . . . . . . . . . . . . 110
Diazepam and Its Major Metabolite, N-Desmethyl-diazepam . . . . . . . . . . . . . . . . . . . . . 128
Amphetamine . . . . . . . . . . . . . . . . . . . 150
Methamphetamine . . . . . . . . . . . . . . . . . 165
2,5-Dimethoxy-4-Methylamphetamine (DOM) . . . . . 179
Mescaline . . . . . . . , . . . . . . . . . . . . 189
i x

Chapter 1
IntroductionThe combination of gas chromatography and mass spectrometry (GC/MS)became widely recognized in the 1960’s as the most sensitive andversatile tool available for the identification of volatile or-ganic compounds. It was not until the 1970’s, however, and thedevelopment of selected ion monitoring techniques, that the poten-tial of GC/MS for quantitative analysis was generally appreciated.It now seems certain that the quantitative measurement of specificorganic compounds in complex mixtures will become the major appli-cation of GC/MS simply because its sensitivity, accuracy, and ver-satility are unequalled by any other technique, including the popu-lar immunological assays.
The rapid increase in the use of GC/MS has occurred in spite ofseveral severe limitations and deterrents. The major limitationis that for a compound to be analyzed by GC/MS it must have suf-ficient volatility and thermostability to pass through the gas chro-matographic column intact in the vapor state, or be capable of con-version to a derivative which can do so; this requirement prohibitsGC/MS analysis for 80 to 90 percent of known organic compounds.Fortunately, this is not a serious problem for the toxicologist,because most drugs and their metabolites are among the structureswhich can be analyzed by GC/MS. More serious deterrents to wideruse of GC/MS in toxicological and clinical laboratories are theexpense of GC/MS instrumentation and the relatively high level oftraining and skill required to make effective use of these instru-ments. Although the former is unlikely to be reduced in the fu-ture, the latter will undoubtedly become less burdensome as thereliability of GC/MS instrumentation is improved and its designsimplified.
The purpose of this monograph is to assemble, within a single vol-ume, detailed descriptions of GC/MS procedures for quantitativemeasurement of some of the drugs and their metabolites which areof particular concern to the National Institute on Drug Abuse(NIDA). The procedures were developed at Battelle Colunbus Labora-tories and the Center for Human Toxicology at the University ofUtah, and have been extensively evaluated at both of these labora-tories. All of the assays make use of deuterium-labeled internalstandards and packed column gas chromatography combined with chemi-cal ionization mass spectrometry. This combination was chosen forthe following reasons:
Stable isotope labeled analogs constitute nearly idealinternal standards because their chemical and physicalproperties are nearly identical to those of the respec-tive unlabeled compounds.
1

Most analytical laboratories with GC/MS systems aremore familiar with the use of packed columns thanwith capillary columns.
Chemical ionization mass spectrometry, using thetechnique of selected ion monitoring, is the mostsensitive method of detection available. With chemi-cal ionization most drugs are efficiently ionized,the sample ion current is concentrated at one or twom/z values, and the likelihood of interference fromions generated by column bleed or components of thebiological extract is minimized.
Each drug was originally the subject of a separate analyticalmanual. A decision was subsequently made, however, to combine themanuals into a single volume, with each chapter devoted to a spe-cific drug and its metabolites. As a result of this evolutionof manuscripts, each chapter is relatively self-contained and in-cludes its own list of literature references and its own numbersequence for figures, tables, and structural drawings. For thisreason, anyone who has the tenacity to read the monograph fromcover to cover will find excessive repetition of certain descrip-tions and explanations. Most readers, however, will not be con-cerned with all of the drugs included in the monograph, and willchoose to read only selected chapters. Nevertheless, in order tokeep repetition to a minimum, many of the considerations and oper-ations which are common to all of the assays have been removedfrom the individual chapters and combined in Chapter 2. We there-fore recommend that the reader begin with Chapter 2 and only thenproceed to the chapters which deal with the drugs of particularinterest.
On the premise that an analyst who must determine the concentrationof a drug in biological specimens should know something about thedrug, we have included in each chapter background information whichwe believe to be relevant and useful. This background includes:
a brief history of the drug and its uses
a summary of the pharmacology and metabolism of thedrug
a survey of literature procedures for the quantitativeanalysis of the drug and its metabolites, with parti-cular emphasis on other GC/MS assays for the drug, orassays which may be considered as alternatives to GC/MS analysis
a compilation of physical, chemical and spectroscopicdata on the drug
Although GC/MS instruments are now prominent fixtures in many clini-cal and toxicological laboratories, too often their use is limitedto the identification of unknowns by matching their electron impact
2
mass spectra to reference spectra. We hope that this monographwill encourage more analysts to use the power of GC/MS as a quanti-tative technique. It is important, of course, to recognize whento use GC/MS for a particular drug analysis and when to use someother technique. The assays described in this monograph are in-tended to be used either as reference methods for validation andquality control of other methods, or as the technique of choicewhen other available methods do not offer adequate sensitivity,specificity or accuracy. The latter situation is often a factorin forensic toxicology, because the outcome of court litigation maydepend upon the reliability of a drug assay.
GC/MS can also reduce the cost of implementing a new drug assay.On several occasions we have attempted to use a “less expensive”technique for a particular drug assay, only to find that the assaydid not have adequate sensitivity or specificity. Each time weresolved the problem by using GC/MS, but valuable time and moneywere expended.
Another reason why GC/MS can often be economic relative to otherchromatographic techniques is that its specificity frequently per-mits use of simple and rapid extraction procedures. Not only doesa simple extraction procedure lower cost by saving time, but italso reduces the opportunity for human error. The degree to whichan extraction procedure can be simplified is dependent, however,upon the level of sensitivity required. For example, tetrahydro-cannabinol is psychoactive at blood concentrations of 10 ng/ml,and less. At these low concentrations a multi-step extraction andpurification procedure is required in order to eliminate inter-ference by endogenous components in the biological medium. In con-trast, pharmacologically significant blood concentrations of a drugsuch as methaqualone are much higher (> 100 ng/ml); and therefore asimple, direct extraction of bases without further purification orconcentration is adequate for GC/MS analysis, provided the chroma-tographic and mass spectrometric conditions are chosen properly.
The exclusive use of chemical ionization (CI) in each of the drugas says, rather than electron impact (EI) ionization, deserves com-ment. In qualitative analysis the major advantage of CI is that itnormally generates a prominent peak from which the molecular weightof a compound can be calculated. In quantitative analysis of drugsit offers two advantages over EI ionization: 1) the ion current ofthe analyte is usually concentrated at one or two compound-charac-teristic masses which are particularly suitable for selected ionmonitoring, and 2) most drugs and their metabolites can be efficient-ly ionized by a selective reagent gas such as ammonia. These fea-tures usually permit better effective sensitivity with CI than withEI ionization. Nevertheless, analysts in many laboratories havebeen reluctant to use chemical ionization. Part of this reluctanceundoubtedly reflects a lack of familiarity with CI. However, itis also true that there arc more experimental variables in CI thanin EI ionization, and the task of optimizing and controlling thesevariables may discourage some analysts. For this reason we haveincluded in Chapter 2, and in the discussions of each of the drugassay procedures, suggestions and guidelines for use of CI.
3

A number of newer chromatographic and mass spectrometric techniquesare in various stages of development and evaluation for analysisof drugs. Glass capillary columns are rapidly increasing in popu-larity and will continue to be used in place of packed columnswhenevcr greater separating power and higher sensitivity are needed.The commercial availability of combined liquid chromatograph/massspectrometer (LC/MS) systems makes it feasible to analyze polardrugs and metabolites directly, without derivatization. The newtechnique of MS/MS, in which a mass analyzer is used in place ofa gas chromatograph to separate the components of a mixture priorto identification or quantitation by mass spectrometry, may ulti-mately supplant GC/MS where large numbers of samples must be ana-lyzed. Finally, negative ion chemical ionization has been shownto be capable of dramatically higher sensitivity than positiveion CI for the GC/MS analysis of compounds which have high electronaffinities. The application of negative ion CI to the analysis ofdiazepam and N-desmethyldiazepam is discussed in Chapter 9.
None of these newer techniques are employed in the GC/MS drug assaysin this monograph, primarily because at the time the assays weredeveloped techniques such as LC/MS, negative ion CI, and MS/MSwere in the early stages of development and were available at onlya few research laboratories. It is now evident, however, that eachof these techniques offers exciting capabilities that will uniquelysatisfy specific analytical needs. It is likely that by the timethis monograph is distributed, many readers will already have hadexperience with one or more of the techniques.
The authors gratefully acknowledge the contributions of the manyindividuals and institutions that have assisted in the developmentof these assays and the preparation of this monograph. First andforemost, we thank the National Institute on Drug Abuse (NIDA) forfinancial support. We especially appreciated the guidance, encourage-ment, and many helpful discussions with the Project Monitors, Drs.Richard L. Hawks and Robert E. Willette. Additionally, we wouldlike to thank the Insurance Institute for Highway Safety for theirfinancial support which enabled us to further evaluate and refineseveral of these assays. Those who contributed to the laboratoryresearch include Dr. David A. Knowlton, Dr. Pauline A. Clarke, Dr.Denis C.K. Lin, Dr. Edith G. Leighty, Dr. Bruce A. Petersen, Mr.Warren E. Bresler, Mr. Bruce J. Hidy, and Dr. Frank W. Crow atBattelle Columbus Laboratories, and Mr. Dennis M. Chinn and blissCheryl L. Jackson at the Center for Human Toxicology. Others whohelped evaluate the methods include: Dr. Dan S. Pearce, Laboratoryof Criminalistics, Santa Ana, CA; Dr. Jack D. Henion, New York StateCollege of Veterinary Medicine, Cornell University, Ithaca, NY; Dr.James Ferguson, Toxicology Department, The Ohio State University,Columbus Ohio; Dr. Daniel R. DiFeo, Jr., Analytical Chemistry Center,The University of Texas Health Science Center, Houston, Texas;and Miss Pamela Ahearn, State of Rhode Island Department of Health,Providence, Rhode Island.
Finally, special thanks are due to Dr. Bryan S. Finkle at the Centerfor Human Toxicology for his invaluable assistance in preparingand reviewing the monograph manuscript.
4
Chapter 2
Experimental Considerationsand OperationsCommon to All of the Assays
Each of the GC/MS assays described in this monograph includes thefollowing steps:
1. Addition of a deuterium labeled internal standard to thebiological specimen
2. Solvent extraction of the biological specimen
3. GC/MS analysis of the extract using chemical ionizntionand selected ion monitoring
4. Calculation of the drug concentration in the biologicalsample based on the ratio of ion currents generated bythe drug and the internal standard.
This chapter discusses general considerations relevant to each ofthese operations, and presents our recommendations regarding thepreparation of calibration graphs and procedures for monitoringthe quality of the analytical data.
Even though all of the assays utilize chemical ionization (CI) , theprocedures can be modified for electron impact (EI) ionization. ‘Ibischange will usually result in lower sensitivity and specificity be-cause the most abundant ions in the EI mass spectra of these drugsare generally not as satisfactory for selected ion monitoring asthe abundant ions in the chemical ionization mass spectra (1).A more rigid requirement of these assays is that the GC/MS systemmust be capable of continuously monitoring the ion currents at twoor more selected ion masses. The usefulness of selected ion moni-toring (also called “multiple ion detection” and “mass fragmento-graphy”) is now so widely recognized that virtually all GC/MS sys-tems intended for biomedical applications have this capability,either in the form of an interactive data system or a hardwiredselected ion monitor.
TYPES AND SOURCES OF SPECIMENS
Because the blood concentration of a drug usually gives the best cor-relation with the pharmacological effect of the drug,the preferred biological specimens for drug analysis are whole blood,plasma, or serum. All of the GC/MS assays in this monograph are
5

capable of measuring drug concentrations in blood at least as lowas the minimum level at which the drug exerts a detectable physio-logical ef fect .
If a choice of specimen is available, plasma is usually preferred.The blood should be collected in evacuated tubes containing sodiumfluoride to inhibit bacterial and enzymatic action, and sodium oxa-late or heparin to prevent coagulation. The blood should be centri-fuged as soon as possible to separate the plasma from the red bloodcells, and the plasma transferred into silylated glass tubes equippedwith Teflon-lined screw caps. If storage or shipment of the plasmais necessary, it should be frozen and maintained in the frozen stateuntil the extraction can be performed. Several guaranteed 24-hourparcel delivery services are now available to most cities in theUnited States. These services are well worth the additional costfor shipment of biological specimens.
The GC/MS assays described here are also applicable to other physio-logical fluids and tissues, including urine, saliva, cerebrospinalfluid, gastric fluid, and homogenates from adipose tissue, liver,kidney, etc. Some specimens, particularly those with a high fatcontent, may require additional purification in order to remove in-terfering endogenous compounds. This can be accomplished in thecase of basic drugs by a “back extraction” procedure in which thedrug is extracted from an organic solvent into aqueous acid. Theacid solution is then made basic and the drug reextracted into anorganic solvent.
Tetrahydrocannabinol (Chapter 6) is unique among the drugs discussedin this monograph in that it is a highly lipophilic, nonbasic drug,and therefore difficult to separate from the lipids present in phy-siological specimens. For this reason, the THC assay is a parti-cularly striking example of the power of GC/MS to selectively mea-sure a specific compound within a complex mixture of similar mater-ials .
INTERNAL STANDARDS
The sensitivity of a GC/MS system depends on a large number of fac-tors, some of which are difficult to control. Consequently, it isessential to use an internal standard if accurate, quantitative mea-surements are to be made. An ideal internal standard behaves identi-cally to the analyte throughout the extraction, chromatographic sep-aration, and ionization processes, so that the weight ratio of ad-ded internal standard to analyte will remain unaffected by any ofthese operations. Stable isotope labeled analogs come the closestto meeting the characteristics of ideal internal standards. The iso-tope label exerts a very slight, but usually insignificant effect onthe physical and chemical properties of the compound, yet the highermass of the isotope labeled ions of the internal standard permitsthem to be separated from the analyte ions by the mass spectrometer.
The major deterrent to the use of stable isotope labeled drugs as in-ternal standards is their limited availability and the high cost ofthose that are available. In recognition of this problem, the
6

National Institute on Drug Abuse has contracted the synthesis ofstable isotope labeled analogs of many of the abused drugs and theirmetabolites. Milligram quantities of these compounds are availablewithout charge to authorized investigators engaged in research re-quiring the quantitative analysis of these drugs. Enquiries regard-ing the availability of specific isotope labeled drugs and metabo-lites should be sent to:
National Institute on Drug AbuseDivision of Research/Research Technology Branch5600 Fishers LaneRockville, MD 20857301-443-5280
Several commercial firms specialize in the synthesis and sale ofstable isotope labeled compounds. These include:
Merck Sharp Dohme Canada LimitedIsotope DivisionP.O. Box 899Pointe Claire-Dorval, Quebec H9R 4P7Canada514-697-2823
KOR Isotopes56 Rogers StreetCambridge, MA 02142 USA517-661-8220
Prochem19, Ox Bow LaneSummit, NJ 07901 USA201-273-0440
Chromacol Ltd.73 a Friern Barnet LaneLondon N20 OXT England368- 7666
Stohler Isotope Chemicals, Inc.49 Jones RoadWaltham, MA 02154 USA617-891-1827
Unfortunately, the problems associated with selling controlled sub-stances have discouraged some of the suppliers from any involvementwith this category of drugs. Merck Sharp Dohme Canada synthesizesand sells stable isotope labeled controlled drugs, but purchasersin the United States must obtain an American Government Permit toImport before Merck can ship the product.
Because the market for stable isotope labeled compounds is stillrelatively small, their cost is high when purchased from commercialsources. For this reason laboratories with organic synthesis ex-pertise may elect to synthesize their own isotope labeled internal
7
328-011 0 - 80 - 2
standards. Experimental procedures have been published for prepar-ation of many deuterium labeled drugs and metabolites (2,3).
Several factors arc important to keep in mind when selecting anisotope labeled compound for use as an internal standard. Mostimportantly, the isotope must not undergo exchange under any ofthe conditions encountered during the extraction, derivatization,or chromatography steps of the assay, nor those within the ionsource of the mass spectrometer. The replacement of a deuteriumlabel by hydrogen within the ion source sometimes occurs unexpect-edly under chemical ionization conditions. For example, a druglabeled with three dcuterium atoms attached to a tertiary aminomethyl group was found to undergo extensive exchange between deu-terium and hydrogen atoms when the drug was subjected to methanechemical ionization (3). Fortunately, the exchange did not occurwhen ammonia was used as the reagent gas.
Additional potential problems associated with the use of deuteriumlabeled analogs as internal standards are discussed in Millard’sbook entitled Quantitative Mass Spectrometry (5). In particular,an example is cited in which a prostaglandin was labeled with fourdeuterium atoms in apparently stable positions in the molecule, butafter prolonged storage in methanol considerable exchange of hydro-gen for deuterium was found to have occurred. Based upon this ex-perience, Millard recommends that stock solutions of deuteriumlabeled compounds should be checked at regular intervals for evi-dence of hydrogen-dcutcrium exchange.
The problem of exchange has prompted some analysts to utilize 13Cor 15N labels rather than dcuterium. However, deuterium is usuallyfar easier to incorporate into a molecule than other heavy isotopesand therefore will undoubtedly continue to be the most frequentlyused label for internal standards. The important point is thatthe analyst must be aware of the possible problems associated withthe use of deuterium labeled internal standards, and to thoroughlyevaluate each application of a particular internal standard he-fore embarking on an extensive series of assays.
A second important point regarding isotope labeling is that theisotopic variant should have a molecular weight three or more massunits greater than the unlabeled compound. This is because thenaturally occurring heavy isotope content (primarily 13C) of organiccompounds gives rise to ions of significant intensity at one andtwo mass units above each carbon containing ion in the compound’smass spectrum. In principle the contributions of these naturallyoccurring isotope ions can be calculated and subtracted from theion currents resulting from the internal standard, hut in practicemeasurement of the intensity of the isotope labeled ion peak iseasier and more accurate if there is no contribution from other ions.
Of course, other types of compounds can bc used as internal stan-dards when a suitable isotope labeled analog is not available.For example, homologs and other structurally similar compounds havebeen used as internal standards and often give satisfactory results(6-8). Nevertheless, when they can be obtained, stable isotope
8

labeled analogs are the first choice for internal standards of mostpractitioners of quantitative mass spectrometry (9).
PREPARATION OF CALIBRATION GRAPHS
The procedure we recommend for preparation of calibration graphs(“standard curves”) involves addition of a fixed quantity of inter-nal standard to aliquots of an appropriate body fluid containingknown quantities of the analyte. The “spiked standards” are thenextracted, derivatized, and analyzed by exactly the procedure tobe used for unknown samples. The calibration graph is constructedby plotting the measured ratio of ion current peak heights cor-responding to the analyte and the internal standard versus the quan-tity of analyte added to each sample. Any inaccuracies in measurementthat occur in the preparation of a calibration graph will affectthe accuracy of all subsequent quantitative determinations whichutilize that calibration graph. Consequently, preparation of anaccurate calibration graph is extremely important. The two require-ments that are most critical are: 1) the quantity of analyte ineach sample must be accurately known, and 2) exactly the same quan-tity of internal standard must be added to each sample used to pre-pare the calibration graph as is added to each of the unknown sam-ples.
As a general rule the sample medium used for preparing a calibrationgraph should be as similar as possible to the sample medium to beanalyzed. If the unknowns consist of plasma samples, the biologi-cal standards to be used in establishing the calibration graph canbe prepared by adding precise volumes of standard solutions of theanalyte to aliquots of a pool of plasma obtained from a local bloodbank. It is important, of course, to establish that the plasmapool is completely free of the analyte, or any other compounds whichinterfere with the assay.
Ideally, the analyte standard solution and the internal standardsolution should be added in such a way that the biological mediumis not changed and drug compounds are introduced into a molecularenvironment which exactly mimics that of the biological specimensto be analyzed. For this reason it is generally preferable to useaqueous standard solutions. However, some drugs have very littlesolubility in water so that it is difficult to prepare aqueous so-lutions at the concentrations required. Most drugs are soluble inmethanol, and addition of small quantities of methanolic solutionsto biological media causes relatively minor physical and chemicalalteration. For the sake of uniformity the standard solutions forall of the drugs and metabolites in this monograph are prepared inmethanol. We have also chosen 100 µl as the volume of the metha-nolic standard solutions to be added to 1-ml volumes of the biolo-gical specimen. This volume of methanolic solution is a compromisein that it is large enough to be conveniently dispensed with goodaccuracy, but is not so large that it causes extensive protein pre-cipitation.
9
As previously stated it is important to add precisely the sameamount of internal standard to each sample to be analyzed, i.e.,to both standards and unknowns. It is not actually necessary toknow the weight of internal standard added, as long as it is exact-ly the same for all samples. Nevertheless, the normal practice isto decide in advance the approximate quantity of internal standardto be added to each sample, since the ratio of analyte to internalstandard can be measured most accurately when they are present insimilar concentrations. Consequently, the quantity of internalstandard added to a specimen should give a concentration inter-mediate between the lowest and highest anticipated analyte concen-trations, or more precisely, the concentration of internal stan-dard should be such that the lowest anticipated weight ratio ofanalyte to internal standard should approximately equal the inverseof the highest anticipated ratio. Thus, if one desires to measureconcentrations of a drug over the range 1 to 1000 ng/ml, the amountof internal standard added should give a concentration of approxi-mately 32 ng/ml (1:32 = 32:1000).
Some analysts may favor a lower concentration of internal standardon the basis that it is more difficult to measure low concentrationsof a drug than high concentrations, and therefore the internal stan-dard concentration should be selected so as to facilitate accuratemeasurement of‘ low levels of the drug. On the other hand, relative-ly large quantities of internal standard are sometimes used in orderfor it to act as a “carrier” to minimize losses of analyte due toadsorption at active sites on the surface of extraction vessels andwithin the GC column (7). However, the “carrier” effect is not asignificant factor except at very low analyte concentrations, usu-ally below about 10 ng/ml (8). Based upon these considerations wehave standardized our procedure by specifying the addition of ap-proximately 40 ng of internal standard to each ml of body fluid.
A calibration graph should include measurements at a minimum offour different concentrations of analyte plus a blank, i.e., asample with no added analyte. At least three samples should be pre-pared and analyzed at each concentration in order to assess thevariance in the measurements at each concentration. The analyteconcentrations used in preparing the calibration graph must in-clude the extremes of concentrations expected to be found in theunknowns, since linearity must be demonstrated, not assumed. Theremaining points on the graph should correspond to intermediate con-centrations.
Since it is important to add the same volume of standard solutionto each body fluid sample in preparing a calibration graph, it isnecessary to prepare a series of standard solutions containing dif-ferent concentrations of the analyte. A dilution scheme designedto provide seven analyte concentrations covering the range 1 to1000 ng/ml is shown in Table 1. To use the scheme, prepare stan-dard stock solutions of the analyte and the internal standard hav-ing accurately measured concentrations of approximately 0.10 mg/mlin methanol as described in the Experimental Procedure sectionswithin each of the drug chapters. The dilution scheme requires the
10

use of seven 10-ml volumetric flasks, one 1-ml volumetric pipette,three 2-ml volumetric pipettes, and three 5-ml volumetric pipettes.
TABLE 1. DILUTION SCHEME FOR PREPARINGANALYTE STANDARD SOLUTIONS
Dilute 1 ml of the 0.10-mg/ml analyte stocksolution to 10 ml to give a 10.0-µg/ml solution.
Dilute 5 ml of the 10.0-µg/ml solution to10 ml to give a 5.0-µg/ml solution.
Dilute 2 ml of the 5.0-µg/ml solution to10 ml to give a 1.0-µg/ml solution.
Dilute 5 ml of the 1.0-µg/ml solution to10 ml to give a 500-ng/ml solution.
Dilute 2 ml of the 500-ng/ml solution to10 ml to give a 100-ng/ml solution.
Dilute 5 ml of the 100-ng/ml solution to10 ml to give a 50.0-ng/ml solution.
Dilute 2 ml of the 50.0-ng/ml solution to10 ml to give a 10.0-ng/ml solution.
Exactly 100 µl of each of these standard solutions is added to 1 mlof drug-free body fluid along with 100 µl of a 400-ng/ml solutionof the internal standard. Prepare the 400-ng/ml standard solutionby diluting 1 ml of the 0.10-mg/ml stock solution of internal stan-dard to 250 ml with methanol. Each of the body fluid samples willthen contain 40 ng of internal standard and the concentration ofanalyte shown in the right hand column in Table 2.
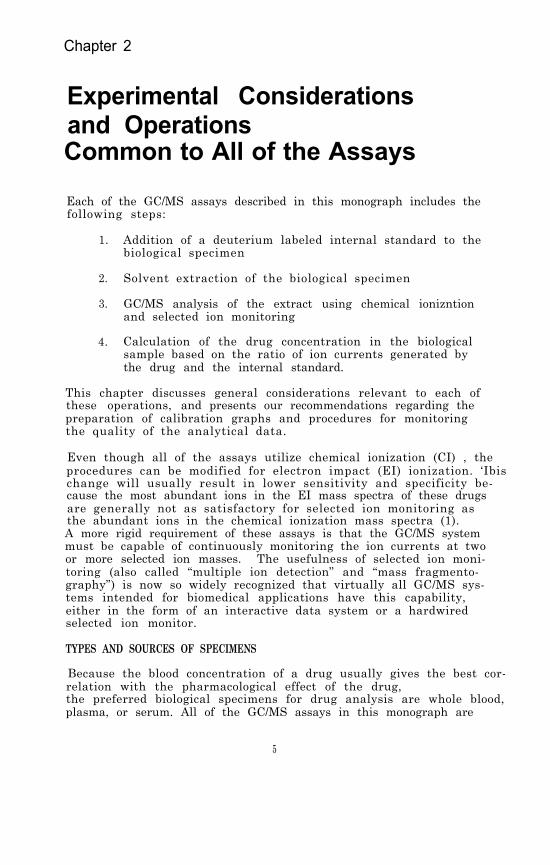
Prepare three or more spiked body fluid samples at each of the listedconcentrations. Extract and analyze each sample as described in theExperimental Procedure section in the appropriate drug chapter.Plot the ratio of peak heights of the analyte and the internal stan-dard to the quantity of analyte added to the body fluid sample. Acalibration graph is then obtained by constructing the straight linewhich best fits the plotted points. The best fit straight line canbe determined by visual estimation, or more accurately, by the me-thod of “least squares” in which that straight line is drawn whichminimizes the sum of the squares of the vertical deviations fromthe line.
Figure 1 is an example of a computer-generated calibration graph.The significant features of the graph are the slope, the y-inter-cept, the linear range of the assay, and the variance of the mea-surements at different analyte concentrations. In this example the
11
FIGURE 1. A CALIBRATION GRAPH FOR ANALYSIS OF TETRA-HYDROCANNABINOL IN PLASMA
12

TABLE 2. SCHEME FOR ADDITION OF ANALYTE AND INTERNALSTANDARD (IS) TO BODY FLUID SAMPLES FORPREPARING CALIBRATION GRAPHS
Resulting AnalyteConcentration
Add to 1 ml of Body Fluid
100 µl of the 400- + No analyteng/ml IS solution
(ng/ml)
0
"
"
"
"
"
"
" + 100 µ1 of the 10-ng/mlanalyte solution
1
+ 100 µ1 of the 50-ng/mlanalyte solution
5
+ 100 µ1 of the 100-ng/mlanalyte solution
10
+ 100 µ1 of the 500 ng/mlanalyte solution
50
+ 100 µl of the 1-µg/mlanalyte solution
100
+ 100 µ1 of the 5-µg/mlanalyte solution
500
+ 100 µl of the 10-µg/mlanalyte solution
1000
variance is indicated by vertical bars representing the relativestandard deviation at each concentration measured. The slope andthe y-intercept are the functions used to calculate the quantityof analyte in an unknown based on the ion current response ratio.Assays using stable isotope labeled internal standards usually givecalibration lines with positive y-intercepts. The magnitude of they-intercept reflects the proportion of internal standard moleculescontaining no heavy isotopes (unlabeled molecules). A large y-inter-cept can significantly limit the sensitivity of the assay.
An important advantage to the use of stable isotope labeled inter-nal standards is that the slope of the calibration line should re-main constant as long as the compositions of the standard solutionsremain unchanged and the same volumes of standard solutions areadded to the body fluid samples. Because of the nearly identicalchemical and physical properties of the analyte and its isotopelabeled analog, their weight ratio should not be affected to any
13

significant extent by variations in the extraction, derivatization,chromatographic and mass spectrometric processes. For this reasonthe practice in our laboratories is to determine new calibrationgraphs only when new standard solutions arc prepared, or when theanalysis of control specimens containing known concentrations ofthe drug shows unacceptable variance from the true values.
If the concentration of a drug in an unknown specimen is found tobe greater than the highest concentration used in preparing thecalibration graph, the specimen should be reanalyzed after dilutionwith water or saline (typically 1:10) in order to bring its concen-tration within the extremes of the calibration graph. The alter-native practice of adding a larger quantity of internal standardto the specimen is less satisfactory because it requires prepara-tion of a new calibration graph.
SAMPLE EXTRACTION
One of the important criteria that guided our selection and evalu-ation of sample preparation procedures was that they should be assimple and rapid as possible while still providing adequate recoveryand separation of the analyte from compounds that could interferewith the GC/MS quantitation. The very high sensitivity and selec-tivity of GC/MS often permits use of relatively simple extractionprocedures, and we have attempted to fully exploit this feature.
A second major concern was to minimize loss of analyte due to adsorp-tion, evaporation, or decomposition. Even though use of stableisotope labeled internal standards can compensate for loss of a por-tion of the analyte through these processes, any loss of analytewill reduce the sensitivity of the assay. Loss of analyte due toadsorption on glass surfaces is particularly a problem when thequantity of analyte is in the low nanogram range. Adsorption canbe minimized by silylation of all glass surfaces with which solu-tions of the analyte will come in contact. Commercial formulationsare available for liquid-phase silylation of glass surfaces (forexample, Glas-Treet, Regis Chemical Co., Morton Grove, IL 60053).However, vapor-phase silylation is more convenient and less expen-sive if large quantities of glassware must be silylated on a regularbasis (10).
All glassware should be thoroughly cleaned before silylation. Theeasiest and most thorough method of removing organic contaminantsfrom glassware is to bake it off in a muffle furnace. Unfortunate-ly, a muffle furnace of sufficient capacity to handle normal labo-ratory glassware is expensive to purchase and operate. Chromicacid baths can also be used to remove all traces of organic materialfrom glassware, but they are messy and are a safety hazard. Conse-quently, in most laboratories glassware is cleaned by washing witha detergent solution followed by thorough rinsing with distilledwater. A final rinse with acetone helps to assure removal of anyremaining organic residue (11).
14

It is the practice in our laboratories to use high purity solventsfor preparation of standard solutions and all sample extractions,even though interference from solvent impurities is not nearly asmuch of a problem in GC/MS assays as it is in most other methodsfor drug analysis. High purity solvents from several commercialsources have proven satisfactory. We have not found it necessaryto redistill the solvents.
Some of the drugs discussed in this monograph are quite volatile,so care must be taken to avoid evaporative loss of the drug duringconcentration of the extract. Steps that have been taken to mini-mize evaporative loss of analyte include:
1. Eliminating the need for concentration of extracts byusing a very small quantity of extraction solvent (seeassays for methaqualone, cocaine, and diazepam).
2. Using highly volatile solvents such as methylene chloride,hexane, or 1-chlorobutane, which can be removed by heatingat mild temperatures ( 40 to 60°C) under a gentle streamof air or nitrogen.
3. Adding a small quantity (10 to 20 µl) of a high boilingliquid to the extract to act as a “keeper solvent” duringevaporative concentration.
Procedures for analysis of volatile basic drugs such as amphetamineoften specify addition of an acid prior to evaporative concentra-tion in order to convert the drug to a nonvolatile salt. In ourexperience the use of a keeper solvent such as dimethylformamide(DMF) is a more effective means of reducing loss due to evaporationof such drugs (see assays for phencyclidine, methadone, tetrahydro-cannabinol, amphetamine, methamphetamine, mescaline, and DOM). How-ever, it is important to establish that the keeper solvent does notexert adverse effects on the GC/MS assay. For example, we foundthat DMF could not be used in combination with trifluoroacetic an-hydride for derivatization of amphetamine. Apparently the DMF sup-pressed removal by evaporation of the trifluoroacetic acid formed inthe derivatization reaction, and subsequent injections of the highlyacidic mixture adversely affected the gas chromatography of the tri-fluoroacetamide derivative. This problem was avoided by using N-methyl-bis-(trifluoroacetamide) instead of trifluoroacetic anhy-dride to prepare the amphetamine trifluoroacetamide derivative (seeassays for amphetamine, methamphetamine, mescaline and DOM).
CALIBRATION AND PERFORMANCE EVALUATION OF THE GC/MS
In spite of substantial improvements in stability and reliability,gas chromatograph/mass spectrometers remain one of the most atten-tion-requiring of analytical instruments. In addition to havingcomplex electronic circuitry, the mass spectrometer includes keycomponents which can only be operated under high vacuum. If leaksdevelop in the vacuum system, or if the ionizer, mass analyzer, ordetector become contaminated, the performance of the instrument
15
deteriorates. Yet some contamination is inevitable, since samplesare introduced and effectively decomposed within the instrument’svacuum system. Likewise, gas chromatographic columns have a finitelifetime which often is reduced to only a few weeks when large num-bers of crude biological extracts are analyzed. For these reasonsit is imperative to evaluate the total system performance at reg-ular and frequent intervals.
The specific manner in which a GC/MS system is tuned up and cali-brated, and its performance evaluated, will vary with different in-struments, with the level of performance required for the particu-lar analyses, and according to the personal preferences of theoperator. The procedures described here have proven satisfactoryin our laboratories, and are intended as a guide to assist readersin establishing a systematic scheme appropriate for their own dailyinstrument “check-out.”
A thorough discussion of tune-ups and performance evaluation pro-cedures is beyond the scope of this chapter. Instead, the emphasishere is on procedures and suggestions which may not be included inoperator and maintenance manuals , but which we have found to beuseful in preparing to perform the types of analyses described inthis monograph.
Performance Evaluation Procedure
Before turning on the ionizer filament and the electron multipliervoltage to obtain mass spectra it is good practice to check the pres-sures in the ion source ( < 10-3 mm) and in the analyzer ( < 10-6 mm),as well as the GC column head pressure, to assure that no majorleaks have occurred. Following this preliminary check, set the GCcolumn at the maximum temperature to be used for the assay, and ob-serve the electron impact mass spectral background with and withoutthe helium carrier gas entering the ion source. Some increase inbackground will occur when the carrier gas is introduced into themass spectrometer. However, a very large increase in backrround iscause for concern. If the intensities of ions due to air [m/z 28.(N2
+), 32 (O2+), 40 (Ar+), and 34 (CO2
+)] become abnormally large;a leak in the GC system is indicated. The most common locationsof air leaks within the GC system are the injector septum and thecolunm connector fittings. Under methane or ammonia chemical ioni-zation conditions the air peaks will not be seen, and yet an airleak can significantly affect the instrument sensitivity. There-fore it is important to check for an air leak before switchingto chemical ionization. The appearance of abnormally intense ionpeaks at higher masses suggests that the GC column should be fur-ther conditioned or replaced.
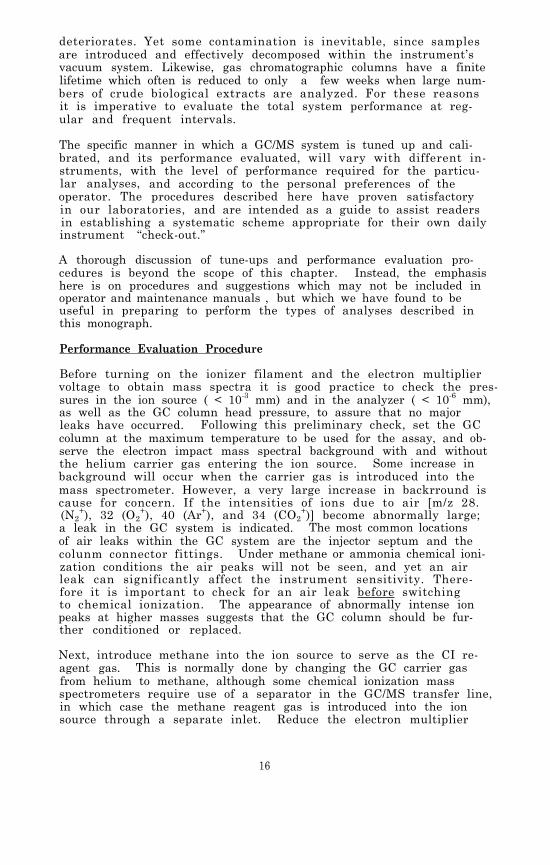
Next, introduce methane into the ion source to serve as the CI re-agent gas. This is normally done by changing the GC carrier gasfrom helium to methane, although some chemical ionization massspectrometers require use of a separator in the GC/MS transfer line,in which case the methane reagent gas is introduced into the ionsource through a separate inlet. Reduce the electron multiplier
16

voltage (to 1.2 KV) and the filament emission current (to 5 0microamps) to prevent possible damage to the electron multiplier,and observe the methane CI mass spectrum. It should be similarto the spectrum shown in Figure 2. The peak at m/z 19 is due toprotonated water and is often quite large, particularly just af-ter the instrument has been down for cleaning and maintenance. Thesize of the water peak can usually be reduced by an overnight sys-tem bakeout. However, if ammonia is to be used as the reagent gas,the adsorbed water in the system is unlikely to affect the ioniza-tion of sample molecules.
Return the electron multiplier voltage and filament current to theirnormal operating valves, and bleed a small quantity (about 10-5mmpartial pressure) of a suitable reference compound such as per-fluorotributylamine (often referred to as PFTBA or FC-43) into theion source and observe its methane CI mass spectrum. The relativeion intensities in CI mass spectra are often strongly affected bythe ion source temperature. At a source temperature of approxi-mately 150°C the methane CI mass spectrum of perfluorotributylamineshould look similar to that shown in Figure 3. At higher sourcetemperatures the high-mass ions tend to decrease in abundance re-lative to the low-mass ions. Either of the very abundant ions atm/z 219 and 414 in the methane CI mass spectrum of perfluorotribu-tylamine can be used to optimize source potentials, depending onwhich is closest to the analyte and internal standard ions thatwill be monitored.
In mass spectrometry, resolution and sensitivity are inversely re-lated. Normally the mass spectrometer is adjusted to give unit re-solution, i.e. base-line separation between consecutive integralmass peaks. However, in quantitative analysis using selected ionmonitoring, a gain in sensitivity can be achieved by decreasing themass resolution and thereby increasing the ion current passingthrough the mass analyzer. The degree to which the resolution canbe lowered is limited by the specificity required, and since speci-ficity is directly related to resolution, a decrease in resolutionwill increase the likelihood of interference from other ions. Inour laboratories the mass spectrometer is normally adjusted to unitresolution if the ions to be monitored have masses below 300, andthe resolution is reduced by about a factor of 2 when ions abovemass 300 are to be monitored.
After the mass spectral resolution has been set and the ion sourcepotentials optimized, the system's mass calibration should be checkedand recalibrated if necessary.
If the assay to be performed involves the use of ammonia as reagentgas, it is best to introduce the ammonia into the ion source throughan inlet line which is adjacent to or concentric with the GC/MStransfer line. We have found that introducing the ammonia gasthrough an inlet into the ion source at a location opposite to theentering carrier gas gives less satisfactory results.
17
FIGURE 2. METHANE REAGENT GAS IONS (ION SOURCE TEM-PERATURE, 150°C; PRESSURE, 1 x 10⁻³ MM)
18

FIGURE 3. METHANE CI MASS SPECTRUM OF PERFLUOROTRIBU-TYLAMINE (QUADRUPOLE MASS ANALYZER. IONSOURCE TEMPERATURE, 150°C; METHANE PRESSURE,1 x 10-3 MM; PFTBA PRESSURE, 1 x 10⁻⁵ MM)
19
Slowly increase the rate of flow of ammonia into the ion sourcewhile observing the ion intensities at m/z 18 and 35. As the ammoniaflow rate is increased, the intensity of the m/z 18 peak (NH4
+) shouldat first increase and then reach a plateau, at which point a peakat m/z 35 (NH3•NH4
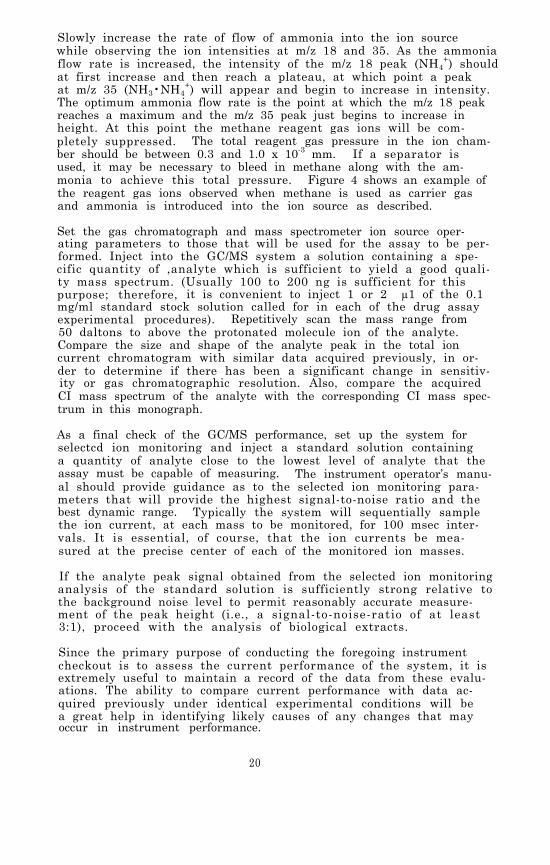
+) will appear and begin to increase in intensity.The optimum ammonia flow rate is the point at which the m/z 18 peakreaches a maximum and the m/z 35 peak just begins to increase inheight. At this point the methane reagent gas ions will be com-pletely suppressed. The total reagent gas pressure in the ion cham-ber should be between 0.3 and 1.0 x 10⁻³ mm. If a separator isused, it may be necessary to bleed in methane along with the am-monia to achieve this total pressure. Figure 4 shows an example ofthe reagent gas ions observed when methane is used as carrier gasand ammonia is introduced into the ion source as described.
Set the gas chromatograph and mass spectrometer ion source oper-ating parameters to those that will be used for the assay to be per-formed. Inject into the GC/MS system a solution containing a spe-cific quantity of ,analyte which is sufficient to yield a good quali-ty mass spectrum. (Usually 100 to 200 ng is sufficient for thispurpose; therefore, it is convenient to inject 1 or 2 µ1 of the 0.1mg/ml standard stock solution called for in each of the drug assayexperimental procedures). Repetitively scan the mass range from50 daltons to above the protonated molecule ion of the analyte.Compare the size and shape of the analyte peak in the total ioncurrent chromatogram with similar data acquired previously, in or-der to determine if there has been a significant change in sensitiv-ity or gas chromatographic resolution. Also, compare the acquiredCI mass spectrum of the analyte with the corresponding CI mass spec-trum in this monograph.
As a final check of the GC/MS performance, set up the system forselectcd ion monitoring and inject a standard solution containinga quantity of analyte close to the lowest level of analyte that theassay must be capable of measuring. The instrument operator’s manu-al should provide guidance as to the selected ion monitoring para-meters that will provide the highest signal-to-noise ratio and thebest dynamic range. Typically the system will sequentially samplethe ion current, at each mass to be monitored, for 100 msec inter-vals. It is essential, of course, that the ion currents be mea-sured at the precise center of each of the monitored ion masses.
If the analyte peak signal obtained from the selected ion monitoringanalysis of the standard solution is sufficiently strong relative tothe background noise level to permit reasonably accurate measure-ment of the peak height (i.e., a signal-to-noise-ratio of at least3:1), proceed with the analysis of biological extracts.
Since the primary purpose of conducting the foregoing instrumentcheckout is to assess the current performance of the system, it isextremely useful to maintain a record of the data from these evalu-ations. The ability to compare current performance with data ac-quired previously under identical experimental conditions will bea great help in identifying likely causes of any changes that mayoccur in instrument performance.
20
FIGURE 4. METHANE-AMMONIA REAGENT GAS IONS (ION SOURCETEMPERATURE, 150°C; AMMONIA PRESSURE, 2 x10⁻⁴ MM; METHANE PRESSURE, 8 x 10⁻⁴ MM)
21

A common cause of poor sensitivity in GC/MS assays is adsorptiveloss of the analyte within the GC column. Often the sensitivityimproves after 3 number of injections of analyte solution. “Prim-ing” of GC columns in this manner is a common practice in gas chro-matography. The effect of priming is most noticeable when a columnwas previously. used for analysis of chemically different compounds.Ideally a separate column should be reserved for each of the dif-ferent drugs commonly assayed. If this is not practical, columnsused for quantitation of basic compounds should at least not beinterchanged with those used for analysis of acidic compounds.
An inherent danger in column priming is that some of the adsorbedanalyte may be “washed off” the column during subsequent injections,resulting in an erroneously high value for the concentration ofanalyte measured. This potential source of error can be easilychecked by analyzing a sample blank (i.e. a body fluid extract con-taining the internal standard but none of the analyte) before be-ginning analysis of sample unknowns.
QUALITY CONTROL AND SOURCES OF ERROR
In addition to determining that the total GC/MS system performanceis satisfactory before beginning the analysis of sample unknowns,it is important intersperse spiked standards among sample un-knowns so that intra-day changes in instrument performance will beevident and documented. Control charts are effective means of main-taining a continuous record of the accuracy experienced with eachdrug assay (12,13).
Probably the largest source of error in GC/MS quantitative drugassays is that involved in preparing the standard solutions used inestablishing calibration graphs (5). Once the internal standardis added to the body fluid and becomes equilibrated, there are fewthings which will change the weight ratio of the drug to its stableisotope labeled analog.
Incomplete equilibration of the internal standard in the body fluidis a potential cause of poor precision. Unfortunately the time andthe conditions required for internal standards to achieve completeequilibration in terms of protein binding are difficult to deter-mine and undoubtedly vary for each drug and type of specimen. Theassay procedures in this monograph specify equilibration for 15 minbefore beginning the extraction, but we have no convincing data uponwhich to base this recommendation. Others routinely allow as longas 12 hr for equilibration (5).
In spite of the high specificity of the selected ion monitoring tech-nique, particularly when ammonia chemical ionization is used, ionsfrom endogenous compounds will occasionally interfere. Usually avisual examination of the ion current profile plots will indicatewhen an analyte or internal standard peak contains a contributionfrom another compound; that is, the peak width will be broader than
22
normal or its retention time will be slightly altered. However,we have seen a few rare cases where an endogenous compound had anidentical retention time and yielded ions at the same mass as eitherthe analyte or the internal standard. When this situation occursit can easily go undetected and result in erroneous data.
The experimental procedures can be altered in several ways if anunusually high degree of specificity is required. For example,the GC/MS analysis can be repeated using a GC column with a dif-ferent polarity liquid phase, or a high resolution glass capillarycolumn can be used. Also, prominent fragment ions can be monitoredin addition to the protonated molecule ions. This may require an al-teration of the ionization conditions, such as the substitution ofmethane for ammonia as the CI reagent gas.
To conclude this chapter, it is appropriate to reemphasize theremarkable versatility of the gas chromatograph/mass spectrometeras an analytical instrument. The experienced analyst will becomeaware of the full range of capabilities available and can thenchoose to modify the procedures in order to best satisfy specificanalytical needs.
REFERENCES
1. R.L. Foltz, D.A. Knowlton, D.C.K. Lin, and A.F. Fentiman, Jr.Proceedings of the Second International Conference on StableIsotopes, Oak Brook, IL, October 20-23, 1975.
2. A.F. Fentiman, Jr. and R.L. Foltz. J. Labelled Compounds,13, 579 (1977).
3. A.F. Fentiman, Jr. and R.L. Foltz. J. Labelled Compounds,12, 69 (1976).
4. Personal communication from Dr. Fred Falknier, Pfizer, CentralResearch, Groton, CT.
5. B.J. Millard. Quantitative Mass Spectrometry. Heyden, London(1978).
6. M.G. Lee and B.J. Millard. Biomed. Mass Spectr., 2, 78 (1975).
7. B. Samuelsson, M. Hamberg, and C.C. Sweeley. Anal. Biochem. ,38, 301 (1970).
8. R. Self. Biomed. Mass Spectr., 6, 315 (1979).
9. M. Claeys, S.P. Markey and W. Maenhaut. Biomed. Mass Spectr.,4, 122 (1977).
10. D.C. Fenimore, C.M. Davis, J.H. Whitford, and C.A. Harrington.Anal. Chem., 48, 2289 (1976).
23

11. R.R. Watts, ed. Analysis of Pesticide Residues in Human andEnvironmental Samples. U.S. Environmental Protection Agency,Health Effects Research Laboratory, Environmental ToxicologyDivision, Research Triangle Park, NC, Section 3A, p. 1-6 (1980).
12. D.L. Massart, A. Dijkstra, and L. Kaufman, eds. Evaluation andOptimization of Laboratory Methods and Analytical Procedures.Elsevier, Amsterdam (1978).
13. H.C. Curtius and M. Roth, eds Clinical Biochemistry, Princi-ples and Methods. Walter de Gruyter, New York, NY, 1, p. 594-617 (1974).
24
Chapter 3
Phencyclidine (PCP)
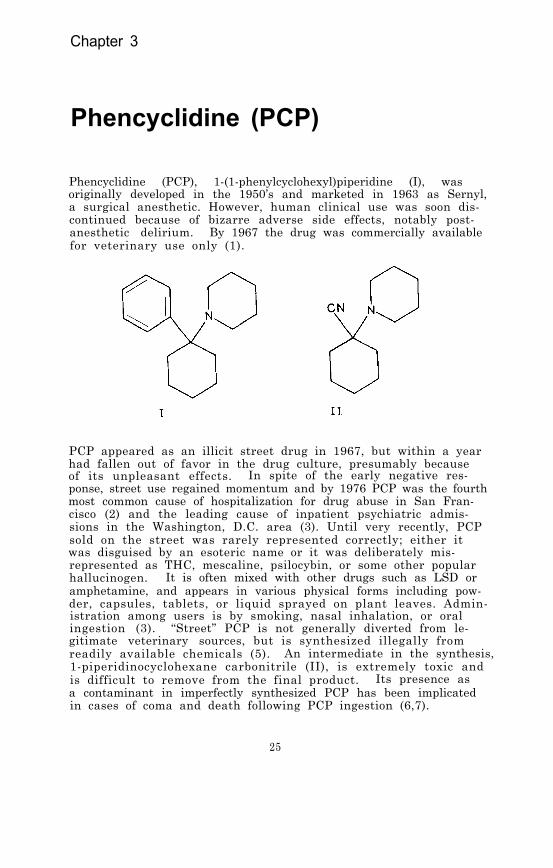
Phencyclidine (PCP), 1-(1-phenylcyclohexyl)piperidine (I), wasoriginally developed in the 1950’s and marketed in 1963 as Sernyl,a surgical anesthetic. However, human clinical use was soon dis-continued because of bizarre adverse side effects, notably post-anesthetic delirium. By 1967 the drug was commercially availablefor veterinary use only (1).
PCP appeared as an illicit street drug in 1967, but within a yearhad fallen out of favor in the drug culture, presumably becauseof its unpleasant effects. In spite of the early negative res-ponse, street use regained momentum and by 1976 PCP was the fourthmost common cause of hospitalization for drug abuse in San Fran-cisco (2) and the leading cause of inpatient psychiatric admis-sions in the Washington, D.C. area (3). Until very recently, PCPsold on the street was rarely represented correctly; either itwas disguised by an esoteric name or it was deliberately mis-represented as THC, mescaline, psilocybin, or some other popularhallucinogen. It is often mixed with other drugs such as LSD oramphetamine, and appears in various physical forms including pow-der, capsules, tablets, or liquid sprayed on plant leaves. Admin-istration among users is by smoking, nasal inhalation, or oralingestion (3). “Street” PCP is not generally diverted from le-gitimate veterinary sources, but is synthesized illegally fromreadily available chemicals (5). An intermediate in the synthesis,1-piperidinocyclohexane carbonitrile (II), is extremely toxic andis difficult to remove from the final product. Its presence asa contaminant in imperfectly synthesized PCP has been implicatedin cases of coma and death following PCP ingestion (6,7).
25

PHARMACOLOGY
The pharmacology of PCP is dose-dependent and complex. The drugacts primarily on the central nervous system as a depressant, butin a manner distinctly different from that of the sedative-hypnoticclass of depressants. Studies in rats have shown it to be a potentcompetitive inhibitor of catecholamine uptake in both the dopamin-ergic and noradrenergic regions of the brain. This, combined withits anticholinergic properties, makes PCP an unusual and, there-fore, an attractive substance for studies of model psychoses (8).In its original human surgical doses (0.25 mg/kg body weight givenintravenously), PCP was found to induce unresponsiveness and com-plete anesthesia although the patients appeared to he awake. Bloodpressure was elevated. With intravenous doses of 0.5-1 mg/kg, agi-tation and seizure activity appeared. Following even a small oral“street” dose (commonly 1-6 mg), the initial “high,” during whichthe subject is unresponsive but confused and agitated, is followedby depression, irritability, feelings of isolation, and sometimesparanoia. Doses of 10-20 mg, possible even by smoking, are suf-ficient to induce stupor or coma, and the larger amounts possiblewith oral ingestion can precipitate fatal epileptic seizures orhypertensive crises. Blood concentrations of PCP as low as 0.10µg/ml have been associated with behavioral effects leading to injuryor death, while concentrations greater than 1.0 µg/ml cause comain most individuals. Blood concentrations over 2.0-2.5 µg/ml aregenerally fatal (9). Recovery from sublethal doses usually occurswithin a few hours when the drug has been smoked or inhaled, butoral ingestion is characterized by a recovery period of days orweeks (2). It has been suggested that these prolonged effectsmay be due to the lipophilic nature of PCP; in rats high concentra-tions of the drug were found in adipose tissue long after its dis-appearance from plasma and urine (10). Also, the analysis ofblood and tissue samples from phencyclidine-related fatalities re-vealed that in all cases tissue concentrations greatly exceededthose in blood, and blood levels were similar to those found in theplasma from casual users (11). Therefore, since PCP concentratesin tissue, plasma concentrations may not adequately reflect theseverity of ingestion.
Schizophrenic psychosis, as opposed to short-tern intoxication,can persist for several weeks after the use of PCP, and appears tobe related to personality factors and/or individual drug sensitiv-ity. The drug has been found to be teratogenic (12). While deathsresulting from true pharmacologic overdoses of PCP have been re-ported, in many other cases death has resulted from the behavioraltoxicity of the drug; i.e., accidental drowning or violence pro-voked by aggressive hehavior (13). Clinically significant inter-actions of PCP with other drugs of abuse have been suggested byanimal experiments. For example, in monkeys PCP strongly potenti-ates the effects of pentobarbital, including respiratory depression.PCP has also been found to reinforce drug self-administration inmonkeys, the only hallucinogen which is known to do so, and somehuman chronic users report psychological dependence and behavioraltolerance. However, no evidence for physical dependence has beenreported either in man or animals (14).
26

The pharmacology and toxicology of PCP are reviewed in papers pu-blished in 1974 (1.5) and in 1978 (9). Also, a National Instituteon Drug Abuse monograph reviews many aspects of the abuse of PCP,treatment of PCP intoxications,(16).
and the pharmacology of the drug
PHARMACOKINETICS AND METABOLISM
Phencyclidine, with a pKa of 8.5, appears to be rapidly metabolizedand excreted. About 60 percent of labeled PCP given intravenouslyto monkeys appeared in the urine within 12 hours and 75 percentwithin eight days (17). In cases of acute intoxication in humans,urine concentrations have been used to predict the duration of coma(2). A comparison of plasma with urinary PCP concentrations in hu-man “overdose” cases showed that urinary concentrations of PCP were13-19 times the concurrent concentrations in plasma (18). A plasmaelimination half-life of about 11 hours has been reported in a caseof human PCP ingestion (19). It has been shown, however, that PCPis excreted much more rapidly in acidic urine, and several severelyintoxicated patients have been successfully treated by urine acidi-fication procedures, such as gastric infusion with NH4Cl (20).
In man, PCP is excreted primarily as monohydroxylated derivativesin the form of conjugates. Two of these metabolites, isolated fromhuman urine after enzymatic hydrolysis, were identified by massspectrometry as 4-phenyl-4-piperidinocyclohexanol (III) and 1-(1-phenylcyclohexyl)-4-hydroxypiperidine (IV) (21). Both metaboliteswere found to exhibit weak pharmacological activity in test animals(22)
Traces of a N-dealkylated metabolite, 1-phenylcyclohexylamine (V),have also been detected in the urine of a PCP-intoxicated patient(23). Dihydroxy metabolites are produced in rats, mice, pigeons,sheep, and monkeys, and in these animals PCP tends to be less toxicthan in species which have a weaker capacity for hydroxylation (24).In tests on monkeys, no metabolites were detected in central orperipheral tissue, although unchanged PCP was present in sciaticnerve, spinal cord, and brain (17). The detection of PCP metabo-lites in human blood has not been reported.
27
ANALYTICAL METHODOLOGY
Generally, the urine of patients seen on an emergency basis con-tains a sufficiently high concentration of unmetabolized PCP(>0.2 mg/ml) to permit qualitative detection by any of a varietyof analytical methods (25). These have included thin-layer chroma-tography (TLC), with a sensitivity of 0.2 µg/ml (26) and gas chroma-tography (GC) with a sensitivity of 2.0 µg/ml (27). GC combinedwith mass spectrometry (28,29) and TLC (30) has been used to iden-tify PCP in confiscated street drug samples. However, both clini-cal work and pharmacokinetic studies have been hampered by the lackof reliable quantitative methods for analysis of PCP in biologicalfluids. Hoffmann-La Roche markets a radio-immunoassay (RIA) kit forPCP and Syva is field testing a homogeneous enzyme immunoassay(EMIT) for the drug. To date, however, the sensitivities and spe-cificities of these assays have not been published.
Recently, a method using ultraviolet spectroscopy was reported,which was able to measure PCP concentrations in urine extracts con-taining as little as 0.01 mg of the drug by comparison with stan-dard absorbance curves. However, when other basic drugs were pre-sent in the sample, GC assay with a flame ionization detector (FID)was used. Methadone was chosen as the internal standard. TheGC-FID system (Chromosorb W coated with Apiezon L, column tempera-ture 200ºC) detected 0.076 µg/ml of PCP added to urine, and mea-sured a range of 0.1-69.4 µg/ml of the drug in samples from hos-pital admissions (31).
For rapid analysis of urine for PCP in a clinical setting, tempera-ture-programmed (150- 230°) GC-FID on a column of 5 percent SE-30plus 1 percent Carbowax 20M on Chromosorb WHP has been suggested.A metabolite, 1- (1-phenylcyclohexyl)-4-hydroxypiperdine (IV) isalso observable by this technique, to confirm the presence of PCPeven when the drug has been extensively metabolized (32).
A GC-FID method using mepivicaine as the internal standard and anOV-1 or OV-17 column at 180°C, was applied to blood and tissue sam-ples as well as to urine. Blood concentrations in fatal overdosecases ranged from 0.5 to 5.0 µg/ml, and in liver tissue from thesame individuals, from 5.0 to 36.0 µg/g (33). Human plasma PCPconcentrations in clinical cases, which covered a range of 0.09-0.22 µg/ml, were measured by a similar GC-FID technique (3.8 per-cent UCW-98 on Gas Chrom Q at 200°C column temperature) usingketamine as the internal standard (19). Improved sensitivity andselectivity were achieved in a GC method by using a nitrogen-phosphorus detector (3 percent OV-17, 165°C isothermal). Meperi-dine was used as the internal standard because of its chemicalsimilarity to PCP. The method gave a linear calibration curve upto 1 µg/ml and could detect as little as 10 ng/ml of PCP in plasma(11).
The combination of GC and MS with selected ion monitoring and theuse of an isotope-labeled variant as the internal standard hasbeen applied to the quantitation of PCP in blood and urine. Sincean initial report of the adaptation of GC/MS to the assay of PCP
28

(21), the technique has been applied to a study of blood concen-trations in 26 PCP intoxications where concentrations ranged from0.007 to 0.250 µg/ml (34), and to studies of serial plasma andurine samples in an effort to correlate PCP concentrations withthe duration of psychotropic effects (20). GC/MS analysis of PCPhas also been adapted to an automated procedure using probabilitybased matching, in a computerized GC/MS system (Olfax) utilizinga reverse-search algorithm for the measurement of PCP levels inthe urine. The method permits analysis of up to eight samplesper hr and has a detection limit of approximately 10 ng/ml ofPCP (35).
For quantitative studies of PCP, it is important to note that phency-clidine undergoes progressive thermal decomposition to 1-phenylcy- clohexene as temperatures rise above 150°C. To minimize pyrolysisduring gas chromatograpny, the injection port temperature should bekept below 200°C (21,25,36).
Solvents which have been used for the extraction of PCP from alka-line biological fluids include hexane, with an overall recovery of70-85; percent (21); cyclohexane, 95 percent (used only for urine)(35); petroleum ether, 76 percent from plasma (19); diethyl ether(34); 1-chlorobutane (33); 95 percent ethanol (for TLC of urine)(30); and chloroform, for urine only, with 83 percent recovery re-ported (27,31). Increasing the pH of the urine to 9 reportedlyallows 94 percent recovery of PCP and quantitative recovery of thenydroxy metabolite with chloroform (32). Extraction from urine bya reverse phase XAD-2 resin procedure, with quantitative recover)of PCP and 89 percent of the metabolite, has also been reported.Back: extraction into aqueous acid is often used in order to separ-ate PCP from neutral and acidic materials, followed by realkalini-zation and reextraction with an organic solvent.
EXPERIMENTAL PROCEDURE
Because phencyclidine can be psychoactive at low blood concentra-tions the GC/MS analytical procedure is designed to measure thedrug at plasma concentrations as low as 1 ng/ml. The extractionprocedure consists of addition of deuterium-labeled phencyclidineand a pH 9.6 buffer to the plasma, followed by extraction withhexane, back extraction into acid, and finally, alkalinization andreextraction with hexane. Chemical ionization with methane andammonia as reagent gases is used for the GC/MS analysis.
Standards and Reagents
Phencyclidine hydrochloride was purchased from Applied ScienceLaboratories, State College, PA 1680l. Phencyclidine-2H5 (1-[1-(phenyl-2H5) cyclohexyl]piperidine) was synthesized from bromoben-zene-2H5 by a published procedure (38). It was found to be 99percent pure based on GC/MS analysis. Over 99 percent of the mole-cules contained five deuterium atoms and less than 0.1 percent ofthe molecules were undeuterated.
29
A suitable pH 9.6 buffer can be prepared by dissolving 500 gramsof potassium monohydrogen phosphate (K2HPO4) in about 500 ml ofdistilled water. When all of the salt is dissolved, allow thesolution to cool to room temperature and add sufficient water togive exactly 1 liter.
Stock solutions of phencyclidine and phencyclidine-2H5, used forthe determination of calibration graphs (Chapter 2) and the prepara-tion of working standards, are prepared as follows. Weigh into a100-ml volumetric flask 11.5 mg of phencyclidine hydrochloride or10 mg of the free base. Dissolve the drug in methanol and bringthe volume to exactly 100 ml with additional methanol. The re-sulting stock solution will correspond to a concentration of 0.10mg/ml of phencyclidine calculated as the free base. A series ofworking standard solutions can then be prepared by appropriatedilution of the stock solution as described in Chapter 2.
The stock solution of phencyclidine-2H5 is prepared in the samemanner. For the measurement of phencyclidine in body fluids withinthe concentration range of 1 to 1000 ng/ml, addition of approxi-mately 40 ng of the internal standard to each ml of specimen issatisfactory. This can be conveniently done by adding 100 µ1 ofa 400-ng/ml phencyclidine-2H5 methanolic solution to each ml ofsample. Prepare the 400-ng/ml standard solution bv diluting 1 mlof the 0.10-mg/ml stock solution of phencyclidine-2H5 to 250 mlwith methanol. Store stock and working standard solutions inwell-stoppered or capped glass vessels under refrigeration.
Extraction
Transfer 1 ml of specimen (whole blood, plasma, urine, or cerebro-spinal fluid) to a 20-ml culture tube equipped with a Teflon-linedscrew cap (0.5 to 2 ml of specimen can be used, but it must be mea-sured accurately). Add 100 µ1 of the 400-ng/ml phencyclidine-2H5internal standard solution to the body fluid and vortex for 10 sec.Allow the sample to equilibrate for about 15 min and then add 1 mlof the pH 9.6 buffer and 5 ml of hexane. Cap the tube and checkfor a leak around the cap. Gently mix the contents for 30 minusing a motorized rocker or rotator. Centrifuge for 5 min and thentransfer the organic layer (top) to a clean culture tube by meansof a disposable Pasteur pipette. Add 5 ml of 0.2 N H2SO4 and vig-orously agitate for about 1 min. Remove and discard the hexanelayer (top). Add a sufficient quantity of 1 N NaOH to the aqueouslayer to raise the pH to 9.5. Add 5 ml of hexane and again agitatevigorously for about 1 min. Centrifuge and transfer the organiclayer (top) to a silylated concentrator at least 5 ml in volumeand having a conical or nipple-shaped bottom. Add 20 µ1 of dimethyl-formamide as a “keeper” solvent to minimize evaporative loss ofthe phencyclidine. Remove the hexane by evaporation under a gen-tle stream of nitrogen or filtered air while heating at 40 to 50°C.When the extract volume has decreased to about 20 µ1, stopper thetube or cover the top with Parafilm and store at 0°C until the GC/MSanalysis is to be performed. Inmediately prior to the analysis,allow the tube to warm to room temperature.
30
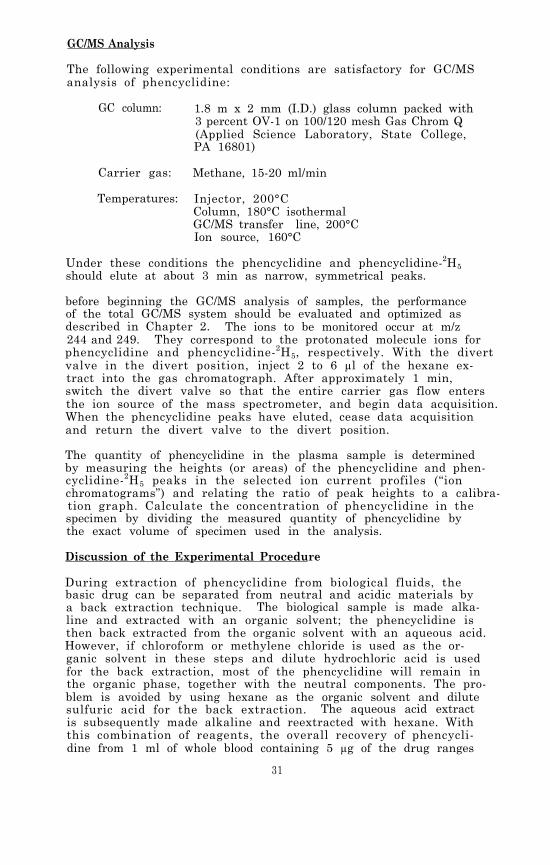
GC/MS Analysis
The following experimental conditions are satisfactory for GC/MSanalysis of phencyclidine:
GC column: 1.8 m x 2 mm (I.D.) glass column packed with3 percent OV-1 on 100/120 mesh Gas Chrom Q(Applied Science Laboratory, State College,PA 16801)
Carrier gas: Methane, 15-20 ml/min
Temperatures: Injector, 200°CColumn, 180°C isothermalGC/MS transfer line, 200°CIon source, 160°C
Under these conditions the phencyclidine and phencyclidine-2H5should elute at about 3 min as narrow, symmetrical peaks.
before beginning the GC/MS analysis of samples, the performanceof the total GC/MS system should be evaluated and optimized asdescribed in Chapter 2. The ions to be monitored occur at m/z244 and 249. They correspond to the protonated molecule ions forphencyclidine and phencyclidine-2H5, respectively. With the divertvalve in the divert position, inject 2 to 6 µl of the hexane ex-tract into the gas chromatograph. After approximately 1 min,switch the divert valve so that the entire carrier gas flow entersthe ion source of the mass spectrometer, and begin data acquisition.When the phencyclidine peaks have eluted, cease data acquisitionand return the divert valve to the divert position.
The quantity of phencyclidine in the plasma sample is determinedby measuring the heights (or areas) of the phencyclidine and phen-cyclidine-2H5 peaks in the selected ion current profiles (“ionchromatograms”) and relating the ratio of peak heights to a calibra-tion graph. Calculate the concentration of phencyclidine in thespecimen by dividing the measured quantity of phencyclidine bythe exact volume of specimen used in the analysis.
Discussion of the Experimental Procedure
During extraction of phencyclidine from biological fluids, thebasic drug can be separated from neutral and acidic materials bya back extraction technique. The biological sample is made alka-line and extracted with an organic solvent; the phencyclidine isthen back extracted from the organic solvent with an aqueous acid.However, if chloroform or methylene chloride is used as the or-ganic solvent in these steps and dilute hydrochloric acid is usedfor the back extraction, most of the phencyclidine will remain inthe organic phase, together with the neutral components. The pro-blem is avoided by using hexane as the organic solvent and dilutesulfuric acid for the back extraction. The aqueous acid extractis subsequently made alkaline and reextracted with hexane. Withthis combination of reagents, the overall recovery of phencycli-dine from 1 ml of whole blood containing 5 µg of the drug ranges
31

between 70 and 85 percent.
During early work with phencyclidine, it was noticed that GC anal-yses of the drug typically showed a second peak eluting considerablybefore phencyclidine. The second peak was identified as 1-phenyl-cyclohexene on the basis of its mass spectrum and comparison withauthentic material (Aldrich Chemical Co., Milwaukee, WI). 1-Phenyl-cyclohexene is a thermal decomposition product of phencyclidine.Consequently, when phencyclidine is gas chromatographed, the sizeof the 1-phenylcyclohexene peak is dependent on the injection porttemperature. Figure 1 shows the flame ionization detector record-ings which resulted from gas chromatography of phencyclidine withinjection port temperatures of 300, 250, and 200°C. The 1-phenyl-cyclohexene peak decreased in size as the injection port tempera-ture was lowered. At an injection port temperature of 200°C the1-phenylcyclohexene peak amounted to only 0.5 percent of the phen-cyclidine peak height. At an injection port temperature of 150°Cthe 1-phenylcyclohexene peak was still detectable, but it now re-presented only 0.1 percent of the phencyclidine peak height. Inview of the thermal lability of phencyclidine, it is important tokeep all surfaces which may come in contact with the drug at thelowest practical temperature. For example, if the GC/MS separatoris heated to 280°C some of the phencyclidine eluting from the gaschromatographic column will be thermally converted to 1-phenyl-cyclohexene.
The electron impact (EI), methane chemical ionization (CICH4) , andmethane-ammonia chemical ionization (CICH4-NH3) mass spectra ofphencyclidine are shown in Figure 2. The EI spectrum of phency-clidine (top) snows an abundant ion at m/z 200 resulting from lossof C3H7 from the cyclohexyl ring. Since the deuterium atoms inthe internal standard are on the aromatic ring, the correspondingion in the mass spectrum of the deuterated phencyclidine is shiftedto m/z 205; therefore, the ions at m/z 200 and 205 are satisfac-tory for selected ion monitoring. In the methane CI mass spectrum(middle), the M+ is more intense than the MH+, suggesting thatcharge transfer competes effectively with proton transfer when meth-ane is used as the reagent gas. In the methane-ammonia CI massspectrum (bottom) the protonated molecule ions give the most in-tense peak and fragmentation is virtually absent. Relative re-sponses for prominent ions in the various modes of ionization arecompared in Table 1. The values in the last column of Table 1indicate that the best sensitivity is achieved with a mixture ofmethane and ammonia as the reagent gas. These data were acquiredon two separate Finnigan 3200 GC/MS systems, one optimized for EIand the other for CI. If maximum sensitivity is important, eachmethod of ionization should be evaluated on the specific GC/MSsystem(s) to be used for the analysis. Sensitivities can varysignificantly from instrument to instrument.
To evaluate the reproducibility of the method, five independentreplicate analyses were performed on 1-ml samples of whole bloodcontaining 100 ng of phencyclidine and 50 ng of the internal stan-dard. Methane was used as the reagent gas and ions were monitoredat m/z 159 and 164, and at m/z 243 and 248. The relative standarddeviations for the peak height ratios were 2.9 and 2.3, respectively.
32

FIGURE 1. GAS CHROMATOGRAMS SHOWING GENERATION OF 1-PHENYLCYCLOHEXENE FROM INJECTION OF PHENCY-CLIDINE AT HIGH INJECTION PORT TEMPERATURES
33
FIGURE 2. MASS SPECTRA OF PHENCYCLIDINE
34

TABLE 1. RELATIVE RESPONSES FOR PROMINENT IONS IN THEEI AND CI MASS SPECTRA OF PHENCYCLIDINE
Relative ResponsePercent of Total Per Unit Weight
Method m/z Monitored Ion Current of Drug
EI 200 (M+ -C3H7) 14 59
CI (CH4) 243 (M+) 24 20
CI (CH4+NH3) 244 (MH+) 73 100
Table 2 lists phencyclidine concentrations found in various bodyfluids from phencyclidine-intoxicated patients. Blood concentra-tions ranged from 49 ng/ml for a child in a coma, to 2.7 µg/mlfound in an adult who died following an overdose.
TABLE 2. CONCENTRATIONS OF PHENCYCLIDINE IN BODY FLUIDSFROM PHENCYCLIDINE INTOXICATED PATENTS
Case Number Blood Urine CSF Serum
1(Adult, fatal)
2.7 µg/ml
2(Child, coma)
49 ng/ml 910 ng/ml 6.5 ng/ml
3
(Youth, drowsy)51 ng/ml 870 ng/ml
4 a 171 ng/ml
5b 73 ng/ml
aThe condition of the patient was described as "serious."bThe condition of the patient was described as "fairly serious."
35

PHYSICAL, CHEMICAL AND SPECTROMETRIC DATA FOR PHENCYCLIDINE
Nomenclature
Chemical Name: 1-(1-Phencyclohexyl)piperidine
Other Names: Phencyclidine, HOG, PCP, CI-395, Angel dust
Empirical Formula: C17H25N
Chemical Abstracts Registry Number: 77-10-1
Trade Names of Hydrochloride: Sernyl, Sernylan
Physical Constants
Appearance: White crystals
Melting Point: 46-46.5°C; hydrochloride, 243-244°C
Boiling Point: 135-137°C (1.0 mm)
Specific Rotation: Optically inactive
Solubility: The hydrochloride is soluble in hater, ethanol andchloroform.
REFERENCES
1. Unsigned. PCP (Phencyclidine): The New Disillusionogen.STASH Press, Madison, WI (1975).
2. Unsigned. Emergency Med. , 8 (3), 265 (1976).
3. P.V. Luisada and B.I. Brown. Clin. Toxicol., 9 (4), 539(1976).
4. G.D. Lundberg, R.C. Gupta, and S.H. Montgomery. Clin. Toxicol.,9 (4), 503 (1976).
5. A.T. Snulgin and D.E. Mac Lean. Clin. Toxicol., 9 (4), 553(1976).
6. C. Helisten and A.T. Snulgin. J. Chromatog., 117, 232 (1976).
7. D. Gagne and R.K. Pike. J. Assoc. Off. Anal. Chem., 60, 32(1977).
8. K.E. Garey and R.G. Heath. Life Sciences., 18, 1105 (1976).
9. R.S. Burns and S.E. Lerner. Clin. Toxicol., 12, 463 (1978).
10. S.H. James and S.H. Schnoll. Clin. Toxicol., 9 (4), 573 (1976).
36

11. D.N. Bailey, R.F. Shaw, and J.J. Guba. J. Anal. Toxicol., 2,233 (1978).
12.
13.
14.
15.
16.
17.
18.
19.
20.
21.
22.
23.
24.
25.
26.
27.
28.
29.
30.
F. Walker. Science, 184, 189, (1974).
R.S. Burns and S.E. Lerner. Clin. Toxicol., 9 (4), 477 (1976).
R.L. Balster and L.D. Chait. Clin. Toxicol., 9 (4), 513 (1976).
J.C. Munch. Bull. Narcotics, 26 (4), 9 (1374).
R.C. Petersen and R.C. Stillman, eds., Phencyclidine (PCP)Abuse: An Appraisal. National Institute on Drug AbuseResearch Monograph 21, DHEW Pub. (ADM) 78-728. Supt. of Docs.,U.S. Govt. Print. Off Washington, D.C. (August 1978).
R.E. Ober, G.W. Gwynn, T. Chang, D.A. McCarthy, and A.J.Glazko. Fed. Proc., 22, pt. 1, 539 (1963).
E.F. Domino and A.L. Wilson. Clin. Pharmacol. Therap., 22,421 (1977).
J.A. Marshman, M.P. Ramsay, and E.M. Sellers. Toxicol. Appl.Pharmacol., 35, 129 (1976).
A. h. Done, R. Aronow, J.A. Miceli, and D.C.K. Lin, in B.H.Rumack and A.R. Temple, eds., Management of the PoisonedPatient. Science Press, Princeton, NJ, p. 79 (1977).
D.C.K. Lin, A.F. Fentiman, Jr., K.L. Foltz, R.D. Forney, Jr.,and I. Sunshine. Biomed. Mass Spectr., 2, 206 (1975).
E.F. Domino. Int. Rev. Neurobiol., 6, 303 (1964).
L.K. Wong and K. Biemann. Biomed. Mass Spectr., 2, 204 (1975).
H.B. Hucker. Ann. Rev. Pharmacol., 10, 99 (1970).
C.B. Liden, F.H. Lovejoy, Jr., and C.E. Costello. J. Amer. Med.Assoc., 234 (5), 513 (1975).
N.C. Jain, R.D. Budd, W.J. Leung, and T.C. Sneath. J. Anal.Toxicol., 1, 77 (1977).
B.S. Finkle, E.J. Cherry, and D.M. Taylor. J. Chromatogr. Sci.,9, 393 (1971).
J.-E. Lindgren, C.-G. Hammer, R. Hessling, and B. Holmstedt.Am. J. Pharm., 141, 86 (1969).
R.C. Shaler, J.M. Parker, and A. Sage. Clin. Toxicol., 7 (3),307 (1974).
J.K. Brown, L. Shapazian, and G.D. Griffin. J. Chromatogr.,64, 129 (1972).
37
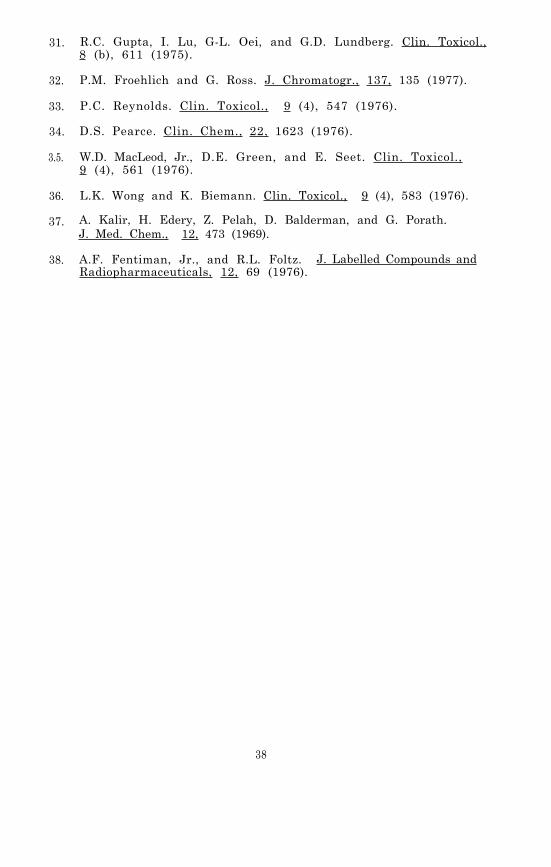
31.
32.
33.
34.
3.5.
36.
37.
38.
R.C. Gupta, I. Lu, G-L. Oei, and G.D. Lundberg. Clin. Toxicol.,8 (b), 611 (1975).
P.M. Froehlich and G. Ross. J. Chromatogr., 137, 135 (1977).
P.C. Reynolds. Clin. Toxicol., 9 (4), 547 (1976).
D.S. Pearce. Clin. Chem., 22, 1623 (1976).
W.D. MacLeod, Jr., D.E. Green, and E. Seet. Clin. Toxicol.,9 (4), 561 (1976).
L.K. Wong and K. Biemann. Clin. Toxicol., 9 (4), 583 (1976).
A. Kalir, H. Edery, Z. Pelah, D. Balderman, and G. Porath.J. Med. Chem., 12, 473 (1969).
A.F. Fentiman, Jr., and R.L. Foltz. J. Labelled Compounds andRadiopharmaceuticals, 12, 69 (1976).
38
Chapter 4
MethaqualoneMethaqualone (2-methyl-3-o-tolyl-4(3H) -quinazolinone, I) was firstsynthesized in 1951 after the elucidation of the structure of febri-fugine, the active principle of the ancient Chinese antimalarialCh’ang Shan, stimulated interest in the medicinal chemistry ofquinazoline derivatives (1).
It was introduced in Europe in 1956 and into the United States in1965, advertised as a nonbarbiturate, nonaddictive sedative-hypnotic, and marketed under several trade names including Quaalude,Sopor, Optimil, Parest, and Somnafac. Within a few years, it hadbecome the sixth best selling sedative-hypnotic in this country(2). Methaqualone abuse was quick to follow, and by 1972 had reachedalmost epidemic proportions in the United States, although the firstcase of fatal poisoning had been reported in Europe at least tenyears earlier (3).
PHARMACOLOGY
Even in therapeutic doses (150-500 mg), methaqualone can producea sensual, euphoric state and a relaxed, intimate mood which ex-plains its popularity and abuse potential. However, the drug mayaccumulate in the blood following repeated doses and is addictiveafter prolonged use; abrupt withdrawal can result in death if notproperly supervised. Methaqualone is particularly dangerous whenconsumed with alcohol. Coma and convulsions can result from acuteingestion of 2 grams of methaqualone and death from 8 grams, butin the presence of alcohol these consequences can result from in-gestion of considerably smaller quantities of the drug (2). Since1973, illicit use of methaqualone has dropped dramatically, appar-ently because of tighter control of its manufacture and distribu-tion.
Methaqualone is a lipophilic, acid-soluble, quinazoline derivativeeasily prepared from anthranilic acid, o-toludine and an acetyla-
39
328-011 0 - 80 - 4

ting agent. It has a characteristic ultraviolet absorption spec-trum and is volatile enough for gas chromatography. Its pKa, cal-culated from UV spectral data, is 2.5 (4). Although resistant tochemical hydrolysis or oxidation, it is rapidly hydroxylated byhepatic microsomal enzymes to polar metabolites, which are excre-ted primarily as ß-glucuronic acid conjugates (1). Since metabo-lites of methaqualone are not present in significant amounts inblood (<0.2 µg/ml) after therapeutic doses, they probably contri-bute very little to the overall pharmacological response to metha-qualone (5) . However, a study of urinary metabolite patterns insix human volunteers given single or repeated therapeutic doses ofmethaqualone showed a higher urinary level of one metabolite, 2-methyl-3-(2'-hydroxymethylphenyl)-4(3H)-quinazolinone, in indivi-duals who demonstrated the most pronounced physiological response(lower tolerance) to the drug. Since the same metabolite has beenfound, unconjugated, in the blood of overdose patients, this com-pound may be pharmacologically active (6).
PHARMACOKINETICS AND METABOLISM
Binding studies by equilibrium dialysis have established that 80percent of adlministered methaqualone is protein-bound in plasmaover the whole therapeutic range of concentration. Based on thisobservation and on the assumption that only unconjugated metha-qualone is pharmacologically active, a comparison of the levels ofunbound drug in serum with levels in cerebrospinal fluid (CSF) bygas chromatographic measurement has indicated a passive, uninhibitedtransfer of drug to the CSF. However, drugs which compete for pro-tein binding sites could theoretically affect the transfer (7).Other workers have also pointed out the susceptibility of the phar-macokinetics of methaqualone to influence by other drugs, especiallydrugs able to influence hepatic microsomal oxidation. This isnot merely of academic interest, since methaqualone is used in manycompound formulations for treatment of a wide range of ailments,particularly in Germany (1). In this connection, a study of thekinetics of methaqualone in a formulation containing 250 mg metha-qualone, 300 mg carbromal, and 0.33 mg benactyzine, found 6-hrplasma levels of methaqualone to be lower than those usually re-ported for methaqualone alone. These results may indicate an effectof the other drugs on methaqualone metabolism, lending support tothe claim that the pharmaceutical formulation, Staurodorm, allevi-ates methaqualone “hangover” (8).
The most salient features of the results of pharmacokinetic studiesof methaqualone have been the wide variation in the rate of absorp-tion by different subjects and the faster absorption rate for thehydrochloride salt as compared with the free base (1). Plasmalevels of methaqualone following a single oral dose of 300 mg gener-ally reach a maximum of 1-8 µg/ml within 2 hr. The average plasmahalf life has been reported as 2.6 hr for the first, rapid excre-tory phase (9). A slow excretory phase becomes apparent as muchas 100 hr after ingestion, and the half life of this phase isvariously reported to be from 19 to 50 hr (10,11).
40
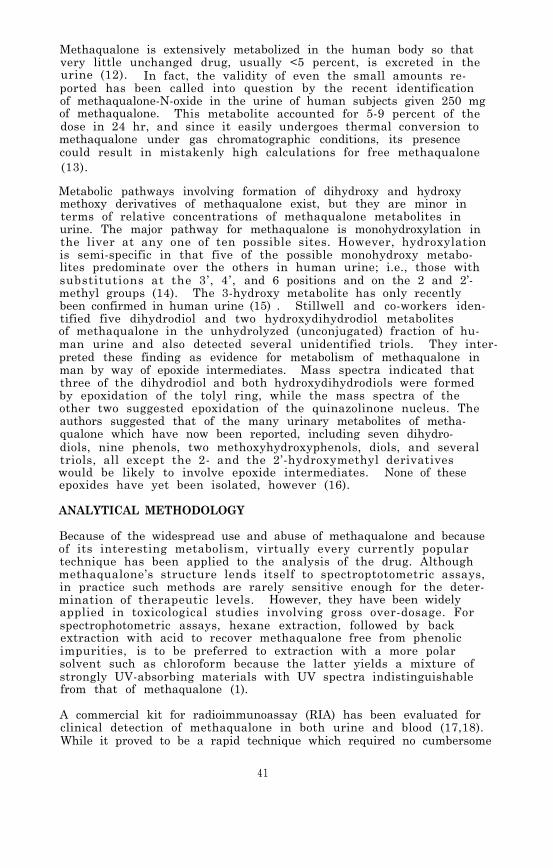
Methaqualone is extensively metabolized in the human body so thatvery little unchanged drug, usually <5 percent, is excreted in theurine (12). In fact, the validity of even the small amounts re-ported has been called into question by the recent identificationof methaqualone-N-oxide in the urine of human subjects given 250 mgof methaqualone. This metabolite accounted for 5-9 percent of thedose in 24 hr, and since it easily undergoes thermal conversion tomethaqualone under gas chromatographic conditions, its presencecould result in mistakenly high calculations for free methaqualone(13).
Metabolic pathways involving formation of dihydroxy and hydroxymethoxy derivatives of methaqualone exist, but they are minor interms of relative concentrations of methaqualone metabolites inurine. The major pathway for methaqualone is monohydroxylation inthe liver at any one of ten possible sites. However, hydroxylationis semi-specific in that five of the possible monohydroxy metabo-lites predominate over the others in human urine; i.e., those withsubstitutions at the 3’, 4’, and 6 positions and on the 2 and 2’-methyl groups (14). The 3-hydroxy metabolite has only recentlybeen confirmed in human urine (15) . Stillwell and co-workers iden-tified five dihydrodiol and two hydroxydihydrodiol metabolitesof methaqualone in the unhydrolyzed (unconjugated) fraction of hu-man urine and also detected several unidentified triols. They inter-preted these finding as evidence for metabolism of methaqualone inman by way of epoxide intermediates. Mass spectra indicated thatthree of the dihydrodiol and both hydroxydihydrodiols were formedby epoxidation of the tolyl ring, while the mass spectra of theother two suggested epoxidation of the quinazolinone nucleus. Theauthors suggested that of the many urinary metabolites of metha-qualone which have now been reported, including seven dihydro-diols, nine phenols, two methoxyhydroxyphenols, diols, and severaltriols, all except the 2- and the 2’-hydroxymethyl derivativeswould be likely to involve epoxide intermediates. None of theseepoxides have yet been isolated, however (16).
ANALYTICAL METHODOLOGY
Because of the widespread use and abuse of methaqualone and becauseof its interesting metabolism, virtually every currently populartechnique has been applied to the analysis of the drug. Althoughmethaqualone’s structure lends itself to spectroptotometric assays,in practice such methods are rarely sensitive enough for the deter-mination of therapeutic levels. However, they have been widelyapplied in toxicological studies involving gross over-dosage. Forspectrophotometric assays, hexane extraction, followed by backextraction with acid to recover methaqualone free from phenolicimpurities, is to be preferred to extraction with a more polarsolvent such as chloroform because the latter yields a mixture ofstrongly UV-absorbing materials with UV spectra indistinguishablefrom that of methaqualone (1).
A commercial kit for radioimmunoassay (RIA) has been evaluated forclinical detection of methaqualone in both urine and blood (17,18).While it proved to be a rapid technique which required no cumbersome
41

sample preparation, it was unable to distinguish between methaqua-lone and its metabolites, some of which were as reactive as theparent compound and others less so or not at all. Metabolites pre-sent were additive in their effect on the concentration reading.Standard RIA curves prepared in serum for methaqualone and fivemetabolites demonstrated a detection sensitivity of 2 ng/ml, butbecause of the contribution of metabolites to the measured levels,RIA in the form tested would be useful as a screening procedureonly.
For quantitative studies, gas chromatographic (GC) methods havebeen developed, some reporting detection levels as low as 0.01µg/ml for methaqualone in plasma. This degree of sensitivity wasachieved in a method reported by Berry in 1969, which involved ex-traction of 5.0 ml plasma, after pH adjustment by addition of 1.0ml 1N NaOH, with 15 ml of hexane followed by gas chromatography ona column coated with 3 percent cyclohexanedimethyl succinate. Buto-barbital was used as an internal standard. An extraction efficiencyof 96 percent was reported for this method (19).
An extraction efficiency of 98-100 percent was reported for a tech-nique in which saturated NaH2PO3 solution was added to serum inorder to precipitate proteins and lipoproteins and free the drugfrom binding sites before extraction with n-hexane. After centri-fugation, the n-hexane phase was evaporated under nitrogen at 57°Cand the residue dissolved in acetone containing hendecyl myristateas an internal standard. Gas chromatography on a 3 percent OV-17column with nitrogen as the carrier gas provided a sensitivity of1.0 µg/ml methaqualone (20).
Quantitation of methaqualone and its five most abundant hydroxylmetabolites in urine was done by GC in a recent study designed tocharacterize metabolite patterns as possible indicators of metha-qualone ingestion. Methaqualone was extracted with chloroform fromacid-hydrolyzed urine and chromatographed on 3 percent OV-1 columnsat 21O°C. To achieve complete separation, the metabolites weresilylated and chromatographed on high-resolution SE-30 SCOT columns.Concentrations measured ranged from 0.20 to 1.24 µg/ml methaqualoneand 0.56 to 31.5 µg/ml among the five principal hydroxy metabolites.Electron impact mass spectra of the methaqualone and the trimethyl-silyl ethers of the metabolites, separated by GC on a 3 percent OV-17 column at 225°C, were used to confirm identification of the meta-bolites (14).
Selected ion monitoring has come into wide use as a highly sensitiveand specific method for measurement of methaqualone as well as foridentification and quantitation of its metabolites. An early attemptto use methaqualone labeled with deuterium on the 2-methyl substi-tuent as internal standard was abandoned because of poor isotopicpurity. However, the 2-ethyl analog of methaqualone added to plasmabefore extraction with diethyl ether provided an internal standardsuitable for GC/MS analysis. The mass spectrometer monitored theion current at m/z = 250 for methaqualone and at m/z = 264 for theinternal standard. The method permitted measurement of plasma con-centrations of the drug as low as 5 ng/ml (10).
42
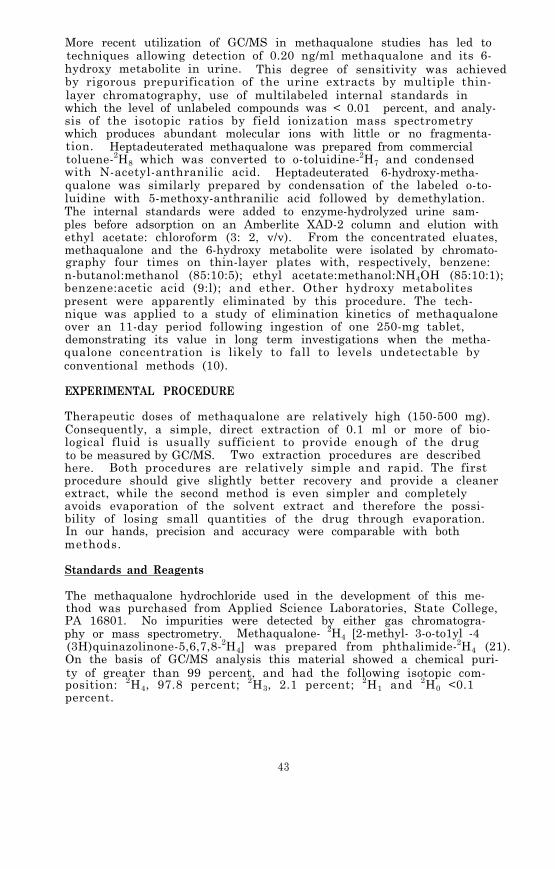
More recent utilization of GC/MS in methaqualone studies has led totechniques allowing detection of 0.20 ng/ml methaqualone and its 6-hydroxy metabolite in urine. This degree of sensitivity was achievedby rigorous prepurification of the urine extracts by multiple thin-layer chromatography, use of multilabeled internal standards inwhich the level of unlabeled compounds was < 0.01 percent, and analy-sis of the isotopic ratios by field ionization mass spectrometrywhich produces abundant molecular ions with little or no fragmenta-tion. Heptadeuterated methaqualone was prepared from commercialtoluene-2H8 which was converted to o-toluidine-2H7 and condensedwith N-acetyl-anthranilic acid. Heptadeuterated 6-hydroxy-metha-qualone was similarly prepared by condensation of the labeled o-to-luidine with 5-methoxy-anthranilic acid followed by demethylation.The internal standards were added to enzyme-hydrolyzed urine sam-ples before adsorption on an Amberlite XAD-2 column and elution withethyl acetate: chloroform (3: 2, v/v). From the concentrated eluates,methaqualone and the 6-hydroxy metabolite were isolated by chromato-graphy four times on thin-layer plates with, respectively, benzene:n-butanol:methanol (85:10:5); ethyl acetate:methanol:NH4OH (85:10:1);benzene:acetic acid (9:l); and ether. Other hydroxy metabolitespresent were apparently eliminated by this procedure. The tech-nique was applied to a study of elimination kinetics of methaqualoneover an 11-day period following ingestion of one 250-mg tablet,demonstrating its value in long term investigations when the metha-qualone concentration is likely to fall to levels undetectable byconventional methods (10).
EXPERIMENTAL PROCEDURE
Therapeutic doses of methaqualone are relatively high (150-500 mg).Consequently, a simple, direct extraction of 0.1 ml or more of bio-logical fluid is usually sufficient to provide enough of the drugto be measured by GC/MS. Two extraction procedures are describedhere. Both procedures are relatively simple and rapid. The firstprocedure should give slightly better recovery and provide a cleanerextract, while the second method is even simpler and completelyavoids evaporation of the solvent extract and therefore the possi-bility of losing small quantities of the drug through evaporation.In our hands, precision and accuracy were comparable with bothmethods.
Standards and Reagents
The methaqualone hydrochloride used in the development of this me-thod was purchased from Applied Science Laboratories, State College,PA 16801. No impurities were detected by either gas chromatogra-phy or mass spectrometry. Methaqualone- 2H4 [2-methyl- 3-o-to1yl -4(3H)quinazolinone-5,6,7,8-2H4] was prepared from phthalimide-2H4 (21).On the basis of GC/MS analysis this material showed a chemical puri-ty of greater than 99 percent, and had the following isotopic com-position: 2H4, 97.8 percent; 2H3, 2.1 percent; 2H1 and 2H0 <0.1percent.
43
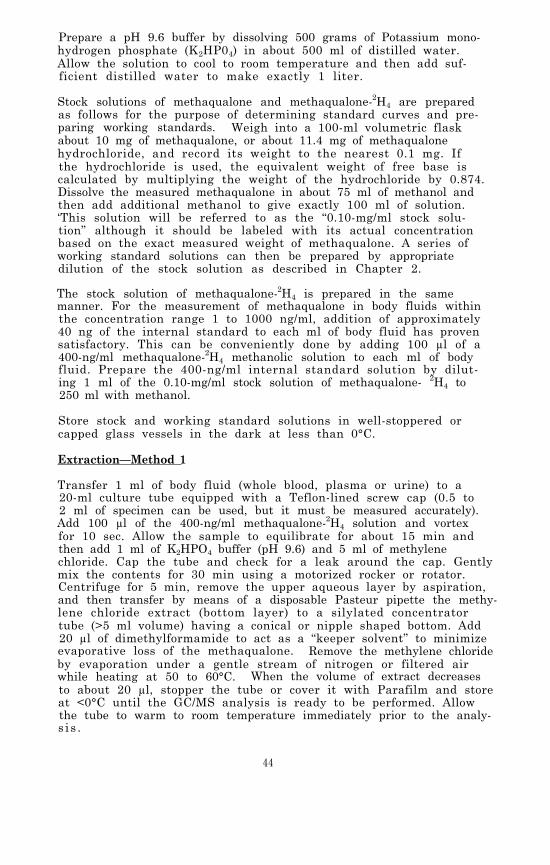
Prepare a pH 9.6 buffer by dissolving 500 grams of Potassium mono-hydrogen phosphate (K2HP04) in about 500 ml of distilled water.Allow the solution to cool to room temperature and then add suf-ficient distilled water to make exactly 1 liter.
Stock solutions of methaqualone and methaqualone-2H4 are preparedas follows for the purpose of determining standard curves and pre-paring working standards. Weigh into a 100-ml volumetric flaskabout 10 mg of methaqualone, or about 11.4 mg of methaqualonehydrochloride, and record its weight to the nearest 0.1 mg. Ifthe hydrochloride is used, the equivalent weight of free base iscalculated by multiplying the weight of the hydrochloride by 0.874.Dissolve the measured methaqualone in about 75 ml of methanol andthen add additional methanol to give exactly 100 ml of solution.‘This solution will be referred to as the “0.10-mg/ml stock solu-tion” although it should be labeled with its actual concentrationbased on the exact measured weight of methaqualone. A series ofworking standard solutions can then be prepared by appropriatedilution of the stock solution as described in Chapter 2.
The stock solution of methaqualone-2H4 is prepared in the samemanner. For the measurement of methaqualone in body fluids withinthe concentration range 1 to 1000 ng/ml, addition of approximately40 ng of the internal standard to each ml of body fluid has provensatisfactory. This can be conveniently done by adding 100 µl of a400-ng/ml methaqualone-2H4 methanolic solution to each ml of bodyfluid. Prepare the 400-ng/ml internal standard solution by dilut-ing 1 ml of the 0.10-mg/ml stock solution of methaqualone- 2H4 to250 ml with methanol.
Store stock and working standard solutions in well-stoppered orcapped glass vessels in the dark at less than 0°C.
Extraction—Method 1
Transfer 1 ml of body fluid (whole blood, plasma or urine) to a20-ml culture tube equipped with a Teflon-lined screw cap (0.5 to2 ml of specimen can be used, but it must be measured accurately).Add 100 µl of the 400-ng/ml methaqualone-2H4 solution and vortexfor 10 sec. Allow the sample to equilibrate for about 15 min andthen add 1 ml of K2HPO4 buffer (pH 9.6) and 5 ml of methylenechloride. Cap the tube and check for a leak around the cap. Gentlymix the contents for 30 min using a motorized rocker or rotator.Centrifuge for 5 min, remove the upper aqueous layer by aspiration,and then transfer by means of a disposable Pasteur pipette the methy-lene chloride extract (bottom layer) to a silylated concentratortube (>5 ml volume) having a conical or nipple shaped bottom. Add20 µl of dimethylformamide to act as a “keeper solvent” to minimizeevaporative loss of the methaqualone. Remove the methylene chlorideby evaporation under a gentle stream of nitrogen or filtered airwhile heating at 50 to 60°C. When the volume of extract decreasesto about 20 µl, stopper the tube or cover it with Parafilm and storeat <0°C until the GC/MS analysis is ready to be performed. Allowthe tube to warm to room temperature immediately prior to the analy-s i s .
44

Extraction—Method 2
Transfer 1 ml of body fluid (whole blood, plasma, or urine) to a5-ml glass stoppered, conical centrifuge tube. Add 100 µ1 of the400-ng/ml methaqualone-2H4 internal standard solution and vortexfor 10 sec. Allow the sample to equilibrate for 15 min and thenadd 1 ml of K2HPO4 buffer (pH 9.6), followed by 100 µl of a solventconsisting of toluene:heptane:isoamyl alcohol in a volume ratio of70:20:10. Stopper the tube and vortex for at least 30 sec. Sep-arate the phases by centrifugation at 2000 x G for 15 min. Theorganic solvent should form a narrow upper layer from which an ali-quot can be removed with a syringe for injection into the GC/MS.
GC/MS Analysis
The experimental conditions for the GC/MS analysis of methaqualoneare as follows:
GC column: 1.8 m x 2 mm (I.D.) glass column packed with3 percent OV-1 or OV-17 on 100/120 mesh GasChrom Q (Applied Science Laboratory, StateCollege, PA 16801)
Carrier gas: Methane, 15-20 ml/min
Reagent gas: Ammonia, introduced into the ion chamber asdescribed in Chapter 2
Temperatures: Injector, 270°CColumn, 210°C isothermalGC/MS transfer line, 260°CIon source, 160°C
Under these conditions the methaqualone and methaqualone-2H4 shouldelute at about 4 min as narrow, symmetrical peaks.
Prior to beginning GC/MS analysis of samples, the performance ofthe total GC/MS system should be evaluated and optimized as describedin Chapter 2. The ions to be monitored occur at m/z 251 and 255.They correspond to the protonated molecule ions for methaqualoneand methaqualone-2H4, respectively. With the divert valve in thedivert position, inject the organic extract into the gas chromato-graph (2 to 4 µ1 of the extract from Method 1 or 5 to 10 µ1 of theextract from Method 2). After approximately 1 min switch the divertvalve so that the entire carrier gas flow enters the ion source ofthe mass spectrometer and begin data acquisition. When the metha-qualone peaks nave eluted, cease data acquisition and return thedivert valve to the divert position.
The quantity of methaqualone in the specimen is determined by mea-suring the heights (or areas) of the methaqualone and methaqualone-2H4 peaks in the selected ion current profiles (“ion chromatograms”)and relating the ratio of peak heights to a calibration graph. Calcu-late the concentration of methaqualone by dividing the measured quan-tity of methaqualone by the exact volume of speciman extracted.
45

Discussion of the Experimental Procedure
The distribution ratios of methaqualone between aqueous phases overa range of pH values and various organic solvents were measured inorder to determine the optimum conditions for extraction of thedrug from biological fluids. For this purpose a stock solution ofmethaqualone (100 µg/ml) in 0.1N HCl was prepared. A 5-ml aliquotof the stock solution was adjusted to a specific pH and transferredto a 25-ml screw-cap tube along with 5 ml of the organic solvent.The tube was rocked gently for 30 min and then centrifuged. Theoptical densities of both the aqueous and organic layers were mea-sured from 350 to 250 nanometers using a Cary 14 recording spectro-photometer. Water or the appropriate solvent was placed in thereference cell.
The results indicated that methaqualone is extracted by chloroformwith nearly equal efficiency at all pH values between 2 and 12. AtpH 10 chloroform and methylene chloride are almost equally efficientextraction solvents, while hexane and cyclohexane are less effec-tive. At pH 2 all of the solvents investigated extract a signifi-cant amount of methaqualone. Consequently, a back extraction intoacid, which is often used in drug extractions for removal of non-basic components, would result in loss of an appreciable proportionof the methaqualone. Based on these data, we recommend that thepH of the biological fluid be adjusted to 9-10 before extractionwith methylene chloride,
Since methaqualone contains no NH or OH groups, derivatization be-fore gas chromatography is not necessary. The free drug gas chroma-tographs well on a variety of GC column packings. both 3 percentOV-1 and 3 percent OV-17 on 100/120 mesh Gas Chrom Q have been usedsuccessfully, but there is a slight preference for the former be-cause a significantly lower column temperature can be employed.
The electron impact (EI) and chemical ionization (CI) mass spectraof methaqualone are shown in Figure 1. These spectra were obtainedon quadrupole mass spectrometers (22). The relative sensitivitiesachieved by monitoring the ion current at the m/z value correspondingto the most abundant ion generated by each of the ionization pro-cesses are shown in Table 1. If maximum sensitivity is desired, CIwith methane and ammonia as reagent gases should be used. This com-bination gives slightly better sensitivity than that provided bymethane alone as reagent gas, and is also a more selective mode ofionization. However, since plasma levels following therapeuticdoses of methaqualone are moderately high (~5 µg/ml), sensitivityis usually not a problem. At higher ion source temperatures(>160°C) under methane CI conditions fragment ions at m/z 118 becomemore abundant. Since the corresponding fragment ion in the methaneCI mass spectrum of the methaqualone-2H4 retains the deuteriumlabels, it appears at m/z 122. Consequently, the ions at m/z 118and 122 can be monitored in addition to the protonated molecule ionsat m/z 251 and 255 to provide confirmational data.
46
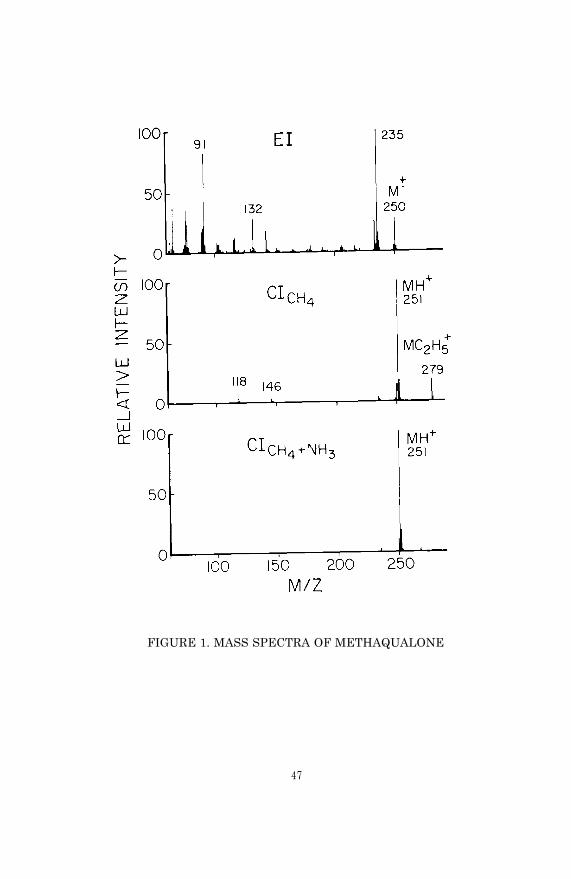
FIGURE 1. MASS SPECTRA OF METHAQUALONE
47

TABLE 1. RELATIVE RESPONSES FOR PROMINENT IONS IN THEEI AND CI MASS SPECTRA OF METHAQUALONE (22)
Percent of Relative ResponseIonization m/z Sample Ion Per Unit Weight
Method Monitored Current of Drug
EI 250 (M+) 4 6
235 (M+ - CH3) 1.5 20
CI (CH4) 251 (MH+) 57 84
Cl (CH4 + NH3) 251 (MH+) 74 100
When solutions of methaqualone and cicosane (internal standard) inmethylene chloride were prepared and stored in capped vials at roomtemperature, 2°C, and -10°C, gas chromatographic analyses of thesolutions over a period of six weeks showed no significant changesin the ratio of eicosane and methaqualone peak heights, indicatingthat methaqualone is stable under these conditions.
48

PHYSICAL, CHEMICAL AND SPECTROMETRIC DATA FOR METHAQUALONE
Nomenclature
Chemical Name: 2-Methyl-3-o-tolyl-4(3H)-quinazolinone
Empirical Formula: C16H14N2O
Chemical Abstracts Registry Number: 72-44-6
Trade Names: Many, including MAOA, MTZ, TR 495, Catendyl, Dormogen,Fadormir, Hyprol, Melsomin, Mebedorm, Normi-Nox, Omnyl, Parminol,Parest, (Quaalude, Roulone, Somnafac, Sonal, Somberol, Soxor, Fori-nol, Tuazolone
Physical Constants
Appearance: White crystalline powder
Melting Points: Free base: 114-116°CHydrochloride: 255-265°C
Specific Rotation: Optically inactive
Solubility: The free base is practically insoluble in water; solublein ethanol, ether, and chloroform
pKa: 2.54 (4)
REFERENCES
1. S.S. Brown. In L, Reid, ed., Methodological Developments inBiochemistry, Vol. 5, p. 179. North-Holland, Amsterdam (1976).
2. J.A. Ostrenga. Clin. Toxicol., 4, 607 (1973).
3. S.S. Brown and S. Goenechea. Clin. Pharmacol. Ther., 14, 314(1973).
4. J.J. Zalipsky, D.M. Patel, R.J. Darnowski, and N.H. Reavey-Cantwell. J. Pharm. Sci., 65 (3), 460 (1976).
5. A.F. Delong, R.D. Smyth, A. Polk, R.K. Nayak, and N.H. Reavey-Cantwell. Arch. Int. Pharmacodyn., 222 (2), 322 (1976).
6. L. Kazyak, J.A. Kelley, J.A. Cella, R.E. Droege, L.R. Hilpert,and R.C. Permisohn. Clin. Chem., 3, 2001 (1977).
7. J.M. Christensen and S. Holfort. J. Pharm. Pharmacol., 2, 538(1975).
8. C. White, E. Doyle, L.F. Chasseaud and T. Taylor. Europ. J.Clin. Pharmacol., 10, 343 (1976).
49
9. R.N. Morris, G.A. Gunderson, S.W. Babcock, and J.F. Zaroslinski.Clin. Pharmacol. Ther., 13, 719 (1972).
10. G. Alvan, J.E. Lindgren, C. Bogentoft, and O. Ericsson. Europ.J. Clin. Pharmacol., 6, 187 (1973).
11. J.M. McReynolds, H. d'A. Heck, and M. Anbar. Biomed. MassSpectr., 2, 299 (1975).
12. R. Bonnichsen, K. Dimberg, Y. Marde, and K. Ryhage. Clin.Chim. Acta, 60, 67 (1975)
13. C.N. Reynolds and K. Wilson. Xenobiotica, 6 (2), 113 (1976).
14. R.C. Permisohn, L.K. Hilpert, and L. Kazyak. J. Forensic Sci.,21 (1), 98 (1976).
15. D. Burnett, C.N. Reynolds, K. Wilson, and J.K. Francis.Xenobiotica, 6 (2), 125 (1976).
16. W.G. Stillwell, P.A. Gregory, and M.G. Horning.olism and Disposition, 3 (4), 287 (1975).
Drug Metab-
17. A.K. Berman, J.P. McGrath, K.C. Permisohn, and J.A. Cella,Clin. Chem., 21, 1878 (1975).
18. R.O. Bost, C.A. Sutheimer, and I. Sunshine. Clin. Chem., 22,689 (1976).
19. D.J. Berry. J. Chromatogr., 42, 39 (1969).
20. D. Chin and E. Fastlich. Clin. Chem., 20, 1382 (1974).
21. A.F. Fentiman, Jr. and R.L. Foltz. J. Labelled Compounds andRadiopharmaceuticals, 12, 69 (1976).
22. K.L. Foltz, D.A. Knowlton, D.C.K. Lin, and A.F. Fentiman, Jr.Proceedings of the Second International Conference on StableIsotopes, Oak Brook, IL, October 20-23, 1975.
50
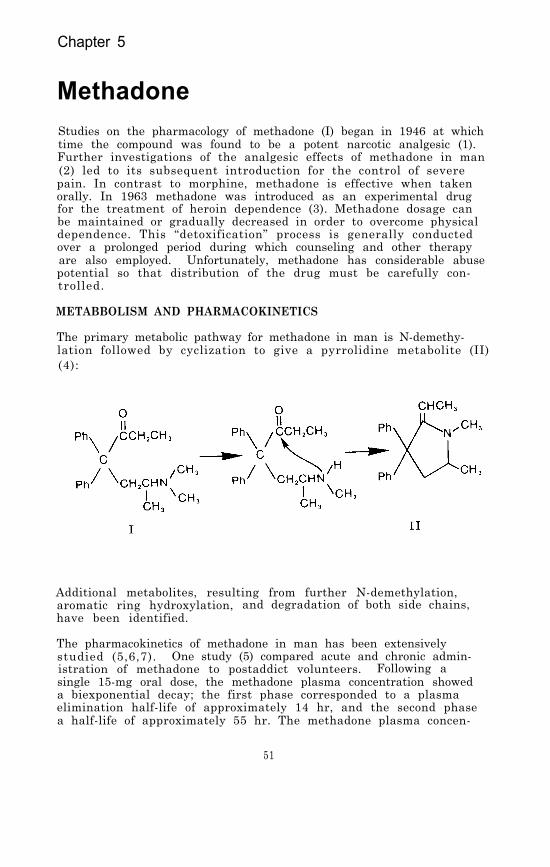
Chapter 5
MethadoneStudies on the pharmacology of methadone (I) began in 1946 at whichtime the compound was found to be a potent narcotic analgesic (1).Further investigations of the analgesic effects of methadone in man(2) led to its subsequent introduction for the control of severepain. In contrast to morphine, methadone is effective when takenorally. In 1963 methadone was introduced as an experimental drugfor the treatment of heroin dependence (3). Methadone dosage canbe maintained or gradually decreased in order to overcome physicaldependence. This “detoxification” process is generally conductedover a prolonged period during which counseling and other therapyare also employed. Unfortunately, methadone has considerable abusepotential so that distribution of the drug must be carefully con-trolled.
METABBOLISM AND PHARMACOKINETICS
The primary metabolic pathway for methadone in man is N-demethy-lation followed by cyclization to give a pyrrolidine metabolite (II)(4):
Additional metabolites, resulting from further N-demethylation,aromatic ring hydroxylation, and degradation of both side chains,have been identified.
The pharmacokinetics of methadone in man has been extensivelystudied (5,6,7). One study (5) compared acute and chronic admin-istration of methadone to postaddict volunteers. Following asingle 15-mg oral dose, the methadone plasma concentration showeda biexponential decay; the first phase corresponded to a plasmaelimination half-life of approximately 14 hr, and the second phasea half-life of approximately 55 hr. The methadone plasma concen-
51
tration measured at 2 hr after administration was 85 ± 10 ng/ml.During chronic oral administration of the drug, the plasma concen-tration underwent a single exponential decay with an average half-life of 22 hr. Patients maintained on daily 40-mg doses showedaverage methadone plasma concentrations of 182 ± 35 ng/ml, whilethose receiving 80-mg doses showed an average daily methadone con-centration of 420 ± 97 ng/ml of plasma. Another study (8) founda plasma elimination half-life of 7.3 hours following intramuscularadministration of 10 mg of methadone. More recently, marked varia-tions in the pharmacokinetics of the drug between individual humansubjects nave been documented among 12 in-hospital methadone main-tenance patients, among whom dose to plasma concentration ratiosvaried widely from one subject to another, as did the plasma half-life of methadone (7 to 21 hr). Recoveries of the drug from urineranged from 23 percent to 52 percent of total intake in 24-hoursamples (9).
Methadone is eliminated from the body primarily as the parent drug(I) and the pyrrolidine metabolite (II). Following a single dose,urine was found to contain about half as much of the metabolite asof the parent drug, expressed as percentage of daily dose in 24-hour collections, while chronic administration of the drug in-creased the percentage of the metabolite to twice that of the drug.The metabolite was always the predominant form in feces (5). Theincreased rate of metabolism and excretion during chronic admin-istration suggests that induction of hepatic microsomal enzymesresponsible for drug metabolism may play a significant role indevelopment of tolerance to the drug. However, it has been shownin the rat that methadone does not enhance microsomal drug metabo-lizing enzyme systems (10). Postmortem examination of tissues frommethadone users demonstrated the presence of both the drug and themetabolite in liver, kidney, spleen, and brain; and especially highconcentrations in the lung (11).
ANALYTICAL METHODOLOGY
Sensitive and specific methods for analysis of methadone in biologi-cal fluids are necessary in order to assess more accurately thepharmacokinetics of the drug, and also to contribute analyticalinformation for correlation with the clinical status of patientswho ingest the drug in both maintenance and overdose situations.Thin-layer chromatography (TLC) (12), UV spectrophotometry (13),fluorimetry (14), biological assay (15), radioisotopes (16), gaschromatography (GC) (17-19), and gas chromatography/mass spectrom-etry (20,21) have been used for detection and quantitation ofmethadone.
Immunoassay techniques, which are well suited for the analysis oflarge batches of samples, are available for detection of metha-done in urine, and are highly sensitive. Radioimmunoassay (RIA)can detect methadone in urine following doses of as little as 2.5mg/day, and shows promise as a screening technique because pro-poxyphene and its metabolites do not interfere as they often do inTLC and GC procedures (22). However, the antibodies used for RIA,
52
hemagglutination inhibition, or the enzyme multiplied immunoassay(EMIT) do not react with the primary metabolite II at concentra-tions of 1000 µg/ml or less. Because the concentration of II isoften equal to or greater than the concentration of methadone inurine, its detection is important at low drug concentrations. Fur-thermore, none of the immunological methods are quantitative overthe normal range of methadone concentrations found in urine (23).
The most satisfactory methods for quantitation of methadone in bio-logical fluids have been found to involve gas chromatography. Thecombination of GC with electron impact mass spectrometry (GC/EI-MS)has been used for quantitation of methadone in human plasma (20).A homolog of methadone was used as the internal standard in orderthat both unlabeled and deuterium-labeled methadone could be admin-istered and simultaneously measured in plasma. The method involvedequilibration of 4 ml of plasma with the internal standard, adjust-ment of the pH to 9.5, and extraction with 1-chlorobutane. The GCcolumn was packed with 1 percent UCW-98 and operated at 190°C. Ionsmonitored corresponded to M+ - CH3 for the methadone (m/z 294),methadone-2H3 (m/z 297), and the internal standard (m/z 308). Thesensitivity of the method was limited by the relatively low abun-dance of the ions monitored. Under electron impact ionizationmost of the ion current for methadone is carried by low mass frag-ment ions which are unsuitable for selected ion monitoring. Never-theless, the method is reported to be capable of measuring methadoneconcentrations as low as 5 ng/ml with a relative standard deviationof less than 4 percent.
A GC/MS procedure employing chemical ionization has been reportedto be about five times more sensitive than the electron impact ioni-zation method because of greater relative abundance of ions in theregion of the molecular ion in the CI mass spectrum of methadone(21). Methadone containing five deuterium atoms attached to onearomatic ring was synthesized for use as the internal standard inthis assay. Extraction from plasma or urine, after addition of thedeuterated standard and adjustment to pH 9, was with ethyl acetate,followed by back extraction into 0.05 N HCl. Gas chromatographywas done on a column of 10 percent W-98 on Gas Chrom Q at 180°C.Ion abundance ratios were measured using isobutane chemical ioniza-tion in which the protonated molecule ions at m/z 310 for methadoneand 315 for 2H5-methadone were monitored.
Methadone-2H10 as well as the corresponding decadeuterated metha-done metabolites have been synthesized for application to metabolicstudies and as internal standards for GC/MS analysis (24). Thelabeled compounds have also proven useful in elucidating the electronimpact fragmentation processes for methadone and its metabolites.
A GC method reported for quantitation of methadone using an electroncapture detector (ECD) involved extraction of methadone from plasmawith n-heptane followed by back extraction into an acidic aqueousphase. The aqueous extract was then oxidized with barium oxide toconvert the methadone to benzophenone in order to obtain a strongerECD response. The method was reported to have sensitivity compar-able to the GC/EI-MS technique (17).
53

Several methadone assays using GC with conventional flame-ioniza-tion detectors (FID) have been published. In one of them, designedfor determination of methadone in the urine of addicts in a metha-done maintenance program, 10 ml of urine was adjusted to pH 9.5and extracted with chloroform- isopropanol (3:1). The GC columnwas packed with 3 percent OV-17 and operated at 240°C. 4-Benzyl-biphenyl was used as the internal standard. The method can quan-titate methadone in urine within the concentration range 3 to 30µg/ml with a relative standard deviation of 7 percent (18). Ano-ther GC method measured methadone concentrations in blood, plasma,or urine by a procedure consisting of the addition of n-docosaneas the internal standard, extraction of the body fluid (adjustedto pH 9.5) with 1-chlorobutane, and gas chromatography on a 4- ft1 percent W-98 column maintained at 165°C. The minimum concentra-tion of methadone that could be measured by this procedure was 15ng/ml using 3 ml of blood or plasma (19). A similar initial ex-traction procedure (1-chlorobutane) was used in another GC assay,but further purification of the extracted methadone was achievedby back extraction into 0.2 N HCl. The aqueous acid extract wasthen made alkaline and extracted with chloroform. A drug (SKF525-A) with a structure similar to methadone was used as the inter-nal standard. The gas chromatographic analysis employed a 3 per-cent SE-30 column operated at 200°C. This method can detect aslittle as 15 ng/ml of methadone in 4 ml of plasma (8).
The GC-FID technique using SKF 525-A as an internal standard hasbeen adapted to the simultaneous determination of methadone, thepyrrolidine metabolite, cocaine, methaqualone, phencyclidine, andpropoxyphene in small (3 ml) volumes of urine, with detection le-vels as low as 0.5 µg/ml. The drugs are extracted together at ba-sic pH by toluene: isoamyl alcohol:heptane (76:4:20) and convertedto their less volatile hydrochloride salts by addition of 1 per-cent HCl in methanol; the reported extraction efficiency for metha-done and its metabolite is 100 percent. The residue after evapor-ation is reconstituted in methanol and subjected to GC on a 2 per-cent W-98/1 percent OV-17 mixed bed column. For optimal accuracyin this procedure, silylated glassware and a fresh buffer solutionfor the internal standard are required (25). A recently reportedimprovement in the extraction procedure for methadone increasedthe sensitivity of a GC-FID assay to 5 ng methadone per ml in a15-ml sample of whole blood. The method involved extraction ofmethadone and internal standard (2-dimethylamino-4,4-diphenyl-5-nonanone, specially synthesized for the analysis) with 1-chlorobu-tane at pH 9.8, back extraction into 0.5M H2SO4, alkalinization,and reextraction into chloroform. Sulfuric acid was used insteadof HCl because the sulfate salt of methadone has a better partitioncoefficient (1-chlorobutane:water) than the hydrochloride salt atpH 0 to 2. In some samples, the aqueous phase had to be equili-brated with 2,2,4-trimethylpentane to break the emulsion formedafter equilibration of the H2SO4 and 1-chlorobutane layers. Noevaporation step was required. Recovery of 14C-labeled methadonefrom whole blood by this procedure was ~93 percent. Chromatogra-phy was done on 1.5 percent OV-101 on Gas Chrom Q with temperatureprogrammed from 170- 250°C (26) .
54
EXPERIMENTAL PROCEDURE
A relatively simple extraction procedure is used for removing metha-done from biological fluids. The procedure consists of addition ofdeuterium-labeled methadone to the specimen together with a pH 9.5buffer, followed by extraction with 1-chlorobutane. Chemical ioni-zation with methane and ammonia as reagent gases is used for theGC/MS analysis.
Standards and Reagents
d,1-Methadone (6-dimethylamino-4,4-diphenyl-3-heptanone) was pur-chased as the hydrochloride salt from Regis Chemical Company, MortonGrove, IL 60053. Analysis by gas chromatography and mass spectrom-etry indicated the material was better than 99 percent pure. Themethadone-1,1,1-2H3 hydrochloride was obtained from the NationalInstitute on Drug Abuse. The deuterated methadone was chromato-graphically pure (> 99 percent) and, based upon its ammonia CI massspectrum, contained an isotopic composition of 2H3, 96.9 percent;2H2, 1.9 percent; 2H1, 0 percent; and 2H0, 1.2 percent.
A suitable pH 9.6 buffer can be prepared by dissolving 500 gramsof potassium monohydrogen phosphate (K2HPO4) in about 500 ml ofdistilled water. When all of the salt is dissolved, allow the solu-tion to cool to room temperature and add sufficient water to giveexactly 1 liter.
Stock solutions of methadone and methadone-2H3 used for the deter-mination of calibration graphs (Chapter 2) and as reference standards,are prepared as follows. Weigh into a 100-ml volumetric flask 11.2mg of methadone hydrochloride. Dissolve the methadone hydrochlo-ride in methanol and bring to exactly 100 ml with additional methanol.The resulting stock solution corresponds to a concentration of 0.10mg/ml of methadone calculated as the free base. A series of stan-dard solutions can then be prepared by appropriate dilution of thestock solution as described in Chapter 2.
The stock solution of methadone-2H3 is prepared in the same manner.For the measurement of methadone in blood or urine within the con-centration range 1 to 1000 ng/ml, addition of approximately 40 ngof the internal standard to each ml of specimen is satisfactory.This can be conveniently done by adding 100 µ1 of a 400-ng/ml metha-done-2H3 methanolic solution to each ml of specimen. Prepare the400-ng/ml standard solution by diluting 1 ml of the 0.10-mg/ml stocksolution of methadone2H3 to 250 ml with methanol. Store stock andstandard solutions in the dark in well-stoppered or capped glassvessels at 0°C or lower. At room temperature, acidic solutions ofmethadone are unstable; they undergo approximately 40 percent decom-position within two weeks.
Extraction
Transfer 1 ml of specimen (whole blood, plasma, or urine) to a 20-mlculture tube equipped with a Teflon-lined screw cap (0.5 to 2 ml ofspecimen can be used, but it must be measured accurately). Add 100µ1 of the 400-ng/ml methadone-2H3 internal standard solution to the
55
328-011 0 - 80 - 5

specimen and vortex for 10 sec. Allow the sample to equilibratefor about 15 min and then add 1 ml of pH 9.5 buffer and 5 ml of1-chlorobutane. Cap the tube and check for a leak around the cap.Gently mix the contents for 30 min using a motorized rocker or ro-tator. Centrifuge for 5 min and then transfer the 1-chlorobutanelayer (top) to a silylated concentrator tube at least 5 ml in vol-ume and having a conical or nipple-shaped bottom. Add 20 µl of di-methylformamide as a “keeper” solvent to minimize evaporative lossof the methadone. Remove the 1-chlorobutane by evaporation with agentle stream of nitrogen or filtered air while heating at 40-50°C.When the extract volume has decreased to about 20 µl, stopper thetube or cover the top with Parafilm and store at less than 0°Cuntil the GC/MS analysis is to be performed. Immediately prior tothe analysis, allow the tube to warm to room temperature.
GC/MS Analysis
The following experimental conditions are satisfactory for GC/MSanalysis of methadone:
GC column: 1.8 m x 2 mm (I.D.) glass column packed with3 percent OV-17 on 100/120 mesh Gas Chrom Q(Applied Science Laboratory, State College,PA 16801)
Carrier gas: Methane, 15-20 ml/min
Temperatures: Injector, 260°CColumn, 210°CGC/MS transfer line, 210°CIon source, 160°C
Under these conditions methadone and methadone-2H3 should elute atbetween 3 and 5 min as narrow, symmetrical peaks.
Before beginning the GC/MS analysis of samples, the performance ofthe total GC/MS system should be evaluated and optimized as describedin Chapter 2. The ions to be monitored occur at m/z 310 and 313.They correspond to the protonated molecule ions for methadone andmethadone 2H3, respectively. With the divert valve in the divertposition, inject 2 to 6 µl of the extract into the gas chromato-graph. After approximately 1 min switch the divert valve so thatthe entire carrier gas flow enters the ion source of the mass spec-trometer, and begin data acquisition. When the methadone peaks haveeluted, cease data acquisition and return the divert valve to thedivert position.
The quantity of methadone in the specimen is determined by measuringthe heights (or areas) of the methadone and the methadone-2H3 peaksin the selected ion current profiles (“ion chromatograms”) and re-lating the ratio of peak heights to a previously established calibra-tion graph. Calculate the concentration of methadone in the bio-logical sample by dividing the measured quantity of methadone bythe exact volume of specimen used in the analysis.
56

Discussion of the Experimental Procedure
The choice of 1-chlorobutane as the extraction solvent was basedprimarily on the work of Sullivan and Blake (19) who showed it tobe one of the most efficient solvents for removal of methadone frombiological fluids. Furthermore, it extracts minimal amounts ofendogenous materials. The extraction efficiency is pH dependent,with a maximum recovery of 85 percent when extractions are made atpH 9.5 to 10.0.
Of the GC column packings evaluated, 3 percent OV-17 on 100/120 meshGas Chrom Q gave the best combination of good resolution and mini-mum column bleed, as well as a suitable methadone retention time.
The electron impact (EI), methane chemical ionization (CICH4), andmethane-ammonia chemical ionization (CICH-NH3) mass spectra ofmethadone are shown in Figure 1. The EI mass spectrum is dominatedby an intense peak at m/z 72 corresponding to the fragment ionCH3CH=N (CH3) 2+. This ion is unsuitable for selected ion monitor-ing because it occurs at a m/z value where interfering ions arelikely, and even more important, the corresponding fragment ionfrom the deuterated methadone does not retain the deuterium label.None of the higher mass ions in the EI mass spectrum are suffici-ently abundant to be satisfactory for selected ion monitoring. Withmethane alone as the reagent gas, the protonated-molecule ion atm/z 310 and the fragment ion at m/z 265 are abundant and are satis-factory for selected ion monitoring. Monitoring an abundant frag-ment ion in addition to the protonated molecule ion provides addi-tional confidence in the reliability of the quantitative measure-ments (see Chapter 2). However, addition of ammonia to the methanereagent gas results in approximately a fivefold increase in the ioncurrent generated at m/z 310 by a given amount of methadone (Table1). Also, the contribution of the methadone-2H3 internal standardto the m/z 310 ion current is slightly less (1.0 percent vs. 1.9percent) under ammonia CI than under methane CI. Apparently, inthe latter case, some deuteride abstraction occurs. Consequently,small amounts of methadone can be measured more accurately in thepresence of large amounts of internal standard when ammonia CI isused. Finally, addition of ammonia to the reagent gas results ina more selective ionization since nonbasic compounds are not ion-ized. In our experience, when methane alone was used, interfer-ing ions prevented reliable quantitation of low concentrations ofmethadone ( < 10 ng/ml) in Plasma. The interferences were not a pro-blem when a methane-ammonia mixture was used as the reagent gas.
57

FIGURE 1. MASS SPECTRA OF METHADONE
58
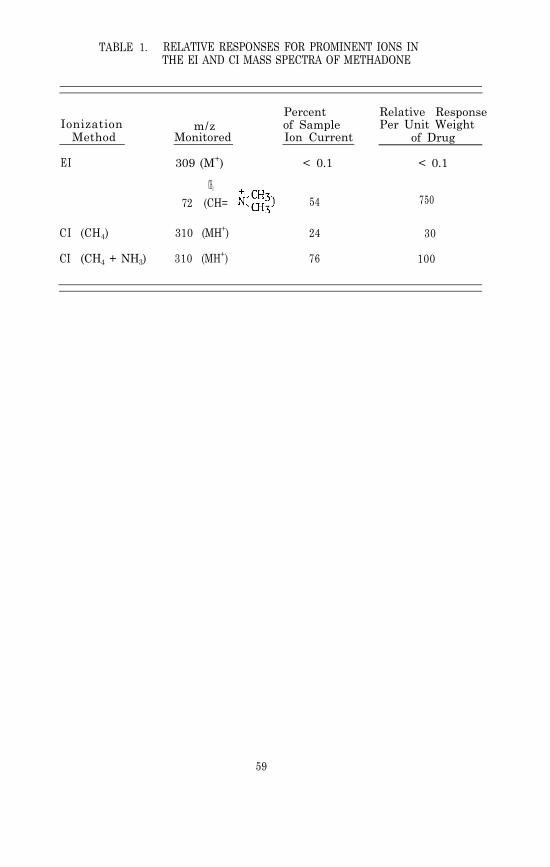
TABLE 1. RELATIVE RESPONSES FOR PROMINENT IONS INTHE EI AND CI MASS SPECTRA OF METHADONE
Ionization m/zMethod Monitored
EI 309 (M+)
Percent Relative Responseof Sample Per Unit WeightIon Current of Drug
< 0.1 < 0.1
CH3
72 (CH= 54 750
CI (CH4) 310 (MH+) 24 30
CI (CH4 + NH3) 310 (MH+) 76 100
59

PHYSICAL, CHEMICAL AND SPECTROMEIRIC DATA FOR METHADONE
Nomenclature
Chemical Name: d,1-6-Dimethylamino-4,4-diphenyl-3-heptanone
Empirical Formula: C21H27NO
Chemical Abstracts Registry Numbers: d,1-Methadone, 297881d,1-Methadone hydrochloride,125564
Trade Names: Amidone hydrochloride, Adanon hydrochloride, Dolophinehydrochloride, Physeptone, Heptadon hydrochloride
Physical Constants
Melting Points: 1-Methadone: 99-100°C1-Methadone hydrochloride: 241°Cd,1-Methadone: 78°Cd,1-Methadone hydrochloride: 233-236°C
Refractive Index: d,1-Methadone hydrochloride (n25D) = 1.5299
Specific Rotation: 1-Methadone1-Methadone
pKa: 8.25
Solubility of d,l-Methadone HCl: Water 12 g/100 mlEthanol 9 g/100 mlIsopropanol 2.4 g/100 ml
REFERENCES
1.
2.
3.
4.
5.
6.
C.C. Scott and K.K. Chen. J. Pharmacol. Exp. Ther., 87,63 (1946).
H. Isbell, A.J. Eisenman, A. Wikler, and K. Frank. J. Pharm-acol. Exp. Ther., 92, 83 (1948).
V.P. Dole and M. Nyswander. J. Amer. Med. Assoc., 193, 646(1965).
A.H. Beckett, J.F. Taylor, A.F. Casy, and M.M.A. Hassan.J. Pharm. Pharmacol., 20, 754 (1968).
K. Verebely, J. Volavka, S. Mulé, and R. Resnick. Clin.Pharmacol. Ther., 18, 180 (1976).
E. Anggård, L.-M. Gunne, J. Holmstrand, R.E. McMahon, C.-G.Sandberg, and H.R. Sullivan. Clin. Pharmacol. Ther., 17, 258(1975).
60
7. M.J. Kreek. New York State J. Med., 73, 2773 (1973).
8.
9.
10.
11.
12.
13.
14.
15.
16.
17.
18.
19.
20.
21.
22.
23.
24.
25.
26.
C.E. Inturrisi and K. Verebey. J. Chromatogr., 65, 361 (1972).
A.K. Dhar and H. Kutt, Fed. Proc., 35, 565 (1976).
A.P. Alvares and A. Kappas. J. Lab. & Clin. Med., 79, 439(1972).
A.E. Robinson and F.M. Williams. J. Pharm. Pharmacol., 23,353 (1971).
C.M. Davis and D.C. Fenimore. J. Chromatogr., 104, 193 (1975).
H.E. Hamilton, J.E. Wallace, and K. Blum. J. Pharm. Sci., 63,741 (1974).
E.J. McGonigle. Anal. Chem., 43, 966 (1971).
C.T. Liu and F.L. Adler. J. Immunol., 111, 472 (1973).
A.L. Misra, R. Bloch, N.L. Vadlamani, and S.J. Mulé. J. Phar-macol. Exp. Ther., 188, 34 (1974).
P. Hartvig and B. Näslund. J. Chromatogr., 111, 347 (1975).
J.L. Valentine, P.E. Wiegert, and K.L. Charles. J. Pharm.Sci., 61, 796 (1972).
H.R. Sullivan and D.A. Blake. Res. Commun. Chem. Pathol.Pharmacol., 3, 467 (1972).
H.R. Sullivan, F.J. Marshall, R.E. McMahon, E. Anggard,L.M. Gunne, and J.H. Holmstrand. Biomed. Mass Spectr., 2,197 (1975).
D.L. Hachey, M.J. Kreek, and D.H. Mattson. J. Pharm. Sci.,66, 1579 (1977).
D.L. Roerig, R.I.H. Wang, M.M. Mueller, D.L. Lewand, andS.M. Adams. Clin. Chem., 22, 1915 (1976).
N.C. Jain, W.J. Leung, T.C. Sneath, R.D. Budd, and D. Chinn.J. Anal. Toxicol., 1, 6 (1977).
G.I. Kang, F.S. Abbott, and R. Burton. Biomed. Mass Spectr.,6, 179 (1979).
N.C. Jain, D.M. Chinn, T.C. Sneath, and R.D. Budd. J. Anal.Toxicol., 1, 192 (1977).
R.K. Lynn, R.M. Leger, W.P. Gordon, G.D. Olsen, and N. Gerber.J. Chromatogr., 131, 329 (1977).
61

Chapter 6
Tetrahydrocannabinol (THC)and Two of its Metabolites,11-Hydroxy- THCand 11-nor-9-Carboxy- THCUse of the resin of the hemp plant, Cannabis sativa, for healingand euphoriant purposes is as old as recorded history. From writtenreferences to its use as a surgical anesthetic in the Chinese phar-macopeia of the 15th century B.C. until modern times, the historyand lore of cannabis have covered a wide range of medical applica-tions, some without value, as in leprosy, and others apparentlyjustified (1). Its use as a hallucinogen and euphoriant has hada colorful history as well; the term “assassin” was brought toEurope by returning crusaders in reference to an 11th centuryArabic religious sect whose devotees (hashishin) allegedly usedthe drug to induce ecstatic visions of paradise before setting outon potentially suicidal missions of political murder. Known invarious parts of the world as “ganja,” “bhang,” “kif,” “hashish,”or “marijuana,” cannabis in its crude form is eaten or smoked.The potency of the preparations varies widely according to botani-cal strain and the parts of the plant used (2). Cannabis retainsits biological activity for long periods when stored in ethanol orin sesame oil, but the activity is reduced by exposure to lightand oxygen, which helps account for variations in results of earlystudies concerning its pharmacology and psychotomimetic effects (3,4).
PHARMACOLOGY
The systematic study of the pharmacology of cannabis has evolvedonly in the past 12 years, following the total synthesis of 9 -tetrahydrocannabinol (THC*, I) the principal active component of theplant material (5). Recent pharmacological research has shown thedrug to have effects that are potentially therapeutic, such as re-duction of intraocular pressure, bronchodilation, anticonvulsantaction, and retardation of tumor growth (6,7,8). However, the psy-chotomimetic effects of cannabis, while having some potential fortherapeutic use in themselves (analgesia, antidepressant action,etc.), have led to widespread abuse with societal and public healthimplications. For example, the contribution of cannabis intoxicationto traffic accidents is the subject of intensive study (9), because
*In this chapter the term “cannabis” will be used to refer to plantpreparations containing a mixture of cannabinoids, while “THC” willrepresent isolated or synthetic 9-tetrahydrocannabinol, even thoughat least one other active form, 8-THC, is present in small amountsin some extracts.
62
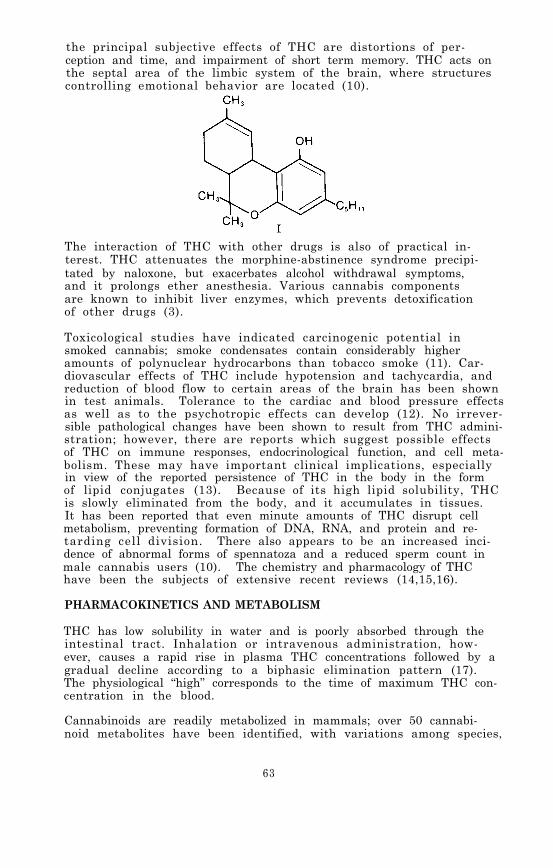
the principal subjective effects of THC are distortions of per-ception and time, and impairment of short term memory. THC acts onthe septal area of the limbic system of the brain, where structurescontrolling emotional behavior are located (10).
The interaction of THC with other drugs is also of practical in-terest. THC attenuates the morphine-abstinence syndrome precipi-tated by naloxone, but exacerbates alcohol withdrawal symptoms,and it prolongs ether anesthesia. Various cannabis componentsare known to inhibit liver enzymes, which prevents detoxificationof other drugs (3).
Toxicological studies have indicated carcinogenic potential insmoked cannabis; smoke condensates contain considerably higheramounts of polynuclear hydrocarbons than tobacco smoke (11). Car-diovascular effects of THC include hypotension and tachycardia, andreduction of blood flow to certain areas of the brain has been shownin test animals. Tolerance to the cardiac and blood pressure effectsas well as to the psychotropic effects can develop (12). No irrever-sible pathological changes have been shown to result from THC admini-stration; however, there are reports which suggest possible effectsof THC on immune responses, endocrinological function, and cell meta-bolism. These may have important clinical implications, especiallyin view of the reported persistence of THC in the body in the formof lipid conjugates (13). Because of its high lipid solubility, THCis slowly eliminated from the body, and it accumulates in tissues.It has been reported that even minute amounts of THC disrupt cellmetabolism, preventing formation of DNA, RNA, and protein and re-tarding cell division. There also appears to be an increased inci-dence of abnormal forms of spennatoza and a reduced sperm count inmale cannabis users (10). The chemistry and pharmacology of THChave been the subjects of extensive recent reviews (14,15,16).
PHARMACOKINETICS AND METABOLISM
THC has low solubility in water and is poorly absorbed through theintestinal tract. Inhalation or intravenous administration, how-ever, causes a rapid rise in plasma THC concentrations followed by agradual decline according to a biphasic elimination pattern (17).The physiological “high” corresponds to the time of maximum THC con-centration in the blood.
Cannabinoids are readily metabolized in mammals; over 50 cannabi-noid metabolites have been identified, with variations among species,
63

There is some evidence for differential metabolism between lungand liver within the same species (3). Numerous biotransforma-tion pathways for THC are known, including allylic and aliphatichydroxylations; oxidations to acids, aldehydes, and ketones; con-jugations with glucuronic acid or fatty acids; epoxidation of thedouble bond; and reduction of the terpene double bond. These bio-transformations can occur singly to produce monosubstituted meta-bolites, or in combination to form diols, triols, hydroxy acids,hydroxy ketones, or substituted hexahydrocannabinols (18). In man,the conversion of THC to biologically inactive 11-nor-9-carboxy-
9-THC (II) is a major metabolic pathway. The main initial bio-transformation product of THC is its 11-hydroxy derivative (III),which is equally and perhaps more active than THC, but like itsprecursor it is short-lived in the body and rarely appears in urine.Recent experiments with radiolabeled THC in rats have demonstratedthat III penetrates the blood-brain barrier more readily than doesTHC, possibly because of its high affinity for plasma albumin ratherthan the lipoprotein to which THC is bound (19).
Very little unchanged THC is found in urine. One study has reportedthat 0.005 percent of the administered drug was detectable in theurine of four human subjects up to 6 hours after a 30-mg dose.Excretion of metabolites extended over a period of several days(20) Although the metabolic breakdown of THC is very rapid, thedrug can be detected in plasma for at least 72 hr after a singleintravenous dose, possibly the consequence of a slowly releasingdeep compartment. THC is highly bound to lipoprotein, 97 percentby one method of estimation, and has a reported pka’ of 10.6 (21).An effective oral dose of THC in humans is about 50-200 µg/kg bodyweight, and the effective dose when smoked is 25-50 µg/kg (22).
ANALYTICAL METHODOLOGY
Because there is great interest in the metabolism and pharmacologyof THC, and because of the forensic implications of its illicituse, numerous methods have been developed for its detection andquantitation; however, its low concentration in biological fluids
64

and the potential interference from endogenous lipids have createddifficult analytical problems. Fluorometric techniques, based ongallium chelate formation or on cannabinoid dansylation, whileonly qualitative, have been suitable for some applications such asdetection of THC in the saliva of marijuana smokers (23-27). Aquantitative fluorometric technique has been reported very recently,in which a known amount of tritiated THC is added to plasma as aninternal standard prior to extraction with methyl acetate:petroleumether:ethanol (66: 33:1.5 v/v, efficiency 70 percent). THC and otherphenols are selectively removed from the organic extract by extrac-tion with Claisen’s alkali reagent. The alkaline solution is thenacidified and reextracted with hexane. The THC is derivatized bytreatment with 14C-labeled dansyl chloride before purification bythin-layer chromatography (TLC) on silanized silica gel plates (cyclohexane:ethyl acetate, 95:5 v/v). The dansylated THC spotis located with UV radiation and eluted into a scintillation vialfor counting of 3H and 14C. The detection level for this methodwas found to be 2.5 ng/tube, implying a sensitivity of a few ng/mlof plasma (28).
For periods up to 2 hours after smoking, the saliva of cannabisusers was reported to contain concentrations of THC sufficient fordetection by two-dimensional TLC with mass spectrometric confir-mation. In a study which compared plasma and saliva concentra-tions of THC in the same subjects, the drug was detected in salivaless than 30 min after smoking and continued to be detectable insaliva even after it could no longer be detected in plasma (29).
A new derivatizing reagent (2-p-chlorosulfophenyl-3-phenylindone)which is reported to be more selective than dansyl chloride hasbeen used in combination with TLC to detect THC and several of itsmetabolites at serum concentrations as low as 0.2 ng/ml (30). How-ever, the fluorescent THC derivative is unstable and must be mea-sured within a few minutes after it is formed on the TLC plate.
Some of the first methods employed for THC quantitation in phar-macological and metabolic studies involved radiolabeled tracersadministered to volunteers. Even minute amounts of cannabinoidproducts of the metabolism of radiolabeled THC were detectable byscintillation counting following TLC. However, the administrationof radioactive substances to human subjects has potential healthhazards which limit the use of the technique (31).
Radioimmunoassays (RIA) have been developed for THC. They havethe advantages of comparative speed and convenience for clinicaluses. This is because they are suited to the simultaneous analy-sis of multiple samples, often without prior purification. Underfavorable conditions, sensitivities of about 2 ng/ml can be achieved.However, because of the variables inherent in the preparation ofreagents by serological procedures, RIA lacks the precision ofother methods. In attempts to maximize specificity and affinityof the antibodies, various derivatives of THC have been used ashaptens to be conjugated to carrier protein. These have includedthe hemisuccinate ester (32), an azobenzoic acid derivative (33),
65

an N-oxysuccinimidoyl ester (34), a 10-iodo-9-uriedo linked THC(35), and an 0-carboxymethyl derivative (36). Although the anti-bodies elicited by these conjugates are highly specific for the3-ring cannabinoid nucleus, cross-reactions with other cannabi-noids, both natural and metabolic, have not been eliminated. Thiscan be an advantage in the case of urine studies, where unmetabo-lized THC is virtually absent. The high degree of nonspecificbinding of THC to lipoprotein is a technical problem in RIA, but0.1 percent Triton X-405 has been found to effectively solubilizeTHC in the aqueous assay medium, and an ethanol extraction stephas been shown to permit > 92 percent recovery of THC from plasmawhile removing protein material by precipitation (32). Other RIA’shave been developed for the measurement of THC and the major meta-bolite II (Carboxy-THC) and used to determine the relative THCand Carboxy-THC concentrations in urine and plasma of cannabissmokers (37).
In order to improve the specificity of an RIA method, high perfor-mance liquid chromatography (HPLC) has been used to separate THCfrom other cannabinoids that may be present in a plasma sample (38).The HPLC-RIA method is reported to measure THC plasma concentra-tions as low as 0.1 ng/ml.
Another immunological technique, the EMIT assay (based on the inhi-bition of enzymes by antihapten antibodies when the enzymes arecovalently linked to the corresponding hapten) has been adaptedfor THC and Carboxy-THC in urine, using relate dehydrogenase. Thehapten synthesized for use in the EMIT system elicited an antibodythat reacted strongly with Carboxy-THC, unlike antibodies previ-ously produced with other THC haptens. The antisera were there-fore suitable for general screening for THC and its metabolites(39). The recommended cut-off for reporting detection of the can-nabinoids is 20 ng/ml.
Another approach involves the use of gas chromatography (GC) toseparate THC from other components in plasma. The normal sensitiv-ity of GC using flame ionization detectors (FID) is too low to beof use for in vivo plasma analysis. However, electron capture de-tectors (ECD) the necessary sensitivity provided the THC isconverted to a suitable derivative. The pentafluoropropionatederivative is satisfactory for this purpose; it allows detectionat concentrations as low as 2 ng/ml. However, the derivatizingreactions are relatively unspecific; therefore biochemical inter-ferences compromise selectivity. A tandem-column GC techniquecan be used to achieve greater specificity; for example, THC wasdetected in blood as the heptafluorobutyrate on a tandem columnGC system using hexahydrocannabinol as the internal standard. Thefirst column (5 percent SE-30) provided internal cleanup and thesecond, a capillary column coated with OV-17, achieved the re-quired resolution. The technique had the advantage of allowingtemperature programming in the first column which increased speedand efficiency but did not disturb the base-line response of theelectron capture detector. The sensitivity reported for nonbio-logical samples was 1 pg injected on column (40).
66

In addition to improved detector response, derivatization of THCcan also improve chromatographic behavior by blocking the polarphenolic group. THC derivatives which have been prepared for thispurpose include the trimethylsilyl, trifluoroacetyl, acetyl, chlo-roacetyl , and t-butyldimethylsilyl derivatives. The last namedhas been shown to exhibit a high degree of stability to moistureand bases (41).
Cannabinoids have also been converted to their diethyl phosphateesters and analyzed by gas chromatography using a nitrogen-phos-phorus detector (GC-NPD). The developers of this assay recommendit for routine quantitative analysis of cannabinoids in all toxi-cological laboratories (42). The procedure utilizes the n-heptylhomolog of 8-THC as the internal standard and is capable of de-tection limits of 0.5 ng/ml in blood and 10 ng/g in brain tissue.For analysis of brain tissue a back extraction into methanolicbase serves to separate the cannabinoids from interfering endoge-nous lipids.
HPLC has been used for separation of THC from other cannabinoidsand lipids in biological fluids before analysis by GC-ECD. Re-verse phase HPLC elution with 47 percent acetonitrile in water, aswell as normal phase HPLC with 25 percent chloroform in heptane,was found to separate THC from its active 11-hydroxy metabolite(III ) . The resolution of 8- and 9-THC was achieved with 5 per-cent tetrahydrofuran in hexane (43). The GC-ECD analysis of penta-fluorobenzylated 9-THC using HPLC purification had a sensitivityof 1 ng/ml of plasma, while radiochemical analysis of the HPLCseparated fraction had a sensitivity of 0.2 ng/ml plasma. Forquantitation of THC in plasma in phannacokinetic studies, a knownamount of radiolabeled THC was added as an internal standard eitherto the plasma or to the heptane extract. This permitted calculationof extraction and/or HPLC collection efficiencies for the particu-lar biological sample (44).
The technique of plasma chromatography has been applied to the de-tection of ultratrace amounts of THC in GC effluents. The posi-tive mobility spectrum for THC shows a strong, single peak with aKo = 1.06. The peak is attributed to the protonated molecule ionof THC (45).
GC/MS analysis using the technique of selected ion monitoring cur-rently is the most reliable method for measuring the very low con-centrations of THC in plasma after smoking. The first GC/MS methodfor quantitation of THC in blood was reported in 1973 (46). Themethod involved addition of a deuterated THC analog as an internalstandard and purification of the extract by liquid chromatographyon a Sephadex LH-20 column. The original procedure was later re-fined to the point that plasma concentrations as low as 0.3 ng/mlcould be measured. Sensitivity was found to be limited by a smallamount of undeuterated THC contaminating the internal standard, sothe best results have been achieved with a 2H7-analog (47).
67
Because of the very small amounts of THC and 11-hydroxy-THC whichappear in human plasma and urine, the major metabolite (Carboxy-THC) is a candidate for analytical studies as a method to identifycannabis users. The concentration of Carboxy-THC in plasma exceedsthat of THC within 50 min after smoking, and then remains higherfor more than 24 hr. A modification of the above GC/MS assay forTHC has been applied to identification and estimation of the car-boxy metabolite. Extraction from plasma or urine was with diethylether (85 percent recovery from plasma, 90 percent from urine),followed by a two-step derivatization which involves esterifica-tion of the carboxyl group with diazomethane and trimethylsila-tion of the phenolic hydroxyl group. The silylated methyl esterof the 8-isomer of the Carboxy-THC was used as an external stan-dard because both isomers have similar retention times but dif-ferent ion intensities in their mass spectra. In this preliminarystudy, a sensitivity in the range of a few ng/ml was indicated (48).
A GC/MS assay for THC in the blood of marijuana smokers has beenreported which is based on the chemistry of the phenolic groupcommon to all cannabinoids and their metabolites; the basis of thepurification technique is the selective extractability of lipid-soluble phenols from hexane by Claisen’s alkali. After the backextraction into the aqueous caustic, trimethylanilinium hydroxidewas used for on-column methylation of the phenolic group. Thetrideuteromethyl ether of THC was easily synthesized for use asan internal standard, but the fact that it was, of necessity,added only after the extraction constitutes a disadvantage ofthe method as a quantitative technique (49).
The Claisen’s alkali extraction procedure was also used in an anal-ysis of the active metabolite, 11-hydroxy-THC, in plasma (50). Inthis case, tetrahexylammonium hydroxide and ethyl iodide were usedto alkylate the phenolic group of the metabolite. Subsequent tri-methylsilylation of the aliphatic hydroxyl group provided a deriv-ative with satisfactory chromatographic and mass spectral proper-t ies. When the corresponding pentadeuteroethyl ether was used asthe internal standard, a linear calibration graph was achieved overthe range 7 to 120 ng/ml of plasma. The procedure can be usedfor simultaneous determination of both THC and the 11-hydroxy me-tabolite in plasma (51).
GC/MS was adapted to an automated system using a computer-managedOlfax II spectrometer and a “probability based matching” algorithm,to measure THC as its trimethylsilyl derivative in extracts of hy-drolyzed human urine, and to identify and measure metabolites.The procedure showed promise as a means of increasing the speedand convenience of THC assays while reportedly retaining the spe-cificity of selective ion monitoring (52).
In a pharmacokinetic study of THC and 11-hydroxy-THC in humanplasma, the results of GC/MS (both electron impact and chemicalionization) were compared with those of GC-ECD and TLC-radiolabelprocedures on the same samples. In the CI procedure THC was deriv-atized with pentafluoropropionic anhydride, and the pentafluoro-
68

propionate ester of hexahydrocannabinol was used as the internalstandard. Endogenous plasma constituents did not interfere, sopreliminary chromatographic purification was not required. Inthe EI procedure Sephadex LH-20 chromatography was used beforeGC/MS, but THC was not derivatized. Pharmacokinetic data for hu-man volunteer subjects were in reasonable agreement for the threetechniques (53).
Further refinements of the GC/EI-MS technique for THC have includeduse of THC-2H3 as internal standard and extraction of THC fromplasma with pure hexane to avoid the need for preliminary chroma-tographic cleanup. The more polar cannabinoids remain with theplasma; therefore hexane extraction would not be suitable when de-termination of metabolites is necessary. Both the CI and EI me-thods had detection limits of about 0.5 ng/ml in clinical samples,although the EI mode (focusing exclusively on m/z 314 and 317 andrequiring no derivatization step) was reported to have a betterdefined linearity on calibration curves than the methane CI me-thod (54).
The combination of HPLC with MS has also been reported for analy-sis of THC in body fluids. A silica gel column was programmed forgradient elution using heptane and methylene chloride. Fractionsof the eluent were collected and introduced by direct probe intothe mass spectrometer. THC- 2H3 was added to the body fluid andserved as an internal standard, a marker for effluent collectionfrom the HPLC (detected by an ultraviolet spectrophotometer) , andas a carrier for the THC. The technique was used to assay THCconcentrations in human blood, breath, saliva, bile, and postmor-tem brain tissue. It was shown to be reproducible, accurate, andlinear in the range of 2.5-100 ng/ml of plasma. A positive, sta-tistically significant concentration of THC was detected in thesaliva of marijuana smokers in the first hour after smoking (55).
A paper chromatographic system which employs methanol as the mobilephase conveniently separates cannabinoids from the large amountsof endogenous lipid material present in chloroform extracts ofblood samples. The region of the paper near the solvent front iseluted with methylene chloride and the cannabinoids are identifiedby GC/MS. If 15 to 25 ml of whole blood are available, concentra-tions of THC as low as 0.5 ng/ml can be detected. For quantita-tive analysis 2,3,4,6-tetrachlorophenyl hexyl ether is suggestedas an internal standard. Under the GC/MS conditions used (3 per-cent OV-1, EI) the tetrachloro ether has a retention time of 0.45relative to THC and produces fragment ions at the same nominalmasses as several of THC’s prominent fragment ions. The same re-port points out the potential for pyrolytic conversion of THC tocannabinol in GC and GC/MS analyses. Thermal decomposition ofTHC is minimized by keeping all GC and MS temperatures to a mini-mum consistent with satisfactory chromatography (56).
Solvents used for extraction of THC from biological samples in-clude hexane at neutral pH (52, 53); hexane + 5 percent isoamylalcohol (49); petroleum ether, sometimes containing 0.5 percent
69

isoamyl ether or 1.5 percent isopentanol (47,53,55); heptane con-taining 1.5 percent isoamyl alcohol (21,40,57); and petroleum ether:Ethyl acetate (2: l ) (29) . Recoveries in excess of 90 percent fromplasma have been reported for heptane:isoamyl alcohol (40); chloro-form extraction of whole blood gave a THC recovery of 86 percent(56).
The proceedings of a symposium on the analysis of cannabinoids inphysiological fluids held in 1977 have been published and providea good review of recent research in this area (58). Also, the Na-tional Institute on Drug Abuse has sponsored two conferences onthe analysis of cannabinoids in physiological specimens. The pro-ceedings of the first conference, held in 1976, were published asa NIDA Research Monograph (59). The proceedings of the second con-ference, held in January, 1980, will be published later in the year(60).
EXPERIMENTAL PROCEDURE
Two methods are described, one for analysis of THC in whole bloodor plasma and another for analysis of the metabolites, 11-hydroxy-THC and 9-carboxy-THC, in blood, plasma and urine. The first me-thod involves extraction of the body fluid with hexane, a nonpolar,relatively selective extraction solvent. The very lipophilic THCis efficiently extracted by hexane, but the polar metabolites arepoorly extracted. The second method employs a more polar extrac-tion solvent (hexane:ethyl acetate, 7:l v/v) which removes the me-tabolites from the body fluid, but unfortunately also extractsendogenous components which interfere with measurement of low con-centrations (< 10 ng/ml) of THC. A glass capillary GC column hasbeen used to resolve trimethylsilylated THC from endogenous com-ponents (61), but efforts to resolve the interferences using packedGC columns have so far been unsuccessful. This is the reason whytwo similar but separate procedures are used for quantitation ofTHC and the two metabolites.
Standards and Reagents
All of the cannabinoid standards used in the development of themethod described here were obtained from the Research TriangleInstitute, Research Triangle, NC, 27709, through the National In-stitute on Drug Abuse. Purity and isotopic composition data aregiven below:
9-Tetrahydrocannabinol (THC)Purity: 98.7 percent by GC
5 ’ - 2 H 3 - 9-Tetrahydrocannabinol (THC-2H3)Purity: > 95 percent by GC, 100 percent by TLCIsotopic composition: 2H3, 96.6 percent; 2H2, 2.6 percent;2H1, 0.77 percent; 2H0, 0 percent.
11-Hydroxy- 9-tetrahydrocannabinol (11-OH-THC)Purity: >98 percent by GC as the bis-(trimethylsilyl) ether,100 percent by TLC
70
5'-2H3-11-Hydroxy- 9-tetrahydrocannabinol (11-OH-THC-2H3)Purity: >95 percent by GC as the bis-(trimethylsilyl) ether,100 percent by TLCIsotopic composition: 2H3 95.8 percent; 2H2, 2.4 percent;2H1 1.1 percent; 2H0, 0 percent
11-Nor-9-car-boxy- 9-tetrahydrocannabinol (9-Carboxy-THC)Purity: 97 percent by GC as the bis-(trimethylsilyl) ether,100 percent by TLC
5'-2H3-11-Nor-9-carboxy- 9-tetrahydrocannabinol (9-Carboxy-THC-2H3)Purity: 100 percent by GC as the bis-(trimethylsilyl) deri-vative, 100 percent by TLCIsotopic composition: 2H3, 95.8 percent;2H1, 1.1 percent; 2H0, 0 percent.
2H2, 2.4 percent;
The pH 2.0 and pH 7.0 buffer solutions were purchased from FischerScientific Company.
N,O-Bis-(trimethylsilyl)-trifluoroacetamide (BSTFA) containing 1percent trimethylsilyl chloride was purchased from the Pierce Chem-ical Company, Rockford, IL, 61105. The reagent was stored at -10°C,but allowed to warm to room temperature before aliquots were re-moved for derivatization.
Pure 9-THC is a colorless, viscous syrup. It is therefore dif-ficult to transfer and weigh small quantities accurately. The
9-THC standards described above were obtained as ethanolic solu-tions of predetermined concentrations, and were subsequently di-luted with methanol to give stock solutions with THC concentra-tions of 0.10 mg/ml. Of course, the concentrations do not haveto be precisely 0.10 mg/ml, but they must be accurately known.A THC stock solution concentration of 0.10 mg/ml is used in thisexperimental description merely as an example.
The 11-OH-THC and 9-carboxy-THC are solids at room temperature.Because these two metabolites are measured at the same time inbiological specimens, a single stock solution containing 0.10 mg/mlof each of the metabolites in methanol can be prepared, as well asa single stock solution containing 0.10 mg/ml of each of the deu-terated analogs (11-OH-THC-2H3 and 9-car-boxy-THC-2H3) in methanol.These can be prepared by weighing into a 100-ml volumetric flask10 mg of 11-OH-THC and 10 mg of 9-carboxy-THC, and weighing intoa second 100-ml volumetric flask 10 mg of each of the deuteratedanalogs. Add about 75 ml of methanol to each flask. After thesolids have dissolved add additional methanol to the flasks tobring each solution to exactly 100 ml. A series of working stan-dard solutions of the undeuterated cannabinoids can be preparedby appropriate dilution of the stock solutions as described inChapter 2.
For the measurement of THC or 11-OH-THC and 9-carboxy-THC in bodyfluids within the concentration range 1 to 500 ng/ml, addition ofapproximately 40 ng/ml of each of the appropriate deuterated in-
71
328-011 0 - 80 - 6

ternal standards to each ml of specimen is satisfactory. This canbe conveniently done by adding 100 µ1 of a 400-ng/ml methanolicsolution of THC- 2H3 or 11-CM-THC-2H3 and 9-carboxy-THC-2H3 to eachml of body fluid. Prepare the 400-ng/ml internal standard solu-tions by diluting 1 ml of the 0.10-mg/ml stock solutions to 250ml with methanol.
Cannabinoids, particularly THC, are unstable when exposed to light(4,62), oxygen (4), acid (21), and/or elevated temperatures (62).Consequently, store stock and standard solutions in full, stopperedor capped glass vessels in the dark at below 0°C. The concentra-tions of the stock solutions should be checked at least every threemonths. This can be done by addition of a known quantity of aninternal standard such as 4-androsten-3,17-dione to an aliquotof the stock solution, and then analyzing the solution by GC witha flame ionization detector. If the concentration of the cannabi-noid solution has changed by a detectable amount, a new calibrationgraph should be established for that stock solution.
THC has a strong tendency to adhere to glass surfaces (21). Thisadsorption can cause poor sensitivity and precision, but can beminimized by using clean, silanized glassware for the sample ex-traction (63).
Extraction of THC from Plasma or Whole Blood
Transfer a measured quantity (normally 1 ml) of plasma or wholeblood to a 20-ml culture tube equipped with a Teflon-lined screwcap. Add 100 µl of a 400-ng/ml methanol solution of the THC-2H3internal standard and vortex for 10 sec. Allow the sample to equil-ibrate for 15 min. Add 1 ml of pH 7.0 buffer solution and 6 ml ofhexane. Cap the tube tightly and gently mix the contents for 30min using an automated tube rocker or rotator. Centrifuge for 5min and then carefully transfer just the hexane (top) layer to asecond culture tube using a disposable Pasteur pipette. The re-maining plasma residue can be discarded. The hexane solution isnow washed successively with dilute alkali and dilute acid to re-move strongly acidic and basic compounds. Add 2.5 ml of 0.1 NNaOH solution to the hexane extract. After capping the tube, ro-tate or rock for 30 min and then centrifuge. Using another dis-posable pipette, remove the aqueous (bottom) layer and discard.Add 2.5 ml of 0.1 N HCl solution to the hexane extract. Tap thetube gently to allow gas bubbles formed by the acid-base reactionto escape. Again, cap the tube tightly, rock or rotate it for 30min, and centrifuge. Carefully transfer just the hexane (top)layer to a 15-ml glass tube with a tapered or cone-shaped bottom.Concentrate the extract to near dryness at a temperature of 35-40°C under a gentle stream of nitrogen. The extract residue isnow transferred to a conical 1-ml glass vial equipped with a Tef-lon-lined screw cap in the following manner. Add 0.5 ml of hexaneto the tube containing the residue and vortex the tube for 10 sec.Using a disposable pipette, transfer the hexane solution to the1-ml glass vial. Repeat the last step using an additional 0.5ml of hexane to transfer any remaining extract residue to the 1-ml
72
vial. Add 10 µ1 of dimethylformamide to the hexane solution toact as a “keeper” to minimize evaporative loss of the THC duringthe final evaporation and to serve as a solvent for the trimethyl-silylation. Slowly concentrate the hexane solution by heating theglass vial in a heating block maintained at 40°C. When all of thehexane has evaporated (approximately 20 min), add 15 µl of bis-(trimethylsilyl) trifluoroacetamide containing 1 percent trimethyl-silyl chloride to the vial and cap tightly. Vortex the vial andthen heat in an oven at 75°C for 1 hr.for GC/MS analysis, but it can be
The sample. is now readystored at -10°C indefinitely.
GC/MS Analysis of THC-TMS
The experimental conditions for the GC/MS analysis of THC are asfollows:
GC column:
Carrier gas:
Reagent gas:
Temperatures:
1.8 m x 2 mm I.D. glass column packed with3 percent OV-17 on 100/120 mesh Gas Chrom Q(Applied Science Laboratory, State College,PA 16801)
Methane, 15-20 ml/min
Ammonia introduced into the ion chamber asdescribed in Chapter 2
Injector, 280°CColumn, 190 to 310°C at 20 °/minGC/MS transfer line, 280°CIon source, 160°C
Under these conditions the THC-TMS should elute from the gas chro-matograph at between 2 and 5 min.
Prior to beginning the GC/MS analysis of samples, the performanceof the total GC/MS system should be evaluated and optimized asdescribed in Chapter 2. The ions to be monitored are the proto-nated molecule ions for THC-TMS (m/z 387) and THC-2H3-TMS (m/z390). With the divert valve in the divert position, inject theorganic extract into the gas chromatograph (2 to 8 µ1). Afterapproximately 1 min, switch the divert valve so that the entirecarrier gas flow enters the ion source of the mass spectrometer,and begin data acquisition. When the THC-TMS peaks have eluted,cease data acquisition and return the divert valve to the divertposition.
The quantity of THC in the biological specimen sample is deter-mined by measuring the heights (or areas) of the THC-TMS and THC-2H3-TMS peaks in the selected ion current profiles (“ion chroma-tograms”) and relating the ratio of peak heights to a calibrationgraph. Calculate the body fluid concentration of THC by dividingthe measured quantity of THC by the exact volume of specimen ana-lyzed.
73
Extraction of Metabolites from Blood, Plasma, or Urine
To 1 ml of specimen (blood, plasma, or urine) in a 20-ml culturetube equipped with a Teflon-lined screw cap, add 100 µ1 of a me-thanol solution containing 40 ng each of the internal standards,11-OH-THC-2H3 and 9-carboxy-THC-2H3 (concentration, 400 ng/ml).Vortex the tube for 10 sec and allow the sample to equilibratefor 15 min. Add 1 ml of pH 2 buffer and 4 ml of a hexane:ethylacetate solvent (7:1 v/v). Screw the cap on the tube tightly andcheck for leaks. Slowly rotate or rock the tube for 15 min. Loosenthe cap and then centrifuge. Using a disposable Pasteur pipette,transfer the organic layer (top) to a second culture tube and dis-card the aqueous plasma layer. Add 2 ml of 0.2 N H2SO4 to the or-ganic extract. Screw on the cap, tighten, and again check forleaks. Repeat the rocking (15 min) and centrifugation (5 min).Transfer the organic layer (top) to a centrifuge tube, at least10 ml in volume. Be careful not to transfer any of the aqueous(lower) layer to the centrifuge tube. Discard the aqueous layer.Concentrate the extract to near dryness by heating to 35-40°C undera gentle stream of nitrogen or filtered air. Wash down the sidesof the tube with 0.5 ml of methylene chloride. Vortex the tubeand transfer the extract to a 1-ml glass vial which has a cone-shaped bottom and a Teflon-lined screw cap. Again wash down thesides of the centrifuge tube with another 0.5 ml of methylenechloride and transfer the solvent wash to the same 1-ml glass vial.Add 10 µl of dimethylformamide to the hexane solution to act as a“keeper” to minimize evaporative loss of the metabolites duringthe final evaporation and to serve as a solvent for the trimethyl-silylation. Evaporate the combined solvents by heating to 30-40°Cunder a gentle stream of nitrogen or filtered air until all of themethylene chloride is gone (about 20 min). Add 50 µ1 of bis-(tri-methylsilyl) trifluoroacetamide containing 1 percent trimethylsilylchloride to the vial; cap tightly and heat at 90°C for 1 hr. Thesample is now ready for GC/MS analysis. If necessary it can bestored in a freezer until it is to be analyzed; however, be sureto allow the vial to warm to room temperature before removing thecap to withdraw material for injection into the GC/MS. The trime-thylsilylated 9-carboxy-THC is particularly vulnerable to hydrolysis.Consequently, exposure of the derivatized extract to air shouldbe kept to a minimum, and prolonged storage should be avoided.
GC/MS Analysis of the 11-OH-THC-TMS and 9-Carboxy-THC-TMS
The experimental conditions for GC/MS analysis of the derivatizedTHC metabolites are as follows:
GC column: 1.8 m x 2 mm I.D. glass column packed with3 percent OV-17 or 100/120 mesh Gas Chrom Q(Applied Science Laboratory, State College,PA 16801)
Carrier gas: Methane, 15-20 ml/min
Reagent gas: Ammonia, introduced into the ion chamber asdescribed in Chapter 2
74

Temperatures: Injector, 280°CColumn, 190 to 310°C at 20°/minGC/MS transfer line, 280°CIon source, 160°C
Under these conditions the 11-OH-THC-TMS should elute from the GCat about 3 min and the 9-carboxy-THC-TMS at about 4.5 min.
The ions to be monitored are the protonated molecule ions for 11-OH-THC-TMS (m/z 475), 11-OH-THC-2H3-TMS (m/z 478), 9-carboxy-THC-TMS (m/z 489), and 9-carboxy-THC-2H3-TMS (m/z 491). With the di-vert valve in the divert position inject 2 to 8 µl of the trimethyl-silylated extract into the GC/MS. After approximately 1 min switchthe divert valve so that the entire carrier gas flow enters theion source. The best sensitivity is achieved by first monitoringjust the ion currents at m/z 475 and 478 until the 11-OH-THC-TMShas eluted from the GC; then monitor the ion currents at m/z 489and 491 until the 9-carboxy-THC-TMS has eluted. If the GC/MS datasystem does not permit rapid changes of the monitored ion masses,all four ion masses must be monitored for the entire time requiredfor elution of both the metabolites. When the 9-carboxy metabolitehas eluted, cease data acquisition and return the divert valve tothe divert position.
The quantities of 11-hydroxy and 9-carboxy metabolites in the bio-logical sample are determined by measuring the heights (or areas)of the derivatized metabolites and their internal standards in theselected ion current profiles, and relating the ratios of peakheights to calibration graphs (Chapter 2). Calculate the concentra-tions of the 11-hydroxy and 9-carboxy metabolites in the specimenby dividing the measured quantities of these compounds by the exactvolume of specimen extracted.
Discussion of the Experimental Procedures
The method described above for quantitation of THC in blood andplasma was developed and refined over a period of four years. Dur-ing this time over 2500 plasma samples, submitted by various can-nabinoid researchers, were analyzed. One out of every six analy-tical samples corresponded to a control plasma to which a knownamount of THC was added. The measured concentrations of THC inthe spiked plasma samples are summarized in Table 1.
75
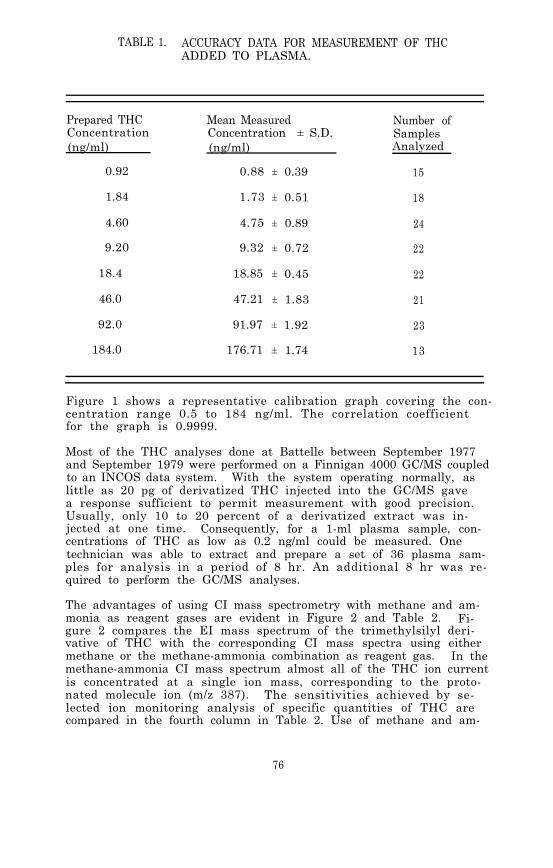
TABLE 1. ACCURACY DATA FOR MEASUREMENT OF THCADDED TO PLASMA.
Prepared THC Mean MeasuredConcentration Concentration ± S.D.(ng/ml) (ng/ml)
0.92 0.88 ± 0.39
1.84 1.73 ± 0.51
Number ofSamplesAnalyzed
15
18
4.60 4.75 ± 0.89 24
9.20 9.32 ± 0.72 22
18.4 18.85 ± 0.45 22
46.0 47.21 ± 1.83 21
92.0 91.97 ± 1.92 23
184.0 176.71 ± 1.74 13
Figure 1 shows a representative calibration graph covering the con-centration range 0.5 to 184 ng/ml. The correlation coefficientfor the graph is 0.9999.
Most of the THC analyses done at Battelle between September 1977and September 1979 were performed on a Finnigan 4000 GC/MS coupledto an INCOS data system. With the system operating normally, aslittle as 20 pg of derivatized THC injected into the GC/MS gavea response sufficient to permit measurement with good precision.Usually, only 10 to 20 percent of a derivatized extract was in-jected at one time. Consequently, for a 1-ml plasma sample, con-centrations of THC as low as 0.2 ng/ml could be measured. Onetechnician was able to extract and prepare a set of 36 plasma sam-ples for analysis in a period of 8 hr. An additional 8 hr was re-quired to perform the GC/MS analyses.
The advantages of using CI mass spectrometry with methane and am-monia as reagent gases are evident in Figure 2 and Table 2. Fi-gure 2 compares the EI mass spectrum of the trimethylsilyl deri-vative of THC with the corresponding CI mass spectra using eithermethane or the methane-ammonia combination as reagent gas. In themethane-ammonia CI mass spectrum almost all of the THC ion currentis concentrated at a single ion mass, corresponding to the proto-nated molecule ion (m/z 387). The sensitivities achieved by se-lected ion monitoring analysis of specific quantities of THC arecompared in the fourth column in Table 2. Use of methane and am-
76

FIGURE 1. CALIBRATION GRAPH FOR ANALYSIS OF THC INPLASMA
77

FIGURE 2. MASS SPECTRA OF TRIMETHYLSILYLATED THC
78
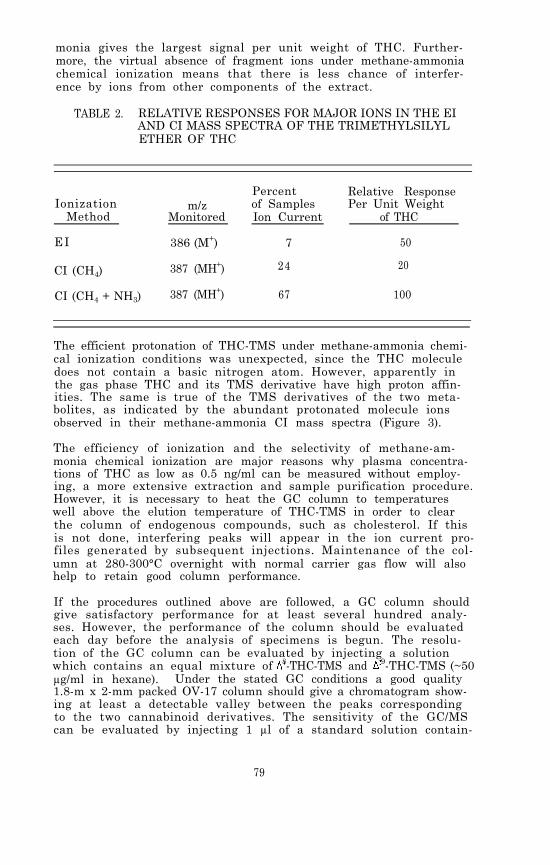
monia gives the largest signal per unit weight of THC. Further-more, the virtual absence of fragment ions under methane-ammoniachemical ionization means that there is less chance of interfer-ence by ions from other components of the extract.
TABLE 2. RELATIVE RESPONSES FOR MAJOR IONS IN THE EIAND CI MASS SPECTRA OF THE TRIMETHYLSILYLETHER OF THC
IonizationMethod
EI
Percent Relative Responsem/z of Samples Per Unit Weight
Monitored Ion Current of THC
386 (M+) 7 50
CI (CH4) 387 (MH+) 24 20
CI (CH4 + NH3) 387 (MH+) 67 100
The efficient protonation of THC-TMS under methane-ammonia chemi-cal ionization conditions was unexpected, since the THC moleculedoes not contain a basic nitrogen atom. However, apparently inthe gas phase THC and its TMS derivative have high proton affin-ities. The same is true of the TMS derivatives of the two meta-bolites, as indicated by the abundant protonated molecule ionsobserved in their methane-ammonia CI mass spectra (Figure 3).
The efficiency of ionization and the selectivity of methane-am-monia chemical ionization are major reasons why plasma concentra-tions of THC as low as 0.5 ng/ml can be measured without employ-ing, a more extensive extraction and sample purification procedure.However, it is necessary to heat the GC column to temperatureswell above the elution temperature of THC-TMS in order to clearthe column of endogenous compounds, such as cholesterol. If thisis not done, interfering peaks will appear in the ion current pro-files generated by subsequent injections. Maintenance of the col-umn at 280-300°C overnight with normal carrier gas flow will alsohelp to retain good column performance.
If the procedures outlined above are followed, a GC column shouldgive satisfactory performance for at least several hundred analy-ses. However, the performance of the column should be evaluatedeach day before the analysis of specimens is begun. The resolu-tion of the GC column can be evaluated by injecting a solutionwhich contains an equal mixture of 8-THC-TMS and 9-THC-TMS (~50µg/ml in hexane). Under the stated GC conditions a good quality1.8-m x 2-mm packed OV-17 column should give a chromatogram show-ing at least a detectable valley between the peaks correspondingto the two cannabinoid derivatives. The sensitivity of the GC/MScan be evaluated by injecting 1 µl of a standard solution contain-
79

FIGURE 3. METHANE-AMMONIA CI MASS SPECTRA OF TRI-METHYLSILYL DERIVATIVES OF THC (TOP), 11-OH-THC (MIDDLE), AND 9-CARBOXY-THC (BOTTOM)
80

ing 1 ng of THC-TMS. The peak in the m/z 387 ion current profilewhich corresponds to the THC-TMS should be symmetrical and have asignal-to-noise ratio of greater than 50:1.
The procedure described above for analysis of the THC metaboliteshas not been used as extensively as the THC method, and thereforeit is not as thoroughly validated. A similar procedure, in whichthe 9-carboxy-THC was first converted to its methyl ester by treat-ment with ethereal diazomethane and then trimethylsilylated, wasemployed at Battelle for the analysis of approximately 300 plasmasamples. Figure 4 shows representative calibration graphs acquiredat the time these assays were conducted. Table 3 lists the assayprecision for the analysis of plasma samples to which a known con-centration of each of the metabolites was added.
TABLE 3. PRECISION DATA FOR MEASUREMENT OFTHC METABOLITES ADDED TO PLASMA
MetaboliteConcentration
(ng/ml)
1
11-OH-THCRSD(%)
7
9-Carboxy-THCRSD(%)
31
5 4 7
10 2 2
50 1 3
100 3 2
It has been shown recently that up to 80 percent of the 9-carboxy-THC in urine from marijuana smokers is present in the form of aglucuronide conjugate (64). The glucuronic acid residue appearsto be attached to the metabolite by an ester linkage with the 9-carboxyl group of the metabolite. The conjugate is not cleavedby conventional treatment with ß-glucuronidase and sulphatase, butcan be cleaved by alkaline hydrolysis (65). The recommended con-ditions for hydrolysis are to add the biological specimen to anequal volume of 1 M sodium hydroxide in methanol and heat on asteam bath (100°C) for 12 minutes. Acidify the mixture to pH 2by addition of 1 ml of 1 N sulfuric acid and 1 ml of pH 2 buffer.The total 9-carboxy-THC concentration can then be determined byextraction with hexane:ethyl acetate, derivatization, and GC/MSanalysis as previously described.
The analysis of THC in decomposed blood or tissues presents spe-cial problems. The main difficulty is that the efficiency of ex-traction of THC from decomposed blood with hexane is poor and er-ratic. Even deuterated THC added to decomposed blood as an inter-
81

FIGURE 4. CALIBRATION GRAPH FOR ANALYSIS OF 11-OH-THCAND 9-CARBOXY-THC AS THEIR TRIMETHYLSILYLDERIVATIVES
82

nal standard is difficult to extract efficiently with hexane. Ap-parently the THC binds to biochemical components in the decomposedblood in a manner that inhibits its removal by conventional ex-traction procedures. A procedure was recently reported for thequantitative determination of THC in cadaver blood (66). The me-thod involves extraction of 3 ml of blood with a total of 50 mlof acetone, evaporation of the acetone, extraction of the residuewith petroleum ether, and then chromatography on Sephadex LH-20followed by GC/MS analysis. A simpler procedure was developedat Battelle for extraction of THC from hemolyzed and decomposedblood (67); it gave acceptable quantitative results for concen-trations of THC down to 1 ng/ml for most batches of hemolyzedblood. However, occasionally large variations in extraction ef-ficiency did occur, indicating that the method needs further re-finement. The procedure consists of addition of the internal stan-dard to 1 ml of hemolyzed blood followed by 1 ml of 3 N H2SO4 and1 ml of acetonitrile. The mixture is sonicated and the resultingprotein precipitate removed after centrifugation. The supernatantis then neutralized with 3 N NaOH, and 1 ml of pH 7.0 buffer isadded. The aqueous solution is extracted twice with 6 ml of hex-ane. The remaining steps, which include successive washes of thehexane extract with dilute alkali and dilute acid followed by con-centration and derivatization, are identical to the procedure forextraction of THC from normal plasma.
83

PHYSICAL, CHEMICAL AND SPECTROMETEIC DATAFOR 9-TETRAHYDROCANNABINOL
Nomenclature
Chemical Name: 6aR-trans-6a,7,8,10a-Tetrahydro-6,6,9-trimethyl-3-pentyl-6H-dibenzo[b,d]pyran-1-ol
Empirical Formula: C21H30O2
Chemical Registry Number: 1972-08-3
Physical Constants
Appearance: Colorless viscous syrup
Boiling Point: 200°C at 0.02 mm
Specific Rotation: = -150.5° (c = 0.53 in CHCl3)
Solubility: Very soluble in hexane, chloroform and ethanol. Solu-bility in water, 3 mg/liter
pKa: 10.6
UV Absorption: max (ethanol) = 283, 276 nm (log E 3.21, 3.20)
PHYSICAL, CHEMICAL AND SPECTROMETRIC DATA FOR11-HYDROXY- 9-TETRAHYDROCANNABINOL
Nomenclature
Chemical Name: 6aR-trans-6a,7,8,10a-Tetrahydro-1-hydroxy-6,6-dimethyl-3-pentyl-6H-dibenzo[b,d]pyran-9-methanol
Empirical Formula: C21H30O3
Chemical Registry Number: 36557-05-8
Physical Constants
Appearance: White, amorphous solid
Melting Point: 139-140°C
Solubility: Soluble in ethanol, acetone. Sparingly soluble inbenzene, chloroform. Nearly insoluble in water,petroleum ether
UV Absorption: m a x (ethanol) = 276, 282 nm
84

PHYSICAL, CHEMICAL AND SPECTROMETRIC DATA FOR11-NOR-9-CARBOXY- 9-TETRAHYDROCANNABINOL
Nomenclature
Chemical Name: 6aR-trans-6a,7,8,10a-Tetrahydro-1-hydroxy-6,6-dimethyl-3-pentyl-6H-dibenzo[b,d]pyran-9-car-boxylic acid
Empirical Formula: C21H28O4
Chemical Registry Number: 56354-06-4
Physical Constants
Appearance: White, crystalline solid
Melting Point: 210-213°C
Solubility: Soluble in ethanol, acetone. Sparingly soluble inchloroform, ethyl ether. Nearly insoluble in water,benzene, petroleum ether
REFERENCES
1.
2.
3.
4.
5.
6.
7.
8.
9.
S. Cohen in R.C. Petersen, ed., Marihuana Research Findings:1976. National Institute on Drug Abuse Research Monograph 14,DHEW Pub. (ADM) 77-501. Supt. of Docs., U.S. Govt. Print.Of f . , Washington, D.C., ch. 9 (July 1977).
A. Sperling. J. Chromatogr. Sci., 10, 268 (1972).
R. Karler in R.C. Petersen, ed., Marihuana Research Findings:1976, ch. 2. See reference 1.
J.W. Fairbairn, J.A. Liebmann, and M.G. Rowan. J. Pharm.Pharmacol., 28, 1 (1976).
R. Mechoulam and Y. Gaoni. J. Am. Chem. Soc., 87, 3273 (1965).
A.J. Singer, ed. “Marihuana: Chemistry, Pharmacology, andPatterns of Social Use”, Ann. N.Y. Acad. Sci., 191, 1-269(1971).
R. Mechoulam, ed. Marijuana, Academic Press, New York andLondon (1973).
W.D.M. Paton and J. Crown. Cannabis and its Derivatives,Oxford Univ. Press, London (1972).
R.E. Willette, ed., Drugs and Driving. National Institute onDrug Abuse Research Monograph 11, DHEW Pub. (AIM) 77-432.Supt. of Docs., U.S. Govt. Print. Off., Washington, D.C.(March 1977).
85

10. G. Nahas. U.N. Bull. Narcotics, 29, 13 (1977).
11. M.L. Lee, M. Novotny, and K.D. Bartle. Anal. Chem., 48,405 (1976).
12. R. Karler in R.C. Petersen, ed., Marihuana Research Findings:1976, ch. 3. See reference 1.
13. E.G. Leighty, A.F. Fentiman, Jr., and R.L. Foltz. Res. Commun.Chem. Pathol. Pharmacol., 14, 13 (1976).
14. R. Mechoulam, W.K. McCallum, and S. Burstein. Chem. Rev., 76,75 (1976).
15. G.G. Nahas, W.D.M. Paton, and J.E. Idanpaan-Heikkila, eds.,Marihuana: Chemistry, Biochemistry, and Cellular Effects.Springer-Verlag, New York (1976).
16. M.C. Braude and S. Szara, eds., Pharmacology of Marihuana,Vol. 1 2. Raven Press, New York (1976).
17. M.E. Wall. Ann. N.Y. Acad. Sci., 191, 23 (1971).
18. D.J. Harvey, B.R. Martin, and W.D.M. Paton. J. Pharm. Phar-macol., 29, 495 (1977).
19. J. Schou, L.D. Prockop, G. Dahlstrom, and C. Rohde. ActaPharmacol. et Toxicol., 41, 33 (1977).
20. S.L. Kanter, L.E. Hollister, F. Moore, and D.E. Green. Clin.Chem., 20, 860 (1974).
21. E.R. Garrett and C.A. Hunt. J. Pharm. Sci., 63, 1056 (1974).
22. R. Mechoulam. Science, 168, 1159 (1970).
23. R. Boudon. Euro. J. Toxicol., 9, 11 (1976).
24. M. Frei-Hausler and R.W. Frei. J. Chromatogr., 79, 209 (1973).
25. M. Frei-Hausler and R.W. Frei. J. Chromatogr., 84, 214 (1973).
26. A.P. Melikian and I.S. Forrest. J. Pharm. Sci., 62, 1025 (1973).
27. H. Bowd, D.H. Swann, B. Towell, and J.H. Turnbull, in J.B. Birks,ed. , Excited States Biol. Mol. Proc. Int. Conf. 1974. Wiley,Chichester, England, p. 128 (1976).
28. J.M. Schermann, H. Hoellinger, N.-H.-Nam, R. Bourdon, and E.Fournier. Clin. Chem. Acta, 79, 401 (1977).
29. W.W. Just, N. Filipovic, and G. Werner. J. Chromatogr., 96,189 (1974).
86
30.
31.
32.
33.
34.
35.
36.
37.
38.
39.
40.
41.
42.
43.
44.
45.
J.A. Vinson, D.D. Patel, and A.H. Patel. Anal. Chem., 49,163 (1977).
L. Lemberger, in Garattini F. Hawking, A. Goldin, and I.J.Kopin, eds., Advances in Pharmacology and Chemotherapy. Aca-demic Press, New York and London, 10, p. 221 (1972).
J.D. Teale, E.J. Forman, L.J. King, E.M. Piall, and V. Marks.J. Pharm. Pharmacol., 27, 465 (1975).
J.D. Grant, S.J. Gross, P. Lomax, and R. Wong. Nature NewBiol., 236, 216 (1972).
C.E. Cook, M.L. Hawes, E.W. Amerson, C.G. Pitt, and D. Williamsin R.E. Willette, ed., Cannabinoid Assays in Humans. NationalInstitute on Drug Abuse Research Monograph 7, DHEW Pub. (ADM)76-339. Supt. of Docs., U.S. Govt. Print. Off., Washington,D.C., p. 15 (May 1976).
P.T. Tsui, K.A. Kelly, M.M. Ponpipom, M. Strahilevitz, andA.H. Sehon. Can. J. Biochem., 52, 252 (1974).
A.R. Chase, P.R. Kelley, A. Taunton-Rigby, R.T. Jones, andT. Harwood in R.E. Willette, ed., Cannabinoid Assays in Hu-mans, p. 1. See reference 34.
S.J. Gross and J.R. Soares in R.E. Willette, ed., CannabinoidAssays in Humans, p. 10. See reference 34.
P.L. Williams, A.C. Moffat, and L.J. King. J. Chromatogr.,155, 273 (1978).
G.L. Rowley, T.H. Armstrong, C.P. Crowl, W.M. Eimstad, W.M. Hu,J.K. Kam, R. Rogers, R.C. Ronald, K.E. Rubenstein, B.G. Sheldon,and E.F. Ullman in R.E. Willette, ed., Cannabinoid Assays inHumans, p. 28. See reference 34.
D.C. Fenimore, R.R. Freeman, and P.R. Loy. Anal. Chem., 45,2331 (1973).
E.E. Knaus, R.T. Coutts, and C.W. Kazakoff. J. Chromatogr.Sci., 14, 525 (1976).
N.K. McCallum and E.R. Cairns. J. Anal. Toxicol., 2, 89 (1978).
E.R. Garrett and C.A. Hunt in R.E. Willette, ed., CannabinoidAssays in Humans, p. 28. See reference 34.
E.R. Garrett and C.A. Hunt. J. Pharm. Sci., 66, 20 (1977).
F.W. Karasek, D.E. Karasek, and S.H. Kim. J. Chromatogr.,105, 345 (1975).
87

46.
47.
48.
49.
50.
51.
52.
53.
54.
55.
56.
57.
58.
59.
60.
61.
S. Agurell, B. Gustafsson, B. Holmstedt, K. Leander, J.-E.Lindgren, I. Nilsson, F. Sandberg, and M. Asberg. J. Pharm.Pharmacol., 25, 554 (1973).
A. Ohlsson, J.-E. Lindgren, K. Leander, and S. Agurell in R.E. Willette, ed., Cannabinoid Assays in Humans, p. 48. Seereference 34.
M. Nordqvist, J.-E. Lindgren, and S. Agurell in R.E. Willette,ed. , Cannabinoid Assays in Humans, p. 64. See reference 34.
J.M. Rosenfeld, B. Bowins, J. Roberts, J. Perkins, and A.S.Macpherson. Anal. Chem., 46, 2232 (1974).
J.M. Rosenfeld and V.Y. Taguchi. Anal. Chem., 48, 726 (1976).
J.M. Rosenfeld. Anal. Letters, 10, 917 (1977).
D.E. Green in R.E. Willette, ed., Cannabinoid Assays in Humans,p. 70. See reference 34.
M.E. Wall, T.M. Harvey, J.T. Bursey, D.R. Brine, and D. Rosen-thal in R.E. Willette, ed., Cannabinoid Assays in Humans, p.107. See reference 34.
D. Rosenthal, T.M. Harvey, J.T. Bursey, D.R. Brine, and M.E.Wall. Biomed. Mass Spectr., 5, 312 (1978).
J.L. Valentine, P.J. Bryant, P.L. Gutshall, O.H.M. Gan, E.D.Thompson, and H.C. Hiu in R.E. Willette, ed., CannabinoidAssays in Humans, p. 96. See reference 34. Also, J. Pharm.Sci., 66, 1263 (1977).
J.N. Pirl, V.M. Papa, and J.J. Spikes. J. Anal. Toxicol., 3,129 (1979).
L. Lemberger, S.D. Silberstein, J. Axelrod, and I.J. Kopin.Science, 170, 1320 (1970).
J.A. Vinson, ed., Cannabinoid Analysis in Physiological Fluids,ACS Symposium Series 98. American Chemical Society, Washington,D.C. (1979).
R.E. Willette, ed., Cannabinoid Assays in Humans. NationalInstitute on Drug Abuse Research Monograph 7, DHEW Pub. (ADM)76-339. Supt. of Docs., U.S. Govt. Print. Off., Washington,D.C. (May 1976).
R.L. Hawks, ed., The Analysis of Cannabinoids in BiologicalFluids. National Institute on Drug Abuse Resarch MonographSeries. In preparation.
R.L. Foltz and B.J. Hidy in R.L. Hawks, ed., The Analysis ofCannabinoids in Biological Fluids. See reference 60.
88

62. C.M. Bonuccelli. J. Pharm. Sci., 68, 262 (1979).
63. D.C. Fenimore, C.M. Davis, J.H. Whitford, and C.A. Harrington.Anal. Chem., 48, 2289 (1976).
64. A.C. Moffat in R.L. Hawks, ed., The Analysis of Cannabinoidsin Biological Fluids. See reference 60.
65. P.L. Williams, A.C. Moffat, and L.J. King. J. Chromatogr.,186, 595 (1979).
66. D. Rosenthal and D. Brine. J. Forensic Sci., 24, 282 (1979).
67. B.J. Hidy and R.L. Foltz. Final Report on Quantification ofCannabinoids in Body Fluids. National Institute on Drug Abuse,Contract No. HSM-42-72-183, January 1980.
89

Chapter 7
Cocaine and Its Major Metabolite,BenzoylecgonineCocaine (3-benzoyloxy-8-methyl-8-azabicyclo[3.2.1]octane-2-carboxylicacid methyl ester, I) is an alkaloid obtained from the leaves ofErythroxylon coca or by synthesis from ecgonine. Although cocainehydrochloride has limited medical use as a topical anesthetic, itis widely used as a stimulant by drug abusers. The major geographi-cal sources of illicit cocaine are Peru, Bolivia, and Ecuador. Theplant from which it comes is largely restricted to the Andes moun-tain regions of these countries. In these areas the plant leaveshave been chewed by the native population for many centuries for
religious purposes and as an adjunct to work, much as coffee isconsumed as a stimulant in our culture (1) . However, when the psy-choactive ingredients of the leaf are isolated and injected or in-haled intranasally in concentrated form, the pharmacological effectscan be quite different from those which occur in the traditionalpattern of cocaine use among Andean Indians. The leaves contain onlyabout 1 percent cocaine, and the oral route appears to delay absorp-tion and decrease toxicity.
Cocaine was first isolated from coca leaves in 1860, and its thera-peutic possibilities were quickly recognized by some physicians,especially in Europe. By 1890 it was incorporated into a varietyof patent nostrums and “tonics” such as Coca Cola, although since1910 the latter has not contained any cocaine (2). The dangerousqualities of cocaine soon became apparent, and following its inclu-sion in a U.S. narcotics law in 1914, cocaine went “underground,”to be used primarily in the Bohemian subculture of artists and musi-cians. It reemerged about 1970 as the “status” drug among middle-class drug abusers in this country, who commonly refer to it as“coke” or “snow” (3). The reason for its popularity is the natureof the stimulation it produces; i.e., feelings of heightened sex-uality, psychic energy, and self-confidence which are of short dura-tion (a few minutes) but very intense.
90
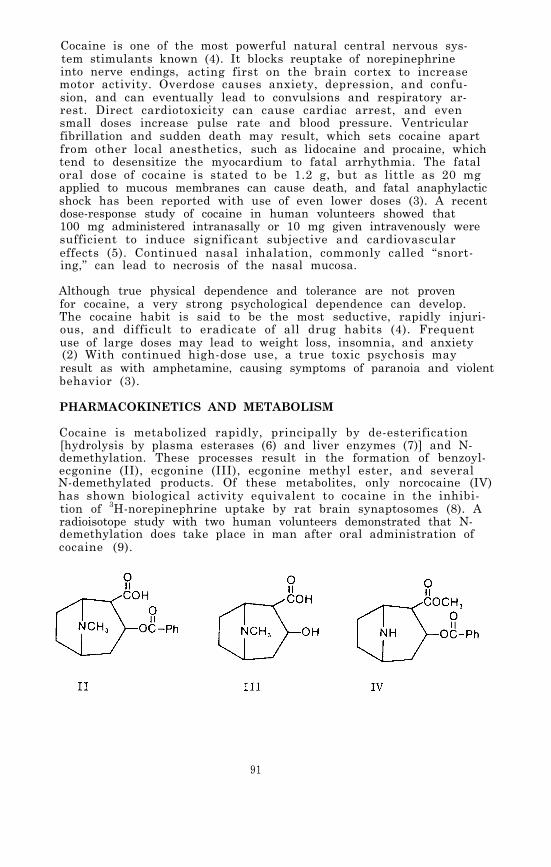
Cocaine is one of the most powerful natural central nervous sys-tem stimulants known (4). It blocks reuptake of norepinephrineinto nerve endings, acting first on the brain cortex to increasemotor activity. Overdose causes anxiety, depression, and confu-sion, and can eventually lead to convulsions and respiratory ar-rest. Direct cardiotoxicity can cause cardiac arrest, and evensmall doses increase pulse rate and blood pressure. Ventricularfibrillation and sudden death may result, which sets cocaine apartfrom other local anesthetics, such as lidocaine and procaine, whichtend to desensitize the myocardium to fatal arrhythmia. The fataloral dose of cocaine is stated to be 1.2 g, but as little as 20 mgapplied to mucous membranes can cause death, and fatal anaphylacticshock has been reported with use of even lower doses (3). A recentdose-response study of cocaine in human volunteers showed that100 mg administered intranasally or 10 mg given intravenously weresufficient to induce significant subjective and cardiovasculareffects (5). Continued nasal inhalation, commonly called “snort-ing,” can lead to necrosis of the nasal mucosa.
Although true physical dependence and tolerance are not provenfor cocaine, a very strong psychological dependence can develop.The cocaine habit is said to be the most seductive, rapidly injuri-ous, and difficult to eradicate of all drug habits (4). Frequentuse of large doses may lead to weight loss, insomnia, and anxiety(2) With continued high-dose use, a true toxic psychosis mayresult as with amphetamine, causing symptoms of paranoia and violentbehavior (3).
PHARMACOKINETICS AND METABOLISM
Cocaine is metabolized rapidly, principally by de-esterification[hydrolysis by plasma esterases (6) and liver enzymes (7)] and N-demethylation. These processes result in the formation of benzoyl-ecgonine (II), ecgonine (III), ecgonine methyl ester, and severalN-demethylated products. Of these metabolites, only norcocaine (IV)has shown biological activity equivalent to cocaine in the inhibi-tion of 3H-norepinephrine uptake by rat brain synaptosomes (8). Aradioisotope study with two human volunteers demonstrated that N-demethylation does take place in man after oral administration ofcocaine (9).
91

Benzoylecgonine and ecgonine are highly polar and therefore theydo not cross the blood-brain barrier in pharmacologically-signifi-cant concentrations. However, norcocaine has been found in thebrains of monkeys given repeated doses of cocaine (8), and theN-demethylation of cocaine has been shown to occur in the brain ofrats (10). The lipophilic nature of cocaine and norcocaine helpsto account for their penetration across the blood-brain barrier.In animal studies which compared the disposition and pharmacoki-netics of radiolabeled cocaine in acute versus chronically treatedrats, chronic treatment led to consistently higher concentrationsof cocaine being sequestered in fat depots. Although cocaine dis-appeared rapidly from brain in acute treatment, measurable amountspersisted in brain and other tissues of chronically treated ratslong after the disappearance of cocaine from plasma (11). In dogs,however, brain-to-plasma ratios of cocaine were lower in chronicallythan in acutely treated animals 2 to 4 hr after injection, and un-metabolized cocaine did not persist in the CNS (12). Radiolabelstudies in rats have also shown localization of cocaine or itsmetabolites in other tissues, including kidney, lung, spleen, testes,intestine, muscle, liver, and heart (13).
In man less than 20 percent, and often only 1 percent, of the parentdrug is excreted in urine; the amount excreted is related to doseand urine acidity. Cocaine is also found in the bile. The prin-cipal urinary metabolites, II (25-54 percent of dose) and III, arehighly water soluble and are largely excreted within 24-36 hr afteradministration of cocaine (14). A time-course study of the urinaryexcretion of benzoylecgonine following intranasal administrationof cocaine in human subjects showed the appearance of the metabo-lite in 1-4 hr and a peak urine concentration at 10-12 hr (15).In another study, peak urine concentrations of benzoylecgonine (upto 75 µg/ml) occurred 1-12 hr after nasal inhalation of clinicaldoses of cocaine (1.5 mg/kg) and diminished slowly over severaldays; it was still detectable by radioimmunoassay at 144 hr in onepatient. Maximum urine concentrations of unchanged cocaine (up to24 µg/ml) occurred within 2 hr of intranasal administration anddiminished rapidly. Benzoylecgonine/cocaine ratios in urine weretoo varied among individuals to be of use in predicting cocaineconcentrations from benzoylecgonine data or vice versa (16).
Following an intravenous dose of 100 mg of cocaine hydrochloride tothree human subjects, cocaine concentrations in plasma peaked at5 min and then declined over 5-6 hr, with a distributional half-life in the plasma of 20-40 min, corresponding to the time-courseof psychologic effects. The mean biologic half-life of cocaine inplasma was reported to be 2.8 hr. In the same study, benzoylecgoninewas detected in plasma 5 min after intravenous administration ofcocaine. Plasma concentrations of the metabolite increased rapidlyin the first hour, remained stable for 2-4 hr, and then declinedslowly. After 24 hr, the benzoylecgonine was still detectable.The persistence of benzoylecgonine in plasma suggested that it wasstrongly bound to plasma proteins (17). The pharmacokinetic mea-surements were comparable to those reported for patients receivingcocaine in the form of a topical anesthetic, and indicated rapid
92
absorption of cocaine through mucous membranes. Plasma concen-trations of cocaine in another human study increased rapidly for15-20 min after intranasal application of 1.5 mg/kg, peaked at15-60 min, and then decreased gradually for 3-5 hr. Maximum plasmaconcentrations ranged from 120 ng/ml to 474 ng/ml (18,19). Incases of acute intoxication, blood concentrations of cocaine aslow as 200 ng/ml have been associated with fatalities, althoughconcentrations up to 9.0 µg/ml are more commonly reported in co-caine deaths when no other drugs were present (20).
ANALYTICAL METHODOLOGY
Because of its rapid metabolism, detection and quantitation of co-caine in body fluids is difficult. In addition to the low concen-trations likely to be encountered in blood and in urine (21), theassay of cocaine presents technical problems caused by hydrolysisof the drug by plasma enzymes and under conditions of storage andlaboratory manipulation. Even when stored in a frozen state, 40percent of the cocaine in plasma was shown to be lost within 5days, and 60 percent within a month; at room temperature 45 per-cent of the cocaine in plasma was lost within 1 hr. However,addition of sodium fluoride (2.5 mg/ml plasma) to the plasma toinhibit enzymatic hydrolysis prevented any appreciable loss ofcocaine in plasma maintained at room temperature for 2 hr (22).Under strongly basic (pH > 10) or acidic (pH< 5) conditions, chemi-cal hydrolysis of cocaine to benzoylecgonine and ecgonine is accel-erated. For these reasons, measurement of the cocaine metabolites,particularly benzoylecgonine, has been emphasized in the develop-ment of assay procedures. However, the metabolites of cocaine arevery polar and also amphoteric; they are not readily extractableinto the organic solvents normally used for drug screening, andtherefore specialized methods must be employed for their recoveryfrom biological materials,
Colorimetric techniques, which are at best semiquantitative, havebeen used to determine cocaine in urine (23) and other biologicalfluids. An early study on the distribution and metabolism of co-caine in dogs and rabbits was based on such a method; it involvedextraction with chloroform, passage of the extract through a su-crose column, and addition of bromcresol purple. Optical densi-ties of the resulting yellow solutions were determined on a spec-trophotometer at 410 nm, and a sensitivity of 0.5-1.0 µg/ml inurine, blood, and tissue homogenates was reported (24,25). Spec-trophotometric methods, however, are neither specific nor suffici-ently sensitive for use in most cases of cocaine analysis.
Thin-layer chromatography (TLC), commonly used for routine identi-fication of abused drugs in urine, requires special solvent systemsfor separation as well as for extraction of cocaine metabolites.In one TLC method, cocaine and its metabolites were extractedfrom urine with 25 percent ethanol in chloroform at pH 10-11 andchromatographed on silica gel plates developed in methanol:ammonia(99:1) and sprayed with an iodoplatinate reagent. The solvent sys-tem separated ecgonine from benzoylecgonine and cocaine, but to
93

separate the latter two compounds from each other it was neces-sary to use ethyl acetate:methanol:ammonia (85:10:10) (26). Ano-ther TLC assay involved extraction with a mixture of chloroform:isopropanol:dichloroethane (8:1:3) at pH 8.5. The sensitivityfor benzoylecgonine analyzed by this procedure was 3-5 µg/ml (27).
More recently, a TLC method using a double solvent system on sili-ca gel sheets involved a butylation step after extraction of co-caine and its metabolites from urine with chloroform:ethanol(3:2) at pH 8-9; it provided a sensitivity of 3 µg/ml (28). Thesensitivity limits for TLC of cocaine and benzoylecgonine in urinewere subsequently lowered to 0.1 and 0.25 µg/ml, respectively, byspraying the developed plates with Dragendorff’s reagent followedby an overspray with dilute H2SO4 and exposure to iodine vapors(29). Another refinement of TLC detection procedures involvedpreliminary absorption of the compounds onto paper loaded withSA-2 cation exchange resin. Extraction from the resin was madewith chloroform: isopropanol: dichloroethane (4.5:0.9:4.5); sensi-tivity for cocaine and its metabolites was 1 µg/ml. in 20 ml ofurine. If other drugs were to be assayed in the same urine sam-ple, cocaine and the other drugs were first extracted from the pa-per at pH 10 and chromatographed in a two-stage solvent system.Benzoylecgonine was extracted from the aqueous buffer phase afteracidification and readjustment of the pH to 8.1-8.4. The sensitiv-ity limit for benzoylecgonine was 2 µg/ml. Alternatively, benzoyl-ecgonine alone was directly extracted from 5 ml of urine with thechloroform: isopropanol: dichloroethane solvent and was detected ata sensitivity limit of 0.5 µg/ml by TLC using Dragendorff’s reagentand an iodine-potassium iodide reagent (30).
The enzyme-multipled immunoassay technique (EMIT) is widely usedin urine screening for cocaine abuse, and has a detection limit of1 µg/ml of benzoylecgonine. No extraction is required, and theassay takes less than 2 min to perform. It does not detect cocainenor is it applicable to plasma (31). A commercially available radio-immunoassay has been developed based on a 125I-labeled benzoylecgo-nine derivative (32). The RIA is now widely used for screeningurine samples for benzoylecgonine and can also be used for quanti-tative measurement of “benzoylecgonine equivalents” which includecocaine and other tropane alkaloids which cross-react with theantibody. The assay will detect benzoylecgonine at urine concen-trations as low as 2 ng/ml, but 100 ng/ml has been recommended asthe “cutoff” concentration for positives in routine screening. Anevaluation of the RIA method has been published in which it is com-pared with GC, TLC and EMIT methods for analysis of benzoylecgoninein urine (33).
Quantitative analysis of cocaine in biological fluids has reliedprimarily on the development of gas chromatographic methods (GC).Cocaine can be gas chromatographed without derivatization, but itsmetabolites cannot. The carboxylic acid groups of II and III mustbe esterified with some reagent such as diazomethane, dimethylfor-mamide dimethylacetal, N,N-dicyclohexyl carbodimide, or n-butanol-boron trifluoride. Esterification with 2-chloroethanol in the pre-
94

sence of boron trichloride has the advantage of introducing a halo-genated substituent which renders the molecule suitable for elec-tron-capture detection (34). A solvent extraction procedure canbe used to separate benzoylecgonine and ecgonine from basic andneutral components of biological extracts prior to esterificationand GC analysis of the metabolites (35).
Gas Chromatography (GC) with flame-ionization detection (FID) hasoften been used for detection of cocaine and metabolites, especi-ally in urine. In one of the first studies of human cocaine meta-bolism, GC-FID with benzhexol as an internal standard was used formeasurement of cocaine in urine. Chromatography was on a 3 per-cent OV-17 column at 185°C, and a linear response was obtainedover a range of 0.5-15.0 µg/ml. Benzoylecgonine was assayed inthis system by continuous extraction with chloroform containing 5-
-cholestane as an internal standard; the extracted benzoylecgo-nine was methylated to cocaine for gas chromatography (36,37). GC-FID on a 2.5 percent SE- 30 column at 200°C was reported as a methodcapable of detecting 1 µg/ml of benzoylecgonine in urine. The ben-zoylecgonine was salted out of the urine into 95 percent ethanol,purified by TLC, eluted in water, and methylated before gas chroma-tography . The overall recovery was only 30-40 percent, but an ef-ficiency of 90-100 percent was reported for the initial ethanol ex-traction (38). Cocaine can be mistaken for pentazocine, levorphe-nol, or methaqualone on the OV-17 columns commonly used for drugscreening; for this reason, an on-column reaction of cocaine withtrimethyl anilinium hydroxide, which yields an unidentified pro-duct with a different retention time, has been suggested as a con-firmatory step in the detection of cocaine in urine (39).
For concurrent determination of 9 CNS-active drugs in human plasma,including cocaine, GC-FID analysis on a 3 percent OV-1 column followedextraction with benzene-isopropanol at pH 10. Recovery of cocainewas about 90 percent, and sensitivity limits corresponded to plasmadrug concentrations of 0.05 µg/ml. The technique had the advantageof comparative simplicity for routine purposes (40). Another pro-cedure designed to determine both cocaine and benzoylecgonine inurine involved methylation of the metabolite, converting it to co-caine in 72 percent yield before GC-FID analysis on a 3 percent OV-17 column. Butylanthraquinone was used as an internal standard.The extraction technique (chloroform:ethanol, 4:1) gave a recoveryof 93 percent for cocaine and 65 percent for benzoylecgonine at pH5.5-9.5. The sensitivity reported was 0.20 µg/ml in a 5-ml speci-men, which was adequate for the measurement of urinary drug andmetabolite concentrations of postsurgical patients up to 24 hr aftertopical cocaine anesthesia (250 mg applied to nasal mucosa) (41).
Similarly, simultaneous determination of cocaine and its metabolitesin urine, using gas chromatography on columns coated with 3 percentSP-2250-DA or 3 percent SE-30, has been reported. In this case ex-traction was into chloroform:ethanol (3:1), followed by propylationof benzoylecgonine using an organic base and 1-iodopropane. Recov-ery of 99 percent of the cocaine and 80 percent of the benzoylecgo-nine, combined with 98 percent conversion of the metabolite to its
95

n-propyl ester, provided detection limits of 0.2 µg/ml in 5 ml ofurine. Back extraction and purification were required, and alsosynthesis of the n-pentyl ester of benzoylecgonine for use as aninternal standard. The procedure measured concentrations rangingfrom 0.2 to 18 µg/ml of benzoylecgonine in samples of urine fromdrug screening programs, and demonstrated concentrations of lessthan 0.3 µg/ml of cocaine and 8-136 µg/ml of benzoylecgonine inpooled 8-hour urine samples from postsurgical patients followingcocaine anesthesia (42).
A method reported for simultaneous analysis of cocaine and benzoyl-ecgonine in blood, bile, urine or tissue involved an extractivealkylation step to convert benzoylecgonine to its ethyl ester whichwas then readily separated from cocaine by gas chromatography (3 per-cent OV-17, 225°C). n-Propyl benzoylecgonine was used as the inter-nal standard (43).
The sensitivity of GC analysis for cocaine can be increased up to100-fold by use of a nitrogen-phosphorus detector. With this typeof detector sub-nanogram quantities of the drug can be measured ac-cording to a reported procedure which involved the use of the propylester of benzoylecgonine as an internal standard, back-extractioninto 0.1 H2SO4, and chromatography on an OV-17 column at 255°C (21).Another application of GC with nitrogen-phosphorus detection forthe measurement of cocaine in blood involved an ethylmorphine in-ternal standard, extraction with benzene:isopropanol (9:1) , andchromatography on a 3 percent SP-2100-DB column. Following topicalapplication of cocaine to nasal mucosa, as little as 20 ng of cocainewas detected in 1 ml of whole blood by this method (44).
An electron-capture detector has also been used for the measurementof benzoylecgonine in blood. The procedure involved extraction ofthe metabolite and an internal standard (chlorproethazine) from plasmawith chloroform: ethanol (4:1) at pH 9.5. The dried extract was alky-lated with pentafluorobenzyl bromide and the derivative partitionedinto benzene to eliminate more polar interfering substances, thenreextracted into acid. Sensitivity for the method was 5 ng of ben-zoylecgonine per ml of plasma. However, the presence of a backgroundcontaminant peak in urine decreased the sensitivity of the procedureto 50 ng/ml for urine analysis (17).
Measurement of 20-30 ng/ml of cocaine in urine, without the neces-sity of evaporative concentration procedures, was achieved in anadaptation of the GC-ECD technique which used an 0-acylated deriva-tive of reduced cocaine (heptafluorobutyric anhydride or pentafluoro-propionic anhydride added to the cyclohexane extract following reduc-tion with LiA1H4) (45). A very similar procedure was subsequentlyused to measure cocaine in plasma as well as urine (46).
High performance liquid chromatography (HPLC) on a reverse phasecolumn was used for separation and measurement of cocaine and ben-zoylecgonine extracted from urine. A detection limit of 0.1 µg/mlof urine was achieved by monitoring the ultraviolet absorption ofthe HPLC effluent at 200 nm. The chromatography procedure also per-
96
mitted the separation and detection of norcocaine and benzoylecgo-nine; however, debenzoylated metabolites such as ecgonine couldnot be detected because of insufficient UV absorption, even at 200nm (47).
The high specificity and sensitivity of gas chromatography/mass spec-trometry (GC/MS) has been applied to the analysis of cocaine andits metabolites in biological fluids (48-50). Concentrations ofcocaine and norcocaine in human urine were determined by a proce-dure which involved initial extraction at pH 8.5 into cyclohexanefollowed by back-extraction into 0.1 N HCl, and after adjustmentto basic pH with 1 N NH4OH, reextraction with cyclohexane. BeforeGC/MS analysis the norcocaine was converted to its N-trifluoroace-tamide derivative. Deuterium labeled analogs were used as inter-nal standards. Cocaine-2H3 was prepared by treatment of benzoyl-ecgonine with dimethylformamide dimethyl-2H6 acetal (Pierce, Rock-ford, Illinois), and norcocaine-2H3 was obtained by N-demethyla-tion of the deuterated cocaine, The assay measured 2 ng/ml of co-caine and norcocaine with a precision of 5 percent (48). A similarassay was developed by the same research group for quantitation ofcocaine and benzoylecgonine. Deuterium-labeled internal standardswere again used, except the deuterated cocaine was prepared by alky-lation of norcocaine with C2H31 and benzoylecgonine-2H3 was generatedfrom the labeled cocaine. Chloroform: isopropanol (4:1) was used toextract the benzoylecgonine from urine after adjustment of the pHto 9 with 0.1 N NH4OH. The extracted benzoylecgonine was then con-verted to its ethyl ester by treatment with diazoethane generatedby addition of N-ethyl-N-nitro-N-nitrosoguanidine to a biphasicsolution of KOH and ether. Electron impact ionization gave mole-cular ions of moderate abundance for cocaine (m/z 303) and benzoyl-ecgonine ethyl ester (m/z 317) which were monitored together withthe molecular ions for the deuterated internal standards. When allsystems were working well, an assay sensitivity of approximately2 ng/ml of cocaine and 5 ng/ml of benzoylecgonine could be achieved(49)
In another application of GC/MS to the assay of cocaine metabolitesin urine, benzoylecgonine was simultaneously extracted from urineand converted to its ethyl ester by a 10-min extractive-alkylationprocedure. The butyl ester of benzoylecgonine served as the internalstandard. Quantitation was accomplished by GC/MS using probability-based matching (SO).
HPLC is promising as a means of purifying polar metabolites extractedfrom body fluids; advantages are extraction selectivity and adaptabil-ity to automation (51). Other reported extraction procedures varywith the analytical method and the purpose of the assay. Cocaine iseasily extracted from alkaline aqueous media into organic solvents,including cyclonexane (12,45), ether (36,37), 2 percent isoamylalcohol in n-heptane (17,18,21), benzene:isopropanol 9:1 (recovery85-90 percent) (40,44), and chloroform (recovery 85-100 percent)(24). The recovery of cocaine is best at pH 9.5 (93 percent fromchloroform:ethanol). It drops to 76 percent at pH 10.5 because ofhydrolysis (52).
97
Benzoylecgonine can be removed from the aqueous phase by exhaustivecontinuous extraction with chloroform; by single extraction withchloroform:isopropanol:1,2-dichloroethane (4.5:0.9:4.5) (30) orchlorofornnethanol (4:1, recovery 65-80 percent) (17,41,42); saltedout together with other polar metabolites into alcohol from a K2CO3solution or a KH2PO4-K2HPO4 solution (38); or extracted into meth-anol from lyophilized urine (90-100 percent recovery) (38). Thelower pH possible with salting out procedures avoids saponificationof benzoylecgonine. Adsorption on nonionic (e.g., XAD-2) resins,followed by elution with chloroform: isopropanol (3:1), is recom-mended for extraction of some cocaine metabolites from tissue homo-genates, but ecgonine and norecgonine are not adsorbed by the resin(35).
Two recently-published books review information on the history,chemistry, pharmacology, analysis, and sociological aspects of co-caine (1,53).
EXPERIMENTAL PROCEDURE
Because cocaine is rapidly metabolized it is often desirable to ana-lyze for both the parent drug and its major metabolite, benzoylecgo-nine. Therefore, two procedures are described; both are modifica-tions of published methods developed at the Center for Human Toxi-cology, University of Utah (54). Procedure 1 consists of a simple,direct extraction which permits rapid measurement of cocaine concen-trations only. Procedure 2 takes longer, but permits simultaneousmeasurement of both cocaine and benzoylecgonine concentrations.The latter procedure consists of extraction with chloroform: isopro-panol from a sodium chloride-saturated solution of the body fluid,derivatization of the extracted benzoylecgonine by heating with N,N-dimethylformide di-n-propyl acetal, sample purification by back-extraction of the basic drug and the derivatized metabolite intoacid, and finally adjustment to basic pH and reextraction into anorganic solvent prior to quantitation by (GC/MS.
Cocaine is rapidly hydrolyzed by plasma esterases to ecgonine methylester (55), so it is important to inhibit these enzymes as soon asblood samples are collected for subsequent cocaine analysis (56).This can be done by collecting the sample in a tube containing so-dium fluoride, such as the grey stoppered 7-ml Venoject tubes (Kim-ble-Terumo, Inc., Elkton, MD 21921) which are supplied with 17.5 mgof solid sodium fluoride and 14 mg of potassium oxalate. An addi-tional 50 µl of a saturated sodium fluoride solution is added foreach ml of blood. The sample is then centrifuged and the plasmatransferred to a Teflon-lined, screw cap culture tube and frozenuntil analysis.
Standards and Reagents
Cocaine hydrochloride and benzoylecgonine of high purity can be pur-chased from Applied Science laboratories, State College, PA 16801.Cocaine hydrochloride labeled with 3 deuterium atoms on the N-methylgroup (cocaine-2H3 HCl), and benzoylecgonine labeled with deuterium
98
on the benzoyl group (benzoylecgonine-2H3) were obtained from theNational Institute on Drug Abuse. On the basis of mass spectralanalysis the cocaine-2H3 had an isotopic composition of: 2H3, 96percent; 2H2, 1 percent; 2H1, 1 percent; and 2H0, 0 percent. Theisotopic composition of the benzoylecgonine-2H3 was: 2H5, 7 percent;2H4, 31 percent; 2H3, 40 percent; 2H2, 21 percent; 2H1 and 1H1, 0percent.
Prepare a pH 9.6 buffer by dissolving 500 grams of potassium mono-hydrogen phosphate (K2HP04) in about 500 ml of distilled water.Allow the solution to cool to room temperature and then add suffi-cient distilled water to make exactly one liter.
N,N-Dimethylformamide di-n-propyl acetal was purchased from theAldrich Chemical Company, Milwaukee, WI 53233.
Stock solutions of cocaine and benzoylecgonine are prepared as fol-lows for the purpose of determining calibration graphs and preparingworking standards. Weigh into a 100-ml volumetric flask about 11.2mg of cocaine hydrochloride (equivalent to 10 mg of free base) and10 mg of benzoylecgonine, and record the weights to the nearest 0.1mg. Dissolve the measured drug and metabolite in about 75 ml ofmethanol and then add additional methanol to give exactly 100 mlof solution. This solution will be referred to as the “0.10 mg/mlstock solution” although it should be labeled with its actual con-centration based upon the exact measured weights of cocaine and ben-zoylecgonine. A series of working standard solutions can then beprepared by appropriate dilution of the stock solution as describedin Chapter 2.
The stock solution of cocaine-2H3 and benzoylecgonine-2H3 is pre-pared in the same manner. For the measurement of drug and metabo-lite in body fluids within the concentration range 1 to 1000 ng/ml,addition of approximately 40 ng of the internal standards to eachml of body fluid is satisfactory. This can be conveniently done byadding 100 µl of a methanolic solution containing 400 ng/ml of bothcocaine-2H3 and benzoylecgonine-2H3 to each ml of body fluid. Pre-pare the 400-ng/ml internal standard solution by diluting 1 ml ofthe 0.10-mg/ml stock solution of cocaine-2H3 and benzoylecgonine-2H3 to 250 ml with methanol.
Store stock and working standard solutions in well-stoppered or cap-ped glass vessels in the dark at less than 0°C.
Extraction - Method 1 (Cocaine only)
Transfer 1 ml of whole blood, plasma or urine to a 5-ml glass-stop-pered, conical centrifuge tube. Add 100 µl of the internal standardsolution containing cocaine-2H3 and benzoylecgonine-2H3 at concentra-tions of 400 ng/ml. Vortex the mixture for 10 sec and then allowit to equilibrate for 15 min. Add 1 ml of K2HPO4 buffer (pH 9.6)followed by 100 µl of a solvent consisting of toluene:heptane:iso-amyl alcohol in a volume ratio of 70:20:10. Immediately stopperthe tube and vortex for at least 30 sec. Centrifuge the mixture at2000 x G for 15 min. The organic solvent should form a narrow upper
99

layer from which an aliquot can be removed with a syringe for in-jection into the GC/MS. If a distinct solvent layer is not ob-tained, add an additional 100 µl of organic solvent and recentri-fuge.
Extraction - Method 2 (Cocaine and Benzoylecgonine)
Transfer 1 ml of whole blood, plasma or urine to a 20-ml culturetube equipped with a Teflon-lined screw cap (0.5 to 2 ml of sam-ple can be used, but it must be measured accurately,). Add 100 µlof the internal standard solution containing cocaine-2H3 and ben-zoylecgonine-2H3 at concentrations of 400 ng/ml. Vortex the mix-ture for 10 sec and allow it to equilibrate for 15 min. Check thepH. If it is not 7.0 ± 0.5, add 1 ml of a pH 7 buffer. Saturatethe mixture with sodium chloride (about 0.5 g) to improve the ex-traction efficiency of benzoylecgonine. Add 8 ml of a solvent mix-ture of chloroform:isopropanol (9:1 v/v). Cap the tube and checkfor a leak around the cap. Gently mix the contents for 30 min usinga motorized rocker or rotator. Centrifuge for 5 min, remove theupper aqueous layer by aspiration, and transfer the lower organiclayer into a 12-ml conical, glass-stoppered centrifuge tube. Ifparticulate matter is present in the organic extract, it should beremoved by filtering the organic extract through silylated glasswool. It is important that the transferred organic extract be ab-solutely dry and devoid of any of the lipid interface that formsbetween the phases. Remove the solvent by evaporation with a gen-tle stream of nitrogen or filtered air and heat at not greater than70°C. All of the volatile solvents must be removed! Add 50 µl ofdimethylformamide and 50 µl of N,N-dimethylformamide di-n-propylacetal. Reflux the mixture for 30 sec over an open flame (see Dis-cussion of the Experimental Procedure). Allow the mixture to coolto room temperature and then add 1 ml of 0.5 N H2SO4. Vortex mixfor about 10 sec. Add 3 ml of a solvent system consisting of tolu-ene:heptane:isoamyl alcohol in a volume ratio of 70:20:10. Vortexfor 30 sec and then centrifuge. Remove the upper organic phase byaspiration. Neutralize the aqueous acid phase by adding 1 ml of0.5 N NaOH and 1 ml of the K2HPO4 buffer. Vortex mix and check thatthe pH is between 9 and 10. If it is not, adjust by adding a fewdrops of 0.5 N NaOH or 0.5 N H2SO4, as appropriate. Immediatelyextract the cocaine and benzoylecgonine n-propyl ester from thebasic aqueous solution by adding 3 ml of the toluene:heptane:iso-amyl alcohol (70:20:10) solvent, vortex for 30 sec, and centrifuge.Transfer by means of a disposable Pasteur pipette the upper organiclayer to a silylated, 12-ml concentrator tube having a conical ornipple-shaped bottom. Remove the solvent by evaporation under agentle stream of nitrogen or filtered air and at a temperature notgreater than 70°C. Reconstitute the extract residue in 30 µl ofchloroform for GC/MS analysis.
GC/MS Analysis
The experimental conditions for the GC/MS analysis of cocaine andbenzoylecgonine n-propyl ester are as follows:
100
GC column:
Carrier gas:
Reagent gas:
Temperatures
1.8 m x 2mm (I.D.) glass column packed with3 percent OV-1 on Gas Chrom Q 100/120 mesh(Applied Science Laboratory, ‘State College,PA 16801)
Methane, 15-20 ml/min
Ammonia, introduced into the ion chamber asdescribed in Chapter 2
Injector, 280°CColumn, 230°CGC/MS transfer line, 280°CIon source, 160°C
Under these conditions the cocaine should elute from the gas chroma-tograph at between 2 and 4 min, and the benzoylecgonine n-propylester should elute at between 3 and 5 min.
Before beginning the GC/MS analysis of samples, the performance ofthe total GC/MS system should be evaluated and optimized as des-cribed in Chapter 2. The ions to be monitored are the protonatedmolecule ions for cocaine (m/z 304), cocaine-2H3 (m/z 307), ben-zoylecgonine n-propyl ester (m/z 332), and benzoylecgonine-2H3 n-propyl ester (m/z 335). With the divert valve in the divert posi-tion, inject into the GC/MS 2 to 6 µl of the organic extract fromeither procedure 1 or 2. After approximately 1 min switch the di-vert valve so that the entire carrier gas flow enters the ion sourceof the mass spectrometer and begin data acquisition. If the extractfrom procedure 1 is being analyzed, only the cocaine ion masses (m/z304 and 307) are monitored. For analysis of extracts from procedure2 the best sensitivity is achieved by first monitoring only the co-caine ion masses until the cocaine has eluted; then the benzoylec-gonine n-propyl ester ion masses are monitored. If the GC/MS datasystem does not permit rapid changes of the monitored ion masses, allfour ion masses must be monitored during the elution of the drugand the derivatized metabolite. Normally, the latter procedure willresult in only a small sacrifice in sensitivity. When the benzoyl-ecgonine n-propyl ester has eluted, cease data acquisition and re-turn the divert valve to the divert position. The quantities of co-caine and benzoylecgonine in the body fluid are determined by mea-suring the peak heights (or areas) of the drug, the derivatized meta-bolite, and their internal standards in the selected ion current pro-files, and relating the ratios of peak heights to calibration graphs(Chapter 2). Calculate the body fluid concentrations of cocaine andbenzoylecgonine by dividing the measured quantities of these com-pounds by the exact volume of body fluid extracted.
Discussion of the Experimental Procedure
Benzoylecgonine must be converted to a volatile derivative before itcan be gas chromatographed. Various methods of derivatization havebeen used, including methylation to cocaine (36,37,41), propylationby treatment with 1-iodopropane (42), alkylation with pentafluoro-
101
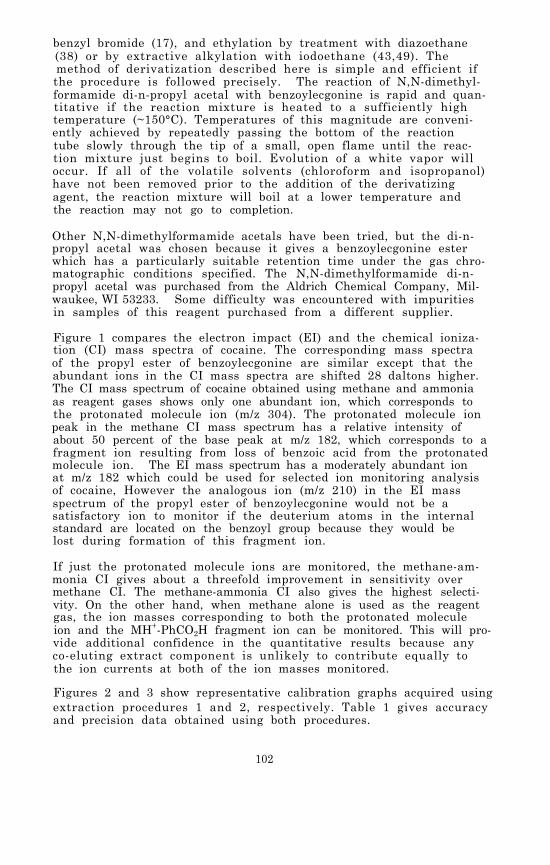
benzyl bromide (17), and ethylation by treatment with diazoethane(38) or by extractive alkylation with iodoethane (43,49). Themethod of derivatization described here is simple and efficient ifthe procedure is followed precisely. The reaction of N,N-dimethyl-formamide di-n-propyl acetal with benzoylecgonine is rapid and quan-titative if the reaction mixture is heated to a sufficiently hightemperature (~150°C). Temperatures of this magnitude are conveni-ently achieved by repeatedly passing the bottom of the reactiontube slowly through the tip of a small, open flame until the reac-tion mixture just begins to boil. Evolution of a white vapor willoccur. If all of the volatile solvents (chloroform and isopropanol)have not been removed prior to the addition of the derivatizingagent, the reaction mixture will boil at a lower temperature andthe reaction may not go to completion.
Other N,N-dimethylformamide acetals have been tried, but the di-n-propyl acetal was chosen because it gives a benzoylecgonine esterwhich has a particularly suitable retention time under the gas chro-matographic conditions specified. The N,N-dimethylformamide di-n-propyl acetal was purchased from the Aldrich Chemical Company, Mil-waukee, WI 53233. Some difficulty was encountered with impuritiesin samples of this reagent purchased from a different supplier.
Figure 1 compares the electron impact (EI) and the chemical ioniza-tion (CI) mass spectra of cocaine. The corresponding mass spectraof the propyl ester of benzoylecgonine are similar except that theabundant ions in the CI mass spectra are shifted 28 daltons higher.The CI mass spectrum of cocaine obtained using methane and ammoniaas reagent gases shows only one abundant ion, which corresponds tothe protonated molecule ion (m/z 304). The protonated molecule ionpeak in the methane CI mass spectrum has a relative intensity ofabout 50 percent of the base peak at m/z 182, which corresponds to afragment ion resulting from loss of benzoic acid from the protonatedmolecule ion. The EI mass spectrum has a moderately abundant ionat m/z 182 which could be used for selected ion monitoring analysisof cocaine, However the analogous ion (m/z 210) in the EI massspectrum of the propyl ester of benzoylecgonine would not be asatisfactory ion to monitor if the deuterium atoms in the internalstandard are located on the benzoyl group because they would belost during formation of this fragment ion.
If just the protonated molecule ions are monitored, the methane-am-monia CI gives about a threefold improvement in sensitivity overmethane CI. The methane-ammonia CI also gives the highest selecti-vity. On the other hand, when methane alone is used as the reagentgas, the ion masses corresponding to both the protonated moleculeion and the MH+-PhCO2H fragment ion can be monitored. This will pro-vide additional confidence in the quantitative results because anyco-eluting extract component is unlikely to contribute equally tothe ion currents at both of the ion masses monitored.
Figures 2 and 3 show representative calibration graphs acquired usingextraction procedures 1 and 2, respectively. Table 1 gives accuracyand precision data obtained using both procedures.
102
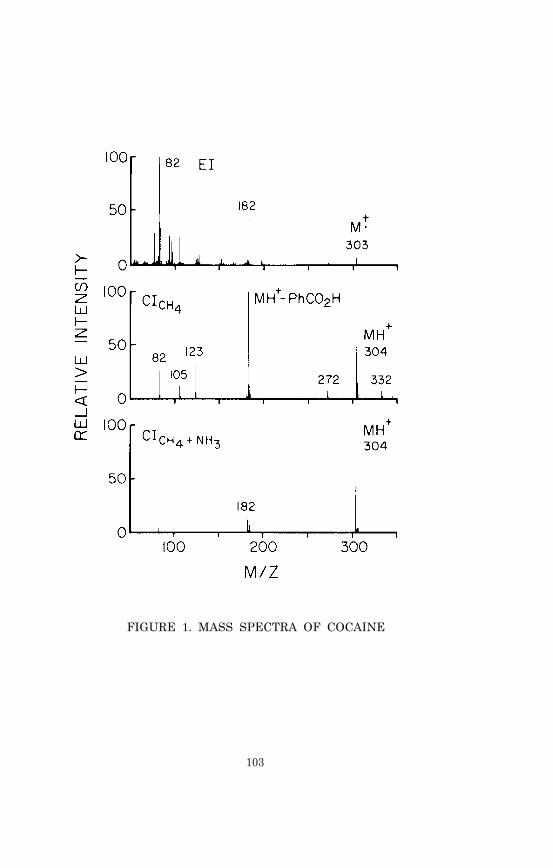
FIGURE 1. MASS SPECTRA OF COCAINE
103
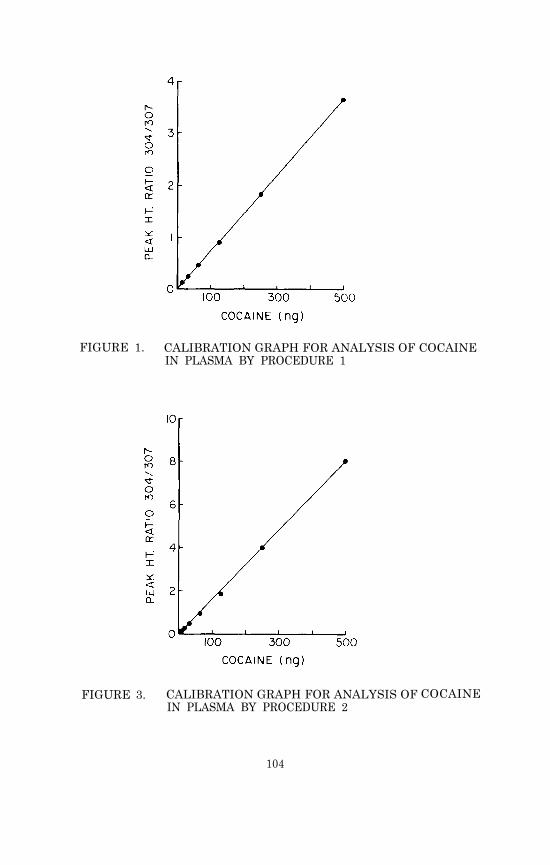
FIGURE 1. CALIBRATION GRAPH FOR ANALYSIS OF COCAINEIN PLASMA BY PROCEDURE 1
FIGURE 3. CALIBRATION GRAPH FOR ANALYSIS OFIN PLASMA BY PROCEDURE 2
COCAINE
104

TABLE 1. ACCURACY AND PRECISION DATA
Body fluid concentrations of cocaine and benzoylecgonine sometimesexceed 1 µg/ml. When this occurs the sample should be diluted bya measured amount with distilled water so that the resulting concen-tration falls within the range of 0 to 1000 ng/ml. The dilutedsample can then be analyzed as described.
Cocaine, and to a lesser extent benzoylecgonine, can undergo enzyma-tic and/or chemical hydrolysis (54). The rate of chemical hydrolysisis greatly accelerated at alkaline pH. For example, at pH 9.8, 40percent of the cocaine in a 3 µM solution was converted to benzoyl-ecgonine in 1 hr at 37°C (54). Also, benzoylecgonine in methanolcan undergo reestcrification to cocaine, particularly if acid ispresent. For these reasons, all body fluid samples to be analyzedfor cocaine should be stabilized with sodium fluoride and stored ina frozen state. Aqueous solutions of cocaine and benzoylecgonineand methanolic solutions of benzoylecgonine should be stored underrefrigeration and for no longer than a few days.
105
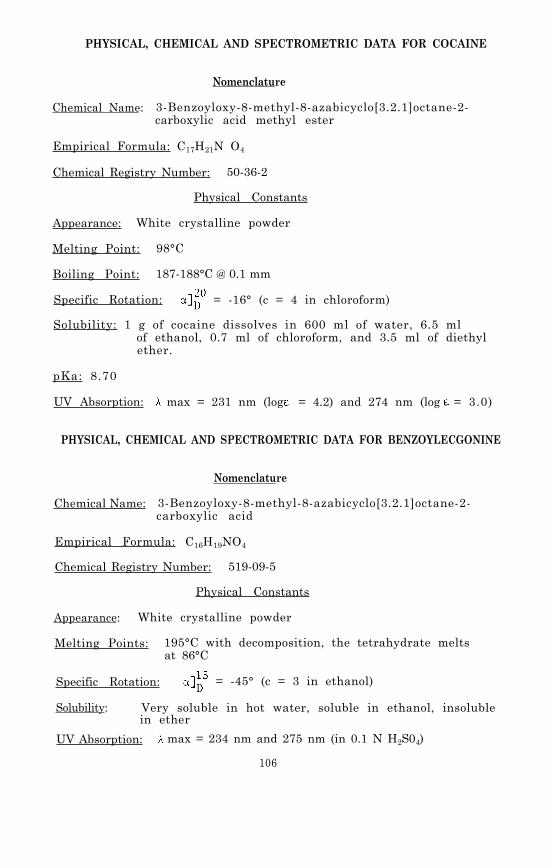
PHYSICAL, CHEMICAL AND SPECTROMETRIC DATA FOR COCAINE
Nomenclature
Chemical Name: 3-Benzoyloxy-8-methyl-8-azabicyclo[3.2.1]octane-2-carboxylic acid methyl ester
Empirical Formula: C17H21N O4
Chemical Registry Number: 50-36-2
Physical Constants
Appearance: White crystalline powder
Melting Point: 98°C
Boiling Point: 187-188°C @ 0.1 mm
Specific Rotation: = -16° (c = 4 in chloroform)
Solubility: 1 g of cocaine dissolves in 600 ml of water, 6.5 mlof ethanol, 0.7 ml of chloroform, and 3.5 ml of diethylether.
pKa: 8.70
UV Absorption: max = 231 nm (log = 4.2) and 274 nm (log = 3.0)
PHYSICAL, CHEMICAL AND SPECTROMETRIC DATA FOR BENZOYLECGONINE
Nomenclature
Chemical Name: 3-Benzoyloxy-8-methyl-8-azabicyclo[3.2.1]octane-2-carboxylic acid
Empirical Formula: C16H19NO4
Chemical Registry Number: 519-09-5
Physical Constants
Appearance: White crystalline powder
Melting Points: 195°C with decomposition, the tetrahydrate meltsat 86°C
Specific Rotation: = -45° (c = 3 in ethanol)
Solubility: Very soluble in hot water, soluble in ethanol, insolublein ether
UV Absorption: max = 234 nm and 275 nm (in 0.1 N H2S04)
106

REFERENCES
1.
2.
3.
4.
5.
6.
7.
8.
9.
10.
11.
12.
13.
14.
15.
16.
17.
R.C. Petersen and R.C. Stillman, eds., Cocaine: 1977. Na-tional Institute on Drug Abuse Research Monograph 13, DHEWPub. (ADM) 77-432. Supt. of Docs., U.S. Govt. Print. Off.,Washington, D.C. (May 1977).
S. Cohen. J. Amer. Med. Assoc., 231, 74 (1975).
G.R. Gay, C.W. Sheppard, D.S. Inaba, and J.A. Newmeyer. Int.J. Addictions, 8, 1027 (1973).
T. Harwood. Drug Enforcement, 1, 20 (Spring 1974).
R.B. Resnick, R.S. Kestenbaum, and L.K. Schwartz. Science,195, 696 (1977).
D. Taylor, V.S. Estevez, L.F. Englert, and B.T. Ho. Res.Commun. Chem. Pathol. Pharmacol., 14, 249 (1976).
E.G. Leighty and A.F. Fentiman, Jr. Res. Commun. Chem. Pathol.Pharmacol., 8, 65 (1974).
R.L. Hawks, I.J. Kopin, R.W. Colburn, and N.B. Thoa. LifeSciences, 15, 2189 (1974).
T. Inaba, D.J. Stewart,23, 547 (1978).
A.L. Misra, P.K. Nayak,Mulé. Experientia, 30,
P.K. Nayak, A.L. Misra,Ther., 196, 556 (1976).
A.L. Misra, M.N. Patel,
and W. Kalow. Clin. Pharmacol. Ther.,
M.N. Patel, N.L. Vadlamani, and S.J.1312 (1974).
and S.J. Mulé. J. Pharmacol. Exp.
V.R. Alluri, S.J. Mulé, and P.K. Na-yak. Xenobiotica, 6, 537 (1976).
A.L. Misra in S.J. Mulé, ed., Cocaine: Chemical, Biological,Clinical, Social, and Treatment Aspects. CRC Press, Cleve-land, OH, p. 73 (1976).
R. Byck and C. Van Dyke in R.C. Petersen and R.C. Stillman,eds., Cocaine: 1977, ch. V. See reference 1.
C.Van Dyke, R. Byck, P.G. Barash, and P. Jatlow. Clin.Chem:, 23, 241 (1977).
H.E. Hamilton, J.E. Wallace, E.L. Shimek, Jr., P.Land, S.C.Harris, and J.G. Christensen. J. Forensic Sci., 22, 697(1977) .
M.J. Kogan, K.G. Verebey, A.C. DePace, R.B. Resnick, and S.J. Mulé. Anal. Chem., 49, 1965 (1977).
107

18. R. Byck, P. Jatlow, P. Barash, and C. Van Dyke. Psychophar-macol. Bull., 12, 47 (1976).
19.
20.
21.
22.
23.
24.
25.
26.
27.
28.
29.
30.
31.
32.
33.
34.
35.
36.
37.
C. Van Dyke, P. Barash, P. Jatlow, and R. Byck. Science,191, 859 (1976).
B.S. Finkle and K.L. McCloskey in R.C. Petersen and R.C. Still-man, eds., Cocaine: 1977, ch. VIII. See reference 1.
P.I. Jatlow and D.N. Bailey. Clin. Chem., 21, 946 (1975).
J.I. Javaid, H. Dekirmenjian, J.M. Davis, and C.R. SchusterJ. Chromatogr., 152, 105 (1978).
H. Bronisz, B. Wysocka, and W. Rusiecki. Disserationes Pharm.,15, 343 (1963).
L.A. Woods, J. Cochin, E.J. Fornefeld, F.G. McMahon, and M.H.Seevers. J. Pharmacol. Exp. Ther., 101, 188 (1951).
L.A. Woods, F.G. McMahon, and M.H. Seevers. J. Pharmacol.Exp. Ther., 101, 200 (1951).
S.J. Mulé. J. Chromatogr., 55, 255 (1971).
N.N. Valanju, M.M. Baden, S.N. Valanju, D. Mulligan, and S.K.Verma. J. Chromatogr., 81, 170 (1973).
M.L. Bastos, D. Jukofsky, and S.J. Mulé. J. Chromatogr., 89,335 (1974).
J.E. Wallace, H.E. Hamilton, H. Schwertner, D.E. King, J.L.McNay, and K. Blum. J. Chromatogr., 114, 433 (1975).
K.K. Kaistha and R. Tadrus. J. Chromatogr., 135, 385 (1977).
Syva Corp. Palo Alto, CA 94304.
Roche Diagnostics. Nutley, NJ 07110.
S.J. Mulé, D. Jukofsky, M. Kogan, A. DePace, and K. Verebey.Clin. Chem., 23, 796 (1977).
J.M. Moore. Clin. Chem., 21, 1538 (1975).
M.L. Bastos and D.B. Hoffman in S.J. Mulé, ed., Cocaine:Chemical, Biological, Clinical, Social, and Treament As-pects, p. 35. See reference 13.
F. Fish and W.D.C. Wilson. J. Chromatogr., 40, 164 (1969).
F. Fish and W.D.C. Wilson. J. Pharm. Pharmacol., 21 135S(1969).
108
39.
40.
38. S. Koontz, D. Besemer, N. Mackey, and R. Phillips. J. Chro-matogr., 85, 75 (1973).
R.H. Hammer, J.L. Templeton, and H.L. Panzik. J. Pharm. Sci.,63, 1963 (1974).
F. Medzihradsky and P.J. Dahlstrom. Pharmacol. Res. Commun.,7, 55 (1975).
41.
42.
43.
44.
45.
46.
47.
48.
49.
50.
51.
52.
53.
54.
55.
56.
J.E. Wallace, H.E. Hamilton, D.E. King, D.J. Bason, H.A.Schwertner, and S.C. Harris. Anal. Chem., 48, 34 (1976).
D.L. von Minden and N.A. D'Amato. Anal. Chem., 49, 1974 (1977).
J.C. Valentour, V. Aggarwal, M.P. McGee, and S.W. Goza.J. Anal. Toxicol., 2, 134 (1978).
B.H. Dvorchik, S.H. Miller, and W.P. Graham. J. Chromatogr.,135, 141 (1977).
J.W. Blake, R.S. Ray, J.S. Noonan, and P.W. Murdick. Anal.Chem., 46, 288 (1974).
J.I. Javaid, H. Dekirmenjian, E.G. Brunngraber, and J.M.Davis. J. Chromatogr., 110, 141 (1975).
P.I. Jatlow, C. Van Dyke, P. Bar-ash, and R. Byck. J. Chro-matogr., 152, 115 (1978).
S.P. Jindal, T. Lutz, and P. Vestergaard. Biomed. MassSpectr., 5, 658 (1978).
S.P. Jindal and P. Vestergaard. J. Pharm. Sci., 67, 811 (1978).
J.E. Graas and E. Watson. J. Anal. Toxicol., 2, 80 (1978).
A.P. Graffeo, D.C.K. Lin, and R.L. Foltz. J. Chromatogr.,126, 717 (1976).
S.J. Mulé, M.L. Bastos, D. Jukofsky, and E. Saffer. J. Chro-matogr., 63, 289 (1971).
S.J. Mulé, ed., Cocaine: Chemical, Biological, Clinical,Social, and Treatment Aspects. See reference 13.
D.M. Chinn, D.J. Crouch, M.A. Peat, B.S. Finkle, and T.A.Jennison. J. Anal. Toxicol., 4, 37 (1980).
D.J. Stewart, T. Inaba, B.K. Tang and W. Kalow. Life Sciences,20, 1557 (1977).
P. Jatlow in S.J. Mul, ed., Cocaine: Chemical, Biological,Clinical, Social, and Treatment Aspects, p. 61. See refer-ence 13.
109

Chapter 8
Morphine
Archaeological and historical evidence indicates that opium hasbeen used as an analgesic since at least the third century B.C.and probably as long ago as the late Bronze Age in Europe. Mor-phine, a pentacyclic alkaloid and the chief active component ofopium, was isolated in 1805 by a German pharmacist, although thecorrect chemical structure (I) was first proposed in 1923. Totalsynthesis was achieved in 1952 (1). In addition to analgesia, mor-phine causes side effects such as constipation, lethargy and nau-sea, and a great many derivatives have been synthesized in effortsto alter or antagonize some of morphine’s pharmacological effects (2).
Heroin (3,6-diacetylmorphine, II) was introduced in 1898. It wasa more effective analgesic than morphine, but it soon became ap-parent that heroin was more toxic and produced physical dependenceand tolerance more rapidly than morphine. Heroin abuse increasedin the period between the World Wars (1920 to 1935) and again after1968. By 1974 the U.S. Bureau of Narcotics estimated that therewere over 400,000 heroin addicts in the United States (1). Inspite of voluminous published data reflecting thousands of animaland human experiments over the past 40 years, the mechanism ofheroin and morphine dependence is still not understood.
Codeine (III), a widely used methyl ether of morphine, has milderanalgesic and respiratory depressant effects, and is an effectivecough suppressant. It is demethylated in vivo and as much as 17percent of a given dose may appear in the urine as morphine (3).
The tertiary amino group accounts for the basic properties of themorphine molecule. Natural morphine and its salts are stronglylevorotary. The d-isomer has been synthesized but has no signifi-cant pharmacological activity (1).
110

PHARMACOKINETICS AND METABOLISM
Because of the comparative absence of cardiovascular effects, mor-phine has been revived as a major adjunct to anesthesia, stimulat-ing kinetic studies in human subjects (4). The maximum pharmaco-logical effect of morphine occurs within minutes after intravenousinjection, corresponding to the maximum measured concentration ofthe free drug in plasma (5) . The clearance of morphine from bloodis rapid, with about 80 percent of an administered dose excretedin urine within 8 hr although traces can be detected 72-100 hrafter administration, especially in addicts. The long retentiontime is usually attributed to protein binding, but there is alsothe likelihood of reabsorption of morphine from the intestinalmucosa after hydrolysis of conjugates transported from the liverin the bile (1). After intravenous injection, a plasma half-lifeof 2 to 3 hr and a clearance time of 10 to 44 hr have been deter-mined by radioimmunoassay (RIA), but the RIA technique does notdistinguish between the free and conjugated forms of the drug(4,5). Following intravenous administration of 10-mg doses toadult volunteers, the serum concentration of morphine ranged from0.04 to 0.10 µg/ml after 2 hr and fell to 0.002 to 0.007 µg/mlafter 12 hr (5). Morphine is rapidly absorbed after intramuscularor subcutaneous injection with a maximum pharmacological effect 60to 90 min after administration, again corresponding to the highestplasma drug concentrations (6).
Probably because of its high pKa (9.85), morphine is poorly absorbedfrom the stomach. The maximum plasma concentration of free morphineafter oral administration in comparison experiments was less than20 percent of that obtained by intravenous administration of thesame dose. Furthermore, the concentration of conjugated drug inserum 1 hr after oral administration was 16 times higher than thefree morphine concentration, suggesting a high hepatic extractionratio (5). In cases of drug overdose, the minimum lethal concentra-tion of morphine has been reported as 0.2 µg/ml in blood or 0.2-0.4 µg/g in muscle. For addicts, the figures are higher. In onecase, an addict who had died of other causes had a blood morphineconcentration of 2.8 µg/ml (7). Urine concentrations show no cor-relation with lethality (7). It has been suggested, but is unsub-stantiated, that in some acute deaths from heroin overdose, toxicadulterants such as quinine may be primary agents in the lethalreaction (8). Acute respiratory depression has also been suggestedas a likely mechanism of heroin overdose deaths, especially incases where the drug is present in combination with other CNS depres-sants such as alcohol (9).
Morphine possesses no functional groups which readily undergo hy-drolysis. Heroin, however, is rapidly hydrolyzed. Less polar thanmorphine, it has high lipid and membrane solubility which couldaccount for rapid absorption and passage through the blood-brainbarrier. The major pharmacologic effects of heroin, however, aredue to 6-monoacetyl-morphine (6-MAM) and morphine; the half-life ofheroin itself in blood is less than 20 min, and the principal pro-duct clearing the blood is 6-MAM. Its presence in plasma can beconsidered presumptive evidence for heroin use (10). Because 6-MAM
111
is converted to morphine in the liver, the analysis of human urineafter heroin administration yields primarily morphine in the sameratio of free to conjugated form as that seen after parenteral admin-istration of morphine, i.e., about 1.9 (1). However, the presenceof 6-MAM and its 3-glucuronide in human urine has been reportedfollowing intravenous heroin administration, in amounts represent-ing less than 5 percent of the dose (11). In a study of heroinkinetics in man, the urinary excretion half-life of free morphinewas found to be 1.3 hr; of 6-MAM, 1.3 hr; of conjugates, 2.8 hr;and of total normorphine, 2.7 hr (12).
The metabolism of morphine in man is summarized in Table 1. Syn-thetic reactions are responsible for detoxification by convertingmorphine or its metabolites, including normorphine, to readilyexcreted water-soluble compounds such as 3- and 6-glucuronides and3-sulfate, by means of microsomal enzyme systems in liver, brain,kidney, and intestine. Quantitatively minor synthetic reactionsinclude methylation of normorphine and 3-0-methylation of mor-phine to codeine (1). The 0-methyl transferase activity which pro-duces codeine increases in addicts, a fact which suggests alteredmetabolism in prolonged opiate use and a possible marker for abuse(13). Norcodeine, a major metabolite of codeine in man, has alsobeen identified in the urine of some heroin addicts, in quantitiesproportional to the formation of codeine from morphine (14).
The maximal reported recovery of morphine and biotransformationproducts is less than 85 percent of the dose, with excretion linear-ly related to urine output (15). Although small amounts of morphineand metabolites are eliminated in feces and saliva, the metabolicfate of 15 to 20 percent of administered drug remains unknown.
ANALYTICAL METHODOLOGY
Thin-layer chromatography (TLC) has been the most commonly employedmethod for qualitative (screening) detection of morphine; it is ra-pid, sensitive, and economical. Technical improvements in solventsystems, plates, sheets, and sprays have appeared regularly in therecent literature (16,17). For example, picogram quantities ofmorphine in urine or brain homogenates were detected on polyamideplates by prior treatment of the n-butanol extracts with dansylchloride to fonn a highly fluorescent morphine derivative which couldbe visualized on the dried plates under ultraviolet light (18).
Spectrofluorometric methods are based on the conversion of morphineto a fluorophore, excitation and measurement of emission at specificwavelengths. Most methods employ the oxidation of morphine to pseu-domorphine by potassium ferricyanide in weakly alkaline solution,and achieve detection levels as low as 0.1 µg/ml (19) . Fluorescencecan also be achieved without potassium ferricyanide by treating theextract (chloroform: isopropanol, 3:1) with concentrated H2SO4, thenconcentrated NH40H, and autoclaving for 15 min at 120°C. The latterprocedure can be automated for application to large numbers of sam-ples with detection levels of 0.2 µg/ml (20). As little as 10 ngof morphine in plasma was detected in a modified method which pre-cipitated plasma proteins before extraction, used only siliconized
112

glassware, and decreased the reaction volume to 40 µ1 in order toincrease sensitivity. Readings were made on a filter fluorometer(21). Because the decay of pseudomorphine fluorescence is rapid,fluorometry has largely been limited to qualitative use. However,coupling the photofluorimeter to a computer system, which readsreaction kinetics within 3 milliseconds of mixing, has shown pro-mise as a quantitative technique (22).
A quantitative spectrofluorometric method, using high performanceliquid chromatography of the oxidized urine extract with an inter-nal standard of dihydromorphine, has been developed (23). The mix-ture of hydrolyzed urine and dihydromorphine was extracted withchloroform: isopropanol (9:1) and mixed with potassium ferricyanideimmediately before injection onto a porous silica column coupledto a fluorimeter set at ex 320 nm and em 436 nm. The solventsystem contained methanol: 2 N NH4OH:1 N NH4NO3 (30: 20:10). Therewas a linear relationship between the amount of morphine in theoriginal solution and the ratio of the emission peak height of themixed dimer (pseudomorphine + pseudodihydromorphine) formed duringoxidation to that of the fluorescent dihydromorphine standard. Thisallowed calibration suitable for quantitative analysis with a sen-sitivity of 0.01 µg/ml. The technique has the advantage of beinghighly specific for morphine. Interference by other drugs, parti-cularly normorphine, N-allyl normorphine, dihydromorphine, and 6-monoacetyl morphine is a potential problem in other fluorometricprocedures because of emission spectra identical to pseudomorphine.In these instances fluorometry must be combined with a chromatogra-phic separation (19).
Immunoassays developed for morphine include the free radical assaytechnique (FRAT) which employs spin labeling with nitroxide-labeleddrugs and is sensitive to 0.5 µg/ml of morphine; the enzyme multi-plied immunoassay technique (EMIT) in which morphine is conjugatedto lysozyme and the combination of the labeled drug with antibodiesto morphine renders the enzyme inactive; radioimmunoassay (RIA);and hemagglutination inhibition (HI) in which the presence of mor-phine in test material prevents agglutination of morphine-coatedred blood cells by an antimorphine antibody. A major advantage ofimmunoassays is that biofluids can be tested directly, without sam-ple extraction or concentration. They can also be extremely sensi-tive, detecting as little as 0.03 µg/ml morphine (RIA and HI), andfast (2 to 4 min for EMIT and FRAT) (17). However, immunoassaysare subject to cross-reactivity with drugs of similar molecularstructure. Morphine antibodies have been shown to react with co-deine, dextromethorphan, pethidine, dihydromorphinone, propoxyphene,diamorphine, and 6-MAM (24,25). Attempts to reduce cross- reactionshave produced antiserums raised against various haptens: an anti-serum to a conjugate of 6-succinyl morphine with bovine serum album-in reacted only slightly with morphine glucuronide and was used tomeasure free morphine in serum of patients receiving oral doses,at a detection level of 0.3 ng/ml (24). Other haptens tried haveincluded morphine-3-glucuronide and oxymorphone-6-carboxy-methoxime(26). Haptens are usually attached to the carrier at one of thecarbon atoms of morphine, but an antiserum capable of distinguish-ing morphine from codeine was obtained by conjugating carrier pro-
113

tein to the nitrogen atom of nomorphine. The antibody produceddid not react with codeine or with the 3-0-monoglucuronide of mor-phine, and detected 15 pg of morphine in the presence of codeine(27). An antiserum specific for codeine has also been reported,prepared from a conjugate using N-butyroylnorcodeine as hapten (28).While immunoassays, especially RIA, can be adapted to quantitativestudies by preparation of calibration graphs, the lack of absolutespecificity remains a problem. Nevertheless, a solid-phase RIA,which involves the absorption of antibody to polymeric surfaces,has been adapted for morphine assay using an antibody to morphine-6-hemisuccinate purified by affinity chromatography. The assay isreported to respond to as little as 0.5 ng of morphine per ml ofserum (29).
Gas chromatography (GC) can be used for screening biofluids, butbecause of the relatively long time required to complete a GC analy-sis, it is more often used for confirmation of TLC or immunoassayresults, and for quantitative studies in pharmacokinetics and meta-bolism. GC systems equipped with flame ionization detectors (GC-FID) are sensitive enough to detect 15 ng of morphine/ml. Conver-sion of the morphine extracted from bile, urine, blood, or liver tothe less polar diacetyl derivative (heroin) can increase sensitivityof GC-FID to 1 ng (17). The polarity of morphine, which causesadsorption in the GC column, can also be altered by silylation. Aderivatization procedure using bis-(trimethylsilyl)trifluoroaceta-mide (BSTFA) plus 1 percent trimethylchlorosilane as both solventand silylating agent is reported to give 100 percent conversion ofmorphine to its bis-(trimethylsilyl) ether within 20 min at roomtemperature (30). Bis-(0-trimethylsilyl) morphine can also be formedquantitatively and reproducibly by simultaneous injection of trime-thylsilylimidazole and the drug solution onto the gas chromatographiccolumn (31).
A quantitative GC method developed for heroin and 6-monoacetyl mor-phine in plasma utilized an alkali-flame detector (nitrogen/phos-phorus detector). Plasma samples at pH 9.0 containing ethylmor-phine as internal standard were extracted with benzene, and thedried extracts were chromatographed as their acetylated derivativesafter treatment with trifluoroacetic anhydride-benzene (1:5). Thealkali-flame detector permitted quantitation of drug concentrationsas low as 100 ng/ml, with detection of 20 ng/ml. Extraction wasdone quickly after venipuncture to avoid in vitro enzymatic hydro-lysis of the compounds (32).
Electron-capture detection (GC-ECD) has been used to quantitatemorphine after conversion to halogen-containing derivatives (33-37).In one procedure nalorphine was added as an internal standard, andthe morphine and nalorphine were trifluoroacetylated following extrac-tion from 1-2 ml of serum or plasma with 10 percent isobutanol inchloroform, back extraction with 0.5 N HCl, and reextraction with10 percent isopropanol in ethyl acetate. With a 63Ni detector asensitivity limit of 25 ng/ml in serum was reported (33). A refine-ment of the ECD technique, using a 3H-ECD, detected 0.5 ng/ml mor-phine in plasma extracts and 0.1 ng morphine in 30 mg of brain tis-sue from rats. The samples were extracted with toluene:butanol
114

(9:1) at pH 8.9, back extracted into 0.1 N H2SO4, and reextractedwith toluene:butanol. Morphine and the internal standard (nalor-phine) were derivatized with pentafluoropropionic anhydride (34).Both morphine and codeine have been quantitated by derivatizationwith pentafluoropropionic anhydride and analysis by GC-ECD usinga 63Ni detector. Detection limits were 2 pg for morphine and 20 pgfor codeine in test solutions (35).
A GC-ECD method which can assay as little as 0.1 ng/ml of morphinein human urine has been reported (36). Morphine was converted toits heptafluorobutyryl derivative for GC separation on 3 percentOV-17 after extraction with ethyl acetate of 2 ml of alkalinizedurine. Codeine was used as an internal standard. The sensitivitylimit reported for this procedure was 100 pg morphine/ml of urine.Fluorinated derivatives were also prepared for GC-ECD quantitationstudies of morphine, codeine, and 6-MAM present as contaminants ini l l ic i t heroin (37) . Heptafluorobutyric anhydride (HFBA) yieldedsuitable derivatives within a 5-min reaction time, and the deriva-tives were extracted from an acetonitrile-sodium bicarbonate solu-tion into petroleum ether before chromatography on 3 percent OV-17on Gas Chrom Q. Morphine, codeine, and 6-MAM in heroin were readilymeasured at levels as low as 0.001, 0.01, 0.01 percent, respectively.The minimum detectable quantity for each compound was ~20 pg formorphine, 80 pg for codeine, and 100 pg for 6-MAM. However, whenprocaine was present as an adulterant, it was highly reactive withHFBA and caused significant interference with the chromatogramsof the heptafluorobutyryl derivatives.
GC coupled with mass spectrometry (GC/MS) offers the best methodavailable for the unequivocal identification of morphine and itsmetabolites in biological materials. It can serve as a check onresults of less sensitive and specific assays, as well as beinga tool for positive confirmation of structures. The technique ofselected ion monitoring has been applied to quantitation of mor-phine and related compounds in a variety of body fluids (10,38-43).
Morphine was measured in urine at concentrations as low as 5 ng/mlusing GC/MS with chemical ionization (42). Morphine labeled withthree deuterium atoms on the N-methyl group served as the internalstandard. After adjustment of the urine to pH 8.5 it was extractedwith chloroform: isopropanol (4:1) and the extract was treated withbis-(trimethylsilyl) acetamide. The resulting bis-(trimethylsilyl)morphine was separated and measured by chromatography on a 3 per-cent OV-17 column maintained at 230°C; monitored ions correspondedto two prominent fragment ions [(M-CH3)
+ and MH+-HOSi(CH3)3] inthe methane chemical ionization mass spectra of the derivatizeddrug and the deuterated internal standard.
Morphine and codeine were measured simultaneously in blood by aGC/MS procedure involving addition of a deuterated internal stan-dard to the blood, acid hydrolysis of conjugates, a series of ex-tractions to separate the bases from other components of the ex-tract, derivatization with trifluoroacetic anhydride, and measure-ment of the bis-(trifluoroacetyl) morphine and mono-(trifluoro-acetyl) codeine using gas chromatography (3 percent OV-17, 230°C)and electron impact mass spectrometry (43). The assay was applied
115

to the analysis of 916 blood samples from individuals arrested forsuspicion of opiate intoxication. The average concentration ofmorphine was 0.29 µg/ml. For most samples the codeine concentra-tion was approximately 5 to 10 percent of the morphine concentra-tion. The lower limit for acceptable quantitative measurement wasconsidered to be 20 ng/ml.
In an application of GC/MS to a study of the relationship betweenbrain levels of morphine and analgesia in rats, the internal stan-dard was again trideuterated morphine and the drug was chromato-graphed as its trifluoroacetyl derivative (40). Sensitivity wassuch that the low concentrations of morphine present in brain fol-lowing therapeutic doses could be measured easily, with a lowerquantitation limit of 8 ng/g of tissue.
Free and bound morphine, as well as free 6-MAM have been quanti-tated in rabbit blood by GC/MS (10). Trideuterated morphine and6-MAM-2H3 were added to 0.2 ml plasma before precipitation of pro-teins by acetone. The supernatant was evaporated to dryness undernitrogen and the residue taken up in 2.5 ml of 0.1 N HCl and puri-fied by two extractions with benzene. The aqueous phase was ad-justed to pH 8.5, extracted with chloroform:isoamyl alcohol (3:1),and evaporated to dryness before derivatization with trifluoroace-tic anhydride. The derivatives were taken up in chloroform for GC/MS analysis on a 6 ft x 2 mm silanized column packed with 1 percentOV-1 on Gas Chrom Q, using helium as carrier gas and a column tem-perature of 230°C. With electron-impact ionization the highest ionintensities were associated with fragments at m/z 364 for the pro-tio compound and 367 for the deuterio compound. As an assay forfree and bound heroin metabolites, the method represented a 100-fold improvement over GC-FID methods for these compounds, with asensitivity of 1 ng/ml.
Extractive alkylation with pentafluorobenzyl (PFB) bromide, usingtetrabutylammonium (TBA) as counter ion and ethyl acetate as sol-vent, has been used to quantitate morphine in plasma at concentra-tions as low as 5 ng/ml (41). With this procedure morphine was ex-tracted from aqueous solutions with 98 percent efficiency. Alky-lation of the phenolic hydroxyl group occurred simultaneously. ThePFB derivative of morphine could then be analyzed directly by GC/MS. However, better results were obtained if the PFB morphine wasfurther derivatized by treatment with trifluoroacetic anhydride.The resulting PFB-TFA derivative was chromatographed on a 2 percentOV-17 column maintained at 245°C. Quantitation was achieved bymeasuring the ion currents at m/z 380 and 383, corresponding to prom-inent fragment ions in the electron impact mass spectra of the PFB-TFA-morphine and its trideuterated analog.
Morphine concentrations determined by spectrofluorometry in blood andbrain were approximately one-half those obtained by GC/MS (44). Thedifference may result from quenching interferences in the fluoromet-ric assay and the greater sensitivity of the GC/MS method. Hydroly-sis of blood samples increased the apparent concentration of morphineby about 260 percent, while the corresponding increase in brainsamples was only about 25 percent. Presumably, the increase iscaused by hydrolysis of the glucuronide conjugate of morphine.
116

Charge-exchange ionization using 10 percent nitric oxide in nitro-gen as reagent gas can offer an advantage over CI or EI ionizationfor the analysis of morphine and heroin in that the charge-exchangemass spectra of these compounds show less fragmentation (45). Fieldionization also causes little or no fragmentation of morphine-typemolecules and can be used to determine trace amounts of drugs inbiological media by isotope dilution analysis with multilabeleddiluents such as morphine-2H5 and codeine-2H8 (46,47).
Quantitation of total morphine in biological fluids requires hy-drolysis to free the drug from conjugates. Enzymatic hydrolysishas generally proven to be less efficient than acid hydrolysis ofmorphine glucuronides because of variations in potency among enzymepreparations. The most efficient enzymatic recovery found in acomparative study was 64 percent. Critical parameters includedchoice of buffer system, pH, temperature, and enzyme concentration.High-temperature (autoclaving or refluxing) acid hydrolysis doesnot require such critical control of conditions. The same studyreported a yield of 93 percent of available morphine when the con-jugate solution was autoclaved at 125°C for 30 min using 8-15 per-cent hydrochloric acid (48). However, hydrolysis conditions varywidely in the literature, and some authors have reported completehydrolysis of morphine-3-glucuronide in 30 min at 100°C by 4 NHCl (10).
Extraction procedures for morphine also vary, but because of itsphenolic hydroxyl and tertiary amine the optimum pH for extractionis 8.5-10 (49). Chloroform is most often used as the organic sol-vent, usually with the addition of isopropanol (7,15,23), n-butanol(19,21), or isoamyl alcohol (10) in a ratio of either 9:1 or 3:1.Recoveries of 60-70 percent have been reported for chloroform:isopropanol (3:1) (7). However, toluene:butanol (9:1) (34), ethylacetate:isobutanol (9:1) (50), ethyl acetate + 10 percent isopro-panol (40), benzene (32), ether (51), and 1,2-dichloroethane + 30percent isopropanol (12) are among other solvents reported. Amorphine recovery of 85-100 percent from urine has been claimedfor a system involving adsorption on a XAD-2 resin column and elu-tion with chloroform: isopropanol (17).
A study (52) of methods of recovering morphine from biological sam-ples prior to analysis resulted in the following conclusions: (1)acid hydrolysis of morphine conjugates is preferable to enzymatichydrolysis unless other acid-labile drugs are to be analyzed, (2)chloroform:isopropyl alcohol (4:1) is the extraction solvent ofchoice because it removes most of the morphine from the biologicalsample in a single extraction and it is readily volatile, (3) sodiumbicarbonate and ammonium carbonate are the preferred “salting out”agents, and (4) the ratio of biological sample to solvent should beabout 1:4.
A review of the analysis of morphine by gas phase methods, includingprocedures for extraction from urine and blood for various biomedi-cal applications and quantitation, was published in 1977 (53).
117

EXPERIMENTAL PROCEDURE
The experimental procedure involves a single extraction of a buf-fered and salt-saturated solution of the biological fluid with asolvent system consisting of toluene:heptane: isoamyl alcohol (70:20:10 v/v). ‘The extract is then concentrated and derivatized bytreatment with trifluoroacetic anhydride. Quantitation is achievedby selected ion monitoring using chemical ionization with methaneand ammonia as reagent gases.
Standards and Reagents
The morphine used in the development of this procedure was purchasedfrom Applied Science Laboratories, State College, PA 16801. Noimpurities were detected by either gas chromatography or mass spec-trometry. Morphine labeled with 3 deuterium atoms on the N-methylgroup (morphine-2H3) was prepared by a published procedure (54,55).Mass spectral analysis of the morphine-2H3 showed that 94 percentof the molecules contained 3 deuterium atoms, while 0.5 percentcontained no deuterium atoms. Gas chromatography indicated a chem-ical purity of greater than 99 percent.
Prepare a pH 9.6 buffer by dissolving 500 grams of potassium mono-hydrogen phosphate (K2HPO4) in about 500 ml of distilled water. Al-low the solution to cool to room temperature and then add sufficientdistilled water to make exactly one liter.
Stock solutions of morphine and morphine-2H3 used to determine cali-bration graphs and prepare working standards are prepared as follows.Weigh into a 100-ml volumetric flask about 10 mg of morphine andrecord its weight to the nearest 0.1 mg. Dissolve the measuredmorphine in about 75 ml of methanol and then add additional methanolto make exactly 100 ml of solution. In the following paragraphsthis solution will be referred to as the “0.10-mg/ml stock solution”although it should be labeled with its actual concentration basedon the exact measured weight of morphine. A series of standard solu-tions can be prepared by appropriate dilution of this stock solutionas described in Chapter 2.
The stock solution of morphine-2H3 is prepared in the same manner.For the measurement of morphine in body fluids within the concentra-tion range 1 to 500 ng/ml, addition of approximately 40 ng of theinternal standard to each ml of specimen is satisfactory. This canbe conveniently done by adding 100 µl of a 400-ng/ml morphine-2H3methanolic solution to each ml of specimen. Prepare the 400-ng/mlinternal standard solution by diluting 1 ml of the 0.10-mg/ml stocksolution of morphine-2H3 to 250 ml with methanol.
Store stock and standard solutions in well-stoppered or capped glassvessels in the dark at less than 0°C.
118
328-011 0 - 80 - 7

Extraction
Transfer 1 ml of the specimen (plasma, serum, whole blood, or urine)into a 5-ml glass stoppered, conical centrifuge tube. Add 100 µlof the 400-ng/ml morphine-2H3 internal standard solution and vor-tex for about 10 sec. Allow the sample to equilibrate for 15 min,and then add about 0.5 g of solid sodium chloride followed by 1 mlof the K2HPO4 buffer (pH 9.6). Vortex the mixture for about 10 sec.Add 1 ml of a solvent system consisting of toluene:heptane:isoamylalcohol in a volume ratio of 70:20:10. Stopper the tube and vor-tex mix for at least 30 sec. Separate the phases by centrifugationfor 10 min. Transfer most of the organic layer (top) to a 12-mlglass stoppered, conical centrifuge tube. Be careful not to trans-fer any of the aqueous (bottom) layer. Evaporate the organic ex-tract just to dryness by heating to 70°C under a stream of filteredair. Stopper the tube and store under refrigeration until shortlybefore the GC/MS analysis is ready to be performed. For derivati-zation, allow the tube to warm to room temperature and then add200 µl of chloroform plus 100 µl of trifluoroacetic anhydride.Cap the tube and heat at 70°C for 10 min. Allow the tube to coolat room temperature for 10 min and then evaporate to dryness byheating at 40°C under a gentle stream of dry nitrogen or dry air.The derivatized extract is subject to hydrolytic decomposition uponprolonged exposure to laboratory air, so it is important to recon-stitute the residue immediately in about 30 µl of chloroform andmake the injection into the GC/MS.
GC/MS Analysis
Recommended experimental conditions for the GC/MS analysis of thetrifluoroacetyl derivative of morphine are as follows:
GC column 1.8 m x 2 nun (I.D.) glass column packed with3 percent OV-17 on 100/120 mesh Gas Chrom Q(Applied Science Laboratory, State College,PA 16801)
Carrier gas: Methane, 15-20 ml/min
Reagent gas: Ammonia, introduced into the ion chamber asdescribed. in Chapter 2.
Temperatures: Injector, 270°CColumn, 225°C isothermalGC/MS transfer iine, 260ºCIon source, 160°C
Under these conditions the bis-(trifluoroacetyl) morphine shouldelute at between 2 and 4 min.
Before beginning the GC/MS analysis of samples, the performance ofthe total GC/MS system should be evaluated and optimized as descri-bed in Chapter 2. The ions to be monitored occur at m/z 478 and 481.They correspond to the protonated molecule ions for bis-(trifluoro-
119
328-011 0 - 80 - 9

acetyl) morphine and the 2H3-analog, respectively. With the di-vert valve in the divert position, inject 2 to 6 µl of the chloro-form solution of the extract into the gas chromatograph. Afterapproximately 1 min, switch the divert valve so that the entirecarrier gas flow enters the ion source of the mass spectrometerand begin data acquisition. When the morphine derivative has elu-ted, cease data acquisition and return the divert valve to the di-vert position.
The quantity of free morphine in the biological sample is deter-mined by measuring the heights (or areas) of the bis-(trifluoro-acetyl) morphine peak and the 2H3-analog peak in the ion currentprofiles (“ion chromatograms”) and relating the ratio of peakheights to a calibration graph. Calculate the specimen concentrationof free morphine by dividing the measured quantity of morphine bythe exact volume of specimen extracted.
Discussion of the Experimental Procedure
The procedure described here is relatively rapid, yet it resultsin excellent sensitivity and specificity. Morphine concentrationsas low as 1 ng/ml can be measured accurately and interference fromother components of the extract is seldom a problem. If interfer-ences are encountered it may be possible to remove them by incor-porating a back-extraction into the method. When a back-extractionis desirable, follow the previously described procedure to thepoint where the toluene:heptane:isoamyl alcohol extract (approxi-mately 1 ml) is transferred into a 12-ml glass stoppered, conicalcentrifuge tube. Then add 1 ml of 0.2 N H2SO4. Stopper the tubeand shake or vortex for at least 30 sec. Discard the organic layer(top) and neutralize the aqueous layer (bottom) by addition of 1 mlof 0.2 N NaOH. Saturate the solution with sodium chloride (~1 g)and add 2.0 ml of the K2HPO4 buffer. Confirm that the pH of thesolution is between 8.5 and 9.0, and then extract the morphine with2 ml of the toluene:heptane:isoamyl alcohol solvent. Finally, pro-ceed with the derivatization and GC/MS analysis as previously des-cribed.
Preparation of the bis- (trimethylsilyl) derivative of morphine byheating the extract with bis-(trimethylsilyl) trifluorocetamide(BSTFA) at 60°C for 1 hr, is an alternative to formation of thetrifluoroacetyl derivative. Both derivatives have been used withsatisfactory results. Trifluoroacetylation occurs somewhat morerapidly than the trimethylsilyation. However, the excess triflu-oroacetic anhydride should be removed by evaporation prior to GC/MSanalysis to avoid degradation of the GC column. (Injection of excessBSTFA onto the GC column does not appear to degrade column perfor-mance). Figures 1 and 2 show the methane-ammonia CI mass spectraof bis-(trifluoroacetyl) morphine and bis-(trimethylsilyl) morphine,respectively. In both spectra the only abundant ions correspond tothe protonated molecule ions. A direct comparison has not been madeof the stability of these two morphine derivatives, but no majordifferences have become evident so far.
120

FIGURE 1. METHANE-AMMONIA CI MASS SPECTRUM OF BIS-(TRI-FLUOROACETYL) MORPHINE
FIGURE 2. METHANE-AMMONIA CI MASS SPECTRUM OF BIS-(TRI-METHYLSILYL) MORPHINE
121

The procedure described here measures only free morphine in thebody fluid. In urine, most of the excreted morphine is presentas glucuronide and sulfate conjugates. Consequently, in order tomeasure the total morphine it is necessary to hydrolyze the conju-gated morphine before extraction. Acid hydrolysis can be performedas follows (43):
Transfer 1 ml of specimen into a 12-ml culture tube. Add 100 µlof the 400-ng/ml morphine-2H3 internal standard solution and vor-tex for about 10 sec. Allow the sample to equilibrate for 15 min.Add 1 ml of 6 N HC1 (prepared by a 1 to 1 dilution of concentratedhydrochloric acid with distilled water). Vortex the mixture andthen heat in a boiling water bath for 1 hr. After cooling to roomtemperature neutralize the mixture by slowly adding 1 ml of 6 NNaOH. Saturate the solution with sodium chloride to facilitateextraction of the free morphine. Add 2 ml of the K2HPO4 bufferand check to see that the pH of the mixture is between 8.5 and 9.0.Extract the morphine with 1 ml of the toluene:heptane:isoamyl al-cohol solvent, and proceed with the derivatization and GC/MS analy-sis as previously described.
Other opiate narcotics such as codeine and 6-monoacetyl morphinecan be measured simultaneously by the described method if thecorresponding deuterium-labeled analogs are available for use asinternal standards. The protonated molecule ions for trifluoro-acetyl codeine and its 2H3-analog occur at m/z 396 and 399, respect-ively; in the case of the trifluoroacetyl derivative of 6-mono-acetyl morphine and its 2H3- analog, these ions occur at m/z 4.24and 427. Figures 3 and 4 show representative calibration graphs formorphine and codeine in plasma. The graphs are linear for drugconcentrations from 1 to 500 ng/ml. If higher concentrations areencountered or anticipated, the specimen should be diluted with dis-tilled water in order to reduce the drug concentration so that itfalls within the linear range of the calibration graph.
122

FIGURE 3. CALIBRATION GRAPH FOR ANALYSIS OF MORPHINEIN PLASMA
FIGURE 4. CALIBRATION GRAPH FOR ANALYSIS OF CODEINEIN PLASMA
123
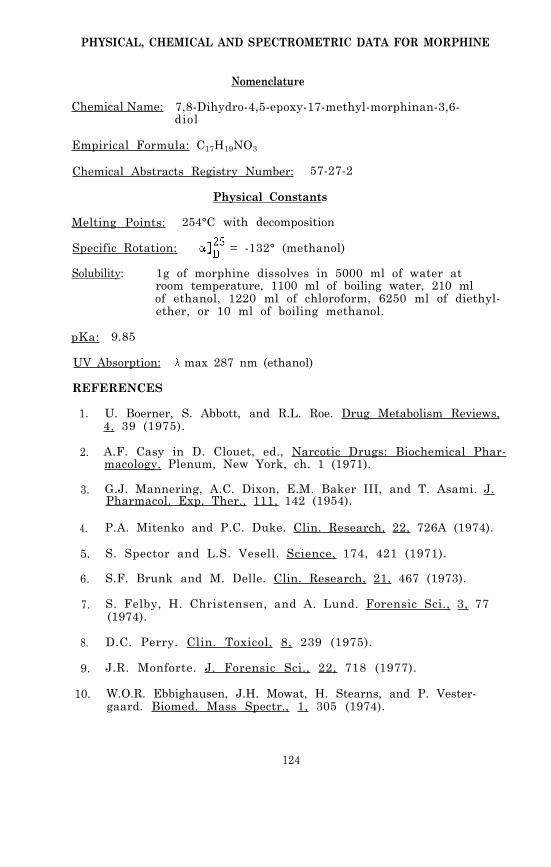
PHYSICAL, CHEMICAL AND SPECTROMETRIC DATA FOR MORPHINE
Nomenclature
Chemical Name: 7,8-Dihydro-4,5-epoxy-17-methyl-morphinan-3,6-diol
Empirical Formula: C17H19NO3
Chemical Abstracts Registry Number: 57-27-2
Physical Constants
Melting Points: 254°C with decomposition
Specific Rotation: = -132° (methanol)
Solubility: 1g of morphine dissolves in 5000 ml of water atroom temperature, 1100 ml of boiling water, 210 mlof ethanol, 1220 ml of chloroform, 6250 ml of diethyl-ether, or 10 ml of boiling methanol.
pKa: 9.85
UV Absorption: max 287 nm (ethanol)
REFERENCES
1. U. Boerner, S. Abbott, and R.L. Roe. Drug Metabolism Reviews,4, 39 (1975).
2. A.F. Casy in D. Clouet, ed., Narcotic Drugs: Biochemical Phar-macology. Plenum, New York, ch. 1 (1971).
3. G.J. Mannering, A.C. Dixon, E.M. Baker III, and T. Asami. J.Pharmacol. Exp. Ther., 111, 142 (1954).
4. P.A. Mitenko and P.C. Duke. Clin. Research, 22, 726A (1974).
5. S. Spector and L.S. Vesell. Science, 174, 421 (1971).
6. S.F. Brunk and M. Delle. Clin. Research, 21, 467 (1973).
7. S. Felby, H. Christensen, and A. Lund. Forensic Sci., 3, 77(1974).
8. D.C. Perry. Clin. Toxicol, 8, 239 (1975).
9. J.R. Monforte. J. Forensic Sci., 22, 718 (1977).
10. W.O.R. Ebbighausen, J.H. Mowat, H. Stearns, and P. Vester-gaard. Biomed. Mass Spectr., 1, 305 (1974).
124

11. S.Y. Yeh, R.L. McQuinn, and C.W. Gorodetzky. J. Pharm. Sci.,66, 201 (1977).
12. S.Y. Yeh, C.W. Gorodetzky and R.L. McQuinn. J. Pharmacol.Exp. Ther., 196, 249 (1976).
13. U. Boerner and S. Abbott. Experientia, 29, 180 (1973).
14. U. Boerner, K.L. Roe, and C.E. Becker. J. Pharm. Pharmacol.,26, 393 (1974).
15. S.Y. Yeh. J. Pharmacol. Exp. Ther., 192, 201 (1975).
16. J.F. Taylor in D.Clouet, ed., Narcotic Drugs: BiochemicalPharmacology. Plenum, New York, ch. 2 (1971).
17. S.J. Mulé. J. Chromatogr. Sci., 12, 245 (1974).
18. H.H. Loh, I.K. Ho, T.M. Cho, and W. Lipscomb. J. Chromatogr.,76, 505 (1973).
19. H. Kupferberg, A. Burkhalter, and E.L. Way. J. Pharmacol.Exp. Ther., 145, 247 (1964).
20. S.J. Mulé and P.L. Hushin. Anal. Chem., 43, 708 (1971).
21. A.E. Takemori. Biochem. Pharmacol., 11, 1627 (1968).
22. J.M. Hicks, R.A. Sonoff, and K.J. Koch. Clin. Chem., 20,901 (1974).
23. I. Jane and J.F. Taylor. J. Chromatogr., 109, 37 (1975).
24. G.W. Aherne, V. Marks, B.A. Morris, E.M. Piall, J.D. Robinson,and R.G. Twycross. Brit. J. Pharmacol., 54, 228P (1975).
25. D. Sohn, J. Simon, M.A. Hanna, G.V. Ghali, R.A. Tolba, and V.Melkonian. Anal. Chem., 45, 1498 (1973).
26. M. Koida, M. Takahashi, and H. Kaneto. Japan. J. Pharmacol.,24, 707 (1974).
27. G. Gintzler, E. Mohacsi, and S. Spector. Europ. J. Pharmacol.,38, 149 (1976).
28. J.W.A. Findlay, R.F. Butz, and K.M. Welch. Life Sci., 19,389 (1976).
29. M. Steiner and J.L. Spratt. Clin. Chem., 24, 339 (1978).
30. G.R. Wilkinson and E.L. Way. Biochem. Pharmacol., 18, 1435(1969).
31. K.E. Rasmussen. J. Chromatogr., 120, 491 (1976).
125

32. D.A. Smith and W.J. Cole. J. Chromatogr., 105, 377 (1975).
33.
34.
35.
36.
37.
38.
39.
40.
41.
42.
43.
44.
45.
46 .
47.
48.
49.
50.
51.
52.
J.E. Wallace, H.E. Hamilton, K. Blum, and C. Petty. Anal.Chem., 46, 2107 (1974).
B. Dahlström and L. Paalzow. J. Pharm. Pharmacol., 27, 172(1975).
M.J. Kogan and M.A. Chedekel. J. Pharm. Pharmacol., 28, 261(1976).
G. Nicolau, G. Van Lear, B. Kaul, and B. Davidow. Clin. Chem.,23, 1640 (1977).
J.M. Moore. J. Chromatogr., 147, 327 (1978).
W.O.R. Ebbighausen, J.H. Mowat, and P. Vestergaard. J. Pharm.Sci., 62, 146 (1973).
W.O.R. Ebbighausen, J.H. Mowat, P. Vestergaard, and N.S. Kline.Adv. in Biochem. Psychopharmacol., 7, 135 (1973).
P.P. Hipps, M.R. Eveland, E.R. Meyer, W.R. Sherman, and T.J.Cicero. J. Pharmacol. Exp. Ther., 196, 642 (1976).
W.J. Cole, J. Parkhouse and Y.Y. Yousef. J. Chromatogr. 136,409 (1977).
P.A. Clarke and R.L. Foltz. Clin. Chem., 20, 465 (1974).
D. Pearce, S. Wiersema, M. Kuo, and C. Emery. Clin. Toxicol.,14, 161 (1979).
D. Reed. Clin. Toxicol., 14, 169 (1979).
I. Jardine and C. Fenselau. J. Forensic Sci., 20, 373 (1975).
M. .Anbar and W.H. Aberth. Anal. Chem., 46, 59A (1974).
J.A. Lawson, J.I. Degraw, and M. Anbar. J. Heterocyclic Chem.,13, 593 (1976).
F. Fish and T.S. Hayes. J. Forensic Sci., 19, 676 (1974).
T.N. Higgins and J.D. Taylor. Clin. Biochem., 7, 280 (1974).
G.R. Nakamura and E.L. Way. Anal. Chem., 47, 775 (1975).
F. Fish and W.D.C. Wilson. J. Chromatogr., 40, 164 (1969).
D.B. Predmore, G.D. Christian, and T.A. Loomis. J. ForensicSci., 23, 481 (1976).
126

53. J.P.G. Tehnot and K.D. Haegele in D. Glick, ed., Methods ofBiochemical Analysis, Vol. 24. Interscience, John Wiley andSons, New York, p. 101 (1977).
54. C. Elison, H.W. Elliott, M. Look, and H. Rapoport. J. Med.Chem., 6, 237 (1963).
55. H. Rapoport and M. Look. U.S. Patent 2,890,221; Chem. Abstr.,54, 612f (1960).
127

Chapter 9
Diazepam and its Major Metabolite,N-DesmethyldiazepamDiazepam (7-chloro-1,3-dihydro-1-methyl-5-phenyl-2H-1,4-benzodia-zepin-2-one, I) was first synthesized in 1959 and introduced clini-cally in the early 1960’s as an antianxiety agent and a muscle re-laxant (1). It can be synthesized by the reaction of 2-methyl-amino-5-chlorobenzophenone and ethyl glycinate, or by a variety ofother routes (2) . Diazepam has been marketed since 1963 as Valiumand has become the most commonly used prescription drug in theWestern world (1).
The most important clinical effects of the drug are mediated throughthe central nervous system (CNS); the limbic system of the brain,which controls emotions, has been implicated in attempts to lo-cate the site of antianxiety activity. Diazepam has muscle relax-ant and strong anticonvulsant properties also, but the sites ofaction for these activities have not been identified. Unlikebarbiturates, drugs of the benzodiazepine class do not appear toproduce clinically important hepatic microsomal induction and aremore benign than other sedative-hypnotic drugs with respect tocardiovascular and respiratory depression (1). Tolerance does de-velop, however, so that larger doses become necessary to achievethe desired effects. Recent clinical studies have indicated thatsensitivity to the CNS-depressant effects of diazepam increaseswith age (3). Side effects of therapeutic doses (usually 20 mgdaily or less) can include drowsiness, ataxia, disorientation, andvertigo (4). There is evidence for an association between the in-gestion of diazepam in the first trimester of pregnancy and theincidence of oral clefts in infants (5). However, because of itsrelatively wide margin of safety, death due to diazepam overdoseis rare. Significant impairment of psychomotor skills at doses of10-20 mg was demonstrated in a study related to driving ability,and this impairment combined with the sleep-inducing effect of thedrug makes its possible contribution to traffic accidents an impor-
128
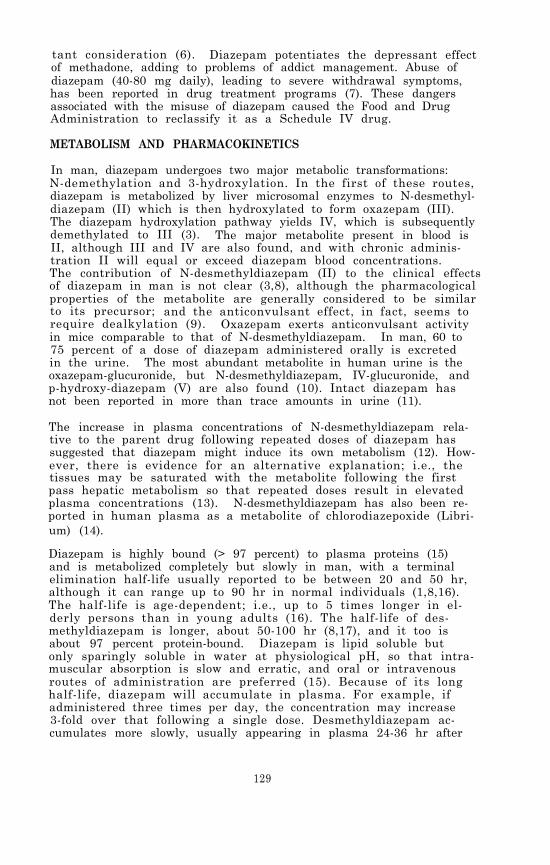
tant consideration (6). Diazepam potentiates the depressant effectof methadone, adding to problems of addict management. Abuse ofdiazepam (40-80 mg daily), leading to severe withdrawal symptoms,has been reported in drug treatment programs (7). These dangersassociated with the misuse of diazepam caused the Food and DrugAdministration to reclassify it as a Schedule IV drug.
METABOLISM AND PHARMACOKINETICS
In man, diazepam undergoes two major metabolic transformations:N-demethylation and 3-hydroxylation. In the first of these routes,diazepam is metabolized by liver microsomal enzymes to N-desmethyl-diazepam (II) which is then hydroxylated to form oxazepam (III).The diazepam hydroxylation pathway yields IV, which is subsequentlydemethylated to III (3). The major metabolite present in blood isII, although III and IV are also found, and with chronic adminis-tration II will equal or exceed diazepam blood concentrations.The contribution of N-desmethyldiazepam (II) to the clinical effectsof diazepam in man is not clear (3,8), although the pharmacologicalproperties of the metabolite are generally considered to be similarto its precursor; and the anticonvulsant effect, in fact, seems torequire dealkylation (9). Oxazepam exerts anticonvulsant activityin mice comparable to that of N-desmethyldiazepam. In man, 60 to75 percent of a dose of diazepam administered orally is excretedin the urine. The most abundant metabolite in human urine is theoxazepam-glucuronide, but N-desmethyldiazepam, IV-glucuronide, andp-hydroxy-diazepam (V) are also found (10). Intact diazepam hasnot been reported in more than trace amounts in urine (11).
The increase in plasma concentrations of N-desmethyldiazepam rela-tive to the parent drug following repeated doses of diazepam hassuggested that diazepam might induce its own metabolism (12). How-ever, there is evidence for an alternative explanation; i.e., thetissues may be saturated with the metabolite following the firstpass hepatic metabolism so that repeated doses result in elevatedplasma concentrations (13). N-desmethyldiazepam has also been re-ported in human plasma as a metabolite of chlorodiazepoxide (Libri-um) (14).
Diazepam is highly bound (> 97 percent) to plasma proteins (15)and is metabolized completely but slowly in man, with a terminalelimination half-life usually reported to be between 20 and 50 hr,although it can range up to 90 hr in normal individuals (1,8,16).The half-life is age-dependent; i.e., up to 5 times longer in el-derly persons than in young adults (16). The half-life of des-methyldiazepam is longer, about 50-100 hr (8,17), and it too isabout 97 percent protein-bound. Diazepam is lipid soluble butonly sparingly soluble in water at physiological pH, so that intra-muscular absorption is slow and erratic, and oral or intravenousroutes of administration are preferred (15). Because of its longhalf-life, diazepam will accumulate in plasma. For example, ifadministered three times per day, the concentration may increase3-fold over that following a single dose. Desmethyldiazepam ac-cumulates more slowly, usually appearing in plasma 24-36 hr after
129
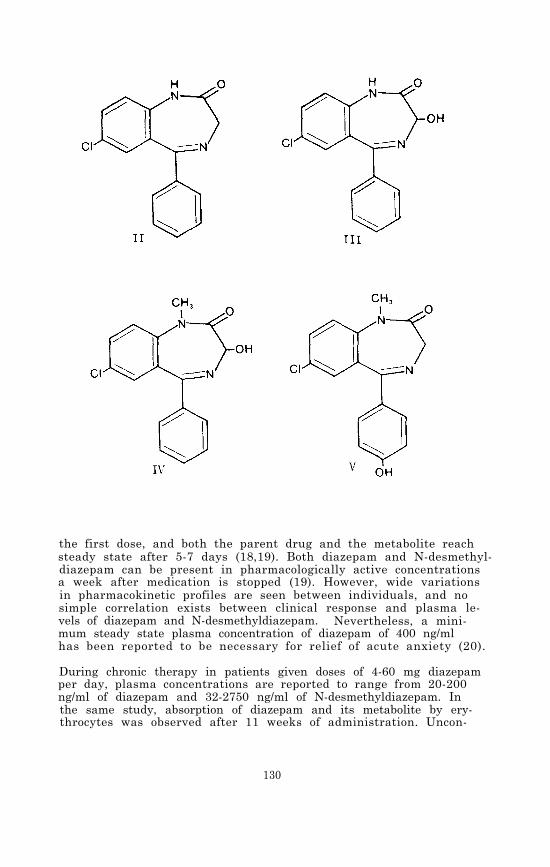
the first dose, and both the parent drug and the metabolite reachsteady state after 5-7 days (18,19). Both diazepam and N-desmethyl-diazepam can be present in pharmacologically active concentrationsa week after medication is stopped (19). However, wide variationsin pharmacokinetic profiles are seen between individuals, and nosimple correlation exists between clinical response and plasma le-vels of diazepam and N-desmethyldiazepam. Nevertheless, a mini-mum steady state plasma concentration of diazepam of 400 ng/mlhas been reported to be necessary for relief of acute anxiety (20).
During chronic therapy in patients given doses of 4-60 mg diazepamper day, plasma concentrations are reported to range from 20-200ng/ml of diazepam and 32-2750 ng/ml of N-desmethyldiazepam. Inthe same study, absorption of diazepam and its metabolite by ery-throcytes was observed after 11 weeks of administration. Uncon-
130
jugated forms of diazepam and metabolites appeared in urine fol-lowing several weeks of medication (21).
After intravenous injection of 20 mg of diazepam, a maximum con-centration of 1600 ng/ml was reached in 15 min, while 20 mg takenorally gave a maximum blood concentration of 490 ng/ml in 30 minand the maximum after intramuscular administration was 290 ng/mlin 60 min (22). In other investigations, however, oral adminis-tration of 10 mg diazepam resulted in peak plasma concentrationsof 100-200 ng/ml after 1.5 hr (23). ‘The drug was labeled withtritium for this study, and the decline of radioactivity in theplasma indicated a rapid and extensive uptake by tissues followedby a redistribution into blood of both diazepam and N-desmthyl-diazepam.
The rate at which diazepam returns to the central compartment fromthe deep peripheral compartment has been shown to be the rate-controlling factor in the elimination of diazepam from the bodyand in formation of dealkylated metabolites; only 18 percent ofthe drug in the body is present in the central compartment andavailable for elimination at any given time (17). In vitro dis-placement of diazepam from human serum albumin by lauric acid demon-strated that protein binding, as well as tissue distribution, couldbe affected by fluctuations in plasma free fatty acids (24). Be-cause human bile contains virtually no diazepam, N-desmethyldiaze-am, or their glucuronide conjugates, as shown by a study using
14C-diazepam their long half-lives in plasma cannot be explainedby enterohepatic circulation (10). The presence of liver disease,however, has been found to decrease the protein binding of diazepamand to prolong its plasma elimination half-life (16). Chronicingestion of alcohol. (25), as well as food intake (26), can alsoaffect the pharmacokinetics of intravenously administered diazepam.
The entry of free, unbound diazepam and N-desmethyldiazepam intothe cerebrospinal fluid (CSF) appears to be by passive diffusion,quickly reaching concentrations equivalent to 2-4 percent of thetotal plasma concentration (11). After long-term diazepam therapy,however, some accumulation of the metabolite in the CSF relative toplasma has been observed which could reflect high concentrationsof the metabolite in brain tissue following repeated administrationof diazepam (9). Desmethyldiazepam is known to accumulate in fetalbrain, heart, liver, and lung tissues when the mother has takendiazepam (27).
The concentration of diazepam in saliva has been shown to be di-rectly proportional to the concentration of unbound drug in plasma(saliva/plasma ratio 0.03). This finding is significant in thatit raises the possibility of obtaining a sample by a noninvasivemethod for the determination of plasma concentrations (28).
An extensive review of the clinical pharmacokinetics of diazepamand N-desmethyldiazepam has been published (29).
131
ANALYTICAL METHODOLOGY
A quantitative ultraviolet spectrophotometric assay capable of mea-suring blood concentrations of diazepam and N-desmethyldiazepamresulting from doses greater than 50 mg was reported in 1966.Quantitation was based on measurement of absorbance values at 240nm. The sensitivity limit of 0.3 µg/ml was sufficient for toxico-logical purposes (18). A fluorometric screening method capableof detecting benzodiazepines in blood and urine at concentrationsof 25 ng/ml has been reported more recently, but it does not dis-tinguish between diazepam and its metabolites. The benzodiazepinespresent are hydrolyzed to benzophenones and then converted to fluo-rescent 9-acridanones by heating with lead dioxide (30).
For human metabolic studies using 14C-labeled diazepam, thin-layerchromatography (TLC) of extracts, using chloroform: acetone (9:1) asdeveloping solvent, followed by scintillation counting of the ap-propriate sections of gel, has been used for measurement of diaze-pam and its metabolites in blood, urine, and bile (10). Recently,another TLC procedure was developed for use in bioavailabilitystudies. Carbamazepine was added as an internal standard to buf-fered serum (pH 8) before extraction with n-hexane containing 10percent isobutanol. The dried residue was dissolved in chloroformand spotted on the TLC plate; the developing solvent was ethyl ace-tate:benzene:ammonia (35:15:0.15). After drying, the plates wereexposed to HCl gas for 30 min and then to radiation at 254 nm. Dia-zepam, N-desmethyldiazepam, and the internal standard were conver-ted to fluorescent compounds by this procedure, and fluorescencewas enhanced by dipping the plates in a 10 percent solution of par-affin wax in light petroleum. Quantitative fluorimetry ( ex 360 nm,
em 460 nm) was then possible based on calibration graphs relatingpeak height ratios to drug concentrations over the range 50-500ng/ml (31).
Differential pulse polarography based on the reduction peak of the4,5-azomethine group, while not specific for diazepam among 1,4-benzodiazepines, can measure this class of compounds in blood ata sensitivity of 250 ng/ml. The concentration of drugs and meta-bolites is calculated on the basis of the resultant current of ap-propriate internal standards. Resolution of particular benzodia-zepines can be achieved by incorporation of a TLC step, which alsoincreases the sensitivity to 50 ng/ml (32).
Currently, the techniques most widely used for analysis of benzo-diazepines include high performance liquid chromatography (HPLC),immunoassays, and gas chromatography with electron capture detec-tion (GC-ECD). HPLC has the advantage that it can be used to ana-lyze for any of the benzodiazepines and their major metabolites.The immunoassay techniques (RIA, EMIT) offer greater speed and,when large numbers of samples are involved, lower cost than chro-matographic methods; however, they have a very limited dynamic rangeand are more suitable for qualitative screening than quantitativemeasurement. GC-ECD offers excellent sensitivity and specificityif a high quality column is used, but is unsatisfactory for the
132

analysis of some benzodiazepines and their metabolites because oftheir thermal instability. A more detailed discussion of each ofthe techniques follows.
Quantitative high performance liquid chromatography on porous sili-ca, using n-heptane:isopropanol:methanol (40:10:1) with detectionby UV absorption at 232 nm, was developed for routine forensic de-terminations of diazepam and N-desmethyldiazepam in human blood.Extraction was made with benzene followed by a back extraction intoacid. When concentrations were greater than 100 ng/ml., 1 ml ofblood was sufficient for quantitation by HPLC, but for lower con-centrations (25-100 ng/ml), 2 ml of blood and repetition of eachextraction step was necessary (33).
A reverse-phase HPLC column was used for simultaneous measurementof diazepam and its pharmacologically active metabolites, N-des-methyldiazepam and oxazepam (34). An internal standard (chlor-diazepoxide) was added to 250 µl of serum or plasma together witha sodium phosphate buffer (pH 11) and the mixture was extractedwith chloroform. The extract was chromatographed on a µ-BondapakCN column (Waters Association, Milford, MA) using a solvent systemof acetonitrile and phosphate buffer (1:2). UV detection at 254nm gave a linear response from 20 to 2000 ng for each drug andmetabolite. Day-to-day precision was reported to be 5 to 10 per-cent. Two recent reports also describe reverse-phase HPLC proce-dures for diazepam which were used to confirm measurements obtainedby GC-ECD). Both methods employed UV detection at 254 nm (35,36).
An electrochemical detector operated in a reduction mode served asthe detector for an HPLC assay for diazepam, nitrazepam, and chlor-diazepoxide. A mobile phase of methanol:water (60:40) containing0.05 M ammonium acetate (pH 7.25) was used with a reverse-phasecolumn. Interference due to reduction of oxygen is a major prob-lem when electrochemical detectors are operated in the reductionmode. Attempts to remove oxygen from the solvent and sample failedto completely eliminate this interference. However, diazepam,which can be measured at a reduction potential of -0.93 v, couldbe detected at quantities as low as 3 ng (37).
A radioimmunoassay (RIA) procedure for diazepam in blood extractswas developed following production of two different antibodies, onespecific for diazepam and the other recognizing both diazepam andits metabolite, N-desmethyldiazepam. The RIA was capable of de-tecting 1 ng of the drug in dried ether extracts of whole blood,and the response was linear to 100 ng (38). In a separate RIAdeveloped specifically for N-desmethyldiazepam, cross reactionwith diazepam and most other benzodiazepines was less than 1 per-cent; this assay permitted detection of as little as 3 ng/ml ofthe metabolite in only 10 µl of plasma (39). Another immunoassayprocedure, EMIT, has also been reported for benzodiazepines (40),but it is not specific for diazepam and is used only for urine be-cause of interference by enzymes in plasma.
133

Gas chromatography (GC) has been used extensively in the analysisof benzodiazepines. The high polarity and low volatility of thebenzodiazepines require use of a thermally-stable liquid phaseand well-deactivated column packings. Because gas chromatographyof these compounds, and particularly N-desmethyldiazepam, is dif-ficult, some of the earlier GC methods involved conversion of thebenzodiazepines to benzophenones by acid hydrolysis prior to ex-traction and GC analysis (41,42). However, with recent improve-ments in GC column technology it is now possible to chromatographboth diazepam and N-desmethyldiazepam without prior chemical trans-formations (Table 1).
Gas chromatography with flame ionization detection (FID) does notoffer sufficient sensitivity to assay blood concentrations of dia-zepam after therapeutic dosage. However, because of the presenceof the electronegative chlorine substituent, diazepam and its meta-bolites are well suited for electron capture detection (ECD) andmany assays using this detector have been published (9,28,35,36,43-50).
In general, the GC-ECD assays are able to measure diazepam concen-trations as low as about 10 ng/ml, although a sensitivity of 1 ng/ml has been reported for an assay of the drug in human cerebrospi-nal fluid when a 63Ni detector was used and griscofulvin was addedas an internal standard to the extraction residue just before in-jection into the chromograph (9). An equally sensitive (1 ng/ml)method for the assay of N-desmethyldiazepam, suitable for pharmaco-kinetic studies, uses N-desmethyl tetrazepam as the internal stan-dard and relies on extraction from plasma with diethyl ether and anacid back extraction for additional purification. A recovery ofat least 70 percent is reported. The dried ether residue is dis-solved in hexane:acetone (4:1) and chromatographed on a column con-taining 1 percent Poly-A103 on Gas Chrom Q with a 63Ni detector.This degree of sensitivity requires scrupulously clean glassware,extremely pure reagents, and careful extraction/purification pro-cedures (4 7). ECD assays are time-consuming and are usually un-suitable for rapid analysis of large numbers of clinical samples;therefore a simplified procedure was developed in which 2 ml ofNa3PO4-saturated distilled water was added to 1 ml of whole bloodto precipitate proteins (final pH = 12.8). After thorough vortexmixing, the sample was extracted with benzene:methylene chloride(9:1). The extract was evaporated to dryness, dissolved in 100µl benzene:acetone:methanol (80:15:10) and analyzed by GC-ECD with-out further purification. The sensitivity reported for this pro-cedure was 5 ng/ml of blood (43).
In another adaptation of GC-ECD for rapid (< 1 hr) quantitation ofdiazepam in 1-ml samples of human blood, methyl clonazepam wasadded to serum or plasma as an internal standard prior to extrac-tion with toluene at pH 9, back extraction into acid, and reextrac-tion with toluene. Underivatized diazepam and N-desmethyldiazepamwere analyzed on a 3 percent OV-17 column equipped with 63Ni-ECD(44) Similarly, sensitivities of 5 ng diazepam and 10 ng N-des-methyldiazepam per ml of plasma have been reported for automated
134

TABLE 1. GAS CHROMATOGRAPHIC ASSAYS FOR DIAZEPAMAND/OK N-DESMETHYLDIAZEPAM
ExtractionSolvent
Toluene:heptane(4:1)
Diethyl etherplus backextraction
Benzene:methylenechloride (9:1)
Toluene plusback extraction
Benzene 3% OV-17
Toluene:heptane(4:1) plus 1.6%isoamyl alcohol
Toluene:heptane:isoamyl alcohol(76:20:4)
Hexane:ethylacetate (7:3)
Toluene
Toluene:heptane(9:1)
Diethyl etherplus backextraction
Benzene:isoamylalcohol
Ethyl acetate
GCColumn
2% OV-17
1%Poly-A103
3% OV-17
3% OV-17
3% OV-17
3% OV-17 Flunitrazepam ECD 35
3%SP2250-DB
3% OV-17
3% OV-17
3% OV-17
3% OV-17
3% OV-17
InternalStandard
Griseofulvin
Desmethyl-tetrazepam
Methyl-clonazepam
Methylnitrazepam
Medazepam
Prazepam ECD 36
Flurazepam ECD 28
Prazepam ECD 49
Prazepam NPD 51
50
52
53
Ro 7-9957 andRo 7-9749
N-C2H7-diazepam
N-C 2H 7-diazepam
135
Detector
ECD
ECD
ECD
ECD
ECD
ECD
ECD
MS
MS
Reference
9
47
43
44
45,48
46
- -

ExtractionSolvent
Diethyl etherplus backextraction
G C InternalColumn Standard
1% OV-17 Medazepam
Detector Reference
FID 54
Butyl chloride 2% OV-17 Prazepam FID 55
GC-ECD analysis using benzene for extraction and methylnitrazepamas internal standard (45). When a single-step extraction methodwas combined with GC using a frequency-response ECD, linear sensi-tivity over the range of 10- 500 ng/ml of serum was achieved (46).The method permitted results of up to 40 clinical samples to bereported on the same day.
Another rapid extraction procedure has been applied to simultaneousquantitation of four benzodiazepines in blood and plasma. One mlof saturated borate buffer was added to 0.05 to 1.0 ml of body fluidand the mixture extracted with 1 ml of a solvent system consistingof toluene:heptane:isoamyl alcohol (76:20:4). After centrifugation,1.5 µl of the organic phase was removed and injected directly intothe GG-ECD. The method gave adequate sensitivity for measurementof therapeutic levels of the benzodiazepine drugs and their meta-bolites (35).
N-Desmethyldiazepam has been measured in plasma by GC-ECD followingadministration of dipotassium clorazepate, a drug which undergoesspontaneous decarboxylation to N-desmethyldiazepam at pH < 4 (48).A rapid and convenient extraction procedure was used, consistingof addition of 0.1 ml saturated potassium chloride solution to 0.1ml of plasma and extraction with 1 ml of benzene containing 25 ngof methylnitrazepam as the internal standard.
Various methods have been reported for improving the chromatogra-phic characteristics of the benzodiazepines, and particularly N-desmethyldiazepam. The need for priming the GC column before be-ginning each day’s analyses is frequently mentioned. Primingagents that have proven beneficial include: 1) blank plasma ex-tracts (35,50,59), 2) lecithin in ethanol (5 g/l) (49), and 3)cholesterol in acetone (49). A new liquid phase (SP 2250-DB, Su-pelco, Inc.) was found to considerably reduce the GC peak tailingof N-desmethyldiazepam when compared with OV-17 or OV-1 columns(36).
Because the free N-hydrogen in N-desmethyldiazepam can hydrogenbond to active sites in the GC column, conversion of the metaboliteto an N-alkyl derivative can result in dramatically improved chro-matographic behavior. The N-butyl derivative was formed by treat-ment of a dimethylacetamide solution of the extracted residue withtetrabutylammonium hydroxide and 1-iodobutane (49). The N-buty-lation procedure gave more reliable results than formation of the
136

trimethylsilyl derivative (54). A similar derivatization involv-ing formation of the N-propyl derivative of N-desmethyldiazepamwas combined with use of a nitrogen-phosphorus detector for quan-titation of diazepam and its major metabolite in whole blood (51).
Although the FID is not as sensitive as the ECD, it is less easilycontaminated and because of its wider range of linearity it isoften preferred for routine use in pathology and toxicology labor-atories. The incorporation of back extraction procedures and in-ternal standards allows diazepam to be measured at serum concen-trations as low as 80 ng/ml (54). However, because many neutraland basic drugs may be present in the final extract, confirmationof identity by TLC is desirable (55).
The use of mass spectrometry as the detector system for GC sep-aration of drugs in biological fluids is indicated when the drugsare present in the picogram to low nanogram per ml range. N-C2H3Diazepam was used as the internal standard in two studies con-cerned with the quantitation of diazepam in plasma (52) and inbreast milk (53) by GC/MS.
Both diazepam and N-desmethyldiazepam are readily extracted frombiological media by various organic solvents. The extractions arenormally done at alkaline pH. Back extraction into acid has beenemployed to achieve additional sample purification. However, somesalts of the drug and its metabolites are difficult to extractfrom solvents such as chloroform and methylene chloride.
Diethyl ether is commonly used for extraction of diazepam and N-desmethyldiazepam from blood, urine, or bile (16,18,38,54,56); atpH 7 the recovery efficiency is 90 percent. Other solvents re-ported for diazepam extraction include benzene (> 90 percent fromblood, urine hydrolysates, or tissue homogenates) (10,26,43,45,50);benzene:methylene chloride (9:1, > 85 percent from blood) (3,32,43);ethyl benzoate (56); chloroform (90 percent) (58,59); hexane:iso-amyl alcohol (98.3:1.7) from blood or gastric fluid (30); 1-chlo-robutane followed by chloroform after back extraction into acid(100 percent from blood or tissue homogenates) (55); and toluene:heptane:isoamyl alcohol (78: 20:2, 96 percent at pH 9.5 from blood,homogenates, and urine) (21,35); or toluene containing 1.5 percentamyl alcohol to prevent absorption onto glass (83 percent fromblood) (44).
The choice of solvent and pH depends in part on the metabolitesto be measured. For example, the hydroxy metabolites have dif-ferent partition properties from diazepam, and oxazepam is lost ata pH greater than 10 (21). Because diazepam metabolites occurmainly in the form of water-soluble conjugates in urine, AmberliteXAD-2 resin has been recommended for extraction of these compoundsfrom urine made alkaline to pH 8-9. Absorbed compounds are elutedwith ethyl acetate:methanol:acetic acid (90:10:0.1). The eluateis evaporated and the residue is taken up in buffer and hydrolyzedwith ß-glucuronidase/arylsulfatase before extraction with ethylacetate. A recovery of 95 percent has been reported for this pro-cedure (60).
137
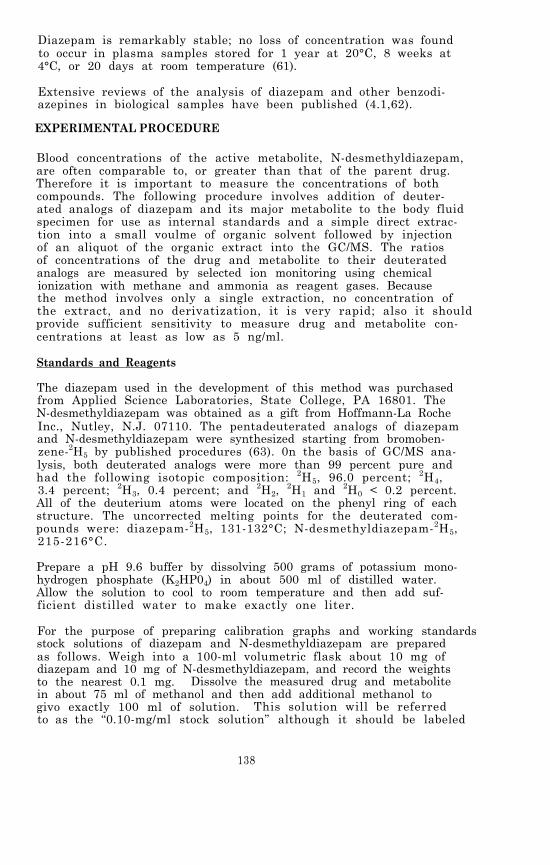
Diazepam is remarkably stable; no loss of concentration was foundto occur in plasma samples stored for 1 year at 20°C, 8 weeks at4°C, or 20 days at room temperature (61).
Extensive reviews of the analysis of diazepam and other benzodi-azepines in biological samples have been published (4.1,62).
EXPERIMENTAL PROCEDURE
Blood concentrations of the active metabolite, N-desmethyldiazepam,are often comparable to, or greater than that of the parent drug.Therefore it is important to measure the concentrations of bothcompounds. The following procedure involves addition of deuter-ated analogs of diazepam and its major metabolite to the body fluidspecimen for use as internal standards and a simple direct extrac-tion into a small voulme of organic solvent followed by injectionof an aliquot of the organic extract into the GC/MS. The ratiosof concentrations of the drug and metabolite to their deuteratedanalogs are measured by selected ion monitoring using chemicalionization with methane and ammonia as reagent gases. Becausethe method involves only a single extraction, no concentration ofthe extract, and no derivatization, it is very rapid; also it shouldprovide sufficient sensitivity to measure drug and metabolite con-centrations at least as low as 5 ng/ml.
Standards and Reagents
The diazepam used in the development of this method was purchasedfrom Applied Science Laboratories, State College, PA 16801. TheN-desmethyldiazepam was obtained as a gift from Hoffmann-La RocheInc., Nutley, N.J. 07110. The pentadeuterated analogs of diazepamand N-desmethyldiazepam were synthesized starting from bromoben-zene-2H5 by published procedures (63). 0n the basis of GC/MS ana-lysis, both deuterated analogs were more than 99 percent pure andhad the following isotopic composition: 2H5, 96.0 percent; 2H4,3.4 percent; 2H3, 0.4 percent; and 2H2,
2H1 and 2H0 < 0.2 percent.All of the deuterium atoms were located on the phenyl ring of eachstructure. The uncorrected melting points for the deuterated com-pounds were: diazepam-2H5, 131-132°C; N-desmethyldiazepam-2H5,215-216°C.
Prepare a pH 9.6 buffer by dissolving 500 grams of potassium mono-hydrogen phosphate (K2HP04) in about 500 ml of distilled water.Allow the solution to cool to room temperature and then add suf-ficient distilled water to make exactly one liter.
For the purpose of preparing calibration graphs and working standardsstock solutions of diazepam and N-desmethyldiazepam are preparedas follows. Weigh into a 100-ml volumetric flask about 10 mg ofdiazepam and 10 mg of N-desmethyldiazepam, and record the weightsto the nearest 0.1 mg. Dissolve the measured drug and metabolitein about 75 ml of methanol and then add additional methanol togivo exactly 100 ml of solution. This solution will be referredto as the “0.10-mg/ml stock solution” although it should be labeled
138

with its actual concentration based upon the exact measured weightsof diazepam and N-desmethyldiazepam. A series of working standardsolutions can then be prepared by appropriate dilution of the stocksolution as described in Chapter 2.
The stock solution of diazepam-2H5 and N-desmethyldiazepam-2H5 isprepared in the same manner. For the measurement of drug and meta-bolite in body fluids within the concentration range 5 to 1000 ng/ml, addition of approximately 40 ng of the internal standards toeach ml of specimen is satisfactory. This can be convenientlydone by adding 100 µl of a methanolic solution containing 400 ng/ml of both diazepam2H5 and N-desmethyldiazepam-2H5 to each ml ofspecimen. Prepare the 400-ng/ml internal standard solution by di-luting 1 ml of the 0.10-mg/ml stock solution of diazepam-2H5 andN-desmethyldiazepam-2H5 to 250 ml with methanol.
Store stock and working standard solutions in well-stoppered orcapped glass vessels in the dark at less than 0°C.
Extraction Procedure
Transfer 1 ml of body fluid (whole blood, plasma, or urine) to a5-ml glass-stoppered, conical centrifuge tube. Add 100 µl of theinternal standard solution containing 400 ng/ml of diazepam-2H5and N-desmethyldiazepam-2H5 and vortex the mixture for 10 sec. Al-low the sample to equilibrate for 15 min and then add 1 ml of theK2HPO4 buffer (pH 9.6), followed by 100 µl of a solvent consistingof toluene:heptane:isoamyl alcohol in a volume ratio of 70:20:10.Stopper the tube and vortex mix for at least 30 sec. Separate thephases by centrifugation for 10 min. The organic solvent will haveformed a narrow upper layer from which an aliquot can be removedwith a syringe for injection into the GC/MS, If there is not aclean separation of layers and a clear upper solvent layer, repeatthe centrifugation at a higher speed ( 2000 X G).
GC/MS Analysis
The experimental conditions for the simultaneous GC/MS analysis ofdiazepam and N-desmethyldiazepam are as follows:
GC column:
Carrier gas:
Reagent gas:
Temperatures
1 m x 2 mm (I.D.) glass column packed with 3percent OV-17 on Ultra-bond 20M, 100/120 mesh(RFR Corp., Hope, RI, 02831)
Methane, 15-20 ml/min
Ammonia, introduced into the ion chamber asdescribed in Chapter 2
Injector, 290°CColumn, 270°C isothermalGC/MS transfer line, 280°CIon source, 160°C
139
328-011 0 - 80 - 10
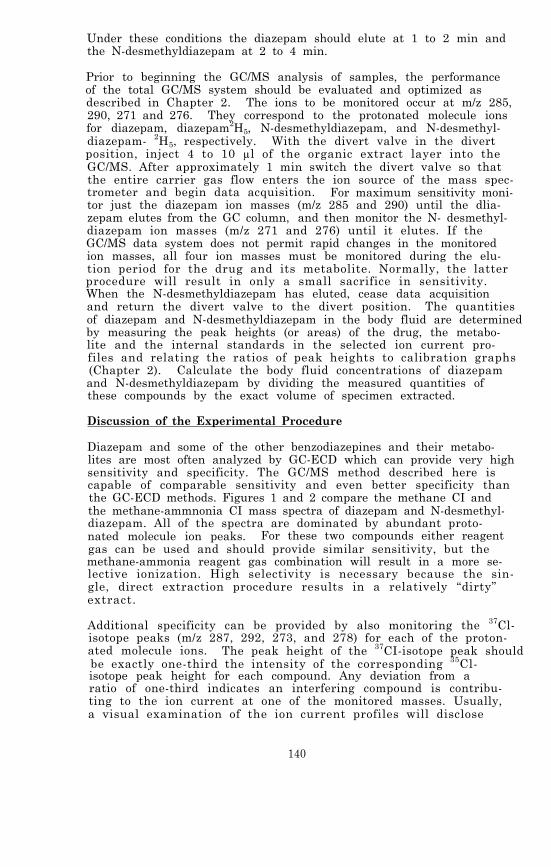
Under these conditions the diazepam should elute at 1 to 2 min andthe N-desmethyldiazepam at 2 to 4 min.
Prior to beginning the GC/MS analysis of samples, the performanceof the total GC/MS system should be evaluated and optimized asdescribed in Chapter 2. The ions to be monitored occur at m/z 285,290, 271 and 276. They correspond to the protonated molecule ionsfor diazepam, diazepam2H5, N-desmethyldiazepam, and N-desmethyl-diazepam- 2H5, respectively. With the divert valve in the divertposition, inject 4 to 10 µl of the organic extract layer into theGC/MS. After approximately 1 min switch the divert valve so thatthe entire carrier gas flow enters the ion source of the mass spec-trometer and begin data acquisition. For maximum sensitivity moni-tor just the diazepam ion masses (m/z 285 and 290) until the dlia-zepam elutes from the GC column, and then monitor the N- desmethyl-diazepam ion masses (m/z 271 and 276) until it elutes. If theGC/MS data system does not permit rapid changes in the monitoredion masses, all four ion masses must be monitored during the elu-tion period for the drug and its metabolite. Normally, the latterprocedure will result in only a small sacrifice in sensitivity.When the N-desmethyldiazepam has eluted, cease data acquisitionand return the divert valve to the divert position. The quantitiesof diazepam and N-desmethyldiazepam in the body fluid are determinedby measuring the peak heights (or areas) of the drug, the metabo-lite and the internal standards in the selected ion current pro-files and relating the ratios of peak heights to calibration graphs(Chapter 2). Calculate the body fluid concentrations of diazepamand N-desmethyldiazepam by dividing the measured quantities ofthese compounds by the exact volume of specimen extracted.
Discussion of the Experimental Procedure
Diazepam and some of the other benzodiazepines and their metabo-lites are most often analyzed by GC-ECD which can provide very highsensitivity and specificity. The GC/MS method described here iscapable of comparable sensitivity and even better specificity thanthe GC-ECD methods. Figures 1 and 2 compare the methane CI andthe methane-ammnonia CI mass spectra of diazepam and N-desmethyl-diazepam. All of the spectra are dominated by abundant proto-nated molecule ion peaks. For these two compounds either reagentgas can be used and should provide similar sensitivity, but themethane-ammonia reagent gas combination will result in a more se-lective ionization. High selectivity is necessary because the sin-gle, direct extraction procedure results in a relatively “dirty”extract.
Additional specificity can be provided by also monitoring the 37Cl-isotope peaks (m/z 287, 292, 273, and 278) for each of the proton-ated molecule ions. The peak height of the 37CI-isotope peak shouldbe exactly one-third the intensity of the corresponding 35Cl-isotope peak height for each compound. Any deviation from aratio of one-third indicates an interfering compound is contribu-ting to the ion current at one of the monitored masses. Usually,a visual examination of the ion current profiles will disclose
140

FIGURE 1. CHEMICAL IONIZATION MASS SPECTRA OF DIAZEPAM
141
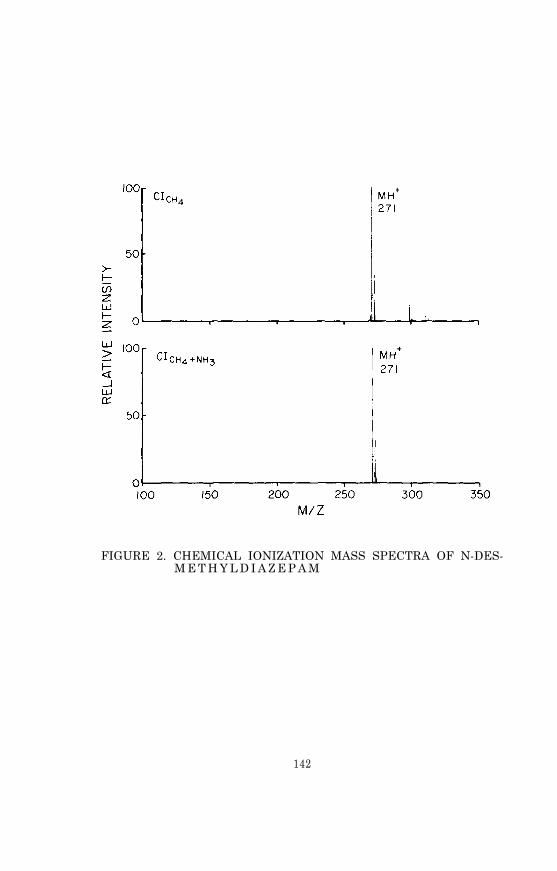
FIGURE 2. CHEMICAL IONIZATION MASS SPECTRA OF N-DES-M E T H Y L D I A Z E P A M
142

which of the peak heights is inaccurate due to the interference;i.e. the peak will have a shoulder, or will be perceptibly broad-ened, or will have an abnormal retention time.
If even greater sensitivity is needed, negative ion chemical ion-ization can be used. Diazepam and N-desmethyldiazepam have highelectron affinities and therefore are efficiently ionized by elec-tron capture under methane chemical ionization conditions. In un-published work conducted at Battelle Columbus Laboratories, up toa 30-fold improvement in sensitivity was achieved by switchingfrom positive ion detection to negative ion detection while oper-ating the mass spectrometer under conventional methane CI condi-tions. Unfortunately, there are significant problems associatedwith quantitative measurements obtained with electron-capture neg-ative ion chemical ionization. One difficulty is illustrated inFigure 3, which compares the negative ion CI mass spectra of dia-zepam acquired at ion source temperatures of 80° and 170°C. Inthe spectrum acquired at the lower ion source temperature the mole-cular anion at m/z 284 is the only prominent peak observed, andthe chloride anion at m/z 35 has a relative intensity of only 10percent. At an ion source temperature of 170°C a dissociativeelectron capture process dominates so that the chloride anion be-comes the most intense peak in the spectrum, while the molecularanion peak has virtually vanished (about 2 percent relative inten-sity). Consequently, in order to use electron-capture negativeion chemical ionization for quantitative measurement of diazepamwith high sensitivity, it is necessary to maintain a low ion sourcetemperature (< 100°C) even though the ion source tends to becomecontaminated more rapidly at low temperatures. The large tem-perature effect experienced with negative ion chemical ionizationcan also cause poor reproducibility in quantitative measurements,although the use of deuterated analogs as internal standards large-ly compensates for changes in the ionization process.
The choice of chromatographic column is critical in the GC/MS ana-lysis of diazepam and N-desmethyldiazepam, particularly when lownanogram-quantities are injected onto the column. The Ultra-bond20M column packing supplied by the RFR Corporation is a very in-active surface, well suited for gas chromatography of polar drugsand metabolites. Both diazepam and N-desmethyldiazepam give nar-row, relatively symmetrical peaks when chromatographed under theconditions specified here.
143
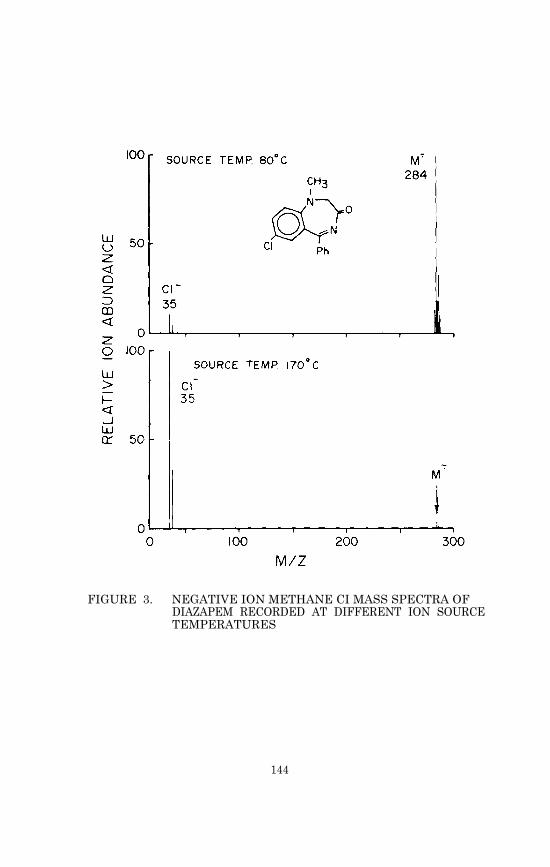
FIGURE 3. NEGATIVE ION METHANE CI MASS SPECTRA OFDIAZAPEM RECORDED AT DIFFERENT ION SOURCETEMPERATURES
144

PHYSICAL, CHEMICAL AND SPECTROMETRIC DATA FOR DIAZEPAM
Nomenclature
Chemical Name: 7-Chloro-1,3-dihydro-1-methyl-5-phenyl-2H-1,4-ben-zodiazepin-2-one
Empirical Formula: C16H13C1N2O
Chemical Abstracts Registry Number: 439-14-5
Trade Names: Ansiolin, Apavrin, Apozepam, Atensine, Atilen, Bial-zepam, Calmpose, Ceregulart, Dipam, Eridan, Faustan,Lembrol, Levium, Morosan, Noan, Pacitran, Paxate,Paxel, Relanium, Seduxen, Setonil, Stesolid, Steso-lin, Tranimul, Valium, Vival, Vivol
Physical Constants
Physical Appearance: Off-white to yellow crystalline powder
Melting Point: 125-126°C
Specific Rotation: optically inactive
pKa: 3.4
Solubility: At room temperature 1 g of diazepam will dissolve in20 1 of water, 56 ml of diethyl ether, 20 ml of meth-anol, 4.5 ml of benzene, and less than 2 ml of chloro-form.
UV Absorption: max at 242, 285 and 368 nm (in 2N HCl)
PHYSICAL, CHEMICAL AND SPECTROMETRICDATA FOR N-DESMETHYLDIAZEPAM
Nomenclature
Chemical Name: 7-chloro-1,3-dihydro-5-phenyl-2H-1,4-benzodiaze-pin-2-one
Empirical Formula: C15H11C1N2O
Chemical Abstracts Registry Number: 1088-11-5
Physical Constants
Physical Appearance: Off-white to yellow crystalline powder
Melting Point: 216-217°C
145

REFERENCES
1. D.J. Greenblatt and Richard I. Shader. New England J. Med.,291, 1011 (1974).
2. A. MacDonald, A.F. Michaelis, and B.Z. Senkowski, in K. Florey,ed. , Analytical Profiles of Drug Substances, Vol. 1. AcademicPress, New York, p. 79 (1972).
3. M.M. Reidenberg, M. Levy, H. Warner, C.B. Coutinho, M.A.Schwartz, G. Yu, and J. Cheripko. Clin. Pharmacol. Ther.,23, 371 (1978).
4. J.J. Tanja, C.R. Clark, and D.E. Griffies. J. Anal. Toxicol.,1, 175 (1977).
5. I. Saxén and L. Saxén. Lancet, 2 (7933), 498 (1975).
6. J.F.W. Haffner, J. Morland, J. Setekleiv, C.E. Stromsaether,A. Danielsen, P.T. Frivik, and F. Dybing. Acta Pharmacol.Toxicol., 32, 161 (1973).
7. J. Wiersum. J. Amer. Med. Assoc., 227, 79 (1974).
8. L. Hillestad, T. Hansen, and H. Melsom. Clin. Pharmcol.Ther., 16, 485 (1974).
9. J. Hendel. Acta Pharmacol. Toxicol., 37, 17 (1975).
10. W.A. Mahon, T. Inaba, T. Umeda, E. Tsutsumi, and R. Stone.Clin. Pharmcol. Ther., 19, 443 (1976).
11. J. Kanto, L. Kangas, and T. Siirtola. Acta Pharmacol. Toxicol.,36, 328 (1975).
12. R. Sellman, J. Xanto, E. Raijola, and A, Pekkarinen. ActaPharmacol. Toxicol., 37, 34.5 (1975).
13. K. Korttila, M.J. Mattila, and M. Linnoila. Acta Pharmacol.Toxicol., 36, 190 (1975).
14. R. Dixon, M.A. Brooks, E. Postma, M.R. Hackman, S. Spector,J.D. Moore, and M.A. Schwartz. Clin. Pharmacol. Ther., 20,450 (1976).
15. U. Klotz, K.H. Antonin, and P. Bieck. Arch. Pharmacol., 287,Suppl, R90 (1975).
16. U. Klotz, G.R. Avant, A. Hoyumpa, S. Schenker, and G.R. Wil-kinson. J. Clin. Inv., 55, 347 (1975).
17. S.A. Kaplan, M.L. Jack, K. Alexander, and R.E. Weinfeld. J.Pharm. Sci., 62, 1789 (1973).
146
18. J.A.F. de Silva, B.A. Koechlin, and G. Bader. J. Pharm. Sci.,55, 692 (1966).
19.
20.
21.
22.
23.
24.
25.
26.
27.
28.
29.
30.
31.
32.
33.
34.
35.
36.
E. van der Kleijn, P.J. M. Guelen, C.G.W.M. van Wijk, I.Baars, and T.B. Vree, in G. Levy, ed., Clinical Pharmokine-tics: Symposium. Amer. Pharm. Assoc., Acad. PharmaceuticalSciences (October 1974), p. 79.
H. Dasberg. Psychother. Psychosom., 24, 113 (1974).
I.A. Zingales. J. Chromatogr., 75, 55 (1973).
L. Hillestad, T. Hansen, H. Melsom, and A. Drivenes. Clin.Pharmacol. Ther., 16, 479 (1974).
M.A. Schwartz, B.A. Koechlin, E. Postma, S. Palmer, and G.Krol. J. Pharmacol. Exp. Ther., 149, 423 (1965).
E. Tsutsumi., T. Inaba, W.A. Mahon, and W. Kalow. Biochem.Pharmacol., 24, 1361 (1975).
R. Sellman, J. Kanto, E. Raijola, and A. Pekkarinen. ActaPharmacol. Toxicol., 36, 33 (1975).
M. Linnoila, K. Korttila, and M.J. Mattila. Acta Pharmacol.Toxicol., 36, 181 (1975).
M. Mandelli, P.L. Morselli, S. Nordio, G. Pardi, N. Principi,F. Sereni, and G. Tognoni. Clin. Pharmacol. Ther., 17, 564(1975).
G.J. DiGregorio, A.J. Piraino, and E. Ruch. Clin. Pharmacol.Ther., 24, 720 (1978).
M. Mandelli, G. Tognoni, and S. Garattini. Clin. Pharma-cokinetics, 3, 72 (1978).
J.C. Valentour, J.R. Monforte, B. Lorenzo, and I. Sunshine.Clin. Chem., 21, 1976 (1975).
P.J. Van der Merwe and J.M. Steyn. J. Chromatogr., 148,549 (1978).
M.A. Brooks, L. D'Arconte, M.R. Hackman, and J.A.F.de Silva.J. Anal. Toxicol., 1, 179 (1977).
A. Bugge. J. Chromatogr., 128, 111 (1976).
J.J. MacKichan, W.J. Jusko, P.K. Duffner, and M.E. Cohen.Clin. Chem., 25, 856 (1979).
M.A. Peat and L. Kopjak. J. Forensic Sci., 24, 46 (1979).
J.E. Wallace, H.A. Schwertner, and E.L. Shimek, Jr. Clin. Chem.,25, 1296 (1979).
147

37. W. Lund, M. Hannisdal, and T. Greibrokk. J. Chromatogr.,173, 249 (1979).
38.
39.
40.
41.
42.
43.
44.
45.
46.
47.
48.
49.
50.
51.
52.
53.
54.
55.
56. J.F. Steyn and H.K.L. Hundt. J. Chromatogr., 107, 196 (1975).
B. Peskar and S. Spector. J. Pharmacol. Exp. Ther., 186,167 (1973).
R. Dixon, W. Glover, J. Earley, and M. Delaney. J. Pharm. Sci.,68, 1471 (1979).
B.H. Haden, K.G. McNeil, N.A. Huber, W.A. Khan, P. Singh, andR.S. Schneider. Clin. Chem., 22, 1200 (1976).
D.M. Hailey. J. Chromatogr., 98, 527 (1974).
A.K. Dhar and H. Kutt. Clin. Chem., 25, 137 (1979).
J.A.F. de Silva, I. Bekersky, C.V. Puglisi, M.A. Brooks, andR.E. Weinfeld. Anal. Chem., 48, 10 (1976).
J.L. Ferguson and D. Couri. J. Anal. Toxicol., 1, 171 (1977).
R.E. Weinfeld, H.N. Posmanter, K.C. Khoo, and C.V. Puglisi.J. Chromatogr., 143, 581 (1977).
M. Linnoila and F. Dorrity, Jr. Acta Pharmacol. Toxicol.,41, 458 (1977).
A. Viala, J.-P. Cano, J.-P. Reynier, and R. Rispe. J. Chro-matogr., 147, 349 (1978).
D. Haidukewych, E.A. Rodin, and R. Davenport. Clin. Chem.,26, 142 (1980).
J.J. De Gier and B.J. 't Hart. J. Chromatogr., 163, 304 (1979).
D.J. Greenblatt. Clin. Chem., 24, 1838 (1978).
H.H. McCurdy, E.L. Slightom, and J.C. Harrill. J. Anal. Toxi-col., 3, 195 (1979).
B.M. Yehia, J.S. Oliver and A. Mackay. Vet. Hum. Toxicol.,21 (Suppl.), 167 (1979).
M.G. Horning, W.G. Stillwell, J. Nowlin, K. Lertratanangkoon,D. Carroll, I. Dzidic, R.N. Stillwell, and E.C. Horning. J.Chromatogr., 91, 413 (1974).
M.S. Greaves. Clin. Chem., 20, 141 (1974).
R.C. Baselt, C.B. Stewart, and S.J. Franch. J. Anal. Toxicol.,1, 10 (1977).
148
57. A.G. Howard, G. Nickless, and D.M. Hailey. J. Chromatogr.,90, 325 (1974).
58. G. Banelli and P. Marini. Boll. Chim. Unione Ital. Lab. Prov.,2, 310 (1976).
59. L.B. Foster and C.S. Frings. Clin. Chem., 16, 177 (1970).
60. H. Sawada, A. Hara, S. Asano, and Y. Matsuaoto. Clin. Chem.,22, 1596 (1976).
61.
62.
P.J. Howard. J. Pharm. Pharmacol., 30, 136 (1978).
B.J. Gudzinowicz and M.J. Gudzinowicz, Analysis of Drugs andMetabolites by Gas Chromatography-Mass Spectrometry, Vol. 2:Hypnotics, Anticonvulsants, and Sedatives. Marcel Dekker,New York, ch. 2, VII (1977).
63. A.F. Fentiman, Jr. and R.L. Foltz. J. Labelled Compounds andRadiopharmaceuticals, 13, 579 (1977).
149

Chapter 10
Amphetamine
For many centuries the khat plant has been cultivated in the MiddleEast for its central nervous system (CNS) stimulating properties.A synthetic relative of the khat alkaloids, amphetamine ( - methyl-phenethylamine, I) was first produced in 1887, but its psychophar-macological properties were not described until 1927 (1). For thenext 30 years, medical use of amphetamine (as a bronchodilator, asan appetite suppressant, in the treatment of hyperkinesis in chil-dren, and for narcolepsy) was extensive (2), but by 1967 the poten-tial for abuse of the drug was causing widespread concern. Regularoral use of amphetamine can cause paranoid psychosis and a dis-abling dependence, and intravenous use is even more likely to leadto these effects. Primarily because of an initial euphoria, especi-ally following intravenous injection, amphetamine has become a ma-jor drug of abuse. Appetite suppression, insomnia, sudden changesin mood, and compulsiveness are the common results of even mod-erate amphetamine use. Tolerance develops rapidly, so that increas-ing doses are required to achieve the desired stimulation (3).
Amphetamine is marketed for medical purposes as Dexedrine (d-amphe-tamine) and as Benzedrine (d,l-amphetamine), or in combination with
a barbiturate (e.g. Dexamyl, d-amphetamine + amobarbital) (4). How-ever, because of the relative ease of manufacture, illicit prepar-ations of amphetamine are common in “street” use. As a result, con-taminants are often present. Significant quantities of zinc (1-2percent) have been found in some illicit samples, as well as poly-condensation products whose pharmacological and toxicological pro-perties are unknown (5), although there is evidence that the inten-sity of euphoria following intravenous injection may depend on con-taminants (3). Severe reactions can occur in nontolerant personsfollowing a dose of 30 mg of amphetamine, while persons who havedeveloped tolerance can endure doses of 400-500 mg. While truephysical dependence has not been proven, very strong psychologicalhabituation to amphetamine is common. In its extreme form, the“speed cycle” of heavy intravenous use for days at a time results
150
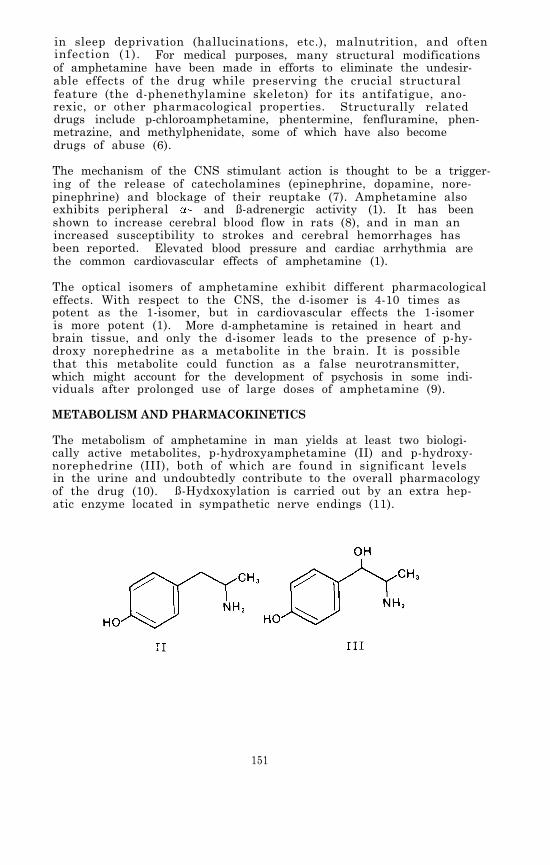
in sleep deprivation (hallucinations, etc.), malnutrition, and ofteninfection (1). For medical purposes, many structural modificationsof amphetamine have been made in efforts to eliminate the undesir-able effects of the drug while preserving the crucial structuralfeature (the d-phenethylamine skeleton) for its antifatigue, ano-rexic, or other pharmacological properties. Structurally relateddrugs include p-chloroamphetamine, phentermine, fenfluramine, phen-metrazine, and methylphenidate, some of which have also becomedrugs of abuse (6).
The mechanism of the CNS stimulant action is thought to be a trigger-ing of the release of catecholamines (epinephrine, dopamine, nore-pinephrine) and blockage of their reuptake (7). Amphetamine alsoexhibits peripheral - and ß-adrenergic activity (1). It has beenshown to increase cerebral blood flow in rats (8), and in man anincreased susceptibility to strokes and cerebral hemorrhages hasbeen reported. Elevated blood pressure and cardiac arrhythmia arethe common cardiovascular effects of amphetamine (1).
The optical isomers of amphetamine exhibit different pharmacologicaleffects. With respect to the CNS, the d-isomer is 4-10 times aspotent as the 1-isomer, but in cardiovascular effects the 1-isomeris more potent (1). More d-amphetamine is retained in heart andbrain tissue, and only the d-isomer leads to the presence of p-hy-droxy norephedrine as a metabolite in the brain. It is possiblethat this metabolite could function as a false neurotransmitter,which might account for the development of psychosis in some indi-viduals after prolonged use of large doses of amphetamine (9).
METABOLISM AND PHARMACOKINETICS
The metabolism of amphetamine in man yields at least two biologi-cally active metabolites, p-hydroxyamphetamine (II) and p-hydroxy-norephedrine (III), both of which are found in significant levelsin the urine and undoubtedly contribute to the overall pharmacologyof the drug (10). ß-Hydxoxylation is carried out by an extra hep-atic enzyme located in sympathetic nerve endings (11).
151

Metabolic N-oxidation of amphetamine has also been reported (12).The hydroxylamine (IV) is unstable and is quickly converted bychemical or metabolic processes to the oxime (V) and to phenylace-tone (VI).
Based on the report that 30 percent of an administered dose of d-amphetamine in human subjects was found to be excreted as unchangeddrug, 3 percent as II (free and conjugated), 3 percent as phenyla-cetone, 20 percent as free and conjugated benzoic acid, and 5 per-cent as III, deamination seems to be the predominant metabolicroute in man, although p-hydroxylation is the primary route in rats.Deamination is catalyzed by a liver microsomal enzyme that requiresreduced NADP (9). Deamination is stereoselective; the S-(+)-isomerof amphetamine is preferentially metabolized (11).
The pKa of amphetamine is 9.77 (13), so it is ionized at physiolo-gical pH; nevertheless, it does readily penetrate the blood-brainbarrier. Excretion of the unchanged drug has been shown to fluc-tuate from 10 percent to 60 percent with changes in urinary pH (14).A computerized method of predicting excretion curves (and by exten-sion, body concentrations) has been developed (15).
Pharmacokinetic studies in humans have confirmed that the drug hasa high extravascular concentration in the body. In one of thesestudies, peak blood concentrations (~35 ng/ml) were reached about2 hr after ingestion of 10 mg of d-amphetamine sulfate, followedby an exponential decline over the next 48 hr, with a plasma elimi-nation half-life of 11-13 hr. Mean total urinary recovery of un-changed drug was 45 percent of the ingested dose (16). Anotherreport indicated an 8 hr plasma half-life for human subjects onan acid diet, but 22 hr when on an alkaline diet (9). In a studyinvolving patients with amphetamine psychosis, the intensity ofpsychosis correlated with the concentration of basic polar meta-bolites of the drug in urine but not with the amphetamine concen-tration in plasma. Amphetamine metabolism in these patients wasfollowed with the aid of a tritium-labeled analog of the drug. Un-der metabolic conditions producing acid urine (pH <6.6), renal eli-mination of unchanged drug (67-73 percent of the dose) was associ-ated with a plasma elimination half-life of 7-14 hr and a rapidreduction in psychotic symptoms. In patients with alkaline urine,the plasma half-life of amphetamine was 18-34 hr, psychosis was oflonger duration, and hydroxylated metabolites in urine accounted
152

for 6-13 percent of the dose as compared with 3-8 percent inacidic urine (17).
In a study using rats as models, inhibition of metabolism increasedthe brain concentration of amphetamine by a factor of 5, indicatingthat metabolism is more important than renal excretion as the routeof elimination of amphetamine, at least in that species (18). Inhuman subjects receiving 1500 mg of ascorbic acid daily prior toamphetamine administration, the 24-hr excretion of a single 30 mgdose of drug was decreased by an average of 38 percent, regardlessof urinary pH, although the acute pharmacological effects of thedrug were not altered by the ascorbic acid pretreatment. Therewas no increase in hydroxylated metabolites to account for thesmaller quantity of amphetamine excreted (19).
A definitive compendium of information on the pharmacology and meta-bolism of amphetamine was published in 1970 (20), and an extensivereview of amphetamine metabolism in mammals, including man, appearedin 1976 (11).
ANALYTICAL METHODOLOGY
The development of methods sufficiently sensitive, specific, andreproducible for the identification and measurement of amphetaminein biological fluids is important because there is a need to esta-blish therapeutic dosages and plasma concentrations, to understandtolerance and the stereoisomeric effects, to carry out toxicitystudies, and simply to identify drug users. The concentrations ofamphetamine found in urine, even after small doses, are high enoughto be detected by most methods available to clinical laboratories.However, plasma concentrations are usually in the 5-100 ng/mlrange. Techniques used have included ultraviolet spectrophotometry(UV), thin-layer chromatography (TLC), fluorometry, immunoassay,gas chromatography (GC), and combined gas chromatography/mass spec-trometry (GC/MS).
A quantitative UV method, with the advantages of relative speed andsimplicity for screening purposes, was reported in 1968. The amphe-tamine extract from urine, blood, or tissue homogenate was oxi-dized with ceric sulfate, using 0.8 N HCl as a catalytic agent, toform a reaction product with a well-defined UV absorption curve( max 287 nm, ,min 253 nm in hexane). Sensitivity was 0.5 µg/ml,but the method was unable to distinguish between amphetamine andmethamphetamine (21).
Until the early 1970’s, fluorometry was the most widely used methodfor the quantitative analysis of biogenic amines and amphetamines.A fluorometric method, based on conversion of amphetamine to its dihy-drolutidine derivative, utilized an automated continuous-flow appar-atus for extraction of the derivatized drug from urine (22). Thedetection limit was 0.15 µg/ml, but 2-phenylethylamine and 2-amino-heptane gave false positive reactions, Fluorometry combined withTLC is widely used, especially for screening urine specimens foramphetamine. For example, the drugs in urine can be separatedand concentrated by XAD-2 resin, chromatographed on silica gel in
153

a suitable solvent system, and sprayed with a color reagent. Se-quential spraying with ethanolic ninhydrin-phenylacetaldehyde, aque-ous sodium phosphate, and then p-dimethylaminobenzaldehyde has beenshown to distinguish amphetamine from other primary amines of for-ensic and toxicological interest such as mescaline, DOM, phenyl-propanolamine, ß-phenethylamine, benzocaine, chlorphentermine , andprocaine. A final spray with chromotropic acid was found to benecessary to distinguish amphetamine from 3,4-methylenedioxyamphet-amine (MDA). A 2 µg detection limit for amphetamine was reportedfor this technique (23). A Fluorescamine (4-phenyl- spiro [furan-2(H)-1’-phthalen]- 3,3'dione) spray reagent was found to be moresensitive than ninhydrin, detecting 250 ng of amphetamine in urineextracts following TLC. Methamphetamine does not react with Fluore-scamine (24). The Fluorescamine technique was adapted to in situspectrodensitometry of thin-layer chromatograms for quantitationof amphetamine in urine extracts without elution. A solvent sys-tem of ethyl acetate:methanol:water:ammonia (85:13.5:10:0.5) wasused to separate amphetamine from extraneous fluorescent material.A concentration of 0.25 µg/ml was detectable (25). 4-Chloro-7-nitrobenzo-2,1,3-oxadiazole (NBD-Cl) has also been used to form afluorescent derivative of amphetamine in urine and blood extractsbefore separation by TLC, and the fluorescence intensity used as aquantitative measure of the amphetamine present. Sensitivity issufficient for measurement of therapeutic concentrations in blood(10-100 ng/ml) (26). Although any primary or secondary amine willyield a fluorescent derivative with NBD-Cl, TLC analysis using atwo-solvent system [e.g., pentane: ethyl ether (1:1) or methanol:carbon tetrachloride (80: 30)] can be used to separate amphetaminefrom compounds likely to yield false results (27).
Some assays developed for amphetamine do not require chromatographicseparation. As little as 10 ng/ml of amphetamine in plasma was de-tected by an enzyme assay based on the N-methylation of the drugto form radioactive methamphetamine by means of a rabbit lung N-methyltransferase and S-adenosyl-L-[methyl-3H] methionine as methyldonor. Sensitivity, specificity, and reproducibility were achievedby a combination of several extraction and drying procedures usedprior to liquid scintillation counting (28).
For large numbers of samples or for rapid screening, immunologicaltechniques are often the method of choice. They do not requireextensive extraction of biological materials or a high degree ofskill in operation. Radioimmunoassay (RIA) depends upon competitionbetween the unlabeled drug in the sample and a known amount of radio-labeled drug for the binding sites on specific drug antibodies inrabbit serum. The antibody in some RIA assays for amphetamine bindsequally well with methamphetamine, but the method can detect 30ng/ml of amphetamine in urine (29). A single RIA takes about 40min, but several samples can be run concurrently (30). The othercommon immunoassay, HIT, is based on the linkage of an enzyme(lysozyme) to the amphetamine molecule to form the antigen reagent.Antibody binds the drug and its attached enzyme, inactivating thelysozyme. Any free amphetamine present in the sample competes withthe drug-enzyme complex for antibody binding sites; while unboundenzyme is then free to hydrolyze the cell walls of bacteria used as
154
an indicator in the assay. The clearing of the cell walls suspension(decrease in absorbance) is proportional to the amount of enzymelabel displaced from the antibody and hence to the amount of com-peting free drug present in the specimen. EMIT cannot presentlybe used for blood, and it is subject to interference by lysozymenaturally present in some urine samples and to false negativesbecause of inactivation of enzyme in alkaline urines. However,it takes only one minute to perform, it is as sensitive and spe-cific as RIA, and it gives semiquantitative results based on calibra-tion graphs (30).
Gas chromatography (GC) has been used at least since 1969 for mea-surement of amphetamine in urine and blood. Gas chromatographyof extracts, after addition of N,N-dimethylaniline as an internalstandard, on a column coated with 5 percent KOH + 10 percent Car-bowax 6000 and using a flame ionization detector (FID), was sensi-tive enough to detect 0.1 µg/ml of amphetamine in urine (31). Arapid GC method developed for routine use in urine screening incor-porated diethylamine as the internal standard and confirmation bypreparation of a ketone derivative of amphetamine. Detection limitswere 0.01 ng/ml (32). For quantitation of amphetamine in blood byGC a number of specific steps were recommended. These includedthe use of Teflon-coated glassware to minimize absorption, coextrac-tion with a scavenger amine (diethylamine), formation of the non-volatile HCl salt, preparation of the trifluoroacetamide derivative,and use of an internal standard (1-adamantanamine HCl). This com-bination of conditions gave a nearly complete (98 percent) recoveryof amphetamine from blood, and concentrations of 10-100 ng/ml weremeasurable (33).
Because of the sensitivity limits of the flame ionization detector,electron capture detection (ECD) after formation of suitable deri-vatives offers advantages over FID for GC assay of the very lowconcentrations of amphetamine often present in blood samples. Theheptafluorobutyl (34), trichloroacetamide (35), and N-acetyl (36)derivatives, among others, have been reported for this purpose. On-column acylation of amphetamine with N- (trifluoroacetyl) imidazole,or with N-(heptafluorobutyryl) imidazole, has also been reported.The derivatives were formed quantitatively and reproducibly, mak-ing the technique suitable for quantitative analysis. The imidazolereagents have the advantage over acyl chlorides or acid anhydridesin that no acids are released into the chromatographic system (37).A comparison study of the ECD response of several fluorinated am-phetamine derivatives indicated that a sensitivity of 10 pg for thepentafluorobenzamide derivative was possible using a 63Ni detector,but pure compounds and not biological extracts were used in thestudy (38). GC-ECD of the trichloroacetate derivative, also usinga 63Ni detector, was able to measure concentrations of amphetamineas low as 5 ng/ml in plasma (39). Although EC detectors may im-prove sensitivity, they can have the disadvantages of excessivebackground or of severe quenching due to water and solvent. Pre-liminary studies of the analysis of amines by GC-ECD, using modelcompounds such as phenethylamine and utilizing glass capillary col-umns, have suggested that the high resolving power of capillarycolumns could improve quantitative analysis at the subnanogram level
155
328-011 0 - 80 - 11
of neurotransmitters and related compounds like amphetamine (40).
GC analysis of the metabolite N-hydroxyamphetamine is difficultbecause of its instability under normal GC conditions, but the de-composition has been shown to be the result of catalytic activityof the solid support rather than thermal conditions or oxidationin the column. Direct GC analysis was found to be possible withoutderivatization, by the use of a column containing 0.2 percent Car-bowax 20M with glass beads as support material, operated at 100°C(41).
For selected ion monitoring analysis of drugs and metabolites inbiological fluids preparation of derivatives is often desirable inorder to achieve better gas chromatographic characteristics andto generate ions in the mass spectrometer which are more suitablethan those generated by the parent drug. Acetylation, trimethyl-silylation (TMS), and perfluroacylation give amphetamine derivativeswhich show good GC and MS characteristics (39).
Some acetylation procedures call for reaction times of up to severalhours and are therefore unsuitable for rapid analyses. Recently,a rapid and quantitative acetylation of amphetamine was reportedin which trifluoroacetic anhydride was used in the presence of mer-curic trifluoroacetate as a catalyst. The reagent acts on amphe-tamine in the form of either the free base or salt, and the methodrequires no prior extraction of street drug samples to remove adul-terants. Application of this derivatization procedure to GC/MSanalysis allowed detection of amphetamine at the picomole level,within about 10 min total analysis time (42).
For purposes of mass spectral identification of primary amines inurine samples, isothiocyanate derivatives have been shown to possesssome advantages over TMS derivatives because of a fragmentation pat-tern which eliminates a CNS-containing radical from the molecularion and allows for charge retention on the moiety containing thephenyl group (43). The isothiocyanate derivative of amphetamineis claimed to be even more stable than the trifluoroacetamide deri-vative. By monitoring the molecular ion of the isothiocyanatederivative a signal-to-noise ratio of 3:1 was achieved for 1 nginjected on column (44).
Dansylation of amphetamine with 5-dimethylamino-1-naphthalene sul-fonyl chloride yields a UV-absorbing derivative which was employedin an assay for amphetamine in urine and tissue homogenates. Am-phetamine- 2H5 was added to urine (pH 10) before extraction and dan-sylation. A benzene extract of the dansyl-amphetamine was chroma-tographed on thin-layer plates developed with benzene:triethyla-mine (8:1), and the zone identified by UV spectroscopy (365 nm)was eluted with ethyl acetate, dried, and chromatographed on ano-ther plate (petroleum ether:toluene:acetic acid:water, 133:67:170:30 v/v). The final extract was analyzed by high resolution massspectrometry using selected ion monitoring. A linear relationshipbetween amphetamine concentration and ion current response was es-tablished over the range 5 pg to 500 ng, and as little as 0.1 ng/mlof amphetamine was detectable in urine. However, because the inter-
156
nal standard was of poor isotopic purity, reliability of the methodsuffered at concentrations lower than 2 ng/ml (45).
In a GC/MS procedure involving quantitation of amphetamine as theisothiocyanate derivative, amphetamine-2H5 and ß-methylphenethyla-mine were compared as internal standards. The two internal stan-dards were reported to give comparable results (44).
A comparison of an RIA and a GC/MS assay for amphetamine showedthat the GC/MS method was about twice as sensitive and gave bet-ter precision than the RIA method, However, taking into consid-eration factors such as cost, time, and degree of training re-quired to perform the assays, RIA performed in duplicate or tripli-cate was recommended for routine measurements. The measured con-centrations in unknown samples by both techniques showed a goodcorrelation, lending confidence in the accuracy of both methods(46).
The optical isomers of amphetamine can be separated by formationof a N-trifluoroacetyl-L-prolyl derivative and separation of thediastereoisomers by TLC. For qualitative purposes, such as foren-sic differentiation of illicit samples (47), the individual isomerscan be measured in urine (48). However, GC/MS, with its high in-herent sensitivity, has provided the first means of studying thestereochemical profile of amphetamine in human plasma and salivaat ng/ml concentrations following oral administration of 10 mgof racemic amphetamine. The drug, following extraction, was deri-vatized by reaction with a chiral agent, N-pentafluorobenzoyl-S-(-)-prolyl-1-imidazole. The resulting diastereoisomers were easily re-solved by capillary GC (5 percent OV-275 coated on Chromosorb W-AW)and quantitated by chemical ionization mass spectrometry using meth-ane as the reagent gas. Amphetamine-2H2 served as the internalstandard (49). An analytical procedure developed for simultaneousdetermination of the concentrations of amphetamine enantiomers inrat urine also utilized GC/MS with selected ion monitoring, butused the N-(S)- -methoxy- -(trifluoromethyl)phenylacetyl derivativeand amphetamine labeled with deuterium on the methyl group as theinternal standard (50).
A general method for extraction of amphetamine from biological mat-erials involves adjustment of the pH to about 10-12 and subsequentextraction with an organic solvent or elution from ion exchange col-umns. The latter is not as selective and the resulting extracts showmany extraneous peaks, so the solvent extraction method is preferredfor GC analysis. Solvents used have included chloroform (22) orchloroform: isopropanol (96: 4) (24); pentane (28); diethyl ether, forwhich recoveries of 70-75 percent from blood and 83 percent fromurine have been reported (26,32,51); hexane (89 percent from blood,97 percent from urine) (21,49), or hexane:isooctane (75:25 v/v) (35);and benzene (33,52). Amphetamine is about 15 percent bound to plasmaproteins, but both free and bound forms are extracted equally well,suggesting that losses in recovery are mainly a consequence of thedrug’s high volatility. Mild conditions are therefore essentialfor evaporation of the solvent (51).
157

EXPERIMENTAL PROCEDURE
The experimental procedure for extraction, derivatization, and GC/MS analysis of amphetamine is identical to the procedure describedin Chapter 9 for analysis of methamphetamine except for the inter-nal standard (amphetamine-2H3 is used instead of methamphetamine-2H5) and the specific ions monitored. Consequently, the concentra-tions of both drugs can be measured simultaneously by adding deu-terated analogs of the two drugs to the biological sample for useas internal standards. Then during data acquisition, the ion cur-rents at four m/z values are monitored. These are m/z 232, 235,246, and 251, which correspond to the protonated molecule ions forthe trifluoroacetamide derivatives of amphetamine, amphetamine-2H3,methamphetamine, and methamphetamine-2H5, respectively.
Standards and Reagents
d-Amphetamine hydrochloride can be purchased from Applied ScienceLaboratories, State College, PA 16801, for preparation of standardsolutions. The amphetamine-2H3 hydrochloride used in the develop-ment of this procedure was synthesized by a literature procedure(53). The deuterium-labeled amphetamine had an isotopic purity of99.9 percent (2H3).
For the purpose of preparing calibration graphs and working standards,stock solutions of amphetamine and amphetamine-2H3 are prepared asfollows. Weigh into a 100-ml volumetric flask about 12.6 mg ofamphetamine hydrochloride and record its weight to the nearest 0.1mg The equivalent weight of free base is calculated by multiply-ing the weight of amphetamine hydrochloride by 0.79. Dissolve themeasured amphetamine in about 75 ml of methanol and then add addi-tional methanol to give exactly 100 ml of solution. In the followingparagraphs this solution will be referred to as the “0.10-mg/ml stocksolution” although it should be labeled with its actual concentra-tion based upon the exact measured weight of amphetamine hydrochlo-ride. A series of working standard solutions can be prepared byappropriate dilution of this stock solution as described in Chapter 2.
The stock solution of amphetamine-2H3 is prepared in the same manner.For the measurement of amphetamine in body fluids within the concen-tration range 1 to 500 ng/ml, addition of approximately 40 ng of theinternal standard to each ml of specimen is satisfactory. This canbe conveniently done by adding 100 µl of a 400-ng/ml amphetamine-2H3 methanolic solution to each ml of specimen. Prepare the 400-ng/ml internal standard solution by diluting 1 ml of the 0.10-mg/mlstock solution of amphetamine-2H3 to 250 ml with methanol.
Store stock and standard solutions in well-stoppered or capped glassvessels in the dark at less than 0°C.
Extraction
Transfer 1 ml of the specimen (whole blood, plasma or urine) to a20-ml culture tube equipped with a Teflon-lined screw cap (0.5 to 2ml of specimen can be used, but it must be measured accurately).
158
Add 100 µl of the 400-ng/ml amphetamine-2H3 soiution and vortexfor about 10 sec. Allow the sample to equilibrate for about 15min and then increase the pH to greater than 10 by adding 1 ml ofK2CO3-saturated distilled water. Extract the basic mixture with5 ml of 1-chlorobutane by gently mixing the contents for 30 minusing a motorized rocker or rotator. Centrifuge for 5 min and thentransfer the organic phase (top) to another 20-ml culture tube bymeans of a disposable Pasteur pipette. Extract the amphetamineand other organic bases from the organic phase into aqueous acidby adding 3 ml of 0.2 N H2SO4 and gently mixing for at least 15min. Centrifuge and remove the top organic phase by aspiration.Add 0.5 ml of 10 N NaOH to the aqueous phase, mix the contents, andcheck the pH to make certain the solution is strongly basic (pH > 10).Finally, reextract the organic bases from the aqueous alkaline solu-tion by adding 5 ml of methylene chloride and gently mixing for atleast 15 min. Centrifuge for 5 min, aspirate off the upper aqueouslayer, and transfer by means of a disposable Pasteur pipette themethylene chloride extract (bottom layer) to a silylated concentra-tor tube having a volume of at least 5 ml, a conical bottom, and aTeflon-lined screw cap. Add 10 µl of dimethylformamide to act asa “keeper solvent” to minimize evaporative loss of the amphetamine.Remove the methylene chloride by evaporation under a gentle streamof nitrogen or filtered air while heating the tube to no higherthan 40°C. When the volume of extract has decreased to about 10µ1, add 15 µl of N-methyl bis- (trifluoroacetamide) “MBTFA” (PierceChemical Co., Rockford, IL 61105). Cap the tube and heat it at70°C for 15 min. The capped tube can be stored under refriger-ation until the GC/MS analysis is ready to be performed. Immedi-ately before the analysis, allow the tube to warm to room tempera-ture.
GC/MS Analysis
The experimental conditions for the GC/MS analysis for amphetaminetrifluoroacetamide are as follows:
GC column: 1.8 m x 2 mm (I.D.) glass column packed with3 percent OV-17 on 100/120 mesh Gas Chrom Q(Applied Science Laboratory, State College,PA 16801).
Carrier andreagent gas: Methane, 15-20 ml/min
Temperatures: Injector, 260°CColumn, 120°C, isothermalGC/MS transfer line, 260°CIon source, 160°C
Under these conditions, the amphetamine trifluoroacetamide shouldelute in 2 to 4 min as a narrow, symmetrical peak.
prior to beginning GC/MS analysis of samples, the performance ofthe total GC/MS system should be evaluated and optimized as des-cribed in Chapter 2. The ions to be monitored occur at m/z 232 and235. They correspond to the protonated molecule ions for ampheta-
159

tamine trifluoroacetamide and amphetamine-2H3 trifluoroacetamide,respectively. With the divert valve in the divert position, in-ject 2 to 6 µl of the organic extract into the gas chromatograph.After approximately 1 min, switch the divert valve so that the en-tire carrier gas flow enters the ion source of the mass spectro-meter, and begin data acquisition. When the amphetamine trifluoro-acetamide peak has eluted, cease data acquisition and return thedivert valve to the divert position.
The quantity of amphetamine in the specimen is determined by mea-suring the heights (or areas) or the amphetamine trifluoroacetamideand amphetamine-2H3 trifluoroacetamide peaks in the selected ioncurrent profiles (“ion chromatograms”) and relating the ratio ofpeak heights to a calibration graph. Calculate the concentration ofamphetamine in the specimen by dividing the measured quantity ofamphetamine by the exact volume of specimen extracted.
Discussion of the Experimental Procedure
The electron impact (EI) and chemical ionization (CI) mass spectraof amphetamine trifluoroacetamide are shown in Figure 1. The mostabundant ions in the CI mass spectra correspond to the protonatedmolecule ion (m/z 232) and the ammonia-attachment ion (m/z 249), de-pending on whether methane alone or methane and ammonia are usedas reagent gases. Even though the procedure specifies use of meth-ane alone as the reagent gas, the combination of methane and ammoniais also satisfactory and should provide slightly better sensitivity.Perhaps most important is the fact that the methane and ammonia com-bination offers an opportunity to monitor a different pair of ionmasses if interferences are encountered at m/z 232 or 235 when me-thane alone is used.
An additional option which can be explored if interferences are en-countered in the selected ion monitoring measurements, is to gener-ate a derivative different from the trifluoroacetamide. For exam-ple, the acetamide derivative could be prepared by substitutingN-acetylimidazole for the N-methyl bis-(trifluoroacetamide). Also,the pentafluoroacetamide or heptafluorobutyramide derivatives couldbe used. The trifluoroacetamide derivative has proven satisfactory,but the use of other derivatives has not been fully evaluated.
A potential problem associated with concentration of organic extractscontaining amphetamine is the loss of the drug through evaporationbecause of its relatively high volatility. For this reason, someamphetamine assay procedures specify addition of an acid to convertthe drug to a nonvolatile salt prior to concentration of the extract.In the procedure described here, losses due to evaporation are mini-mized by the following means. First, methylene chloride is used inthe final extraction because it has a lower boiling point (39°C)than 1-chlorobutane (78°C). Second, a small quantity of dimethyl-formamide is added just prior to evaporative concentration to actas a “keeper solvent.” If these procedures are followed and careis taken not to allow the concentrated residue to remain at an ele-vated temperature for an extended period, no more than 20 percent ofthe amphetamine should be lost due to evaporation.
160
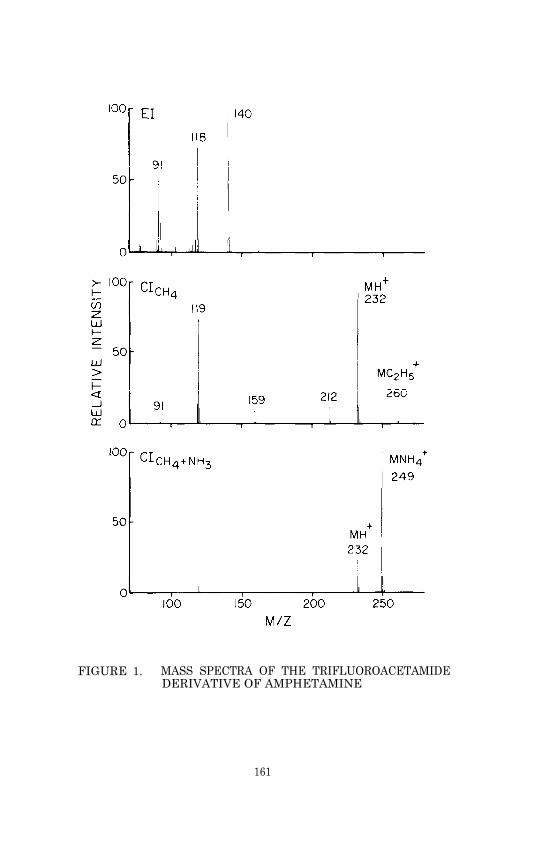
FIGURE 1. MASS SPECTRA OF THE TRIFLUOROACETAMIDEDERIVATIVE OF AMPHETAMINE
161

PHYSICAL, CHEMICAL AND SPECTROMETRIC DATA FOR AMPHETAMINE
Nomenclature
Chemical Name: -Methylphenethylamine
Empirical Formula: C9H13N
Chemical Abstracts Registry Number: 300-62-9
Trade Names: Actedron, Allodene, Benzedrine, Adipan, Sympatedrine,Psychoedrine, Isomyn, Isoamyne, Mecodrin, Norephedrone,Novydrine, Elastonon, Ortedrine, Phenedrine, Profamina,Propisamine, Sympamine, Simpatedrin
Physical Constants
Appearance: Colorless liquid
Boiling Point: 200-203° (760 mm); 82-85° (13 mm)
Solubility of the free base: Slightly soluble in water; solublein acid, alcohol, and ether
pKa: 9.77
Specific Rotation: d- -methylphenethylamine sulfate = +21.8°(c=2)
REFFRENCES
1.
2.
3.
4.
5.
6.
7.
8.
9.
J.B. Hart and J. Wallace. Clin. Toxicol., 8, 179 (1975).
Unsigned. Brit. Med. J., 1, 476 (1975).
J.C. Kramer. J. Psychedelic Drugs, 2, 8 (1969).
M. Lampe. Drugs: Information for Crisis Treatment. STASHPress, Beloit, WI, p. 9 (1972).
J.N. Lomonte, W.T. Lowry, and I.C. Stone. J. Forensic Sci., 2,575 (1976).
J.H. Biel, in E. Costa and S. Garattini, eds., Amphetaminesand Related Compounds. Raven Press, New York, p. 3 1970).
A. Carlsson, in E. Costa and S. Garattini, eds., Amphetaminesand Related Compounds. Raven Press, New York, p. 289 (1970).
C. Carlsson, M. Hagerdal, and B.K. Siesjö. Acta Physiol.Scand., 94, 128 (1975).
J. Axelrod, in E. Costa and S. Garattini, eds., Amphetaminesand Related Compounds. Raven Press, New York, p. 207 (1970).
162
10.
11.
12.
13.
14.
15.
16.
17.
18.
19.
20.
21.
22.
23.
24.
25.
26.
27.
28.
29.
30.
L.G. Dring, R.L. Smith, and R.T. Williams. J. Pharm.Pharmacol., 18, 402 (1966).
J. Caldwell. Drug Metab. Revs., 5, 219 (1976).
A.H. Beckett, H.T. Coutts, and F.A. Ogunbona. J. Pharm.Pharmacol., 25, 708 (1973).
A.H. Beckett and S. Al-Sarraj. J. Pharm. Pharmacol., 25,328 (1973).
J.W. Gorrod. Life Sci., 13, lviii (1973).
A.H. Beckett, R.N. Boyes, and G.T. Tucker. J. Pharm. Pharmacol.,20, 277 (1968).
M. Rowland. J. Pharm. Sci., 58, 508 (1969).
E. Änggård, L.-E. Jonsson, A.-L. Hogmark, and L.-M. Gunne.Clin. Pharmacol. Ther., 14, 870 (1973).
A.K. Cho, B.J. Hodshon, B. Lindeke, and G.T. Miwa. J. Pharm.Sci., 62, 1491 (1973).
M.P. Kullberg and J.D. Griffith. Fed. Proc., 35, 565 (1976).
E. Costa and S. Garattini, eds., Proc. Int. Symp Amphetaminesand Related Compounds. Raven Press, New York (1970).
J.E. Wallace, J.D. Biggs, and S.L. Ladd. Anal. Chem., 40,2207 (1968).
T.S. Hayes. Clin. Chem., 19, 390 (1973).
K.J. Bussey and R.C. Backer. Clin. Chem., 2, 302 (1974).
B. Klein, J.E. Sheehan, and E. Grunberg. Clin. Chem., 20,272 (1974).
J. Sherma, M.F. Dobbins, and J.C. Touchstone. J. Chromatogr.Sci., 12, 300 (1974).
F. Van Hoof and A. Heyndrickx. Anal. Chem., 46, 286 (1974).
T.J. Hopen, R.C. Briner, H.G. Sadler, and R.L. Smith. J.Forensic Sci., 21, 842 (1976).
D.S. Kreuz and J. Axelrod. Science, 183, 420 (1974).
A. Castro and H. Malkus. Res. Commun. Chem. Pathol. Pharmacol.,16, 291 (1977).
R.O. Bost, C.A. Sutheimer, and I. Sunshine. Clin. Chem., 22,789 (1976).
163

31. K.D.R. Setchell and J.D.H. Cooper. Clin. Chim. Acta, 35,67 (1971).
32.
33.
34.
35.
36.
37.
38.
39.
40.
41.
42.
43.
44.
45.
46.
47.
48.
49.
50.
51.
52.
J.E. O'Brien, W. Zazulak, V. Abbey, and O. Hinsvark. J. Chrom-atogr. Sci., 10, 336 (1972).
R.B. Bruce and W.R. Maynard, Jr. Anal. Chem., 41, 977 (1969).
J.S. Noonan, P.W. Murdick, and R.S. Ray. J. Pharmacol. Exp.Ther., 168, 205 (1969).
P.A. Toseland and P.H. Scott. Clin. Chim. Acta, 25, 75 (1969).
G. Brugaard and K.E. Rasmussen. J. Chromatogr., 147, 476(1978).
G.R. Wilkinson. Anal. Lett., 3, 289 (1970).
E. Änggård, in E. Costa and S. Garattini, eds., Amphetaminesand Related Compounds. Raven Press, New York, p. 191 (1970).
J.J. Franken and M.M.F. Trijbels. J. Chromatogr., 91, 425(1974).
A.H. Beckett and R. Achari. J. Chromatogr., 135, 200 (1977).
A. Wu. Clin. Toxicol., 8, 225 (1975).
N. Narasimhachari and P. Vouros. Anal. Biochem., 45, 154(1972).
N. Narasimhachari, R.O. Friedel, F. Schlemmer, and J.M. Davis.J. Chromatogr., 164, 386 (1979).
T.J. Danielson and A.A. Boulton. Biomed. Mass Spectr., 1, 159(1974).
K.H. Powers and M.H. Ebert. Biomed. Mass Spectr., 6, 187 (1979).
D. Eskes. J. Chromatog., 117, 442 (1976).
L.-M. Gunne. Biochem. Pharmacol., 16, 863 (1967).
S.B. Matin, S.H. Wan, and J.B. Knight. Biomed. Mass Spectr.,4, 118 (1977).
J. Gal. Biomed. Mass Spectr., 5, 32 (1978).
D.B. Campbell. J. Pharm. Pharmacol., 21, 129 (1969).
A.K. Cho, B. Lindeke, B.J. Hodshon, and D.J. Jenden. Anal.Chem., 45, 570 (1973).
B. Lindeke and A.K. Cho. Acta Pharm. Suecica, 9, 363 (1972).
164

Chapter 11
Methamphetamine
The first synthesis of methamphetamine ( d -N, -dimethylphenethyla-mine, I), a potent central nervous systerm stimulant, was reportedin 1919 (1). Methamphetamine has since been used clinically as ananaleptic to counteract alcohol, barbiturate, or narcotic stupor,and also during surgery to maintain the blood pressure of patientsunder anesthesia (2). Clinical use of the drug has declined inrecent years but methamphetamine continues to be abused. It isavailable on the street as Methedrine tablets or as illicit pre-parations which are often injected intravenously. Like other stim-ulants of the amphetamine group, methamphetamine produces an initialstate of euphoria. However, this feeling is followed by restless-ness, agitation, irritability and sometimes extreme paranoia, aswell as depression and exhaustion as the stimulant effects of thedrug wear off. In consequence there is a strong tendency to con-tinue use in order to maintain the “high” and avoid the unpleasantafter-effects. Tolerance develops rapidly following repeated useand increasing doses are required to maintain the original levelof stimulation. Physical dependence has not been proven, but thelikelihood of continued use is very high (3). Methamphetamine hasbeen found in human neonatal tissues, and the fetus rarely survivesto term when the mother is a methamphetamine abuser (4).
For forensic purposes, it may be necessary to use procedures whichcan identify the stereoisomers, because 1-methamphetamine can befound in the urine of persons using at least one of the common, non-prescription inhaler formulations. As in the case of amphetamine,the isomers differ in their pharmacological activity; 1-methamphet-amine has greater sympathomimetic properties while d-methamphetaminehas greater anorexic and stimulant properties (5).
A comparative study in rats showed that the N-methyl group ren-dered methamphetamine less toxic to liver microsomal enzyme systemsthan amphetamine, but in these animals the methylated drug was moreactive, and required a smaller dose to achieve the same pharmaco-
165

logical ef fect (6) . Also in rats, methamphetamine was found tocause a short-term (less than 6 hr) depletion of norepinephrineand serotonin in brain and a long-lasting (more than 48 hr) deple-tion of heart norepinephrine. Amphetamine was detected in thesetissues after methamphetamine administration, as well as the p-hy-droxyl derivative of amphetamine and one or more unidentified meta-bolite(s) represented by radioactivity. The latter, more polarthan the parent drug or amphetamine, persisted at higher concen-trations in heart than in brain tissue, paralleling the time courseof norepinephrine depletion. Methamphetamine and amphetamine levelswere lower in heart than in brain and disappeared from heart tissuewithin 5 hr (7).
METABOLISM AND PHARMACOKINETICS
A study of 14C-methamphetamine metabolism in man showed that about90 percent of the 14C was excreted in the urine within four days.An average of 22 percent of the dose was excreted in urine within24 hr as unchanged drug, and 15 percent was excreted as 4-hydroxy-methamphetamine (II).
Minor metabolites include 4-hydroxyamphetamine (III, 1 percent),amphetamine (IV, 2-3 percent), 4-hydroxynorephedrine (V, 1-2 per-cent), norephedrine (VI, 2 percent), hippuric acid (5 percent),and an acid-labile precursor of benzylmethyl ketone (1 percent).An average of only 62 percent of the radioactivity ingested appearedin urine within 24 hr (8). Radioactivity was not monitored insweat or saliva, although methamphetamine is known to be excretedby these routes (9). Although its products account for only 4 per-cent of the dose in man, ß-hydroxylation is significant because nor-ephedrine and 4-hydroxy norephedrine could act as false neuro-transmitters (10). The hydroxylated derivatives of methampheta-mine are excreted primarily as glucuronic acid conjugates. Inthose metabolites where both parahydroxylation and N-demethylationhave occurred, some evidence indicates that the latter occurs first.N-demethylation is to some degree stereospecific, occurring morereadily with the d-isomer of methamphetamine than with the l-isomer(7,11).
166
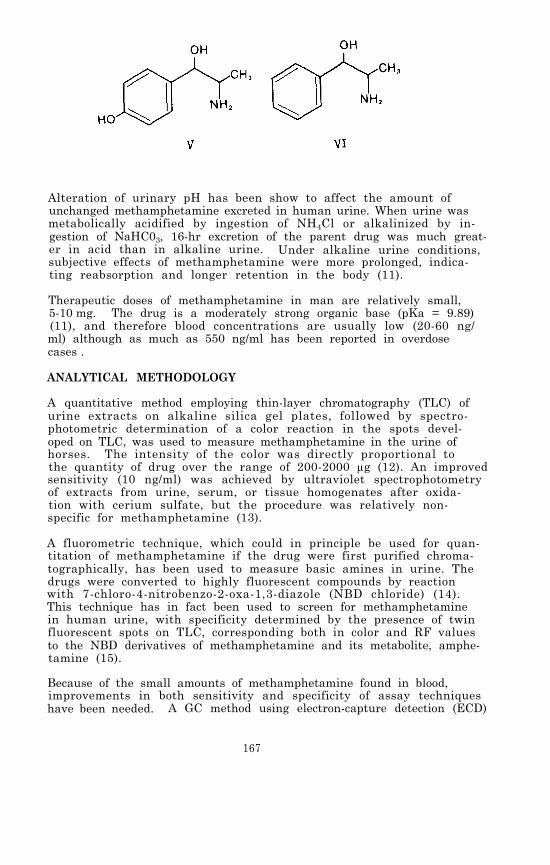
Alteration of urinary pH has been show to affect the amount ofunchanged methamphetamine excreted in human urine. When urine wasmetabolically acidified by ingestion of NH4Cl or alkalinized by in-gestion of NaHC03, 16-hr excretion of the parent drug was much great-er in acid than in alkaline urine. Under alkaline urine conditions,subjective effects of methamphetamine were more prolonged, indica-ting reabsorption and longer retention in the body (11).
Therapeutic doses of methamphetamine in man are relatively small,5-10 mg. The drug is a moderately strong organic base (pKa = 9.89)(11), and therefore blood concentrations are usually low (20-60 ng/ml) although as much as 550 ng/ml has been reported in overdosecases .
ANALYTICAL METHODOLOGY
A quantitative method employing thin-layer chromatography (TLC) ofurine extracts on alkaline silica gel plates, followed by spectro-photometric determination of a color reaction in the spots devel-oped on TLC, was used to measure methamphetamine in the urine ofhorses. The intensity of the color was directly proportional tothe quantity of drug over the range of 200-2000 µg (12). An improvedsensitivity (10 ng/ml) was achieved by ultraviolet spectrophotometryof extracts from urine, serum, or tissue homogenates after oxida-tion with cerium sulfate, but the procedure was relatively non-specific for methamphetamine (13).
A fluorometric technique, which could in principle be used for quan-titation of methamphetamine if the drug were first purified chroma-tographically, has been used to measure basic amines in urine. Thedrugs were converted to highly fluorescent compounds by reactionwith 7-chloro-4-nitrobenzo-2-oxa-1,3-diazole (NBD chloride) (14).This technique has in fact been used to screen for methamphetaminein human urine, with specificity determined by the presence of twinfluorescent spots on TLC, corresponding both in color and RF valuesto the NBD derivatives of methamphetamine and its metabolite, amphe-tamine (15).
Because of the small amounts of methamphetamine found in blood,improvements in both sensitivity and specificity of assay techniqueshave been needed. A GC method using electron-capture detection (ECD)
167

of the heptafluorobutyramide derivative of the drug in blood ex-tracts was sensitive to 20 ng/ml of methamphetamine, the amountfound in human blood 6 hr after a 5-mg oral dose (16). In anotherapplication of GC-ECD in which therapeutic blood concentrations ofmethamphetamine were monitored, the trichloroacetamide derivativewas prepared before chromatography on 3 percent OV-1. This deri-vative was superior in chromatographic characteris tics and more sen-sitive to ECD than either the heptafluorobutyramide or the penta-fluorobenzamide. Blood concentrations over a 24-hr period werefound to range from 10 to 20 ng/ml following a 12.5-mg dose ofmethamphetamine, but the method was capable of measuring amountsas low as 25 pg (17).
Human urinary excretion rates of several amphetamine drugs, inclu-ding methamphetamine, were followed by a GC procedure with theaddition of phenethylamine as an internal standard and the use ofa flame ionization detector (FID). The drug was chromatographedas its acetamide derivative on a column packing coated with 8 per-cent ethylene glycol adipate, but the sensitivity was reportedonly in terms of µg base/mg creatinine (18). In a similar method,blood was first treated with tungstic acid to precipitate proteins,and N-propylamphetamine was added as an internal standard. Thesupernatant was made strongly basic for ether extraction of metham-phetamine and the internal standard before conversion to the aceta-mide derivatives for GC-FID analysis. This method measured 30 ng/ml methamphetamine in human blood 2 hr after ingestion of a single10-mg dose (19).
For clinical use, a procedure to measure methamphetamine in urine byGC-FID was &signed to eliminate the false positives caused by inter-fering substances and to shorten analysis time to 30 min. First,the drug was determined as the free base on a 10 percent Apiezon L-10 percent KOH column. Extracts found positive with reference toGC peaks of standard solutions were then chromatographed on 3 per-cent OV-17, with on-column derivatization with trifluoroacetic anhy-dride. ß-Phenethylamine was the internal standard in both GC sys-tems. The amount of methamphetamine was measured with an accuracyof ±7 percent and the sensitivity was 0.1 µg/ml. The procedurewas adaptable to rapid analysis of a large number of samples (20,21).
Although chromatographic techniques have proved to be highly sensi-tive for methamphetamine, the addition of mass spectrometry is oftendesirable for confirmation of its structure, even in routine analysissuch as monitoring in competitive sports. For confirmation pur-poses of this kind, the trifluoroacetylated derivative of metham-phetamine was incorporated into a GC/MS protocol which detected 0.3µg of methamphetamine/ml of human urine (22). GC/MS had been em-ployed several years earlier as a method of identification, but notquantitation, of methamphetamine in the urine of participants insporting events, with confirmation based on spectra of the N-acetyland N-propionyl derivatives (23). Mercuric acetate has been usedas a catalyst for rapid (30 sec at 80°C) quantitative formation oftrifluoroacetamide derivatives of methamphetamine and other phenyl-alkylamine drugs prior to GC/MS analysis (24).
168
Immunoassay techniques have been used in the screening of body fluidsfor methamphetamine and have the advantages of being highly sensi-tive and requiring no extraction procedure. However, those in pre-sent use cannot distinguish between amphetamine and methamphetamine,and they are subject to interference by other phenylethylamines (21).Radioimmunoassay (RIA) did prove successful in detecting metabolitesof methamphetamine in rat saliva following injection of the drug.Neither methamphetamine itself nor its 4-hydroxy derivative wasreactive in the RIA procedure, but the rat saliva gave positiveRIA reactions which resulted from amphetamine, 4-hydroxynorepne-drine, and 4-hydroxyamphetamine, either alone or in combination(25). A commercial RIA system is available and can be used forquantitative measurement of phenethylamines in both blood andurine (26). However, its dynamic range is very limited and con-sequently it is primarily used as a screening technique with con-firmation and quantitation achieved by other methods. The EMITtechnique is widely used for detection of phenethylamines in urine.More than 70 tests per hr can be conducted with a detection levelof 2 µg/ml of urine (27).
Extraction solvents used for methamphetamine include diethyl ether(19,22,23), n-hexane (13,17), pentane (16), cyclohexane (28), andchloroform (14,15,18,21), under pH conditions ranging from 8 to 14.Back extraction into acid is sometimes employed (21). Blood pro-teins can be precipitated and acid substances removed by treatmentwith tungstic acid prior to extraction of methamphetamine at alka-line pH (17,19). A recovery of 100 percent has been reported forextractions of the drug from blood with pentane (16) and from urinewith chloroform (18), both after alkalinization with NaOH.
An extensive review of the GC and GC/MS of amphetamines and theirderivatives has been published (29).
EXPERIMENTAL PROCEDURE
The blood concentrations of methamphetamine following normal dosagesare usually in the low ng/ml range. Consequently, the extractionprocedure includes a back extraction purification in order to pro-vide a relatively clean extract, which in turn permits GC/MS mea-surement of the methamphetamine with very high sensitivity and lit-tle likelihood of interferences from endogenous components of theblood. After addition of the deuterium-labeled internal standard,the sample is made strongly basic with a saturated potassium car-bonate solution and extracted with 1-chlorobutane. The methamphet-amine and other organic bases are back extracted into dilute sul-furic acid, which is subsequently made basic with sodium hydroxideand reextracted with 1-chlorobutane. The organic extract is thentreated with trifluoroacetic anhydride to convert methamphetamineto its N-trifluoroacetamide derivative prior to concentration byevaporation. Quantitation is achieved by selected ion monitoringusing chemical ionization with methane as the reagent gas.
Standards and Reagents
The d , 1-methamphetamine hydrochloride used in the development ofthis method was acquired from the National Institute on Drug Abuse.
169

It had a melting point range of 170-172°C. No impurities were de-tected by either gas chromatography or mass spectrometry. d ,1-Meth-amphetamine-2H5 hydrochloride was synthesized at Battelle ColumbusLaboratories using a published procedure (30). The location ofthe deuterium atoms is indicated in structure VII. On the basisof mass spectral analysis, its isotopic composition was: 2H5, 94percent; 2H4, 5.7 percent; 2H3, 0.3 percent; 2H2, 2H1 and 2H0 lessthan 0.1 percent.
For the purpose of preparing calibration graphs and working standards,stock solutions of methamphetamine and methamphetamine-2H5 are pre-pared as follows. Weigh into a 100-ml volumetric flask about 12.4mg of methamphetamine hydrochloride and record its weight to thenearest 0.1 mg. The equivalent weight of free base is calculatedby multiplying the weight of methamphetamine hydrochloride by 0.805.Dissolve the measured methamphetamine in about 75 ml of methanoland then add additional methanol to give exactly 100 ml of solution.In the following paragraphs this solution will be referred to asthe “0.10-mg/ml stock solution” although it should be labeled withits actual concentration based upon the exact measured weight ofmethamphetamine hydrochloride. A series of working standard solu-tions can be prepared by appropriate dilution of this stock solu-tion as described in Chapter 2.
The stock solution of methamphetamine-2H5 is prepared in the sanemanner. For the measurement of methamphetamine in body fluids with-in the concentration range 1 to 500 ng/ml, addition of approximately40 ng of the internal standard to each ml of specimen is satisfac-tory. This can be conveniently done by adding 100 µl of a 400-ng/mlmethamphetamine-2H5 methanolic solution to each ml of specimen. Pre-pare the 400-ng/ml internal standard solution by diluting 1 ml ofthe 0.10-mg/ml stock solution of methamphetamine-2H5 to 250 ml withmethanol.
Store stock and standard solutions in well-stoppered or cappedglass vessels in the dark at less than 0°C.
Extraction
Transfer 1 ml of body fluid (whole blood, plasma or urine) to a 20-mlculture tube equipped with a Teflon-lined screw cap (0.5 to 2 ml ofspecimen can be used, but it must be measured accurately). Add 100µl of the 400-ng/ml methamphetamine-2H5 solution and vortex for
170
about 10 sec. Allow the sample to equilibrate for about 15 min andthen increase the pH to greater than 10 by adding 1 ml of K2CO3-saturated distilled water. Extract the basic mixture with 5 ml of1-chlorobutane by gently mixing the contents for 30 min using amotorized rocker or rotator. Centrifuge for 5 min and then trans-fer the organic phase (top) to another 20-ml culture tube by meansof a disposable Pasteur pipette. Extract the methamphetamine andother organic bases from the organic phase into aqueous acid byadding 3 ml of 0.2 N H2SO4 and gently mixing for at least 15 min.Centrifuge and remove the top organic phase by aspiration. Add0.5 ml of 10 N NaOH to the aqueous phase, mix the contents, andcheck the pH to make certain the solution is strongly basic (pH> 10).Finally, reextract the organic bases from the aqueous alkaline solu-tion by adding 5 ml of methylene chloride and gently mixing for atleast 15 min. Centrifuge for five minutes, aspirate off the upperaqueous layer, and transfer by means of a disposable Pasteur pipettethe methylene chloride extract (bottom layer) to a silylated con-centrator tube having a volume of at least 5 ml, a conical bottom,and a Teflon-lined screw cap. Add 10 µl of dimethylformamide toact as a “keeper solvent” to minimize evaporative loss of the meth-amphetamine. Remove the methylene chloride by evaporation under agentle stream of nitrogen or filtered air while heating the tube tono higher than 40°C. When the volume of extract has decreased toabout 10 µl, add 15 µl of N-methyl bis-(trifluoroacetamide) ‘MBTFA”(Pierce Chemical Co., Rockford, IL 61105). Cap the tube and heatit at 70°C for 15 min. The capped tube can be stored under refri-geration until the GC/MS analysis is ready to be performed. Immedi-ately before the analysis, allow the tube to warm to room tempera-ture .
GC/MS Analysis
The experimental conditions for the GC/MS analysis for methamphe-tamine trifluoroacetamide are as follows:
GC column: 1.8 m x 2 mm (I.D.) glass column packed with3 percent OV-17 on 100/120 mesh Gas Chrom Q(Applied Science Laboratory, State College,PA 16801)
Carrier andreagent gas: Methane, 15-20 ml/min
Temperatures: Injector, 260°CColumn, 120°C, isothermalGC/MS transfer line, 260°CIon source, 160°C
Under these conditions, the methamphetamine trifluoroacetamide shouldelute in two to four minutes as a narrow, symmetrical peak.
Prior to beginning GC/MS analysis of samples, the performance ofthe total GC/MS system should be evaluated and optimized as des-cribed in Chapter 2. The ions to be monitored occur at m/z 246 and251. They correspond to the protonated molecule ions for methamphe-tamine trifluoroacetamide and methamphetamine-2H5 trifluoroacetamide,
171
respectively. With the divert valve in the divert position, inject2 to 6 µl of the organic extract into the gas chromatograph. Afterapproximately 1 min, switch the divert valve so that the entirecarrier gas flow enters the ion source of the mass spectrometer,and begin data acquisition. When the methamphetamine trifluoro-acetamide peak has eluted, cease data acquisition and return thedivert valve to the divert position.
The quantity of methamphetamine in the specimen is determined bymeasuring the heights (or areas) or the methamphetamine triflu-oroacetamide and methamphetamine-2H5 trifluoroacetamide peaks inthe selected ion current profiles (“ion chromatograms”) and relat-ing the ratio of peak heights to a calibration graph. Calculate theconcentration of methamphetamine in the specimen by dividing themeasured quantity of methamphetamine by the exact volume of spe-cimen extracted.
Discussion of the Experimental Procedure
The procedure for analysis of amphetamine (Chapter 10) is virtuallyidentical to this procedure, except for the ions monitored. Conse-quently, the concentrations of both drugs can be measured simul-taneously by adding deuterated analogs of the two drugs to the bio-logical sample for use as internal standards. Then during dataacquisition, the ion currents at four m/z values are monitored.These are m/z 232, 235, 246, and 251, which correspond to the pro-tonated molecule ions for the trifluoroacetamide derivatives ofamphetamine, amphetamine-2H3, methamphetamine, and methamphetamine-2H5, respectively.
The electron impact (EI) and chemical ionization (CI) mass spectraof metamphetamine trifluoroacetamide are shown in Figure 1. Therelative sensitivities achieved by monitoring the ion current atthe m/z value corresponding to the most abundant ion generated byeach of the ionization processes are shown in Table 1. In thiscase, the highest response was obtained by monitoring the fragmention at m/z 154 generated by EI ionization. Nevertheless, CI shouldgive effective sensitivities at least as high as EI ionization be-cause of the lower background usually experienced in CI. The mostabundant ions in the CI mass spectra correspond to the protonatedmolecule ion (m/z 246) and the ammonia-attachment ion (m/z 263),depending on whether methane alone or methane and ammonia are usedas reagent gases. Even though the procedure specifies use of meth-ane alone as the reagent gas, the combination of methane and ammoniais also satisfactory and should provide slightly better sensitivity.Perhaps most important is the fact that the methane and ammonia com-bination offers an opportunity to monitor a different ion mass ifinterferences are encountered at m/z 246 or 251 when methane aloneis used.
An additional option which can be explored if interferences are en-countered in the selected ion monitoring measurements, is to gener-ate a derivative different from the trifluoroacetamide. For exam-ple, the acetamide derivative could be prepared by substitutingN-acetylimidazole for the N-methyl bis-(trifluoroacetamide). Alsothe pentafluoroacetamide or heptafluorobutyramide derivatives could
172

FIGURE 1. MASS SPECTRA OF METHAMPHETAMINE TRIFLUORO-ACETAMIDE
173

be used. The trifluoroacetamide derivative has proven satisfactory,but the use of other derivatives has not been fully evaluated.
TABLE 1. RELATIVE RESPONSES FOR PROMINENT IONS IN THEEI AND CI MASS SPECTRA OF THE TRIFLUOROACETAMIDEDERIVATIVE OF METHAMPHETAMINE
% of Sample Relative Response PerMethod m/z Monitored Ion Current Unit Weight of Drug
EI 154 18 100
CI (CH4) 264 50 32
CI (CH4 + NH3) 263 72 59
A potential problem associated with concentration of organic ex-tracts containing methamphetamine is the loss of the drug throughevaporation because of its relatively high volatility. For thisreason, some methamphetamine assay procedures specify addition ofan acid to convert the drug to a nonvolatile salt prior to concen-tration of the extract. In the procedure described here, lossesdue to evaporation are minimized by the following means. First,methylene chloride is used in the final extraction because it hasa lower boiling point (39°C) than 1-chlorobutane (78°C). Second,the methamphetamine is converted to the less volatile trifluoro-acetamide derivative prior to removing the solvent. Finally, asmall quantity of dimethylformamide is added just prior to evap-orative concentration to act as a “keeper solvent.”
A comparison study showed that all of the organic solvents investi-gated except diethyl ether are effective in extracting methamphet-amine from 2.5 N sodium hydroxide (Table 2). 1-Chlorobutane wasselected as the solvent to extract methamphetamine from biologicalfluids. It represents a compromise of several factors includingextraction efficiency, solvent volatility, cleanliness of the ex-tract, and ease of separation of the organic phase from the biolog-ical fluid. Diethyl ether, ethyl acetate, and ethylene chloride
were eliminated from consideration because of their relatively lowpartition coefficients (4.3, 25.8, and 41.9, respectively). Chloro-form:isopxopanol 9:1 (v/v), chloroform, and methylene chloride allhad high partition coefficients (82.8, > 90, and 78.5, respectively),but they form the lower layer of an aqueous/organic two-phase sys-tem and it is therefore difficult to separate them from body fluidsusing a pipette without introducing contamination from the aqueousphase. 1-Chlorobutane, hexane, and cyclohexane all have relativelyhigh partition coefficients (70.3, 81.3, and 74.3, respectively)and all form the upper layer of the aqueous/organic two-phase sys-tem. Of these, hexane was found to cause emulsion problems and
174
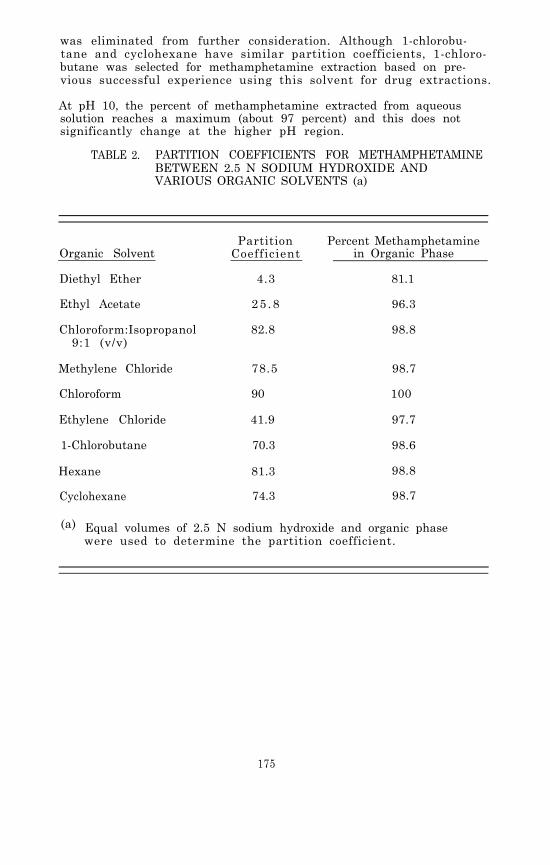
was eliminated from further consideration. Although 1-chlorobu-tane and cyclohexane have similar partition coefficients, 1-chloro-butane was selected for methamphetamine extraction based on pre-vious successful experience using this solvent for drug extractions.
At pH 10, the percent of methamphetamine extracted from aqueoussolution reaches a maximum (about 97 percent) and this does notsignificantly change at the higher pH region.
TABLE 2. PARTITION COEFFICIENTS FOR METHAMPHETAMINEBETWEEN 2.5 N SODIUM HYDROXIDE ANDVARIOUS ORGANIC SOLVENTS (a)
Organic Solvent
Diethyl Ether
Ethyl Acetate
Chloroform:Isopropanol9:1 (v/v)
Methylene Chloride
Chloroform
Ethylene Chloride
1-Chlorobutane
Partition Percent MethamphetamineCoefficient in Organic Phase
4.3 81.1
25 .8 96.3
82.8 98.8
78.5 98.7
90 100
41.9 97.7
70.3 98.6
Hexane 81.3 98.8
Cyclohexane 74.3 98.7
(a) Equal volumes of 2.5 N sodium hydroxide and organic phasewere used to determine the partition coefficient.
175
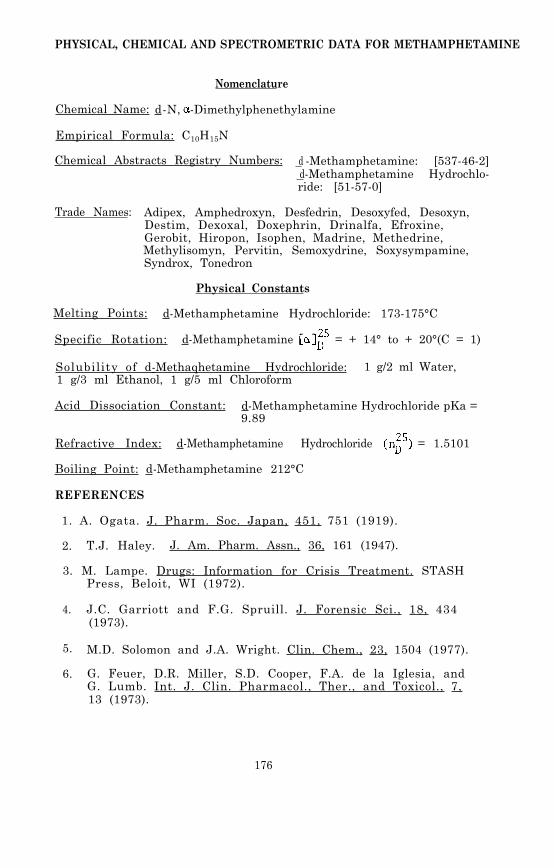
PHYSICAL, CHEMICAL AND SPECTROMETRIC DATA FOR METHAMPHETAMINE
Nomenclature
Chemical Name: d-N, -Dimethylphenethylamine
Empirical Formula: C10H15N
Chemical Abstracts Registry Numbers: d -Methamphetamine: [537-46-2] d-Methamphetamine Hydrochlo-ride: [51-57-0]
Trade Names: Adipex, Amphedroxyn, Desfedrin, Desoxyfed, Desoxyn,Destim, Dexoxal, Doxephrin, Drinalfa, Efroxine,Gerobit, Hiropon, Isophen, Madrine, Methedrine,Methylisomyn, Pervitin, Semoxydrine, Soxysympamine,Syndrox, Tonedron
Physical Constants
Melting Points: d-Methamphetamine Hydrochloride: 173-175°C
Specific Rotation: d-Methamphetamine = + 14° to + 20°(C = 1)
Solubility of d-Methaqhetamine Hydrochloride: 1 g/2 ml Water,1 g/3 ml Ethanol, 1 g/5 ml Chloroform
Acid Dissociation Constant: d-Methamphetamine Hydrochloride pKa =9.89
Refractive Index: d-Methamphetamine Hydrochloride = 1.5101
Boiling Point: d-Methamphetamine 212°C
REFERENCES
1. A. Ogata. J. Pharm. Soc. Japan, 451, 751 (1919).
2. T.J. Haley. J. Am. Pharm. Assn., 36, 161 (1947).
3. M. Lampe. Drugs: Information for Crisis Treatment. STASHPress, Beloit, WI (1972).
4. J.C. Garriott and F.G. Spruill. J. Forensic Sci., 18, 434(1973).
5. M.D. Solomon and J.A. Wright. Clin. Chem., 23, 1504 (1977).
6. G. Feuer, D.R. Miller, S.D. Cooper, F.A. de la Iglesia, andG. Lumb. Int. J. Clin. Pharmacol., Ther., and Toxicol., 7,13 (1973).
176

7.
8.
9.
10.
11.
12.
13.
14.
15.
16.
17.
18.
19.
20.
21.
22.
23.
24.
25.
C.D. Morgan, F. Cattabeni, and E. Costa. J. Pharmacol. Exp.Ther., 180, 127 (1972).
J. Caldwell, L.G. Dring, and R.T. Williams. Biochem. J.,129, 11 (1972).
T.B. Vree, T.J.M. Muskens, and J.M. Van Rossum. Arch. Int.Pharmacodynamie, 199, 311 (1972).
H. Thoenen, A. Hürlimann, K.F. Gey, and W. Haefely. Life Sci.,5, 1715 (1966).
A.H. Beckett and M. Kowland. J. Pharm. Pharmacol., 17,suppl.. 109S (1965).
M.S. Karawya, M.A. El-Keiy, S.K. Wahba, and A.R. Kozman.J. Pharm. Pharmacol., 20, 650 (1968).
J.E. Wallace, J.D. Biggs, and S.L. Ladd. Anal. Chem., 40,2207 (1968).
J. Monforte, R.J. Bath, and I. Sunshine. Clin. Chem., 18,1329 (1972).
R.N. Gupta, B.G. Chittim, and P.M. Keane. J. Chromatogr.Sci., 12, 67 (1974).
R.B. Bruce and W.R. Maynard, Jr. Anal. Chem., 41, 977 (1969).
R.C. Driscoll, F.S. Barr, B.J. Gragg, and G.W. Moore. J.Pharm. Sci., 60, 1492 (1971).
J.W. Schweitzer and A.J. Friedhoff. Clin. Chem., 16, 786(1970).
P. Lebish, B.S. Finkle, and J.W. Brackett, Jr. Clin. Chem.,16, 195 (1970).
N.C. Jain, T.C. Sneath, and R.D. Budd. Clin. Chem., 20,1460 (1974).
N.C. Jain, R.D. Budd, and T.C. Sneath. Clin. Toxicol., 8,211 (1975).
K. Kamei, M. Murata, K. Ishii, M. Namekata, and A. Momose.Chem. Pharm. Bull., 21, 1996 (1973).
A.H. Beckett, G.T. Tucker, and A.C. Moffat. J. Pharm.Pharmacol., 19, 273 (1967).
A. Wu. Clin. Toxicol., 8, 225 (1975).
G.J. Pigregorio and E.K. Kniaz. Drug and Alcohol Dependence,1, 377 (1976).
177
26. Abuscreen. Roche Diagnostics, Nutley, NJ 07110.
27. EMIT. Syva, Palo Alto, CA 94304.
28. J.W. Blake, R.S. Ray, J.S. Noonan, and P.W. Murdick. Anal.Chem., 46, 288 (1974).
29. B.J. Gudzinowicz and M.J. Gudzinowicz. Analysis of Drugsand Metabolites by Gas Chromatography - Mass Spectrometry,Vol. 4. Marcel Dekker, Inc., New York (1978).
30. A.F. Fentiman, Jr. and R.L. Foltz. J. Labelled Compoundsand Radiopharmaceuticals, 12, 69 (1976).
178

Chapter 12
2, 5-Dimethoxy-4-methylamphetamine (DOM)
In the late 1960’s a street drug known to users as “STP” was ex-tensively circulated in the United States as a hallucinogen (1).The psychotomimetic component of the illicit preparations was iden-tified as 1-(2,5-dimethoxy-4-methylphenyl)-2-aminopropane (I), astructure more conveniently referred to as 2,5-dimethoxy-4-methyl-amphetamine or DOM, which had been developed as an experimentalcompound by Dow Chemical Company. Early tests of its psychotropicactivity in mice showed behavioral responses very similar to thoseevoked by mescaline, but which required only about one-fiftieth ofthe dose for an equivalent response (2). Controlled dosage studiesin human volunteers indicated a hallucinogenic potency 100 timesgreater than mescaline but only about one-thirtieth that of LSD.Effects of the drug included elevation of pulse rate, systolicblood pressure and temperature, as well as nausea, paresthesia,and tremors. Psychoactivity began with moderate euphoria within1-2 hr after administration of as little as 2 mg; and doses inexcess of 5 mg always produced marked hallucinogenic effects ofdose-related intensity which subsided within 8 hr (1).
The sensory and hallucinogenic effects of DOM are limited to theR-(-) enantiomer (3). In vivo metabolism of DOM in rabbits is ste-reoselective (4), and in rabbit liver preparations S-(+)-DOM-2H6is metabolized more rapidly than R-(-)-DOM by microsomal enzymes(5). Several methoxyl and methyl analogs were prepared for astudy of comparative pharmacological activity in mice. These stu-dies showed that DOM was almost as effective as amphetamine indecreasing pentobarbital-induced sleep time, and that the 4-methylgroup was apparently essential for the psychotomimetic activityof DOM while the 2-methoxyl group was not (6). DOM has no knowntherapeutic value but has been used for research investigationsconcerning model psychoses.
179

METABOLISM AND PHARMACOKINETICS
In vivo studies in rats, using radiolabeled tracers, showed thatthe major metabolic pathway of DOM in that species is hydroxyla-tion of the 4-methyl group to 1-(2,5-dimethoxy-4-hydrovthyl-phenyl)-2-aminopropane (II), followed by oxidation of II to 1-(2,5-dimethoxy-4-carboxyphenyl)-2-aminopropane (III). Nearly 50 per-cent of the urinary radioactivity was present as II plus its glu-curonide and sulfate conjugates. Unchanged DOM accounted for 8percent of urinary radioactivity and III accounted for 28 percent.1-(2,5-Dimethoxy-4-methylphenyl)-2-propanone (IV) was detected intrace amounts. In feces, 83 percent of the radioactivity was dueto III; 6 percent was due to II; only a trace amount was due tounchanged DOM (7). Identification of the metabolites was based oncomparison of TLC Rf values with those of synthesized standards(8). The same metabolic pathways for DOM, including the minor oneinvolving oxidative deamination, have been demonstrated in rabbitsin vivo (4). N-Hydroxylation (V) and O-demethylation reactionshave been reported in rabbit liver microsomal preparations incu-bated with DOM (9). The O-demethylated derivative of DOM might beof interest in light of speculation that a bis-O-demethylated me-tabolite could be oxidized to the corresponding p-hydroquinonewhich in turn could cyclize to form 5-hydroxy-2,6-dimethylindolein a manner analogous to that observed for 6-hydroxydopamine.The 5-hydroxy-2,6-dimethylindole has been suggested as a possiblecause of hallucinogenic activity (10).
180

In the human study previously mentioned, about 20 percent of theinjected dose appeared in the urine within 24 hr as the unchangeddrug. The peak of urinary excretion, between 3 and 6 hr after ad-ministration, corresponded to the peak clinical effects (1). Inrats, excretion of radiolabeled DOM and its metabolites was nearlycomplete within 24 hr (7). Plasma concentration of DOM monitoredover a 24-hr period in two 9-kg dogs given 2 mg and 4 mg of DOMrespectively, suggested a bi-phasic elimination process, with aninitial rapid decrease and a slower phase corresponding to a half-life of 1.5 hr (11).
ANALYTICAL METHODOLOGY
Even though DOM has been a recognized drug of abuse for at leastten years, little effort appears to have been devoted to develop-ment of methods for identification and quantitation of the drug inbiological media for forensic or research purposes. In 1968, sev-eral authors reported data on the physical and chemical character-istics for DOM including its TLC Rf values and its ultraviolet,infrared, nuclear magnetic resonance, and mass spectra. These ana-lytical techniques were used for identification of the drug in con-fiscated illicit preparations (2,12). An ultraviolet spectropho-tometric method for determination of DOM following oxidation bycerium sulfate was reported (13). However, UV and IR spectra wereunsatisfactory for samples containing impurities because of inade-quate specificity. Mass spectrometry was suggested as a reliablemeans of identification of DOM in confiscated drugs (14).
A fluorometric method has been used for the analysis of unchangedDOM in the urine of human volunteers during a study of hallucino-genic reactions (1). More recently, a highly sensitive radioim-munoassay (RIA) has been reported in which a radioiodinated deriv-ative of DOM was used as the test antigen. The specificity ofthe antibody, raised in rabbits by DOM conjugated to human serumalbumin, was such that structurally related molecules (i.e., am-phetamine, mescaline, catecholamine metabolites, or N,N-diethyl-tryptamine) were several orders of magnitude less effective thanDOM as inhibitors (15).
In vivo metabolic studies in rats measured excretion of tritium-labeled DOM and its metabolites in urine and in fecal homogenatesby liquid scintillation counting. Metabolites were extractedwith diethyl ether and identified by comparison of TLC Rf valueswith those of synthesized standards. The major metabolites werefurther characterized by gas chromatography with a flame-ioniza-tion detector (GC-FID) on columns of 3 percent OV-1 or 3 percentSE-30 maintained at 160°C. Quantitation of individual metaboliteswas done by scintillation counting of the appropriate spots cutfrom paper chromatograms (7). Similarly, concentrations of uri-nary DOM and metabolites from rabbits receiving carbon-14 labeledDOM were measured by isotope dilution analysis during a study ofstereoselective metabolism. DOM was extracted from the urine withdiethyl ether and recrystallized for measurement of radioactivity(4) .
181

In vitro studies of stereoselective metabolism have utilized direct-probe chemical ionization mass spectrometry with deuterium-labeledDOM as an internal standard for quantitation of DOM and its meta-bolites in rabbit liver preparations (5). In other metabolicstudies with rabbit liver microsomes, the technique of selectedion monitoring was used to measure DOM metabolite formation, withDOM-2H6 as substrate, and a synthetic N-hydroxylated metaboliteof DOM as the internal standard. The deuteratcd metabolite pro-duced by the enzyme system was identified as its bis-(trifluoro-acetyl) derivative by GC/MS. Electron impact mass spectra wereobtained following GC separation on a 2 percent Dexil 300 columnmaintained at 160°C. GC separations prior to isobutane chemicalionization mass spectrometry were done on 3 percent OV-25 or 3percent OV-1 columns (9).
In published studies which involved extraction of DOM from biolog-ical specimens, the extraction solvent has usually been diethylether, with no extraction efficiencies reported (4,7).
EXPERIMENTAL PROCEDURE
The procedure for extraction, derivatization, and GC/MS quantita-tion of DOM is the same as that described for the analysis of meth-amphetamine (Chapter 9) and the other phenylalkylamine drugs (i.e.,amphetamine and mescaline). After addition of the deuterium-labeledinternal standard, the sample is made strongly basic with a satu-rated potassium carbonate solution and extracted with 1-chlorobu-tane. The DOM and other organic bases arc back extracted into di-lute sulfuric acid, which is subsequently made basic with sodiumhydroxide and reextracted with 1-chlorobutane. The organic extractis then treated with trifluoroacetic anhydride to convert DOM toits N-trifluoroacetamide derivative prior to concentration by evap-oration. Quantitation is achieved by selected ion monitoring usingchemical ionization with methane as the reagent gas.
Standards and Reagents
The DOM•HCl used in the validation of this procedure was obtainedfrom the National Institute on Drug Abuse. It had a melting pointof 187-189°C. The DOM•HCl can be purchased from Applied ScienceLaboratories, State College, PA 16801. DOM-2H6•HCl was synthesizedat Battelle Columbus Laboratories using a published procedure (15).On the basis of mass spectral analysis the DOM-2H6 had the follow-ing isotopic composition: 2H6 96.1 percent; 2H5, 3.1 percent; 2H4,0.6 percent; 2H3, 0.2 percent; 2H2, 2H1, and 2H0, <0.1 percent.
For the purpose of preparing calibration graphs and working standards,stock solutions of DOM and DOM-2H6 are prepared as follows. Weighinto a 100-ml volumetric flask about 11.7 mg of DOM•HCl and recordits weight to the nearest 0.1 mg. The equivalent weight of freebase is calculated by multiplying the weight of DOM•HCl by 0.85.Dissolve the measured DOM in about 75 ml of methanol and then addadditional methanol to give exactly 100 ml of solution. In thefollowing paragraphs this solution will be referred to as the “0.10-mg/ml stock solution” although it should be labeled with its actual
182
concentration based upon the exact measured weight of DOM hydrochlo-ride. A series of working standard solutions can be prepared byappropriate dilution of this stock solution as described in Chap-ter 2.
The stock solution of DOM-2H6 is prepared in the same manner. Forthe measurement of DOM in body fluids within the concentrationrange 1 to 500 ng/ml, addition of approximately 40 ng of the inter-nal standard to each ml of specimen is satisfactory. This can beconveniently done by adding 100 µl of a 400-ng/ml DOM-2H6 methanol-ic solution to each ml of specimen. Prepare the 400-ng/ml inter-nal standard solution by diluting 1 ml of the 0.10-mg/ml stock solu-tion of DOM-2H6 to 250 ml with methanol.
Store stock and standard solutions in well-stoppered or cappedglass vessels in the dark at less than 0°C.
Extraction
Transfer 1 ml of body fluid (whole blood, plasma or urine) to a20-ml culture tube equipped with a Teflon-lined screw cap (0.5 to2 ml of specimen can be used, but it must be measured accurately).Add 100 µl of the 400-ng/ml DOM2H6 solution and vortex for about10 sec. Allow the sample to equilibrate for about 15 min and thenincrease the pH to greater than 10 by adding 1 ml of K2CO3- Satu-rated distilled water. Extract the basic mixture with 5 ml of l-chlorobutane by gently mixing the contents for 30 min using a mo-torized rocker or rotator. Centrifuge for 5 min and then transferthe organic phase (top) to another 20-ml culture tube by means ofa disposable Pasteur pipette. Extract the DOM and other organicbases from the organic phase into aqueous acid by adding 3 ml of0.2 N H2SO4 and gently mixing for at least 15 min. Centrifuge andremove the top organic phase by aspiration. Add 0.5 ml of 10 NNaOH to the aqueous phase, mix the contents, and check the pH tomake certain the solution is strongly basic (pH > 10). Finally,rcextract the organic bases from the aqueous alkaline solution byadding 5 ml of methylene chloride and gently mixing for at least15 min. Centrifuge for 5 min, aspirate off the upper aqueous layer,and transfer by means of a disposable Pasteur pipette the methylenechloride extract (bottom layer) to a silylated concentrator tubehaving a volume of at least 5 ml, a conical bottom, and a Teflon-lined screw cap. Add 10 µl of dimethylformamide to act as a“keeper solvent” to minimize evaporative loss of the DOM. Removethe methylene chloride by evaporation under a gentle stream ofnitrogen or filtered air while heating the tube to no higher than40°C. When the volume of extract has decreased to about 10 µl,add 15 µl of N-methyl bis-(trifluoroacetamide) “MBTFA” (PierceChemical Co., Rockford, IL 61105). Cap the tube and heat it to70°C for 15 min. The capped tube can be stored under refriger-ation until the GC/MS analysis is ready to be performed. Immedi-ately before the analysis, allow the tube to warm to room tempera-ture.
183

GC/MS Analysis
The experimental conditions for the GC/MS analysis for DOM triflu-oroacetamide are as follows:
GC column: 1.8 m x 2 mm (I.D.) glass column packed with3 percent OV-17 on 100/120 mesh Gas Chrom Q(Applied Science laboratory, State College,PA 16801)
Carrier andreagent gas: Methane, 15-20 ml/min
Temperatures: Injector, 260°CColumn, 165°C, isothermalGC/MS transfer line, 260°CIon source, 160°C
Under these conditions, the DOM trifluoroacetamide should eluteat about 4 min as a narrow, symmetrical peak.
Prior to beginning GC/MS analysis of samples, the performance ofthe total GC/MS system should be evaluated and optimized as des-cribed in Chapter 2. The ions to be monitored occur at m/z 306and 312. They correspond to the protonated molecule ions for DOMtrifluoroacetamide and DOM-2H6 trifluoroacetamide, respectively.With the divert valve in the divert position, inject 2 to 6 µl ofthe organic extract into the gas chromatograph. After approximately1 min, switch the divert valve so that the entire carrier gas flowenters the ion source of the mass spectrometer, and begin data ac-quisition. When the DOM trifluoroacetamide peak has eluted, ceasedata acquisition and return the divert valve to the divert position.
The quantity of DOM in the specimen is determined by measuring theheights (or areas) or the DOM. trifluoroacetamide and DOM-2H6 tri-fluoroacetamide peaks in the selected ion current profiles (“ionchromatograms”) and relating the ratio of peak heights to a calibra-tion graph. Calculate the concentration of DOM in the specimenby dividing the measured quantity of DOM by the exact volume ofspecimen extracted.
Discussion of the Experimental Procedure
The methane chemical ionization mass spectrum of the trifluoroace-tamide derivative of DOM is shown in Figure 1. In addition to theprotonated molecule ion at m/z 306, there is also an abundant frag-ment ion (m/z 193) which is formed by loss of H2NCOCF3 from theprotonated molecule ion. These ions are shifted to m/z 312 and199 in the methane CI mass spectrum of DOM-2H6. Normally only theion currents at m/z 306 and 312 are monitored during GC/MS analysis,but the ion currents at m/z 193 and 199 can also be monitored ifadditional specificity is desired. The slope of the calibration graphobtained by measuring the m/z 193/199 ratio for samples containingknown concentrations of DOM and DOM-2H6 may be slightly different
184

FIGURE 1. METHANE CI MASS SPECTRUM OF THE TRIFLUORO-ACETAMIDE DERIVATIVE OF DOM
185

from the slope obtained for the m/z 306/312 ratio. However, ifthe concentration of DOM calculated from the m/z 193/199, peakheight ratio differs significantly from the concentration basedon the measured m/z 306/312 peak height ratio, it is likely thatan interfering compound is contributing to one or more of the DOM•TFA peaks in the ion current profiles. When this occurs, usuallya visual examination of the ion current profiles will disclosewhich of the peak heights is inaccurate due to the interference;i.e. the peak will have a shoulder, or will be perceptibly broad-ened, or will have an abnormal retention time.
186

PHYSICAL, CHEMICAL AND SPECTROMETRIC DATA FOR DOM
Nomenclature
Chemical Name: 2,5-Dimethoxy-4-methylamphetamine
Empirical Formula: C12H19NO2
Chemical Abstracts Registry Numbcr: 15588-95-1
Physical Constants
Appearance: White crystals
Melting Point: 61°CHydrochloride, 190°C
Specific Rotation: Synthetic material is usually racemic
Solubility: Insoluble in water, soluble in chloroform
W Absorption: m a x = 214, 225 and 288 nm (in dilute HCl)
REFERENCES
1.
2.
3.
4.
5.
6.
7.
8.
9.
10.
S.H. Snyder, L. Faillace, L. Hollister. Science, 158, 669(1967).
G.F. Phillips and R.J. Mesley. J. Pharm. Pharmacol., 21, 9(1969).
A.T. Shulgin. J. Pharm. Pharmacol., 25, 271 (1973).
S.B. Matin, P.S. Callery, J.S. Zwieg, A. O'Brien, R. Rapoport,and N. Castagnoli, Jr. J. Med. Chem., 17, 877 (1974).
K.J. Weinkam, P. Callery, J. Gal, and N. Castagnoli, Jr. 22ndAnn. Conf. MS and Allied Topics, Philadelphia. Abst., p. 174May 19-24, 1974.
B.T. Ho, W.M. McIsaac, R. An, L.W. Tansey, K.E. Walker, L.F.Englert, Jr., and M.B. Noel. J. Med. Chem., 13, 26 (1970).
B.T. Ho, V. Estevez, L.W. Tansey, L.F. Englert, P.J. Creaven,and W.M. McIsaac. J. Med. Chem., 14, 158 (1971).
B.T. Ho and L.W. Tansey. J. Med. Chem., 14, 156 (1971).
J. Gal, L.D. Gruenke, and N. Castagnoli, Jr. J. Med. Chem.,18, 683 (1975).
J.S. Zweig and N. Castagnoli, Jr. J. Med. Chem., 17, 747(1974).
187
328-011 0 - 80 - 13
11. R.J. Martin and T.G. Alexander. J. Assoc. Off. Anal. Chem.,51, 159 (1968).
12. J.F. Wallace, J.D. Biggs, and S.L. Ladd. Anal. Chem., 40,2207 (1968).
13. S.W. Bellman. J. Assoc. Off. Anal. Chem., 51, 164 (1968).
14. L.J. Riceberg, H. van Vunakis, and L. Levine. Anal. Biochem.,60, 551 (1974).
15. A.F. Fentiman, Jr., and R.L. Foltz. J. labelled Compoundsand Radiopharmaceuticals, 12, 69 (1976).
188
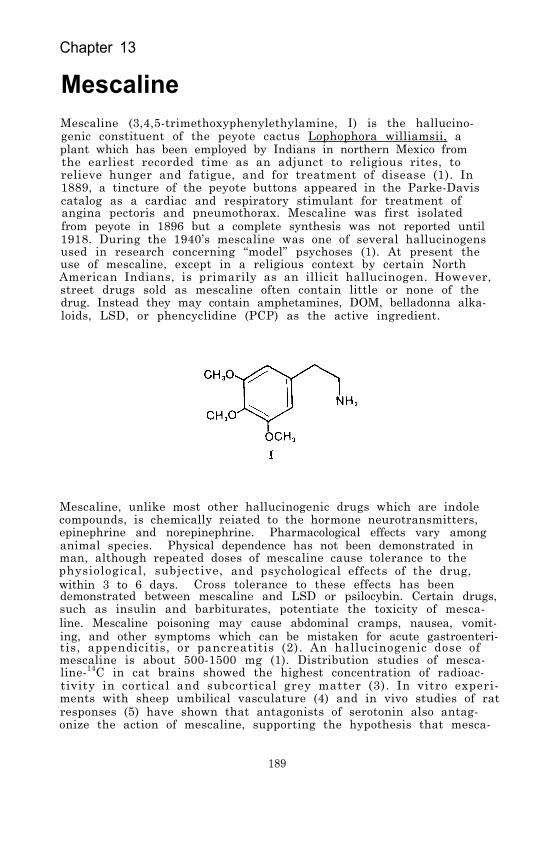
Chapter 13
MescalineMescaline (3,4,5-trimethoxyphenylethylamine, I) is the hallucino-genic constituent of the peyote cactus Lophophora williamsii, aplant which has been employed by Indians in northern Mexico fromthe earliest recorded time as an adjunct to religious rites, torelieve hunger and fatigue, and for treatment of disease (1). In1889, a tincture of the peyote buttons appeared in the Parke-Daviscatalog as a cardiac and respiratory stimulant for treatment ofangina pectoris and pneumothorax. Mescaline was first isolatedfrom peyote in 1896 but a complete synthesis was not reported until1918. During the 1940’s mescaline was one of several hallucinogensused in research concerning “model” psychoses (1). At present theuse of mescaline, except in a religious context by certain NorthAmerican Indians, is primarily as an illicit hallucinogen. However,street drugs sold as mescaline often contain little or none of thedrug. Instead they may contain amphetamines, DOM, belladonna alka-loids, LSD, or phencyclidine (PCP) as the active ingredient.
Mescaline, unlike most other hallucinogenic drugs which are indolecompounds, is chemically reiated to the hormone neurotransmitters,epinephrine and norepinephrine. Pharmacological effects vary amonganimal species. Physical dependence has not been demonstrated inman, although repeated doses of mescaline cause tolerance to thephysiological, subjective, and psychological effects of the drug,within 3 to 6 days. Cross tolerance to these effects has beendemonstrated between mescaline and LSD or psilocybin. Certain drugs,such as insulin and barbiturates, potentiate the toxicity of mesca-line. Mescaline poisoning may cause abdominal cramps, nausea, vomit-ing, and other symptoms which can be mistaken for acute gastroenteri-tis, appendicitis, or pancreatitis (2). An hallucinogenic dose ofmescaline is about 500-1500 mg (1). Distribution studies of mesca-line-14C in cat brains showed the highest concentration of radioac-tivity in cortical and subcortical grey matter (3). In vitro experi-ments with sheep umbilical vasculature (4) and in vivo studies of ratresponses (5) have shown that antagonists of serotonin also antag-onize the action of mescaline, supporting the hypothesis that mesca-
189

line initiates its pharmacological activity via serotonin receptors.Efforts to synthesize specific antagonists to mescaline have led toproduction of the N-allyl and N-n-propyl derivatives of mescalinewhich alone have no effect on the swim-maze behavior of mice butdo antagonize the effect of mescaline on mouse behavior. No cor-relation has been demonstrated, however, between the swim-maze ef-fects of mescaline in mice and psychotomimetic potency in humans(6) .
METABOLISM AND PHARMACOKINETICS
Mescaline metabolism has been studied in several species, stimulatedby evidence that the hallucinogenic properties of mescaline are actu-ally caused by one or more of its metabolites. This is suggestedbecause the psychotomimetic effects typically take several hours toreach their maximum and the hallucinogenic dose is so large. Casesof “flashbacks” over a period of several months following a singledose of mescaline have also been reported (7). The major urinarymetabolic product in mammals is 3,4,5-trimethoxyphenylacetic acid(II) produced by oxidative deamination by way of the correspondingaldehyde. The aldehyde can also be reduced to 3,4,5-trimethoxyetha-nol, which has been detected in rat urine and brain, although thealdehyde intermediate itself has not been isolated (8). The enzymeinvolved in deamination differs from monoamine oxidase in that itis cyanide-sensitive and resistant to octanol, and it has been char-acterized as a type-II enzyme (diamine oxidase) (9,10). However,mescaline is not extensively metabolized in man or in laboratoryanimals. Metabolic studies with mescaline-14C in human subjectsshowed that 55-60 percent of the drug was excreted unchanged in theurine. Trimethoxyphenylacetic acid accounted for 27-30 percent ofurinary radioactivity, while N-acetyl-ß-(3,4-dimethoxy-5-hydroxyphenyl)ethylamine (III), in the form of a conjugate, represented 5 percentand N-acetylmescaline (IV) less than 1 percent. The proportionsvaried with time following administration. Five other minor meta-bolites were only partially characterized (11). Other studies haveshown the presence of 3,4-dimethoxy-5-hydroxyphenethylamine (V) andthe glutamine conjugate of 3,4-dihydroxy-5-methoxyphenylacetic acid(VI) in human urine following administration of mescaline (7,12).
Compounds I, II, III, and IV were also found in human cerebrospinalfluid (CSF) after oral administration of mescaline-14C. Mescalinerepresented at least 50 percent of the CSF radioactivity, and theconcentration of radioactivity in the CSF appeared to coincide withthe peak of behavioral manifestations. The average biological half-life of radioactivity ingested as mescaline in this study was 6 hr,with 87 percent of the dose excreted within 24 hr and 92 percentwithin 48 hr (11). Neither trimethoxyphenylacetic acid nor N-acetyl-mescaline, in doses as high as 12 mg/kg, had any physiological orpsychological effects in human subjects, indicating that N-acety-lation and deamination are both detoxification pathways for mesca-line. The discrepancy in the relative amount of trimethoxyphenyl-acetic acid and N-acetylmescaline in CSF as compared to urine sug-gested that in the central nervous system N-acetylation is a moreimportant pathway (11). N-Acetylmescaline has been identified in
190

the CNS of mice (13) and of rats, in which acetylation appeared tooccur predominantly in the soluble cell fractions (14). 0-Demethy-lation of mescaline has been reported; however, 0-demethylation canoccur spontaneously under acidic conditions, which casts doubt onthe authenticity of these urinary metabolites (12).
In the continuing effort to identify the mechanism of hallucinogenicactivity of mescaline, rats trained for discriminative responseswere given inhibitors of aldehyde dehydrogenase or amine oxidasebefore treatment with mescaline or three of its major rat metabo-lites. A role in mescaline-induced interoceptive stimuli could notbe established for any of the metabolites (8); however, in mousebrain, side-chain degradation of mescaline to 3,4,5-trimethoxyben-zoic acid has been demonstrated in vivo and in vitro, catalyzed byenzymes in the nuclear and microsomal fractions of brain tissue (15).The authors of this report suggest that complete elucidation of themechanism of the oxidative degradation of mescaline to 3,4,5-trime-thoxybenzoic acid could provide a basis for disclosure of the assumedrelationship between the hallucinogenic properties of mescaline andits metabolism.
ANALYTICAL METHODOLOGY
Thin-layer chromatography (TLC) and gas chromatography (GC) havebeen the methods used in most studies for isolation and identifica-tion of mescaline in biological fluids or plant materials (16,17).For TLC, mescaline extracted from urine can be developed in ethyl
191

acetate:methanol:NH40H (85:5:5) and sprayed with ninhydrin beforeirradiation under 350 nm light, or in chloroform:methanol (9:1)treated with Marquis reagent. The detection limit reported for TLCis 40 ng/ml. GC conditions recommended for confirmation of mesca-line in urine extracts are 3 percent SE-30 on Chromosorb W-AW 100/200 mesh in a Teflon-lined aluminum column, and an oven temperatureof 150°C (2). A recent study of mescaline metabolism in mouse braintissue used mass spectrometry to confirm the identification of 3,4,5-trimethoxybenzoic acid as its brominated derivative after TLC sep-aration (15). A quantitative radioimmunoassay, which can distin-guish between mescaline and its most common urinary metabolite, tri-methoxyphenylacetic acid, has been reported. The assay detected aslittle as 100 pg of mescaline (18).
A very sensitive GC/MS method for quantitation of mescaline in bloodor urine has been reported (19). Blood plasma was made basic (pH 10)and extracted with benzene. The extracted mescaline was convertedto its trifluoroacetyl derivative which was measured by GC/MS usinga 2.5 percent OV-1 on Varaport column packing and a column tempera-ture of 195°C. Deuterated mescaline was used as an internal stan-dard. The limit of detection was reported to be 0.5 ng injected oncolumn.
Mescaline can be separated from its acid metabolites in urine byextraction of the latter from acid solution with ethyl acetate. Mes-caline remains in the aqueous phase and can be quantitatively ex-tracted with benzene after the solution is made strongly basic (11).Mescaline extraction from urine at pH 8.5 in n-butanol has also beenreported, with a recovery of 65 percent after back-extraction into0.1N HCl (20). There are also reports of mescaline extraction fromurine buffered at pH 9.2 using chloroform or chloroform:isopropanol(3:1) (2,3) and with ethylene dichloride:isoamyl alcohol at pH 10( 1 2 )
EXPERIMENTAL PROCEDURE
The procedure for extraction, derivatization, and GC/MS quantitationof mescaline is the same as that described for the analysis of meth-amphetamine (Chapter 11) and the other phenylalkylamine drugs (i.e.,amphetamine and DOM). After addition of the deuterium-labeled inter-nal standard, the sample is made strongly basic with a saturated po-tassium carbonate solution and extracted with 1-chlorobutane. Themescaline and other organic bases are back-extracted into dilute sul-furic acid, which is subsequently made basic with sodium hydroxideand reextracted with 1-chlorobutane. The organic extract is thentreated with trifluoroacetic anhydride to convert mescaline to itsN-trifluoroacetamide derivative prior to concentration by evaporation.Quantitation is achieved by selected ion monitoring using chemicalionization with methane as the reagent gas.
Standards and Reagents
The mescaline hydrochloride (m.p. 183-184) and the mescaline-2H3 hy-drochloride (m.p. 179-182) used in the validation of this procedurewere obtained from the National Institute on Drug Abuse. No impuri-
192
ties were detected in either compound by gas chromatography. Themescaline-2H3 HCl was further examined by thin-layer chromatography(silica gel plates, 1.5 percent ammonia in methanol, Rf = 0.19)and found to give a single spot. The three deuterium atoms in mes-caline-2H3 were located on the 4-methoxy group. Its isotopic com-
2H0, < 1 percent.position was: 2H3, 93 percent; 2H2, 3 percent; 2H1, 3 percent;
For the purpose of preparing calibration graphs and working standardsstock solutions of mescaline and mescaline-2H3 are prepared as fol-lows. Weigh into a 100-ml volumetric flask about 11.7 mg of mes-caline hydrochloride and record its weight to the nearest 0.1 mg.The equivalent weight of free base is calculated by multiplying theweight of mescaline hydrochloride by 0.85. Dissolve the measuredmescaline in about 75 ml of methanol and then add additional metha-nol to give exactly 100 ml of solution. In the following paragraphsthis solution will be referred to as the “0.10-mg/ml stock solution”although it should be labeled with its actual concentration basedupon the exact measured weight of mescaline hydrochloride. A seriesof working standard solutions can be prepared by appropriate dilu-tion of this stock solution as described in Chapter 2.
The stock solution of mescaline-2H3 is prepared in the same manner.For the measurement of mescaline in body fluids within the concen-tration range 1 to 500 ng/ml, addition of approximately 40 ng ofthe internal standard to each ml of specimen is satisfactory. Thiscan be conveniently done by adding 100 µl of a 400-ng/ml mescalinemethanolic solution to each ml of specimen. Prepare the 400-ng/mlinternal standard solution by diluting 1 ml of the 0.10-ng/ml stocksolution of mescaline-2H3 to 250 ml with methanol.
Store stock and standard solutions in well-stoppered or capped glassvessels in the dark at less than 0°C.
Extraction
Transfer 1 ml of body fluid (whole blood, plasma or urine) to a 20-mlculture tube equipped with a Teflon-lined screw cap (0.5 to 2 ml ofspecimen can be used, but it must be measured accurately). Add 100µl of the 400-ng/ml mescaline-2H3 solution and vortex for about 10sec. Allow the sample to equilibrate for about 15 min and then in-crease the pH to greater than 10 by adding 1 ml of K2CO3-saturateddistilled water. Extract the basic mixture with 5 ml of 1-chloro-butane by gently mixing the contents for 30 min using a motorizedrocker or rotator. Centrifuge for 5 min and then transfer the or-ganic phase (top) to another 20-ml culture tube by means of a dis-posable Pasteur pipette. Extract the mescaline and other organicbases from the organic phase into aqueous acid by adding 3 ml of 0.2N H2SO4 and gently mixing for at least 15 min. Centrifuge and re-move the top organic phase by aspiration. Add 0.5 ml of 10 N Na0Hto the aqueous phase, mix the contents, and check the pH to makecertain the solution is strongly basic (pH > 10). Finally, reex-tract the organic bases from the aqueous alkaline solution by add-ing 5 ml of methylene chloride and gently mixing for at least 15 min.
193
Centrifuge for 5 min, aspirate off the upper aqueous layer, andtransfer by means of a disposable Pasteur pipette the methylenechloride extract (bottom layer) to a silylated concentrator tubehaving a volume of at least 5 ml, a conical bottom, and a Teflon-lined screw cap. Add 10 µl of dimethylformamide to act as a“keeper solvent” to minimize evaporative loss of the mescaline.Remove the methylene chloride by evaporation under a gentle streamof nitrogen or filtered air while heating the tube to no higherthan 40°C. When the volume of extract has decreased to about 10µl, add 15 µl of N-methyl bis-(trifluoroacetamide) “MBTFA” (PierceChemical Co., Rockford, IL 61105). Cap the tube and heat it at70°C for 15 min. The capped tube can be stored under refriger-ation until the GC/MS analysis is ready to be performed. Immedi-ately before the analysis, allow the tube to warm to room temperature.
GC/MS Analysis
The experimental conditions for the GC/MS analysis for mescalinetrifluoroacetamide are as follows:
GC column: 1.8 m x 2 mm (I.D.) glass column packed with3 percent OV-17 on 100/120 mesh Gas Chrom Q(Applied Science Laboratory, State College,PA 16801)
Carrier andreagent gas: Methane, 15-20 ml/min
Temperatures: Injector, 260°CColumn, 160°C, isothermalGC/MS transfer line, 260°CIon source, 160°C
Under these conditions, the mescaline trifluoroacetamide shouldelute at about 4 min as a narrow, symmetrical peak.
Prior to beginning GC/MS analysis of samples, the performance ofthe total GC/MS system should be evaluated and optimized as des-cribed in Chapter 2. The ions to be monitored occur at m/z 308and 311. They correspond to the protonated molecule ions for mes-caline trifluoroacetamide and mescaline-2H3 trifluoroacetamide,respectively. With the divert valve in the divert position, in-ject 2 to 6 µl of the organic extract into the gas chromatograph.After approximately 1 min, switch the divert valve so that theentire carrier gas flow enters the ion source of the mass spectro-meter, and begin data acquisition. When the mescaline trifluoro-acetamide peak has eluted, cease data acquisition and return thedivert valve to the divert position.
The quantity of mescaline in the specimen is determined by measur-ing the heights (or areas) or the mescaline trifluoroacetamideand mescaline-2H3 trifluoroacetamide peaks in the selected ioncurrent profiles (“ion chromatograms”) and relating the ratioof peak heights to a calibration graph. Calculate the concentrationof mescaline in the specimen by dividing the measured quantity ofmescaline by the exact volume of specimen extracted.
194

Discussion of the Experimental Procedure
The methane chemical ionization mass spectrum of the trifluoro-acetamide derivative of mescaline is shown in Figure 1. The onlyabundant ion in the mass spectrum is the protonated molecule ionat m/z 308. The fragment ion formed by loss of H2NCOCF3 from theprotonated molecule ion is considerably less abundant than it isin the methane CI mass spectra of the other phenylalkylamine drugsincluded in this monograph. This is probably because the amidenitrogen is attached to a primary carbon, rather than a secondarycarbon as is the case in amphetamine, methamphetamine, and DOM.Elimination of H2NCOCF3 from a secondary carbon would lead to amore stable carbonium ion.
195

FIGURE 1. METHANE CI MASS SPECTRUM OF: THE TRIFLUORO-ACETAMIDE DERIVATIVE OF MESCALINE
196

PHYSICAL, CHEMICAL AND SPECTROMETRIC DATA FOR MESCALINE
Nomenclature
Chemical Name: 3,4,5-Trimethoxybenzenethanamine or3,4,5-Trimethoxyphenethylamine
Empirical Formula: C11H17NO3
Chemical Abstracts Registry Number: 54-04-6
Physical Constants
Appearance: White crystals
Melting Point: 35-36°CHydrochloride, 181°C
Boiling Point: 180° (12mm)
Specific Rotation: Optically inactive
Solubility: Moderately soluble in water; soluble in alcohol,chloroform, benzene; almost insoluble in etherand petroleum ether
UV Absorption: max = 268( = 30)
REFERENCES
1.
2.
3.
4.
5.
6.
7.
8.
Staff of Student Association for the Study of Hallucinogens,Mescaline and Peyote: A Literature Review. STASH Press,Madison, WI (1974).
D.T. Teitelbaum and D.C. Wingeleth. J. Anal. Toxicol., 1,36 (1977).
N. Neff, G.V. Rossi, G.D. Chase, and J.L. Rabinowitz. J.Pharmacol. Exp. Ther., 144, 1 (1964).
D.C. Dyer, R. Benington, and R.D. Morin. Arch. Int. Pharma-codyn. Ther., 217, 197 (1975).
J.C. Winter. Arch. Int. Pharmacodyn. Ther., 214, 250 (1975).
F. DeSantis, Jr. and K.A. Nieforth. J. Pharm. Sci., 65,1479 (1976).
J. Harley-Mason, A.H. Laird, and J.R. Smythies. ConfiniaNeurologica, 18, 152 (1958).
R.G. Browne and B.T. Ho. Pharmacol. Biochem. and Behavior,3, 109 (1975).
197

9. E.A. Zeller, J. Barsky, E.R. Berman, M.S. Cherkas, and J.R.Fouts. J. Pharmacol. Exp. Ther., 124, 282 (1958).
10.
11.
12.
13.
14.
15.
16.
17.
18.
19.
20.
L.J. Riceberg, M. Simon, H. Van Vunakis, and R.H. Abeles.Biochem. Pharmacol., 24, 119 (1975).
K.D. Charalampous, K.E. Walker, and J. Kinross-Wright. Psycho-pharmacologia, 9, 48 (1966).
J. Ratcliff'e and P. Smith. Chem. Ind., p. 925 (July 18, 1959).
N.S. Shah and H.E. Himwich. Neuropharmacol., 10, 547 (1971).
B.T. Ho, S.F. Pong, R.G. Browne, and K.E. Walker. Experientia,29, 275 (1973).
L. Demisch and N. Seiler. Biochem. Pharmacol., 24, 575 (1975).
G.F. Phillips and J. Gardiner. J. Pharm. Pharmacol., 21,793 (1969).
J. Lundstrom and S. Agurell. J. Chromatogr., 36, 105 (1968).
L.J. Riceberg, H.Van Vunakis, and L. Levine. Anal. Biochem.60, 551 (1974).
C. Van Peteghem, M. Van den Heede, and A. Heyndrickx in A.Frigerio, ed., Recent Dev. Mass Spectr. Biochem. Med., 4thVolume. Plenum Press, New York, p. 153 (1978).
J.M. Musacchio and M. Goldstein. Biochem. Pharmacol., 16,963 (1967).
198

monograph series
While limited supplies last, single copies of the monographs maybe obtained free of charge from the National Clearinghouse forDrug Abuse Information (NCDAI). Please contact NCDAI also forinformation about availability of coming issues and other publica-tions of the National Institute on Drug Abuse relevant to drugabuse research.
Additional copies may be purchased from the U.S. Government Print-ing Office (GPO) and/or the National Technical Information Service(NTIS) as indicated. NTIS prices are for paper copy. Microfichecopies, at $3.50, are also available from NTIS. Prices from eithersource are subject to change.
Addresses are:
NCDAINational Clearinghouse for Drug Abuse InformationRoom 10A-5600 Fishers LaneRockville, Maryland 20857
GPOSuperintendent of DocumentsU.S. Government Printing OfficeWashington, D.C. 20402
NTISNational Technical Information
ServiceU.S. Department of CommerceSpringfield, Virginia 22161
1 FINDINGS OF DRUG ABUSE RESEARCH. Not available from NCDAI.Vol. 1: GPO out of stock NTIS PB #272 867/AS $22Vol. 2: GPO out of stock NTIS PB #272 868/AS $20
2 OPERATIONAL DEFINITIONS IN SOCIO-BEHAVIORAL DRUG USE RESEARCH1975. Jack Elinson, Ph.D., and David Nurco, Ph.D., eds. Notavailable from NCDAI.GPO out of stock NTIS PB #246 338/AS $11
3 AMINERGIC HYPOTHESES OF BEHAVIOR: REALITY OR CLICHE? Bruce J.Bernard, Ph.D., ed.GPO Stock #017-024-00486-3 $2.25 NTIS PB #246 687/AS $11
199
4 NARCOTIC ANTAGONISTS: THE SEARCH FOR LONG-ACTING PREPARATIONS.Robert Willette, Ph.D., ed.GPO Stock #017-024-00488-0 $1.10 NTIS PB #247 096/AS $6
5 YOUNG MEN AND DRUGS: A NATIONWIDE SURVEY. John A. O'Donnell,Ph.D., et al.GPO Stock #017-024-00511-8 $2.25 NTIS PB #247 446/AS $11
6 EFFECTS OF LABELING THE "DRUG ABUSER": AN INQUIRY. Jay R.Williams, Ph.D.GPO Stock #017-024-00512-6 $1.05 NTIS PB #249 092/AS $6
7 CANNABINOID ASSAYS IN HUMANS. Robert Willette, Ph.D., ed.GPO Stock #017-024-00510-0 $1.95 NITS PB #251 905/AS $10
8 Rx: 3x/WEEK LAAM - ALTERNATIVE TO METHADONE. Jack Blaine, M.D.,and Pierre Renault, M.D., eds.Not available from GPO NTIS PB #253 763/AS $10
9 NARCOTIC ANTAGONISTS: NALTREXONE PROGRESS REPORT. DemetriosJulius, M.D., and Pierre Renault, M.D., eds.GPO Stock #017-024-00521-5 $2.55 NTIS PB #255 833/AS $12
10 EPIDEMIOLOGY OF DRUG ABUSE: CURRENT ISSUES. Louise G. Richards,Ph.D., and Louise B. Blevens, eds. Examines methodological issuesin surveys and data collection. Not available from NCDAI.GPO Stock #017-024-00571-1 $2.60 NTIS PB #266 691/AS $13
11 DRUGS AND DRIVING. Robert Willette, Ph.D., ed. Reviews researchon effects of drugs on psychomotor performance, focusing on measuresof impairment by different drugs at various levels.GPO Stock #017-024-00576-2 $1.70 NTIS PB #269 602/AS $11
12 PSYCHODYNAMICS OF DRUG DEPENDENCE. Jack D. Blaine, M.D., andDemetrios A. Julius, M.D., eds. Theoretical and clinical papers con-cerned with the intrapsychic determinants of drug addiction.GPO Stock #017-024-00642-4 $2.75 NTIS PB #276 084/AS $12
13 COCAINE: 1977. Robert C. Petersen, Ph.D., and Richard C. Still-man, M.D., eds. Reports the extent and limits of current knowledgeabout cocaine, its use and misuse.GPO Stock #017-024-00592-4 $3 NTIS PB #269 175/AS $13
14 MARIHUANA RESEARCH FINDINGS: 1976. Robert C. Petersen, Ph.D.,ed. Technical papers on which the 6th Marihuana and Health Reportto Congress was based.GPO Stock #017-024-00622-0 $3 NTIS PB #271 279/AS $15
15 REVIEW OF INHALANTS: EUPHORIA TO DYSFUNCTION. Charles Wm. Sharp,Ph.D., and Mary Lee Brehm, Ph.D., eds. Review of inhalant abuse,including an extensiue bibliography.GPO Stock #017-024-00650-5 $4.25 NTIS PB #275 798/AS $19
200

16 THE EPIDEMIOLOGY OF HEROIN AND OTHER NARCOTICS. Joan DunneRittenhouse, Ph.D., ed. Task Force report on research technologiesand implications for studying heroin-narcotic use.GPO Stock #017-024-00690-4 $3.50 NTIS PB #276 357/AS $14
17 RESEARCH ON SMOKING BEHAVIOR. Murray E. Jarvik, M.D., Ph.D.,et al., eds. Includes epidemiology, etiology, consequences ofuse, and approaches to behavioral change. From a NIDA-supportedUCLA conference.GPO Stock #017-024-00694-7 $4.50 NTIS PB #276 353/AS $20
18 BEHAVIORAL TOLERANCE: RESEARCH AND TREATMENT IMPLICATIONS.Norman A. Krasnegor, Ph.D., ed. Theoretical and empirical studiesof nonpharmacologic actors in development of drug tolerance.fGPO Stock #017-024-00699-8 $2.75 NTIS PB #276 337/AS $11
19 THE INTERNATIONAL CHALLENGE OF DRUG ABUSE. Robert C. Petersen,Ph.D., ed. Papers from the VI World Congress of Psychiatry whichdeal with drug issues of particular interest worldwide.GPO Stock #017-024-00822-2 $4.50 NTIS PB #293 807/AS $19
20 SELF-ADMINISTRATION OF ABUSED SUBSTANCES: METHODS FOR STUDY.Norman A. Krasnegor, Ph.D., ed. Techniques used to study basicprocesses underlying abuse of drugs, ethanol, food, and tobacco.Not available from GPO NTIS PB #288 471/AS $15
21 PHENCYCLIDINE (PCP) ABUSE: AN APPRAISAL. Robert C. Petersen,Ph.D., and Richard C. Stillman, M.D., eds. Pioneering volume forclinicians and researchers assessing what is known about the prob-lem of PCP abuse.GPO Stock #017-024-00785-4 $4.25 NTIS PB #288 472/AS $17
22 QUASAR: QUANTITATIVE STRUCTURE ACTIVITY RELATIONSHIPS OF ANALGE-SICS, NARCOTIC ANTAGONISTS, AND HALLUCINOGENS. Gene Bamett, Ph.D.;Milan Trsic, Ph.D.; and Robert Willette, Ph.D.; eds. Reports froman interdisciplinary conference on the molecular nature of drug-receptor interactions.GPO Stock #017-024-00786-2 $5.25 NTIS PB #292 265/AS $24
23 CIGARETTE SMOKING AS A DEPENDENCE PROCESS. Norman A. Krasnegor,Ph.D., ed. Discusses factors involved in the onset, maintenance,and cessation of the cigarette smoking habit. Includes an agendafor future research.GPO Stock #017-024-00895-8 $4.50 NTIS PB #297 721/AS $13
24 SYNTHETIC ESTIMATES FOR SMALL AREAS: STATISTICAL WORKSHOP PAPERSAND DISCUSSION. Joseph Steinberg, ed. Papers from a workshop co-sponsored by NIDA and the National Center for Health Statistics ona class of statistical approaches that yield needed estimates ofdata for States and local areas.GPO Stock #017-024-00911-3 $5 NTIS PB #299 009/AS $16
201
25 BEHAVIORAL ANALYSIS AND TREAMENT OF SUBSTANCE ABUSE. Norman A.Krasnegor, Ph.D., ed. Papers present commonalities and implicationsfor treatment of dependency on drugs, ethanol, food, and tobacco.GPO Stock #017-024-00939-3 $4.50 NTIS PB #80-112428 $15
26 THE BEHAVIORAL ASPECTS OF SMOKING. Norman A. Krasnegor, Ph.D. ,ed. Reprint of the behavioral section of the 1979 Report of theSurgeon General on Smoking and Heatth, with an iintroduction bythe editor.GM Stock #017-024-00947-3 $4.25 NTIS PB #80-118755 $12
27 PROBLEMS OF DRUG DEPENDENCE, 1979: PROCEEDINGS OF THE 41ST AN-NUAL SCIENTIFIC MEETING, THE COMMITTEE ON PROBLEMS OF DRUG DEPEN-DENCE, INC. Louis S. Harris, Ph.D., ed. Comprehensive assemblageof ongoing research on drug abuse, addiction, and new compounds.GPO Stock #017-024-00981-4 $8 NTIS PB #80-175482 $25
28 NARCOTIC ANTAGONISTS: NALTREXONE PHARMACOCHEMISTRY AND SUSTAINED-RELEASE PREPARATIONS (DRUG DEVELOPMENT VOLUME VI. Gene Barnett,Ph.D., and Robert Willette, Ph.D., eds. Papers report research oninserted sustained-release and long-acting drug devices, and onpossible use with the narcotic antagonist naltrexone.
In Preparation
29 DRUG ABUSE DEATHS IN NINE CITIES: A SURVEY REPORT. Louis A.Gottschalk, M.D., et al. Epidemiologic study providing data ondrug-involved deaths and procedures for their investigations.GPO Stock #017-024-00982-2 $4.25 NTIS PB #80-178882 $12
30 THEORIES ON DRUG ABUSE: SELECTED CONTEMPORARY PERSPECTIVES.Dan J. Lettieri, Ph.D.; Mollie Sayers; and Helen Wallenstein;eds . Volume presents summaries of the major contemporarytheories of drug abuse by each of 43 leading theorists.GPO Stock #017-024-00997-1 $8.50 Not available from NTIS
31 MARIJUANA RESEARCH FINDINGS: 1980. Robert C. Petersen, Ph.D.,ed. Review of ongoing marijuana research, including technicalpapers on which 8th .Marijuana and Health Report to Congresswas based.GPO Stock #017-024-01010-3 $5 NTIS PB # to be assigned
202
328-011 0 - 80 - 12

DEPARTMENT OFHEALTH AND HUMAN SERVICES POSTAGE AND FEES PAID
U.S DEPARTMENT OF H.H.S.
PUBLIC HEALTH SERVICE HHS 396
ALCOHOL, DRUG ABUSE, ANDTHIRD CLASS
BULK RATEMENTAL HEALTH ADMINISTRATION
5600 FISHERS LANEROCKVILLE, MARYLAND 20857
OFFICIAL BUSINESSPenalty for private use, $300
NOTICE OF MAILING CHANGE
Check here if you wish to discontinue receiving this type of publication
Check here if your address has changed and you wish to continue receivingthis type of publication. (Be sure to furnish your complete address includingzip code.)
Tear off cover with address label still affixed and send to
Alcohol, Drug Abuse, and Mental Health AdministrationPrinting and Publications Management Branch5600 Fishers Lane (Rm. 6C-02)Rockville, Maryland 20857
DHHS Publication No. (ADM) 80-1014Printed 1980