GCA Weekly Digital Media Sector Summary · Weekly Internet / Digital Media / SaaS Sector Summary...
19
1 Weekly Internet / Digital Media / SaaS Sector Summary Week of January 16 th , 2017
-
Upload
nguyenliem -
Category
Documents
-
view
216 -
download
0
Transcript of GCA Weekly Digital Media Sector Summary · Weekly Internet / Digital Media / SaaS Sector Summary...

1
Weekly Internet / Digital Media / SaaS Sector Summary
Week of January 16th, 2017
2
Internet / Digital Media / SaaS
DEAL DASHBOARD
Notes: Source: Capital IQ, PitchBook, and Dow Jones VentureSource. 1) Criteria based on internet/digital media/SaaS Series A and subsequent rounds of global financings greater than or equal to $10MM. Excludes the $7.3Bn raise by Didi Chuxing on 6/15/2016. 2) Financings include Venture and Private Equity Growth/Expansion activity for internet/digital media/SaaS sectors. 3) Criteria based on global target internet/digital media/SaaS M&A deals with transaction enterprise values greater than $50MM. Excludes AT&T’s acquisition of Time Warner announced 10/22/2016. 4) Search/online advertising composite, internet commerce composite, internet content composite, diversified marketing composite, SaaS composite and social media composite used as proxy for
internet/digital media/SaaS landscape. Details on companies included can be found on the public valuation company slides.
DM Composite SPX
Quarterly Financing Deal Count (1)(2) Quarterly M&A Deal Count (3)
Select Financing Transactions Quarterly Financing Volume ($Bn) (1)(2) Quarterly M&A Volume ($Bn) (3)
Select M&A Transactions
Company Amount ($MM) Acquirer Target EV ($Bn)
$750.0 $26.2
$653.0 $8.7
$60.0 $4.8
$60.0 $4.7
$50.0 $4.3
$40.0 $2.9
$35.0 $2.9
$20.0 $2.8
Last 12 Months Digital Media Price Performance vs. S&P 500 (4)
778
Financing Transactions 2016 (1)(2)
$42.5 Billion
Financing Volume 2016 (1)(2)
$111.7 Billion
M&A Volume 2016 (3)
108
M&A Transactions 2016 (3)
143 149
194210 201
226
184167
0
50
100
150
200
250
$7
$9$11 $10
$13$14
$8 $8
$0
$5
$10
$15
$4
$16$20 $21
$6
$55
$36
$14
$0
$10
$20
$30
$40
$50
$60
1720
32 31
25
32
25 26
0
10
20
30
40
18%
22%
3
60%
80%
100%
120%
140%
160%
1/18/2016 3/10/2016 5/1/2016 6/22/2016 8/13/2016 10/4/2016 11/25/2016 1/16/2017
80%
90%
100%
110%
120%
10/18/2016 11/2/2016 11/17/2016 12/2/2016 12/17/2016 1/1/2017 1/16/2017
22.3%
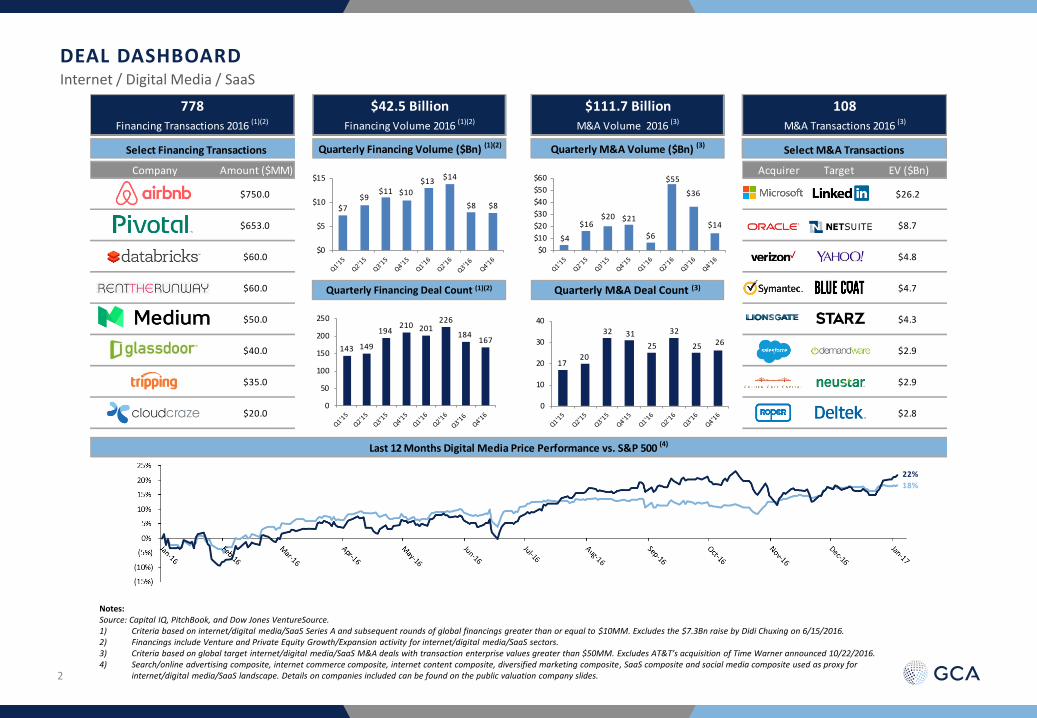
35.6%
7.3%
19.7%
36.4%
3.0%
14.6% 14.8%
24.5%
(7.8%)
INDUSTRY STOCK MARKET VALUATION
Internet / Digital Media / SaaS
Notes: (1) Search/Online Advertising Composite includes: CRTO, GOOGL, FUEL, MCHX, MRIN, MSFT, MXPT, QNST, RTHM, RUBI, TRMR, TTD, YNDX, YUME. (2) Internet Commerce Composite includes: AMZN, ANGI, BABA, CMPR, CPRT, EBAY, ETSY, EXPE, FLWS, GRUB, NFLX, NILE, OSTK, PCLN, PRSS, QUOT, QVCA, SSTK, STMP, TRVG, TZOO. (3) Internet Content Composite includes: CRCM, DHX, EHTH, GDDY, IAC, RATE, RENN, SCOR, SFLY, TGNA, TTGT, WBMD, WEB, XOXO, ZG. (4) Publishers Composite includes: GCI, GHC, MMB-FR, NWSA, NYT, PSON-GB, SSP, TIME, TRI, UBM-GB. (5) Diversified Marketing Composite includes: ACXM, ADS, EFX, EXPN-GB, HAV-FR, HHS, IPG, MDCA, NLSN, WPP-GB. (6) Media Conglomerates Composite includes: CBS, CMCSA, DIS, DISCA, FOXA, SNI, SONY (6758-JP), TRCO, VIAB. (7) Gaming Composite includes: ATVI, CYOU, DENA (2432-JP), EA, GAM, GLUU, GREE (3632-JP), GHO (3765-JP), NVR (A035420-KR), NCSOFT(A036570-KR), NTES, TENCENT (700-HK) ,UBI-FR, ZNGA. (8) SaaS Composite includes: APPF, APTI, BCOV, BOX, BV, COUP, CRM, CSOD, ECOM, EVBG, HUBS, JIVE, LPSN, MB, MRIN, NOW, NTNX, RNG, RP, SHOP, ULTI, WDAY, XTLY, ZEN. (9) Social Media includes: FB, LINE (3938-JP), P, TWTR, YELP.
Diversified Marketing (5)
Internet Content (3)
Search / Online Advertising (1)
Gaming (7)
Media Conglomerates (6)
Internet Commerce (2)
SaaS (8)
Publishers (4)
NASDAQ
Social Media (9)
Last 12 Months Last 3 Months
34.7%
9.0%
(1.6%)
13.0%
7.9% 6.3%
9.1%
(0.6%)
4.6%
(1.1%)
INDUSTRY STOCK MARKET VALUATION

4
37.4x
22.1x 21.7x
14.2x 13.4x 12.8x 11.2x
9.7x 9.0x
0.0x
10.0x
20.0x
30.0x
40.0x
5.8x
5.2x
3.7x3.4x 3.0x 2.7x
2.5x2.0x
1.7x
0.0x
1.0x
2.0x
3.0x
4.0x
5.0x
6.0x
7.0x
INDUSTRY STOCK MARKET VALUATION Internet / Digital Media / SaaS: Financial Metrics
EV / 2016E Revenue EV / 2016E EBITDA
Mean: 3.3x Median: 3.0x
Mean: 16.8x Median: 13.2x
Notes: (1) Search/Online Advertising Composite includes: CRTO, GOOGL, FUEL, MCHX, MRIN, MSFT, MXPT, QNST, RTHM, RUBI, TRMR, TTD, YNDX, YUME. (2) Internet Commerce Composite includes: AMZN, ANGI, BABA, CMPR, CPRT, EBAY, ETSY, EXPE, FLWS, GRUB, NFLX, NILE, OSTK, PCLN, PRSS, QUOT, QVCA, SSTK, STMP, TRVG, TZOO. (3) Internet Content Composite includes: CRCM, DHX, EHTH, GDDY, IAC, RATE, RENN, SCOR, SFLY, TGNA, TTGT, WBMD, WEB, XOXO, ZG. (4) Publishers Composite includes: GCI, GHC, MMB-FR, NWSA, NYT, PSON-GB, SSP, TIME, TRI, UBM-GB. (5) Diversified Marketing Composite includes: ACXM, ADS, EFX, EXPN-GB, HAV-FR, HHS, IPG, MDCA, NLSN, WPP-GB. (6) Media Conglomerates Composite includes: CBS, CMCSA, DIS, DISCA, FOXA, SNI, SONY (6758-JP), TRCO, VIAB. (7) Gaming Composite includes: ATVI, CYOU, DENA (2432-JP), EA, GAM, GLUU, GREE (3632-JP), GHO (3765-JP), NVR (A035420-KR), NCSOFT(A036570-KR), NTES, TENCENT (700-HK) ,UBI-FR, ZNGA. (8) SaaS Composite includes: APPF, APTI, BCOV, BOX, BV, COUP, CRM, CSOD, ECOM, EVBG, HUBS, JIVE, LPSN, MB, MRIN, NOW, NTNX, RNG, RP, SHOP, ULTI, WDAY, XTLY, ZEN. (9) Social Media includes: FB, LINE (3938-JP), P, TWTR, YELP.
5
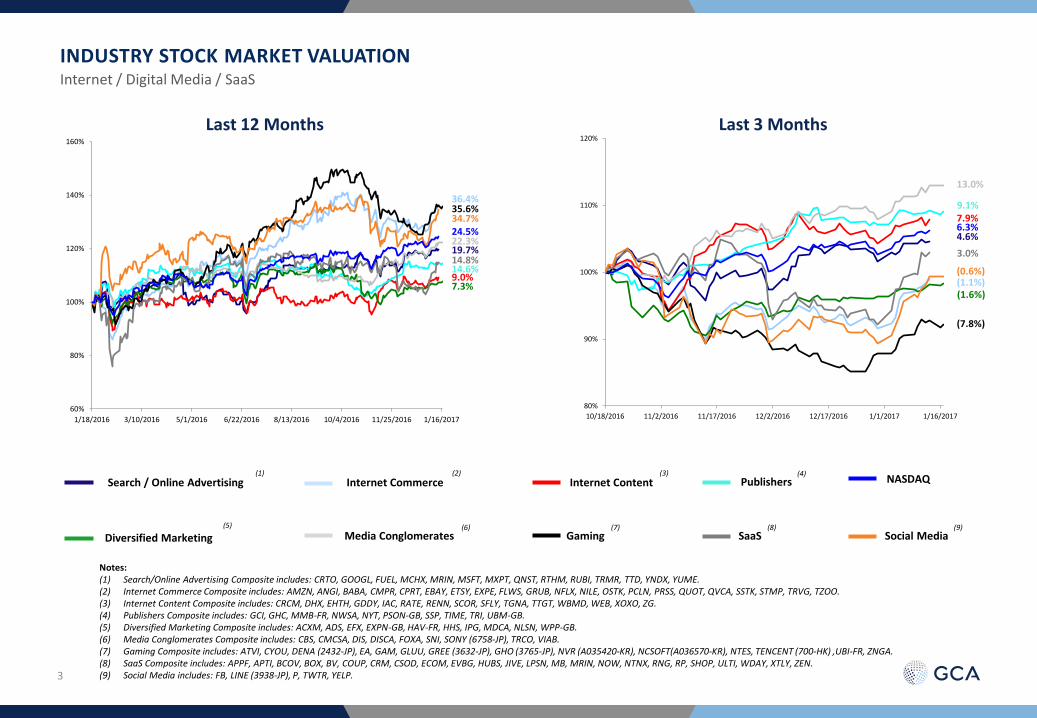
PUBLIC COMPANY VALUATIONS Internet / Digital Media / SaaS: Financial Metrics (Cont’d)
Notes: Source: Capital IQ and Wall Street Estimates. Multiples <0 and >100 considered NM. (1) Revenue multiples reflective of Net Revenue.
$MM, Except Per Share Data
Stock LTM EPS
Price Price Range Equity Net Enterprise EV / Revenue EV / EBITDA Price / EPS Long Term Revenue Growth
1/17/17 Low High Value Debt Value LTM CY 16E CY 17E LTM CY 16E CY 17E LTM CY 16E CY 17E Growth PEG 17E/16E Y/Y MRQ
Search / Online Advertising
Alphabet Inc. $827.46 $672.66 $839.00 $570,319 ($79,118) $491,201 5.7x 5.5x 4.8x 17.4x 13.6x 11.6x 30.3x 23.8x 20.1x 17.1% 1.2 15.7% 20.2%
Microsoft Corporation 62.53 48.04 64.10 486,193 (60,857) 425,336 5.0 4.6 4.4 15.8 12.2 11.5 29.9 21.9 20.4 8.9% 2.3 4.1% 0.4%
Yandex N.V. 21.92 11.00 23.87 7,054 (690) 6,377 5.6 5.2 4.2 19.0 15.0 11.9 53.4 29.7 23.0 23.7% 1.0 23.1% 30.2%
Criteo SA (1) 44.03 24.23 47.81 2,807 (398) 2,419 5.1 3.4 2.6 15.9 11.4 8.8 35.5 23.5 19.3 28.3% 0.7 29.9% 27.4%
The Trade Desk, Inc. (1) 28.99 22.00 33.40 1,118 (72) 1,046 6.0 5.4 4.2 19.6 18.8 14.9 NM 38.4 34.2 25.9% 1.3 28.8% 116.6%
The Rubicon Project, Inc. (1) 8.48 6.12 20.37 416 (193) 223 0.7 0.9 0.9 4.7 3.5 3.5 19.1 9.0 12.6 NM NM 1.2% 2.4%
RhythmOne plc 0.50 0.19 0.55 203 (41) 163 1.0 0.9 0.7 NM NM 14.2 NM NM 40.7 NM NM 34.4% (11.7%)
QuinStreet, Inc. 3.92 2.61 4.32 179 (39) 141 0.5 0.6 0.6 NM 30.5 14.4 NM 99.7 NM NM NM 2.1% 1.4%
Tremor Video, Inc. 2.44 1.29 2.76 127 (48) 79 0.5 0.5 0.4 NM NM 11.1 NM NM NM NA NA 13.0% (0.8%)
YuMe, Inc. 3.56 2.77 4.36 122 (62) 60 0.4 0.4 0.4 NM 7.4 6.3 NM NM 17.0 NA NA 2.0% (10.1%)
Marchex, Inc. 2.58 2.46 4.68 112 (105) 7 0.0 0.1 0.1 NM NM NM NM NM NM 15.0% NM (14.0%) (16.6%)
Rocket Fuel Inc. 2.10 1.70 4.10 96 9 105 0.2 0.2 0.2 NM 8.2 8.1 NM NM NM 3.0% NM 2.9% (1.9%)
Marin Software Incorporated 2.30 1.88 3.62 89 (33) 55 0.5 0.6 0.6 NM NM 20.8 NM NM NM NA NA (3.5%) (8.8%)
MaxPoint Interactive, Inc. 4.30 3.85 11.94 29 2 31 0.2 0.3 0.3 NM NM 34.3 NM NM NM 20.0% NM 5.1% 4.0%
Mean 2.3x 2.0x 1.7x 15.4x 13.4x 13.2x 33.7x 35.2x 23.4x 17.7% 1.3 10.3% 10.9% Median 0.6 0.7 0.6 16.6 12.2 11.6 30.3 23.8 20.3 18.5% 1.2 4.6% 0.9%
Internet Content
Zillow Group, Inc. $37.09 $16.46 $39.99 $6,640 ($215) $6,425 8.2x 7.6x 6.2x NM 46.0x 27.4x NM NM 63.5x 58.0% 1.1 22.5% 27.1%
IAC/InterActiveCorp 69.69 38.82 71.46 5,526 274 5,937 1.9 1.9 1.8 15.2 12.0 9.9 NM 27.6 20.2 18.9% 1.1 7.6% (8.9%)
TEGNA Inc. 21.35 17.91 25.38 4,578 4,131 9,049 2.8 2.7 2.6 7.8 7.3 8.0 10.1 9.5 11.4 NA NA 3.4% 13.6%
GoDaddy Inc. 35.20 23.88 37.40 3,079 475 3,752 2.1 2.0 1.8 17.7 9.1 7.9 NM 21.7 21.1 NM NM 13.3% 14.8%
WebMD Health Corp. 50.92 45.46 67.55 1,869 6 1,874 2.7 2.7 2.5 10.6 8.2 7.6 28.5 26.7 25.1 12.5% 2.0 5.5% 12.3%
comScore, Inc. 32.13 21.74 43.53 1,837 (114) 1,723 4.7 3.3 2.9 46.4 14.4 11.3 NM 21.5 18.3 30.0% 0.6 13.1% 8.4%
Shutterfly, Inc. 53.33 35.91 54.60 1,810 308 2,119 1.9 1.8 1.7 15.7 9.6 8.3 32.8 83.8 49.5 NM NM 9.3% 11.8%
Bankrate, Inc. 11.25 6.59 12.93 1,014 159 1,173 2.8 2.7 2.4 12.6 10.3 9.4 NM 18.0 16.4 17.5% 0.9 12.9% 29.2%
Web.com Group, Inc. 19.20 12.90 21.20 905 664 1,569 2.4 2.2 2.1 12.5 8.9 8.3 12.5 7.1 6.7 13.4% 0.5 3.6% 39.4%
Renren Inc. 1.70 1.51 3.58 578 24 602 13.0 9.5 6.3 NM NM NM NM NM NM 20.0% NM 50.6% NA
XO Group Inc. 19.17 13.64 20.99 488 (101) 386 2.6 2.5 2.3 18.9 12.2 11.0 76.4 49.2 41.5 17.5% 2.4 10.3% 5.8%
DHI Group, Inc. 6.15 4.95 9.64 306 61 367 1.5 1.6 1.7 7.1 6.3 6.9 NM 17.1 19.0 NA NA (3.0%) (13.9%)
TechTarget, Inc. 8.78 5.98 9.24 244 8 252 2.3 2.4 2.1 17.4 14.2 9.2 66.5 33.5 19.2 27.7% 0.7 11.9% (11.2%)
Care.com, Inc. 8.40 4.90 12.00 242 (71) 171 1.1 1.1 0.9 38.9 14.7 10.1 NM 55.9 29.5 17.5% 1.7 13.0% 12.7%
eHealth, Inc. 12.29 6.38 15.14 225 (67) 158 0.8 0.9 0.9 16.5 25.5 23.7 NM 36.1 NM 10.0% NM (2.1%) (16.1%)
Mean 3.4x 3.0x 2.5x 18.3x 14.2x 11.4x 37.8x 31.4x 26.3x 22.1% 1.2 11.5% 8.9% Median 2.4 2.4 2.1 15.7 11.1 9.3 30.6 26.7 20.2 17.5% 1.1 10.3% 12.1%

6
PUBLIC COMPANY VALUATIONS Internet / Digital Media / SaaS: Financial Metrics (Cont’d)
Notes: Source: Capital IQ and Wall Street Estimates. Multiples <0 and >100 considered NM. (1) Reflects Expedia's 63.5% controlling equity stake.
$MM, Except Per Share Data
Stock LTM EPS
Price Price Range Equity Net Enterprise EV / Revenue EV / EBITDA Price / EPS Long Term Revenue Growth
1/17/17 Low High Value Debt Value LTM CY 16E CY 17E LTM CY 16E CY 17E LTM CY 16E CY 17E Growth PEG 17E/16E Y/Y MRQ
Internet Commerce
Amazon.com, Inc. $809.72 $474.00 $847.21 $384,752 $641 $385,393 3.0x 2.8x 2.3x 35.2x 25.7x 19.9x NM NM 89.2x 52.4% 1.7 22.8% 29.0%
Alibaba Group Holding Limited 96.12 59.25 109.87 240,300 (7,448) 233,592 12.4 16.2 12.6 35.7 31.5 25.3 46.7 39.4 31.6 24.5% 1.3 28.7% 47.4%
The Priceline Group Inc. 1,540.13 954.02 1,600.93 75,998 2,967 78,965 7.6 7.4 6.4 19.7 18.6 15.9 39.3 22.5 19.9 17.9% 1.1 15.5% 18.9%
Netflix, Inc. 132.89 79.95 133.93 57,030 1,031 58,060 7.1 6.6 5.3 NM 99.1 55.8 NM NM NM 50.1% NM 24.9% 31.7%
eBay Inc. 30.29 21.52 33.19 33,862 986 34,848 3.9 3.9 3.7 11.5 10.1 9.6 18.9 16.1 14.6 8.0% 1.8 4.4% 5.6%
Expedia, Inc. 118.58 88.40 133.55 17,791 1,319 20,755 2.5 2.4 2.1 20.4 12.8 10.6 94.3 25.3 19.7 21.6% 0.9 14.6% 33.2%
QVC Group 19.30 17.88 27.25 9,013 6,104 15,239 1.5 1.5 1.4 8.6 8.0 7.6 7.4 11.4 10.3 12.8% 0.8 3.2% 14.7%
Copart, Inc. 56.55 32.26 57.58 6,480 576 7,056 5.3 5.2 4.8 15.1 14.2 13.2 17.6 23.8 22.0 14.8% 1.5 6.9% 19.8%
GrubHub Inc. 39.13 17.77 44.58 3,349 (297) 3,053 6.7 6.2 4.9 29.1 21.1 16.5 71.2 43.0 34.0 23.0% 1.5 25.5% 44.1%
Cimpress N.V. 95.02 67.89 104.18 3,007 635 3,708 2.0 1.9 1.6 17.5 13.9 11.7 NM 32.3 31.1 20.5% 1.5 19.1% 18.1%
trivago N.V. (1) 11.71 11.10 12.61 2,799 (5) 2,797 3.6 3.6 2.6 NM NM 40.7 NA NM 85.2 NA NA 38.5% 56.0%
Stamps.com Inc. 119.70 68.82 123.75 2,041 81 2,122 6.5 6.0 5.1 17.6 12.9 10.9 46.6 14.3 14.2 20.3% 0.7 16.0% 79.1%
Shutterstock, Inc. 48.22 25.44 65.16 1,694 (290) 1,403 2.9 2.8 2.4 21.6 14.3 11.8 58.1 30.8 28.5 16.5% 1.7 15.8% 14.7%
Etsy, Inc. 12.77 6.04 16.05 1,476 (258) 1,217 3.6 3.4 2.7 32.9 21.6 16.2 NM NM 49.2 10.0% 4.9 22.8% 33.3%
Quotient Technology Inc. 10.45 5.00 14.36 920 (139) 781 2.9 2.9 2.5 NM 28.1 17.9 NM NM 49.8 43.6% 1.1 14.7% 17.7%
1-800-FLOWERS.COM, Inc. 10.10 6.11 11.40 659 229 888 0.8 0.7 0.7 11.8 10.4 8.9 26.5 23.7 18.8 19.0% 1.0 4.9% 6.3%
Blue Nile, Inc. 40.69 22.33 41.39 477 (40) 437 0.9 0.9 0.9 26.7 17.8 17.0 50.2 46.2 43.8 5.0% 8.8 2.1% (4.4%)
Angie's List, Inc. 7.43 6.32 10.76 440 20 460 1.4 1.4 1.4 23.9 18.2 12.8 NM NM NM 8.0% NM 0.1% (8.3%)
Overstock.com, Inc. 16.80 10.03 19.70 426 (75) 350 0.2 0.2 0.2 NM 9.9 19.8 45.3 NM NM NA NA 8.0% 12.9%
Travelzoo Inc. 9.95 6.63 13.27 138 (25) 112 0.9 0.9 0.9 9.2 9.0 10.0 38.3 22.5 24.2 5.0% 4.8 (0.5%) (9.7%)
CafePress Inc. 3.40 2.80 3.99 57 (35) 21 0.2 0.2 0.2 NM 37.2 17.9 NM NM NM NA NA 6.3% (1.6%)
Mean 3.6x 3.7x 3.1x 21.0x 21.7x 17.6x 43.1x 27.0x 34.5x 20.7% 2.2 14.0% 21.8% Median 2.9 2.8 2.4 20.1 16.0 15.9 45.3 23.8 28.5 18.5% 1.5 14.7% 18.1%
Media Conglomerates / Selected Entertainment
Comcast Corporation $72.56 $52.34 $72.94 $173,624 $57,621 $234,913 3.0x 2.9x 2.8x 9.1x 8.9x 8.5x 21.3x 20.9x 19.3x 11.3% 1.7 4.0% 14.2%
The Walt Disney Company 107.97 86.25 109.49 171,830 15,560 191,448 3.4 3.4 3.3 11.3 11.1 10.6 18.8 19.4 17.6 10.0% 1.8 5.1% (2.7%)
Twenty-First Century Fox, Inc. 29.93 22.66 31.25 55,530 14,807 72,138 2.6 2.6 2.4 10.8 10.3 9.9 20.4 15.6 15.2 11.9% 1.3 5.2% 7.1%
Sony Corporation 31.06 19.49 31.64 39,205 (3,539) 41,875 0.6 0.6 0.6 6.9 8.4 5.7 70.1 NM 21.9 18.0% 1.2 7.0% 5.5%
CBS Corporation 62.26 41.36 66.88 26,754 8,778 35,532 2.5 2.4 2.4 10.6 10.4 10.2 17.2 15.1 14.0 16.9% 0.8 0.9% 4.3%
Discovery Communications, Inc. 27.81 23.66 29.75 16,563 7,609 24,419 3.8 3.8 3.6 10.0 10.0 9.6 15.7 13.4 12.0 13.1% 0.9 5.2% (0.1%)
Viacom, Inc. 38.69 30.11 47.47 15,353 11,420 27,037 2.2 2.2 2.1 9.2 9.8 8.4 10.7 11.6 9.6 2.0% 4.9 3.0% (14.8%)
Scripps Networks Interactive, Inc. 75.02 52.00 75.84 9,686 3,253 13,245 3.9 3.9 3.7 8.9 9.6 9.3 12.4 14.2 14.0 9.7% 1.4 4.2% 3.5%
Tribune Media Company 28.80 26.10 40.72 2,518 2,772 5,295 2.5 2.5 2.5 12.8 9.3 11.1 NM 35.4 20.4 3.0% 6.8 (0.6%) 6.0%
Mean 2.7x 2.7x 2.6x 9.9x 9.7x 9.2x 23.3x 18.2x 16.0x 10.7% 2.3 3.8% 2.5% Median 2.6 2.6 2.5 10.0 9.8 9.6 18.0 15.3 15.2 11.3% 1.4 4.2% 4.3%
Publishers
Thomson Reuters Corporation $44.80 $36.42 $45.94 $32,666 $8,520 $41,668 3.4x 3.7x 3.6x 16.3x 13.2x 12.5x 26.5x 21.8x 19.2x 8.0% 2.4 1.9% (0.1%)
Pearson plc 10.00 7.97 12.24 8,153 2,162 10,318 1.8 1.9 1.8 12.6 11.3 9.3 NM 14.7 12.5 1.9% 6.6 5.7% (21.0%)
News Corporation 12.23 10.21 14.68 7,113 (1,122) 6,207 0.8 0.8 0.8 9.5 6.9 6.8 NM 38.8 29.9 8.2% 3.6 (2.1%) (2.4%)
UBM plc 9.01 6.64 9.28 3,545 49 3,634 3.4 3.5 3.1 12.7 12.2 10.2 30.0 19.4 15.1 11.2% 1.3 14.7% (8.7%)
Lagardère SCA 27.29 19.64 29.03 3,497 1,931 5,571 0.7 0.7 0.7 9.2 8.3 8.0 29.2 14.1 13.0 5.8% 2.2 (0.5%) 3.2%
Graham Holdings Company 522.85 427.56 547.80 2,935 (504) 2,441 1.0 NA NA 6.9 NA NA 16.2 NA NA NA NA NA (3.1%)
The New York Times Company 13.50 10.60 14.20 2,175 (311) 1,860 1.2 1.2 1.2 8.1 8.0 8.5 50.2 26.1 24.2 NA NA 0.2% (1.0%)
Time Inc. 19.15 12.23 20.40 1,897 937 2,834 0.9 0.9 0.9 9.0 6.9 6.8 NM 16.0 14.2 8.5% 1.7 (1.9%) (3.0%)
The E. W. Scripps Company 18.38 12.16 19.99 1,524 308 1,832 2.1 1.9 2.0 21.1 9.2 13.7 NM 23.7 50.7 NA NA (2.1%) 22.9%
Gannett Co., Inc. 9.68 7.30 17.72 1,129 268 1,397 0.5 0.5 0.4 4.2 4.4 4.1 29.1 9.1 9.0 NM NM 5.6% 10.1%
Mean 1.6x 1.7x 1.6x 10.9x 9.0x 8.9x 30.2x 20.4x 20.9x 7.3% 3.0 2.4% (0.3%) Median 1.1 1.2 1.2 9.3 8.3 8.5 29.2 19.4 15.1 8.1% 2.3 0.2% (1.7%)

7
PUBLIC COMPANY VALUATIONS Internet / Digital Media / SaaS: Financial Metrics (Cont’d)
Notes: Source: Capital IQ and Wall Street Estimates. Multiples <0 and >100 considered NM.
$MM, Except Per Share Data
Stock LTM EPS
Price Price Range Equity Net Enterprise EV / Revenue EV / EBITDA Price / EPS Long Term Revenue Growth
1/17/17 Low High Value Debt Value LTM CY 16E CY 17E LTM CY 16E CY 17E LTM CY 16E CY 17E Growth PEG 17E/16E Y/Y MRQ
Diversified Marketing
WPP plc $23.05 $14.90 $23.56 $29,527 $5,649 $35,785 2.1x 2.1x 1.9x 14.1x 12.4x 11.2x 26.9x 16.8x 14.7x 9.1% 1.6 11.0% (5.4%)
Experian plc 19.53 13.17 20.02 19,134 3,161 22,309 4.8 NA 4.6 15.9 NA 13.0 22.1 NA 20.1 10.0% 2.0 NA 2.6%
Nielsen Holdings plc 42.37 40.96 55.94 15,144 7,523 22,856 3.6 3.6 3.6 14.7 11.9 11.6 26.0 15.4 15.6 8.8% 1.8 1.0% 2.5%
Equifax Inc. 120.66 91.72 136.97 14,450 2,732 17,223 5.7 5.5 5.0 16.6 15.3 13.9 30.5 22.0 20.1 12.0% 1.7 8.6% 20.5%
Alliance Data Systems Corporation 230.00 176.63 257.05 13,285 17,839 31,123 4.4 4.3 3.9 18.6 15.2 14.0 24.3 13.6 12.3 16.0% 0.8 9.6% 18.7%
The Interpublic Group of Companies, Inc. 23.52 19.79 24.82 9,338 846 10,465 1.3 1.3 1.3 9.8 9.5 8.9 17.6 17.9 16.3 11.1% 1.5 3.4% 3.0%
Havas SA 9.05 6.92 9.09 3,800 99 3,913 1.6 1.6 1.5 9.8 9.9 9.3 19.4 18.6 17.0 7.0% 2.4 5.5% 4.8%
Acxiom Corporation 27.38 17.32 27.73 2,125 (1) 2,124 2.4 2.4 2.3 24.5 13.8 12.1 NM 41.7 38.4 15.0% 2.6 4.9% 4.8%
MDC Partners Inc. 6.75 2.75 23.90 361 930 1,418 1.0 1.0 1.0 10.2 8.5 6.9 NM NM 9.4 6.0% 1.6 5.8% 6.3%
Harte Hanks, Inc. 1.53 0.85 3.73 94 54 149 0.3 0.3 0.3 11.6 4.1 3.3 NM 10.9 7.3 NA NA 0.5% (10.4%)
Mean 2.7x 2.5x 2.5x 14.6x 11.2x 10.4x 23.8x 19.6x 17.1x 10.5% 1.8 5.6% 4.7% Median 2.3 2.1 2.1 14.4 11.9 11.4 24.3 17.3 15.9 10.0% 1.7 5.5% 3.9%
Gaming
Tencent Holdings Limited $25.49 $17.03 $28.47 $239,144 ($443) $240,223 11.6x 11.0x 8.1x 27.2x 26.2x 19.8x 42.7x 37.4x 28.1x 27.8% 1.0 35.4% 44.8%
NetEase, Inc. 243.08 129.60 272.58 31,959 (4,177) 27,819 5.5 5.1 4.0 16.2 14.8 12.2 21.3 18.3 15.6 19.2% 0.8 26.2% 31.6%
Activision Blizzard, Inc. 38.95 26.49 45.55 28,948 2,333 31,281 5.3 4.8 4.6 16.5 13.2 13.0 33.8 19.2 18.6 21.7% 0.9 3.8% 58.4%
Electronic Arts Inc. 80.23 53.01 86.07 24,210 (2,276) 21,934 4.8 4.6 4.3 18.4 14.3 12.9 20.4 23.6 20.0 12.4% 1.6 7.6% 10.2%
Naver Corporation 683.36 467.61 776.19 19,911 (2,937) 17,447 5.0 5.2 4.3 17.1 16.4 12.3 31.9 32.8 24.3 34.5% 0.7 20.9% 29.8%
Gamesa Corporación Tecnológica, S.A. 20.90 14.26 23.67 5,786 (281) 5,505 1.1 1.1 0.9 9.6 8.0 6.6 20.0 18.7 17.3 18.5% 0.9 24.4% 31.0%
NCsoft Corporation 241.54 183.09 263.89 5,130 (676) 4,463 5.2 5.7 4.3 14.6 15.9 11.0 23.1 24.0 17.3 35.9% 0.5 31.3% 19.7%
Ubisoft Entertainment SA 32.76 19.91 41.61 3,664 (42) 3,622 2.2 2.3 1.5 15.4 NA 4.2 32.5 29.7 20.3 36.1% 0.6 54.5% 36.7%
DeNA Co., Ltd. 23.31 13.58 35.06 3,382 (782) 2,672 1.9 2.1 2.0 7.5 8.3 6.0 21.7 21.6 19.0 22.1% 0.9 5.5% 21.7%
Zynga Inc. 2.63 1.78 3.08 2,346 (871) 1,475 2.0 2.0 1.8 NM 25.6 14.5 NM NM 38.2 21.0% 1.8 12.7% (6.8%)
GungHo Online Entertainment, Inc. 2.18 2.00 3.07 1,551 (256) 1,310 1.1 1.3 1.5 2.5 3.2 3.9 7.0 7.4 8.0 NA NA (12.1%) (16.7%)
Gree, Inc. 5.46 4.06 6.03 1,280 (806) 474 0.7 0.9 0.9 3.8 4.3 5.5 7.7 12.5 17.7 NA NA 1.8% (8.7%)
Changyou.com Limited 24.92 15.21 30.28 1,266 (848) 447 0.8 0.9 0.7 2.9 3.0 2.6 9.3 9.3 8.0 NM NM 15.2% (28.1%)
Glu Mobile Inc. 2.23 1.73 4.00 298 (148) 150 0.7 0.7 0.7 NM NM NM NM NM NM 15.0% NM 5.9% (18.8%)
Mean 3.4x 3.4x 2.8x 12.6x 12.8x 9.6x 22.6x 21.2x 19.4x 24.0% 1.0 16.6% 14.6% Median 2.1 2.2 1.9 15.0 13.8 11.0 21.5 20.4 18.6 21.7% 0.9 13.9% 20.7%
Social Media & New Platform
Facebook, Inc. $127.87 $89.37 $135.60 $368,543 ($26,140) $342,403 13.9x 12.5x 9.3x 26.6x 19.4x 14.8x 49.3x 31.0x 24.7x 31.5% 0.8 34.3% 55.8%
Twitter, Inc. 16.96 39.40 26.20 12,031 771 12,802 5.1 5.0 4.6 NM 17.9 15.3 NM 32.7 28.0 22.4% 1.2 9.7% 8.2%
LINE Corporation 36.52 33.51 46.36 7,947 (1,284) 6,666 5.0 5.3 4.3 34.9 27.2 16.0 81.0 NM 37.4 54.4% 0.7 25.0% 54.6%
Yelp Inc. 40.36 14.53 43.36 3,167 (432) 2,734 4.1 3.8 3.1 NM 24.1 16.8 NM 55.9 37.7 33.1% 1.1 25.7% 29.7%
Pandora Media, Inc. 12.75 7.10 15.25 2,975 80 3,055 2.3 2.2 1.8 NM NM NM NM NM NM 47.0% NM 22.8% 12.9%
Mean 6.1x 5.8x 4.6x 30.8x 22.1x 15.7x 65.2x 39.9x 31.9x 37.7% 1.0 23.5% 32.2% Median 5.0 5.0 4.3 30.8 21.8 15.6 65.2 32.7 32.7 33.1% 1.0 25.0% 29.7%

8
PUBLIC COMPANY VALUATIONS Internet / Digital Media / SaaS: Financial Metrics (Cont’d)
Notes: Source: Capital IQ and Wall Street Estimates. Multiples <0 and >100 considered NM.
$MM, Except Per Share Data
Stock LTM EPS
Price Price Range Equity Net Enterprise EV / Revenue EV / EBITDA Price / EPS Long Term Revenue Growth
1/17/17 Low High Value Debt Value LTM CY 16E CY 17E LTM CY 16E CY 17E LTM CY 16E CY 17E Growth PEG 17E/16E Y/Y MRQ
SaaS
salesforce.com, inc. $75.02 $52.60 $84.48 $50,946 $1,315 $52,261 6.6x 6.2x 5.1x 97.8x 30.5x 24.6x NM 76.6x 58.3x 27.0% 2.2 21.6% 25.3%
Workday, Inc. 80.99 47.32 93.35 16,279 (1,386) 14,893 10.2 9.5 7.5 NM NM 67.8 NM NM NM 32.6% NM 27.5% 34.2%ServiceNow, Inc. 81.41 46.00 89.79 13,515 (308) 13,207 10.2 9.5 7.3 NM 50.6 34.1 NM NM 77.8 42.5% 1.8 30.0% 37.0%The Ultimate Software Group, Inc. 193.18 148.26 224.07 5,602 (100) 5,502 7.4 7.0 5.7 85.2 29.5 23.3 NM 59.6 48.3 26.4% 1.8 24.0% 26.8%Shopify Inc. 49.52 18.58 49.43 4,418 (400) 4,018 12.2 10.6 7.1 NM NM NM NM NM NM 25.0% NM 47.9% 88.6%Nutanix, Inc. 30.05 23.11 46.78 4,275 (347) 3,928 7.5 6.8 4.5 NM NM NM NM NM NM 30.0% NM 51.9% 90.1%
Cornerstone OnDemand, Inc. 41.07 22.25 47.75 2,308 (1) 2,306 5.6 5.4 4.7 NM 66.6 47.2 NM NM NM 20.0% NM 15.4% 23.5%
RealPage, Inc. 28.25 16.06 30.85 2,273 (133) 2,141 4.0 3.8 3.3 28.5 17.1 14.4 NM 38.1 31.3 20.0% 1.6 14.4% 21.7%
Zendesk, Inc. 22.59 11.06 31.88 2,154 (211) 1,942 6.8 6.3 4.7 NM NM NM NM NM NM 24.3% NM 32.3% 45.0%
Box, Inc. 16.62 8.82 17.39 2,104 (102) 2,002 5.4 5.0 4.0 NM NM NM NM NM NM NM NM 26.0% 30.7%
HubSpot, Inc. 51.05 27.00 59.97 1,818 (113) 1,705 6.9 6.3 4.9 NM NM NM NM NM NM 25.0% NM 30.3% 48.0%
RingCentral, Inc. 21.70 13.88 25.00 1,597 (136) 1,460 4.1 3.9 3.1 NM 67.8 46.4 NM NM NM 28.8% NM 24.4% 26.1%
Coupa Software Incorporated 25.00 23.52 41.61 1,250 (221) 1,029 8.4 7.8 6.3 NM NM NM NM NM NM NA NA 25.1% 55.4%MINDBODY, Inc. 24.60 9.20 26.60 996 (71) 926 7.2 6.7 5.1 NM NM NM NM NM NM 15.0% NM 29.4% 35.2%
AppFolio, Inc. 21.90 11.07 24.50 738 (18) 720 7.4 6.9 5.3 NM NM NM NM NM NM 30.0% NM 30.1% 38.7%
Apptio, Inc. 16.05 15.30 24.60 615 (122) 492 3.3 3.1 2.6 NM NM NM NM NM NM NA NA 19.4% 26.0%
Everbridge, Inc. 18.71 11.76 20.66 508 (62) 446 6.2 5.8 4.6 NM NM NM NM NM NM 20.0% NM 25.8% 31.2%LivePerson, Inc. 7.70 3.74 8.85 446 (51) 395 1.7 1.8 1.7 23.5 20.9 17.3 NM NM 89.8 20.0% 4.5 2.8% (10.3%)
Bazaarvoice, Inc. 4.50 2.82 6.14 373 (49) 324 1.6 1.6 1.5 NM 24.8 18.3 NM NA NM NA NA 4.4% 1.0%
ChannelAdvisor Corporation 14.45 10.28 15.91 373 (63) 309 2.8 2.7 2.4 NM 59.9 47.0 NM NM NM NA NA 14.1% 14.8%
Xactly Corporation 11.70 4.68 16.10 367 (27) 339 3.7 3.6 3.0 NM NM NM NM NM NM 25.0% NM 19.5% 25.4%
Jive Software, Inc. 4.20 2.84 4.59 328 (100) 228 1.1 1.1 1.1 NM 13.5 11.3 NM 64.6 38.2 NA NA 0.8% 1.6%Brightcove Inc. 7.75 4.70 13.80 262 (34) 227 1.5 1.5 1.4 NM 30.8 21.4 NM NM 65.5 15.0% 4.4 9.5% 13.5%
Marin Software Incorporated 2.30 1.88 3.62 89 (33) 55 0.5 0.6 0.6 NM NM 20.8 NM NM NM NA NA (3.5%) (8.8%)
Mean 5.5x 5.2x 4.1x 58.8x 37.4x 30.3x NM 59.7x 58.4x 25.1% 2.7 21.8% 30.0% Median 5.9 5.6 4.6 56.9 30.5 23.3 NM 62.1 58.3 25.0% 2.0 24.2% 26.5%

9
Valuation Correlation to Growth and Cash Flow
Notes: Source: Capital IQ and Wall Street Estimates. When analyzing the same data set, R value of 2017E Revenue Multiple and 2017E Revenue Growth % is 0.76.
CY 2017E Revenue Growth % + CY 2017E FCF Margin %
Ente
rpri
se V
alu
e /
CY
20
17
E R
eve
nu
e
PUBLIC SAAS COMPANIES
Company Identifier
APPF
APTI
BCOV
BOX
BV
COUP
CRM
CSOD
ECOM
EVBG
HUBS
JIVE
LPSN
MB
MRIN
NOW
NTNX
RNG
RP
SHOP
ULTI
WDAY
XTLY
ZEN
Selected Public Saas Companies
WDAYNOW
ULTI
SHOP
ZENCSOD
RP
HUBS
BOX
RNG
MB
APPF
LPSNBV
XTLY
BCOVJIVE
ECOM
MRIN
COUP
CRM
EVGB
APTI
NTNX
2.0x
4.0x
6.0x
8.0x
10.0x
12.0x
(10%) 0% 10% 20% 30% 40% 50% 60% 70%
R = 0.84

10
Valuation Correlation to S&M Effectiveness
Notes: Source: Capital IQ and Wall Street Estimates.
Annual Change in Revenue (CY16E) / LTM Sales & Marketing Expense
Ente
rpri
se V
alu
e /
CY
20
16
E R
eve
nu
e
PUBLIC SAAS COMPANIES
Company Identifier
APPF
APTI
BCOV
BOX
BV
COUP
CRM
CSOD
ECOM
EVBG
HUBS
JIVE
LPSN
MB
MRIN
NOW
NTNX
RNG
RP
SHOP
ULTI
WDAY
XTLY
ZEN
Selected Public Saas Companies
CRM
WDAYNOW
ULTI
SHOP
ZEN
CSOD
RP
HUBS
BOX
RNG
MBAPPF
LPSNBV
XTLY
BCOVJIVE
ECOM
MRIN
COUP
APTI
EVBG
NTNX
2.0x
4.0x
6.0x
8.0x
10.0x
12.0x
14.0x
(0.5x) 0.0x 0.5x 1.0x 1.5x 2.0x
R = 0.82

11
Notes: Multiples <0x or >50x considered NM. Disclosed transactions with Enterprise Value <$50MM not included. (1) Enterprise Value and LTM multiples based on Capital IQ consensus estimates. (2) Enterprise Value and multiples based on Wall Street Estimates. (3) LTM multiple based on period ending 9/30/16. (4) Reflects an 80.1% stake acquisition.
RECENT ACQUISITIONS Internet / Digital Media / SaaS
($MM)
Announced Date Acquirer Target Enterprise Value EV / LTM Sales EV / LTM EBITDA EV / NTM Sales EV / NTM EBITDA
1/10/2017 $150 2.5x NA NA NA
1/9/2017 $425 NA NA NA NA
12/20/2016 $560 NA NA NA NA
12/19/2016 $118 3.0x NA NA NA
12/16/2016 Dalian Zeus Entertainment Pocket Technology $153 NA NA NA NA
12/15/2016 $82 NA NA NA NA
12/14/2016 $2,871 2.5x 6.8x 2.3x 5.0x
12/14/2015 $135 NA NA NA NA
12/13/2016 $130 NA NA NA NA
12/12/2016 $50 NA NA NA NA
12/6/2016 $854 2.9x 42.7x 2.7x 13.5x
12/6/2016 $2,800 NA NA NA NA
12/5/2016 $68 NA NA NA NA(4)
(2) (3)
(1)

12
Notes: Multiples <0x or >50x considered NM. Disclosed transactions with Enterprise Value <$50MM not included. (1) Enterprise Value and LTM multiples based on Wall Street Estimates. (2) LTM multiple based on period ending 9/30/16. (3) NTM multiples based on Capital IQ consensus estimates. (4) Uses gross profit as proxy for net revenue. (5) LTM multiple based on period ending 6/30/16.
RECENT ACQUISITIONS Internet / Digital Media / SaaS (Cont’d)
($MM)
Announced Date Acquirer Target Enterprise Value EV / LTM Sales EV / LTM EBITDA EV / NTM Sales EV / NTM EBITDA
11/30/2016 $112 2.2x NA NA NA
11/29/2016 $250 NA NA NA NA
11/29/2016 CONF. CONF. CONF. CONF. CONF.
11/20/2016 $2,362 3.6x 50.0x 3.3x 24.0x
11/17/2016 CONF. CONF. CONF. CONF. CONF.
11/10/2016 $540 3.7x NM 3.2x NM
10/22/2016 $106,021 3.8x 13.7x 3.5x 12.4x
10/21/2016 $465 1.9x NM 1.7x 8.8x
10/21/2016 $410 NA NA NA NA
10/20/2016 $55 NA NA NA NA
10/20/2016 $500 2.6x NA NA NA
10/13/2016 $300 NA NA NA NA
10/4/2016 CONF. CONF. CONF. CONF. CONF.
(3) (5)
(3) (5)
(3) (4)
(1) (3)
(1) (2)

13
Notes: Multiples <0x or >50x considered NM. Disclosed transactions with Enterprise Value <$50MM not included. (1) LTM multiple based on period ending 9/30/16. (2) NTM multiples based on Capital IQ consensus estimates. (3) LTM multiple based on period ending 7/31/16. (4) LTM multiple based on period ending 6/30/16. (5) LTM multiple based on period ending 3/31/16.
RECENT ACQUISITIONS Internet / Digital Media / SaaS (Cont’d)
($MM)
Announced Date Acquirer Target Enterprise Value EV / LTM Sales EV / LTM EBITDA EV / NTM Sales EV / NTM EBITDA
10/4/2016 $250 NA NA NA NA
10/3/2016 $680 13.1x NA NA NA
9/26/2016 $153 NA NA NA NA
9/26/2016 $1,400 NA NA NA NA
9/19/2016 $1,342 3.7x NM 3.6x 19.3x
9/8/2016 $515 6.0x NM 4.6x NM
8/31/2016 $1,400 3.3x NM 3.1x 38.4x
8/26/2016 $4,300 2.1x 6.4x 2.1x 6.1x
8/25/2016 $225 45.9x NM NA NA
8/22/2016 $900 2.8x NA NA NA
8/22/2016 $59 NA NA NA NA
8/18/2016 $120 NA NA NA NA
8/16/2016 $135 NA NA NA NA
(5)
(4)
(2) (4)
(2) (4)
(2)(4)
(2) (3)
(1)

14
RECENT ACQUISITIONS Internet / Digital Media / SaaS (Cont’d)
Notes: Multiples <0x or >50x considered NM. Disclosed transactions with Enterprise Value <$50MM not included. (1) NTM multiples based on Capital IQ consensus estimates. (2) LTM multiple based on period ending 6/30/16. (3) Enterprise Value and LTM multiples based on Wall Street Estimates. (4) LTM and NTM sales multiple are reflective of gross revenue. (5) LTM multiple based on period ending 3/31/16. (6) LTM multiple based on CY15 ending annualized recurring net revenue.
($MM)
Announced Date Acquirer Target Enterprise Value EV / LTM Sales EV / LTM EBITDA EV / NTM Sales EV / NTM EBITDA
8/9/2016 $355 0.5x 3.8x 0.6x 4.2x
8/8/2016 $1,500 3.4x NA NA NA
8/8/2016 $3,300 NA NA NA NA
8/3/2016 $85 0.5x NM 0.4x 14.1x
8/1/2016 $582 NA NA NA NA
7/28/2016 $8,694 10.3x NM 8.5x NM
7/27/2016 $1,010 1.9x 12.8x 1.9x 8.8x
7/25/2016 $4,826 1.3x 6.2x 1.4x 5.7x
7/21/2016 $215 NA NA NA NA
7/21/2016 $130 8.7x NA NA NA
7/21/2016 $3,800 NA NA NA NA
7/13/2016 $60 NA NA NA NA
7/5/2016 $45 NA NA NA NA
(6)
(1) (2)
(1) (5)
(1) (2)
(1) (2) (4)
(3)
(1)(2)
15
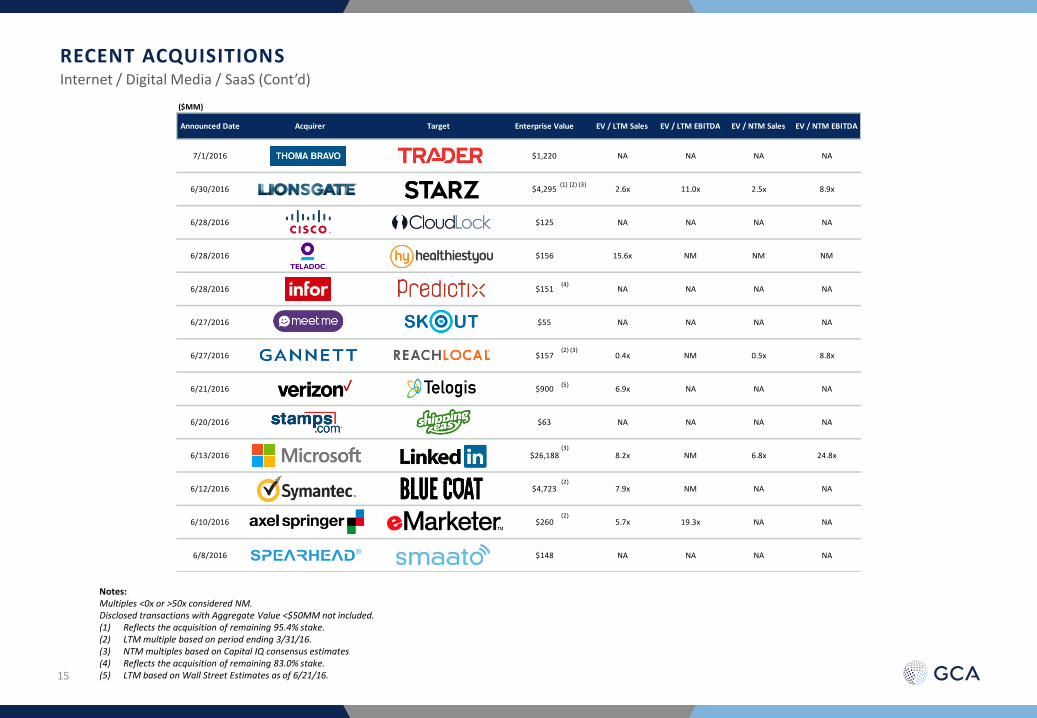
RECENT ACQUISITIONS Internet / Digital Media / SaaS (Cont’d)
Notes: Multiples <0x or >50x considered NM. Disclosed transactions with Aggregate Value <$50MM not included. (1) Reflects the acquisition of remaining 95.4% stake. (2) LTM multiple based on period ending 3/31/16. (3) NTM multiples based on Capital IQ consensus estimates (4) Reflects the acquisition of remaining 83.0% stake. (5) LTM based on Wall Street Estimates as of 6/21/16.
($MM)
Announced Date Acquirer Target Enterprise Value EV / LTM Sales EV / LTM EBITDA EV / NTM Sales EV / NTM EBITDA
7/1/2016 $1,220 NA NA NA NA
6/30/2016 $4,295 2.6x 11.0x 2.5x 8.9x
6/28/2016 $125 NA NA NA NA
6/28/2016 $156 15.6x NM NM NM
6/28/2016 $151 NA NA NA NA
6/27/2016 $55 NA NA NA NA
6/27/2016 $157 0.4x NM 0.5x 8.8x
6/21/2016 $900 6.9x NA NA NA
6/20/2016 $63 NA NA NA NA
6/13/2016 $26,188 8.2x NM 6.8x 24.8x
6/12/2016 $4,723 7.9x NM NA NA
6/10/2016 $260 5.7x 19.3x NA NA
6/8/2016 $148 NA NA NA NA
(2)
(2)
(3)
(5)
(2) (3)
(4)
(1) (2) (3)

16
IPO PIPELINE Internet / Digital Media / SaaS: IPOs in Public Registration
Notes: Source: Capital IQ and SEC.gov. (1) LTM as of 10/31/16. (2) LTM as of 9/30/16. (3) Figures represent 9 months ended 9/30/16. (4) KKR & Co. L.P. (NYSE:KKR) entered into a definitive agreement to acquire a majority stake in Optiv Security Inc. on 12/6/16.
Offering Amounts $10MM or Greater
Primary Initial Initial Offering LTM
Issuer Industry Filing Date Amount ($MM) Description Revenue EBIT % Adj. EBITDA
Internet Software
and Services12/28/16 $100
AppDynamics, Inc. provides an integrated suite of
software application, IT infrastructure monitoring,
and analytics products.
$206 (54.9%) ($105)
IT Consulting 11/22/16 $100 Presidio, Inc. provides professional and managed
services for IT solutions. $2,761 3.4% $210
IT Consulting 11/18/16 $100 Optiv Security Inc. provides cyber solutions to plan,
build, and operate security programs.$644 4.6% $61
(3) (4)
(2)
(1)

17
0
200
400
600
800
1,000
$0
$2
$4
$6
$8
$10
$12
Q3 2001 Q3 2002 Q3 2003 Q3 2004 Q3 2005 Q3 2006 Q3 2007 Q3 2008 Q3 2009 Q3 2010 Q3 2011 Q3 2012 Q3 2013 Q3 2014 Q3 2015 Q3 2016
Nu
mb
er o
f In
vest
men
ts
$B
n
Quarter - Year
Number of Deals Investment Amount
VENTURE CAPITAL INDUSTRY TMT: Transactions Since Q3 2001
Notes: (1) Number of TMT VC Investments per PriceWaterhouseCoopers / NVCA MoneyTree report. TMT inclusive of Computers and Peripherals, Electronics / Instrumentation, IT Services, Media
and Entertainment, Networking and Equipment, Semiconductors, Software and Telecommunications.
(1)

18
GCA OVERVIEW Selected Recent Digital Media and Software Transactions
Acquired By Acquired By Sale of Controlling Preferred Stock Acquired by Acquired by Acquired by Acquired by Acquired by
Interest to
We Advised the Seller We Advised the Seller We Advised the Seller Financial Advisor We Advised the Seller We Advised the Seller We Advised the Seller We Advised the Seller We Advised the Seller
December 2016 November 2016 November 2016 October 2016 October 2016 October 2016 September 2016 September 2016 August 2016
Divestiture of
Preferred Stock Equity Investment Acquisition of Acquired by Acquired by Acquired by Acquired by Preferred Stock
to Undisclosed
We Advised the Seller Financial Advisor Financial Advisor We Advised the Buyer We Advised the Seller We Advised the Seller We Advised the Seller We Advised the Seller Financial Advisor
August 2016 February 2016 February 2016 December 2015 August 2015 July 2015 July 2015 June 2015 June 2015
Preferred Stock Acquired by Acquired by Acquired by Acquired by Acquired by Acquired by Acquired by Acquired by
Consortium Led by A subsidiary of
Financial Advisor We Advised the Seller We Advised the Seller We Advised the Seller We Advised the Seller We Advised the Seller We Advised the Seller We Advised the Seller We Advised the Seller
May 2015 August 2012 April 2015 March 2015 February 2015 December 2014 May 2012 October 2014 May 2012
Sale of
Acquired by Acquired by Acquired by Preferred Stock Acquired by Acquisition of Acquired by Acquired by
to
We Advised the Seller We Advised the Seller We Advised the Seller We Advised the Seller Financial Advisor We Advised the Seller We Advised the Buyer We Advised the Seller We Advised the Seller
September 2014 August 2014 August 2014 March 2012 May 2014 April 2014 April 2014 March 2014 March 2014
Acquired by Sale of Entertainment Acquired by Acquired by Preferred Stock Acquired by Acquired by Acquired by Preferred Stock
Store Assets to
We Advised the Seller We Advised the Seller We Advised the Seller We Advised the Seller Financial Advisor We Advised the Seller We Advised the Seller We Advised the Seller Financial Advisor
November 2013 September 2013 August 2013 August 2013 July 2013 July 2013 January 2013 September 2012 August 2012
Reality Media Holdings
Japan

19
GCA OVERVIEW Digital Media / Software Team
*Tomohiko Kubota is a Vice President at GCA Corporation. *Saif Malik is a Vice President at GCA Savvian Europe Limited.
San Francisco
One Maritime Plaza, 25th Fl. San Francisco, CA 94111
United States Phone: (415) 318-3600
New York
640 Fifth Avenue, 10th
Fl. New York, NY 10019
United States Phone: (212) 999-7090
Tokyo
11-1 Marunouchi 1-chome Chiyoda-ku, Tokyo 100-6230
Japan Phone: +81 (3) 6212-7100
London
1 Southampton Street London WC2R0LR United Kingdom
Phone: +44 (0) 207 038-3200
Paul DiNardo Steve Fletcher Rich Jasen Seihun Kong John Lambros James Orozco Joshua WepmanAdvisory Director Managing Director Managing Director Managing Director Managing Director Managing Director Managing Director
Phone: (212) 999-7097 Phone: (415) 318-3661 Phone: (415) 318-3653 Phone: (415) 318-3682 Phone: (212) 999-7083 Phone: (415) 318-3667 Phone: (212) 999-7092
Mobile: (415) 509-4501 Mobile: (415) 518-6725 Mobile: (415) 308-4760 Mobile: (415) 823-7300 Mobile: (917) 744-9011 Mobile: (415) 722-0922 Mobile: (917) 306-4168
[email protected] [email protected] [email protected] [email protected] [email protected] [email protected] [email protected]
Dan Etchevers Ashley Ma Gautam Garg Giuseppe Diprima Tomohiko Kubota* Saif Malik*Director Director Vice President Vice President Vice President Vice President
Phone: (415) 318-3644 Phone: (212) 999-7076 Phone: (415) 318-3692 Phone: (212) 999-7088 Phone: +81 (3) 6212-7129 Phone: +44 (0) 207 038-3216
Mobile: (415) 572-3549 Mobile: (917) 575-0103 Mobile: (650) 504-1722 Mobile: (347) 622-1887 [email protected] Mobile: +44 (0) 778 606-8553
[email protected] [email protected] [email protected] [email protected] [email protected]