
GBE The Author(s) 2015. Published by Oxford University Press on behalf of the Society for Molecular...
12
Clustering of Two Genes Putatively Involved in Cyanate Detoxification Evolved Recently and Independently in Multiple Fungal Lineages M. Holly Elmore 1,4,y , Kriston L. McGary 1,y , Jennifer H. Wisecaver 1 , Jason C. Slot 1,5 , David M. Geiser 2 , Stacy Sink 3 , Kerry O’Donnell 3 , and Antonis Rokas 1, * 1 Department of Biological Sciences, Vanderbilt University 2 Department of Plant Pathology and Environmental Microbiology, The Pennsylvania State University 3 Bacterial Foodborne Pathogens and Mycology Research Unit, National Center for Agricultural Utilization Research, US Department of Agriculture, Agricultural Research Service, Peoria, Illinois 4 Present address: Department of Organismic and Evolutionary Biology, Harvard University, Cambridge, MA 5 Present address: Department of Plant Pathology, The Ohio State University, Columbus, OH y These authors contributed equally to this work. *Corresponding author: E-mail: [email protected]. Accepted: February 2, 2015 Data deposition: Sequences have been deposited at GenBank under the accessions KJ950372–KJ950435. Abstract Fungi that have the enzymes cyanase and carbonic anhydrase show a limited capacity to detoxify cyanate, a fungicide employed by both plants and humans. Here, we describe a novel two-gene cluster that comprises duplicated cyanase and carbonic anhydrase copies, which we name the CCA gene cluster, trace its evolution across Ascomycetes, and examine the evolutionary dynamics of its spread among lineages of the Fusarium oxysporum species complex (hereafter referred to as the FOSC), a cosmopolitan clade of purportedly clonal vascular wilt plant pathogens. Phylogenetic analysis of fungal cyanase and carbonic anhydrase genes reveals that the CCA gene cluster arose independently at least twice and is now present in three lineages, namely Cochliobolus lunatus, Oidiodendron maius, and the FOSC. Genome-wide surveys within the FOSC indicate that the CCA gene cluster varies in copy number across isolates, is always located on accessory chromosomes, and is absent in FOSC’s closest relatives. Phylogenetic reconstruction of the CCA gene cluster in 163 FOSC strains from a wide variety of hosts suggests a recent history of rampant transfers between isolates. We hypothesize that the independent formation of the CCA gene cluster in different fungal lineages and its spread across FOSC strains may be associated with resistance to plant-produced cyanates or to use of cyanate fungicides in agriculture. Key words: Fusarium oxysporum, horizontal gene transfer, metabolic gene cluster, convergent evolution, gene duplication, fungicide resistance. Introduction Cyanate (CNO ) is a toxic defense compound produced by a wide range of bacterial, plant, and fungal species and is currently commonly used in agriculture as a general purpose pesticide and fungicide. Like the closely related compound cyanide (CN ), cyanate inhibits cytochrome C (Jain and Kassner 1984), thereby shutting down oxidative phosphoryla- tion and starving cells of ATP (Albaum et al. 1946). The wide- spread use of toxic cyanate compounds in nature is reflected in the broad taxonomic distribution of the enzyme cyanase, which detoxifies cyanate by converting it to ammonia (NH4 + ) and carbon dioxide (CO 2 ). Found throughout plants, bacteria, and nematodes (Wilson et al. 2009), cyanase is nearly ubiqui- tous in the Basidiomycota, the Ascomycota (other than the yeasts, where it is absent), as well as in other fungal phyla (http://supfam.cs.bris.ac.uk/SUPERFAMILY/cgi-bin/taxviz.cgi?sf= 55234, last accessed February 23, 2014; Wilson et al. 2009). Cyanase consumes bicarbonate (H 2 CO 3 ), which is supplied through the conversion of water (H 2 O) and carbon dioxide (CO 2 ) by the enzyme carbonic anhydrase (Ebbs 2004) GBE ß The Author(s) 2015. Published by Oxford University Press on behalf of the Society for Molecular Biology and Evolution. This is an Open Access article distributed under the terms of the Creative Commons Attribution Non-Commercial License (http://creativecommons.org/licenses/by-nc/4.0/), which permits non-commercial re-use, distribution, and reproduction in any medium, provided the original work is properly cited. For commercial re-use, please contact [email protected] Genome Biol. Evol. 7(3):789–800. doi:10.1093/gbe/evv025 Advance Access publication February 6, 2015 789 by Antonis Rokas on March 19, 2015 http://gbe.oxfordjournals.org/ Downloaded from
Transcript of GBE The Author(s) 2015. Published by Oxford University Press on behalf of the Society for Molecular...
Clustering of Two Genes Putatively Involved in Cyanate
Detoxification Evolved Recently and Independently in
Multiple Fungal Lineages
M Holly Elmore14y Kriston L McGary1y Jennifer H Wisecaver1 Jason C Slot15 David M Geiser2Stacy Sink3 Kerry OrsquoDonnell3 and Antonis Rokas11Department of Biological Sciences Vanderbilt University2Department of Plant Pathology and Environmental Microbiology The Pennsylvania State University3Bacterial Foodborne Pathogens and Mycology Research Unit National Center for Agricultural Utilization Research US Department of
Agriculture Agricultural Research Service Peoria Illinois4Present address Department of Organismic and Evolutionary Biology Harvard University Cambridge MA5Present address Department of Plant Pathology The Ohio State University Columbus OHyThese authors contributed equally to this work
Corresponding author E-mail antonisrokasvanderbiltedu
Accepted February 2 2015
Data deposition Sequences have been deposited at GenBank under the accessions KJ950372ndashKJ950435
Abstract
Fungi that have the enzymes cyanase and carbonic anhydrase show a limited capacity to detoxify cyanate a fungicide employed by
both plants and humans Here we describe a novel two-gene cluster that comprises duplicated cyanase and carbonic anhydrase
copies which we name the CCA gene cluster trace its evolution across Ascomycetes and examine the evolutionary dynamics of its
spread among lineages of the Fusarium oxysporum species complex (hereafter referred to as the FOSC) a cosmopolitan clade of
purportedlyclonalvascularwiltplantpathogensPhylogeneticanalysisoffungalcyanaseandcarbonicanhydrasegenesrevealsthatthe
CCAgenecluster arose independentlyat least twiceand isnowpresent in three lineagesnamelyCochliobolus lunatusOidiodendron
maiusandtheFOSCGenome-widesurveyswithintheFOSCindicatethattheCCAgeneclustervariesincopynumberacrossisolates is
always located on accessory chromosomes and is absent in FOSCrsquos closest relatives Phylogenetic reconstruction of the CCA gene
cluster in163FOSCstrainsfromawidevarietyofhostssuggestsarecenthistoryoframpanttransfersbetweenisolatesWehypothesize
that the independent formation of the CCA gene cluster in different fungal lineages and its spread across FOSC strains may be
associated with resistance to plant-produced cyanates or to use of cyanate fungicides in agriculture
Key words Fusarium oxysporum horizontal gene transfer metabolic gene cluster convergent evolution gene duplication
fungicide resistance
Introduction
Cyanate (CNO) is a toxic defense compound produced by a
wide range of bacterial plant and fungal species and is
currently commonly used in agriculture as a general purpose
pesticide and fungicide Like the closely related compound
cyanide (CN) cyanate inhibits cytochrome C (Jain and
Kassner 1984) thereby shutting down oxidative phosphoryla-
tion and starving cells of ATP (Albaum et al 1946) The wide-
spread use of toxic cyanate compounds in nature is reflected
in the broad taxonomic distribution of the enzyme cyanase
which detoxifies cyanate by converting it to ammonia (NH4+)
and carbon dioxide (CO2) Found throughout plants bacteria
and nematodes (Wilson et al 2009) cyanase is nearly ubiqui-
tous in the Basidiomycota the Ascomycota (other than the
yeasts where it is absent) as well as in other fungal phyla
(httpsupfamcsbrisacukSUPERFAMILYcgi-bintaxvizcgisf=
55234 last accessed February 23 2014 Wilson et al 2009)
Cyanase consumes bicarbonate (H2CO3) which is supplied
through the conversion of water (H2O) and carbon dioxide
(CO2) by the enzyme carbonic anhydrase (Ebbs 2004)
GBE
The Author(s) 2015 Published by Oxford University Press on behalf of the Society for Molecular Biology and Evolution
This is an Open Access article distributed under the terms of the Creative Commons Attribution Non-Commercial License (httpcreativecommonsorglicensesby-nc40) which permits
non-commercial re-use distribution and reproduction in any medium provided the original work is properly cited For commercial re-use please contact journalspermissionsoupcom
Genome Biol Evol 7(3)789ndash800 doi101093gbeevv025 Advance Access publication February 6 2015 789
by Antonis R
okas on March 19 2015
httpgbeoxfordjournalsorgD
ownloaded from
(fig 1A) Carbonic anhydrase which plays an important role in
numerous processes including respiration pH homeostasis
and bicarbonate-dependent carboxylation reactions
(Elleuche and Poggeler 2010) has been found in all cellular
organism genomes except for a single syntrophic bacterium
that grows on carbon dioxide provided by other bacteria
(Nishida et al 2009) Interestingly cyanate also inhibits
carbonic anhydrase (fig 1A) potentially slowing cyanate
detoxification by reducing bicarbonate production (Peng
et al 1993)
Although both cyanase and carbonic anhydrase co-occur in
the majority of fungal genomes they are not known to be
physically colocalized For example in members of the
Fusarium oxysporum species complex (FOSC) the native cya-
nase gene is located on chromosome 4 whereas the native
carbonic anhydrase gene is on chromosome 8 (Ma et al
2010) In the course of our studies on the evolution of
fungal metabolism (McGary et al 2013) we discovered but
did not report a novel gene cluster (CCA gene cluster) that
comprises cyanase and carbonic anhydrase gene copies on
accessory chromosomes in whole-genome sequence from
several members of the FOSC (fig 1B) In this study our anal-
ysis of 234 fungal genomes spanning the diversity of the
fungal kingdom revealed that duplicates of the same genes
are also clustered in Oidiodendron maius a facultative endo-
mycorrhizal fungus and Cochliobolus lunatus a pathogen of
several monocots Phylogenetic analysis of all cyanase and
carbonic anhydrase gene copies shows that the CCA gene
cluster originated independently at least twice suggesting
that clustering is likely a response to a shared selection
pressure Furthermore molecular screening of 163 FOSC iso-
lates identified 73 CCA gene cluster-containing isolates from 6
continents 41 different hosts diverse sequence types (STs)
and forma specialis (following OrsquoDonnell et al 2009) as well
as from several different vegetative compatibility groups
(VCGs) The gene clusterrsquos pattern of presence and absence
in FOSC isolates from the same VCG forma specialis and ST
group across multiple continents suggests that the FOSC CCA
gene cluster might also reflect a response to a recent wide-
spread selection pressure
Materials and Methods
Discovering the CCA Gene Cluster
The cyanasendashcarbonic anhydrase gene cluster was first iden-
tified through a screen of 234 fungal genomes using previ-
ously reported methods to identify metabolically linked genes
that are colocated on a chromosome (Slot and Rokas 2010
2011 Campbell et al 2012 2013 Zhang et al 2012 McGary
et al 2013 Greene et al 2014)
Phylogenetic Analysis of the CCA Gene Cluster
Cyanase sequences from F oxysporum f sp lycopersici 4287
(NRRL 34936) (httpwwwbroadinstituteorg second anno-
tation last accessed March 1 2012) O maius Zn version 10
(httpwwwjgidoegov last updated May 24 2011 last
accessed March 1 2012) and C lunatus m118 version 20
(httpwwwjgidoegov last updated February 13 2012 last
accessed March 1 2012) and other Pezizomycotina cyanase
sequences of EC 421104 (Kanehisa et al 2004) were
aligned with MAFFT version 6923 b using the E-INS-I strategy
(Katoh and Toh 2008) and quality trimmed with trimAl version
14rev11 using the automated1 strategy (Capella-Gutierrez
et al 2009) The optimal model of sequence evolution was
determined using ProtTest v24 (Abascal et al 2005)
Maximum-likelihood (ML) trees were built in RAxML version
728 using the PROTGAMMALGF model and clade support
was assessed by 100 bootstrap pseudoreplicates (Stamatakis
and Alachiotis 2010) Tests of monophyly were performed
in RAxML using the log-likelihood ShimodairandashHasegawa
(SH) test to compare the unconstrained best tree and the
best tree given a constrained topology (Shimodaira and
Hasegawa 1999)
Identifying CCA Gene Clusters in FOSC Genomes
Cluster sequences were identified in the ten FOSC genomes
available through the BROAD Institute Fusarium Comparative
Database (httpwwwbroadinstituteorgannotationgenome
fusarium_groupMultiHomehtml last accessed May 30
2012 Ma et al 2010) and the FOSC O maius and C lunatus
genomes available through the Joint Genome Institute
(Grigoriev et al 2012) using the nucleotide sequence of the
cluster originally identified in F oxysporum f sp lycopersici
CyanateH2CO3
CO2
H2O Ammonia2 CO2
CarbonicAnhydrase
Cyanase
2235 bp
Carbonic anhydrase Cyanase
~1100 bp
A
B
FIG 1mdash(A) Cyanase and carbonic anhydrase enzymes are both re-
quired to detoxify cyanate Cyanase converts the toxic compound cyanate
into nontoxic ammonia and carbon dioxide Carbonic anhydrase converts
carbon dioxide and water into bicarbonate which cyanase requires in
order to convert cyanate to ammonia and carbon dioxide (B) A novel
clustered form of the genes (ie CCA gene cluster) encoding these en-
zymes may increase the capacity for cyanate detoxification In several
members of the FOSC the genes are divergently transcribed and sepa-
rated on the chromosome by a highly variable intergenic region that is
approximately 1100bp in length
Elmore et al GBE
790 Genome Biol Evol 7(3)789ndash800 doi101093gbeevv025 Advance Access publication February 6 2015
by Antonis R
okas on March 19 2015
httpgbeoxfordjournalsorgD
ownloaded from
4287 as the query sequence in a tBLASTn search through the
NCBI (National Center for Biotechnology Information) BLAST
webpage (Altschul et al 1997 2005)
Phylogenetic Analysis of Clusters in Published FOSCGenomes
Nucleotide sequences of CCA gene clusters identified in pub-
lished genomes were aligned in ClustalW2 (Larkin et al 2007)
and revised manually An ML phylogeny was generated using
RAxML version 726 using the GTRGAMMA model of se-
quence evolution with 100 bootstrap pseudoreplicates
(Stamatakis and Alachiotis 2010)
Selecting FOSC Isolates
Isolates were selected from a previously reported collection of
850 FOSC strains (OrsquoDonnell et al 2009) which are available
upon request from the ARS culture collection (NRRL http
nrrlncaurusdagovTheCollectionRequestshtml last
accessed February 23 2015) National Center for
Agricultural Utilization Research Peoria Illinois To minimize
redundant screening of closely related strains isolates were
selected for screening based on ST groups that is groups of
isolates that shared identical sequences at the conserved tran-
scription elongation factor 1-a (EF1-) and nuclear ribosomal
intergenic spacer region (IGS rDNA) loci (OrsquoDonnell et al
2009) In total 163 isolates were selected to maximize cover-
age of the species complex and increase the likelihood that
clusters would be detected using the following criteria
Known hosts Sampling focused on isolates found on hosts(tomato muskmelon cotton and pea) of the four fullysequenced isolates known to contain the CCA gene clusterFor each ST group including isolates found on tomatocotton melon or pea one isolate was selected from thishost and one more from each additional host in the STgroup In total 110 isolates were chosen by these criteria
Likely hosts Sampling included hosts thought more likely tohave isolates regularly exposed to cyanate Potato andbanana because they require higher doses of metamsodium (NCAP 2006) and Brassicaceae because they emitisothiocyanate compounds that function as a natural anti-fungal defense We included carnation because diverseFusarium spp infect this host (their leaves are commonlyused to induce Fusarium spp to produce sporodochia inculture) (Leslie and Summerell 2006) For ST groups that didnot contain isolates from any of the ldquoknown hostsrdquo oneisolate from a ldquolikely hostrdquo was selected In total 52 isolateswere selected under this criterion
Coverage One additional isolate (NRRL 38296 F oxysporum fsp betae) was selected so that the published EF1- phylog-eny of the species complex (OrsquoDonnell et al 2009) waswell-covered
Outgroup Two isolates of F foetens (NRRL 31852 and 38302)were selected because this species is sister to the FOSC(OrsquoDonnell et al 2009) Genomic DNA was extracted
using a cetyltrimethyl ammonium bromide (CTAB) protocol(Stewart and Via 1993)
Primer Design
Nucleotide sequences of the cyanase and carbonic anhydrase
CCA gene cluster were sufficiently divergent from native
copies that the cluster could be selectively amplified To ge-
notype the selected isolates for the presence or absence of the
gene cluster we designed polymerase chain reaction (PCR)
primers A and B which target the 30-ends of carbonic anhy-
drase and cyanase respectively (supplementary table S5
Supplementary Material online) This primer pair amplified a
2173-bp fragment that covered 100 of the two genes and
the intergenic region in the reference genome F oxysporum
f sp lycopersici 4287 (NRRL 34946) Genomic DNA from
F oxysporum f sp lycopersici MN25 (NRRL 54003) and
F oxysporum f sp raphani PHW815 (NRRL 54005) whose
sequenced genomes do not contain the CCA gene cluster
were used as negative controls
In order to detect partial CCA gene clusters PCR primers
were designed to target each genersquos open reading frame
(ORF) using nucleotides that were invariant in CCA gene
clusters from the sequenced FOSC genomes but divergent
from the native gene copies Primer F was designed to bind
near the 50-end of the carbonic anhydrase ORF and Primer E
near the 50-end of the cyanase ORF Primers were tested
with PCR and gel electrophoresis which revealed that they
were effective in gene cluster-specific amplification Primers
G C and D were designed to provide greater flexibility to the
PCR amplification and eventual sequencing of the cluster
Primer testing revealed that some of the interior primers did
not work in every strain in which the A B fragment was
amplified
Screening FOSC Isolates for CCA Gene Cluster
Screening consisted of two rounds of PCR and gel
electrophoresis for each isolate In all 163 isolates were
screened for the presence of clusters using primers A and
B in a long distance PCR protocol with the following
temperature profile 3 min at 95 C followed by six cycles of
94 C for 1 min 55 C for 1 min and 72 C for 1 min plus 30 s
for each additional cycle followed by 29 cycles of 94 C for
1 min 55 C for 1 min and 72 C for 5 min In total 73 iso-
lates yielded detectable bands of the appropriate size in both
rounds and were thus considered positive for the CCA gene
cluster
Reverse Transcription PCR to Assess Expression of theCluster in the FOSC
Erlenmeyer flasks (300 ml) containing 50 ml of yeast malt
broth (OrsquoDonnell et al 2009) adjusted to pH 66 with potas-
sium phosphate buffer were inoculated separately with
Repeated Evolution of Novel Cyanase Gene Clusters GBE
Genome Biol Evol 7(3)789ndash800 doi101093gbeevv025 Advance Access publication February 6 2015 791
by Antonis R
okas on March 19 2015
httpgbeoxfordjournalsorgD
ownloaded from
5 105 conidia of F oxysporum f sp lycopersici NRRL 34936
F oxysporum f sp vasinfectum NRRL 25433 F oxysporum f
sp melonis NRRL 26046 or F oxysporum f sp pisi NRRL
37622 and then grown at 25 C on a rotary shaker at
100 rpm for 48 h which was designated the 0 h time point
After1-ml aliquots were removed from each flask 15 ml of a
1 M sodium cyanate (product 185086 Sigma-Aldrich St
Louis MO) stock was added to each flask to set the concen-
tration at 30 mM cyanateml Subsequently 1-ml aliquots
were removed from each flask at 4 8 24 and 48 h time
points Samples taken at the five time points were immedi-
ately placed in 15-ml eppendorf tubes and spun at 12000 g
in a tabletop centrifuge for 10 min to obtain a mycelial pellet
Following removal of the supernatant the pellets were pul-
verized with plastic pestles in 750 ml of TRIzol reagent then
spun at 12000 g for 3 min after which 600ml supernatant
was recovered for use in a Direct-zol RNA extraction kit (Zymo
Research Corp Irvine CA) that included in-column DNase
treatment Extracted RNA was quantified with a NanoDrop
ND-1000 Spectrophotometer (Thermo Scientific Wilmington
DE) and sample quality confirmed with an Agilent 2100
Bioanalyzer (Agilent Technologies Inc Santa Clara CA)
Reverse transcription (RT)-PCR was performed with an
Agilent Easy-A One Tube RT-PCR kit using 2ml of RNA an
annealing temperature of 55 C and the following primers
Cyanate-RT GGGTTGGAAGGGAGCCATTTG and Primer H C
TTTCGAAGGACGACTTGC Standard PCR was then per-
formed using the RT-PCR product as the template with the
following temperature profile 94 C for 90 s 40 cycles of
94 C for 30 s 45 s at 52 C 2 min at 68 C a final extension
of 5 min at 68 C and ending with an indefinite 4 C soak
PCR products were purified by vacuum filtration using
Montage PCR96 filter plates (Millipore Corp Billerica MA)
and sequenced to verify that they were transcripts of the cy-
anate cluster A negative control with water in place of the
RNA template yielded no bands during the RT-PCR or stan-
dard PCR steps
Assessing Phylogenetic Distribution of the CCA GeneCluster
In order to assess phylogenetic signal in the distribution of the
cluster relative to the EF1- phylogeny we used Fritz and
Purvisrsquos D statistic for binary character dispersion on a phylog-
eny (Fritz and Purvis 2010) D is given by the formulaDfrac14dobsmeanethdbTHORNmeanethdrmeanethdbTHORN
where dobs is the observed sum of esti-
mated sister-clade differences in the binary trait across the
entire tree db is the expected sum of estimated sister-
clade differences in the binary trait across the entire tree
under a Brownian model of evolution and dr is the expected
sum of estimated sister-clade differences in the binary trait
across the entire tree under a random model that is shuffling
the trait labels at the tips of the tree D = 1 if the observed trait
has a phylogenetically random distribution across the tips of
the phylogeny and Dgt 1 if the trait has an overdispersed dis-
tribution D = 0 if the trait has a clumped distribution accord-
ing to a Brownian motion model
Sequencing
Sanger sequencing of the entire gene cluster of each of the 73
cluster-positive isolates was performed for three fragments A
GC and B Primer G gave better coverage so C was only
used when G failed to amplify in a particular isolate Primers G
and C failed to amplify in six isolates so only primers A and B
were used in these cases After the A B PCR product from
the 73 cluster-positive strains was sequenced at GENEWIZ
Inc the chromatogram files were edited with PeakScanner
software v10 (Applied Biosystems) to insure they were error
free Sequences are available in GenBank Accessions
KJ950372ndashKJ950435
Assembly Editing and Alignment of Sequences
Isolates with amplicons that failed to sequence and those with
less than 50 coverage of the region were excluded from the
analysis bringing the total number of isolates represented
in the alignment to 59 Fragments that were sequenced
with the A GC and B primers were assembled by profile
alignment in the software program SeaView against a
known gene cluster and then manually spliced into one
composite sequence for each isolate (Gouy et al 2010)
Assembled sequences were aligned with the global alignment
software MAFFT version 6847 (Katoh and Toh 2008) and
then trimmed to remove poorly aligned nucleotide sites with
TrimAl software using the ldquogappyoutrdquo option (Capella-
Gutierrez et al 2009) EF1- sequences for all of the isolates
included in the alignment were downloaded from the
FUSARIUM-ID version 10 database (httpisolatefusar
iumdborg last accessed February 23 2015 Geiser et al
2004) and aligned with MAFFT (Katoh and Toh 2008) All
alignments are available through TreeBASE submission
15573
Constructing Phylogenies
Phylogenies were constructed with RAxML software version
726 using the GTRGAMMA model of sequence evolution
with 100 bootstrap pseudoreplicates (Stamatakis and
Alachiotis 2010) Separate phylogenies were inferred for the
whole cluster carbonic anhydrase cyanase the concatenated
genes IGS rDNA and EF1- partitions The CCA sequence
from F oxysporum f sp melonis NRRL 26406 was re-
moved because it was missing a large portion of the carbonic
anhydrase ORF and thereby distorting the phylogenies
through long-branch attraction Consensus phylogenies
were then constructed using DENDROPY software with a
ldquomajority rulesrdquo threshold bootstrap support frequency of
050 at each bipartition (Sukumaran and Holder 2010) The
Elmore et al GBE
792 Genome Biol Evol 7(3)789ndash800 doi101093gbeevv025 Advance Access publication February 6 2015
by Antonis R
okas on March 19 2015
httpgbeoxfordjournalsorgD
ownloaded from
best ML trees were compared visually using the MirrorTree
MTSERVER (httpcsbgcnbcsicesmtserver last accessed
February 23 2015 Ochoa and Pazos 2010)
Results
The CCA Gene Cluster Evolved Independently at LeastTwice in Fungi
During previous work (McGary et al 2013) we serendipitously
noted the physical linkage of the genes encoding cyanase and
carbonic anhydrase (a CCA gene cluster) Here we report that
screening of 234 fungal genomes (supplementary table S1
Supplementary Material online) for CCA gene clusters re-
vealed their presence in three genomes those of the faculta-
tive endomycorrhizal fungus O maius (Leotiomycetes) the
fungal plant pathogen C lunatus (Dothideomycetes) and the
FOSC (Sordariomycetes) as represented by F oxysporum f sp
lycopersici NRRL 34936 In each of these genomes the
CCA cluster genes are separated by approximately 600ndash
2400 bp and divergently oriented that is the genes are im-
mediately adjacent and transcribed in opposite directions
which is also commonly referred to as a head-to-head
arrangement Examination of the ten genes on either side
of each CCA gene cluster (or to the end of the assembly
scaffold) revealed no shared synteny and BLAST2Seq pairwise
searches of the intergenic regions revealed no meaningful
similarity between the clusters from each species with the
longest hit limited to 14 bp and the lowest Expect value only
0045
The cyanase genes from the CCA gene clusters of the
FOSC C lunatus and O maius do not group together in
the ML phylogeny suggesting that the CCA gene cluster orig-
inated independently in these three taxa (fig 2) Even though
average bootstrap support in the cyanase gene phylogeny was
low (661) the bootstrap values supporting the indepen-
dent origins of the CCA gene cluster in the three taxa were
100 (for O maius vs C lunatus) 100 (for the FOSC vs C
lunatus) and 83 (for the FOSC vs O maius) Furthermore
an SH test which compared the ML-supported phylogeny
with a tree in which all clustered cyanase genes were con-
strained to form a monophyletic group rejected the hypoth-
esis of a single origin for the CCA gene cluster (P-value
threshold for all SH tests 005 supplementary table S2
Supplementary Material online)
SH tests were unable to reject the monophyly of clustered
cyanase genes from the FOSC and O maius suggesting at
least two independent origins of the CCA gene cluster once
for the cluster in C lunatus and once for the cluster in the
FOSC and O maius (supplementary table S2 Supplementary
Material online) However if the CCA gene cluster present in
the FOSC and O maius had the same origin explaining its
presence in these two species would seem to imply an addi-
tional recent horizontal transfer between the FOSC and O
maius Finally the SH tests from a second phylogenetic anal-
ysis using increased taxon sampling from 163 Pezizomycotina
genomes showed similar results finding support for at least
two separate origins of the CCA gene cluster (supplementary
fig S1 and table S3 Supplementary Material online)
In contrast to the cyanase gene phylogeny the anhydrase
gene phylogeny had much lower average bootstrap support
(555) and was much less informative about taxonomic re-
lationships (supplementary fig S2 Supplementary Material
online) Unsurprisingly SH tests were unable to reject most
of the topological constraints imposed (supplementary table
S2 Supplementary Material online)
Characterizing the CCA Gene Cluster within the FOSC
To further understand the evolution of the CCA gene
cluster in the FOSC we first examined the sequenced
genomes of two related Fusarium species F graminearum
and F verticillioides Orthologous CCA cluster genes
were not detected in the genomes of these two species
Analyses of ten fully sequenced FOSC genomes revealed
that four contained between one and three copies of the
CCA gene cluster and the other six lacked the cluster
Specifically F oxysporum f sp lycopersici NRRL 34936
possessed three nearly identical copies of the CCA gene clus-
ter F oxysporum f sp vasinfectum NRRL 25433 two copies
and F oxysporum f sp pisi HDV247 (NRRL 37622) and
F oxysporum f sp melonis NRRL 26406 one copy each
(fig 3) In contrast to the conserved locations of the native
cyanase and carbonic anhydrase copies on the core chromo-
somes all copies of the CCA gene cluster in the four cluster-
containing isolates occupied different positions on multiple
accessory chromosomes
To further characterize the CCA gene cluster within the
FOSC we screened 163 representative isolates from the
ARS Culture Collection (NRRL) (supplementary table S4
Supplementary Material online) Approximately 45 of the
isolates (73163) contained the CCA gene cluster (supplemen-
tary table S4 Supplementary Material online) To examine
whether the CCA gene cluster was functional RT-PCR and
sequencing were used to assess whether the genes were
expressed in the presence and absence of cyanate This exper-
iment revealed that the genes of the cluster were expressed
in the four cluster-containing isolates tested (table 1)
Intriguingly three of the isolates appeared to express the clus-
ter genes constitutively whereas expression was induced in
F oxysporum f sp lycopersici NRRL 34936 only after exposure
to 30 mM cyanate
Distribution of the CCA Gene Cluster in the FOSC Doesnot Correlate with Geography Genetic Structure or Host
The 163 isolates screened for the presence of the CCA gene
cluster were selected to represent the full range of diversity
within the FOSC they were from 6 different continents
Repeated Evolution of Novel Cyanase Gene Clusters GBE
Genome Biol Evol 7(3)789ndash800 doi101093gbeevv025 Advance Access publication February 6 2015 793
by Antonis R
okas on March 19 2015
httpgbeoxfordjournalsorgD
ownloaded from
included members of 6 VCGs and 20 formae speciales and
were isolated from 41 different hosts Thus this screen al-
lowed us to examine whether the presence of the CCA
gene cluster was correlated with geography host or genetic
structure The CCA gene cluster was identified over a very
broad geographical range in isolates collected on six different
continents (fig 4) Moreover the six VCGs that contained
isolates with the CCA gene cluster also contained isolates
that lacked it With the exception of isolates obtained from
human hosts the CCA gene cluster was detected in at least
FIG 2mdashML tree of cyanase (EC 421104) in the Pezizomycotina Numbers above branches correspond to bootstrap support50 Species containing a
CCA gene cluster are shown in bold and letters in parentheses indicate whether the gene copies are part of a CCA gene cluster (C) or are unclustered (U)
SH tests support at least two independent origins of the CCA gene cluster (P 005 supplementary table S2 Supplementary Material online)
Elmore et al GBE
794 Genome Biol Evol 7(3)789ndash800 doi101093gbeevv025 Advance Access publication February 6 2015
by Antonis R
okas on March 19 2015
httpgbeoxfordjournalsorgD
ownloaded from
one isolate from every host that was represented by more
than one isolate Furthermore in every instance where two
or more isolates from the same host were screened the CCA
gene cluster was never found to be present in all isolates from
the same host
Rapid Spread of the CCA Gene Cluster among the FOSC
Given the lack of any pattern to the distribution of the
CCA gene cluster by geography genetic structure or host
we next investigated the evolutionary dynamics of the
CCA gene cluster Using the FritzndashPurvis D statistic which
measures the phylogenetic signal of a binary trait we
evaluated how well the CCA gene clusterrsquos distribution
across the 163 screened isolates corresponded to the isolatesrsquo
phylogeny (Fritz and Purvis 2010) The distribution of the CCA
gene cluster was found to only weakly resemble the
phylogeny of the isolates (estimated D value [ED] = 083
P(no phylogenetic structure) = 0013 P(Brownian mo-
tion) = 00) suggesting that the distribution of the CCA
gene cluster was not primarily determined by vertical
descent At least two scenarios are compatible with this
result In the first the distribution of the cluster lacks
a phylogenetic signal because the cluster has been rampantly
duplicated and rapidly lost from many strains in a
Table 1
Expression of the CR Genes in Four Cluster-Positive Strains over 2
Days of Growth in Liquid Culture
Strain 0 h 4 h 8 h 24 h 48 h
Fol NRRL 34936 + + + +
Fov NRRL 25433 + + + + +
Fom NRRL 26406 + + + + +
Fop NRRL 37622 + + + + +
NOTEmdashShaded cells indicate RT-PCR results were confirmed by sequencingNote that three of the four strains appeared to express the cluster genes consti-tutively prior to the addition of cyanate at the zero time point However expres-sion was only detected in Fusarium oxysporum f sp lycopersici NRRL 34936 afterexposure to 30 mM cyanate Fol F oxysporum f sp lycopersici Fov F oxysporumf sp vasinfectum Fom F oxysporum f sp melonis Fop F oxysporum f sp pisi
FIG 3mdashPhylogenic analysis of native and clustered forms of cyanase and carbonic anhydrase supports a single origin of the cluster within the FOSC The
phylogeny revealed that multiple clusters in F oxysporum f sp lycopersici 34936 and F oxysporum f sp vasinfectum 25433 are copy number polymor-
phisms most likely the result of very recent intragenomic duplication For example in F oxysporum f sp lycopersici 34936 two of the three copies are
identical and a third differs from these two by only four SNPs indicating an extremely recent duplication The single copy native genes of F graminearum and
F verticillioides were added to root the tree Strains listed only by NRRL number and host are members of the FOSC
Repeated Evolution of Novel Cyanase Gene Clusters GBE
Genome Biol Evol 7(3)789ndash800 doi101093gbeevv025 Advance Access publication February 6 2015 795
by Antonis R
okas on March 19 2015
httpgbeoxfordjournalsorgD
ownloaded from
FIG 4mdashCladogram of EF1- nucleotide sequences including the 163 FOSC isolates screened for the presence of a CCA gene cluster Cluster-containing
isolates indicated by the solid black circles are labeled with the host and continent from which they were isolated Af Africa As Asia Au Australia Eu
Europe NA North America SA South America Un unknown
Elmore et al GBE
796 Genome Biol Evol 7(3)789ndash800 doi101093gbeevv025 Advance Access publication February 6 2015
by Antonis R
okas on March 19 2015
httpgbeoxfordjournalsorgD
ownloaded from
phylogenetically random manner In the second the distribu-
tion of the cluster is due to very recent rapid horizontal spread
of the cluster between strains by the exchange of accessory
chromosomes
Given that the distribution of the CCA gene cluster con-
tained little phylogenetic signal it was not surprising that our
direct comparison of the CCA gene cluster tree to the species
phylogeny inferred from EF1- (OrsquoDonnell et al 2009)
showed no discernible pattern of relationship between the
two trees (fig 5 supplementary figs S3 and S4
Supplementary Material online) Consider for example that
the CCA tree indicates a clade with 96 bootstrap support
that includes the isolates 34936 38446 and 38435 (fig 5 in
bold) however the isolate are well dispersed in the EF1- tree
in separate clades with high bootstrap support (93 100
and 100 respectively) This discordance goes both ways in
the EF1- tree the clade containing isolates 38446 and 38364
has 100 support but in the CCA cluster tree the isolates are
separated by several branches including one with 100
support
The discrepancy between the inferred histories of CCA
cluster and the isolates is also clear from inspection of their
269622836545909
37622385113844438589385912617828389
289213831138454383583845238498
3647138551 26961
3831637616262203628738307256092987125437
34115363973639036315269653406238315269602643738476
36364340643850732898 45917
459182644745932365203854638442225573851938487384913149845900
3851645908 3844538433384434594438294
254333850222518 383353849345931
316653827626221
364763288326022 38479
362283631238441384352892636105 36293
362613644638468263973835738506363033288738359284043835026033
360793627536379383243828736546
2839631495 38352283623828036394
363933636626445386002255526380 38325
3641138548262233850945972 28394
3629836311385082891538274
384593761238446289123836436238283852254436342 2927226411
3828838542316634018336092 3855336570
38440264063853134936364193845032885385273657236474256033610332897
328913827531852F foetens 3830238296
F verticillioides 20956F graminearum 31084
2644764472385423854238542
28912289122891225433 (supe254 peercontig 752)errcontig 752rcontig 752)ontig 752ntig 752)ntig 752
262622162216221338493384938493849
38441384484418448838288382883828
25433 (supe254 ercontierrconti )ig 729)ig 729)729)7293850938509
3844438444386000386000038600045932945932454593259454590059005900
4591745915917591384423844284428442
444594459444594454591859185918
45945990990090325383383838
383831113833831111343406240624062
341153411411541152560925605609560
328833289834064
3843584353844638448446844
6385163851638516364193641936419
34936 (supercontig7a)u34 6 percontig7a)percontig7a4936 (supercontig7a)(su4 6 (s percontig7a)ercontig7a333333 b)34936 superconti 7b3434936 supercontig 734934 6 s b)4936 supercontig 7b49 su4936 supercontig 7s
34936 (superco936 (s334936 (superco349 6 ( 9)ontig 9ontig 9)tig 9tig575362736273627
3663036303630326965226966965696
83835383583835383854685468546
873828382838282255522555255545972459724597236287362873628738531385313853122262640664066406
5722552255722554383643836438364
3383827582758275314593459314593
3166531665316652543725437254372643726437264373835038350383503149831498
3835773835773333844333844338384433
2892112892112892112626626269612262696169669616
383833838383 773033007705063858383 5068588376223762276227622
084590459084590F fooetens etens 2383023830
Species (EF1-α) CCA cluster
FIG 5mdashMirrortree comparison of EF1- (left) and whole CCA gene cluster (right) phylogenies Lines connecting the same isolate indicate the two loci
have very different evolutionary histories Examples discussed in the text are highlighted with bold lines and labels
Repeated Evolution of Novel Cyanase Gene Clusters GBE
Genome Biol Evol 7(3)789ndash800 doi101093gbeevv025 Advance Access publication February 6 2015 797
by Antonis R
okas on March 19 2015
httpgbeoxfordjournalsorgD
ownloaded from
sequence divergences For example closely related isolates
often had very distantly related copies of the CCA gene clus-
ter for example isolate NRRL 38302 and isolate NRRL 38364
shared 975 nucleotide identity in EF1- but 88 nucleo-
tide identity in the CCA gene cluster EF1-a is a highly con-
served protein that is expected to evolve far more slowly than
the CCA gene cluster which includes an intergenic sequence
so the converse comparison is even more convincing Distantly
related isolates may have nearly identical CCA gene clusters
for example isolate 38302 and isolate 45908 have 978
nucleotide identity in EF1- and 988 nucleotide identity
in the CCA gene cluster In fact of a total of 12 isolates
that shared a nearly identical CCA gene cluster sequence
with one or more other isolates (at 99 average nucleotide
identity among groups) only two isolates 34115 and 25609
also shared identical EF1- sequences Together these results
argue that the CCA gene cluster spread recently and rapidly
through nonvertical means
Discussion
Our investigation reveals a complex history for the CCA gene
cluster with more than one possible explanation Nevertheless
in evaluating the evidence we consider one scenario the most
likely (fig 6) The CCA gene cluster emerged independently in
three different classes of Pezizomycotina C lunatus in the
Dothidiomycetes the FOSC in the Sordariomycetes and
O maius in the Leotiomycetes In C lunatus and O maius
the CCA gene cluster appears to have formed by rearrange-
ment of cyanase and carbonic anhydrase paralogs of the
native genes in these species In the FOSC the CCA gene
cluster probably arose by the same process of duplication
and rearrangement of native genes in a single isolate but
on an accessory chromosome which subsequently spread
into other isolates by some combination of gene duplication
and horizontal transfer (both processes are likely facilitated by
accessory chromosomes) Alternatively the CCA gene cluster
may have originated only twice once in C lunatus and once in
Duplication of native genes
accessory genome
core genome
core genome
emit
CCA cluster duplication
Oidiodendron maius Cochliobolus lunatus Fusarium oxysporum species complex (FOSC)
CCA cluster formation
Carbonic anhydrase
Cyanase
1
2
3
1
1
1
2
1
2
1
2
1
3
FIG 6mdashA model for the independent origin through similar mechanisms of the CCA gene clusters in C lunatus O maius and the FOSC (1) The initial
step to form a CCA gene cluster is the duplication of both the native cyanase and carbonic anhydrase genes possibly in response to selection pressure
imposed from increased levels of cyanate in the environment (2) The CCA gene cluster forms when the duplicated cyanase or carbonic anhydrase relocates
to the chromosomal location of the complementary duplicate gene Alternatively only one of the two genes may be duplicated initially and the CCA cluster
forms in place simultaneously with the duplication of the complementary gene (3) In the FOSC the CCA gene cluster is consistently located on accessory
chromosomes where the entire cluster is frequently duplicated and transferred to additional accessory chromosomes which appears to facilitate transfer
among clonal lineages within the FOSC and may contribute to substantial copy number variation between isolates Large gray arrows represent the carbonic
anhydrase ORF and large black arrows the cyanase ORF with a thick black line indicating the chromosome An alternative model in which the CCA gene
cluster originated only twice once in C lunatus and once in either O maius or the FOSC after which it spread to the other species through horizontal
transfer is also consistent with our data
Elmore et al GBE
798 Genome Biol Evol 7(3)789ndash800 doi101093gbeevv025 Advance Access publication February 6 2015
by Antonis R
okas on March 19 2015
httpgbeoxfordjournalsorgD
ownloaded from
either O maius or the FOSC after which it spread to the other
species through horizontal transfer In either case the distri-
bution and inferred phylogeny of the CCA gene cluster in the
purportedly clonal FOSC suggest widespread transfer inde-
pendent of the genetic structure of the lineages inferred
from VCGs The most likely molecular mechanism of CCA
gene cluster spread is through the exchange of accessory
chromosomes which are known to transfer between isolates
(Ma et al 2010)
The independent evolution of the CCA gene cluster in spe-
cies from at least two and possibly three distinct classes
(Leotiomycetes Sordariomycetes and Dothidiomycetes fig
2) from varying ecological niches suggests that they have in-
dependently converged on a similar response to a similar se-
lection pressure In each class the CCA gene cluster is found
only in a single species and comprises paralogous copies that
are not highly diverged from the native genes copies which
together suggest that the origins of the CCA gene clusters in
all three lineages are relatively recent The presence of the
CCA cluster in FOSC isolates from six continents and nearly
every host and forma specialis sampled further indicates that
the cluster arose in response to a widespread recent selection
pressure The fact that all CCA gene cluster copies in the four
fully sequenced isolates occupy nonhomologous chromo-
somal locations suggests that it is selection for the CCA
gene cluster itself that is driving its spread rather than mere
hitchhiking on the accessory chromosomes The location of all
CCA gene cluster copies on accessory chromosomes which
shuffle their contents rapidly through TE-mediated ectopic
recombination and a breakage-fusion-bridge mechanism
(Croll et al 2013) also offers a plausible mechanism for the
rapid independent spread of the CCA gene cluster
Fungi are likely to be regularly exposed to naturally pro-
duced cyanates particularly from plants Thus it is possible
that these three CCA gene clusters arose in response to se-
lection pressure from naturally occurring cyanate compounds
If that is the case the fact that similar CCA gene clusters are
absent from most fungal genomes that have both CA and
cyanase suggests that this pressure is either quite specific or
quite recent Indeed C lunatus infects sorghum a plant
known to poison animals with cyanide when grown in stress-
ful conditions particularly drought (Gillingham et al 1969)
Alternatively clustering of these two genes may be the signa-
ture of a genomic response to the global popularity of cyanate
fungicides in agriculture over the past four decades As
Fusarium infections are commonly treated with cyanate-
based fungicides (AMVAC Chemical Corporation 2013) the
rapid nonvertical spread of the CCA gene cluster in the FOSC
across multiple continents is consistent with this hypothesis
Although many other fungal species regularly exposed to
cyanate fungicides do not have the CCA gene cluster the
incomplete spread of the CCA gene cluster through the
FOSC despite the accessory chromosomes that provide a
mechanism for rapid transfer implies that clustering of
these two genes may simply not have had opportunity
to arise and spread through the population of many fungal
species
The third species with the CCA cluster O maius is not a
pathogen so it is not specifically targeted for fungicide treat-
ment However as a facultative endomycorrhizal symbiont of
cultivated plants including blueberry azalea and rhododen-
dron O maius is likely exposed to cyanate fungicides during
treatment of other infections (Hagan and Cobb 1996) al-
though it is possible that some of its hosts produce cyanates
as well Regardless of cyanate source our discovery of the
CCA gene cluster in three unrelated fungal species raises
the hypothesis that this remarkable case of convergent evolu-
tion represents an adaptive response to exposure to natural or
agricultural cyanate
Supplementary Material
Supplementary data file S1 figures S1ndashS4 and tables S1ndashS5
are available at Genome Biology and Evolution online (http
wwwgbeoxfordjournalsorg)
Acknowledgments
The authors thank Nathane Orwig for running some of the
DNA sequences in the NCAUR DNA Core Facility The mention
of firm names or trade products does not imply that they are
endorsed or recommended by the US Department of
Agriculture over other firms or similar products not men-
tioned The USDA is an equal opportunity provider and em-
ployer This work was conducted in part using the resources of
the Advanced Computing Center for Research and Education
at Vanderbilt University Nashville TN This work was sup-
ported by funds provided by a Vanderbilt Undergraduate
Summer Research Program Fellowship to MHE and the
National Science Foundation (2013170866 to MHE and
DEB-0844968 and DEB-1442113 to AR)
Literature CitedAbascal F Zardoya R Posada D 2005 ProtTest selection of best-fit
models of protein evolution Bioinformatics 212104ndash2105
Albaum HG Tepperman J Bodansky O 1946 The in vivo inactivation by
cyanide of brain cytochrome oxidase and its effect on glycolysis and on
the high energy phosphorus compounds in brain J Biol Chem 164
45ndash51
Altschul SF et al 1997 Gapped BLAST and PSI-BLAST a new generation
of protein database search programs Nucleic Acids Res 25
3389ndash3402
Altschul SF et al 2005 Protein database searches using compositionally
adjusted substitution matrices FEBS J 2725101ndash5109
AMVAC Chemical Corporation 2013 VAPAM HL A Soil Fumigant
Solution for all Crops Available from httpwwwamvac-chemical
comproductsdocumentsVapam20TBsprdc2120copypdf
Campbell MA Rokas A Slot JC 2012 Horizontal transfer and death of a
fungal secondary metabolic gene cluster Genome Biol Evol 4
289ndash293
Repeated Evolution of Novel Cyanase Gene Clusters GBE
Genome Biol Evol 7(3)789ndash800 doi101093gbeevv025 Advance Access publication February 6 2015 799
by Antonis R
okas on March 19 2015
httpgbeoxfordjournalsorgD
ownloaded from
Campbell MA Staats M Kan JV Rokas A Slot JC 2013 Repeated loss of
an anciently horizontally transferred gene cluster in Botrytis Mycologia
1051126ndash1134
Capella-Gutierrez S Silla-Martinez JM Gabaldon T 2009 trimAl a tool for
automated alignment trimming in large-scale phylogenetic analyses
Bioinformatics 251972ndash1973
Croll D Zala M McDonald BA 2013 Breakage-fusion-bridge cycles and
large insertions contribute to the rapid evolution of accessory chromo-
somes in a fungal pathogen PLoS Genet 9e1003567
Ebbs S 2004 Biological degradation of cyanide compounds Curr Opin
Biotechnol 15231ndash236
Elleuche S Poggeler S 2010 Carbonic anhydrases in fungi Microbiology
15623ndash29
Fritz SA Purvis A 2010 Selectivity in mammalian extinction risk and threat
types a new measure of phylogenetic signal strength in binary traits
Conserv Biol 241042ndash1051
Geiser DM et al 2004 FUSARIUM-ID v 10 a DNA sequence database for
identifying Fusarium Eur J Plant Pathol 110473ndash479
Gillingham JT Shirer MM Starnes JJ Page NR McClain EF 1969
Relative occurrence of toxic concentrations of cyanide and nitrate
in varieties of sudangrass and sorghum-sudangrass hybrids Agron J
61727
Gouy M Guindon S Gascuel O 2010 SeaView version 4 a multiplatform
graphical user interface for sequence alignment and phylogenetic tree
building Mol Biol Evol 27221ndash224
Greene GH McGary KL Rokas A Slot JC 2014 Ecology drives the distri-
bution of specialized tyrosine metabolism modules in fungi Genome
Biol Evol 6121ndash132
Grigoriev IV et al 2012 The genome portal of the Department of Energy
Joint Genome Institute Nucleic Acids Res 40D26ndashD32
Hagan AK Cobb PP 1996Controlling insects and diseases on azaleas and
rhododendrons Available from httpwwwagriskumneducache
arl01681htm
Jain A Kassner RJ 1984 Cyanate binding to the ferric heme octapeptide
from cytochrome c A model for anion binding to high spin ferric
hemoproteins J Biol Chem 25910309ndash10314
Kanehisa M Goto S Kawashima S Okuno Y Hattori M 2004 The KEGG
resource for deciphering the genome Nucleic Acids Res 32
D277ndashD280
Katoh K Toh H 2008 Recent developments in the MAFFT multiple se-
quence alignment program Brief Bioinform 9286ndash298
Larkin MA et al 2007 Clustal W and Clustal X version 20 Bioinformatics
232947ndash2948
Leslie JF Summerell BA editors 2006 The Fusarium laboratory manual
p 3ndash14 [cited 30 Sep 2014] Ames IA Blackwell Publishing
Ma L-J et al 2010 Comparative genomics reveals mobile pathogenicity
chromosomes in Fusarium Nature 464367ndash373
McGary KL Slot JC Rokas A 2013 Physical linkage of metabolic genes in
fungi is an adaptation against the accumulation of toxic intermediate
compounds Proc Natl Acad Sci U S A 11011481ndash11486
NCAP Northwest Coalition for Alternatives to Pesticides 2006 Metam
sodium facts sheet J Pestic Ref 2612ndash16
Nishida H Beppu T Ueda K 2009 Symbiobacterium lost carbonic anhy-
drase in the course of evolution J Mol Evol 6890ndash96
Ochoa D Pazos F 2010 Studying the co-evolution of protein families with
the Mirrortree web server Bioinformatics 261370ndash1371
OrsquoDonnell K et al 2009 A two-locus DNA sequence database for typing
plant and human pathogens within the Fusarium oxysporum species
complex Fungal Genet Biol 46936ndash948
Peng Z Merz KM Banci L 1993 Binding of cyanide cyanate and thio-
cyanate to human carbonic anhydrase II Proteins 17203ndash216
Shimodaira H Hasegawa M 1999 Multiple comparisons of log-
likelihoods with applications to phylogenetic inference Mol Biol
Evol 161114ndash1116
Slot JC Rokas A 2010 Multiple GAL pathway gene clusters evolved in-
dependently and by different mechanisms in fungi Proc Natl Acad Sci
U S A 10710136ndash10141
Slot JC Rokas A 2011 Horizontal transfer of a large and highly toxic
secondary metabolic gene cluster between fungi Curr Biol 21
134ndash139
Stamatakis A Alachiotis N 2010 Time and memory efficient likelihood-
based tree searches on phylogenomic alignments with missing data
Bioinformatics 26i132ndashi139
Stewart CN Via LE 1993 A rapid CTAB DNA isolation technique useful for
RAPD fingerprinting and other PCR applications BioTechniques 14
748ndash750
Sukumaran J Holder MT 2010 DendroPy a Python library for phyloge-
netic computing Bioinformatics 261569ndash1571
Wilson D et al 2009 SUPERFAMILYmdashsophisticated comparative geno-
mics data mining visualization and phylogeny Nucleic Acids Res 37
D380ndashD386
Zhang H Rokas A Slot JC 2012 Two different secondary metabolism
gene clusters occupied the same ancestral locus in fungal dermato-
phytes of the Arthrodermataceae PLoS One 7e41903
Associate editor John Archibald
Elmore et al GBE
800 Genome Biol Evol 7(3)789ndash800 doi101093gbeevv025 Advance Access publication February 6 2015
by Antonis R
okas on March 19 2015
httpgbeoxfordjournalsorgD
ownloaded from
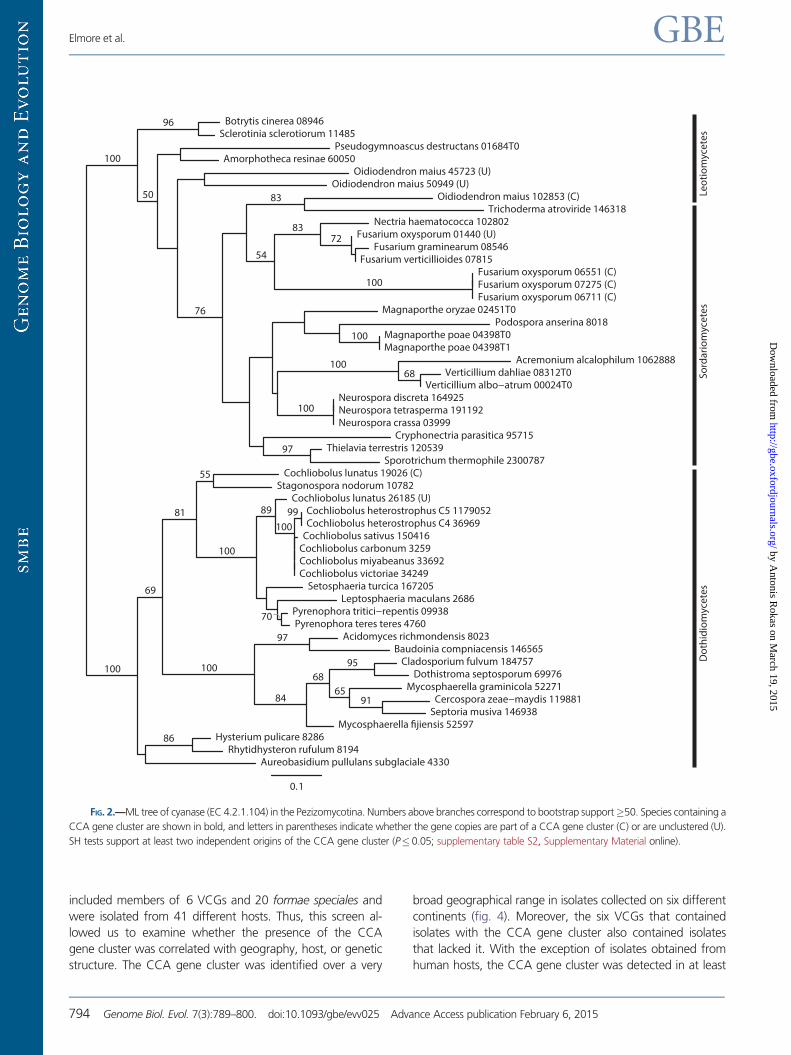