GAZİ UNIVERSITY ENGINEERING FACULTY …emreakaslan.com/projeler/04-Distillation_Column_Design.pdfi...
73
ANKARA 2013 GAZİ UNIVERSITY ENGINEERING FACULTY DEPARTMENT OF CHEMICAL ENGINEERING KM451E CHEMICAL ENGINEERING DESIGN I ASSIGMENT IV: DISTILLATION COLUMN DESIGN DELIVERED DATE : 30.12.2013 DELIVERED TO : PROF. DR. BEKİR ZÜHTÜ UYSAL : RES. ASIST. MELDA ESKİTOROS 09114003 EMRE AKASLAN
Transcript of GAZİ UNIVERSITY ENGINEERING FACULTY …emreakaslan.com/projeler/04-Distillation_Column_Design.pdfi...

ANKARA 2013
GAZİ UNIVERSITY ENGINEERING FACULTY
DEPARTMENT OF CHEMICAL ENGINEERING
KM451E CHEMICAL ENGINEERING DESIGN I
ASSIGMENT IV: DISTILLATION COLUMN DESIGN
DELIVERED DATE : 30.12.2013 DELIVERED TO : PROF. DR. BEKİR ZÜHTÜ UYSAL
: RES. ASIST. MELDA ESKİTOROS
09114003 EMRE AKASLAN

i
ABSTRACT
In this report, the aim is to design the optimum economical distillation column for seperation
of acetone, ethanol and water mixture. This mixture is desired to be distilled to 99.9 % pure
components.
The feed of first distillation column is 190 000 kg/h. We used four distillation columns to
distillate mesitylene, n-buthanol, water, ethanol and acetone and we done detailed calculation
and found optimum Rd/Rdmin parameter for third column. We used partial condensers for
first, second and third column and we used total condenser for last column.
The third (designed column) column’ s feed is 351 kmol/h. The mole fraction in feed acetone
is 0.1118, ethanol is 0.0470 and water is 0.8412. We selected heavy component as water and
light component as ethanol. Water is distilled to 99.99% outlet composition from the bottom
of distillation column. Distillate of column is fed to the last column which is binary
distillation column. The products of this column are 99.9% acetone and 99.9% ethanol.
Calculations are done by using these decisions.
Three different calculation methods are employed.
ChemCad Simulation program
Microsoft excel program
GWBasic Software program
ChemCad simulation program is run after deciding on distillation columns arrangement. In
calculations the temperatures of exit streams from program are used for determining the
physicochemical properties of components and in rough calculations taken ideal number of
plates are used to calculate pressure drops. Pressure drop is found as about 0.18 atm.
After detailed calculations, we found optimum Rd/Rdmin value as 1.1 and on this way we
found Total Annual Cost as 2 452 259 TL/yr for using steam cost as 40 TL/ton. Then we done
a calculation again to see effect steam cost on Total Annual Cost. Taking steam cost as 16
TL/ton we found Total Annual Cost as 1 442 001 TL/yr. We discussed this results.
GWBasic Software program is run to check the results of ChemCad and excel program for
optimum value. We compared them and it is seen that the results for ideal number of plates
are same.

ii
INDEX
ABSTRACT ................................................................................................................................ i
INDEX ....................................................................................................................................... ii
FIGURE AND TABLE LIST ................................................................................................... iv
1. INTRODUCTION .................................................................................................................. 1
1.1. Bioacetone ....................................................................................................................... 2
1.1.1. Bioacetone Production .............................................................................................. 2
1.2. Bioethanol ........................................................................................................................ 3
1.2.1. Bioethanol Production .............................................................................................. 3
1.3. Biobuthanol ..................................................................................................................... 4
1.3.1. Biobuthanol Production ............................................................................................ 4
1.4. Distillation ....................................................................................................................... 5
1.4.1. Basic Components of Distillation Columns .............................................................. 5
1.4.1.1. Trays ................................................................................................................... 7
1.4.2. Continuous Distillation ........................................................................................... 10
1.4.2.1. Reflux Considerations ...................................................................................... 11
1.4.2.2. Selection of Column Pressure .......................................................................... 12
1.2.2.3. Dew Points and Bubble Points ......................................................................... 12
1.4.3. Multicomponent Distillation ................................................................................... 13
1.4.3.1. Key Components .............................................................................................. 14
1.4.3.2. Number and Sequencing of Columns ............................................................... 14
1.5. Distillation Column Design ........................................................................................... 15
2. PROBLEM STATEMENT .................................................................................................. 16
3. METHOD OF CALCULATIONS ...................................................................................... 17
3.1. Assumptions .................................................................................................................. 26
4. SAMPLE CALCULATIONS .............................................................................................. 27
5. RESULTS ............................................................................................................................ 56
6. DISCUSSION ...................................................................................................................... 59
7. CONCLUSION .................................................................................................................... 62
8. SYMBOLS ........................................................................................................................... 63
9. REFERENCES ..................................................................................................................... 65
APPENDIX-A: PHYSIOCHEMICAL PROPERTIES OF COMPONENTS .......................... 67
APPENDIX-B: FIGURES WHICH ARE USED ON CALCULATIONS .............................. 69

iii
APPENDIX-C: GWBASIC PROGRAM RESULTS .............................................................. 74
APPENDIX-D: CHEMCAD RESULTS ................................................................................. 76
APPENDIX-E: ECONOMICAL RESULTS ........................................................................... 81
APPENDIX-F: CHEMCAD, EXCEL AND GW BASIC RESULTS COMPARATIONS .... 83
APPENDIX-G: EXCEL RESULTS ........................................................................................ 84
APPENDIX-H: DETAILED FLOW CHART ......................................................................... 96

1. INTR
Figure
In this
distillati
column
the last
optimum
Figure
RODUCTI
1: Basic Flo
project, to
ion column
is seperatin
one is sepe
m paramete
2: Detailed
ON
owchart for
distillate m
ns, one heat
ng mesithyl
erating etha
rs.
Flowchart
r Distillation
mesithylene
t exchanger
lene, second
anol. We do
for Third (D
n System
e, n-buthano
r and pump
d is seperati
one detailed
Designed) C
ol, water, e
ps are used
ing buthano
d calculation
Column
ethanol, ace
d shown in
ol, third is se
ns for third
etone mixtu
Figure 1. T
eperating w
d column an
1
ure; four
The first
water and
nd found
2
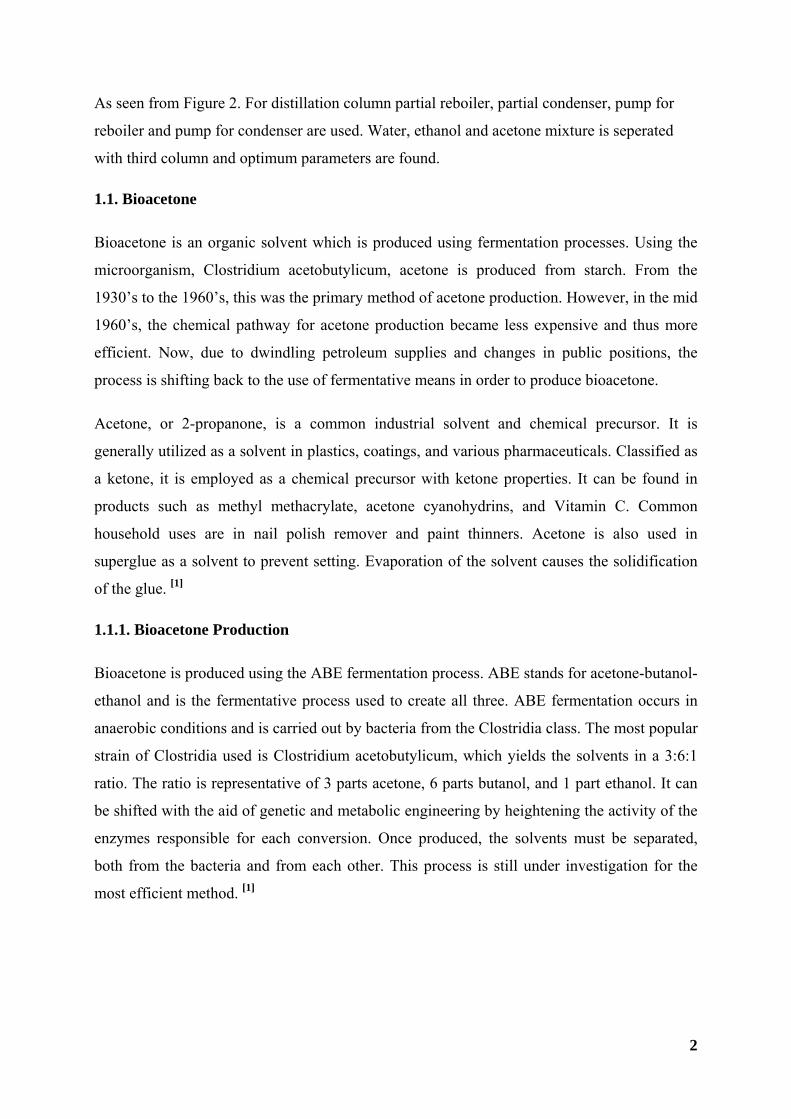
As seen from Figure 2. For distillation column partial reboiler, partial condenser, pump for
reboiler and pump for condenser are used. Water, ethanol and acetone mixture is seperated
with third column and optimum parameters are found.
1.1. Bioacetone
Bioacetone is an organic solvent which is produced using fermentation processes. Using the
microorganism, Clostridium acetobutylicum, acetone is produced from starch. From the
1930’s to the 1960’s, this was the primary method of acetone production. However, in the mid
1960’s, the chemical pathway for acetone production became less expensive and thus more
efficient. Now, due to dwindling petroleum supplies and changes in public positions, the
process is shifting back to the use of fermentative means in order to produce bioacetone.
Acetone, or 2-propanone, is a common industrial solvent and chemical precursor. It is
generally utilized as a solvent in plastics, coatings, and various pharmaceuticals. Classified as
a ketone, it is employed as a chemical precursor with ketone properties. It can be found in
products such as methyl methacrylate, acetone cyanohydrins, and Vitamin C. Common
household uses are in nail polish remover and paint thinners. Acetone is also used in
superglue as a solvent to prevent setting. Evaporation of the solvent causes the solidification
of the glue. [1]
1.1.1. Bioacetone Production
Bioacetone is produced using the ABE fermentation process. ABE stands for acetone-butanol-
ethanol and is the fermentative process used to create all three. ABE fermentation occurs in
anaerobic conditions and is carried out by bacteria from the Clostridia class. The most popular
strain of Clostridia used is Clostridium acetobutylicum, which yields the solvents in a 3:6:1
ratio. The ratio is representative of 3 parts acetone, 6 parts butanol, and 1 part ethanol. It can
be shifted with the aid of genetic and metabolic engineering by heightening the activity of the
enzymes responsible for each conversion. Once produced, the solvents must be separated,
both from the bacteria and from each other. This process is still under investigation for the
most efficient method. [1]

3
1.2. Bioethanol
The principle fuel used as a petrol substitute for road transport vehicles is bioethanol.
Bioethanol fuel is mainly produced by the sugar fermentation process, although it can also be
manufactured by the chemical process of reacting ethylene with steam.
The main sources of sugar required to produce ethanol come from fuel or energy crops. These
crops are grown specifically for energy use and include corn, maize and wheat crops, waste
straw, willow and popular trees, sawdust, reed canary grass, cord grasses, jerusalem artichoke,
myscanthus and sorghum plants. There is also ongoing research and development into the use
of municipal solid wastes to produce ethanol fuel.
Ethanol or ethyl alcohol (C2H5OH) is a clear colorless liquid, it is biodegradable, low in
toxicity and causes little environmental pollution if spilt. Ethanol burns to produce carbon
dioxide and water. Ethanol is a high octane fuel and has replaced lead as an octane enhancer
in petrol. By blending ethanol with gasoline we can also oxygenate the fuel mixture so it
burns more completely and reduces polluting emissions. Ethanol fuel blends are widely sold
in the United States. The most common blend is 10% ethanol and 90% petrol (E10). Vehicle
engines require no modifications to run on E10 and vehicle warranties are unaffected also.
Only flexible fuel vehicles can run on up to 85% ethanol and 15% petrol blends (E85). [2]
1.2.1. Bioethanol Production
Ethanol can be produced from biomass by the hydrolysis and sugar fermentation processes.
Biomass wastes contain a complex mixture of carbohydrate polymers from the plant cell walls
known as cellulose, hemi cellulose and lignin. In order to produce sugars from the biomass,
the biomass is pre-treated with acids or enzymes in order to reduce the size of the feedstock
and to open up the plant structure. The cellulose and the hemi cellulose portions are broken
down (hydrolysed) by enzymes or dilute acids into sucrose sugar that is then fermented into
ethanol. The lignin which is also present in the biomass is normally used as a fuel for the
ethanol production plants boilers. There are three principle methods of extracting sugars from
biomass. These are concentrated acid hydrolysis, dilute acid hydrolysis and enzymatic
hydrolysis. [2]

4
1.3. Biobuthanol
Biobutanol, which is also sometimes called biogasoline, is an alcohol that is produced from
biomass feedstocks. Butanol is a 4-carbon alcohol that is currently used as an industrial
solvent in many wood finishing products. Biobutanol can be utilized in internal combustion
engines as both a gasoline additive and or a fuel blend with gasoline. The energy content of
biobutanol is 10% less than that of regular gasoline. This is not as bad as energy density of
ethanol is 40% lower. Since biobutanol is more chemically similar to gasoline than ethanol, it
can be integrated into regular internal combustion engines easier than ethanol. Its
bioproduction route was halted in the 1960s due to high production price with respect to
production from petroeum. New technology advancements and an increase in petroleum
prices are making bioproduction of butanol more competitive and safer. Biobutanol has
displayed the potential to reduce the carbon emissions by 85 percent when compared to
gasoline, making it a superior alternative to gasoline and a gasoline-ethanol blended fuel. [3]
1.3.1. Biobuthanol Production
Biobutanol is made via fermentation of biomasses from substrates ranging from corn grain,
corn stovers and other feedstocks. Microbes, specifically of the Clostridium acetobutylicum,
are introduced to the sugars produced from the biomass. These sugars are broken down into
various alcohols, which include ethanol and butanol. Unfortunately, a rise in alcohol
concentration causes the butanol to be toxic to the microorganisms, killing them off after a
period of time. This made the fermentation process expensive and unrealistic when compared
to the petroleum costs of the late 50’s. Luckily, new technological advances and the discovery
of new microbes have improved the efficiency and cost of the fermentation process
tremendously. Through genetic engineering, researchers have been able to modify the most
efficient microbes to be able to withstand high alcohol concentrations. New modifications are
constantly being researched, including the modification to enzymes and genes involved in
butanol formation from biomass fermentation.
A promising trend is a slew of recent ethanol fermentation plants purchases by biobutanol
companies. These ethanol plants are being retrofitted with advanced separation systems to
allow them to produce biobutanol. Since biobutanol has inherently higher value vs.
bioethanol, the trend of the plant conversions is likely to continue.

5
Aside from fermentation, a handful of companies are pursuing pyrolysis biobutanol. This
route can convert waste biomass or crop waste into biobutanol. [3]
1.4. Distillation
Whenever two materials at any temperature possessed a marked difference in their vapor
pressures, this difference could be made the basis of a method of separation of the two; and if
one or both of the substances were recovered by condensation, the process is called
distillation. Equilibrium is established at any temperature between a liquid or a mixture of
liquids held in a containing vessel, and the vapor existing above it.
There are a variety of configurations for distillation columns, each designed to perform
specific types of separations. A simplified way of classifying distillation columns is to look at
how they are operated. In this manner, the two major types are batch and continuous columns.
In a batch operation, the feed to the column is introduced batch-wise. That is, the column is
charged with a ‘batch’ and then the distillation process is conducted. When the desired
separation is achieved, a next batch of feed is introduced. In contrast, continuous columns
process a continuous feed stream. No interruptions occur unless there is a problem or upsets
with the column or surrounding process units. They are capable of handling high throughputs
and are the more common of the two types. The following discussions focus on continuous
columns. [4]
1.4.1. Basic Components of Distillation Columns
There are several important components in a distillation column, each of which is used either
to transfer heat energy or enhance mass transfer. The major components in a typical
distillation are:
A vertical shell where the separation of liquid components is carried out,
Column internals such as tray, plates and/or packing which are used to enhance
component separations,
A reboiler to provide the necessary vaporization for the distillation process, a
condenser to cool and condense the vapor leaving the top of the column,
A reflux drum to hold the condensed vapor from the top of the column. The liquid
(reflux) is recycled back to the column.

A sc
show
Figure
The liqu
somewh
The fee
(strippin
reboiler
any suit
heating
re-introd
is know
Figure
chematic of
wn in Figure
3: Basic Co
uid mixture
here near th
ed tray divid
ng) section.
r. Heat is su
table fluid,
source may
duced into t
wn as the bot
4: Diagram
f a typical
e 3.
omponents o
e that is to
he middle of
des the colu
The feed f
upplied to t
although in
y be the out
the unit at t
ttoms produ
m Shows Rol
distillation
of Distillati
be processe
f the column
umn into a
flows down
the reboiler
n most chem
tput streams
the bottom
uct or simpl
le of the Re
unit with a
ion [4]
ed is called
n to a tray k
top (enrich
the column
r to generat
mical plants
s of other co
of the colum
ly, the botto
eboiler [4]
a single fee
d the feed. T
known as th
hing or recti
n where it is
e vapor. Th
s this is nor
olumns. The
mn. The liq
oms.
ed and two
The feed is
e feed tray.
ification) se
s collected a
he source o
rmally steam
e vapor rais
quid remove
product str
introduced
ection and a
at the botto
of heat inpu
m. In refine
sed in the re
ed from the
6
reams is
d usually
a bottom
om in the
ut can be
eries, the
eboiler is
reboiler

The vap
The con
liquid is
liquid th
Figure
1.4.1.1.
The ter
designs
Bubble
that cov
allow th
cap, fina
tray. Bu
each of
Figu
Liqu
por travels u
ndensed liq
s recycled b
hat is remov
5: The Role
Trays
rms "trays"
, but the mo
Cap Tray
vers the rise
he passage o
ally dischar
ubble-tray o
which the l
ure 6: (A) B
uid on A Bu
up the colum
quid is store
back to the
ved from the
e of Reflux
and "plate
ost common
s: A bubble
er. The cap
of vapor. Va
rging throug
or plate tow
liquid flows
Bubblecap
ubblecap Tr
mn, and as i
ed in a hold
top of the
e system is
[4]
es" are use
n ones are b
e cap tray h
p is mounte
apor rises th
gh slots in th
ers typically
s in turn on
Tray Confi
ray [4]
it exits the t
ding vessel
column and
known as th
ed intercha
ubble cap tr
has a riser or
ed so that t
hrough the
he cap, and
y consist of
its way dow
guration. (B
top of the un
known as
d this is cal
he distillate
angeably. T
rays, valve
r chimney f
here is a sp
chimney an
finally bub
f a number
wn the towe
B) Assembl
nit, it is coo
the reflux d
lled the refl
e or top prod
There are m
trays, and s
fitted over e
pace betwe
nd is directe
bbling throu
of shallow
er.
ly of and A
oled by a co
drum. Some
lux. The co
duct. [4]
many types
sieve trays.
each hole, a
en riser and
ed downwar
ugh the liqui
plates or tr
Action of Va
7
ondenser.
e of this
ondensed
of tray
and a cap
d cap to
rd by the
id on the
ays over
apor and

Sieve T
upward
design p
cost fac
in many
Figure
hh
lh i
fh i
th i
The req
spacing
keep th
flooding
10% an
Weir he
normal
Trays: Siev
through th
parameters.
ctors, sieve
y application
7: Sieve Tr
is the head
is the equiv
is the visibl
is the pressu
quired towe
, with a po
e gpm/in. o
g value. Cor
d for surfac
eights of 2 i
conditions
ve trays are
he liquid on
Because of
and valve t
ns. [4]
ray Phenom
in the down
valent head o
le height of
ure drop acr
er diameter
ossibly over
of weir belo
rrections ar
ce tension ot
in. are fairly
downcomer
simply me
n the plate.
f their effici
trays have r
ena and Pre
ncomer,
of clear liqu
froth on the
ross the tray
depends pr
rriding rest
ow about 8
re indicated
ther than 20
y standard a
rs are sized
etal plates w
The arrang
iency, wide
replaced the
essure Relat
uid on the tr
e tray,
y
rimarily on
triction of a
. Allowable
with the fig
0 dyn/cm. [5
and weir len
d so that the
with holes i
gement, num
operating r
e once high
tions [4]
ray,
n the vapor
accommoda
e velocity u
gure for the5]
ngths about
e depth of li
in them. Va
mber and si
range, ease
hly thought
rate and d
ating suffic
usually is ta
e fractional h
t 75% of the
iquid in the
apor passes
ize of the h
of maintena
of bubble c
density and
cient weir l
aken as 80%
hole area ot
e tray diame
em is less th
8
straight
holes are
ance and
cap trays
the tray
ength to
% of the
ther than
eter. For
han 50%

and the
time ma
1.0 (ft/s
A detail
1. H
2. B
3. D
4. T
5. P
6. T
7. L
Valve
themsel
about 0
diamete
With 3
section
structur
Figure
In spite
usually
which n
services
residence t
ay be two to
sec)(lb/cuft)
led design o
Hole diame
Blanking of
Downcorne
Tray thickn
Pressure dro
Turndown r
Liquid grad
Trays: Th
lves to vapo
.1 in. above
er is 1.5in. b
in. spacing
is taken up
re.
8: Two Kin
e of their ap
are less ex
need less s
s. [5]
time more t
o three time
)l” for mixtu
of a tray inc
eter, area, pi
f holes for l
er type, size
ness and mat
op.
ratio before
dient.
he openings
or flow. Illu
e the floor a
but sizes to
g, the numb
p by the d
nds of Valve
pparent com
xpensive th
support. Th
than 3sec. F
s this value
ures similar
cludes speci
itch and patt
ess than eve
, clearance,
terial.
weeping be
s in valve
ustrations of
and rise to a
o 6in. are av
ber of valve
downcomer,
es for Trays
mplexity of
an sieve tra
hey are mo
For foamin
e. The tray e
r to water w
fication of t
tern.
entual load.
and weir h
egins.
trays are
f two kinds
a maximum
vailable. Sp
es is 12-14/
by suppor
s [5]
f constructi
ays because
re subject
ng and foam
efficiency ar
with alcohols
these items:
.
eight.
covered w
of valves a
clearance o
pacing of th
/sqft of free
rts, and by
ion in comp
e of their l
to fouling
m-stable sys
re 80-90% i
s and to C,+
:
with liftable
are in Figur
of 0.32in. T
he standard
e area. Som
some of th
parison wit
arger holes
and defer
stems, the re
in the vicini
+ hydrocarb
e caps tha
e 1.6. The c
The common
diameter is
me of the tr
he central
th sieve tra
s and thicke
to sieves f
9
esidence
ity of F=
ons.
at adjust
caps rest
nest hole
s 3-6 in.
ray cross
manway
ays, they
er plates
for such
1.4.2. C
The sep
the com
equipme
column
contact
of the c
the base
Figure
In some
condens
partial c
have th
equilibr
be obtai
compon
the colu
constitu
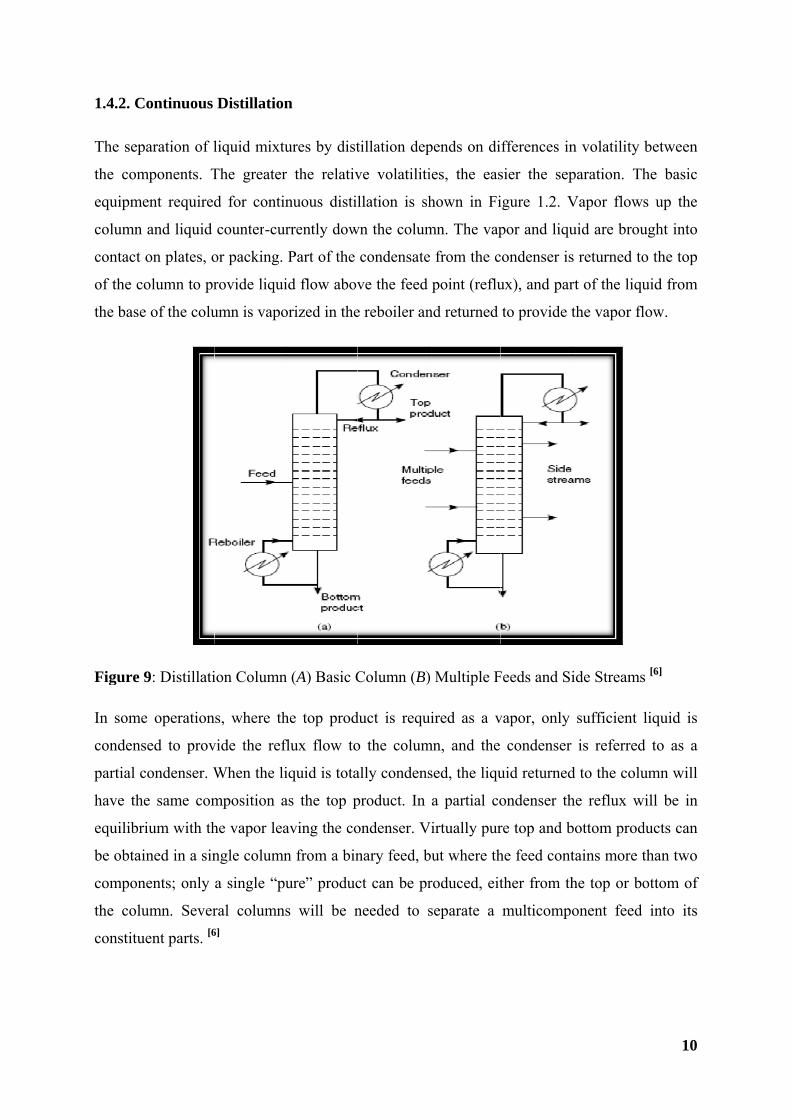
Continuous
paration of l
mponents. T
ent required
and liquid
on plates, o
olumn to pr
e of the colu
9: Distillati
e operation
sed to prov
condenser. W
he same com
rium with th
ined in a sin
nents; only
umn. Sever
uent parts. [6
Distillation
liquid mixtu
The greater
d for contin
counter-cur
or packing.
rovide liqui
umn is vapo
ion Column
ns, where th
vide the ref
When the li
mposition a
he vapor lea
ngle column
a single “pu
ral columns6]
n
ures by dist
r the relativ
nuous distil
rrently dow
Part of the
id flow abov
orized in the
n (A) Basic C
he top prod
flux flow to
iquid is tota
as the top p
aving the co
n from a bin
ure” produc
s will be n
tillation dep
ve volatiliti
llation is sh
wn the colum
condensate
ve the feed
e reboiler an
Column (B)
duct is requ
o the colum
ally condens
product. In
ondenser. V
nary feed, b
ct can be pr
needed to s
pends on di
ies, the eas
hown in Fi
mn. The vap
e from the c
point (reflu
nd returned
) Multiple F
uired as a v
mn, and the
sed, the liqu
a partial co
Virtually pur
but where th
roduced, eit
separate a
fferences in
sier the sep
igure 1.2. V
por and liqu
condenser is
ux), and par
to provide t
Feeds and Si
vapor, only
condenser
uid returned
ondenser th
re top and b
he feed cont
ther from th
multicompo
n volatility
paration. Th
Vapor flow
uid are brou
s returned to
rt of the liqu
the vapor fl
ide Streams
sufficient
is referred
d to the colu
he reflux w
bottom prod
tains more t
he top or bo
onent feed
10
between
he basic
s up the
ught into
o the top
uid from
low.
s [6]
liquid is
d to as a
umn will
will be in
ducts can
than two
ottom of
into its

11
1.4.2.1. Reflux Considerations
The reflux ratio, R, is normally defined as:
The number of stages required for a given separation will be dependent on the reflux ratio
used.
In an operating column the effective reflux ratio will be increased by vapor condensed within
the column due to heat leakage through the walls. With a well-lagged column the heat loss
will be small and no allowance is normally made for this increased flow in design
calculations. If a column is poorly insulated, changes in the internal reflux due to sudden
changes in the external conditions, such as a sudden rain storm, can have a noticeable effect
on the column operation and control.
Total Reflux: Total reflux is the condition when all the condensate is returned to the column
as reflux: no product is taken off and there is no feed.
At total reflux the number of stages required for a given separation is the minimum at which it
is theoretically possible to achieve the separation. Though not a practical operating condition,
it is a useful guide to the likely number of stages that will be needed. The testing of columns
is conveniently carried out at total reflux.
Minimum Reflux: As the reflux ratio is reduced a pinch point will occur at which the
separation can only be achieved with an infinite number of stages. This sets the minimum
possible reflux ratio for the specified separation.
Optimum Reflux Ratio: Practical reflux ratios will lie somewhere between the minimum for
the specified separation and total reflux. The designer must select a value at which the
specified separation is achieved at minimum cost. Increasing the reflux reduces the number of
stages required, and hence the capital cost, but increases the service requirements (steam and
water) and the operating costs. The optimum reflux ratio will be that which gives the lowest
annual operating cost. No hard and fast rules can be given for the selection of the design
reflux ratio, but for many systems the optimum will lie between 1.2 to 1.5 times the minimum
reflux ratio.

12
For new designs, where the ratio cannot be decided on from past experience, the effect of
reflux ratio on the number of stages can be investigated using the short-cut design methods.
This will usually indicate the best of value to use in more rigorous design methods.
At low reflux ratios the calculated number of stages will be very dependent on the accuracy of
the vapor-liquid equilibrium data available. If the data are suspect a higher than normal ratio
should be selected to give more confidence in the design.
1.4.2.2. Selection of Column Pressure
Except when distilling heat-sensitive materials, the main consideration when selecting the
column operating-pressure will be to ensure that the dew point of the distillate is above that
which can be easily obtained with the plant cooling water. The maximum, summer,
temperature of cooling water is usually taken as 30°C. If this means that high pressures will
be needed, the provision of refrigerated brine cooling should be considered. Vacuum
operation is used to reduce the column temperatures for the distillation of heat-sensitive
materials and where very high temperatures would otherwise be needed to distilled relatively
non-volatile materials.
When calculating the stage and reflux requirements it is usual to take the operating pressure as
constant throughout the column. In vacuum columns, the column pressure drop will be a
significant fraction of the total pressure and the change in pressure up the column should be
allowed for when calculating the stage temperatures. This may require a trial and error
calculation, as clearly the pressure drop cannot be estimated before an estimate of the number
of stages is made.
1.2.2.3. Dew Points and Bubble Points
To estimate the stage, and the condenser and reboiler temperatures, procedures are required
for calculating dew and bubble points. By definition, a saturated liquid is at its bubble point
(any rise in temperature will cause a bubble of vapor to form), and a saturated vapor is at its
dew point (any drop in temperature will cause a drop of liquid to form).
Dew points and bubble points can be calculated from knowledge of the vapor-liquid
equilibrium for the system. For multicomponent mixtures the temperature that satisfies these
equations, at a given system pressure, must be found by trial and error. For binary systems the

13
equations can be solved more readily because the component compositions are not
independent; fixing one fixes the other.
1.4.3. Multicomponent Distillation
The problem of determining the stage and reflux requirements for multicomponent
distillations is much more complex than for binary mixtures. With a multicomponent mixture,
fixing one component composition does not uniquely determine the other component
compositions and the stage temperature. Also when the feed contains more than two
components it is not possible to specify the complete composition of the top and bottom
products independently. The separation between the top and bottom products is specified by
setting limits on two “key” components, between which it is desired to make the separation.
The complexity of multicomponent distillation calculations can be appreciated by considering
a typical problem. The normal procedure is to solve the MESH equations stage-by-stage, from
the top and bottom of the column toward the feed point. For such a calculation to be exact the
compositions obtained from both the bottom up and top-down calculations must mesh at the
feed point and match the feed composition. But the calculated compositions will depend on
the compositions assumed for the top and bottom products at the commencement of the
calculations. Though it is possible to match the key components, the other components will
not match unless the designer was particularly fortunate in choosing the trial top and bottom
compositions. For a completely rigorous solution the compositions must be adjusted and the
calculations repeated until a satisfactory mesh at the feed point is obtained. Clearly, the
greater the number of components, the more difficult the problem. Trial-and error calculations
will be needed to determine the stage temperatures. For other than ideal mixtures, the
calculations will be further complicated by the fact that the component volatilities will be
functions of the unknown stage compositions. If more than a few stages are required, stage-
by-stage calculations are complex and tedious.
The short-cut methods available can be divided into two classes:
1. Simplification of the rigorous stage-by-stage procedures to enable the calculations to be
done by hand, or graphically.
2. Empirical methods, which are based on the performance of operating columns, or the
results of rigorous designs.

14
1.4.3.1. Key Components
Before commencing the column design, the designer must select the two “key” components
between which it is desired to make the separation. The light key will be the component that it
is desired to keep out of the bottom product, and the heavy key the component to be kept out
of the top product. Specifications will be set on the maximum concentrations of the keys in
the top and bottom products. The keys are known as “adjacent keys” if they are “adjacent” in
a listing of the components in order of volatility, and “split keys” if some other component
lies between them in the order; they will usually be adjacent.
Which components are the key components will normally be clear, but sometimes,
particularly if close boiling isomers are present, judgments must be used in their selection.
If any uncertainty exists, trial calculations should be made using different components as the
keys to determine the pair that requires the largest number of stages for separation (the worst
case). The Fenske equation can be used for these calculations.
The “non-key” components that appear in both top and bottom products are known as
“distributed” components; and those that are not present, to any significant extent, in one or
other product, are known as “non-distributed” components.
1.4.3.2. Number and Sequencing of Columns
In multicomponent distillations it is not possible to obtain more than one pure component, one
sharp separation, in a single column. If a multicomponent feed is to be split into two or more
virtually pure products, several columns will be needed. Impure products can be taken off as
side streams; and the removal of a side stream from a stage where a minor component is
concentrated will reduce the concentration of that component in the main product.
For separation of N components, with one essentially pure component taken overhead, or
from the bottom of each column, (N-1) columns will be needed to obtain complete separation
of all components. For example, to separate a mixture of benzene, toluene and xylene two
columns are needed (3-1). Benzene is taken overhead from the first column and the bottom
product, essentially free of benzene, is fed to the second column. This column separates the
toluene and xylene.

15
The order in which the components are separated will determine the capital and operating
costs. Where there are several components the number of possible sequences can be very
large; for example, with five components the number is 14, whereas with ten components it is
near 5000. When designing systems that require the separation of several components,
efficient procedures are needed to determine the optimum sequence of separation.
1.5. Distillation Column Design
The design of a distillation column can be divided into the following steps:
1. Specify the degree of separation required: set product specifications.
2. Select the operating conditions: batch or continuous; operating pressure.
3. Select the type of contacting device: plates or packing.
4. Determine the stage and reflux requirements: the number of equilibrium stages.
5. Size the column: diameter, number of real stages.
6. Design the column internals: plates, distributors, packing supports.
7. Mechanical design: vessel and internal fittings.
The principal step will be to determine the stage and reflux requirements. This is a relatively
simple procedure when the feed is a binary mixture, but a complex and difficult task when the
feed contains more than two components (multicomponent systems). [6]

16
2. PROBLEM STATEMENT
Bio-technology is gaining increasing importance due to the limited reserves of fossil fuels
which have been used substantially in the last decades to produce practically all the chemicals
that our modern world needs. Our company, which sees the necessity to shift to bio-
technology, decided to produce acetone, buthanol and ethanol from starch via ABE
fermentation process that uses bacterial anaerobic fermentation.
The products are recovered from fermentation medium by extraction using mesitylene as the
solvent. The extract phase is avaible at room temperature and atmospheric pressure, and has
the following composition;
Components wt%
Acetone 1.2
Butanol 2.4
Ethanol 0.4
Water 2.8
Mesitylene 93.2
It is desired to produce acetone, butanol and ethanol, each with 99 % purity, by distillation.
Our engineering group is expected to recommend as a reasonable layout for this separation
and is particularly responsible for the design of the 190 ton/h distillation column.

17
3. METHOD OF CALCULATIONS [7]
Decide on heavy key and light key,
Decide on distillation column arrangement,
Run ChemCad Simulation,
Find number of theoretical plates (N) and feed plate location for column,
Calculate average densitiy of feed streams,
Calculate pressure drop and feed plate pressure for column;
∆ (1)
Material balance calculations for column;
Calculate molar flow rate of each component in inlet stream;
(2)
Calculate distillate and bottom flow rates with total material balance for water
(3)
(4)
Determine mole fractions in distillate and bottom
(5)
Assume water mole fraction in distillate
1 (6)
Get operating temperature of condenser and reboiler from Chemcad
Calculate vapor pressures for each component from Antoine Equation
(7)
Determine dew and bubble point by using excel trial and error method
Calculate partial pressures for each components
(8)
Determine total pressure
∑ (9)
Calculate relative volatilities for column
∝ (10)
Calculate average volatilities
∝ ∝ ∝ (11)

18
Determine q value,
1 , 0
Calculate value
∑∝
∝1 (12)
Calculate RD min
∑∝
∝ 1 (13)
Determine number of theoretical stages including partial reboiler from Fenske
Equation
1∝
(14)
Calculate number of theoretical plates from Gilliland Correlation
(15)
1.
. √ (16)
(17)
Determine total column efficiency from O’Connell Correlation
∑
(18)
51 32.5 ∝ (19)
Determine actual number of plate
(20)
Determine ideal number of plates in stripping and enriching section from Kirkbride
Correlation
0.206 (21)
1 (22)
(23)
Calculate height of the column
3.25 1 (24)
19
Calculate mass flow rate of distillate and bottom
∑ (25)
(26)
(27)
Calculate Lo
(28)
Calculate Vn+1
(29)
Calculate Lm
(30)
Calculate Vm+1
(31)
Calculate average density of vapor
(32)
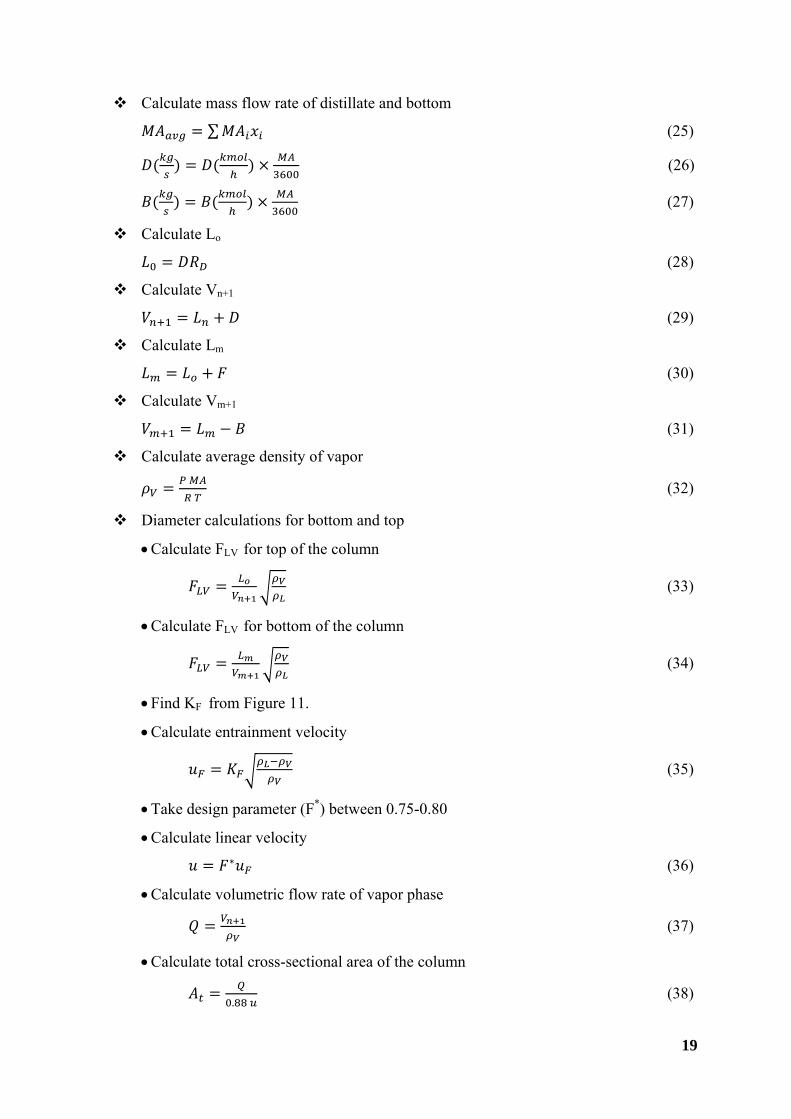
Diameter calculations for bottom and top
Calculate FLV for top of the column
(33)
Calculate FLV for bottom of the column
(34)
Find KF from Figure 11.
Calculate entrainment velocity
(35)
Take design parameter (F*) between 0.75-0.80
Calculate linear velocity
∗ (36)
Calculate volumetric flow rate of vapor phase
(37)
Calculate total cross-sectional area of the column
.
(38)

20
Calculate diameter of the column
(39)
Cost of the plate column
Calculate column wall thickness
(40)
Calculate weight of shell
Calculate base cost
(41)
Determine material factors for the shell (FM)
Calculate cost of the shell of the column
(42)
Calculate base cost for the plate
340 . (43)
Calculate material factors for plates
(44)
Determine plate type factor (FRT)
Determine correction factor (FNR)
Calculate cost of the plates
(45)
Calculate cost of platform and ladder
(46)
Calculate total cost of the column
(47)
Calculate heat capacity of condenser
For partial condenser
(48)
Calculate mass flow rate of water
(49)

21
Calculate ΔTLM
Δ (50)
Assume overall heat transfer coefficient
Calculate area of condenser
Δ
(51)
Determine cost of condenser from Figure 12.
Calculate cost of water
Calculate heat capacity of partial reboiler
(52)
Calculate mass flow rate of steam
(53)
Determine steam properties (pressure and temperature of inlet and outlet)
Calculate ΔT
Δ (54)
Assume overall heat transfer coefficient
Calculate area of partial reboiler
Δ
(55)
Determine cost of reboiler from Figure 12.
Calculate cost of steam
Calculate optimum pipe diameter
For turbulent flow and Di ≥ 0.0254m
, 0.363 . . (56)
Calculate volumetric flow rate
(57)
Calculate area of pump
, (58)
Calculate linear velocity
(59)

22
Calculate Reynold Number
(60)
Calculate Wp
(61)
Calculate power of pump
(62)
Calculate cost of electricity
Determine cost of pump from Figure 13.

23
Detailed Cost Calculations;
Direct Costs (DC)
1. Purchased Equipment Cost (Column + Condenser + Reboiler + Pump’s Costs) (64)
2. Installation, Including Insulation and Painting Cost = 0.50 x PEC (65)
3. Instrumentation and Controls, Installed = 0.25 x PEC (66)
4. Electrical, Installed= 0.20 x PEC (67)
5. Piping, Installed = 0.30 x PEC (68)
Direct Cost = Pec. + Ins. + Inst. + Elec. + Pip. (69)
Indirect Costs(IC)
1. Engineering and Supervision = 0.20 x DC (70)
2. Legal Expenses = X
3. Construction Expense and Contractor’s Fee= 0.20 x FCI (71)
4. Contingency = 0.05 x FCI (72)
Indirect Costs = Eng. & Sup. + Cons. & Cont. + Contin. (73)
Fixed Capital Investment = DC+IC (74)
Fixed Charges
1. Depreciation = (1/15) x FCI (15 years service life) (75)
2. Local Taxes = X
3. Insurance = 0.005 x FCI (76)
4. Rent = X
5. Financing = X
Fixed Cost = Dep. + Insr. (77)
Operating Costs
1. Raw Materials = X
2. Operating Labor = %25 Technician(1 Technician’s Salary = 2200TL), %10 Engineer (1
Engineer’s Salary = 3500TL)
(78)
3. Direct Supervisory and Clerical Labor =X
4. Utilities = (Cooling Water’s Cost + Electricity Cost for Pumps + Steam’s Cost) (79)
5. Maintenance and Repairs = 0.05 x FCI (80)
6. Operating Supplies = X
7. Laboratory Charges = X
8. Patents and Royalities = X
OC= Mant. & Rep. + Op. Lab. + Util. (81)
Total Annual Cost For System = Fixed Costs + Operating Costs (82)

P
Figu
Plate Desig
ure 10: Siev
Volumetr
Length of
Area of d
Net area
Area of h
Active are
Perforated
≅
Number o
For triang
gn; [7]
ve Tray Phe
ric flow rate
f weir
0.77
rain channe
0.12
0.88
oles
0.1
ea
0.76
d area
≅ 2
of holes
gular pitch
0.95
enomena an
e for liquid p
el
nd Pressure R
phase
Relation
24
(86)
(87)
(88)
(89)
(90)
(91)
(92)
(93)
(94)
25
Determine drag ratio (ψ) from Figure B.4
Liquid entrainment
(95)
Vapor velocity in holes
(96)
Determine dry orifice coefficient (Cvo) from Figure B.5
Pressure drop in dry plate
Δ 5.08ρ
ρu (97)
Bubble parameter
(98)
Determine bubble factor (Qp) from Figure B.6
Height of liquid above weir
66.6.
(99)
Bubbled liquid height
(100)
Total plate pressure drop
Δ Δ (101)
Pressure drop from bubbling
4.14 10 (102)
Check weeping from Figure B.7
Velocity of the liquid in the decent duct
(103)
The time passed during the stay of liquid in decent duct
(104)
Height of Foam on the Plate
(105)
Hydraulic Radius of the Bubbled
(106)

26
(107)
Determine density of foam (ϕ) from Figure B.6
Velocity of bubbled mass
(108)
Reynolds module
(109)
Determine friction coefficient (f) from Figure B.8
Liquid gradient
∆ 100 (110)
Height of liquid in decent duct
(apron space) (111)
16.5 (112)
Check plate space assumption
hdc Pdry + hw + how + + hda (113)
For bubbling liquids:
(114)
For non-bubbling liquids:
0.9 (115)
3.1. Assumptions
hw= 0.05m
x 0.0001
F*=0.80
For partial condenser U=750 W/m2K
For partial reboiler U= 1200 W/m2K
Pump efficiency = 0.75
ld = 0.075 m

27
4. SAMPLE CALCULATIONS

28

29

30

31

32

33

34

35

36

37

38

39

40

41

42

43

44

45

46

47

48

49

50

51

52

53

54

55

56
5. RESULTS
3rd Column
Feed, kmol/h 351 Distillate, kmol/h 55.71 Bottom, kmol/h 295.29
x(acetone),F 0.1118 x(acetone),D 0.7043 x(acetone),B 0
x(ethanol),F 0.047 x(ethanol),D 0.2956 x(ethanol),B 0.0001
x(water),F 0.8412 x(water),D 0.0001 x(water),B 0.9999
Partial Condenser Partial Reboiler Flows in Column
Operating
Temperature. oC 65.66 Operating Temperature.°C 104.36 Lo, kg/s 8.59
Operating Pressure. atm 1.15 Operating Pressure. atm 1.18 V1, kg/s 9.43
Duty. kW 3103.5 Duty. kW 3162.6 Lm, kg/s 10.92
U. W/m2-K 750 U. W/m2-K 1200 Vm, kg/s 9.42
m(water). kg/s 35.37 m(steam). kg/s 1.46
Column Properties Plate Properties
RDmin 9.697 Column Efficiency.Eo(%) 81 ΔPdry (cm liq. column) 2.389
RD/RDmin 1.1 Number of Plates 59 Δptotal (cm liq. column) 9.236
RD 10.67 Feed Plate 42 Weeping Yes
Nmin 20 Height.m 27.5 Number of holes 64106
Ntheoretical 47 Diameter.m 3.8

57
Graph 1. TAC, OC, FC vs. RD/RD,min (Steam Cost: 40 TL/ton)
Table 1. Detailed Cost Analysis Results for Steam Cost 40 TL/ton
DETAILED COST ANALYSIS Direct costs Purchased Equipment 1 639 666 TL Installation 819 833 TL Instrumentation and Controls 409 917 TL Piping 491 900 TL Electrical, Installed 327 933 TL TOTAL DIRECT COST 3 689 909 TL Indirect Costs Engineering and Supervision 737 862 TL Construction Expense and Contractor's Fee 1 180 578 TL Contingency 295 144 TL TOTAL INDIRECT COST 2 213 586 TL FIXED-CAPITAL INVESTMENT(TL) 5 902 894 TL Depreciation 393 526 TL/yr Insurance 29 515 TL/yr FIXED-CHARGES 423 041 TL/yr Maintenance and Repairs 295 145 TL/yr Utilities 1 723 273 TL/yr OPERATING COST 2 029 218 TL/yr TOTAL ANNUAL COST(TL/year) 2 452 259 TL/yr
280000530000780000
1030000128000015300001780000203000022800002530000278000030300003280000353000037800004030000
1 1,1 1,2 1,3 1,4 1,5 1,6 1,7 1,8 1,9 2 2,1
COST (TL/yr)
RD/RDmin
TAC, OC, FC vs. RD/RDmin (Steam Cost: 40 TL/ton)
FC (TL/yr)
OC (TL/yr)
TAC (TL/yr)

58
Graph 2. TAC, OC, FC vs. RD/RD,min (Steam Cost: 16 TL/ton)
Table 2. Detailed Cost Analysis Results for Steam Cost 16 TL/ton
DETAILED COST ANALYSIS Direct costs Purchased Equipment 1 639 666 TL Installation 819 833 TL Instrumentation and Controls 409 917 TL Piping 491 900 TL Electrical, Installed 327 933 TL TOTAL DIRECT COST 3 689 909 TL Indirect Costs Engineering and Supervision 737 862 TL Construction Expense and Contractor's Fee 1 180 578 TL Contingency 295 144 TL TOTAL INDIRECT COST 2 213 586 TL FIXED-CAPITAL INVESTMENT(TL) 5 902 894 TL Depreciation 393 526 TL/yr Insurance 29 515 TL/yr FIXED-CHARGES 423 041 TL/yr Maintenance and Repairs 295 145 TL/yr Utilities 713 015 TL/yr OPERATING COST 1 019 030 TL/yr TOTAL ANNUAL COST(TL/year) 1 442 001 TL/yr
340000
490000
640000
790000
940000
1090000
1240000
1390000
1540000
1690000
1840000
1990000
2140000
2290000
1 1,1 1,2 1,3 1,4 1,5 1,6 1,7 1,8 1,9 2 2,1
COST (TL/yr)
RD/RDmin
TAC, OC, FC vs. RD/RDmin (Steam Cost: 16 TL/ton)
FC (TL/yr)
OC (TL/yr)
TAC (TL/yr)

59
6. DISCUSSION
In this project, the main aim was design the optimum economical distillation column for
seperation of acetone, ethanol and water mixture. This mixture is desired to be distilled to
99.9 % pure components.
The feed of first distillation column is 190 000 kg/h. We used four distillation columns to
distillate mesitylene, n-buthanol, water, ethanol and acetone and we done detailed calculation
and found optimum Rd/Rdmin parameter for third column. We used partial condensers for
first, second and third column and we used total condenser for last column.
On ChemCad we used 0.9999 light key split for first and second column and looked at third
column stages number than we used 0.99 and 0.999 light key split for first and second column
then we have seen that we must use extra one column for bottom product of third column to
seperate ethanol and water. But using 0.9999 light key split at first and second column is more
economic, because total number of stages of first, second and third column is lower than
adding extra one column.
The cause of using partial condenser is about cooling water cost. If we used total condenser
for first, second and third column in this system, the cooling water cost will increase, so we
just used total condenser for last column.
The third (designed column) column’ s feed is 351 kmol/h. The mole fraction in feed acetone
is 0.1118, ethanol is 0.0470 and water is 0.8412. We selected heavy component as water and
light component as ethanol. Water is distilled to 99.99% outlet composition from the bottom
of distillation column. Distillate of column is fed to the last column which is binary
distillation column. The products of this column are 99.9% acetone and 99.9% ethanol.
Calculations are done by using these decisions.
After distillation; acetone, ethanol and water’ s mole fractions are found as 0.7043, 0.2956,
0.0001 for distillate. About bottom they are found 0, 0.0001, 0.9999 by completing material
balance.
The efficiency of column is found about 80 %. On calculations q taken as “1” because feed
was saturated vapor.
We have done calculations for two situations. One of them is taking steam cost as 40 TL/ton
(for Turkey) and the other one is taking steam cost as 16 TL/ton (for U.S.A.). We want to see

60
effect of steam cost to total annual cost. And the results show that for first situation there is no
optimum point on Graph 1. and for second situation we found an optimum value which is 1.1
Rd/Rd,min ratio on Graph 2. and we done calculations using this optimum point. When cost
of steam increases, total annual cost increases.
After calculation we found diameter of column as about 3.8 m, height of column as 27.5 m,
minimum reflux ratio as about 9.6 , minimum stage number as 20, theoretical stage number as
47 and actual number of stage found as 59.
On basic and chemcad program we found same minimum reflux as about 9.6, but the number
of minimum and theoretical stages we have very little error but it can negliable. It’s reason
maybe our calculation has mistake a little.
The condensers and reboilers are placed on two different platforms where condensers are on
higher level than reboilers. The reason of this arrangement is to save place. In order to transfer
the feed to the system and also, in order to transmit the exit stream from the condenser to the
column as a reflux, pumps are used. The reflux pump is placed near reboiler to decrease pump
power and as a result energy cost.
We used two pumps for column, one of them for partial condenser and one of them for partial
reboiler. But we have seen that after calculation, for partial reboiler the pump is not necessary.
Because it is gas phase and not need to use pump. Also after calculation the reboiler pump
power found as 0.04 kW, it shows if there is no pump for reboiler, system can keep working.
Any other reason; the power of reflux pump is higher than reboilers’ pump as a result of
higher difference between heights of condensers and reflux pump in second column.
For reboiler we used lower pressure steam, which is 3 bar 133 oC. It was enough for our
system and if we use higher pressure steam the utility cost will find bigger. It shows steam
choosing is also important thing for distillation system.
Also steam production is important for cost of steam. On Turkey, steam production from coal
is cheaper than steam production from natural gas. Steam which by produced from coal cost is
40 TL/ton and from natural gas steam cost is 50 TL/ton. So we choosed steam for system
which is produced from coal.
304 stainless steel is chosen as the material of construction, because for long service life and
protect material from corrosion, these type of materials are using distillation system.

61
About plate, we used sieve type plate, because it’s efficiency is higher than other type of
plates, it is simple to produce and usefull for these type of distillation columns.
Around the distillation column there should be manholes which are used when there is need
for cleaning the plates or when there is a need for unexpected situation in the system and also,
the ladder is used to climb to the column and used to reach to the manholes.
After all calculations for Rd/Rd, min 1.1, we done economical calculations. We found total
direct cost as 3,689,909 TL, total indirect cost as 2,213,586 TL, fixed charges as 423,041
TL/yr, operating cost as 2,029,218 TL/yr, and finally total annual cost as 2,452,589 TL/yr for
Turkey. For U.S.A. we found operating cost as 1,019,030 TL/yr and total annual cost as
1,442,001 TL/yr because of steam cost.

62
7. CONCLUSION
In this project, the distillation column is designed to get pure product of ethanol and acetone
about 99%.
After economic analysis, following datas found;
Purchased Equipment Cost: 1,639,666 TL
Direct Cost: 3,689,909 TL
Indirect Cost: 2,213,586 TL
Fixed Cost: 423,041 TL/yr
For Turkey;
Operating Cost: 2,029,218 TL/yr
Total Annual Cost: 2,452,589 TL/yr
For U.S.A.;
Operating Cost: 1,019,030 TL/yr
Total Annual Cost: 1,442,001 TL/yr
This project is acceptable to purification of ethanol, acetone and n- buthanol. These
components using and market is increasing day to day. So it will make profit.

63
8. SYMBOLS
A,B,C : Antoine constants
At : Cross sectional area of column ,m2
B: Mass flow rate of bottom product, kmol/ h
c: corrosion allowance, mm
Cp : specific heat, kj/ kg K
dc: Column diameter, m
d h : Hole diameter, m
D: Mass flow rate of distillate product, kmol/ h
E0 : Efficiency of column
f: Material’s max. working stress
F: Mass flow rate of feed, kmol/ h
F*: Design parameter
FLV: Flow parameter
hW: Height of water on tray ,m
HK: heavy key
IR: Plate spacing in column
KF: Capacity paramater
LM: Mass of liquid
LK: Light key
N: Number of plates
N,act: number of actual tray
P: Maximum allowable pressure, Mpa

64
Po: Partial pressure of each component, mmHg
PT: Total pressure, mmHg
q: Heat load, j/s
Q: Volumetric flow rate of vapor, m3/s
RD: Reflux ratio
RDmin: Minimum reflux ratio
T: Temperature, K
t: Shell thickness,m
U: Overall heat transfer coefficient, W/ m2 K
u: Actual vapor velocity, m/s
uF: Floading velocity,m/s
VM : Mass of vapor
yi : Mol fraction of each component in vapor
ZT: Height of column, m
α: Relative volalitiy
XiF: Mol fraction of each component in feed
xi: Mol fraction of each component in liquid
ΔP: Pressure drop, mmHg
μ: Viscosity, mPa.s or kg/m.s
ρV: Density of vapor, kg/m3
ρL: Density of liquid, kg/ m3
λ: Latent heat, kJ/gmol

65
9. REFERENCES
[1] http://bioacetone.com (28.12.2013)
[2] http://www.esru.strath.ac.uk/EandE/Web_sites/02-03/biofuels/what_bioethanol.htm
(28.12.2013)
[3] http://www.biobutanol.com (28.12.2013)
[4] Cheremisinoff, N., P., “Handbook of Chemical Processing Equipment”, 1st ed.,
Butterworth-Heinemann Publications, WoBurn, USA, 2000.
[5] Walas, S.M., “Chemical Process Equipment - Selection and Design”, 1st ed., Butterworth-
Heinemann publications, Reed Publishing USA, 1990
[6] Sinnott, R.K., Coulson & Richardson’s Chemical Engineering Design, Volume 6, 4th
Edition, Elsevier Inc., 2005
[7] Uysal B.Z., ‘Akışkanlar Mekaniği’, Alp Yayınevi, 2. Baskı, Ankara, 2006
[8] Peters M.S., Timmerhaus K.D., West R.E.,’Plant Design and Economics for Chemical
Engineers’, University of Colorado, fifth edition, New York, 2002
[9] http://www.engineeringtoolbox.com/saturated-steam-properties-d_457.html (28.12.2013)
[10] Ethanol MSDS
[11] Water MSDS
[12] Acetone MSDS
66
APPENDICES

67
APPENDIX-A: PHYSIOCHEMICAL PROPERTIES OF COMPONENTS
Table 3. Properties of Ethanol [10]
Properties of Ethanol at 20°C
Molecular Weight (g/mol) 46.0414
Viscosity (kg/ms) 0.0012
Boiling Point (° C ) 78
Freezing/Melting Point (° C ) -114.1
Density (kg/m3) 0.790
Solubility Miscible
Table 4. Properties of Water [11]
Properties of Water at 20°C
Molecular Weight (g/mol) 18.02
Viscosity (kg/ms) 0.001002
Boiling Point (° C ) 100
Freezing/Melting Point (° C ) 0
Density (kg/m3) 1.00
Table 5. Properties of Acetone [12]
Properties of Acetone at 20°C
Molecular Weight (g/mol) 58.08
Viscosity (mPa.s) 0.32
Boiling Point (° C ) 56.2°C
Freezing/Melting Point (° C ) -95.35
Density (kg/m3) 0.79
Solubility Easily soluble in cold water, hot water.
Table 6. Antoine Constans for Each Components [7]
Antoine Constants, T in K and P in mmHg A B C Acetone 16,6513 2940,46 -35,93 Ethanol 18,9119 3803,98 -41,68 Water 18,3036 3816,44 -46,13

68
Table 7. Saturated Steam Properties [9]
Absolute pressure
Boiling point Specific volume (steam) Density (steam) Specific enthalpy of liquid water
(sensible heat) Specific enthalpy of steam
(total heat) Latent heat of evaporization Specific heat
(bar) (oC) (m3/kg) (kg/m3) (kJ/kg) (kcal/kg) (kJ/kg) (kcal/kg) (kJ/kg) (kcal/kg) (kJ/kg K)
1 99.63 1.694 0.590 417.51 99.72 2675.43 639.02 2257.92 539.30 2.0267
1.2 104.81 1.428 0.700 439.36 104.94 2683.44 640.93 2244.08 535.99 2.0476
1.4 109.32 1.236 0.809 458.42 109.49 2690.28 642.56 2231.86 533.07 2.0673
1.5 111.37 1.159 0.863 467.13 111.57 2693.36 643.30 2226.23 531.73 2.0768
1.6 113.32 1.091 0.916 475.38 113.54 2696.25 643.99 2220.87 530.45 2.0860
1.7 115.17 1.031 0.970 483.22 115.42 2698.97 644.64 2215.75 529.22 2.0950
1.8 116.93 0.977 1.023 490.70 117.20 2701.54 645.25 2210.84 528.05 2.1037
1.9 118.62 0.929 1.076 497.85 118.91 2703.98 645.83 2206.13 526.92 2.1124
2 120.23 0.885 1.129 504.71 120.55 2706.29 646.39 2201.59 525.84 2.1208
2.2 123.27 0.810 1.235 517.63 123.63 2710.60 647.42 2192.98 523.78 2.1372
2.4 126.09 0.746 1.340 529.64 126.50 2714.55 648.36 2184.91 521.86 2.1531
2.6 128.73 0.693 1.444 540.88 129.19 2718.17 649.22 2177.30 520.04 2.1685
2.8 131.20 0.646 1.548 551.45 131.71 2721.54 650.03 2170.08 518.32 2.1835
3 133.54 0.606 1.651 561.44 134.10 2724.66 650.77 2163.22 516.68 2.1981
3.5 138.87 0.524 1.908 584.28 139.55 2731.63 652.44 2147.35 512.89 2.2331
4 143.63 0.462 2.163 604.68 144.43 2737.63 653.87 2132.95 509.45 2.2664
4.5 147.92 0.414 2.417 623.17 148.84 2742.88 655.13 2119.71 506.29 2.2983
5 151.85 0.375 2.669 640.12 152.89 2747.54 656.24 2107.42 503.35 2.3289
5.5 155.47 0.342 2.920 655.81 156.64 2751.70 657.23 2095.90 500.60 2.3585
6 158.84 0.315 3.170 670.43 160.13 2755.46 658.13 2085.03 498.00 2.3873
6.5 161.99 0.292 3.419 684.14 163.40 2758.87 658.94 2074.73 495.54 2.4152
7 164.96 0.273 3.667 697.07 166.49 2761.98 659.69 2064.92 493.20 2.4424
7.5 167.76 0.255 3.915 709.30 169.41 2764.84 660.37 2055.53 490.96 2.4690
8 170.42 0.240 4.162 720.94 172.19 2767.46 661.00 2046.53 488.80 2.4951
8.5 172.94 0.227 4.409 732.03 174.84 2769.89 661.58 2037.86 486.73 2.5206
9 175.36 0.215 4.655 742.64 177.38 2772.13 662.11 2029.49 484.74 2.5456
9.5 177.67 0.204 4.901 752.82 179.81 2774.22 662.61 2021.40 482.80 2.5702
10 179.88 0.194 5.147 762.60 182.14 2776.16 663.07 2013.56 480.93 2.5944
30 233.84 0.067 15.009 1008.33 240.84 2802.27 669.31 1793.94 428.48 3.4069

APPEN
Figure
Figure
NDIX-B: FI
11: Capacit
12: Purchas
IGURES W
ty of Entrain
sed Cost of
WHICH AR
nment Diag
Fixed-Tube
RE USED O
gram [7]
e-Sheet Hea