Adaptive eye-gaze tracking using neural-network-based user ...
Gaze Map Matching: Mapping Eye Tracking Data to...
10
Gaze Map Matching: Mapping Eye Tracking Data to Geographic Vector Features Peter Kiefer Institute of Cartography and Geoinformation ETH Zurich Wolfgang-Pauli-Str. 15 CH-8093 Zurich, Switzerland [email protected] Ioannis Giannopoulos Institute of Cartography and Geoinformation ETH Zurich Wolfgang-Pauli-Str. 15 CH-8093 Zurich, Switzerland [email protected] ABSTRACT This paper introduces gaze map matching as the problem of algorithmically interpreting eye tracking data with respect to geographic vector features, such as a road network shown on a map. This differs from previous eye tracking studies which have not taken into account the underlying vector data of the cartographic map. The paper explores the chal- lenges of gaze map matching and relates it to the (vehicle) map matching problem. We propose a gaze map matching algorithm based on a Hidden Markov Model, and compare its performance with two purely geometric algorithms. Two eye tracking data sets recorded during the visual inspection of 14 road network maps of varying realism and complexity are used for this evaluation. Categories and Subject Descriptors I.5 [Pattern Recognition]: Models; I.2.1 [Artificial In- telligence]: Applications and Expert Systems—Cartogra- phy General Terms Algorithms, Measurement Keywords Eye tracking, map matching, gaze-based assistance 1. INTRODUCTION Eye trackers are used to measure the visual attention of individuals. They have a number of potentials for studying and improving the way humans interact with the interface of a geographic information system (GIS). On the one hand, they offer valuable data that can be exploited in usability studies. In the geovisualization community, for instance, gaze data analyses have been combined with standard us- ability metrics to evaluate the effectiveness and efficiency of interactive map interface designs [3, 4]. Permission to make digital or hard copies of all or part of this work for personal or classroom use is granted without fee provided that copies are not made or distributed for profit or commercial advantage and that copies bear this notice and the full citation on the first page. T o copy otherwise, to republish, to post on servers or to redistribute to lists, requires prior specific permission and/or a fee. ACM SIGSP ATIAL GIS ’12 November 6-9, 2012. Redondo Beach, CA, USA Copyright 2012 ACM ISBN 978-1-4503-1691-0/12/11 ...$15.00. Another application of eye tracking consists in real-time map interaction, such as gaze-based zooming and panning [27], or using the user’s gaze history as visual clue for better orientation on a map [9]. These gaze-based assistive tech- nologies are specifically interesting for the support of geo- spatial tasks in scenarios where interaction possibilities are restricted, such as wayfinding with a mobile map [13]. In both, usability studies and gaze-based assistance, pre- vious work on eye tracking for GIS has typically interpreted gaze with respect to few areas of interest (AOI) which were not originally in the underlying vector data. For instance, the analysis presented in [3] interprets the gaze data as a se- quence between control elements of a GIS (map panel, layer selection panel, query results dialog, etc.). In this paper we argue that, especially for the case of inter- active maps where the map content may change frequently, an intelligent interpretation of gaze should take the current contents of the map into account: ‘which map object, i. e., which road, river, lake, point of interest etc., was (or is) the user inspecting?’. An algorithm that automatically answers this question would take a sequence of gaze points as an input and match these points with the vector features displayed on a map. To the authors’ best knowledge, this problem of mapping gaze to geographic vector features (the gaze map matching prob- lem) has never been addressed in literature before. From a geometric point of view, it is related to the problem of matching a sequence of vehicle position measurements to the road segments most probably travelled (known as ‘map matching’ in literature) [19]. Problems that make gaze map matching challenging include hardware inaccuracy, bad cali- bration, the permanent unintentional movements of the eye, and ambiguity resolution when a gaze point is in the vicinity of more than one map element. The paper compares three gaze map matching algorithms: a naive algorithm, one working with a sliding window, and one probabilistic algorithm based on a Hidden Markov Model (HMM). A dataset of eye tracking data collected from two participants during the visual inspection of 14 road network maps of varying realism and complexity is used for the eval- uation. For this inspection task, the HMM algorithm per- formed better than the naive algorithms. We argue that this is due to the possibility to parameterize the HMM to the task, whereas the other two algorithms are purely geo- metric. The paper is structured as follows: section 2 gives a basic introduction to eye tracking, its applications for geo-spatial
Transcript of Gaze Map Matching: Mapping Eye Tracking Data to...

Gaze Map Matching: Mapping Eye Tracking Data toGeographic Vector Features
Peter KieferInstitute of Cartography and Geoinformation
ETH ZurichWolfgang-Pauli-Str. 15
CH-8093 Zurich, [email protected]
Ioannis GiannopoulosInstitute of Cartography and Geoinformation
ETH ZurichWolfgang-Pauli-Str. 15
CH-8093 Zurich, [email protected]
ABSTRACTThis paper introduces gaze map matching as the problem ofalgorithmically interpreting eye tracking data with respectto geographic vector features, such as a road network shownon a map. This differs from previous eye tracking studieswhich have not taken into account the underlying vectordata of the cartographic map. The paper explores the chal-lenges of gaze map matching and relates it to the (vehicle)map matching problem. We propose a gaze map matchingalgorithm based on a Hidden Markov Model, and compareits performance with two purely geometric algorithms. Twoeye tracking data sets recorded during the visual inspectionof 14 road network maps of varying realism and complexityare used for this evaluation.
Categories and Subject DescriptorsI.5 [Pattern Recognition]: Models; I.2.1 [Artificial In-telligence]: Applications and Expert Systems—Cartogra-phy
General TermsAlgorithms, Measurement
KeywordsEye tracking, map matching, gaze-based assistance
1. INTRODUCTIONEye trackers are used to measure the visual attention of
individuals. They have a number of potentials for studyingand improving the way humans interact with the interfaceof a geographic information system (GIS). On the one hand,they offer valuable data that can be exploited in usabilitystudies. In the geovisualization community, for instance,gaze data analyses have been combined with standard us-ability metrics to evaluate the effectiveness and efficiency ofinteractive map interface designs [3, 4].
Permission to make digital or hard copies of all or part of this work forpersonal or classroom use is granted without fee provided that copies are
not made or distributed for profit or commercial advantage and that copiesbear this notice and the full citation on the first page. To copy otherwise, to
republish, to post on servers or to redistribute to lists, requires prior specificpermission and/or a fee.
ACM SIGSPATIAL GIS ’12 November 6-9, 2012. Redondo Beach, CA,USACopyright 2012 ACM ISBN 978-1-4503-1691-0/12/11 ...$15.00.
Another application of eye tracking consists in real-timemap interaction, such as gaze-based zooming and panning[27], or using the user’s gaze history as visual clue for betterorientation on a map [9]. These gaze-based assistive tech-nologies are specifically interesting for the support of geo-spatial tasks in scenarios where interaction possibilities arerestricted, such as wayfinding with a mobile map [13].
In both, usability studies and gaze-based assistance, pre-vious work on eye tracking for GIS has typically interpretedgaze with respect to few areas of interest (AOI) which werenot originally in the underlying vector data. For instance,the analysis presented in [3] interprets the gaze data as a se-quence between control elements of a GIS (map panel, layerselection panel, query results dialog, etc.).
In this paper we argue that, especially for the case of inter-active maps where the map content may change frequently,an intelligent interpretation of gaze should take the currentcontents of the map into account: ‘which map object, i. e.,which road, river, lake, point of interest etc., was (or is) theuser inspecting?’.
An algorithm that automatically answers this questionwould take a sequence of gaze points as an input and matchthese points with the vector features displayed on a map. Tothe authors’ best knowledge, this problem of mapping gazeto geographic vector features (the gaze map matching prob-lem) has never been addressed in literature before. Froma geometric point of view, it is related to the problem ofmatching a sequence of vehicle position measurements tothe road segments most probably travelled (known as ‘mapmatching’ in literature) [19]. Problems that make gaze mapmatching challenging include hardware inaccuracy, bad cali-bration, the permanent unintentional movements of the eye,and ambiguity resolution when a gaze point is in the vicinityof more than one map element.
The paper compares three gaze map matching algorithms:a naive algorithm, one working with a sliding window, andone probabilistic algorithm based on a Hidden Markov Model(HMM). A dataset of eye tracking data collected from twoparticipants during the visual inspection of 14 road networkmaps of varying realism and complexity is used for the eval-uation. For this inspection task, the HMM algorithm per-formed better than the naive algorithms. We argue thatthis is due to the possibility to parameterize the HMM tothe task, whereas the other two algorithms are purely geo-metric.
The paper is structured as follows: section 2 gives a basicintroduction to eye tracking, its applications for geo-spatial
pekiefer
Schreibmaschinentext
pekiefer
Schreibmaschinentext
Preprint version. ACM, 2012. This is the authors version of the work. It is posted here by permission of ACM for your personal use. Not for redistribution. The definitive version will be published in ACM SIGSPATIAL GIS '12 (DOI to be assigned).
pekiefer
Schreibmaschinentext
Please cite as: Peter Kiefer and Ioannis Giannopoulos. Gaze map matching: Mapping eye tracking data to geographic vector features. In Proceedings of the 20th SIGSPATIAL International Conference on Advances in Geographic Information Systems, New York, NY, USA, 2012. ACM. to appear
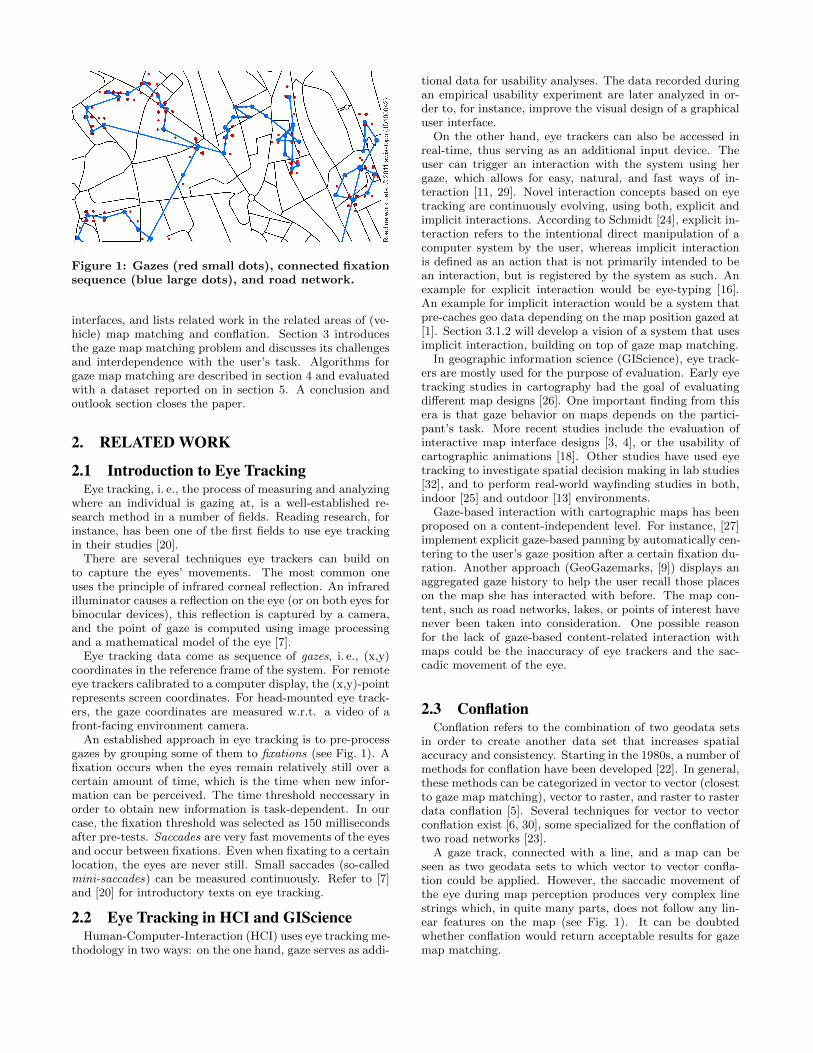
Figure 1: Gazes (red small dots), connected fixationsequence (blue large dots), and road network.
interfaces, and lists related work in the related areas of (ve-hicle) map matching and conflation. Section 3 introducesthe gaze map matching problem and discusses its challengesand interdependence with the user’s task. Algorithms forgaze map matching are described in section 4 and evaluatedwith a dataset reported on in section 5. A conclusion andoutlook section closes the paper.
2. RELATED WORK
2.1 Introduction to Eye TrackingEye tracking, i. e., the process of measuring and analyzing
where an individual is gazing at, is a well-established re-search method in a number of fields. Reading research, forinstance, has been one of the first fields to use eye trackingin their studies [20].
There are several techniques eye trackers can build onto capture the eyes’ movements. The most common oneuses the principle of infrared corneal reflection. An infraredilluminator causes a reflection on the eye (or on both eyes forbinocular devices), this reflection is captured by a camera,and the point of gaze is computed using image processingand a mathematical model of the eye [7].
Eye tracking data come as sequence of gazes, i. e., (x,y)coordinates in the reference frame of the system. For remoteeye trackers calibrated to a computer display, the (x,y)-pointrepresents screen coordinates. For head-mounted eye track-ers, the gaze coordinates are measured w.r.t. a video of afront-facing environment camera.
An established approach in eye tracking is to pre-processgazes by grouping some of them to fixations (see Fig. 1). Afixation occurs when the eyes remain relatively still over acertain amount of time, which is the time when new infor-mation can be perceived. The time threshold neccessary inorder to obtain new information is task-dependent. In ourcase, the fixation threshold was selected as 150 millisecondsafter pre-tests. Saccades are very fast movements of the eyesand occur between fixations. Even when fixating to a certainlocation, the eyes are never still. Small saccades (so-calledmini-saccades) can be measured continuously. Refer to [7]and [20] for introductory texts on eye tracking.
2.2 Eye Tracking in HCI and GIScienceHuman-Computer-Interaction (HCI) uses eye tracking me-
thodology in two ways: on the one hand, gaze serves as addi-
tional data for usability analyses. The data recorded duringan empirical usability experiment are later analyzed in or-der to, for instance, improve the visual design of a graphicaluser interface.
On the other hand, eye trackers can also be accessed inreal-time, thus serving as an additional input device. Theuser can trigger an interaction with the system using hergaze, which allows for easy, natural, and fast ways of in-teraction [11, 29]. Novel interaction concepts based on eyetracking are continuously evolving, using both, explicit andimplicit interactions. According to Schmidt [24], explicit in-teraction refers to the intentional direct manipulation of acomputer system by the user, whereas implicit interactionis defined as an action that is not primarily intended to bean interaction, but is registered by the system as such. Anexample for explicit interaction would be eye-typing [16].An example for implicit interaction would be a system thatpre-caches geo data depending on the map position gazed at[1]. Section 3.1.2 will develop a vision of a system that usesimplicit interaction, building on top of gaze map matching.
In geographic information science (GIScience), eye track-ers are mostly used for the purpose of evaluation. Early eyetracking studies in cartography had the goal of evaluatingdifferent map designs [26]. One important finding from thisera is that gaze behavior on maps depends on the partici-pant’s task. More recent studies include the evaluation ofinteractive map interface designs [3, 4], or the usability ofcartographic animations [18]. Other studies have used eyetracking to investigate spatial decision making in lab studies[32], and to perform real-world wayfinding studies in both,indoor [25] and outdoor [13] environments.
Gaze-based interaction with cartographic maps has beenproposed on a content-independent level. For instance, [27]implement explicit gaze-based panning by automatically cen-tering to the user’s gaze position after a certain fixation du-ration. Another approach (GeoGazemarks, [9]) displays anaggregated gaze history to help the user recall those placeson the map she has interacted with before. The map con-tent, such as road networks, lakes, or points of interest havenever been taken into consideration. One possible reasonfor the lack of gaze-based content-related interaction withmaps could be the inaccuracy of eye trackers and the sac-cadic movement of the eye.
2.3 ConflationConflation refers to the combination of two geodata sets
in order to create another data set that increases spatialaccuracy and consistency. Starting in the 1980s, a number ofmethods for conflation have been developed [22]. In general,these methods can be categorized in vector to vector (closestto gaze map matching), vector to raster, and raster to rasterdata conflation [5]. Several techniques for vector to vectorconflation exist [6, 30], some specialized for the conflation oftwo road networks [23].
A gaze track, connected with a line, and a map can beseen as two geodata sets to which vector to vector confla-tion could be applied. However, the saccadic movement ofthe eye during map perception produces very complex linestrings which, in quite many parts, does not follow any lin-ear features on the map (see Fig. 1). It can be doubtedwhether conflation would return acceptable results for gazemap matching.
2.4 Vehicle Map MatchingLiterature uses the term ‘map matching’ for the problem
of matching a sequence of (potentially inaccurate) vehicleposition measurements to road segments of a street network[19]. In the scope of this paper, we refer to this problem asvehicle map matching. Position is typically measured witha Global Navigation Satellite System (GNSS). Some spe-cialized algorithms consider other position methods, suchas WiFi [31]. Besides purely geometric vehicle map match-ing (e.g., [28]), more advanced algorithms include topologyand/or speed constraints into their reasoning (e.g., [15]). Inthe last years, probabilistic methods have gained some pop-ularity, such as the HMM-based approach presented in [17]which is the basis of one of our algorithms in section 4.
Gaze map matching has a similar goal as vehicle mapmatching, with the decisive difference that, in general, topo-logical and speed constraints do not apply to gaze data. Sac-cades from one part of the map to a completely different partmay appear at any time. As an exception, extra knowledgecan be utilized if we know the user is performing a task thatsomehow relates to, say, the topology of the network (referto section 3.3). Even then, the task model never poses asstrong restrictions as the physical restriction of a vehicle be-ing forced to travel along the road segments. This excludesthe transfer of most of the vehicle map matching methodsto our problem.
3. GAZE MAP MATCHINGGaze map matching aims at interpreting eye tracking data
w.r.t. the contents of a cartographic map. The underlyingvector data of the map are used to match the gaze sequenceto the inspected geographic features, such as roads, rivers,or points of interest.
3.1 Application ScenariosThis paper focusses on the basic algorithmic problem of
gaze map matching. Applications building on top of gazemap matching have not been implemented yet. To under-line the benefits of gaze map matching, two potential appli-cations are sketched in the following.
3.1.1 Usability AnalysesDaniel is a cartographer. He is designing an interactive
online map that should help bicyclists find a safe, conve-nient, and fast route through the city of Zurich. With aneye tracking study he has collected gaze data from 10 partic-ipants. Daniel wonders whether his prototypical map designhelps to clearly separate biking paths from major roads.
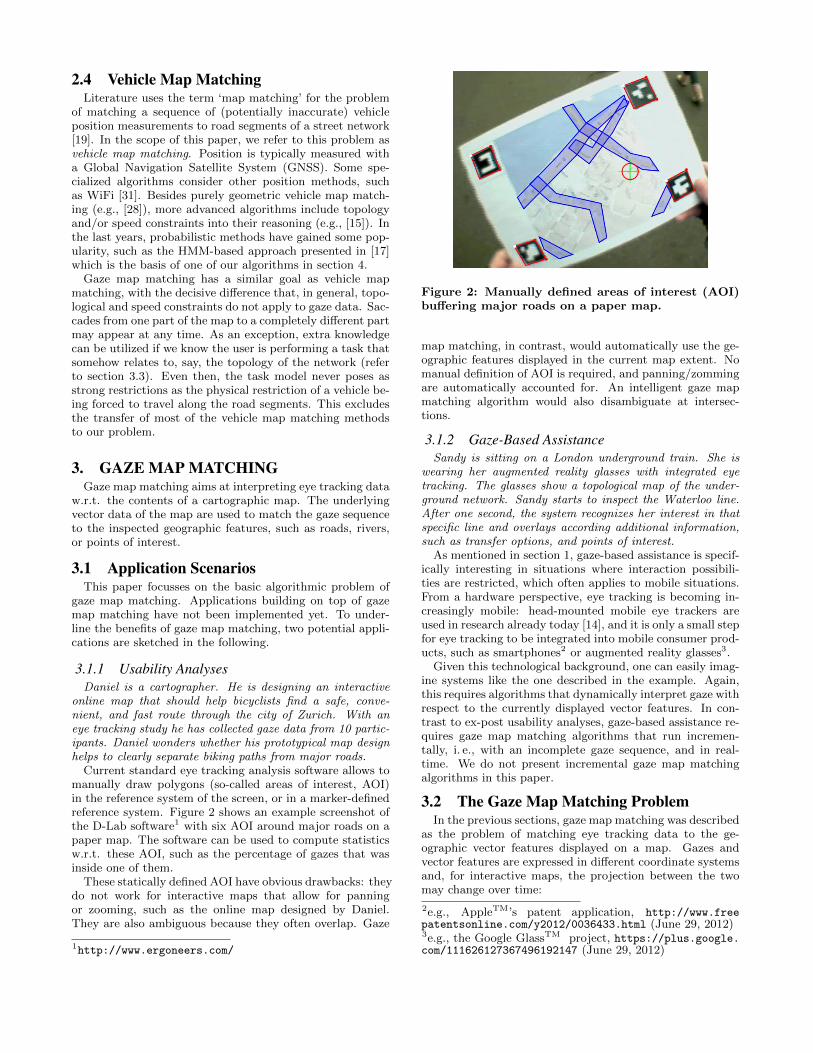
Current standard eye tracking analysis software allows tomanually draw polygons (so-called areas of interest, AOI)in the reference system of the screen, or in a marker-definedreference system. Figure 2 shows an example screenshot ofthe D-Lab software1 with six AOI around major roads on apaper map. The software can be used to compute statisticsw.r.t. these AOI, such as the percentage of gazes that wasinside one of them.
These statically defined AOI have obvious drawbacks: theydo not work for interactive maps that allow for panningor zooming, such as the online map designed by Daniel.They are also ambiguous because they often overlap. Gaze
1http://www.ergoneers.com/
Figure 2: Manually defined areas of interest (AOI)buffering major roads on a paper map.
map matching, in contrast, would automatically use the ge-ographic features displayed in the current map extent. Nomanual definition of AOI is required, and panning/zommingare automatically accounted for. An intelligent gaze mapmatching algorithm would also disambiguate at intersec-tions.
3.1.2 Gaze-Based AssistanceSandy is sitting on a London underground train. She is
wearing her augmented reality glasses with integrated eyetracking. The glasses show a topological map of the under-ground network. Sandy starts to inspect the Waterloo line.After one second, the system recognizes her interest in thatspecific line and overlays according additional information,such as transfer options, and points of interest.
As mentioned in section 1, gaze-based assistance is specif-ically interesting in situations where interaction possibili-ties are restricted, which often applies to mobile situations.From a hardware perspective, eye tracking is becoming in-creasingly mobile: head-mounted mobile eye trackers areused in research already today [14], and it is only a small stepfor eye tracking to be integrated into mobile consumer prod-ucts, such as smartphones2 or augmented reality glasses3.
Given this technological background, one can easily imag-ine systems like the one described in the example. Again,this requires algorithms that dynamically interpret gaze withrespect to the currently displayed vector features. In con-trast to ex-post usability analyses, gaze-based assistance re-quires gaze map matching algorithms that run incremen-tally, i. e., with an incomplete gaze sequence, and in real-time. We do not present incremental gaze map matchingalgorithms in this paper.
3.2 The Gaze Map Matching ProblemIn the previous sections, gaze map matching was described
as the problem of matching eye tracking data to the ge-ographic vector features displayed on a map. Gazes andvector features are expressed in different coordinate systemsand, for interactive maps, the projection between the twomay change over time:
2e.g., AppleTM’s patent application, http://www.freepatentsonline.com/y2012/0036433.html (June 29, 2012)3e.g., the Google GlassTM project, https://plus.google.com/111626127367496192147 (June 29, 2012)

Eye Tracking
Fixation Preprocessing
Gaze Map Matching
Task Recognition «Find ShortestBiking Route»
UsabilityAnalysis
«Biking paths notvisible enough»
Gaze-BasedAssistance Follow this road
Figure 3: Gaze map matching and task recognition.
Definition 1. A geo-referenced fixation sequence is a time-indexed sequence φ = 〈 (x0, y0, π0), . . . , (xn, yn, πn) 〉, where(xt, yt) is the fixation position at time t in the screen coor-dinate system C s, and πt: C s → Cm denotes the projectionfrom screen to map coordinate system valid at time t.
As explained in section 2.1, eye tracking research generallyassumes that perception takes place only when the gaze re-mains still for a minimum amount of time. This is whyfixation sequences are used instead of gazes here. The pre-processing converting a gaze sequence to a (much shorter)fixation sequence is omitted here (refer to section 5.1.2). Wecan now define the gaze map matching problem as follows:
Definition 2. Let G denote a set of geographic vector fea-tures, all defined in Cm. Let φ denote a geo-referencedfixation sequence with projections to Cm. The gaze mapmatching problem consists in finding the according featuresequence γ = 〈g0, . . . , gn 〉 from G ∪ {ω}, where the i-thelement of φ is matched with the i-th element of γ, andω is assigned to those fixations that cannot be mapped tofeatures from G.
Gaze map matching algorithms need the projection informa-tion to convert from C s to Cm, and to perform any distancecomputations that may become necessary (e.g., buffering).Fixations too far away from any feature may be assigned ω,i. e., ‘not matchable’.
3.3 Gaze Map Matching and User TasksFor general scene perception it has been shown that a
person’s gaze behavior is influenced by the task [33]. Earlystudies on eye tracking and cartography have indicated thatthe same is true for maps [26]: the task a person is solving ona map will influence her gaze. In the bicycle map examplepresented in section 3.1, for instance, a participant told tofind a biking route from A to B will probably look at A,B, and then follow different route options between them. Afree-viewing task (‘tell me whether you like the visual designof this map’), will probably lead to a more dispersed and lessclearly structured gaze behavior, maybe with more gazes onvisually salient features.
The automatic recognition of the task a viewer is per-forming on a map could build upon gaze map matching (seeFig. 3). The recognized task in turn would serve as input
a b c
Figure 4: Inaccuracy and disambiguation.
for gaze-based assistance, or be analyzed w.r.t. usability re-quirements. Although task recognition is out of the scopeof this paper, the task layer is relevant for us (indicated bythe two converse arrows in Fig. 3): gaze map matching canbe facilitated with knowledge about the task the user is per-forming. If we already know, for instance, that the user issearching for the shortest biking route, we can expect fix-ation sequences along topologically connected edges of thebiking network graph, whereas topologically unconnected se-quences are less likely to happen. The type of feature wecan expect the user to gaze at (point, polyline, polygon)also depends on the task. These expectations can be usedfor ambiguity resolution when a fixation is in the vicinity ofmore than one feature.
Our point in this paper is that knowledge about the taskcan be used to make gaze map matching algorithms moreintelligent. We do not aim at solving gaze map matching forany possible task.
Thus, for the rest of this paper, we focus on a specificclass of tasks we call inspection tasks. In an inspection task,the user’s gaze traverses the edges of a graph (e.g., the roadsegments of a street network) at low speed. In most cases,the traversal path will follow topologically connected edges.A saccade to an edge further away will only rarely happen.We perform experiments in which participants have to gazeat a predefined path on the map. By giving the participantsalmost no freedom we can be sure to have a ground truthagainst which we can evaluate the algorithms (see section 5).
3.4 Challenges
3.4.1 Technological and Physiological ChallengesEye tracking data are inaccurate due to a number of tech-
nological and physiological reasons. Accuracy depends –among others – on the device used, the eye physiology, therelative position of the eye tracker to the head, the lightnessconditions of the recording environment, and the calibrationquality. Most eye tracker manufacturers do currently not re-port properly on the accuracy specifications of their devices,given certain conditions [10].
Thus, and due to the mini-saccades (see section 2.1), thegaze point recorded by the device will almost never be lo-cated exactly on the geographic feature currently inspected.The same applies to fixations. An additional challenge hasbeen mentioned in section 2.4: fast saccades to distant partsof the map may occur at any time.
3.4.2 Spatial DisambiguationThe spatial disambiguation challenge is a logical conse-
quence of inaccuracy. As the fixation points are never ex-actly on the inspected features, a distance based approachbecomes necessary. A fixation located close enough to a fea-ture is matched with this feature. Ambiguity occurs when afixation is in the vicinity of more than one feature.

This problem is well-known in vehicle map matching, andtypically resolved by taking a larger termporal and spatialcontext into account. For instance, it is clear how to matchthe vehicle trajectories displayed in Figs. 4a) and b) to roadsegments although parts of the trajectories are close to morethan one road. The ‘jump’ from one road to the other inFig. 4c) would be interpreted as inaccuracy (and thus bematched to the lower road) because there is no sensible wayof traveling from the lower to the upper road given the speedrestrictions of the vehicle.
If the points in Fig. 4 were the result of an eye trackingexperiment it would not be that simple: the data shown inFig. 4c) could then result from a participant really havinglooked at the upper road for a short moment (for whateverreason). In theory, it could even be possible that there is noinaccuracy in the data, i. e., that the participant has reallygazed at the white area between the two roads in Fig. 4a).Another possible hypothesis could be that the gaze has beenjumping back and forth between the upper and lower roadin Fig. 4a).
The spatial disambiguation challenge for gaze map match-ing thus consists in deciding how much spatial context can beused for disambiguation or not. This is task-dependent (seesection 3.3). A gaze map matching algorithm well-suited forone task may perform bad for a different task.
4. ALGORITHMICALLY MATCHING GAZEWITH A ROAD NETWORK
This section introduces two simple geometric algorithmsfor the gaze map matching problem (see section 3.2), andone probabilistic algorithm that can be parameterized for aspecific task. A road inspection task is assumed (see sec-tion 3.3), and the set of geographic vector features G con-tains only road segments.
4.1 Closest Line MatchingThe base case algorithm is a simple geometric approach
that takes only the distances between the fixation points andthe vector lines into consideration. For each geo-referencedfixation φ<t> (the t-th element in the geo-referenced fixa-tion sequence φ), the algorithm retrieves all features fromG (accesible with a spatial index) that are located in a pre-defined radius, and returns the closest one of them as gt.If no feature is within the radius, ω is returned for time t,indicating ‘not matchable’.
The radius is computed in a way that it corresponds to the30 pixels that were also used for fixation computation. Wetransformed this value into map units using the projectionπt from screen to map coordinate system valid when thegaze data were retrieved.
4.2 Simple Sliding WindowThe simple sliding window algorithm is a first approach
for spatial disambiguation. It is inspired by the situationthat typically occurs at crossroads, displayed in Fig. 4b: theclosest point matching algorithm would map the point inthe center to the vertical line, although it is likely that thisfixation is inaccurate, given the inspection of the horizontalline before and after the point.
The sliding window algorithm takes n past and m futurefixations into account. In our case, a symmetrical windowwith n = m = 2 was successful. The algorithm first uses the
inspectedgeo feature(hidden state)
geo-referencedfixation(observation)
tt=0 t=1 t=n-1 t=n
...emission probability:eye tracking noise
state transition probability:task dependent
Figure 5: HMM structure
closest line matching algorithm to retrieve the closest linefor each fixation. The algorithm then sequentially movesfrom left to right, starting at time index 2, and comparesall fixations in the 5-neighborhood around the current timeindex. If these match the pattern L1-L1-L2-L1-L1, whereL1 and L2 have to be different, and one of L1 and L2 maybe ω, the middle position (L2) would simply be replaced byL1. The runtime complexity of both, closest line matchingand simple sliding window, is obviously linear with respectto the length of the fixation sequence.
4.3 Hidden Markov Model InferenceHidden Markov Models (HMM) are dynamic probabilis-
tic models that are used for reasoning under uncertainty intemporally evolving situations (see [21, chapter 15.3] for anintroduction). Among many other applications, they havebeen used in vehicle map matching to find the most likelypath a vehicle has traveled [17]. In this paper, the HMMalgorithm is used to demonstrate how task knowledge canimprove gaze map matching.
4.3.1 Model StructureAn HMM is a graphical model with two states (more pre-
cisely: two random variables) for every time slice: one hid-den and one observed state. In our case, the observed stateis a geo-referenced fixation (xt, yt, πt). The hidden stateis the geo feature gt the user has inspected at time t. Themodel evolves over time, i. e., the length of the observationsequence φ determines the number of time slices of the HMM(see Fig. 5). The directed edges in the graph express condi-tional dependencies: the geo feature a user inspects at time(t + 1) depends only on the road segment she has inspectedat time t (inter-slice dependencies). The geo-referenced fix-ation we observe at time t depends only on the geo featurea user inspects at time t (intra-slice dependencies).
The first order Markov assumption (between slices) is asimplification due to the lack of a sophisticated task model.For other tasks than road inspection it may be an over-simplification: for instance, a user performing a structuredsearch task on the whole map is less likely to return to fea-tures she has seen at any time before. In contrast, a userwith a comparison task may be more likely to return to fea-tures she has seen before.
4.3.2 Probability DistributionsThree probability distributions need to be specified for
an HMM: the initial probability distribution, the emissionprobabilities, and the state transition probabilities.
Initially, i. e., for time slice t = 0, we assume an equaldistribution over all features. This makes sense because a
Node distance Weight0 (same line) 5
1 42 2
>2 and ‘unconnected’ 1
Table 1: Weights used for the state transition prob-abilities of the HMM.
system typically has no initial expectation on which partsof the map the user will be more interested in. More so-phisticated models could use feature saliency to capture the‘eye-catchingness’ that may attract the first gaze.
Emission probabilities model the inaccuracy of the system,i. e., the probability that a geo-referenced fixation φ<t> =(xt, yt, πt) is observed, given the user is inspecting a givenfeature gi. To our knowledge, there is no related work onhow eye tracker inaccuracy can be approximated mathemat-ically. Lacking better options, we use a zero-mean Gaussianas in [17, p.339]:
p(φ<t>|gi) = 1√2πσz
e−0.5( d
σz)2
,
where d is the distance between φ<t> and gi, and σz is thestandard deviation of the eye tracker. As mentioned in sec-tion 3.4.1, most eye tracking manufacturers do not reporton the error measures of their devices. Besides, the stan-dard deviation depends on the size of mini-saccades, whichin turn depends on the user. We used the size of the boxused for fixation computation (see section 5.1.2) as an ap-proximation.
State transition probabilities model the dynamics of thesystem. In our case, this is the probability that the user’sgaze stays on the same, or changes to another geo feature.This probability is highly task dependent. For inspectiontasks on a network, the edge gt, and edges that share acommon node with gt are more likely to appear in t+1 thanedges that are far away. Still, edges far away can neverbe assigned a zero probability (as in road matching). Ourexperiments showed that the values listed in Table 1 weresuccessful in the evaluation (where weight w means a prob-ability w-times of the probability of ‘unconnected’, normal-ized over all state transitions).
For different tasks, especially those with more freedom,these weights will differ. Free exploration tasks, as an ex-treme case, could have the same weight for all state transi-tions (which is not very interesting), or assign state transi-tions depending on saliency.
4.3.3 InferenceWe use the Viterbi algorithm [8], a dynamic programming
algorithm which finds the most likely sequence of hiddenstates in an HMM for a given sequence of observation –in our case: the most likely feature sequence γ for a geo-referenced fixation sequence φ.
On maps with many road segments the state transitionprobabilities were very small. For long gaze sequences, thiscaused Viterbi to run into underflow problems due to manymultiplications. We solved this problem with a commontechnique: by using the natural logarithm of the probabili-ties and replacing multiplication by summation.
A post-processing assigned ω to positions t in the result
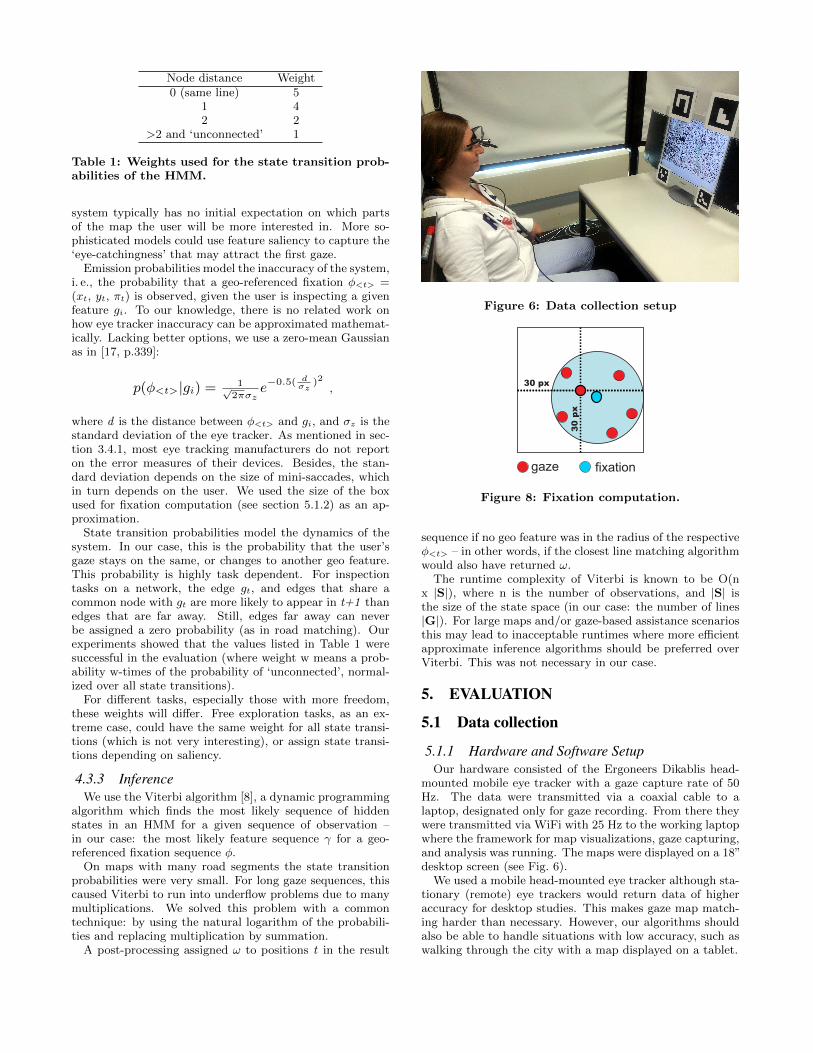
Figure 6: Data collection setup
gaze fixation
30 px
30 p
x
Figure 8: Fixation computation.
sequence if no geo feature was in the radius of the respectiveφ<t> – in other words, if the closest line matching algorithmwould also have returned ω.
The runtime complexity of Viterbi is known to be O(nx |S|), where n is the number of observations, and |S| isthe size of the state space (in our case: the number of lines|G|). For large maps and/or gaze-based assistance scenariosthis may lead to inacceptable runtimes where more efficientapproximate inference algorithms should be preferred overViterbi. This was not necessary in our case.
5. EVALUATION
5.1 Data collection
5.1.1 Hardware and Software SetupOur hardware consisted of the Ergoneers Dikablis head-
mounted mobile eye tracker with a gaze capture rate of 50Hz. The data were transmitted via a coaxial cable to alaptop, designated only for gaze recording. From there theywere transmitted via WiFi with 25 Hz to the working laptopwhere the framework for map visualizations, gaze capturing,and analysis was running. The maps were displayed on a 18”desktop screen (see Fig. 6).
We used a mobile head-mounted eye tracker although sta-tionary (remote) eye trackers would return data of higheraccuracy for desktop studies. This makes gaze map match-ing harder than necessary. However, our algorithms shouldalso be able to handle situations with low accuracy, such aswalking through the city with a map displayed on a tablet.

3
4
5
6
7 8
11
13
12
14
Cases 7,8,11-14:© 2011 swisstopo (JD100042)
1
2
Figure 7: Cartographical material used for the evaluation (cases 9/10 are vector maps of the same regions ascases 11/12).
We developed a framework (a Java 6 application) thatsupports eye tracking user studies for vector and raster maps.The framework captures, pre-processes, and stores the gazeof participants while they are inspecting the map. The anal-ysis part of the framework provides functionality to post-process the recorded gaze data after the study, i. e., to runour gaze map matching algorithms and visualize the results.The result visualization helped to get a first idea of the algo-rithms’ functionality (Figs. 9 and 11 are screenshots of theframework, enhanced with labels).
5.1.2 Computation of FixationsFixations were computed from the gaze sequence as fol-
lows (see Fig. 8): a quadratic window with side length 60pxwas created around the first gaze point. If for a given timethreshold (150 milliseconds in our case) all following gazepoints occurred inside this window, a fixation (green point)was formed by taking the mean x and y of all gaze points in-side the window. If a gaze point occurs outside the window,or after having created a fixation, a new window is createdaround the next point and the procedure starts over again.
5.1.3 Cartographical MaterialThe gaze data were collected for 14 maps of road networks
(we call them ‘cases’, see Fig. 7) with increasing complexityand realism. Cases 1 to 10 were vector maps, cases 11 to 14were raster maps. The road network vector data for the fourraster cases were available and later used by the algorithms.The coordinate system Cm of all maps was the ‘swiss grid’map projection4.
Cases 1 to 6 were manually drawn base cases, cases 7to 10 were vector road maps from a real city. The ideaof the base cases was to cover typical situations in whicherroneous matchings can occur due to ambiguity: 1) One lineas absolute base case (distinguish between line and ω). 2)Two lines with overlapping bounding boxes. 3) A line withseveral (almost) 90◦ street crossings. 4) A line with severalcrossings at small angles. 5) Three lines with the instructionto jump between them at two designated positions. 6) Threelines with three jumps, some crossing the middle line.
4http://www.swisstopo.admin.ch/internet/swisstopo/en/home/topics/survey/sys/refsys/projections.html

Figure 9: Spatial disambiguation through the slidingwindow (bottom), compared to closest line matching(top).
(C)
2011
sw
isst
opo (
JD100042)
Figure 10: Example eye tracking data: gazes (yel-low) and fixations (blue) on the road network un-derlying the raster map of case 13. Red indicatesthe highway the participant had to follow.
Cases 7 to 10 were vector cases based on real street net-work data from a topographic map (1:25.000) of the areaaround Lausanne, Switzerland. All topographic maps wereprovided by swisstopo5 in the ESRITM Shapefile format.Cases 11 to 13 were topographic raster maps (1:25.000) ofLausanne, case 14 was a topographic raster map (1:200.000)of Bern, Switzerland. In cases, 1 to 12 a thin red line in-dicated the path the participants had to follow, in case 14this line was cyan. The path in case 13 was defined by ahighway.
5.1.4 Participants and ProcedureTwo users participated in our experiment, each complet-
ing all 14 cases (leading to 28 datasets). The users wereplaced in front of the desktop screen at a distance of 80centimeters (see Fig. 6). Four visual markers were attached
5Source: Bundesamt fur Landestopografie swisstopo (Art.30 GeoIV): 5704 000 000
Figure 11: Spatial disambiguation through aMarkov Model (bottom), compared to sliding win-dow (top). Matched fixations from a subarea ofFig. 10.
on the screen to span up a coordinate system in which thescreen coordinates for the captured captured gaze data werecomputed.
At the beginning of each case, participants were shown themap and given a short time to attain overview knowledge.This should avoid exploration behavior during the experi-ment (inspection, not exploration behavior was the focus ofthis study). The participants were then instructed to strictlyfollow the highlighted path with their gaze. In case 13, theinstruction was to follow a selected highway, starting from ared dot, and change highway at the crossroads in directionEast.
5.2 ResultsEach of the 28 datasets was pre-processed by comput-
ing fixations from the gazes. Figure 10 shows one exampledataset. Then, the data were processed with the closestline matching algorithm, the sliding window algorithm, andthe HMM algorithm. The maximum runtime of the HMMalgorithm was approx. 3 minutes (on a 2.33 GHz desktopcomputer with 8GB RAM).
All 84 resulting feature sequences were analyzed w.r.t. thenumber of fixations that was matched with a correct line(i. e., a line the participant was supposed to follow). Thepercentage of correctly matched fixations for each case, eachparticipant, and each algorithm are listed in Table 2.
Comparing the results of closest line and sliding window,the data show that the sliding window algorithm performsbetter in 8 of 28 trials (29%), and worse in 3 (11%). Thedata, especially of participant 1, indicate that sliding win-dow seems to help especially for simple maps with few roads,such as the manually designed base cases. Figure 9 displaysan example (case 2, participant 1): the fixation marked witha1 is in the vicinity of both lines, and (probably due to inac-curacy) mapped to the wrong lower line by the closest linematching algorithm. The sliding window of size 5, eliminatesthis error.
Comparing the results of sliding window and HMM, theHMM clearly achieves a better result than the sliding win-

Participant 1 Participant 2Cases Closest Line Sliding Window Hidden Markov Closest Line Sliding Window Hidden Markov
1 0.9310 1.000 0.9310 0.3142 0.3142 0.31422 0.7692 0.8461 0.8846 0.3888 0.3888 0.38883 0.6250 0.6666 0.7916 0.7142 0.7619 0.76194 0.4137 0.4827 0.6896 0.2941 0.2941 0.47055 0.5909 0.5909 0.5909 0.7857 0.7857 0.78576 0.6129 0.6129 0.6129 0.4400 0.4000 0.44007 0.3552 0.3421 0.4210 0.5243 0.5243 0.52438 0.3736 0.3736 0.4065 0.5365 0.5487 0.57319 0.4800 0.4800 0.5600 0.5396 0.5396 0.619010 0.4117 0.4117 0.5176 0.4555 0.4555 0.477711 0.3809 0.3809 0.5952 0.1904 0.1904 0.428512 0.5074 0.4925 0.5373 0.4069 0.4186 0.406913 0.2151 0.2151 0.2278 0.5978 0.6086 0.608614 0.4814 0.4814 0.4691 0.4867 0.4867 0.5309
Table 2: Comparing the results of the algorithms: ratio of correct matched fixations over all fixations, fortwo participants, 14 cases, and 3 different algorithms.
dow: it performs better in 16 trials (57%), and again 3 times(11%) worse than the sliding window. Figure 11 displays anexample (case 13, participant 1): the fixations marked witha1, b1, c1, and d1 were matched wrong by the sliding windowalgorithm. The HMM algorithm matches them correctly tothe line the user was inspecting (any of the parallel red lineswas possible). This is because the transitions from the redline to the rest of the network are less likely than staying onthe line. A good example is the line that c1 was matchedto incorrectly, because three nodes have to be traversed toreach it from the red line.
Overall, these results indicate that more complicated mapsrequire more sophisticated algorithms that are aware of theparticipant’s task. A task-aware algorithm then outperformspurely geometric algorithms, such as the sliding window.
6. CONCLUSION AND OUTLOOKThis paper has introduced the gaze map matching prob-
lem which, to our knowledge, is the first attempt to an au-tomated content-based analysis of gaze with respect to geo-graphic features displayed on a map. The goal of gaze mapmatching consists in automatically determining the featuresa person has looked at, given inaccuracy and spatial ambigu-ity. Various applications in the domains of usability studies,geo visualization, and gaze-based assistance exist.
At this stage of our research, we considered gaze mapmatching as a geometrical problem. We demonstrated aprobabilistic algorithm, working with a Hidden Markov Mo-del, that performs better than simpler algorithms because itis able to exploit knowledge about the higher level task, an‘inspection task’ in our case. An essential question for futureresearch is how gaze map matching can be performed forother tasks. On the other hand, we will try to automaticallyrecognize the task a user is performing on a map from hergaze. This is related to work on activity recognition fromgaze [2], and intention recognition from trajectories [12]. Asindicated in Fig. 3, the steps of task recognition and gazemap matching are interconnected.
Our 28 gaze datasets were taken from 2 participants. Oneissue for future work is to include a larger number of par-ticipants in the experiments to account for individual differ-ences. Sections 4 and 5 discussed only line features. Future
work should consider points and polygons, too.We are planning to investigate novel concepts for gaze-
based assistance that build upon gaze map matching. Inter-active maps were used to motivate gaze map matching; inour study users were not allowed to pan or zoom. However,as the zoom level was treated separately in theory and imple-mentation, the step to interactive maps is small. The HMMstate transition probabilities were assigned with a systematictry-out, based on plausible assumptions. Clearly, learningthese task-dependent probabilities would be a worthwhileendeavor for future work. Incremental algorithms for gazemap matching are another open research topic to enablegaze-based assistance on cartographic maps.
AcknowledgementsWe wish to thank our participants for contributing their gazedata. Special thanks also to Martin Raubal for supportingour research. Our discussions with Martin helped to shapesome of the ideas expressed in this paper. In addition, wewould also like to thank Alain Geiger for his input on (ve-hicle) map matching.
7. REFERENCES[1] K. Bektas and A. Coltekin. An approach to modeling
spatial perception for geovisualization. In Proceedingsof STGIS 2011: Spatial Thinking and GeographicInformation Sciences, 2011.
[2] A. Bulling, J. Ward, H. Gellersen, and G. Troster. Eyemovement analysis for activity recognition usingelectrooculography. Pattern Analysis and MachineIntelligence, IEEE Transactions on, 33(4):741–753,April 2011.
[3] A. Coltekin, S. I. Fabrikant, and M. Lacayo. Exploringthe efficiency of users’ visual analytics strategies basedon sequence analysis of eye movement recordings.International Journal of Geographical InformationSystems, 24(10):1559–1575, 2010.
[4] A. Coltekin, B. Heil, S. Garlandini, and S. I.Fabrikant. Evaluating the effectiveness of interactivemap interface designs: A case study integratingusability metrics with eye-movement analysis.

Cartography and Geographic Information Science,36:5–17, 2009.
[5] C.-C. Chen, C. A. Knoblock, and C. Shahabi.Automatically conflating road vector data withorthoimagery. Geoinformatica, 10(4):495–530, Dec.2006.
[6] M. A. Cobb, M. J. Chung, H. Foley III, F. E. Petry,K. B. Shaw, and H. V. Miller. A rule-based approachfor the conflation of attributed vector data.GeoInformatica, 2:7–35, 1998.10.1023/A:1009788905049.
[7] A. T. Duchowski. Eye Tracking Methodology: Theoryand Practice. Springer, London, 2nd edition, 2007.
[8] G. Forney. The viterbi algorithm. Proceedings of theIEEE, 61(3):268 – 278, march 1973.
[9] I. Giannopoulos, P. Kiefer, and M. Raubal.GeoGazemarks: Providing gaze history for theorientation on small display maps. In Proceedings ofthe 14th International Conference on MultimodalInteraction, ICMI ’12, New York, NY, USA, 2012.ACM. to appear.
[10] K. Holmqvist, M. Nystrom, and F. Mulvey. Eyetracker data quality: what it is and how to measure it.In Proceedings of the Symposium on Eye TrackingResearch and Applications, ETRA ’12, pages 45–52,New York, NY, USA, 2012. ACM.
[11] R. J. K. Jacob. The use of eye movements inhuman-computer interaction techniques: What youlook at is what you get. ACM Trans. Inf. Syst.,9(2):152–169, 1991.
[12] P. Kiefer. Mobile Intention Recognition. Springer, NewYork, 2011. PhD Thesis, Otto-Friedrich-UniversitatBamberg, Germany.
[13] P. Kiefer, F. Straub, and M. Raubal. Location-awaremobile eye tracking for the explanation of wayfindingbehavior. In Proceedings of the AGILE’2012International Conference on Geographic InformationScience, 2012.
[14] P. Kiefer, F. Straub, and M. Raubal. Towardslocation-aware mobile eye tracking. In Proceedings ofthe Symposium on Eye Tracking Research andApplications, ETRA ’12, pages 313–316, New York,NY, USA, 2012. ACM.
[15] Y. Lou, C. Zhang, Y. Zheng, X. Xie, W. Wang, andY. Huang. Map-matching for low-sampling-rate gpstrajectories. In Proceedings of the 17th ACMSIGSPATIAL International Conference on Advancesin Geographic Information Systems, GIS ’09, pages352–361, New York, NY, USA, 2009. ACM.
[16] P. Majaranta, U. K. Ahola, and O. Spakov. Fast gazetyping with an adjustable dwell time. In Proc. of theInternational Conf. on Human Factors in ComputingSystems (CHI), pages 357–360. ACM, 2009.
[17] P. Newson and J. Krumm. Hidden markov mapmatching through noise and sparseness. In Proceedingsof the 17th ACM SIGSPATIAL InternationalConference on Advances in Geographic InformationSystems, GIS ’09, pages 336–343, New York, NY,USA, 2009. ACM.
[18] T. Opach and A. Nossum. Evaluating the usabailty ofcartographic animations with eye movement analysis.In 25th International Cartographic Conference 2011,
page 11, 2011.
[19] M. A. Quddus, W. Y. Ochieng, and R. B. Noland.Current map-matching algorithms for transportapplications: State-of-the art and future researchdirections. Transportation Research Part C: EmergingTechnologies, 15(5):312–328, 2007.
[20] K. Rayner. Eye movements in reading and informationprocessing: 20 years of research. Psychological bulletin,124(3):372–422, Nov. 1998.
[21] S. J. Russell and P. Norvig. Artificial Intelligence - AModern Approach. Prentice Hall, third edition, 2010.
[22] A. Saalfeld. Conflation automated map compilation.International Journal of Geographical InformationSystems, 2(3):217–228, 1988.
[23] E. Safra, Y. Kanza, Y. Sagiv, and Y. Doytsher.Efficient integration of road maps. In Proceedings ofthe 14th annual ACM international symposium onAdvances in geographic information systems, GIS ’06,pages 59–66, New York, NY, USA, 2006. ACM.
[24] A. Schmidt. Implicit human computer interactionthrough context. Personal and Ubiquitous Computing,4(2/3):191–199, 2000.
[25] R. Schuchard, B. Connell, and P. Griffiths. Anenvironmental investigation of wayfinding in a nursinghome. In Proceedings of the 2006 symposium on Eyetracking research & applications, ETRA ’06, pages33–33, New York, NY, USA, 2006. ACM.
[26] T. R. Steinke. Eye movement studies in cartographyand related fields. Cartographica: The InternationalJournal for Geographic Information andGeovisualization, 24(2):40–73, 1987.
[27] S. Stellmach and R. Dachselt. Investigatinggaze-supported multimodal pan and zoom. InProceedings of the Symposium on Eye TrackingResearch and Applications, ETRA ’12, pages 357–360,New York, NY, USA, 2012. ACM.
[28] G. Taylor and G. Blewitt. Road reduction filteringusing GPS. In 3rd AGILE Conference on GeographicInformation Science, 2000.
[29] T. Vildan and R. J. Jacob. Interacting with eyemovements in virtual environments. In Proc. of theCHI 2000 Conference on Human factors in computingsystems, pages 265–272. ACM, April 1-6, 2000.
[30] V. Walter and D. Fritsch. Matching spatial data sets:a statistical approach. International Journal ofGeographical Information Science, 13(5):445–473,1999.
[31] M. Weber, L. Liu, K. Jones, M. J. Covington,L. Nachman, and P. Pesti. On map matching ofwireless positioning data: a selective look-aheadapproach. In Proceedings of the 18th SIGSPATIALInternational Conference on Advances in GeographicInformation Systems, GIS ’10, pages 290–299, NewYork, NY, USA, 2010. ACM.
[32] J. M. Wiener, C. Holscher, S. Buchner, andL. Konieczny. Gaze behaviour during space perceptionand spatial decision making. Psychological Research,pages 1–17, 2011.
[33] A. Yarbus. Eye Movements and Vision. Plenum, NewYork, 1967.