Gaze-Dependent Topography in Human Posterior Parietal … · Gaze-Dependent Topography in Human...
8
Gaze-Dependent Topography in Human Posterior Parietal Cortex Jason D. Connolly 1,2,3 , Quoc C. Vuong 1 and Alexander Thiele 1 1 Faculty of Medical Sciences, Institute of Neuroscience, Newcastle University, Newcastle upon Tyne NE2 4HH, UK 2 Current address: Wolfson Research Institute, University of Durham, Thornaby TS17 6BH, UK 3 Current address: Department of Psychology, Durham University Science Site, Durham DH1 3LE, UK Address correspondence to Jason D. Connolly. Email: [email protected] The brain must convert retinal coordinates into those required for directing an effector. One prominent theory holds that, through a combination of visual and motor/proprioceptive information, head-/ body-centered representations are computed within the posterior parietal cortex (PPC). An alternative theory, supported by recent visual and saccade functional magnetic resonance imaging (fMRI) topographic mapping studies, suggests that PPC neurons provide a retinal/eye-centered coordinate system, in which the coding of a visual stimulus location and/or intended saccade endpoints should remain unaffected by changes in gaze position. To distinguish between a retinal/eye-centered and a head-/body-centered coordi- nate system, we measured how gaze direction affected the represen- tation of visual space in the parietal cortex using fMRI. Subjects performed memory-guided saccades from a central starting point to locations “around the clock.” Starting points varied between left, central, and right gaze relative to the head-/body midline. We found that memory-guided saccadotopic maps throughout the PPC showed spatial reorganization with very subtle changes in starting gaze pos- ition, despite constant retinal input and eye movement metrics. Such a systematic shift is inconsistent with models arguing for a retinal/ eye-centered coordinate system in the PPC, but it is consistent with head-/body-centered coordinate representations. Keywords: functional magnetic resonance imaging, head-centered, posterior parietal cortex, spatial coordinate frames, topographic mapping Introduction We take for granted the complex series of neural computations necessary to convert retinal locations into distances relative to the reaching limb. A brain region well suited to perform these oper- ations in human and nonhuman primates is the posterior parietal cortex (PPC). Its position between visual-input (occipital) and motor-output (M1, frontal eye field) areas puts the PPC in a prime locus to integrate visual and motor information. PPC has a topographic representation of visual space much like early visual cortical areas, and it shows a topographic representation related to the endpoints of intended and then executed saccadic eye movements, a so-called saccadotopic map (Sereno et al. 2001). In a saccadotopic map, adjacent saccade endpoints are represented by spatially adjacent locations within each map. That is, adjacent cortical locations in the PPC represent adjacent regions of visual or saccade target space (Sereno et al. 2001; Schluppeck et al. 2005; Konen and Kastner 2008). The topographic represen- tations in the PPC can be influenced by motor input (Mountcastle et al. 1975; Robinson et al. 1978; Colby and Goldberg 1999; An- dersen and Buneo 2002). One highly influential theory argues that motor input helps the PPC in the nonhuman primate (and possibly in the human) to encode visual information within an eye-centered coordinate system or reference frame (Batista et al. 1999; Cohen and Andersen 2000, 2002), whereby the position of the eye in the orbit modulates the visual and saccade-related firing of single neurons through corollary discharge (Wurtz 2008) or input from proprioception (Dijkerman and de Haan 2007). Despite substantial support for an eye-centered reference frame in individual neurons of nonhuman primate PPC (Zipser and Andersen 1988; Andersen et al. 1997, 1998; Batista et al. 1999; Buneo et al. 2002, 2008; Cohen and Andersen 2002), it has been argued that PPC neurons employ a hybrid reference frame consisting of a mixture of eye-centered and head-centered neurons (Duhamel et al. 1997; Mullette-Gillman et al. 2005, 2009). The existence of a higher-order coordinate system relative to the head or body beyond the retina or eye, and especially of hybrid coding in the PPC of the human, remains contested. Some functional magnetic resonance imaging (fMRI) studies report data more compatible with a retino-centric coordinate representation (Sereno et al. 2001; Schluppeck et al. 2005; Fernandez-Ruiz et al. 2007; Konen and Kastner 2008; Van Pelt et al. 2010), while others report eye-centered coding (DeSouza et al. 2000; Medendorp et al. 2003). However, there are also recent findings of head- or “face”-centered coding within subre- gions of the PPC (Sereno and Huang 2006; Pertzov et al. 2011). To investigate possible coding schemes across the PPC, we exploited the topographic representation of saccade endpoints by having participants make saccades from different starting pos- itions. This allowed us to determine whether and, if so, where higher-order topographic representations such as a head-/body- centered coordinate system exist in the human PPC. If saccadoto- pic maps are selectively shifted or distorted when retinal stimu- lation and saccade parameters are held constant, but gaze position is manipulated, this would argue against a retinal/eye- centered coordinate system in the PPC. Using a memory-guided saccade paradigm (Sereno et al. 2001) with different starting gaze positions, we find that topographic maps in lateral/inferior and areas medial to the intraparietal sulcus (IPS) show a global reorganization of saccadotopic space representation across both the inferior and superior parietal lobules of the PPC when gaze is directed to the left or right relative to central gaze. This finding argues against a purely retinal/eye-centered representation and suggests that a substantial proportion of parietal neurons encode visual space in higher-order reference frames, whereby visual space is represented relative to the head or body. Materials and Methods Subjects In the present study, we tested 4 male subjects, who had no history of neurological defects. All subjects provided written consent. The study was approved by the Newcastle University Faculty of Medical Sciences Ethics Committee. © The Author 2013. Published by Oxford University Press. This is an Open Access article distributed under the terms of the Creative Commons Attribution License (http://creativecommons.org/licenses/by/3.0/), which permits unrestricted reuse, distribution, and reproduction in any medium, provided the original work is properly cited. Cerebral Cortex June 2015;25:1519–1526 doi:10.1093/cercor/bht344 Advance Access publication December 18, 2013 at University of Newcastle on October 16, 2015 http://cercor.oxfordjournals.org/ Downloaded from
Transcript of Gaze-Dependent Topography in Human Posterior Parietal … · Gaze-Dependent Topography in Human...

Gaze-Dependent Topography in Human Posterior Parietal Cortex
Jason D. Connolly1,2,3, Quoc C. Vuong1 and Alexander Thiele1
1Faculty of Medical Sciences, Institute of Neuroscience, Newcastle University, Newcastle upon Tyne NE2 4HH, UK2Current address: Wolfson Research Institute, University of Durham, Thornaby TS17 6BH, UK3Current address: Department of Psychology, Durham University Science Site, Durham DH1 3LE, UK
Address correspondence to Jason D. Connolly. Email: [email protected]
The brain must convert retinal coordinates into those required fordirecting an effector. One prominent theory holds that, through acombination of visual and motor/proprioceptive information, head-/body-centered representations are computed within the posteriorparietal cortex (PPC). An alternative theory, supported by recentvisual and saccade functional magnetic resonance imaging (fMRI)topographic mapping studies, suggests that PPC neurons provide aretinal/eye-centered coordinate system, in which the coding of avisual stimulus location and/or intended saccade endpoints shouldremain unaffected by changes in gaze position. To distinguishbetween a retinal/eye-centered and a head-/body-centered coordi-nate system, we measured how gaze direction affected the represen-tation of visual space in the parietal cortex using fMRI. Subjectsperformed memory-guided saccades from a central starting point tolocations “around the clock.” Starting points varied between left,central, and right gaze relative to the head-/body midline. We foundthat memory-guided saccadotopic maps throughout the PPC showedspatial reorganization with very subtle changes in starting gaze pos-ition, despite constant retinal input and eye movement metrics. Sucha systematic shift is inconsistent with models arguing for a retinal/eye-centered coordinate system in the PPC, but it is consistent withhead-/body-centered coordinate representations.
Keywords: functional magnetic resonance imaging, head-centered,posterior parietal cortex, spatial coordinate frames, topographic mapping
Introduction
We take for granted the complex series of neural computationsnecessary to convert retinal locations into distances relative to thereaching limb. A brain region well suited to perform these oper-ations in human and nonhuman primates is the posterior parietalcortex (PPC). Its position between visual-input (occipital) andmotor-output (M1, frontal eye field) areas puts the PPC in aprime locus to integrate visual and motor information. PPC has atopographic representation of visual space much like early visualcortical areas, and it shows a topographic representation relatedto the endpoints of intended and then executed saccadic eyemovements, a so-called saccadotopic map (Sereno et al. 2001). Ina saccadotopic map, adjacent saccade endpoints are representedby spatially adjacent locations within each map. That is, adjacentcortical locations in the PPC represent adjacent regions of visualor saccade target space (Sereno et al. 2001; Schluppeck et al.2005; Konen and Kastner 2008). The topographic represen-tations in the PPC can be influenced by motor input (Mountcastleet al. 1975; Robinson et al. 1978; Colby and Goldberg 1999; An-dersen and Buneo 2002). One highly influential theory arguesthat motor input helps the PPC in the nonhuman primate (andpossibly in the human) to encode visual information within aneye-centered coordinate system or reference frame (Batista et al.
1999; Cohen and Andersen 2000, 2002), whereby the position ofthe eye in the orbit modulates the visual and saccade-relatedfiring of single neurons through corollary discharge (Wurtz2008) or input from proprioception (Dijkerman and de Haan2007). Despite substantial support for an eye-centered referenceframe in individual neurons of nonhuman primate PPC (Zipserand Andersen 1988; Andersen et al. 1997, 1998; Batista et al.1999; Buneo et al. 2002, 2008; Cohen and Andersen 2002), ithas been argued that PPC neurons employ a hybrid referenceframe consisting of a mixture of eye-centered and head-centeredneurons (Duhamel et al. 1997; Mullette-Gillman et al. 2005,2009). The existence of a higher-order coordinate system relativeto the head or body beyond the retina or eye, and especially ofhybrid coding in the PPC of the human, remains contested.Some functional magnetic resonance imaging (fMRI) studiesreport data more compatible with a retino-centric coordinaterepresentation (Sereno et al. 2001; Schluppeck et al. 2005;Fernandez-Ruiz et al. 2007; Konen and Kastner 2008; Van Peltet al. 2010), while others report eye-centered coding (DeSouzaet al. 2000; Medendorp et al. 2003). However, there are alsorecent findings of head- or “face”-centered coding within subre-gions of the PPC (Sereno and Huang 2006; Pertzov et al. 2011).
To investigate possible coding schemes across the PPC, weexploited the topographic representation of saccade endpointsby having participants make saccades from different starting pos-itions. This allowed us to determine whether and, if so, wherehigher-order topographic representations such as a head-/body-centered coordinate system exist in the human PPC. If saccadoto-pic maps are selectively shifted or distorted when retinal stimu-lation and saccade parameters are held constant, but gazeposition is manipulated, this would argue against a retinal/eye-centered coordinate system in the PPC. Using a memory-guidedsaccade paradigm (Sereno et al. 2001) with different startinggaze positions, we find that topographic maps in lateral/inferiorand areas medial to the intraparietal sulcus (IPS) show a globalreorganization of saccadotopic space representation across boththe inferior and superior parietal lobules of the PPC when gazeis directed to the left or right relative to central gaze. This findingargues against a purely retinal/eye-centered representation andsuggests that a substantial proportion of parietal neurons encodevisual space in higher-order reference frames, whereby visualspace is represented relative to the head or body.
Materials and Methods
SubjectsIn the present study, we tested 4 male subjects, who had no history ofneurological defects. All subjects provided written consent. The studywas approved by the Newcastle University Faculty of Medical SciencesEthics Committee.
© The Author 2013. Published by Oxford University Press.This is an Open Access article distributed under the terms of the Creative Commons Attribution License (http://creativecommons.org/licenses/by/3.0/), which permits unrestrictedreuse, distribution, and reproduction in any medium, provided the original work is properly cited.
Cerebral Cortex June 2015;25:1519–1526doi:10.1093/cercor/bht344Advance Access publication December 18, 2013
at University of N
ewcastle on O
ctober 16, 2015http://cercor.oxfordjournals.org/
Dow
nloaded from

Visual Stimuli and TaskEach subject performed a memory-guided saccade task (Sereno et al.2001; Schluppeck et al. 2005; Konen and Kastner 2008) at gaze-center(CG: 0°; center of the screen), gaze-left (LG: −4.1° horizontal shift),and gaze-right (RG: +4.1° horizontal shift) positions (Fig. 1). The pos-itions were run on separate days for 4 of the subjects, and the orderwas randomly determined for each subject. For each gaze position,a target (a 0.22° high contrast dot) appeared consecutively at 12locations on an invisible circle centered on the starting gaze position(i.e., the fixation spot). The circle had a radius of 7.7° of visual angle.Like a clock face, each location was separated by 30° starting from thetop of the circle (0° or 12 o’clock location; Fig. 1). On each trial, a fix-ation square appeared at the gaze position for 1 s. A target then ap-peared for 250 ms, followed by a 3000-ms mask of 100 distracter dots(0.22° high contrast dots). The distracter dots were randomly distribu-ted within an annulus, which had an inner radius of 5.0° and an outerradius of 10.4° from gaze position. When the mask disappeared, sub-jects made a saccade to the remembered target location and back to fix-ation (within 250 ms). A complete cycle consisted of a saccade to eachof the 12 target locations “around the clock.” Subjects performed 5cycles per run. Thus, the stimulus periodicity was 5 cycles per run. Thetotal duration of a single run was 270 s (4.5 s per trial × 12 trials × 5cycles).
Within a session, we alternated scans in which the target advancedin either a clockwise (12 o’clock, 1 o’clock, and so on) or counter-clockwise (11 o’clock, 10 o’clock, and so on) direction. Each subjectcompleted 9–10 runs per scanning session, and 1–2 sessions per start-ing gaze position were acquired for each subject. Subjects, therefore,performed 540–1200 saccades to remembered locations for each gazeposition (CG, LG, and RG). In addition, 1 of the 4 subjects performed asingle session in which all gaze positions were tested (30 runs with1800 saccades). This was done to address any potential confounds dueto the gaze conditions being run across separate sessions. We used aCanon XEED LCD projector to project the visual stimuli onto a screenat the foot-end of the scanner. Subjects viewed the screen through anangled mirror attached to the head coil about 10 cm above the subjects’eye. Stimulus presentation was controlled by Psychtoolbox (www.psychtoolbox.org).
Anatomical Imaging, Registration and Inflated MapsAll MRI data were acquired using a Philips 8-channel receive-onlySENSE head coil on a 3-T scanner (Philips Intera Achieva) at the New-castle Magnetic Resonance Centre. Subjects’ heads were stabilized by
the use of foam padding behind the back of the head and additionalpadding between either sides of the forehead and the top of the headcoil. A high-resolution, T1-weighted anatomical volume was acquiredin the coronal plane at the beginning of the first session—and thesingle session for the complete within session dataset—for eachsubject using a T1TFE pulse sequence (1 mm3 voxels). For all sessions,we also acquired a low-resolution, anatomical T1-weighted volume inthe same coronal slice orientation as the functional volumes. An imageregistration algorithm was used to align our inplane anatomical imagesfrom other sessions with the T1-weighted image (Jenkinson et al.2002). In a subsequent step, the T2*-weighted functional dataset wasthen aligned to the inplane. In this fashion, we were able to average to-gether our clockwise and counter-clockwise scans for a particular start-ing gaze location across scanning sessions.
The mrTools software (http://gru.brain.riken.jp/doku.php) wasused to register the functional data across scanning sessions. We used acombination of FreeSurfer (http://surfer.nmr.mgh.harvard.edu/fswiki)and Matlab-based software from the Heeger Lab (New York University)(http://www.cns.nyu.edu/heegerlab/) to convert the T1-weighted andsegmented Freesurfer image into SurfRelax (http://www.pc.rhul.ac.uk/staff/J.Larsson/software.html). These images were imported intomrTools, which was used to restrict the functional data analyses to graymatter voxels. We then inflated the cortical surface and computed anddisplayed the multicolored phase maps.
Functional ImagingFor each functional scan, a T2*-weighted, echo-planar image pulse se-quence was acquired [time repetition: 1500 ms, time echo: 30 ms, flipangle: 75°, 30 slices, 3 mm3 voxels, field of view (FOV): 192 mm]. Thescans were coronal slices that covered most of the occipital cortex andextended anteriorly to the back of the frontal lobe. Four dummy scanswere collected prior to the onset of each functional scan run to elimin-ate the transient effects of magnetic saturation.
PreprocessingWe high-pass filtered the time series with a 100-s cutoff at each voxelto remove the slow drift related to fMRI. Data from clockwise andcounter-clockwise runs for a given gaze position and within a givensession were combined as follows. First, the time series at each voxelwas temporally shifted by 3 s to compensate for the hemodynamic lag. Wethen time-reversed the counter-clockwise runs. Finally, we averaged allruns (clockwise runs + time-shifted and time-reversed counter-clockwise
Figure 1. Memory-guided saccade task. (A) A standard central gaze topographic saccade paradigm consisted of a peripheral target followed by a memory interval, where a ring ofrandom distracters was presented. Following fixation offset, the subject made a saccade to the remembered location and then returned the eye immediately to central fixation. (B)Subjects made such saccades in a sequence to target “around the clock,” either clockwise (CW) or counter-clockwise (CCW). In the LG/RG conditions, subjects made saccades tolocations “around the clock” that were shifted 4° either to the left or to the right of the center position.
1520 Coding of Space in Parietal Cortex • Connolly et al.
at University of N
ewcastle on O
ctober 16, 2015http://cercor.oxfordjournals.org/
Dow
nloaded from
runs) to compute the mean time series for each voxel. Therefore, the meantime series at each voxel represents visual space in a clockwise manner.For our coherence analysis, we computed the percent signal change timeseries for each voxel by dividing the intensity of each voxel (in arbitraryunits) by its mean intensity using mrTools.
Coherence Analysis (Topographic Mapping)The percent signal change time series were analyzed by fitting a sinus-oid with the same 54 s periodicity as the stimulus cycle to the timeseries at each voxel. We then computed the coherence between thebest-fitting sinusoid and the time series, and the phase of this best-fitting sinusoid. The coherence measures the fit between the referencewaveform and the data (from 0 to 1), whereas the phase indicates thetemporal delay between the 2 signals that yields the maximum magni-tude (from –π to π). The phase, therefore, corresponds to the directionof the saccade vector relative to the beginning of the stimulus cycle(i.e., 12 o’ clock vector). For instance, a 90° phase represents the3 o’clock saccade vector. The phase at each voxel is then color-codedto visualize the systematic progression of polar angle representation inthe PPC, and phase values were equally binned such that the preferredoverall phase could be visualized by means of a rose histogram (referto Figs 4 and 5).
Visualizations were based on segmenting gray and white matter inthe T1-weighted scans. Activation (coherence) maps (Fig. 2) were con-fined to the gray matter and were well visualized on the surfaces. Weused both anatomical boundaries and boundaries based on previousmemory-guided saccade phase-encoded data (Sereno et al. 2001;Schluppeck et al. 2005; Konen and Kastner 2008) to first define thePPC region of interest (ROI). This PPC ROI included voxels anterior tothe parieto-occipital sulcus, medial to the IPS, and posterior to the post-central sulcus. On the inflated surface, this region roughly represented arectangle. Secondly, we defined PPC subregions IPS1 through IPS5using an “equidistant procedure,” in which the PPC ROI was further sub-divided into 5 separate zones of approximately equal size that encom-passed the most posterior to the most anterior portion of the PPC. Wealso discovered 2 additional regions in the inferior PPC that changedphase preference for left gaze when compared with right gaze. Thesesubregions were labeled IPS6 and IPS7.
StatisticsThe statistical significance of coherence values can be determined bytransforming the coherence value (treated as a correlation coefficient)into a t-value and then computing the significance with a 2-tailed t-test
against the null hypothesis c = 0 with degrees of freedom = number oftrials− 2. (The coherence can be Fisher transformed to normalize thedata, but this does not change the significance test much.)
As noted by Schluppeck et al. (2005), there are several assumptionsregarding the independence of the time series at each voxel thatviolate some of the assumptions of the t-test. Therefore, the c-values(or corresponding p) were used only for an initial thresholding of thedata to visualize the phase maps. We performed additional analyses toquantify the lateralization (or relative lack thereof) in the case of thegaze deviated maps and the visual field orientations in our anatomi-cally defined subregions of the PPC. Because we were interested in thedistribution of phases in our defined ROI, we used a circular statisticspackage to analyze the data (Berens 2009) (http://www.mathworks.com/matlabcentral/fileexchange/10676).
Direct Statistical Comparison Between Left and Right Gaze ROIsFor each of the subregions within the PPC (IPS1–IPS7), a circular stat-istical comparison between the mean phases for the 2 shifted gaze con-ditions was made using the Watson-Williams test for equal means(Berens 2009). The null hypothesis (H0) was that there would be nodifference between the circular distribution of phase values for LGwhen compared with RG within a particular hemisphere and subre-gion (Table 1). We further plotted the circular distributions for IPS1through IPS7 as rose histograms for individual subjects and cumulat-ively across subjects in order to visualize the effect of gaze shift ontopographic representations in the human PPC.
Eye Tracking
Eye movements were monitored using a long-throw optics near-infrared scanner compatible eye tracker (Applied Science Laboratories,Bedford, MA, USA). This eye tracker uses bright pupil technologyand tracked saccades at 120 Hz. The eye traces were used to verifythat the subject was fixating at the proper locations for each of thedifferent “starting gaze” positions. In addition, we further conductedeye tracking on 4 additional subjects off-line using an EyeLink IIsystem (SR Research Ltd, Kanata, ON, Canada) to examine eye move-ment metrics across the 3 different starting gaze conditions.
Results
To examine whether the PPC represents saccadic endpointsin retinal/eye-centered or higher-order head-/body-centered
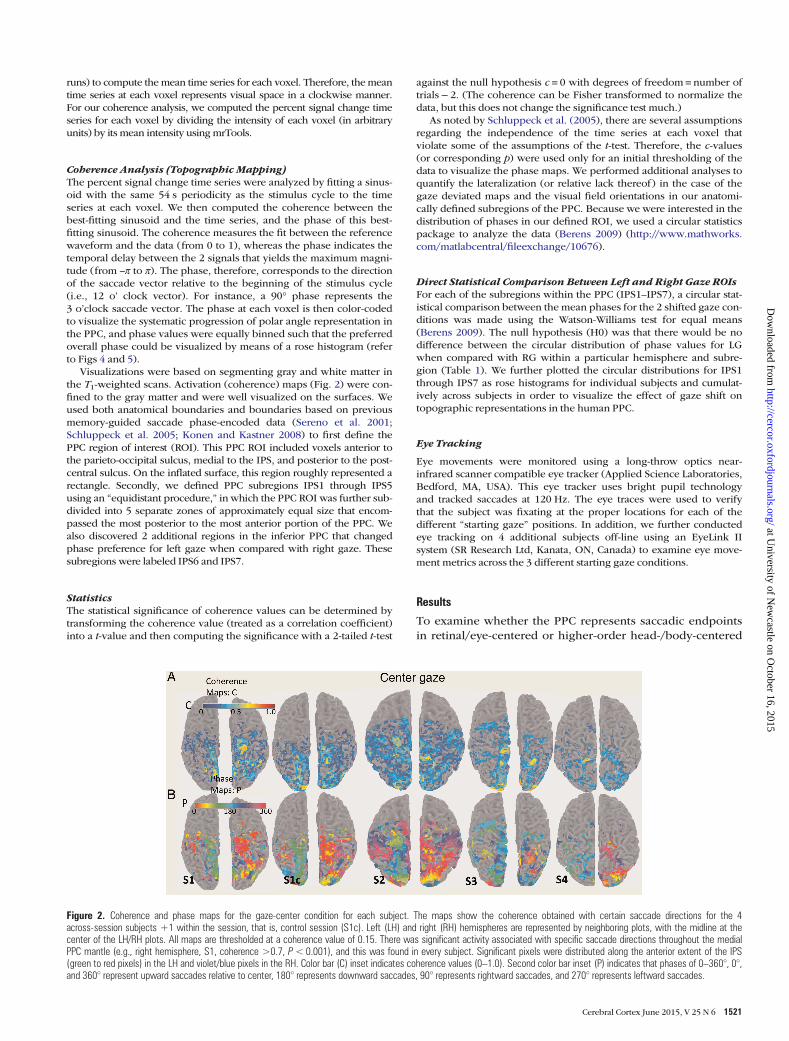
Figure 2. Coherence and phase maps for the gaze-center condition for each subject. The maps show the coherence obtained with certain saccade directions for the 4across-session subjects +1 within the session, that is, control session (S1c). Left (LH) and right (RH) hemispheres are represented by neighboring plots, with the midline at thecenter of the LH/RH plots. All maps are thresholded at a coherence value of 0.15. There was significant activity associated with specific saccade directions throughout the medialPPC mantle (e.g., right hemisphere, S1, coherence >0.7, P<0.001), and this was found in every subject. Significant pixels were distributed along the anterior extent of the IPS(green to red pixels) in the LH and violet/blue pixels in the RH. Color bar (C) inset indicates coherence values (0–1.0). Second color bar inset (P) indicates that phases of 0–360°, 0°,and 360° represent upward saccades relative to center, 180° represents downward saccades, 90° represents rightward saccades, and 270° represents leftward saccades.
Cerebral Cortex June 2015, V 25 N 6 1521
at University of N
ewcastle on O
ctober 16, 2015http://cercor.oxfordjournals.org/
Dow
nloaded from

coordinate systems, we obtained topographic maps in the PPCusing the memory-guided saccade task (Sereno et al. 2001;Schluppeck et al. 2005; Konen and Kastner 2008). Here, sub-jects make saccades from a central gaze position (where theeyes are in the center of the orbits and aligned with head andbody midline) to consecutive peripheral targets “around the
clock.” In contrast to earlier studies employing the same task,we collected multiple maps for each subject as a function ofstarting gaze position.
For the gaze-center condition, we replicated the topographyrelated to saccade direction that has been previously demon-strated in the human PPC (Sereno et al. 2001; Schluppeck et al.2005; Konen and Kastner 2008), although our maps did notexhibit the very gradual progression of phase values of theseprevious studies. For this reason, we used an “equidistantparsing” of IPS1–IPS5 (see Materials and Methods). The coher-ence maps thresholded at c > 0.15 obtained for the gaze-centercondition are shown in Figure 2A (top panel). There was a con-tinuous high-coherence band medial to the IPS in both hemi-spheres of all 5 datasets (4 subjects + 1 control session, or S1c).In each activated subregion (IPS1–IPS7), there were voxelswith coherence values above c > 0.2 (P < 0.035, uncorrected),and in the majority of these regions, there were voxels withc > 0.7 (P < 0.001). Figure 2B (bottom panel) shows the center-gaze phase map for individual subjects with the correspondingcoherence maps thresholded at c > 0.15. The phase values inthe antero-medial PPC demonstrates that high-coherencevalues (those with values of c approaching >0.7) in the left andright hemispheres were shifted by a phase difference close to π(Fig. 2B, bottom panel), consistent with the known contralat-eral visual field bias in these areas for saccadotopy stimuli.
We then investigated the overall quality of the data by calcu-lating Fourier spectra (FS) of our functional MRI data within thePPC. The spectra can be used to estimate the contrast-to-noiseratio (CNR). Figure 3 shows the left-hemisphere FS for eachsubject for center, left, and right gaze across an entire session.(The same pattern was observed in the right hemisphere.) Im-portantly, the magnitude peaked at the periodicity of the stimu-lus in all gaze conditions; in our case, at the stimulus cycle of“5.” The CNR was substantially reduced for the left and rightgaze positions relative to center gaze suggesting some less con-sistent phase representation in many of our voxels with the gazedeviated.
Figure 3. FS for each subject as a function of gaze condition. The cycles per run was “5” in the present study. As can be seen in each of each of the single subject left-hemisphericFourier plots, there is a peak at “5” for the center-gaze condition. In contrast, the LG and RG (middle and bottom panels, respectively) showed a relatively lower magnitude peak at5, and there were additional medium-to-high frequency cycles in the FS with the eyes deviated only slightly in the orbits.
Table 1Results from the Watson-William tests for circular data for the right and left hemispheres
Subregion Subject Right hemisphere Left hemisphere
df F-value P-value df F-value P-value
IPS1 1 1.76 0.10 n.s. 1.28 0.07 n.s.2 1.38 1.77 n.s. 1.32 0.03 n.s.3 1.46 6.12 <0.05 1.20 1.28 n.s.4 1.16 0.09 n.s. 1.30 0.01 n.s.
IPS2 1 1.62 3.54 n.s. 1.20 0.56 n.s.2 1.52 9.96 <0.05 1.90 0.59 n.s.3 1.58 13.07 <0.01 1.30 1.38 n.s.4 1.52 21.35 <0.01 1.30 7.29 <0.01
IPS3 1 1.20 3.64 n.s. 1.32 7.92 <0.012 1.30 0.03 n.s. 1.14 4.98 <0.053 1.28 8.60 <0.01 1.20 0.14 n.s.4 1.16 7.48 <0.05 1.32 21.38 <0.01
IPS4 1 1.20 35.51 <0.01 1.42 11.01 <0.052 1.24 2.21 n.s. 1.16 0.15 n.s.3 1.26 0.38 n.s. 1.22 0.03 n.s.4 1.34 0.57 n.s. 1.22 7.21 <0.05
IPS5 1 1.30 4.07 0.05 1.44 12.00 <0.012 1.16 0.78 n.s. 1.64 59.62 <0.013 1.16 0.25 n.s. 1.28 15.43 <0.014 1.72 12.72 <0.01 1.18 2.17 n.s.
IPS6 1 1.168 220.02 <0.0012 1.150 20.96 <0.0013 1.88 12.13 <0.0014 1.58 22.45 <0.001
IPS7 1 1.94 31.28 <0.005 1.122 114.89 <0.0052 1.70 9.47 <0.005 1.174 39.83 <0.0053 1.70 8.94 <0.005 1.78 14.68 <0.0054 1.32 9.28 <0.005 1.194 6.90 <0.01
Note: The comparisons are listed in the left column. The significance of the effect is indicated bythe P-value column (uncorrected for multiple comparisons). df: degrees of freedom. Subject 1represents S1c (or control session).
1522 Coding of Space in Parietal Cortex • Connolly et al.
at University of N
ewcastle on O
ctober 16, 2015http://cercor.oxfordjournals.org/
Dow
nloaded from

Figure 4 shows the phase maps and the corresponding rosehistograms for every subject as a function of gaze position andhemisphere. The corresponding coherence maps for thesephase maps were thresholded at c > 0.15. The pattern of resultsfor S1 was the same for all the gaze conditions within a sessionor across sessions, which confirms the validity of separatesession runs used in the other subjects. For the gaze-centercondition, there was a strong contralateral bias for memory-guided saccades. It is important to emphasize that IPS6 andIPS7 show opposite phase relationships. IPS6, like other PPCsubregions, represents contralateral space, whereas IPS7 rep-resents ipsilateral space at gaze center. The other PPC subre-gions in the left hemisphere show consistent rightwardmemory-guided saccade (green/turquoise pixels), and the PPCsubregions in the right hemisphere show consistent leftwardmemory-guided saccade (red/violet pixels) activity. However,although the same overall pattern was observed, the SNR wasenhanced for S1 control (same session) when compared withS1 original (across sessions). The IPS1–IPS7 ROIs are indicatedin the enlarged center panel for LG with corresponding ROInumerical values. These ROIs are displayed to indicate theirrelative locations on the actual surface maps and were drawnand displayed on these same surfaces using the mrTools soft-ware (refer to Materials and Methods).
However, there are important differences in the distributionof phase values when the gaze was deviated from the head-/body midline (LG vs. RG conditions). As can be seen in the rosehistograms for each subject, there are significant differences(P < 0.05 or <0.01) in the topographic representation ofmemory-guided saccadic endpoints for LG and RG shifts withinthe same hemisphere. For example, there was almost a 180°
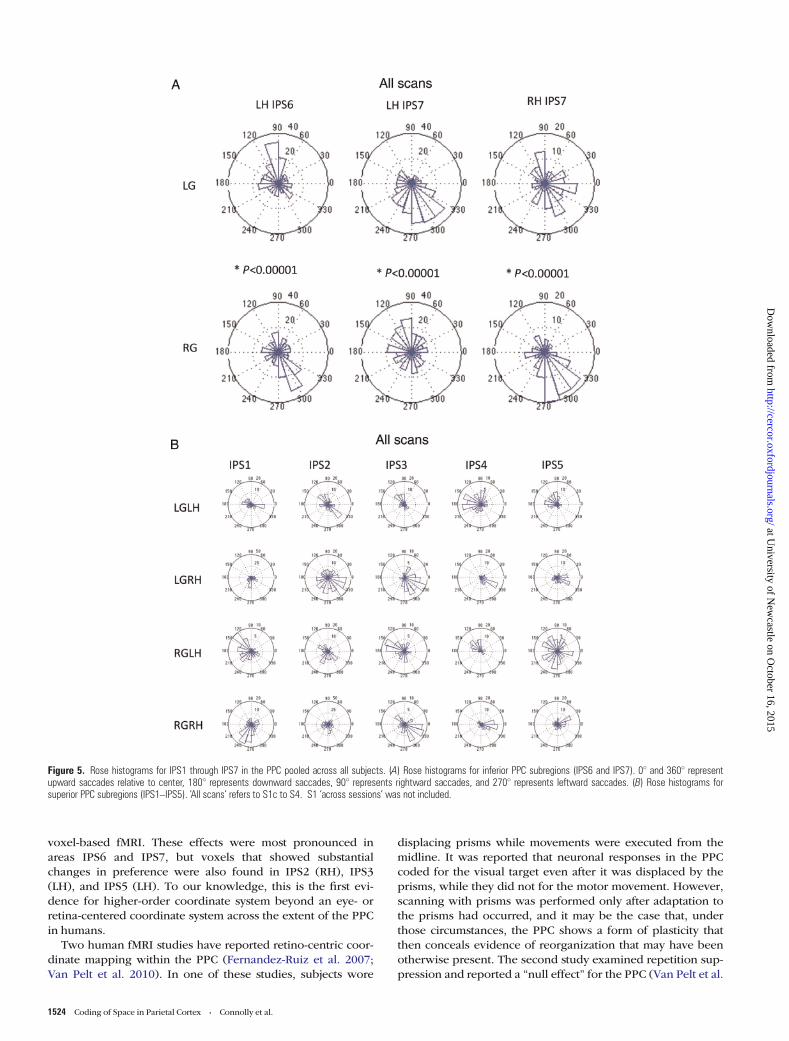
inversion of preferred phases for LG when compared with RGwithin the same hemisphere for IPS6 and IPS7 (Table 1, individ-ual statistics). The same finding was also found when phasevalues were pooled across subjects, as shown in Figure 5.Overall, these findings provide evidence that several PPC subre-gions code in higher-order (head-/body-centered) coordinates.
As noted, eye tracking was conducted outside of the scannerin 4 naïve subjects using the identical stimuli, that is, with theRG and LG offset by ±4.1° when compared with CG. None ofthe statistical measures based on movement amplitude (maineffects and interactions) were significant. Of prime impor-tance, the movement amplitudes across the 3 different startinggaze positions using a repeated-measures analysis of variancewere not significantly different (F2,6 = 0.252, P = 0.561). There-fore, our fMRI differences were not a result of variance insaccade amplitudes as a function of starting gaze position.
Discussion
The present data demonstrate that the PPC not only encodessaccade direction in topographic maps, but also takes intoaccount the position of the eyes in the orbits and reorganizesthese maps accordingly. In particular, the topographic rep-resentation of visual space within a hemisphere differed de-pending on whether observers shifted their gaze slightly to theleft or right of a central point aligned to the midline of the headand body. Our results suggest that there are many neuronsthroughout the PPC that encode visual- and saccade-relatedspatial information in higher-order reference frames, such as ahead-/body-centered coordinate system, and these neuronsappear to be clustered, such that the pattern is detectable using
Figure 4. Phase maps and rose plots for IPS1 through IPS7 in the PPC for each subject. A comparison of surface renderings for the left (LG) and right (RG) starting gaze conditions.(A) A comparison for the complete within the session control subject (S1 control). The enlarged center panels (or “ROI definition” plots) represent LG but with the ROI drawn on theactual surfaces using the mrTools software for visualization of their relative locations in the inferior (IPL) and superior (SPL) parietal lobe. (B) The subsequent rose histograms (refer tothe panels below) are based on these same ROIs. For both the phase and rose plots, 0° and 360° represent upward saccades relative to center, 180° represents downwardsaccades, 90° represents rightward saccades, and 270° represents leftward saccades. (C–J) S1 through S4 across-session data with the same conventions as S1c (above). S4 ispresented without any labeling, for clear visualization of the ROI locations.
Cerebral Cortex June 2015, V 25 N 6 1523
at University of N
ewcastle on O
ctober 16, 2015http://cercor.oxfordjournals.org/
Dow
nloaded from
voxel-based fMRI. These effects were most pronounced inareas IPS6 and IPS7, but voxels that showed substantialchanges in preference were also found in IPS2 (RH), IPS3(LH), and IPS5 (LH). To our knowledge, this is the first evi-dence for higher-order coordinate system beyond an eye- orretina-centered coordinate system across the extent of the PPCin humans.
Two human fMRI studies have reported retino-centric coor-dinate mapping within the PPC (Fernandez-Ruiz et al. 2007;Van Pelt et al. 2010). In one of these studies, subjects wore
displacing prisms while movements were executed from themidline. It was reported that neuronal responses in the PPCcoded for the visual target even after it was displaced by theprisms, while they did not for the motor movement. However,scanning with prisms was performed only after adaptation tothe prisms had occurred, and it may be the case that, underthose circumstances, the PPC shows a form of plasticity thatthen conceals evidence of reorganization that may have beenotherwise present. The second study examined repetition sup-pression and reported a “null effect” for the PPC (Van Pelt et al.
Figure 5. Rose histograms for IPS1 through IPS7 in the PPC pooled across all subjects. (A) Rose histograms for inferior PPC subregions (IPS6 and IPS7). 0° and 360° representupward saccades relative to center, 180° represents downward saccades, 90° represents rightward saccades, and 270° represents leftward saccades. (B) Rose histograms forsuperior PPC subregions (IPS1–IPS5). ‘All scans’ refers to S1c to S4. S1 ‘across sessions’ was not included.
1524 Coding of Space in Parietal Cortex • Connolly et al.
at University of N
ewcastle on O
ctober 16, 2015http://cercor.oxfordjournals.org/
Dow
nloaded from

2010). Repetition suppression may not be sensitive enough toidentify higher nonretinotopic reference frames with fMRI-blood oxygen level-dependent.
Other studies have reported evidence for eye-centered codingwithin the human PPC (DeSouza et al. 2000; Medendorp et al.2003). These studies were designed to distinguish betweenretinal- and eye-centric reference frames, not between retinal/eye-centric and higher-order frames, such as head-/body-centered. If the PPC codes visual information in retinal/eye-centered reference frames, then the visual or saccade mapsshould not be affected by the position of the eye in the orbit.Thus, asking subjects to make identical memory-guided sac-cades from different starting positions should yield the samesaccadotopic maps within the PPC. It could be the case thatthe maps abandon their strong contralateral preference andbecome highly distributed when the eye is deviated from centerbecause of the existence of gain fields with many differentorientations (Andersen 1997), all opposing one another,making the overall representation that can be derived by meansof fMRI very noisy. Our analyses (Figs 4 and 5) suggest that thiswas not the case.
It has been argued that neurons in most of the PPC areasencode information in so-called “intermediate reference frames”(Duhamel et al. 1997; Mullette-Gillman et al. 2005, 2009),whereby different neurons within an area code in different(e.g., retinal or head-centered) or mixed reference frames. Ifthis is true then we may expect some IPS areas to show smallor nonsignificant differences in topographic representation asa function of the gaze position. This is what was found mostlyfor areas IPS1 and IPS4 where the distributions of phase shiftangles were relatively narrowly centered around 0°. However,many of the subregions we identified showed different topo-graphic representations for shifted gaze positions (relative to acentral to the midline of the head and body), suggesting that aconsiderable number of neurons in the PPC encodes referenceframes in higher-order coordinate systems. The subtle effectsseen in our distributions of phase shifts in IPS1 and IPS4 maybe due to the relatively small displacements of gaze directionused. It may be the case, that with larger shifts of the startingeye position we would find more voxels that show sizeablephase shifts because, for larger deviations of starting eye pos-ition, more saccade targets would shift from contralateral toipsilateral relative to the head-/body-centered vertical meri-dian. An 8.2° shift in starting eye position would have shiftedeven the 3 and 9 o’clock targets across. Unfortunately, subjects’total visual FOV in the scanner did not allow for such largegaze shifts relative to center, as the most peripheral saccadetargets would not have been visible on the screen inside thescanner. Future experiments will be necessary to resolve thisquestion. It will be equally important to determine whether ornot the voxels that we identified as “shifting” are more compa-tible with a head- or body-centered reference frame.
Two recent human fMRI studies reported a higher-order re-ference frame for a part of the PPC, and these results are par-ticular pertinent to the present results (Sereno and Huang2006; Pertzov et al. 2011). Our current results show that head-/body-centered coding is much more distributed in the PPC,that is, throughout subregions of the inferior (IPS6 and IPS7)and superior PPC (IPS2, IPS3, and IPS5). While our findingsare the first to demonstrate such higher-order reference framesin large parts of PPC in the human, it is not entirely unexpectedgiven the knowledge gained from single-unit recordings in
monkey PPC and changes in neuronal responses during spatialupdating. Neurons in the lateral intraparietal area showre-mapping of visual receptive fields before saccadic eye move-ments (Duhamel et al. 1992). Neurons in the medial superiortemporal area show evidence for head-centered coding ofheading direction (Bradley et al. 1996), and those in VIP canhave receptive fields that are strictly head-/world-centered(Duhamel et al. 1997). In other words, the PPC has neuronsthat represent the transformation of visual information into areference frame that allows for the calculation of motor error,and it is a relatively “downstream” output source.
The present results support one of the earliest but still con-troversial interpretations of the function of the PPC basedon electrophysiological data (Mountcastle et al. 1975): PPCneurons participate in transformations from retinal to othercoordinate frames. We found a number of areas that exhibit areorganization of the representation of space in PPC withsubtle changes in eye position. These dynamic reorganizationsare incompatible with a strictly retinal/eye-centered codingscheme, but suggest that large clusters of neurons, which codein head-/body-centered reference frames, are distributedthroughout the PPC. Future studies based on the approachused here should be able to determine whether such coding ismostly in head- or body-centered coordinates.
Funding
Funding to pay the Open Access publication charges for thisarticle was provided by the Wellcome Trust.
NotesWe wish to thank J. Gardner and M. Silver for helpful assistance withthe mrTools retinotopy software. We thank C. Hesse for assistance withthe off-line eye tracking. We thank M. Silver, C. Ingram, and M. Goodalefor helpful comments on the manuscript. J.D.C. was supported by aResearch Fellowship from the Faculty of Medical Sciences at NewcastleUniversity, and A.T. was supported by the Wellcome Trust. We also wishto thank each of the anonymous Reviewers for their advice on improvingthe manuscript. Conflict of Interest: None declared.
ReferencesAndersen RA. 1997. Multimodal integration for the representation of
space in the posterior parietal cortex. Philos Trans R Soc Lond Ser BBiol Sci. 352:1421–1428.
Andersen RA, Buneo CA. 2002. Intentional maps in posterior parietalcortex. Ann Rev Neurosci. 25:189–220.
Andersen RA, Snyder LH, Batista AP, Buneo CA, Cohen YE. 1998.Posterior parietal areas specialized for eye movements (LIP) andreach (PRR) using a common coordinate frame. Novartis FoundSymp. 218:109–122; discussion 22–28, 71–75.
Andersen RA, Snyder LH, Bradley DC, Xing J. 1997. Multimodal rep-resentation of space in the posterior parietal cortex and its use inplanning movements. Ann Rev Neurosci. 20:303–330.
Batista AP, Buneo CA, Snyder LH, Andersen RA. 1999. Reach plans ineye-centered coordinates. Science. 285:257–260.
Berens. 2009. Circstat: a matlab toolbox for circular statistics. J StatSoftw. 31:1–21.
Bradley DC, Maxwell M, Andersen RA, Banks MS, Shenoy KV. 1996.Mechanisms of heading perception in primate visual cortex.Science. 273:1544–1547.
Buneo CA, Batista AP, Jarvis MR, Andersen RA. 2008. Time-invariantreference frames for parietal reach activity. Exp Brain Res.188:77–89.
Cerebral Cortex June 2015, V 25 N 6 1525
at University of N
ewcastle on O
ctober 16, 2015http://cercor.oxfordjournals.org/
Dow
nloaded from
Buneo CA, Jarvis MR, Batista AP, Andersen RA. 2002. Direct visuo-motor transformations for reaching. Nature. 416:632–636.
Cohen YE, Andersen RA. 2002. A common reference frame for movementplans in the posterior parietal cortex. Nat Rev Neurosci. 3:553–562.
Cohen YE, Andersen RA. 2000. Reaches to sounds encoded in an eye-centered reference frame. Neuron. 27:647–652.
Colby CL, Goldberg ME. 1999. Space and attention in parietal cortex.Ann Rev Neurosci. 22:319–349.
DeSouza JF, Dukelow SP, Gati JS, Menon RS, Andersen RA, Vilis T. 2000.Eye position signal modulates a human parietal pointing regionduring memory-guided movements. J Neurosci. 20:5835–5840.
Dijkerman HC, de Haan EH. 2007. Somatosensory processes subser-ving perception and action. Behav Brain Sci. 30:189–201; discus-sion 201–39.
Duhamel JR, Bremmer F, BenHamed S, Graf W. 1997. Spatialinvariance of visual receptive fields in parietal cortex neurons.Nature. 389:845–848.
Duhamel JR, Colby CL, Goldberg ME. 1992. The updating of therepresentation of visual space in parietal cortex by intended eyemovements. Science. 255:90–92.
Fernandez-Ruiz J, Goltz HC, DeSouza JF, Vilis T, Crawford JD. 2007.Human parietal “reach region” primarily encodes intrinsic visualdirection, not extrinsic movement direction, in a visual motordissociation task. Cereb Cortex. 17:2283–2292.
Jenkinson M, Bannister P, Brady M, Smith S. 2002. Improved optimiz-ation for the robust and accurate linear registration and motioncorrection of brain images. Neuroimage. 17:825–841.
Konen CS, Kastner S. 2008. Representation of eye movements andstimulus motion in topographically organized areas of human pos-terior parietal cortex. J Neurosci. 28:8361–8375.
Medendorp WP, Goltz HC, Vilis T, Crawford JD. 2003. Gaze-centeredupdating of visual space in human parietal cortex. J Neurosci.23:6209–6214.
Mountcastle VB, Lynch JC, Georgopoulos A, Sakata H, Acuna C. 1975.Posterior parietal association cortex of the monkey: command func-tions for operations within extrapersonal space. J Neurophysiol.38:871–908.
Mullette-Gillman OA, Cohen YE, Groh JM. 2005. Eye-centered, head-centered, and complex coding of visual and auditory targets in theintraparietal sulcus. J Neurophysiol. 94:2331–2352.
Mullette-Gillman OA, Cohen YE, Groh JM. 2009. Motor-related signalsin the intraparietal cortex encode locations in a hybrid, rather thaneye-centered reference frame. Cereb Cortex. 19:1761–1775.
Pertzov Y, Avidan G, Zohary E. 2011. Multiple reference frames forsaccadic planning in the human parietal cortex. J Neurosci.31:1059–1068.
Robinson DL, Goldberg ME, Stanton GB. 1978. Parietal associationcortex in the primate: sensory mechanisms and behavioral modu-lations. J Neurophysiol. 41:910–932.
Schluppeck D, Glimcher P, Heeger DJ. 2005. Topographic organiz-ation for delayed saccades in human posterior parietal cortex.J Neurophysiol. 94:1372–1384.
Sereno MI, Huang RS. 2006. A human parietal face area containsaligned head-centered visual and tactile maps. Nat Neurosci.9:1337–1343.
Sereno MI, Pitzalis S, Martinez A. 2001. Mapping of contralateral spacein retinotopic coordinates by a parietal cortical area in humans.Science. 294:1350–1354.
Van Pelt S, Toni I, Diedrichsen J, Medendorp WP. 2010. Repetition sup-pression dissociates spatial frames of reference in human saccadegeneration. J Neurophysiol. 104:1239–1248.
Wurtz RH. 2008. Neuronal mechanisms of visual stability. Vis Res.48:2070–2089.
Zipser D, Andersen RA. 1988. A back-propagation programmed networkthat simulates response properties of a subset of posterior parietalneurons. Nature. 331:679–684.
1526 Coding of Space in Parietal Cortex • Connolly et al.
at University of N
ewcastle on O
ctober 16, 2015http://cercor.oxfordjournals.org/
Dow
nloaded from