
Gavesana...
73
Volume 11 Issue 1 January-June 2019 Gavesana Journal of Management Editorial Productivity Growth Assessment of Primary Agricultural Dr. Abhijit Sinha and Credit Societies in West Bengal Mr. Amitabha Bhattacharyya An Analysis of Factors Affecting the Performance of Dr. D. Srijanani and General Insurance Companies in India Dr. R. Srinivasa Rao Age of Transformation: Emergence of Artificial Intelligence for Manufacturing Industries Mr .Sandeep Bhattacharjee A Fast Heuristic Method for the Job shop Scheduling Problem with Makespan Objective Dr. Pritibhushan Sinha Promoters Share Pledging: An Emerging Concern for Indian Stock Market Regulator Mr. Pardhasaradhi Madasu Effective Strategic Talent Acquisition Process - A Conceptual Study R. Anita The Motivational Preferences of Gen Y: An empirical Study on Dr. Poonam Jindal and Recent Changes in Motivation of Gen Y Dr. Padmaja Nalluri Kaizen Costing P A L N S Kalyani ISSN No. : 0975-4547 Regn. No. : 108534/2010 Indexed and full text available on
Transcript of Gavesana...

Volume 11 Issue 1 January-June 2019
Gavesana
Journal of ManagementEditorial
Productivity Growth Assessment of Primary Agricultural Dr. Abhijit Sinha and
Credit Societies in West Bengal Mr. Amitabha Bhattacharyya
An Analysis of Factors Affecting the Performance of Dr. D. Srijanani and
General Insurance Companies in India Dr. R. Srinivasa Rao
Age of Transformation: Emergence of Artificial Intelligence
for Manufacturing Industries Mr .Sandeep Bhattacharjee
A Fast Heuristic Method for the Job shop Scheduling
Problem with Makespan Objective Dr. Pritibhushan Sinha
Promoters Share Pledging: An Emerging Concern for
Indian Stock Market Regulator Mr. Pardhasaradhi Madasu
Effective Strategic Talent Acquisition Process -
A Conceptual Study R. Anita
The Motivational Preferences of Gen Y: An empirical Study on Dr. Poonam Jindal and
Recent Changes in Motivation of Gen Y Dr. Padmaja Nalluri
Kaizen Costing P A L N S Kalyani
ISSN No. : 0975-4547
Regn. No. : 108534/2010
Indexed and full text available on
Contents
Productivity Growth Assessment of Primary Agricultural Dr. Abhijit Sinha andCredit Societies in West Bengal Mr. Amitabha Bhattacharyya 1
An Analysis of Factors Affecting the Performance of Dr. D. Srijanani andGeneral Insurance Companies in India Dr. R. Srinivasa Rao 9
Age of Transformation: Emergence of Artificial Intelligencefor Manufacturing Industries Mr .Sandeep Bhattacharjee 17A Fast Heuristic Method for the Job shop SchedulingProblem with Makespan Objective Dr. Pritibhushan Sinha 27
Promoters Share Pledging: An Emerging Concern forIndian Stock Market Regulator Mr. Pardhasaradhi Madasu 36
Effective Strategic Talent Acquisition Process -A Conceptual Study R. Anita 42
The Motivational Preferences of Gen Y: An empirical Study on Dr. Poonam Jindal andRecent Changes in Motivation of Gen Y Dr. Padmaja Nalluri 52
Kaizen Costing P A L N S Kalyani 62
(i)
Articles Authors Page No.

(ii)
ISSN No. : 0975-4547
Regn. No. : 108534/2010
Gavesana
Journal of ManagementEditor : Dr. Ch. S. Durga Prasad
Assistant Editor : Mr. Raghu Mantha
Editorial Board
About the Journal
The Gavesana Journal of Management is a bi-annual refereed journal of the Vignana Jyothi Institute ofManagement. Its objective is to disseminate knowledge of contemporary issues related to management anddevelopment. The journal seeks to serve as a platform for intellectuals to share the rapid strides made incontemporary research. The Research Journal has been registered with the Registrar of Newspapers for India (RNI)vide No. 108534/2010 dated 1/3/2011.
Disclaimer
The views, opinion, data, information, contents etc., appearing in the articles are the sole contribution of theauthor(s). The Editor, Assistant Editor, the Editorial Board, the Advisory Board and the sponsoring institutionsdisclaim the consequences of the views expressed in the articles.
Prof. A. V. Subba Rao, Economist and Business Analyst.
Prof. V. M. Tummala, Professor in Production/Operations Management, Eastern Michigan University, USA.
Prof. Sanjith Sengupta, Professor in Marketing, San Francisco State University, San Francisco, California, USA.
Prof. V. Nagadevara, Former Dean IIM-Bangalore.
Prof. R. Siva Prasad, Nipissing University Canada.
Prof. G. Anjaneya Swamy, Dean Pondicherry University.
Prof. Sarvanan, Central University Tamilnadu.
Prof. V. Venkaiah, Former Vice Chancellor, Dr.B.R. Ambedkar Open University, Hyderabad.
Prof. S. R. Subba Rao, Professor, Bhavan's Vivekananda College, Secunderabad.
EDITORIAL
(iii)
Human Resource function HR) in any organization, has to be that of a strategic orbusiness partner by developing the talent in the entity through job rotation, jobenrichment etc. involving expert teams business leaders and line management Such apartnership is a long term relationship to achieve objectives common to the partners asalso the organization s financial success In the process, the HR employees, as partners,should perform their assigned roles and also support the activities of those in otherfunctional areas This needs a strategic plan which dovetails the HR Vision and Missioninto that of the organization
HR as a Strategic Partner increases employee productivity and thus theorganization s profitability enhances competency and talent management uses thetechnology and knowledge to formulate, implement and review strategies copes withthe changes in the business environment arising from unforeseen business situationsand globalization and serves the internal and external customers well. This is donethrough efficient and effective delivery of human resource services. For this the HRneeds to spend more time in the organization's planning, design and development. Itmust become part of the business team involved in planning at the highest level HRManagers and HR professionals are strategically suited to provide the necessaryleadership in change management, which is a challenging task
The Human Resource Information System (HRIS) has to be effectively used tohandle daily administrative HR tasks. Employees can make use of the self-servicefacility online to support business strategy development and implementation, whichsaves time and costs There should be an HR Head who understands well the strategicpartnership/relationship between organizational strategy and human resources. Heshould be an expert in all HR functions Someone from within the organization can begroomed for this role.
Research has shown that the HR function will be effective in achieving thebusiness objectives when it assumes the role of a strategic business partner. The topmanagement should ensure this. The administrative reactive approach in peoplemanagement can no longer support the organization in a competitive businessenvironment If the HR function is decentralized fully the line managers andsupervisors will eventually put the blame on HR when problems arise If this happens itinterferes with the effective use of line managers and supervisors time in the operationsof the organization on daily basis The line managers and supervisors need to besupported to make them more proficient in managing their subordinates in theperformance of daily tasks Complete participation of HR people in strategydevelopment and implementation promotes HR as a strategic partner. The HR Managerand HR professionals should contribute to business decisions develop business acumento understand how a profitable business is run be customer centric and learn how tolink HR practices to the organizational business strategy
( ,,
, , .- ,' .
,.
.
, -' ; ;
;,
;,
, .
.
,.
.
. ,. ,
' '.
.
;; - ;
.
The expectations from HR as Strategic Partner include: recruiting the rightemployees align corporate values to the recruitment strategy well developedcompetencies of the workforce and their relevance to organizational core businessparticipative culture where HR initiatives fully support the overall strategic plandiscard ineffective HR practices that do not contribute to the success of yourorganization HR management requires continuous improvement i.e., Kaizen to ensureand retain its relevance as strategic partner For this capable and committed people areneeded at every level supported by senior management Change has to be managed wellto avoid or minimize disruption in the organization s activities and for its success.
The effectiveness of the HR people as a strategic partner is also dependent uponthe corporate policies and practices, structure, types of activities carried out, location,effective communication, leadership and motivating employees to keep moving in theright direction as per plan. Every aspect of HR has to be reviewed in the process ofimplementing the necessary changes and reorganization. Having the right is crucial tohelp them succeed and engage their full attention with the view to ensure HR trulybecomes strategic partner The HR Scorecard shows whether the organization is makinggood progress on making HR as strategic partner The competitive advantage of theorganization can be enhanced by aligning the HR strategies to the overall businessplan. To ensure that HR truly becomes a strategic business partner, adequate financialbacking is necessary. One needs to take measures to eliminate or minimize risks to HR,and it should be ensured that HR plays a meaningful role and not necessarily a majorrole, particularly during financial crises. It cannot also be a trial and error approach.
In fact, in a business landscape that is changing fast, there is an imminent needfor HR to be an active strategic partner By aligning itself with strategic plans of thebusiness it needs to foster a stronger relation between the executive team and theworkforce Externally it can make valuable contribution to branding and the tone ofcommunication. By leveraging customised, more personalised metrics and deepanalytics, it can vastly improve organizational learning, training and improve decision-making. Consequently, the human capital program will lend more impact, therebyencouraging and enhancing collaboration between various functions across theorganization. HR can no longer be just a functional arm, a distant participant, but willhave to assume the role of strategic partner, integral to organizational well-being andgrowth.
; ; -, ;
;
.. ,
, .' ,
..
.,
. ,
Dr. Ch. S. Durga Prasad
(iv)
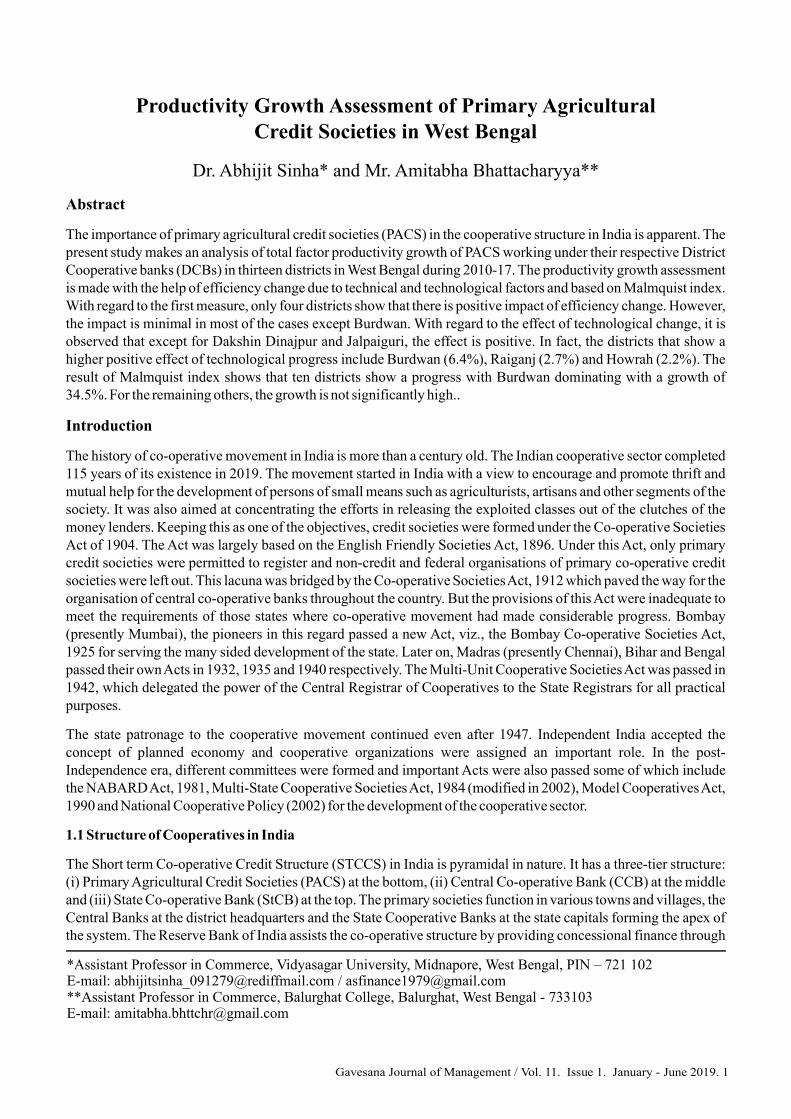
Productivity Growth Assessment of Primary AgriculturalCredit Societies in West Bengal
Dr. Abhijit Sinha* and Mr. Amitabha Bhattacharyya**
Abstract
Introduction
The importance of primary agricultural credit societies (PACS) in the cooperative structure in India is apparent. Thepresent study makes an analysis of total factor productivity growth of PACS working under their respective DistrictCooperative banks (DCBs) in thirteen districts in West Bengal during 2010-17. The productivity growth assessmentis made with the help of efficiency change due to technical and technological factors and based on Malmquist index.With regard to the first measure, only four districts show that there is positive impact of efficiency change. However,the impact is minimal in most of the cases except Burdwan. With regard to the effect of technological change, it isobserved that except for Dakshin Dinajpur and Jalpaiguri, the effect is positive. In fact, the districts that show ahigher positive effect of technological progress include Burdwan (6.4%), Raiganj (2.7%) and Howrah (2.2%). Theresult of Malmquist index shows that ten districts show a progress with Burdwan dominating with a growth of34.5%. For the remaining others, the growth is not significantly high..
The history of co-operative movement in India is more than a century old. The Indian cooperative sector completed115 years of its existence in 2019. The movement started in India with a view to encourage and promote thrift andmutual help for the development of persons of small means such as agriculturists, artisans and other segments of thesociety. It was also aimed at concentrating the efforts in releasing the exploited classes out of the clutches of themoney lenders. Keeping this as one of the objectives, credit societies were formed under the Co-operative SocietiesAct of 1904. The Act was largely based on the English Friendly Societies Act, 1896. Under this Act, only primarycredit societies were permitted to register and non-credit and federal organisations of primary co-operative creditsocieties were left out. This lacuna was bridged by the Co-operative SocietiesAct, 1912 which paved the way for theorganisation of central co-operative banks throughout the country. But the provisions of thisAct were inadequate tomeet the requirements of those states where co-operative movement had made considerable progress. Bombay(presently Mumbai), the pioneers in this regard passed a new Act, viz., the Bombay Co-operative Societies Act,1925 for serving the many sided development of the state. Later on, Madras (presently Chennai), Bihar and Bengalpassed their ownActs in 1932, 1935 and 1940 respectively. The Multi-Unit Cooperative SocietiesAct was passed in1942, which delegated the power of the Central Registrar of Cooperatives to the State Registrars for all practicalpurposes.
The state patronage to the cooperative movement continued even after 1947. Independent India accepted theconcept of planned economy and cooperative organizations were assigned an important role. In the post-Independence era, different committees were formed and important Acts were also passed some of which includethe NABARDAct, 1981, Multi-State Cooperative SocietiesAct, 1984 (modified in 2002), Model CooperativesAct,1990 and National Cooperative Policy (2002) for the development of the cooperative sector.
The Short term Co-operative Credit Structure (STCCS) in India is pyramidal in nature. It has a three-tier structure:(i) Primary Agricultural Credit Societies (PACS) at the bottom, (ii) Central Co-operative Bank (CCB) at the middleand (iii) State Co-operative Bank (StCB) at the top. The primary societies function in various towns and villages, theCentral Banks at the district headquarters and the State Cooperative Banks at the state capitals forming the apex ofthe system. The Reserve Bank of India assists the co-operative structure by providing concessional finance through
1.1 Structure of Cooperatives in India
*Assistant Professor in Commerce, Vidyasagar University, Midnapore, West Bengal, PIN – 721 102E-mail: [email protected] / [email protected]**Assistant Professor in Commerce, Balurghat College, Balurghat, West Bengal - 733103E-mail: [email protected]
Gavesana Journal of Management / Vol. 11. Issue 1. January - June 2019. 1
NABARD in the form of General Lines of Credit for lending to agricultural activities. Thus, the whole system isintegrated with the banking structure of the country. The STCCS functions as a three-tier structure in 16 states; whilein 13 smaller states & union territories, PACS are directly affiliated to the StCB and the STCCS functions as a twotier structure. In three states, a mixed structure, i.e. two tiers in some districts, and three-tier in the other districts is inoperation.
In principle, PACS are expected to mobilize deposits from its members, and use the same for providing crop loans tothe needy members. However, as deposits in PACS are not enough to meet the loan requirements of its entire farmerborrowing members, they draw support from the federal structure, viz., the CCB/StCB. The CCBs were therefore,constituted as a small bank working in small towns to mobilize deposits from public and provide the same forsupporting the credit needs of PACS and its members. As part of the federal structure, the CCBs were also expectedto provide guidance and handholding support to these institutions. StCBs were set up in each state not only tomobilize deposits but also to provide liquidity support for agricultural activities. Moreover, whenever required, theStCBs were also expected to mobilize liquidity and refinance support from the higher financing institutions likeNABARD for supporting the crop loan operations of CCBs and PACS affiliated to it. Over time, STCCS has alsobeen providing medium-term loans for investments in agriculture and for the rural sector, often with refinancesupport of NABARD. PACS, being financial intermediaries, render financial services with the objectives of growth,profit and services. These intermediaries which conduct their business mainly using borrowed funds play a crucialrole in improving the economic and social condition of the common masses and provide short-term and medium-term loans to the members/farmers at reasonable interest rate to meet their needs. They provide credit to the farmersfor agriculture purposes at cheap and easy terms. PACS, therefore, form the foundation of the CooperativeCredit System on which the super structure of the short term cooperative credit system is built.
The banking scenario is changing constantly and significantly due to rapid and radical reforms taking place in theindustry. With the pace of the changing banking scenario, the co-operative credit system is also affected. The presentstudy reviews the situation by looking at the performance aspect of PACS from the angle of total factor productivitygrowth.
There have been several studies and research work done on the co-operative banking sector of our country. Here isthe summary of a few articles on the performance of short term co-operative credit structure as well as theperformance of PACS in the Indian context which are cited below.
Bhaskaran and Josh (2000) conclude that the recovery performance of co-operative credit institutions continues tobe unsatisfactory which contributed to the growth of non-performing assets even after the introduction of prudentialregulations. Jain (2001) in the comparative study on District Central Cooperative Banks (DCCBs) of Maharashtra,Gujarat and Rajasthan found that the institutions of Rajasthan perform better in terms of profitability and liquidity.Kulandaiswamy and Murugesan (2004) study thirty PACS using thirteen performance parameters in the selecteddevelopment blocks of western Tamil Nadu using field survey data. They identify working capital, total loansoutstanding, total business turnover, overdues, net worth and loans to weaker sections as the key performanceindicators. Cahalam and Prasad (2007) in their empirical study looked at the liquidity, operational, productivity andprofitability ratios to study the financial performance of nine select PACS inAndhra Pradesh. Shah (2007) makes anattempt to measure the viability of PACS during the pre- and post- economic reforms period. Basak (2009) examinesthe case of Contai Co-operative Bank Ltd. West Bengal to identify and analyze their trend, progress and problems.The study for 1995-96 to 2006-07 uses statistical tools for analysis. Misra (2009) identifies the factors thatcontribute to the unstable financial condition of PACS. The study finds that the government contribution to the sharecapital of the cooperatives adversely affects the recovery performance. It also finds that larger membership size hasa negative effect on recovery performance which was the same as seen in the case of higher proportion of non-borrowing.
Chander and Chandel (2010) make a study on the financial viability, efficiency and performance of four DCCBs
1.2 Concept and Role of PACS
2. Review of Literature
2. Gavesana Journal of Management / Vol. 11. Issue 1. January - June 2019.
Productivity Growth Assessment of Primary Agricultural Credit Societies in West Bengal
operating in Gurgaon division in Haryana (India) for a period of twelve years from 1997-98 to 2008-09 by financialanalysis and z-score analysis. They conclude that though DCCBs play a pivotal role in the rural banking and thefailure/bankruptcy of these banks raise doubts about their viability and sustenance. Jadhav (2010) in the study on co-operative banks identifies lack of awareness among the customers about their rights to various banking facilities,lack of knowledge and skills of the employees of the banks and also comments that resistance against change in thesystem by all levels of the employees and management including top executives of the banks is posing problem forthe cooperative banks. Rachana (2011) makes a detailed study on financial inclusion and performance of Rural Co-operative in Gujarat. The researcher comments that since Regional Rural Banks (RRBs) and PACS run into lossesdespite having wide coverage, commercial banks should seize this opportunity rather than looking at it as a socialobligation. Agrawal and Solanke (2012) make a study on cooperative banks to find out the problems in Indianperspective. Babu and Selkhar (2012) in their study on the performance of urban cooperative banks (UCBs) find thatthough it is quite satisfactory, there is a reduction in their number since 2004. Bansal and Thakkar (2012) point to theproblems like undue government interference, poor governance, high overdues and lack of deposits, financialindiscipline and accumulating non-performing assets. Bhatt (2013) determines the efficiency of cooperative banksoperating in Jammu and Kashmir by looking at their technical efficiency. Das (2013) evaluates the performance ofthe West Bengal State Cooperative Bank Ltd. for 2001 to 2010.
Soni and Saluja (2013) in their study on Cooperative societies of Chhattisgarh for 2009-12 attempt to analyze therole of co-operative banks in agricultural credit. Thirupathi (2013) makes a thorough analysis of financialperformance of select PACS in Tamil Nadu. The study recommends the need for improvement of owned funds,deposit mobilization, deployment of funds and diversification of lending, management information system andmarketing arrangements. Avhad and Chintamani (2014) analyze the performance of DCCBs by looking at theirmembership, number of offices, capital, deposits, advances, reserves and overdues for the period 2002-03 to 2011-12. Attri and Paul (2015) make a study on state co-operative banking in India. The paper focuses on branchnetworking, capital, advances, deposits, working capital and recovery performance of these banks in India. Theresearch reveals that the overall performance shows that the banks are working efficiently, increasing profits andusing the managerial talent judiciously. However, the study brings to light that till 2007-08, the bank's liquidityposition was not safe as it concentrated on credit dispensation rather than on deposit mobilization. Chandrashekar(2015) looks into the growth and structure of cooperative credit societies in India and also studies the financialhealth and overall performance of UCBs in the country. Majumdar et al. (2015) conduct a critical assessment ofselect two PACS by looking at their financial position and also their role in promoting the agri-business of farmersand self-help groups.
From the above cited review of literatures, it is evident that there are a substantially good number of studies oncooperative banking in India. Some research gaps are identified as follows:
(I) Only a handful of researches have been done on the financial performance of PACS operating duringthe pre- and post- economic reforms period in India.
(ii) The review of literature reveals that no research has been conducted on the assessment of financialperformance of PACS inWest Bengal.
(iii) Further, the researchers have not come across any study that looked into the productivity aspect ofPACS inWest Bengal.
Hence the present research aims to fill the gap by looking at the productivity growth of PACS of selected districts inWest Bengal.
(a) To identify the contribution of technical progress towards productivity growth.
(b) To assess at the contribution of technological progress towards productivity growth.
(c) To determine the total factor productivity growth.
3. Objectives Of The Study
Productivity Growth Assessment of Primary Agricultural Credit Societies in West Bengal
Gavesana Journal of Management / Vol. 11. Issue 1. January - June 2019. 3
4. Research Design
5. FindingsAndAnalysis
5.1 Technical Efficiency Change
The components of the design for the present study are as follows:
Data type: The study is based on secondary data on PACS of thirteen selected DCBs of West Bengal (out of total 17DCBs).
Data source: The secondary data is collected from the Annual reports released by the State Cooperative Bank ofWest Bengal at the Central Cooperative Banks' Conference in different years.
Data period: The period of the study is from 2010 to 2017.
Sample Design: The selection of the districts is on the basis of (i) descending order of deposit mobilized by PACSand (ii) availability of data for all years of study.
Research Methodology:The findings are based on the application of Malmquist Index which is used for determiningfactor productivity growth. For the purpose, the input used is deposits and the outputs are investments and loans. Theoutput-oriented model is used under the variable returns to scale assumption as it is realistic in contrast to theconstant returns to scale which assumes that outputs and inputs are going to change in the same proportion.
The results of factor productivity growth focus on three dimensions which are (i) growth due to technical progress,(ii) growth due to technological progress and (iii) productivity growth. The first is referred to as the catching effectwhereas the second is known as frontier effect. The former captures the progress due to technical efficiency whichassesses whether the movement is towards the frontier (in case value is more than one) or away from it (if value isless than one). This component (called efficiency change) identifies how well the process of production transformsthe inputs into outputs. The frontier effect, however, looks at the growth aspect resulting due to shift in the frontier(from improvement in production technologies) obtained for all the firms put together which is the outcome oftechnological advancement in the industry. The following paragraphs give the results.
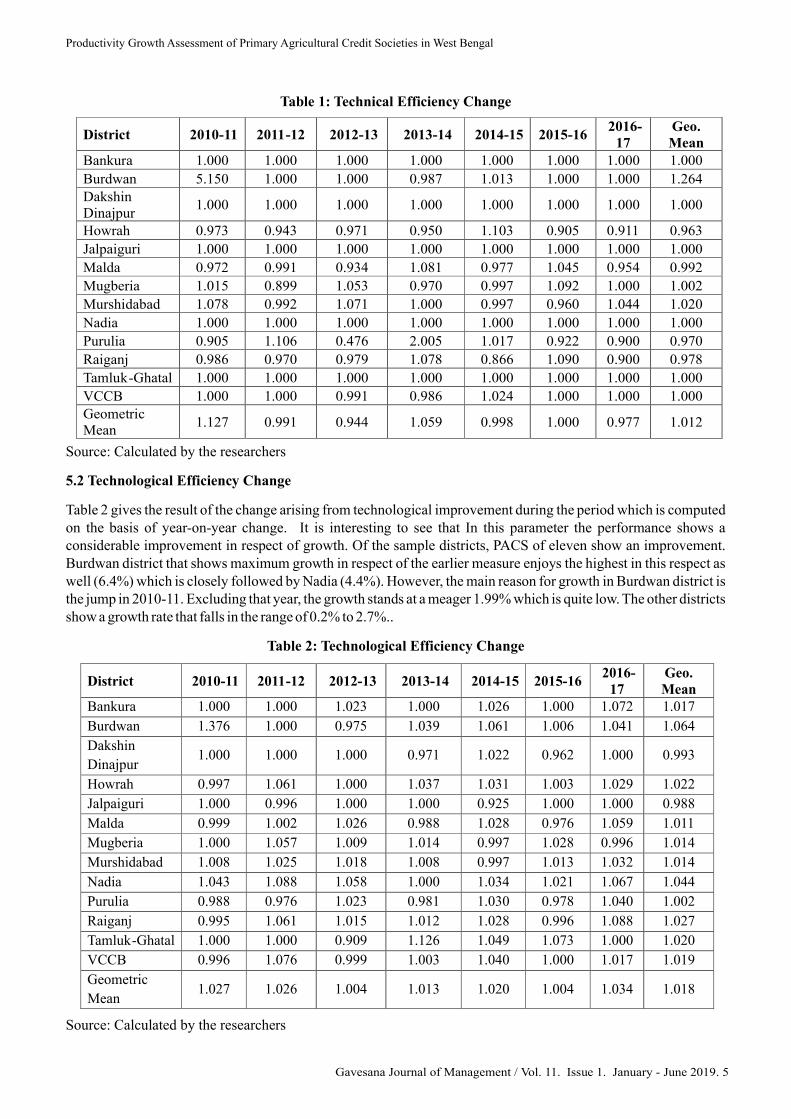
Table 1 gives the result of progress due to technical efficiency change. The overall position of PACS of differentdistricts shows that there is progress in only three districts namely Burdwan, Mugberia and Murshidabad. There arefour districts which show an overall decline which are Howrah, Malda, Purulia and Raiganj. The remaining sixdistricts show stagnation in this regard with the geometric mean to be one during the period.
In the case of Burdwan, the overall growth of 26.4% is due to the abnormal growth in 2010-11 (415%). If weconsider that to be an outlier and recompute the growth, it is found to be nil. Hence, the overall condition of PACSwith regard to growth due to technical efficiency change is not so sound. It is expected that there is a need to grow byproducing more outputs using the same/lesser amount of inputs. With respect to the trend in efficiency change, themean score shows progress of 12.7% in 2010-11 to a regress of 5.6% in 2012-13 and 2.3% in 2016-17. The studyperiod shows an overall progress of 1.2%.
Productivity Growth Assessment of Primary Agricultural Credit Societies in West Bengal
4. Gavesana Journal of Management / Vol. 11. Issue 1. January - June 2019.
District 2010-11 2011-12 2012-13 2013-14 2014-15 2015-162016-
17Geo.Mean
Bankura 1.000 1.000 1.000 1.000 1.000 1.000 1.000 1.000
Burdwan 5.150 1.000 1.000 0.987 1.013 1.000 1.000 1.264DakshinDinajpur
1.000 1.000 1.000 1.000 1.000 1.000 1.000 1.000
Howrah 0.973 0.943 0.971 0.950 1.103 0.905 0.911 0.963
Jalpaiguri 1.000 1.000 1.000 1.000 1.000 1.000 1.000 1.000
Malda 0.972 0.991 0.934 1.081 0.977 1.045 0.954 0.992
Mugberia 1.015 0.899 1.053 0.970 0.997 1.092 1.000 1.002
Murshidabad 1.078 0.992 1.071 1.000 0.997 0.960 1.044 1.020
Nadia 1.000 1.000 1.000 1.000 1.000 1.000 1.000 1.000
Purulia 0.905 1.106 0.476 2.005 1.017 0.922 0.900 0.970
Raiganj 0.986 0.970 0.979 1.078 0.866 1.090 0.900 0.978
Tamluk-Ghatal 1.000 1.000 1.000 1.000 1.000 1.000 1.000 1.000
VCCB 1.000 1.000 0.991 0.986 1.024 1.000 1.000 1.000GeometricMean
1.127 0.991 0.944 1.059 0.998 1.000 0.977 1.012
Table 1: Technical Efficiency Change
5.2 Technological Efficiency Change
Table 2: Technological Efficiency Change
Source: Calculated by the researchers
Table 2 gives the result of the change arising from technological improvement during the period which is computedon the basis of year-on-year change. It is interesting to see that In this parameter the performance shows aconsiderable improvement in respect of growth. Of the sample districts, PACS of eleven show an improvement.Burdwan district that shows maximum growth in respect of the earlier measure enjoys the highest in this respect aswell (6.4%) which is closely followed by Nadia (4.4%). However, the main reason for growth in Burdwan district isthe jump in 2010-11. Excluding that year, the growth stands at a meager 1.99% which is quite low. The other districtsshow a growth rate that falls in the range of 0.2% to 2.7%..
Source: Calculated by the researchers
District 2010-11 2011-12 2012-13 2013-14 2014-15 2015-162016-
17Geo.Mean
Bankura 1.000 1.000 1.023 1.000 1.026 1.000 1.072 1.017
Burdwan 1.376 1.000 0.975 1.039 1.061 1.006 1.041 1.064
Dakshin
Dinajpur1.000 1.000 1.000 0.971 1.022 0.962 1.000 0.993
Howrah 0.997 1.061 1.000 1.037 1.031 1.003 1.029 1.022
Jalpaiguri 1.000 0.996 1.000 1.000 0.925 1.000 1.000 0.988
Malda 0.999 1.002 1.026 0.988 1.028 0.976 1.059 1.011
Mugberia 1.000 1.057 1.009 1.014 0.997 1.028 0.996 1.014
Murshidabad 1.008 1.025 1.018 1.008 0.997 1.013 1.032 1.014
Nadia 1.043 1.088 1.058 1.000 1.034 1.021 1.067 1.044
Purulia 0.988 0.976 1.023 0.981 1.030 0.978 1.040 1.002
Raiganj 0.995 1.061 1.015 1.012 1.028 0.996 1.088 1.027
Tamluk-Ghatal 1.000 1.000 0.909 1.126 1.049 1.073 1.000 1.020
VCCB 0.996 1.076 0.999 1.003 1.040 1.000 1.017 1.019
Geometric
Mean1.027 1.026 1.004 1.013 1.020 1.004 1.034 1.018
Productivity Growth Assessment of Primary Agricultural Credit Societies in West Bengal
Gavesana Journal of Management / Vol. 11. Issue 1. January - June 2019. 5
In respect of the technological efficiency change, the mean score in each year is more than one which points to agrowth. However, the growth rate is quite low (0.4% to 3.4%). The study period shows an overall technologicalefficiency change of 1.8%. The districts of Bankura, Burdwan, Mugberia, Nadia and Tamluk-Ghatal show the mostconsistent performance because either the figure is at least one in all the years or there is a continuous slowimprovement over the years.
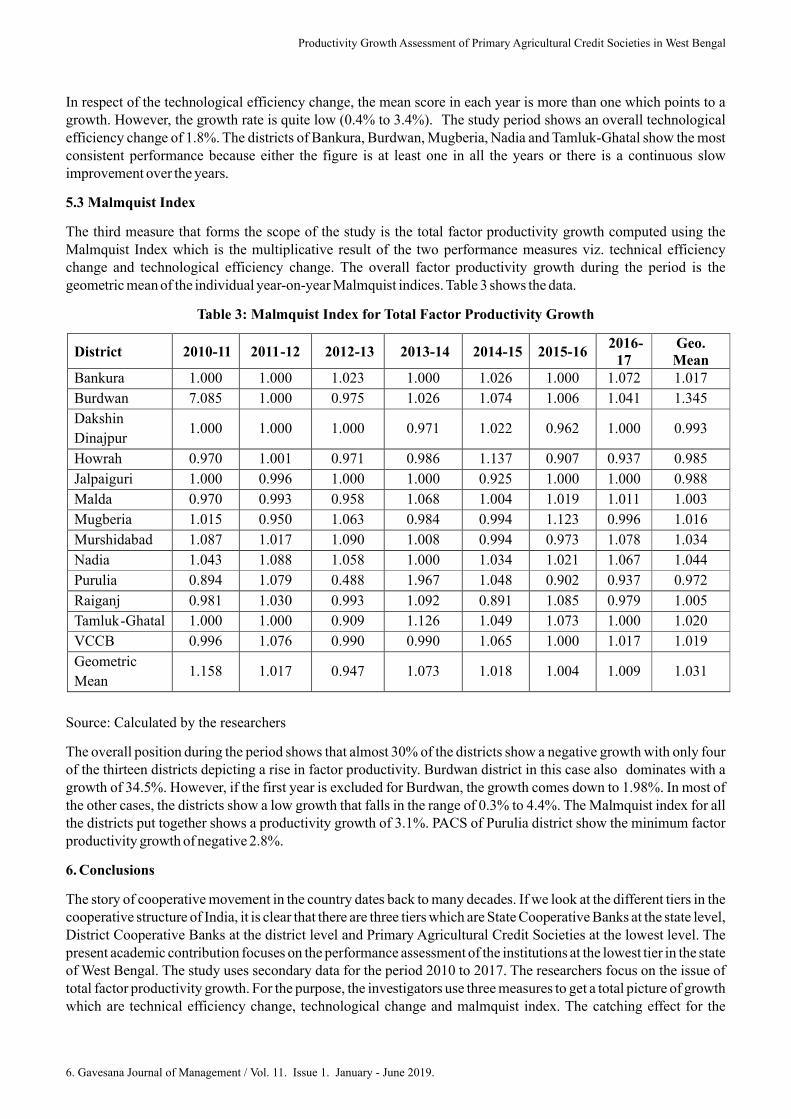
The third measure that forms the scope of the study is the total factor productivity growth computed using theMalmquist Index which is the multiplicative result of the two performance measures viz. technical efficiencychange and technological efficiency change. The overall factor productivity growth during the period is thegeometric mean of the individual year-on-year Malmquist indices. Table 3 shows the data.
Source: Calculated by the researchers
The overall position during the period shows that almost 30% of the districts show a negative growth with only fourof the thirteen districts depicting a rise in factor productivity. Burdwan district in this case also dominates with agrowth of 34.5%. However, if the first year is excluded for Burdwan, the growth comes down to 1.98%. In most ofthe other cases, the districts show a low growth that falls in the range of 0.3% to 4.4%. The Malmquist index for allthe districts put together shows a productivity growth of 3.1%. PACS of Purulia district show the minimum factorproductivity growth of negative 2.8%.
The story of cooperative movement in the country dates back to many decades. If we look at the different tiers in thecooperative structure of India, it is clear that there are three tiers which are State Cooperative Banks at the state level,District Cooperative Banks at the district level and Primary Agricultural Credit Societies at the lowest level. Thepresent academic contribution focuses on the performance assessment of the institutions at the lowest tier in the stateof West Bengal. The study uses secondary data for the period 2010 to 2017. The researchers focus on the issue oftotal factor productivity growth. For the purpose, the investigators use three measures to get a total picture of growthwhich are technical efficiency change, technological change and malmquist index. The catching effect for the
5.3 Malmquist Index
Table 3: Malmquist Index for Total Factor Productivity Growth
6. Conclusions
District 2010-11 2011-12 2012-13 2013-14 2014-15 2015-162016-
17Geo.Mean
Bankura 1.000 1.000 1.023 1.000 1.026 1.000 1.072 1.017
Burdwan 7.085 1.000 0.975 1.026 1.074 1.006 1.041 1.345
Dakshin
Dinajpur1.000 1.000 1.000 0.971 1.022 0.962 1.000 0.993
Howrah 0.970 1.001 0.971 0.986 1.137 0.907 0.937 0.985
Jalpaiguri 1.000 0.996 1.000 1.000 0.925 1.000 1.000 0.988
Malda 0.970 0.993 0.958 1.068 1.004 1.019 1.011 1.003
Mugberia 1.015 0.950 1.063 0.984 0.994 1.123 0.996 1.016
Murshidabad 1.087 1.017 1.090 1.008 0.994 0.973 1.078 1.034
Nadia 1.043 1.088 1.058 1.000 1.034 1.021 1.067 1.044
Purulia 0.894 1.079 0.488 1.967 1.048 0.902 0.937 0.972
Raiganj 0.981 1.030 0.993 1.092 0.891 1.085 0.979 1.005
Tamluk-Ghatal 1.000 1.000 0.909 1.126 1.049 1.073 1.000 1.020
VCCB 0.996 1.076 0.990 0.990 1.065 1.000 1.017 1.019
Geometric
Mean1.158 1.017 0.947 1.073 1.018 1.004 1.009 1.031
Productivity Growth Assessment of Primary Agricultural Credit Societies in West Bengal
6. Gavesana Journal of Management / Vol. 11. Issue 1. January - June 2019.
different PACS shows that improvement in efficiency is observed in the case of Burdwan, Mugberia andMurshidabad. There are four districts which show an overall decline which are Howrah, Malda, Purulia andRaiganj. The remaining six districts show stagnation or no growth. In the case of Burdwan, the overall growth of26.4% is due to the abnormal growth in 2010-11 (415%). If that year is excluded and the result is recomputed, it isobserved that even Burdwan experiences a case of stagnation. Hence, the overall condition of PACS with regard togrowth in technical efficiency is not that rosy. There is a need for the PACS to focus on increasing efficiency byensuring better mobilization of funds.
In order to look into the reason behind productivity progress or regress, investigators also look into technologicalefficiency change. The year-wise figures show that there is a progress over the years though it is quite low at 1.8%. Infact, towards the later part of the study period, there is a progress to the extent of 3.4% in 2016-17.An assessment ofthe performance of PACS of the individual districts shows that except Dakshin Dinajpur and Jalpaiguri, all districtsdepict a growth in technological efficiency which varies from district to district. The change is however maximumin the case of Burdwan followed by Raiganj and Howrah districts.
With regard to the total factor productivity growth, the PACS all together experience a rise in 3.1%. An observationon all the districts individually shows that Burdwan is better placed with a rise of 34.5%. However, if we exclude thefirst year of the study, this district also reveals a similar trend as found in the other cases. But, the productivitygrowth is very low (close to nil) in most of the cases. With regard to the total factor productivity growth, all PACStogether experience a rise of 3.1%. An observation on the individual districts shows that Burdwan is better placedwith a rise of 34.5%. However, if we exclude the first year of the study, the district reveals a similar trend as found inthe other cases. But, the growth assessment shows a position of stagnation in most of the cases. Th us , t heoverall picture of PACS provides evidence of the need to do more for PACS. Else they will slowly perish and will beconsidered as unviable entities.
• Agrawal, S.R. & Solanke S.S. (2012). Problems faced by co-operative banks and perspectives in theIndian Economy. 1(2), October, 53-54.
• Avhad S. & Chintamani R.M. (2014). A Comparative Study of District Central Co-Operative Banks inIndia. IV (Special Issue), July,191-199.
• Attri. K. K. & Paul M. (2015). Growth and performance of co-operative banks in India.2(5), May, 9-15.
• Babu K.V.S.N J. & Selkhar B.M. (2012). The Emerging Urban Co-Operative Banks In India: Problemsand Prospects. 2(5), July-Aug., 1-05.
• Bansal S. N. & Thakkar G. (2012). Rural credit cooperatives in India: Responses to Reforms.2(1), September, 26-38.
• Basak A. (2009). Performance Appraisal of Urban Cooperative Banks: A Case Study.VIII (1), 31-44.
• Bhaskaran R. & Josh P. (2000). Non PerformingAssets in Co-operative Rural Financial System:Amajorchallenge to rural development. (December).
• Bhatt M. S. (2013). Financial Performance and Efficiency of Cooperative Banks in Jammu & Kashmir(India). 2(1), 16-36.
• Chalam, G.V. & Prasad, A. (2007). An Evaluation of Financial Performance of Cooperative Societies inAndhra Pradesh (A Study of Selected PACS in West Godavari District).45(1), 42-58.
References
International Journal ofCommerce, Business andManagement.
Online International InterdisciplinaryResearch Journal.
Sai Om JournalofCommerce&Management,
IOSRJournal of Business andManagement,
Journal ofBusinessManagement andResearch,
IUP Journal ofAccountingResearchandAudit Practices,
Bird's EyeView
Journal ofCo-OperativeAccountingandReporting,
Indian Cooperative Review,
Productivity Growth Assessment of Primary Agricultural Credit Societies in West Bengal
Gavesana Journal of Management / Vol. 11. Issue 1. January - June 2019. 7
• Chander R.& Chandel J.K. (2010). Financial Viability and Performance Evaluation of Co-operativeCredit Institutions in Haryana (India). 1(1),December, 1-22
• Chandrashekar B.S (2015). Growth and Financial Performance of Urban Cooperative Banks in India.Paripex - 4(2), February, 19-21
• Das T. (2013). An Evaluation of Performance of the West Bengal State Cooperative Bank Ltd.4(02), February, 131-136.
• Jain (2001). Comparative study of performance of District Central Co-operative Banks (DCCBs) ofWestern India i.e. Maharashtra, Gujarat & Rajasthan for the year 1999-2000 from the point of view of netprofit/loss. April-June.
• Kulandaiswamy V. & Murugesan, P. (2004). Performance of PACS - An Empirical Evaluation.42(2), 122-30.
• Majumdar K., S. Chowdhury S. & Sarkar K. (2015). Status of Microfinance and Financial Performanceof PACCS in Promoting Rural Development: A Case Study of Selected PACCS in West Bengal.
2(10),April-June, 1039-1041.
• Mishra, B.S. (2009). Research on Performance of Credit Cooperatives. 6.
• Rachana T. (2011). Financial Inclusion and Performance of Rural Co-operative Banks in Gujarat.2(6), 40-50.
• Shah D. (2007). Evaluating Financial Health of Credit Cooperatives in Maharashtra State of India.Paper-3949 (July).
• Soni A.K. & Pal Singh S. H. (2013). Role of Cooperative Bank in Agricultural Credit: A study Based onChhattisgarh. 1(10), 106-113.
• Thirupathi T. (2013).An Analysis of Financial performance of Select Primary Agricultural CooperativeCredit Societies in Mettur Taluk, Salem District. 1(1), 19-24.
International Journal of Computing and Business Research,
Indian Journal of Research,
International Journal of Research inCommerce&Management,
NAFSCOBBulletin,
IndianCooperativeReview,
Advances inEconomics andBusinessManagement,
ResearchWorld,
Research Journal of FinanceandAccounting,
UniversityLibraryofMunich,Germany,MPRA,
Abhinav,
ResearchFront,
Productivity Growth Assessment of Primary Agricultural Credit Societies in West Bengal
8. Gavesana Journal of Management / Vol. 11. Issue 1. January - June 2019.

An Analysis of Factors Affecting the Performance ofGeneral Insurance Companies in India
Dr. D. Srijanani and Dr. R. Srinivasa Rao* **
Abstract
The insurance industry forms an integral part of a country's financial sector. Insurance companies are important forboth businesses and individuals. They are important as they indemnify losses and put them in the same positions asthey were before the occurrence of the loss. Insurers provide economic and social benefits in society like mitigatingthe impact of losses, reduction in fear and uncertainty as well as employment creation.
The Indian insurance industry has seen a change in the market dynamics since liberalization and economicreforms. Though there is an improvement in penetration and density in the last 10 years, India largely remains anunder-penetrated market. Studies show that today the insurance market is primarily dependent on push and taxincentives because of which there is mandatory sales of policies. There is very little or no customer pull. Thecustomer pull will come from the increasing savings and disposable income.
Increase in the interest in insurance, innovative product offerings and distribution channels have helped forthe growth of the industry. Increasing penetration of the internet has also accelerated demand of insurance products.The Indian insurance market is a huge business opportunity. Despite being the second most populous nation, Indiacurrently accounts for less than 1.5% of the world's total insurance premiums and about 2% of the world's lifeinsurance premiums. India is the fifteenth largest insurance market in the world in terms of premium volume, withthe potential to grow exponentially in the coming years.
Currently, there are 24 life insurance, 25 non-life insurance and six health insurance companies in the Indianmarket that compete on prices and services to attract customers. Studies have shown that Demographic factors suchas the growing middle-class population, young insurable population and growing awareness of the need forprotection and retirement planning will support the growth of the Indian life insurance industry. There are not manystudies on the performance of general insurance in India. The present study identifies the gap and examines thefactors that affect the performance of General Insurance in India.
Outreville (1998) suggests that the insurance sector plays a significant role in a country's economic growth andoffers financial protection to individuals or firms against monetary losses suffered from unforeseencircumstances.
Performance is the ability of an organization to gain and manage its resources in several different ways todevelop competitive advantage (Iswatia andAnshoria, 2007). High performance reflects management effectivenessand efficiency in making the use of a company's resources and this contributes to the economy at large (Batra, 1999).Generally, the performance of insurance companies can be estimated by measuring their profitability, which is arelative measure of success for a business and it acts as a proxy of financial performance.
Lack of insurance coverage can leave individuals and families vulnerable to the uncertainties ofeveryday life and emergencies. Insurance makes possible ventures that would otherwise be prohibitivelyexpensive if one party had to absorb all the risks (Rejda and McNamara, 2014). Insurance provides protection forvaluable possessions and assets for the day that an unexpected loss or damage to belongings is experienced. Itencompasses all types of insurance policies other than life insurance policies (Rejda and McNamara, 2014).
2. Review of Literature
* Associate Professor, Vignana Jyothi Institute of Management, Hyderabad.** Assistant Professor, Vignana Jyothi Institute of Management, Hyderabad.
Gavesana Journal of Management / Vol. 11. Issue 1. January - June 2019. 9
Charumathi (2012) defines profitability as the ability of the business to utilize its assets in order to generaterevenues in an efficient manner. Studies reveal that the insurance companies profitability is affected by factorswhich are both internal and external like working capital management efficiency (Jibra, Sameen, Kashif andNouma, 2016), liquidity ratio, capital adequacy, firm growth rate, size of the company (William, 2012) and evenexternal factors like GDPand Inflation (Fadzlan, 2009).
Ansari and Fola (2013), examined the Indian financial soundness and performance of life insuranceindustry. They employed CARAMEL model to analyze the variables. According to the result of this study capitaladequacy, asset quality, management efficiency, earnings /profitability/and liquidity position significantly vary inprivate and public life insurance companies in India.
One of the objectives when managing insurance companies is to attain profit (Chen and Wong, 2004).Profits alone cannot be used to compare performance between different companies hence profitability is suitablymeasured by financial ratios (Abate, 2012).
Al-Shami (2008) and Malik (2011) argued that Return onAssets (ROA) and Return on Equity (ROE) are thebest measures of company performance. ROA measures the ability of an insurance company's management togenerate income by utilising company assets (Wen, 2010). It is a ratio that indicates profitability of an insurancecompany. An increasing trend of ROA indicates that the profitability of the company is improving. ROE is afinancial ratio that measures the amount of profit a company earned relative to the total amount of shareholder equityinvested. Thus, a higher ROE indicates that management is very effective in utilising shareholders' capital(Krawish, 2011).
Kozak (2011) analysed the determinants of the profitability of 25 general insurance companies in Polandfrom 2002 to 2009. By applying a regression model the author identified the factors; reduction of motor insurance,increase of other classes of insurance, growth of gross written premiums, operating costs reduction, Gross domesticProduct (GDP) growth, and growth of the market share of the companies with foreign ownership, as having apositive impact on insurance companies' performance.
Almajali, Alamro and Al-Soub (2012) carried out a study to examine and identify the factors affecting thefinancial performance of Jordanian insurance companies during the period 2002 to 2007. ROA was used as thedependent variable while leverage, liquidity, age, size and management competence index were independentvariables. The results of regression analysis revealed that liquidity, leverage, size of the company and managementcompetence index have a significant and positive effect on the financial performance of Jordanian insurancecompanies. Results also suggest that there is no significant relationship between the age of the company andperformance.
Study in Africa conducted by Derbali, 2012 on “determinants of performance of insurance companies inTunisia” specifically focused on life insurance companies. Accordingly, company growth rate and age wereidentified as had a positive impact while company size affecting negatively the profitability of insurance companies.However, variables such as leverage ratio, tangibility and liquidity risk were identified as had no significant impacton life insurance companies` profitability (Derbali, 2012).
Burca and Batrinca (2014) investigated the factors that affect the financial performance of 21 insurancecompanies operating in the Romanian insurance market during the period 2008-2012. By applying panel datatechniques, the authors showed that the major determinants of financial performance in the Romanian insurancemarket are financial leverage in insurance, company size, growth of gross written premiums, underwriting risk, riskretention ratio, and solvency margin.
The general insurance business in India is currently at about Rs 78,000 crore (US$ 11.44 bn) premium perannum industry and is growing at a rate of 17 %.
The Indian insurance market is a huge business opportunity waiting to be harnessed. Despite India is thesecond most known populous nation in the world, currently accounts for less than 1.5% of the world‟s totalinsurance premiums and about 2% of the world‟s life insurance premiums. In terms of premium, India is the
10. Gavesana Journal of Management / Vol. 11. Issue 1. January - June 2019.
An Analysis of Factors Affecting the Performance of General Insurance Companies in India

fifteenth (15 ) largest insurance market in the world and has a great potential to grow in the future (Bawa andChattha, 2013).
There are several studies on a multiple linear regression approach that investigated the factors affecting theinsurance industry in different countries obtaining different results [Ahmed and Usman, 2011; Charumathi, 2012;Muya, 2013; Mehari andAemiro, 2013; and Pervan, Curak and Poposki, 2014].
In this article we utilise a combination of multiple linear regression and factor analysis using panel data ofgeneral insurance companies in India. We unravel the impact of various independent variables on insurancecompany performance measured using the ROA.
The primary objective of the study is to examine the factors that affect the performance of general insurancecompanies in India.
The study is based on secondary data collected from the annual reports of the companies, IRDA annual reports,Swiss Re repots, PWC Reports and E&Yreports, annual reports of the individual insurance companies.
The data was collected for the years 2009-2017, a total of 9 years. The sources of these data include financialstatements of the selected companies, journals, research papers etc. The annual reports of IRDA, the financials of thecompanies were collected from CAPITALINE DATABASE and also from the individual annual reports of therespective companies. The financial data collected is analyzed using basic statistical measures, correlation analysisand regression analysis.
Asample of ten general insurance companies (4 public and 6 private are taken) .The private insurance companies areselected on judgmental basis. Ten general insurance companies are chosen to understand the factors that impact theoverall performance of the general insurance sector.
The potential and performance of the insurance sector is universally assessed with reference to two parameters, viz.,insurance penetration and insurance density. These two are often used to determine the level of development of theinsurance sector in a country.
(i) Level of insurance penetration which is measured as the percentage of insurance premium in grossdomestic product (GDP); and
(ii) Insurance density ratio (wherein insurance density is defined as the per capita expenditure oninsurance premium and is directly correlated with per capita GDP).
The potential and performance of the insurance sector is universally assessed with reference to twoparameters, viz., insurance penetration and insurance density. These two are often used to determine the level ofdevelopment of the insurance sector in a country. Insurance penetration is defined as the ratio of premiumunderwritten each year to the Gross Domestic Product (GDP).
The penetration of the insurance industry has grown to 3.70% in FY 2017-18 compared to 3.49% in FY2016-17.The penetration of the industry was the highest at 5.20% in FY2009-10 and 5.10% in FY2010-11.
Similarly, the insurance density, which was at a high in 2010-11 at $64 has then to $60 and now againincreased to $73 in FY 2017-18. The insurance density was at $55 in FY 2015-16, that means density has marginallyincreased last fiscal.
The insurance industry has been at the forefront of economic development in India. Gross premiums havegrown at a CAGR of 7.2% over the last decade, pushing the country's sector into the league of larger insuranceeconomies globally. During this period, the behavior of customers has also changed significantly, with 20-25% of
th
3. Objectives of the Study
4. Research Methodology
5. Overview of Indian Insurance Sector
Gavesana Journal of Management / Vol. 11. Issue 1. January - June 2019. 11
An Analysis of Factors Affecting the Performance of General Insurance Companies in India
them now using digital channels to understand and compare insurance products. The performance of the insurancecompanies is affected by a variety of factors. The present study aims to study the factors affecting the performance ofgeneral insurance in India.
Data collected from 7 general insurance companies (3 public and 4 private insurance). Financialreport of companies from their respective website and IRDAI taken as a source and collected for 9 years data from2009 up to 2017, which included 63 observations.
63 observations of panel data (cross-sectional and time series) has been analyzed by usingFixed Effect Model after checking the appropriateness of the model by testing Hausman test and Durbin Waston test.
The Regression output generated through Eviews version 7 to test the following model:
Where,
: Return on equity defined as the insurance companies after tax profit over equity is the profitability in
insurance company at time .
Data collected from 7 general insurance companies (3 public and 4 private insurance). Financial report of companiesfrom their respective website and IRDAI taken as a source and collected for 9 years data from 2009 up to 2017,which included 63 observations.
Analysis technique: 63 observations of panel data (cross-sectional and time series) has been analyzed byusing Fixed Effect Model after checking the appropriateness of the model by testing Hausman test and DurbinWaston test.
The Regression output generated through Eviews version 7 to test the following model:
Where,
: Return on equity defined as the insurance companies after tax profit over equity is the profitability in
insurance company at time .
The descriptive statistics results for the dependent variable; return on equity and independent variables; GDP,solvency ratio, liquidity ratio, claims ratio, inflation rate, liquidity and equity capital. The minimum, maximum,mean and standard deviation values are included in Table 1. These figures give a description about the data used inthe study in order to understand the study variables. The descriptive statistics of each variable which is computedbased on the 63 observations recorded for the period 2009 to 2017.
6. ResearchAnalysis
Methodology
Data source:
Analysis technique:
7. DataAnalysis
Descriptive Statistics
ROE
i t
ROE
i t
i,t
i,t
12. Gavesana Journal of Management / Vol. 11. Issue 1. January - June 2019.
An Analysis of Factors Affecting the Performance of General Insurance Companies in India
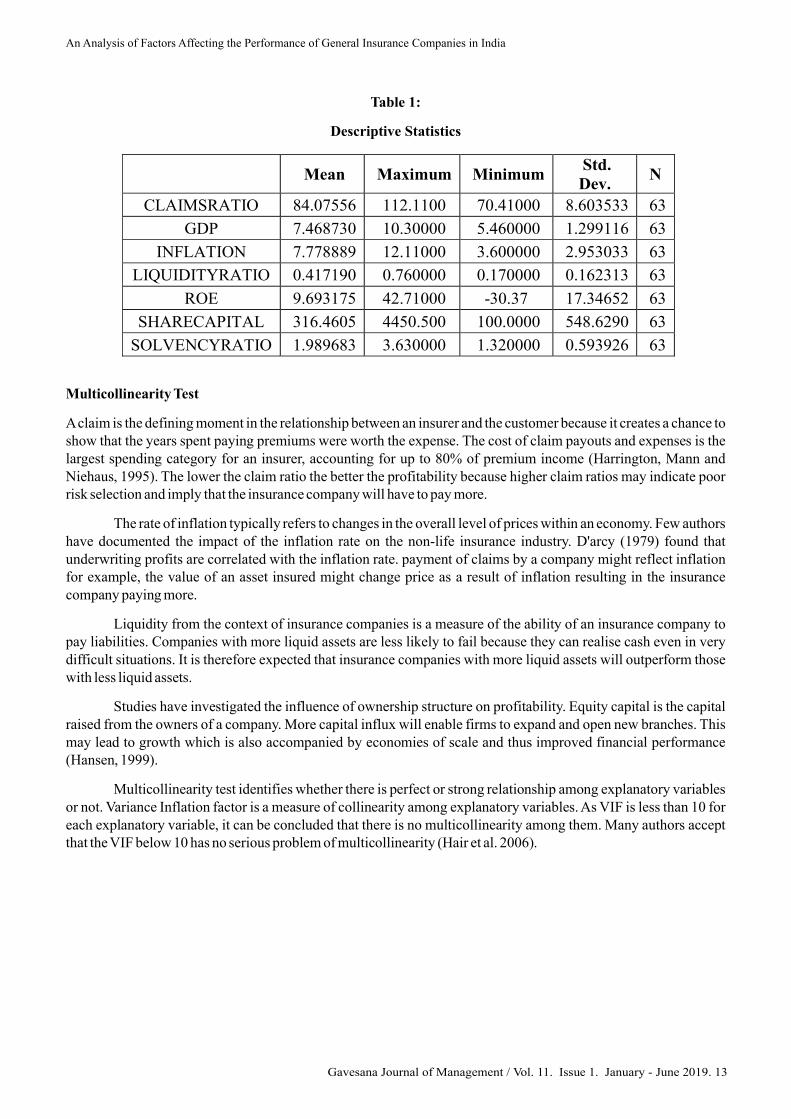
Table 1:
Descriptive Statistics
Multicollinearity Test
Aclaim is the defining moment in the relationship between an insurer and the customer because it creates a chance toshow that the years spent paying premiums were worth the expense. The cost of claim payouts and expenses is thelargest spending category for an insurer, accounting for up to 80% of premium income (Harrington, Mann andNiehaus, 1995). The lower the claim ratio the better the profitability because higher claim ratios may indicate poorrisk selection and imply that the insurance company will have to pay more.
The rate of inflation typically refers to changes in the overall level of prices within an economy. Few authorshave documented the impact of the inflation rate on the non-life insurance industry. D'arcy (1979) found thatunderwriting profits are correlated with the inflation rate. payment of claims by a company might reflect inflationfor example, the value of an asset insured might change price as a result of inflation resulting in the insurancecompany paying more.
Liquidity from the context of insurance companies is a measure of the ability of an insurance company topay liabilities. Companies with more liquid assets are less likely to fail because they can realise cash even in verydifficult situations. It is therefore expected that insurance companies with more liquid assets will outperform thosewith less liquid assets.
Studies have investigated the influence of ownership structure on profitability. Equity capital is the capitalraised from the owners of a company. More capital influx will enable firms to expand and open new branches. Thismay lead to growth which is also accompanied by economies of scale and thus improved financial performance(Hansen, 1999).
Multicollinearity test identifies whether there is perfect or strong relationship among explanatory variablesor not. Variance Inflation factor is a measure of collinearity among explanatory variables. As VIF is less than 10 foreach explanatory variable, it can be concluded that there is no multicollinearity among them. Many authors acceptthat the VIF below 10 has no serious problem of multicollinearity (Hair et al. 2006).
Mean Maximum Minimum Std. Dev.
N
CLAIMSRATIO 84.07556 112.1100 70.41000 8.603533 63
GDP 7.468730 10.30000 5.460000 1.299116 63
INFLATION 7.778889 12.11000 3.600000 2.953033 63
LIQUIDITYRATIO 0.417190 0.760000 0.170000 0.162313 63
ROE 9.693175 42.71000 -30.37 17.34652 63
SHARECAPITAL 316.4605 4450.500 100.0000 548.6290 63
SOLVENCYRATIO 1.989683 3.630000 1.320000 0.593926 63
Gavesana Journal of Management / Vol. 11. Issue 1. January - June 2019. 13
An Analysis of Factors Affecting the Performance of General Insurance Companies in India

Regression Output:
Dependent Variable: ROEMethod: Panel Least SquaresDate: 12/18/18 Time: 12:10Sample: 2009 2017Periods included: 9Cross-sections included: 7Total panel (balanced) observations: 63
CLAIMS RATIO
GDP INFLATION LIQUIDITYRATIO
SHARE CAPITAL
SOLVENCY RATIO
CLAIMSRATIO 1
GDP 0.16 1
INFLATION 0.07 -0.29 1
LIQUIDITYRATIO 0.28 0.27 -0.4 1
SHARECAPITAL 0.02 0.03 -0.12 0.06 1
SOLVENCYRATIO 0.02 0.27 0.18 0.21 0.16 1
Variable Coefficient Std. Error t-Statistic Prob.C 131.1908 17.53738 7.480638 0.0000CLAIMSRATIO -1.168135 0.173155 -6.746192 0.0000GDP 1.672050 0.955101 1.750653 0.0861INFLATION -0.508462 0.527943 -0.963100 0.3401LIQUIDITYRATIO 52.01695 19.79710 2.627504 0.0114SHARECAPITAL 0.001920 0.002129 0.901707 0.3715SOLVENCYRATIO 3.186553 2.709446 1.176090 0.2451
Variable
Collinearity Statistics
Tolerance VIF sharecapital .965 1.037
liquidityratio .725 1.379
solvencyratio .884 1.131
claimsratio .864 1.157
gdp .801 1.248
inflation .796 1.257
14. Gavesana Journal of Management / Vol. 11. Issue 1. January - June 2019.
An Analysis of Factors Affecting the Performance of General Insurance Companies in India

Effects Specification Cross-section fixed (dummy variables)
R-squared 0.827872 Mean dependent var 9.693175 Adjusted R-squared 0.786561 S.D. dependent var 17.34652 S.E. of regression 8.013993 Akaike info criterion 7.181842 Sum squared resid 3211.204 Schwarz criterion 7.624076
Log likelihood -213.2280 Hannan-Quinn criter. 7.355775 F-statistic 20.04012 Durbin-Watson stat 1.325416 Prob(F-statistic) 0.000000
From the above regression it is observed that Claims ratio and Liquidity ratio are statistically significant at 5%,while GDP is statistically significant at 10%. Other variables such as inflation, share capital and Solvency ratioshowed insignificant effect on ROE.
The industry shows signs of stress but there is a silver lining. The insurance industry stands at the threshold ofmoving toward a stable and profitable growth. Most players are now looking to reassess the entire business modelfrom product, pricing, risk management, acquiring rural customers, distribution, claims and fraud management.They are aiming at a realistic pace of growth. The industry is also moving towards consolidation, i.e., mergers andacquisitions.
The study shows that claims ratio and liquidity ratio have a significant affect on the ROE and the otherfactors like GDP, inflation, solvency, capital etc., do not have a huge impact on the performance of general insurancecompanies.
The growing awareness of the need for protection, the need for retirement planning, growing middle classand the huge young insurable population of our country will help and support the growth of insurance industry inIndia. The insurance companies help in the creation of a more stable operating environment for businesses and thusallows companies to concentrate on their core business. The insurance companies should work towards betterperformance, increasing the penetration of insurance to rural and underpenetrated areas and increasing thecontribution to the economy.
• Ahmed, Naveed, Ahmed, Z and Usman, Ahmad. (2011). Determinants of performance: A case of lifeinsurance sector of Pakistan. Vol. 61, pp.123-128.
• Al-Jafari, K. and Al Samman, H. (2015). Determinants of Profitability: Evidence from IndustrialCompanies Listed on Muscat Securities Market. Vol. 7, No. 11, pp. 303-311.
• Alper, D. and Anbar, A. (2011), Bank Specific and Macroeconomic Determinants of Commercial bankprofitability: Empirical Evidence from Turkey. Vol. 2, No.2, pp. 139-152.
• Al-Shami, H. (2008). Unpublished thesis(Msc), Universiti Utara, Malaysia
• Ansari, A. and Fola, W. (2014). Financial Soundness and Performance of Life Insurance Companies inIndia. Vol. 1, pp. 224-253.
• Bawa, K. and Chattha, S. (2013). Financial Performance of Life Insurers in Indian Insurance Industry.Vol. 6, pp. 44-48.
Conclusion
References
International Research Journal of Finance and Economics.
Review of European Studies,
Business and Economics Research Journal,
Determinants of Insurance Companies Profitability in UAE.
International Journal of Research (IJR),
PacificBusiness Review International,
Gavesana Journal of Management / Vol. 11. Issue 1. January - June 2019. 15
An Analysis of Factors Affecting the Performance of General Insurance Companies in India

• Burja, C. (2011). Factors Influencing the Companie Profitability.Vol. 13, No. 2, pp. 215-224.
• Burca, A.M. and Batrînca, G. (2014). The Determinants of Financial Performance in the RomanianInsurance Market.
• Charumathi, B. (2012). Determinants of Profitability of Indian Life Insurers - An Empirical Study.Proceedings of the World Congress on Engineering, Vol I, WCE 2012, July 4-6, 2012, London UK,ISBN: 978-988-19251-3-8.
• Derbali, Abdelkader (2014), Determinants of Performance of Insurance Companies in Tunisia: TheCase of Life Insurance (May 1, 2014). Vol. 6,No. 1, May 2014, pp. 90-96.Available at SSRN: https://ssrn.com/abstract=2540856
• Hussain, I. (2015). Macro Economy and Profitability of Insurance Companies:APost Crisis Scenario inPakistan. July 2015, pp. 243-263.
• IRDAI ,Annual Reports.Available at www.irdaindia.org.
• Jibran,A., Sameen, M., Kashif, A. and Nouman, K. (2016). Determinants thatAffect the Profitability ofNon-Life Insurance Companies: Evidence from Pakistan. Vol. 5,No. 4, pp. 6-11.
• Kaur, N. and Kapoor, R. (2007), Profitability Analysis of Public Sector Banks in India, IndianManagement Studies Journal, Vol. 11, pp 167- 181.
• Malik, H. (2011). Determinants of Insurance Companies Profitability: An Analysis of Insurance Sectorof Pakistan. Vol. 1, pp. 315-321.
• Outreville J F (1990), The economic significance of insurance markets in developing countries.Vol. 57, No. 3, pp. 487-498.
• Outreville J F (1996), Life insurance markets in developing countries. Vol. 63, No. 2, pp.263-278 (PDF)The relationship between insurance and economic growth: Review and agenda.
• Rejda, G.E., and McNamara, M. (2014) Principles of risk management and insurance. 12 ed. NewYork:Pearson Education, pp. 104-160.
• Riaz, S. and Mehar, A. (2013).The impact of Bank Specific and Macroeconomic Indicators on theProfitability of Commercial banks. Vol. XVI No. 47, pp. 91-110.
• Sufian, F. and Chong, R.R. (2008). Determinants of bank profitability in a developing economy:empirical evidence from the Philippine.
Vol. 4, No. 2, pp. 91–112.
• Sümegi, Kjell and Haiss, Peter. (2008). The relationship between insurance and economic growth:Review and agenda. Vol. 5, pp. 32-56.
• IRDAI (2014/15),Annual Report.Available at www.irdaindia.org.
AnnalesUniversitatisApulensis SeriesOeconomica,
International Journal ofAcademicResearch inAccounting.
International Journal of Innovation and Applied Studies,
PakistanBusinessReview,
Research Journal of Recent Sciences,
AcademicResearch International,
J RiskInsur.,
J Risk Insur.,
TheRomanianEconomic Journal,
Asian academy of management journal of accounting andfinance,
The Icfai Journal of Riskand Insurance.
th
16. Gavesana Journal of Management / Vol. 11. Issue 1. January - June 2019.
An Analysis of Factors Affecting the Performance of General Insurance Companies in India
Age of Transformation: Emergence of Artificial Intelligence forManufacturing Industries
Mr. Sandeep Bhattacharjee*
Abstract
We may be witnessing major transformational change in this age of computation of manufacturing and processing.The rise in consumer demand has affected major industries throughout the world. Therefore, the need for a catalystfor instigating such hyper changes has been felt by every element involved in such process. The need for artificialintelligence has seen a boom in last few years with more funds available for research and development ofimplementable concepts into acceptable and feasible designs. This paper is an effort to understand how artificialintelligence has developed in recent years. Also, there are different aspects of manufacturing and allied activitiesthat can be transformed sincerely for innovation, maximizing time-output ratio including quality control.
AI, Neural Network, Business Efficiency, Intelligence
The 4th Industrial Revolution has been recognized as the most dynamic socio-economic transformation thathumanity has ever faced of yet (World Economic Forum). There are so many enduring technology-based changesthat are touching business across different nations around the world. These include cars with auto drivingmechanism, connected devices, AI driven high tech computer micro and nano chips, mobile internet technologiesalong with rapid multi dimensional innovations that indicate this colossal shift to the new era.
As compared to the prior industrial revolution, manufacturing is the centre stage of several of thesepioneering advancements in manufacturing sector. In general, manufacturing is considered as being naturallyinclined to transform, with the intent of making things easily affordable and gain competitive advantage in themarket. Experts all over the world agree the next big change will be the useArtificial Intelligence in manufacturing,more popularly now being called as smart manufacturing. As predicted by the global giant Accenture, keyindustrial applications of Artificial Intelligence have high probability of being the most disruptive due to the highlevels of global competition. This fact has also been ascertained by 92% of manufacturing executives, therebyconfirming that AI is surely going to the ultimate drivers of innovation in the space(https://www.iflexion.com/blog/ai-manufacturing).
Recent growth in artificial intelligence (AI) has enthused passionate interest from private sector and publicsector and governments all across the globe, as they anticipate higher likelihood of bulk-produced consumerproduct machinery with super humanlike intelligence a reality in near times. While AlphaGo deepmind becamethe first computer program to defeat a professional human Go player capturing headlines all across the globe, thereare many other real breakthroughs inAI waiting or are in the process of taking place in near future. There are manyimpressive developments in AI–based computer programs that have made such technologies, which can learn andwisely respond including decision making in different ranges of real time areas and applications.
Some of the instances of preliminary growth of AI can be people visiting shopping websites and gettingemails, alerts on predictable products, services later based on network of algorithms running in the background thatrecords, processes and analyses the data of such online behavior:
There has been literature on current advances in AI and the consequential implications related to jobs,skills, allied sectors and society, not much analyses has been conducted on the explicit impact of AI on India'spromising economy.Also, India must surely and transitionally create workforce and environment to adopt based on
Keywords:
1. Introduction
*Assistant Professor, Amity University, Kolkata, Major Arterial Road, Action Area II, Kadampukur Village,Rajarhat, Newtown, Kolkata, West Bengal 700156 Mobile: +91-9836648495E-mail:[email protected]
Gavesana Journal of Management / Vol. 11. Issue 1. January - June 2019. 17

a programmed framework of national policy to propel AI growth, innovation, adaptation, and propagation invarious sectors and not just concentrating on merely consumer goods and information technology (IT) services.AI's inclusion shall bring in new distinctive opportunities with challenges for India, both in the short, medium andlong term periods.
Therefore, the goal of this paper is to understand how the concept of AI can be applied in various manufacturingapplications so that Indian manufacturing companies can fulfill the necessary requirements for its successfulimplementation and development.
The technology of AI has been a point of discussion for the university researchers for around 30 years. It has beenseen that the Japanese have shown the world business community the successes in the form of manufacturing steel,cars, electronics, and computer chips. In recent times, Japan declared their Fifth Generation Project goal, "think",there were instantaneous reactions from the rest of the world. The U.S. Government also came up with programssuch as the Defense Advanced Research Projects Agency (DARPA).Also, the Britain started theAlvey Committeeand European community formed European Strategic Programs for Research and Development in InformationTechnology (ESPRIT).
During the early stages in 1960's, work on AI experienced a rise in fame when some relatively audacious claimswere made about future capabilities which may emerge, more in the vicinity of machine translation.As these claimscould not occur as thought, research funds also became scant. These were later activated in some ways with theJapanese declaration of their Fifth Generation Project. In the 21st century AI has developed into an importantdomain of research in practically all categories that includes science, engineering, medicine, business, accounting,finance, marketing, economics, stock market, education and law, including others (Halal (2003), Masnikosa(1998), Metaxiotis et al. (2003), Raynor (2000), Stefanuk and Zhozhikashvili (2002), Tay and Ho (1992) andWongpinunwatana et al. (2000)). Tracking of such AI expansion has become a very difficult task (Ambite andKnoblock (2001), Balazinski et al. (2002), Cristani (1999) and Goyache (2003)). There are many other fields ofknowledge which are being looked upon as AI applications tend to increase (Eiter et al. (2003), Finkelstein et al.(2003), Grunwald and Halpern (2003), Guestrin et al. (2003), Lin (2003), Stone et al. (2003) and Wilkins et al.(2003)).
Both business and non-business using information technology are now considering a major shift to AI clearingmajor obstacles and hindrances in the path of applications (Barzilay et al. (2002), Baxter et al. (2001), Darwiche andMarquis (2002), Gao and Culberson (2002), Tennenholtz (2002) and Wiewiora(2003)). One of the main motivatorsfor AI caters to requirements of new players to understand the basic structure of AI literature (Brooks (2001),Gamberger and Lavrac (2002), Kim (1995), Kim and Kim (1995), Patel-Schneider and Sebastiani (2003) andZanuttini (2003)).
Literature points towards different areas of AI that can be divided into sixteen categories (Becker et al. (2000),Singer et al. (2000), Chen and Van Beek (2001), Hong 2001) and Stone et al. (2001)). These are reasoning,programming, artificial life, belief revision, data mining, distributed AI, expert systems, genetic algorithms,knowledge representation, systems, natural language understanding, machine learning, neural networks, theoremproving, constraint satisfaction, and computation theory (Peng and Zhang (2007), Zhou et al. (2007) and Wang et al.(2007)).
2. LITERATURE REVIEW
18. Gavesana Journal of Management / Vol. 11. Issue 1. January - June 2019.
Age of Transformation: Emergence of Artificial Intelligence for Manufacturing Industries

Figure 1. Prediction types for different sectors
(Source: https://www.cloudtp.com/doppler/hot-topics/ai-is-here-and-it-will-change-everything/)
The objectives of the study are as follows:
a. To identify different aspects ofAI.
b. To understand the characteristics of AI in manufacturing process.
c. To observe the trends inAI applications in manufacturing and allied sectors.
d. To understand availability of funding inAI research in manufacturing.
In this research paper, our intention was to identify the practicalities of AI applications in manufacturing sector. Tounderstand this, we have collected secondary data from a range of published sources such as journals, publishedreports. Some tables and figures have also been used based on secondary data sources. The trends were alsocollected from reputed sources and were acknowledged. A preliminary investigation helped in construction of theliterature review and observation technique was used to build the periphery of discussion and analysis.
In manufacturing, there are different areas where manufacturing and allied brands can explore these as separate AIprojects:
1. AI- based Maintenance Systems
2. AI- controlled Supply Chain Management
3. AutomatedYield Optimization usingAI
4. Fault Detection / QAAutomation using AI
I. Research Methodolgy
II. Discussion and Analysis
4.A.Areas of AI Applications
Gavesana Journal of Management / Vol. 11. Issue 1. January - June 2019. 19
Age of Transformation: Emergence of Artificial Intelligence for Manufacturing Industries
5. AI controlled Facility Operations
6. AI managed Staffing
Different AI techniques such as machine learning with neural networks and fuzzy logic lead to predictivemaintenance. Predictive maintenance can be defined as a technique to forecast or anticipate the future failure pointof machine components, so that such can be replaced just before it reaches failure stage, according to plannedarrangement. This helps in minimizing of equipment downtime along with maximization of component lifetime. Inthis technique, different parameters are measured continuously so that connections can be predictable within thecomponent life cycle. An example can be readings of the vibration of a bearing at regular intervals until thecomponent fails. This involves using machine learning techniques using training, testing and validation of samplesfor future estimation of possibility of component failure with immediate replacement of such component
(http://www.mantenimientopetroquimica.com/en/rcm/144-articles-of-interest/100-what-is-predictive-maintenance.html).
As per suggestions of Deloitte, an AI-based predictive safeguarding system can enhance equipment uptime by10%-20%. Also, it can decrease material expenses by 10%, along with reducing maintenance planning time around50%. This may lead to trim down maintenance costs by at least 10%. This may be millions of dollars of savingsevery year, with a very high returns on investments if all planned operations are managed smoothly.
In general, a complex manufacturing process can involve several thousands of parts of systems and sub-systems..These processes may be sourced, delivered to different parties, and needs to safely maintained in inventory. Thissupply chain must be kept highly purposeful and equipped which can lead to lean manufacturing.
Machine learning is considered the most important activity in the domain of supply chain. According to AdeelNajmi (chief product officer at Symphony Retail AI), machine learning takes place when a machine reads theoutput, supervises the output accuracy, and continuously updates its own algorithmic model so that improvedoutputs can be achieved in future. He also contemplates that these may or may not always require use of data sciencetechniques. He emphasizes on the ability of the machine to learn with experience and not just concentrate on justneural networks or some other form of supervised or unsupervised learning technique
(https://www.forbes.com/sites/stevebanker/2019/01/01/20-things-to-know-about-artificial-intelligence-for-supply-chain-management/#279520e75371).
Also, Machine learning is estimated to reduce costs related to transport and warehousing and supply chainadministration by 5 to 10% and 25 to 40%, respectively.
In modern times, most manufacturing concerns think on finding innovative ways to grow, improve at productquality and at the same time with short lead-time production fulfillment for customers. As per a recent survey byWorld Economic Forum (WEF) and A.T. Kearney, the future of production lies in how manufacturers areconsidering pool suitable emerging technologies including Internet of Things, AI, and machine learning that canlead to accuracy of asset tracking, visibility of supply chain, and optimization of inventory (Technology andInnovation for the Future of Production:AcceleratingValue Creation,World Economic Forum withA.T. Kearney).
One of the most common methods used by Multi national corporations is Automation testing where testautomation software is created and operationalized for automated tests for detection of faults and errors(https://www.softwebsolutions.com/resources/qa-automation-consulting-services.html). In real time, it has beenobserved that even cloud technologies like Selenium Grid are vulnerable in terms of lags in execution time, based
• Maintenance AI- based Maintenance Systems
•AI-controlled Supply Chain Management
•AutomatedYield Optimization usingAI
• Fault Detection / QAAutomation using AI
20. Gavesana Journal of Management / Vol. 11. Issue 1. January - June 2019.
Age of Transformation: Emergence of Artificial Intelligence for Manufacturing Industries

on the frequency of nodes running, actual memory used , and the frequency of concurrent tests. Cloud computingenables to increase the ability to execute swift multi level scaling of applications, (up and down), depending on theapplication workload, with sharing information across all implementable instances. Optimized solutions sought bytesters can be achieved with the very high bars if AI is infused for large scale improvement in such processes.Acceptance criteria for such can be:
1. Such tests should be executable at scale, within the cloud, to create more efficient and reliablesolutions with every consequent run and release.
2. Such tests should not be location specific but rather be executable from any place around the globe, bedevice, independent with different levels of bandwidth, and suitable for all possible environments.
3. Speed tests should be easy even for the most complex problems and should take minimumexecutable minutes and not stretch to longer or indefinite periods of time(https://dzone.com/articles/ai-in-test-automation )
Facilities Managers face a very complex task of over viewing and recollecting details linked to everydayoperations. AI in facilities management enhances the ability of systems to use self-optimizing systems, power-driven by the Internet of Things (IoT), reduces machine -work time for team members. For instance, self-vacuumingand self-mopping devices are using AI to chart out a floor, clean them, and return to docking station uponcompletion of predetermined work (Source: http://blog.qsifacilities.com/artificial-intelligence-in-facilities-management).
AI provides supplementary view into and much larger span of control over environmental and facility controls,along with realizing these benefits:
1. AI can open new source revenue. For instance, minimizing energy usage to construct a net-zeroenergy location can efficiently double capital planning ability.
2. Improved predictability and Demand forecasting through AI can improve preventative maintenanceplanning. Also, predictability, facilities Managers can strategically segment capital and operationalcosts, thereby controlling overall facilities expenditures.
3. Automated Reporting and Self-Optimization can detect potential problems before they can take place.AI leads to automated reporting and scheduling of work orders, that includes input of data into acomputerized maintenance management system (CMMS), as and when integration is required.
4. AI using IOT helps in integration virtually with any system that is interconnected. This can lead notonly to easy reporting but also can be stored and processed in cloud-based technologies, Therefore,IOT systems connected systems can combine with more systems and augment potential savings.
5. AI enhances inhabitant experiences by locating potential risks. Reduction in poor facilitiesmanagement can lead to higher profitability; it can result in reducing health problems, like severeallergies or uncomfortable work conditions.AI can smoothly recognize these risks in the same way asidentifying probable equipment malfunctions.
New opportunities can arise when AI facilitates recruiters by increasing hiring time more efficiently andmanaging candidate preliminary short listing and selection. Large datasets can be worked upon using machinelearning to perform tasks and gather insights, AI solutions can also provide necessary support during many diversestages of the recruitment process (https://medium.com/the-future-of-staffing/how-can-ai-help-staffing-agencies-cce8cce179e7).
AI tools can also be flexibly used for increasing human effectiveness and endeavor in the sourcing process.
•AI controlled Facility Operations
•AI managed Staffing
Gavesana Journal of Management / Vol. 11. Issue 1. January - June 2019. 21
Age of Transformation: Emergence of Artificial Intelligence for Manufacturing Industries

Software based solutions can provide help companies by writing suited job descriptions with languageanalysis and providing suitable recommendations for hiring outputs that the system has processed.
Chatbots using Natural language processing (NLP) is a foundational concept in AI. It refers to a machine'sability to create information based on analyzing human language. AI can be applied to gather highly specificinformation from visual data. Statements and facial expressions can be analyzed to give recruiters data aboutpotential dishonesty or emotions like contempt or surprise (interview process using skype). Subjective factors likeculture fit are still too difficult for computers to interpret, and there are still many developments to be made in naturallanguage processing and sentiment analysis. AI is, however, still improving rapidly thanks to the constantgeneration of new data in the world (https://medium.com/the-future-of-staffing/how-can-ai-help-staffing-agencies-cce8cce179e7)
Figure 2. Growth prediction of AI in the year 2035 (Source:
As seen in figure 2, forecasts have been made for different sectors including manufacturing sector where growthforecast without AI stands at $73.3 US billion. With AI, manufacturing forecasts have been made to around $32.8US billion i.e. an additional 44.74% of the base estimate. An area where the impact is already visible is qualityassurance where computer visualization enhancements using AI algorithms are detecting product defects withgreater efficiency. Another important aspect can be to detect efficiency of factory employees with accuracy forcompensation determination. Also, factory workers can gather raw materials from the shelf with automatic stockrecording and updation without any manual process been involved.AI is also capable of tracking causes and reasonsby analyzing variety of data captured using IoT. This can lead to generation of new ideas and unimaginable solutionsfor manufacturing and logistical problems.
Since a long time, funding has always been a critical issue forAI research.Although, in the initial stage of 1960s theAI concept could not proceed more than just a concept, recent trends indicate massive funding fueled from highgrowth potential companies and emerging AI based startups are optimistic in redesigning of the industrial
4. B. Trends of AI in Manufacturing
4. C. Funding inAI Research in Manufacturing
https://www.plantautomationtechnology.com/articles/the-future-of-artificial-intelligence-in-manufacturing-industries
22. Gavesana Journal of Management / Vol. 11. Issue 1. January - June 2019.
Age of Transformation: Emergence of Artificial Intelligence for Manufacturing Industries
framework. In 2017, around US$12 billion of venture funds raised in US and Chinese companies. Based in Japan,Softbank managed to gather US$100 billion, from many international investors, which also included SaudiArabianinvestors. US companies have also raised US$1.2 billion with silicon valley's VC funds. Chinese startup,SENSETIME also garnered more than US$1.2 billion with additional US$1 billion also being raised up(https://medium.com/cognilytica/the-race-for-ai-dominance-is-more-global-than-you-think-e01a0c34d64e).
The two major powerhouses in AI have been China and USA. On one hand, China has multi billion dollarcompanies such Alibaba, baidu, Tencent and Huawei technologies which are heavily interested and continue toinvest huge funds inAI research. These companies have received healthy support from their own government whichhas already embraced the use of facial recognition. On the other Side, the US companies such as Google,Microsoft, IBM, facebook, Amazon, Apple, and other firms have phasewise invested trillions of dollars into AIresearch (https://medium.com/cognilytica/the-race-for-ai-dominance-is-more-global-than-you-think-e01a0c34d64e).
Some of the major findings of this research can be summarized as follows:
1. AI- based Maintenance Systems, AI- controlled Supply Chain Management, Automated YieldOptimization usingAI, Fault Detection / QAAutomation using AI,AI controlled Facility Operations,AI managed Staffing are some of the major areas of manufacturing where continuing research isgoing on in the field ofAI.
2. Manufacturing withAI shows a major boost in manufacturing production as seen in figure 2 ( almost44 %).
3. Funding for AI is on ever increasing rate, with global powers like US, China, Japan integrating AIresearch as a part of their future transformational plan.
4. The future prospects of AI have just begun with more major and significant transformation ofmanufacturing sector yet to be seen in India and worldwide.
In India, AI implementation can start with Make in India program as has been initiated by government of India. Itmust generate special advantages for manufacturers, that can include soothing rules and regulations along withremoving trade barriers, so that the following can be achievable:
• More investments are needed in automation research within the country by building special researchlaboratories and engineering design studios in next two to three years.
• They must initiate region-based innovation clusters, districts, and corridors by structuring strongnetworks around manufacturing automation and robotics between educational universities and newbusinesses in India.
• They must raise ideas to make India a global center for machine intelligence based innovation inmanufacturing and allied areas. Larger MNC's should work on PPP (public –private partnerships) toalign AI implementation policies with actual implementable plans to be carried out by privatecompanies.
We know that our current research is based on secondary sources which highlights the prospect of AI inmanufacturing and allied areas. In future, one may try to conduct a much in depth analysis of the manufacturingsector that shall lead to understanding of certain areas of manufacturing and need for AI implementation in thoseareas.
I. Research Findings and Conclusion
II. Suggestions
III. Future Work
Gavesana Journal of Management / Vol. 11. Issue 1. January - June 2019. 23
Age of Transformation: Emergence of Artificial Intelligence for Manufacturing Industries
IV. References
1. Ambite, J. L. and Knoblock, C. A., Planning by rewriting, Journal ofArtificial Intelligence Research,Vol. 15, pp.207-261, 2001.
2. Balazinski, M., Czogala, E., Jemielniak, K. and Leslie J., Tool condition monitoring using artificialintelligence methods, Engineering Applications of Artificial Intelligence, Vol. 15, Issue 1, pp.73-80,2002.
3. Barzilay, R., Elhadad, N. and McKeown K. R., Inferring strategies for sentence ordering inmultidocument news summarization, Journal of Artificial Intelligence Research, Vol. 17, pp.s 35-55,2002.
4. Barzilay, R., Elhadad, N. and McKeown K. R., Inferring strategies for sentence ordering inmultidocument news summarization, Journal of Artificial Intelligence Research, Vol. 17, pp.s 35-55,2002.
5. Baxter, J. and Bartlett, P. L., Infinite-horizon policy-gradient estimation, Journal of ArtificialIntelligence Research, Vol. 15, pp.319-350, 2001.
6. Baxter, J. and Bartlett, P. L., Infinite-horizon policy-gradient estimation, Journal of ArtificialIntelligence Research, Vol. 15, pp.319-350, 2001.
7. Becker, A., Bar-Yehuda, R. and Geiger, D., Randomised algorithms for the loop cutset problem,Journal ofArtificial Intelligence Research, Vol. 12, pp.219-234, 2000
8. Brooks, R. A., Cambrian Intelligence: The early history of the new AI. Kyberntes: The InternationalJournal of Systems & Cybernetics, Vol. 39 No. 1., 2001.
9. Chen, X. and Van Beek, P., Conflict-directed backjumping revisited, Journal ofArtificial IntelligenceResearch, Vol. 14, pp.53-81, 2001.
10. Darwiche, A. and Marquis, P., A knowledge compilation map, Journal of Artificial IntelligenceResearch, Vol. 17, pp.229-264, 2002.
11. Eiter, T., Faber, W., Leone, N., Pfeifer, G. and Polleres, A., Answer set planning under action costs,Journal ofArtificial Intelligence Research, Vol. 19, pp.25-71, 2003.
12. Finkelstein, L., Markovitch, S., Rivlin, E., Optimal schedules for parallelising anytime algorithms:The case of shared resources, Journal ofArtificial Intelligence Research, Vol. 19, pp. 73-138, 2003.
13. Gamberger, D. and Lavrac, N., Expert-guided subgroup discovery: Methodology and application,Journal ofArtificial Intelligence Research, Vol. 17, pp.501-527, 2002
14. Gao, Y. and Culberson, J., An analysis of phase transition in NK landscapes, Journal of ArtificialIntelligence Research,Vol. 17, pp.309-332, 2002.
15. Goyache, F., Artificial intelligence techniques point out differences in classification performancebetween light and standard bovine carcasses. Meat Science, Vol. 64, Issue 3, pp.219-331, 2003.
16. Grunwald, P. D. and Halpern, J.Y., Updating probabilities,Vol. 19, pp.243-278, 2003.
17. Guestrin, C., Koller, D., Parr, R. and Venkataraman, S., Efficient solution algorithms for factoredMDPs, Journal ofArtificial Intelligence Research, Vol. 19, pp.399-468, 2003.
18. Halal, W. E., Artificial intelligence is almost here, On the Horizon - The Strategic Planning Resourcefor Education Professionals, Vol. 11, No. 2., 2003.
24. Gavesana Journal of Management / Vol. 11. Issue 1. January - June 2019.
Age of Transformation: Emergence of Artificial Intelligence for Manufacturing Industries

19. Hong, J., Goal recognition through goal graph analysis, Journal of Artificial Intelligence Research,Vol. 15, pp.1-30, 2001.
20. Lin, F., Compiling causal theories to successor state axioms and STRIPS-like systems, Journal ofArtificial Intelligence Research, Vol. 19, pp.279-314, 2003.
21. Masnikosa, V. P., The fundamental problem of an artificial intelligence realisation, Kybernetes, Vol.27, No. 1., 1998.
22. Metaxiotis, K., Ergazakis, K., Samouilidis, E. and Psarras, J., Decision support through knowledgemanagement: the role of the artificial intelligence. Information Management & Computer Security;Vol. 11 No. 5., 2003.
23. Niti.gov.in. (2018). National Strategy-for-AI-Discussion-Paper. [online] Available at:https://niti.gov.in/writereaddata/files/document_publication/NationalStrategy-for-AI-Discussion-Paper.pdf?utm_source=hrintelligencer [Accessed 25 May 2019].
24. Patel-Schneider, P. F. and Sebastiani, R., A new general method to generate random modal formulaefor testing decision procedures, Journal of Artificial Intelligence Research, Vol. 18, pp.351-389,2003.
25. Peng Y. and Zhang X., Integrative data mining in systems biology: from text to network mining,Artificial Intelligence in Medicine, Vol. 41, No. 2, pp.83-86, 2007.
26. Raynor, W. J., The international dictionary of artificial intelligence. Reference Reviews, Vol. 14 No.6., 2000.
27. Singer, J., Gent, I. P. and Smaill, A., Backbone fragility and the local search cost peak, Journal ofArtificial Intelligence Research, Vol. 12, pp.235-270, 2000.
28. Stefanuk, V. L. and Zhozhikashvili,A. V., Productions and rules in artificial intelligence, Kybernetes:The International Journal of Systems & Cybernetics, Vol. 31 No. 6., 2002
29. Stone, P., Littman, M.L., Singh, S., Kearns, M., ATTAC-2000: An adaptive autonomous biddingagent, Journal ofArtificial Intelligence Research, Vol. 15, pp. 189-206, 2001.
30. Stone, P., Schapire, R. E., Littman, M. L., Csirik, J.A. and McAllester, D., Decision-theoretic biddingbased on learned density models in simultaneous, interacting auctions, Journal of ArtificialIntelligence Research, Vol. 19, pp.209-242, 2003.
31. Tay, D. P. H. and Ho, D. K. H.,Artificial intelligence and the mass appraisal of residential apartments,Journal of Property Valuation and Investment, Vol. 10 No. 2., 1992.
32. Tennenholtz, M., Competitive safety analysis: Robust decision-making in multi-agent systems,Journal ofArtificial Intelligence Research, Vol. 17, pp.363-378, 2002.
33. Kim, S. M., Irrelevance and relevance of Godel's theorems to artificial intelligence. Kybernetes, Vol.24, No. 4., 1995. [88] Kim, S. W. and Kim, S. M., Turing-computability and artificial intelligence:Godel's incompleteness results. Kybernetes,Vol. 24 No. 6., 1995.
34. Kim, S. W. and Kim, S. M., Turing-computability and artificial intelligence: Godel's incompletenessresults. Kybernetes, Vol. 24 No. 6., 1995.
35. Wang S., Wang Y., Du W., Sun F., Wang X., Zhou C. and LiangY.,Amulti-approaches-guided geneticalgorithm with application to operon prediction, Artificial Intelligence in Medicine, Vol. 41, No. 2,pp.151-159, 2007.
Gavesana Journal of Management / Vol. 11. Issue 1. January - June 2019. 25
Age of Transformation: Emergence of Artificial Intelligence for Manufacturing Industries
36. Wiewiora, E., Potential-based shaping and Q-value initialization are equivalent, Journal of ArtificialIntelligence Research, Vol. 19, pp.205-208, 2003.
37. Wilkins, D. E., Lee, T. J. and Berry, P., Interactive execution monitoring of agent teams, Journal ofArtificial Intelligence Research, Vol. 18, pp.217-261, 2003.
38. Wongpinunwatana, N., Ferguson, C. and Bowen, P., An experimental investigation of the effects ofartificial intelligence systems on the training of novice auditors. ManagerialAuditing Journal, Vol. 15No. 6., 2000.
39. Zanuttini, B., New polynomial classes for logic-based abduction, Journal of Artificial IntelligenceResearch, Vol. 19, pp.1-10, 2003.
40. Zhou X., Liu B., Wu Z. and Feng Y., Integrative mining of traditional Chines medicine literature andMEDLINE for functional gene networks, Artificial Intelligence in Medicine, Vol. 41, No. 2, pp.87-104, 2007
41. http://blog.qsifacilities.com/artificial-intelligence-in-facilities-management
42. https://www.brookings.edu/research/how-artificial-intelligence-is-transforming-the-world/
43. https://cis-india.org/internet-governance/ai-and-governance-case-study-pdf
44. https://www.cloudtp.com/doppler/hot-topics/ai-is-here-and-it-will-change-everything/
45. https://dzone.com/articles/ai-in-test-automation
46. https://www.forbes.com/sites/stevebanker/2019/01/01/20-things-to-know-about-artificial-intelligence-for-supply-chain-management/#279520e75371
47. https://www.iflexion.com/blog/ai-manufacturing
48. http://www.mantenimientopetroquimica.com/en/rcm/144-articles-of-interest/100-what-is-predictive-maintenance.html
49. https://medium.com/cognilytica/the-race-for-ai-dominance-is-more-global-than-you-think-e01a0c34d64e
50. https://medium.com/the-future-of-staffing/how-can-ai-help-staffing-agencies-cce8cce179e7
51. https://www.plantautomation-technology.com/articles/the-future-of-artificial-intelligence-in-manufacturing-industries
52. https://www.softwebsolutions.com/resources/qa-automation-consulting-services.html
53. https://www.weforum.org/agenda/2016/01/the-fourth-industrial-revolution-what-it-means-and-how-to-respond/
26. Gavesana Journal of Management / Vol. 11. Issue 1. January - June 2019.
Age of Transformation: Emergence of Artificial Intelligence for Manufacturing Industries

A Fast Heuristic Method for the Job shop Scheduling Problem withMakespan Objective
Dr. Pritibhushan Sinha*
Abstract
In this paper, a heuristic solution method for the job shop scheduling problem, with the objective of makespan, issuggested. The method is based on an optimal result, for a single machine sequencing problem. With such a priorityrule, a special type of perturbations is combined. Experimental results show satisfactory performance of theheuristic method, in terms of being near to an optimal solution. Moreover, the heuristic method has a worst casepolynomial bound on time requirement and is quite fast on average.
Job shop Scheduling, Makespan, Heuristic Method, Solution Efficiency & Speed
Scheduling problems are important for manufacturing or service organizations, trains and other vehiclesscheduling, computer systems designing, etc. An important type of scheduling problems is the general job shopscheduling (see, e.g., Blazewicz et al. 1996, Pinedo 2002). In it, there are n jobs and m machines. Every job has arequired route, through the machines. There can be various objectives as makespan, number of jobs completedwithin due dates, total of tardiness, total of lateness, etc. Other conditions as sequence-dependant processing times,uncertainty, and others, may give many variants. In this paper, we consider the standard job shop problem, withmakespan as the objective. Makespan is the time in which all the operations of the jobs are completed. We maydescribe the problem in a more specific way as in the succeeding.
There are m machines, indexed as = 1, 2, …, m; there are n jobs, indexed as = 1, 2, …, . Every job has a route,possibly different from that of other jobs, through the machines. A route may be considered as an ordered set,
elements of which are integers, . The time requirement of the operation or processing of the job on
the machine is denoted as ( 0). An operation once started on a machine cannot be interrupted. A machine
cannot do more than one job at a time. If the operation of a job is completed on a machine, it waits before the nextmachine (or, somewhere as suitable), as required in its route, and is started at the earliest possible time point possiblein that machine. Transfer or loading/unloading of a job does not require any time. All the machines and the jobs areready initially. Let denote the makespan of a schedule, which specifies a sequence of jobs for every machine. It isthe sequence in which the machine processes the jobs. A schedule that minimizes has to be determined. A linearinteger programming (ILP) formulation of the problem may be as in the succeeding (see, e.g., Applegate and Cook1991). It is considered in it, without loss of generality, that every job is to be processed on all the machines. Wedenote it as ILP1.
Minimize M
Subject to,
x + p , if l-th machine is immediately after the machine in the route of job;
+A x + p , , , , < ;
+ p x +A(1 - ), , , , < ;
Keywords:
1. Introduction
i j n
k, 1 k m j-th
i-th p
MM
x k-th j-th
x y i j q j q
x y i j q j q
≤ ≤
≥
≥
≥
≤
ij
lj kj kj
ijq iq iq
ij ij iq ijq
lj ∀ ∀ ∀
∀ ∀ ∀
*West Bengal, E-mail: [email protected]
Gavesana Journal of Management / Vol. 11. Issue 1. January - June 2019. 27

x + , , ;
0, i, ;
= 1 or 0, , , , < .
Here, in addition to other symbols, denotes the time j-th job is started in the machine. A is a sufficiently large
number, which may be an upper bound of the optimal makespan. implies job precedes job in the
machine; = 0, otherwise.
The problem, which is strongly NP-hard (see, e.g., Lawler et al. 1993), is difficult to solve. There are somesolution methods, as discussed in the literature, of the job shop scheduling problem with makespan as the objective.The problem may be solved exactly with solving the preceding ILP formulation, or other such formulations, withbranch & bound (B & B) or cutting plane methods (see, for instance, Applegate and Cook 1991). Dynamicprogramming also has been discussed by Grromicho et al. (2012) as an exact method for the problem. However,exact methods may take prohibitively large time, even for moderate instances.As such, in practical situations, oftenheuristic methods, which do not take much time, only are possible to be used. Some heuristic methods are based onpriority (or, dispatch) rules. A priority rule is a rule, used to resolve conflicts and schedule the processings on themachines. Giffler and Thompson (1960) have given such a method, which has been used often. The method usessimple randomization as the priority rule, though. In the method, many sub-optimal schedules are avoided; yet, itmay not be quite time efficient, particularly for large instances. Another heuristic method for the present problem isthe “shifting bottleneck heuristic,” first given by Adams, Balas and Zawack (1988), and the original methodmodified by other researchers (for instance, Carlier and Pinson 1989) later. However, such a heuristic method maytake much time too, and may not even give a feasible solution sometimes. Meta-heuristics as simulated annealing(e.g., Laarhooven et al. 1992), tabu search (e.g., Nagata and Ono 2018, Taillard 1994, Zhang 2008), geneticalgorithms (e.g., Al-Hakim 2001, Spanos et al. 2014), which use random searches in different ways essentially andswitch to relatively worse solutions sometimes, have been suggested. The performance, with reference to solutionefficiency, has been observed empirically to be satisfactory for such methods. Allowed sufficient time (often lesscompared to exact methods), such a method, designed well, should get an optimal or a near optimal solution, formost of the practical instances. However, such methods have high theoretical worst case time bound, or, lack aprovable such a bound.
In this paper, we suggest a heuristic solution method for the problem. The method is based on an optimal singlemachine sequencing result. Application of the result as a priority rule seems to work quite effectively. We also userandom perturbations or search in the method. Combination of these gives good empirical results, for the instances,which may be considered to appear frequently in practical contexts. When time requirement is important, themethod should be highly suitable.
We organize the rest of the paper in this way. First, the single machine result is given. In the next section, wedescribe the present heuristic method. Following, the numerical experiment and the experimental observations aredescribed. We conclude with a discussion of some relevant important issues.
We give an optimal result, which we use subsequently, for a single machine sequencing problem.
We consider a single machine problem, which may be described in this way. There are n jobs, each of which is to be
processed in a machine. The job has the processing time requirement of pi ( 0). After the processing in the
machine, a job spends a time of qi ( 0) in the system (in an alternative description, is processed by another machine,
such machines being different for each job). The latter additional times may be, for example, cooling times. Everyjob has the same release date, so that it may be considered that all jobs are ready in the beginning. The machine, too,is ready at the beginning. We consider the objective of makespan, the time at which all jobs have been completed,and it is to be minimized.Amore generalized version of the problem, where every job may not have the same release
M p i j
x j
y i j q j q
x i-th
y = 1 j-th q-th i-th
y
i-th
≥
≥
≥
≥
ij ij
ij
ijq
ij
ijq
ijq
∀ ∀
∀ ∀
∀ ∀ ∀
2.AResult on Single Machine Sequencing
28. Gavesana Journal of Management / Vol. 11. Issue 1. January - June 2019.
A Fast Heuristic Method for the Job shop Scheduling Problem with Makespan Objective
date is NP-hard (Carlier 1982, Garey, and Johnson 1978). We give an efficient solution method for the problem thatwe consider.
Suppose, there are 2 jobs. Job 1 is processed first. Then, job 1 is completed on ( ) and job 2 on ( ).The makespan is max{( ), ( )}. If job 2 is processed first, makespan is max{( ), (
)}. If ( ) ( ) and , processing job 1 first minimizes the makespan. If ( ) ( )
and , processing job 2 first minimizes the makespan. Thus, for 2 jobs, sequencing according to descendingorder of values minimizes makespan. If , any of the jobs can be placed first. When there are jobs, if, in thesequence, an immediately preceding job has larger , by interchanging the two adjacent jobs, one gets a solution thathas makespan equal or less. So, there exists an optimal solution where the jobs have values in the descending order.Furthermore, if two adjacent jobs have the same , interchanging the positions of the jobs, we get a solution with thesame makespan. Thus, an optimal sequence is obtained by scheduling the jobs in the descending order of thevalues, breaking any ties arbitrarily.
Example 1: Suppose there are 5 jobs. Processing times and cooling times are as (10, 6), (12, 6), (9, 7), (10, 5), (5, 4).(First number in () is processing time, the second is the cooling time.) All jobs are ready at the beginning. Then, anoptimal sequence is job 3 - job 1 - job 2 - job 4 - job 5 (job 3 is processed first, then job 1, etc.). Optimal makespan is50.
Example 2: We consider the same example as above, but there are different job release dates. The release dates areincluded as the third number, (10, 6, 7), (12, 6, 8), (9, 7, 5), (10, 5, 6), (5, 4, 7). Every release date is 5 or larger. Weignore the release dates and get an optimal solution, which may be the earlier sequence. We see that, if theprocessings start at time = 5, the release date is on or before the start time, for each job. So, the sequence is optimal,even considering the release dates. In some instances of the problem, we may obtain an optimal solution, even if therelease dates are not the same, with the method.
In the method, n numbers are to be sorted only. So, the computational complexity of the method is O(n ), orwith a more efficient search O( ).
We use the preceding result in the heuristic method for the jobshop scheduling problem for intuitive reasons that areclear. Indeed, it does not guarantee an optimal solution for the problem. The heuristic method may be described inthis way.
Initialization: Iteration = 1. Best Solution =Asufficiently large number
Step 1. For Iteration > 1, assign weights to the jobs according to the completion (finish) times in the precedingsolution. The largest completion time job gets the highest weight (randomly distributed in [1, 6)), and the weightdecreases linearly with rank of completion time, the minimum completion time job having the weight of 1.0. Breakties according to job indices, with less index having higher priority. For Iteration = 1, all weights are 1.0.All jobs andmachines are ready at the start of an iteration.
Step 2. Check which machines and which jobs are ready for the next processing.
Step 3. For any machine, which is ready, consider the jobs which are ready and for which the next operation is on thismachine. For each one of such jobs, multiply its (total processing time still left – processing time on this machine)with the weight assigned. (If it is the last operation for the job, the value, thus, is zero.). Take the job, which has thehighest this value and place the job on the machine. Ties are broken according to job index, with lesser index jobbeing given higher priority. The job and the machine that are scheduled are set not ready.
Step 4. Consider the completion times of all jobs placed on machines. Calculate the minimum of these.All machines
Solution Method (Single Machine Sequencing)
3. Heuristic Method for Makespan Job Shop Scheduling
Heuristic Method
p1+q1 p1+p2+q2p1+ q1 p1+ p2+ q2 p2+q2 p2+ p1+
q1 p1 + q1 p2 + q2 q2 q1 p1 + q1 p2 + q2
q2 > q1q q1=q2 n
qn q
n log n
≤ ≤ ≤
2
Gavesana Journal of Management / Vol. 11. Issue 1. January - June 2019. 29
A Fast Heuristic Method for the Job shop Scheduling Problem with Makespan Objective
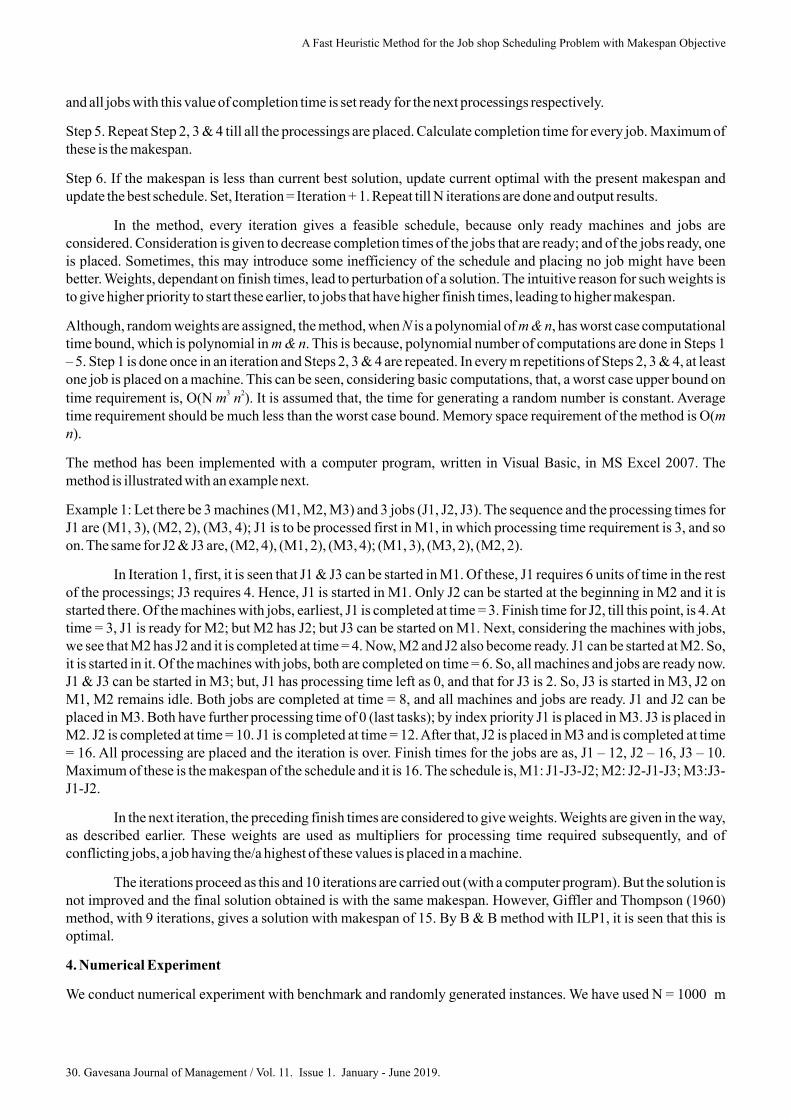
and all jobs with this value of completion time is set ready for the next processings respectively.
Step 5. Repeat Step 2, 3 & 4 till all the processings are placed. Calculate completion time for every job. Maximum ofthese is the makespan.
Step 6. If the makespan is less than current best solution, update current optimal with the present makespan andupdate the best schedule. Set, Iteration = Iteration + 1. Repeat till N iterations are done and output results.
In the method, every iteration gives a feasible schedule, because only ready machines and jobs areconsidered. Consideration is given to decrease completion times of the jobs that are ready; and of the jobs ready, oneis placed. Sometimes, this may introduce some inefficiency of the schedule and placing no job might have beenbetter. Weights, dependant on finish times, lead to perturbation of a solution. The intuitive reason for such weights isto give higher priority to start these earlier, to jobs that have higher finish times, leading to higher makespan.
Although, random weights are assigned, the method, when is a polynomial of , has worst case computationaltime bound, which is polynomial in . This is because, polynomial number of computations are done in Steps 1– 5. Step 1 is done once in an iteration and Steps 2, 3 & 4 are repeated. In every m repetitions of Steps 2, 3 & 4, at leastone job is placed on a machine. This can be seen, considering basic computations, that, a worst case upper bound on
time requirement is, O(N ). It is assumed that, the time for generating a random number is constant. Averagetime requirement should be much less than the worst case bound. Memory space requirement of the method is O(
).
The method has been implemented with a computer program, written in Visual Basic, in MS Excel 2007. Themethod is illustrated with an example next.
Example 1: Let there be 3 machines (M1, M2, M3) and 3 jobs (J1, J2, J3). The sequence and the processing times forJ1 are (M1, 3), (M2, 2), (M3, 4); J1 is to be processed first in M1, in which processing time requirement is 3, and soon. The same for J2 & J3 are, (M2, 4), (M1, 2), (M3, 4); (M1, 3), (M3, 2), (M2, 2).
In Iteration 1, first, it is seen that J1 & J3 can be started in M1. Of these, J1 requires 6 units of time in the restof the processings; J3 requires 4. Hence, J1 is started in M1. Only J2 can be started at the beginning in M2 and it isstarted there. Of the machines with jobs, earliest, J1 is completed at time = 3. Finish time for J2, till this point, is 4.Attime = 3, J1 is ready for M2; but M2 has J2; but J3 can be started on M1. Next, considering the machines with jobs,we see that M2 has J2 and it is completed at time = 4. Now, M2 and J2 also become ready. J1 can be started at M2. So,it is started in it. Of the machines with jobs, both are completed on time = 6. So, all machines and jobs are ready now.J1 & J3 can be started in M3; but, J1 has processing time left as 0, and that for J3 is 2. So, J3 is started in M3, J2 onM1, M2 remains idle. Both jobs are completed at time = 8, and all machines and jobs are ready. J1 and J2 can beplaced in M3. Both have further processing time of 0 (last tasks); by index priority J1 is placed in M3. J3 is placed inM2. J2 is completed at time = 10. J1 is completed at time = 12.After that, J2 is placed in M3 and is completed at time= 16. All processing are placed and the iteration is over. Finish times for the jobs are as, J1 – 12, J2 – 16, J3 – 10.Maximum of these is the makespan of the schedule and it is 16. The schedule is, M1: J1-J3-J2; M2: J2-J1-J3; M3:J3-J1-J2.
In the next iteration, the preceding finish times are considered to give weights. Weights are given in the way,as described earlier. These weights are used as multipliers for processing time required subsequently, and ofconflicting jobs, a job having the/a highest of these values is placed in a machine.
The iterations proceed as this and 10 iterations are carried out (with a computer program). But the solution isnot improved and the final solution obtained is with the same makespan. However, Giffler and Thompson (1960)method, with 9 iterations, gives a solution with makespan of 15. By B & B method with ILP1, it is seen that this isoptimal.
We conduct numerical experiment with benchmark and randomly generated instances. We have used N = 1000 m
N m&nm&n
m nm
n
3 2
4. Numerical Experiment
30. Gavesana Journal of Management / Vol. 11. Issue 1. January - June 2019.
A Fast Heuristic Method for the Job shop Scheduling Problem with Makespan Objective

n. We have implemented the heuristic method in Visual Basic in MS Excel 2007. A personal computer with 1.90GHz processor, 4.0 GB RAM and Windows 8.1 operating system is used for the experiment.
We solve 10 benchmark instances. The benchmark instances are taken from “OR-Library”<http://mscmga.ms.ic.ac.uk/info.html>. Such instances have been first presented, and frequently used later, inresearch articles related to the current problem. In these instances, every job is processed in all the machines. We usethe following index for solution quality.
Efficiency (%) = [1 – (SolutionValue – Optimal SolutionValue)/Optimal SolutionValue] 100.
For each instance, the method is used three times and the average Efficiency and time requirement is seen.Although,except for MT20, same solution is obtained in almost the same time in the three trials, for all instances. We also solvethese 10 instances with Giffler and Thompson (1960) method (abbreviated as GT Method subsequently). The samenumber of iterations is used for both the methods and GT Method is also applied three times for an instance. Theperformance of the methods is given in Table 1. We see that, with the present heuristic, in 2 instances optimalsolutions are obtained, in 7 instances Efficiency is above 95%, minimum Efficiency is 90.1%. The present heuristicshows higher average Efficiency than that of the GT Method, in all instances, except 2, which are of smaller sizerelatively.
We may also mention that, the present heuristic, in fact, has obtained the same or almost the same solutionswith N = m n (i.e., with about 1/1000 time), for all instances, except MT10. For this instance, average efficiency hasimproved by 3.3% (from 93.5% to 96.8%) with higher number of iterations.
4.1. Benchmark Instances
Gavesana Journal of Management / Vol. 11. Issue 1. January - June 2019. 31
A Fast Heuristic Method for the Job shop Scheduling Problem with Makespan Objective

Table 1: Performance of the Heuristic in some Benchmark Instances
4.2. Random Instances
First, we consider instances in which the jobs have different routes through the machines. In all the instances hereand afterwards, all jobs are processed in every machine. The processing times and the sequences are generatedrandomly (independently). The processing times have uniform distribution in [1, 6). We consider instances as, 3(machines) 6 (jobs), 3 10, 6 6, 6 10, 10 10, 10 15. In each case, 10 instances are solved. The solution quality, interms of Efficiency, is verified with respect to the solution as given by a B & B method with the ILP1 formulation.We use LINGO 17.0 to solve the ILPs. It has been observed that, the B & B method does not end even after 2 hours,for many instances that we have attempted. Often, solution obtained within that time is not an optimal solution; or,even if an optimal solution is reached the method goes on (as has been observed with some benchmark and someother instances). Seemingly, a B & B method with the ILP formulation is effective and conclusive only if number ofinteger variables is within 150. As such, we impose a time limit of 30 minutes and compare the best solution that isobtained within such time limit. For every instance, the heuristic method is applied only once. We give averagesolution efficiency and average solution time (for the 10 instances in each case). These are given in Table 2. Theperformance of the method is satisfactory; for example, optimal solutions have been obtained in all the instances for3 10 case.
S
No
Instance
Id
Instance
Size
Optimal
Makespan
Heuristic
Average
Efficiency
(%)
GT
Method
Average
Efficiency
(%)
Heuristic
Average
Time (s)
GT
Method
Average
Time (s)
1 LA1 5 ´ 10 666 100.0 97.6 20.2 32.8
2 LA2 5 ´ 10 655 91.1 91.2 22.2 33.0
3 LA7 5 ´ 15 890 100.0 96.1 57.0 100.2
4 MT20 5 ´ 20 1165 90.5 87.5 132.8 225.8
5 MT6 6 ´ 6 55 92.7 97.0 10.8 13.4
6 MT10 10 ´ 10 930 96.8 85.7 153.1 202.8
7 LA19 10 ´ 10 842 96.0 88.1 135.6 204.4
8 LA20 10 ´ 10 902 95.7 90.0 138.0 203.0
9 ABZ5 10 ´ 10 1234 97.3 91.6 134.1 204.1
10 ABZ6 10 ´ 10 943 96.4 90.0 128.1 204.4
32. Gavesana Journal of Management / Vol. 11. Issue 1. January - June 2019.
A Fast Heuristic Method for the Job shop Scheduling Problem with Makespan Objective

Table 2: Performance of the Heuristic Method in Random Job shop Instances
Next, we have considered randomly generated flow shop instances. A heuristic method for the jobshop problemshould also work well for the flow shop problem. We consider 3 8, 3 9, 3 10 flowshop instances. It is known that(e.g., Pinedo 2002), for the 3 machines case, with makespan as the objective, there exists a permutation schedule(i.e., every machine has the same sequence of the jobs) which is optimal. For such instances, we consider theperformance compared to an optimal solution obtained with exhaustive enumeration of all permutation schedules.10 instances in each case are examined. The results are given in Table 3(a). The heuristic method shows a notableperformance with many optimal solutions. Least Efficiency observed has been 91.9%, and it has occurred for a 3 8instance. We also consider flowshop instances as 4 10, 5 10, 6 10, with 10 instances in each case. Here, the solutionquality is considered with the best permutation schedule obtained with exhaustive enumeration. For the 4 10 case,
S
No
Instance
Size
Average
Efficiency
(%)
Number of
Matching
(or, Better)
Solutions
Average
Time (s) Remarks
1 3 ´ 6 99.6 9 2.2
B & B method obtained an
optimal solution in all cases
(often within 2 s)
2 3 ´ 10 100.0 10 6.4
All solutions same as of B & B
method; B & B method did not
end in 30 min in any instance
3 6 ´ 6 93.5 0 11.1
B & B method obtained an
optimal solution in all cases
(often within 2 s). Minimum
Efficiency of the heuristic
method 82.8%
4 6 ´ 10 98.2 4 32.1
B & B method did not end in 30
min in any instance
5 10 ´ 10 96.5 2 134.4
Heuristic solution better in one
instance; B & B method did not
end in 30 min in any instance
6 10 ´ 15 110.6 10 336.6
Heuristic solution better in all 10
instances; B & B method did not
end in 30 min in any instance
Gavesana Journal of Management / Vol. 11. Issue 1. January - June 2019. 33
A Fast Heuristic Method for the Job shop Scheduling Problem with Makespan Objective
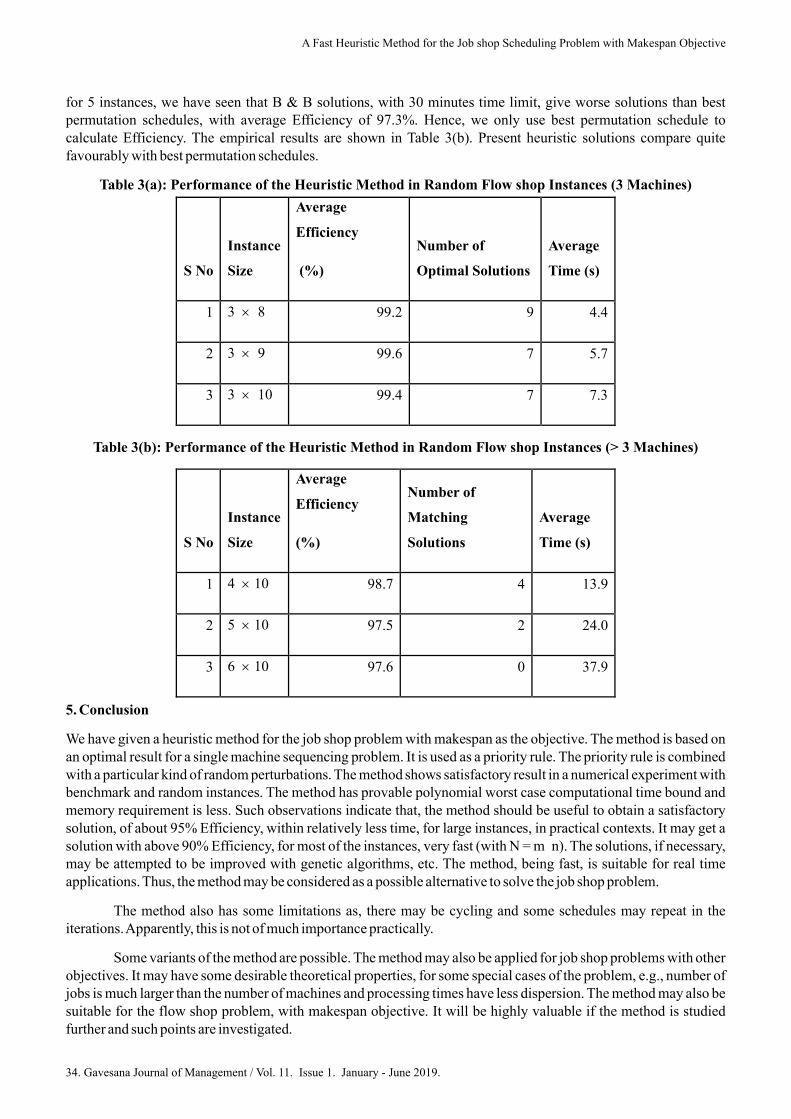
for 5 instances, we have seen that B & B solutions, with 30 minutes time limit, give worse solutions than bestpermutation schedules, with average Efficiency of 97.3%. Hence, we only use best permutation schedule tocalculate Efficiency. The empirical results are shown in Table 3(b). Present heuristic solutions compare quitefavourably with best permutation schedules.
We have given a heuristic method for the job shop problem with makespan as the objective. The method is based onan optimal result for a single machine sequencing problem. It is used as a priority rule. The priority rule is combinedwith a particular kind of random perturbations. The method shows satisfactory result in a numerical experiment withbenchmark and random instances. The method has provable polynomial worst case computational time bound andmemory requirement is less. Such observations indicate that, the method should be useful to obtain a satisfactorysolution, of about 95% Efficiency, within relatively less time, for large instances, in practical contexts. It may get asolution with above 90% Efficiency, for most of the instances, very fast (with N = m n). The solutions, if necessary,may be attempted to be improved with genetic algorithms, etc. The method, being fast, is suitable for real timeapplications.Thus, the method may be considered as a possible alternative to solve the job shop problem.
The method also has some limitations as, there may be cycling and some schedules may repeat in theiterations.Apparently, this is not of much importance practically.
Some variants of the method are possible. The method may also be applied for job shop problems with otherobjectives. It may have some desirable theoretical properties, for some special cases of the problem, e.g., number ofjobs is much larger than the number of machines and processing times have less dispersion. The method may also besuitable for the flow shop problem, with makespan objective. It will be highly valuable if the method is studiedfurther and such points are investigated.
Table 3(a): Performance of the Heuristic Method in Random Flow shop Instances (3 Machines)
Table 3(b): Performance of the Heuristic Method in Random Flow shop Instances (> 3 Machines)
5. Conclusion
S No
Instance
Size
Average
Efficiency
(%)
Number of
Matching
Solutions
Average
Time (s)
1 4 ´ 10 98.7 4 13.9
2 5 ´ 10 97.5 2 24.0
3 6 ´ 10 97.6 0 37.9
S No
Instance
Size
Average
Efficiency
(%)
Number of
Optimal Solutions
Average
Time (s)
1 3 ´ 8 99.2 9 4.4
2 3 ´ 9 99.6 7 5.7
3 3 ´ 10 99.4 7 7.3
34. Gavesana Journal of Management / Vol. 11. Issue 1. January - June 2019.
A Fast Heuristic Method for the Job shop Scheduling Problem with Makespan Objective

Acknowledgment
References
We thank very much Lindo Systems Inc., Chicago, USAfor a licence to use LINGO 17.0.
• Adams, J., Balas, E. and Zawack, D. 1988. The Shifting Bottleneck Procedure for Job Shop Scheduling,34, 391-401.
• Al-Hakim, L. 2001. An analogue genetic algorithm for solving job shop scheduling problems,39(1), 1537-1548.
• Applegate, D., Cook, W. 1991. A computational study of the job-shop scheduling problem,3(2), 149-156.
• Blazewicz, J., Domschke, W. and Pesche, E. 1996. The job shop scheduling problem: Conventional andnew solution techniques, 93, 1-33.
• Carlier, J. 1982. The One-machine Sequencing Problem,11, 42-47.
• Carlier, J., Pinson, E. 1989. An Algorithm for Solving the Job Shop Problem, 35,164-176.
• Garey, M. R., Johnson, D. S. 1978. Computers and Intractability: A Guide to the Theory of NP-Completeness, Freeman, San Francisco.
• Giffler, B., Thompson, G. L. 1960. Algorithms for solving production scheduling problems,8, 487-503.
• Grromicho, J. A. S.., Hoom, J. J., Saldanha-da-Gama, F. and Timmer, G.T. 2012. Solving the job-shopscheduling problem optimally by dynamic programming, 39(12),2968-2977.
• Laarhooven, P .J. M., Aarts, E. H. L. and Lenstra, J. K. 1992. Job Shop Scheduling by SimulatedAnnealing, 40(1), 113-125
• Lawler, E. L., Lenstra, J. K., Rinooy Kan,A. H. G. and Shmoys, D B. 1993. Sequencing and Scheduling:Algorithms and Complexity, [in:] Graves S. C., Rinooy Kan A. H. G, Zipkin P. H. (Eds.)
Volume 4: Logistics of Production and Inventory, NorthHolland,Amsterdam 1993, 445-522..
• Nagata, Y., Ono, I. 2018. A guided local search with iterative ejections of bottleneck operations for thejob shop scheduling problem, 90(2), 60-71.
• Pinedo, M. 2002. Scheduling (Theory,Algorithms and Systems), Prentice Hall, New Jersey.
• Spanos, A. C., Ponis, S. T. Tatsipoulos, I. P., Christou, I. T. and Rokou, E. 2014. A new hybrid parallelgenetic algorithm for the job-shop scheduling problem,
21(3), 479-499.
• Taillard, E. D. 1994. Parallel Taboo Search Techniques for the Job Shop Scheduling Problem,6(2), 108-117.
• Zhang, C., Li, P., Rao, Y. and Guan, Z. 2008. A very fast TS/ SA algorithm for the job shop schedulingproblem, 35(1), 282-294.
Management Science,
International Journal of ProductionResearch,
ORSAJournal ofComputing,
European Journal ofOperationalResearch,
European Journal of Operational Research,
Management Science,
OperationsResearch,
Computers & Operations Research,
OperationsResearch,
Handbook inOperationsResearchandManagement Science,
Computers andOperationsResearch,
International Transactions of OperationalResearch,
ORSAJournal onComputing,
Computers&OperationsResearch,
Gavesana Journal of Management / Vol. 11. Issue 1. January - June 2019. 35
A Fast Heuristic Method for the Job shop Scheduling Problem with Makespan Objective
Promoters Share Pledging: An Emerging Concern for Indian StockMarket Regulator
Mr. Pardhasaradhi Madasu*
Abstract
Pledging shares as collateral for borrowing is common for corporate entities. Till-date substantial academic researchhas been conducted on the various aspects of corporate borrowing. Several research studies in accounting andfinance domain have been conducted on multiple issues relating to corporate borrowings. In disparity, minimalresearch has been done on the various dimensions of promoters/insider-owners borrowing using the firm's shares ascollaterals (Asija, Marisetty, & Rangan). If the pledging of promoters shares is for short-term working capitalrequirement, it could not be considered as risk (Kumar, 2015). On the other hand if the corporate survives for longerduration on the funds raised through pledging of shares than it may be concern for market regulators. The presentshares pledged by promotes of Indian companies is raising alarm among stakeholders. The promoters of Indianlisted companies pledged more than INR 1.2 trillion worth of shares in FY 2018 – 19, 60 percent higher than FY2017 – 18. The upper-level pledging of shares by promoters has put both borrowers and lenders at risk (Xavier,2019).The ever increasing percentage of promoter shares being given as collateral has highlighted the risk involved.Pledging of firm's shares by promoters is one of the issues that is ever debated in the context of corporategovernance. Insiders' share pledging for bank loans is a long-standing corporate governance issue (Wang & Chou,2016). In this backdrop, the present paper provides an overview of promoter share pledging in Indian capital marketsand the perceived implications of these pledged deals.
Insider-owners, Promoters, Share Pledging, Collaterals, and Indian Capital markets.
Promoters (owner-managers) are the major shareholders who generally manage the strategic operations of the listedentities. Promotes being in-charge of the strategic decisions have to manage 'Funds' for business operations. In caseof scarcity of funds for business operations or investment (business acquisitions), the promoters raise funds bypledging the firm's shares as collateral. In a few cases, the pledge of shares may be for personal investment needs.Capital markets had also witnessed the promoters pledging of firm's shares to acquire and raise their shareholding inthe same company (creeping acquisitions). In India, the current regulations allow both resident and non-residentpromoters to pledge their shares. The trend of pledging of promoters holding varies across sectors. Promoterpledging of shares is higher in the case of infrastructure, engineering, and textiles sectors. Promoter's investment innew Greenfield projects by the pledging of shares could be seen more in the case of power and steel sectors (ETMarkets, 2019).
Pledging of shares by promoters group is not an unusual aspect. Corporate finance theory states thatpledging of shares by promoters for valid purposes could create value in the long-run with associated risks forinvestors in short-run. It is believed that shares of the listed firm with higher promoter pledging would experiencehigh volatility in their security prices, which in turn may lead to substantial losses to the investors (especially retailinvestors). The reason for such fluctuations in security prices is the fluctuations in the value of the collateral and theneed for pledging more shares or shell down cash to compensate the shortfall in the value of the collateral.
Three major category of lenders that accept shares of promotes as collateral are: a) banks, b) Non-BankingFinancial Companies (NBFCs) and c) mutual funds with debt schemes. Banks prudential norms would not allowlarger exposure of bank funds to specific sectors. In this scenario, NBFCs and mutual funds are the alternativesource of borrowing for promoters by giving their shares as collateral. Vasudevan (2019) states that cash-flushmutual funds and non-banking finance companies (NBFCs) dominant lenders to promoter groups. Out of the threemajor categories of lenders viz. banks, mutual funds and NBFCs, the significant risk of lending is faced by the
Keywords:
1. Introduction
*Associate Professor (Finance Area) Siva Sivani Institute of Management Email: [email protected]
36. Gavesana Journal of Management / Vol. 11. Issue 1. January - June 2019.

mutual funds. The risk faced by the mutual funds emerges from the fact that unit holders may seek redemption ofunits in a downward moving markets and the borrowers (promoters) could not meet the margin calls. In that kind ofscenario the fund managers have left with no option to off-load the shares held as collateral to meet the marginrequirements. This action could further worsen the situation. In recent past the Indian capital markets haveexperienced these situations. Considerable amount of volatility has been prevalent in case of few stock in the DalalStreet.
In the above stated backdrop, the present paper is aimed at providing an overview of the contemporary stateof affairs concerning the pledge of promoter's shares and associated implications that raise concern for regulators.
Under pledging of shares, promoters give their stake of shares as collateral for borrowed money. Lenders aregenerally commercial banks or non-banking financial institutions. Usually, the pledging of shares by promoters isdiscussed in light of corporate governance. Issue of promoters pledging the shares has been a long-standing problemconcerning the implementation of good governance. Lawmakers contended that pledged shares for bank loansreplicate the degree to which firm director's rise to leverage, explicitly in using less personal funds, to fight forcontrol rights. Regulators are concerned with situations where the promoters pledge shares when stock prices arehigh and then engage in riskier operations for higher returns to boost security prices (which are given as collateral),and further magnify the volatility of the firm value. On the contrary, the severe situation may be when promoterswho want the company to go down, do not repay the loans and exit. This leads to a fall in the stock prices, andminority shareholders would suffer (WangY. C., 2015).
In India, promoter share pledging came under regulatory study in January 2009 during the exposure ofSatyam scandal. Before the Satyam scandal, firms and their promoters were not required to disclose the existence ormagnitude of share pledges. SEBI has come out with disclosure requirement on January 28th, 2009, that mandatedpromoters and companies to disclose details of share pledging (Asija, Marisetty, & Rangan). The disclosures madeduring 2009 revealed that, but for a minority of high-profile conglomerates, practically every promoter of India's topcompanies has admitted to pledging shares for several years now. The predominant end-use of the funds raised waseither to increase the promoters' stakes in their respective companies or to give supplementary guarantees tofinanciers (especially banks) for loans taken (Verma, 2009).
Pledging of shares by promoters is legal and accepted as long as it serves the interests of all the stakeholdersin the firm. In many cases, promoters go overboard and pledge the shares without fully considering theconsequences, and Satyam episode is a classic case study. Bhasin (2013) in his article, mentions that the letter fromMr. Raju to his Board of Directors (BoD) clearly states the kind of fraud that was committed by giving promotersshares as collateral. The said letter indicated that the debacle of Satyam started only after the lenders started off-loading most of the shares held as collateral on account failure to meet the margin triggers.
Satyam corporate fraud has made the regulators monitor the risk involved in promoter's stake being used ascollateral. Usually, banks are the conventional lenders for the promoters on the pledged shares. In this regard, thebanking regulator Reserve Bank of India (RBI) expressed concerns over promoter's shares being accepted ascollateral. The Financial Stability Report (2013) expressed certain apprehensions over pledging of shares bypromoters. Because of the prevalence of promoters pledging a considerable portion of their shares, the subsequentleverage could be a concern not only for shareholders but also for the well-being of the financial system. Whenpromoter's shares are given as collateral, the promoters have no personal liability other than to the extent of theirpledged shares. In some instances, the shares pledged by unscrupulous promoters could go down in value, and thepromoters may not mind losing control of the company as there is a possibility of diversion of funds before the shareprices collapse (Reserve Bank of India, December, 2014).
The asset quality of banks is stressed due to the ever-increasing pledging of shares by promoters. The stressin corporate debt is also confirmed by data on the stocks pledged by promoters. The percentage of shares pledged bypromoters out of their holdings in all listed companies across NSE and BSE has shown a steadily increasing trendover the years. Among all NSE listed companies (including companies with no pledging), the percentage of
2.0 Review of Literature
Gavesana Journal of Management / Vol. 11. Issue 1. January - June 2019. 37
Promoters Share Pledging: An Emerging Concern for Indian Stock Market Regulator

promoter held shares pledged went up from 15.2 percent in March to 15.3 percent in June 2016. The correspondingnumbers were 13.8 per cent in December 2013, 14.4 percent in December 2014, and 14.8 percent in December 2015(Reserve Bank of India, December, 2016).
The promoter pledges data of 2019 is further interesting and provides lot of insights. Kant (2019) in hisnews article, quotes that the promoters have raised the number of shares pledged with their lenders as collateral forborrowing by 23 percent on a year-on-year (YoY) basis.At the end of the December 2018 quarter, promoters of BSE500 companies had pledged 15.7 billion equity shares, against around 12.8 billion equity shares at the end of theDecember 2017 quarter. In rupee terms, promoter-owned shares worth nearly Rs 2 trillion were pledged at the end ofthe December 2018 quarter, up 2.6 percent on aYOYbasis.
In the recent past, the concerns of the banking regulator RBI came turn concerning volatility in Indian stock-markets. During 2019 two significant incidents of market capitalization erosion relating to Reliance Group andEssel Group has once again raised regulatory concerns on promoters pledging shares. Loss in market capitalizationhas created substantial losses to the shareholders and has hampered the interests of other shareholders too. Pledgingof shares by promoters is increasingly becoming a significant corporate governance issue. In India, there are manycompanies where promoters have pledged a substantial percentage of their shares. Both RBI and SEBI, are puttingefforts to design a suitable policy to avert possible crises shortly (National Stock Exchange, February, 2019).
Shares being offered as collateral by promoters has its benefits from the perspective of owner-managers.For example, even after pledging the shares the promoters could exercise voting rights. However, the pledging ofshares could be used by promoters with fraudulent intentions such as pledging the shares when the assets of theovervalued. By pledging the shares, the promoters could be transferring the risk to the lenders. Promoters sharepledges involve many corporate governance issues.
By reviewing the existing body of knowledge, it could be stated that the research in the area of pledging ofshares by promoters and related implications is minimal. Focused academic and industry-sponsored studies arerequired in this direction.
The primary aim of this paper is to bring into focus the risks involved in high degree of promoter shares being offeredas collaterals. The paper is descriptive in nature and is expected to suit the objective of the paper.
Promoters pledging of shares even though legal, has its share of risk involved. Generally, if promoters of debt-burdened listed entities also go in for creating equity-backed bonds than the risk would increase. On January 27,2006, Securities and Exchange Commission (SEC) published a document recognizing that the share pledges of theCEO of WorldCom may have led to the fall of the company and solicited public feedback on regulating sharepledges by insiders. The report stated that share pledges might influence the incentives of insiders and, in turn, theirability to make optimal decisions (Singh, 2018).
Insider/promoters pleading can influence the value of the firm through several channels. First, regardless ofhow insiders use the proceeds of loan procured using shares a collateral, pledging of promoters stake increases acompany's exposure to adverse price movements. Since pledging signifies a margin loan secured by company stock,substantial price declines in the stock automatically trigger margin calls. Servicing these margin calls can be toughfor an insider since the preliminary motive for pledging is generally inferior liquidity. In case of no proper responseto margin calls, the lenders would sell off the stock which compounds the downward pressure on the stock price.This whole process leads to expansion of the left-tail of the stock's return distribution, thereby exposing theshareholders to credit risk (Dou, Masulis, & Zein, 2019).
On the face of it, the equity-backed bonds instruments look like a win-win situation for both the borrowerand the lender. Initially, the bonds are issued with a more significant equity-based collateral than the moneyborrowed and the margin calls on the instrument could be structured with a broader trigger level. This structuring
3.0 Aim and Methodology:
4.0 Discussion
38. Gavesana Journal of Management / Vol. 11. Issue 1. January - June 2019.
Promoters Share Pledging: An Emerging Concern for Indian Stock Market Regulator

could be beneficial for both the parties because an average fall in the value of the collateral would not trigger any top-up. On the other hand, if a sharp decline in the market value of the collateral and promotes non-ability to top-up themargins, the lenders would be forced to off-load the shares. This action by lenders would further erode the marketvalue of the shares.
As the financial markets are highly interconnected, the negative impact in one segment of the market couldspill over to the other sections and lead to massive wealth erosion. The point in discussion could be associated withthe latest happening in the Indian stock markets. Relevant cases for discussion are Essel Group and RelianceADAG.The recent instances have clearly emphasized the risk that is tagged with equity-backed bonds issued by promotergroups in India. The risk involved in equity-backed bonds is different from the loans granted by banks on shares ascollateral (Palepu, 2019).
Promoters share pledging being very much on rising in the Indian capital markets has made the marketregulators to re-assess the risks involved. In India and Taiwan, more than 20% of insiders pledged a significantportion of their shareholding. Recently, share pledges have caught the attention of regulators and participantsworldwide. Regulators in India, Singapore, U.S., and the U.K. start to mandate strict guidelines with promotes sharepledges. It is also reported that 49% of the institutional investors have considered that the pledging of shares byinsiders is problematic. However, the consequences of increased share pledge by insiders/promotes is not yetunderstood fully (Chan, Chen, Hu, & Liu, 2015).
The recent incidents in stock markets of a few of the emerging economies have put the market regulators onhigh alert. Not only the market regulators, but the financial analysts are also cautious of picking stocks of thosecompanies where the insider/promoter share pledging is increasing. In general, terms, if the promoters sharespledges cross 75% threshold over a period, it is considered as 'risky' investment. Regulators and investors are notonly concerned with the companies that have colossal promoter share pledges but also worried about mutual fundsschemes which have lent money to promoters based on equity-backed bonds. In extreme cases, when the marketprices of the pledged stocks fall and the mutual funds lack the liquidity to service the unit-holder's redemptiondemands that the situation deteriorates.
At the initial stage, the market regulators are trying to bring in stringent timely reporting norms. Quarterlydisclosures concerning promoters share pledges are considered to be not adequate. The time lag between the pledgesand consequent disclosures is expected to be narrowed down. Apart from the revelations, the valuation and creditrating of equity-backed bond instruments are to be made stringent. Finally, it would be apt if collective investmentschemes such as mutual funds are restricted from investing in these kind pledge instruments.
The paper focused on a topic which looks very simple on the face of it but has a lot of implications for both retail andinstitutional investors. The paper aimed to bring out the conceptual framework and risks involved in share pledgesby insiders (especially promoters). In the present day scenario, the article gains currency by the fact that high degreeof promoters shares being offered as collateral and the consequent fall in market prices would lead to fatalconsequences. Market regulators and players such as SEBI, SEC, proxy advisors, business media, and investmentconsultants are very concerned about this issue (Hwang, Qiao, & Ku, 2016). The recent incidents in Indian stockmarket that led to debates among mutual funds and NBFC industry leaders was an inspiration to this paper. Thetopic requires further deliberation and focused research using empirical data. The overall summary of the discussionis as follows:
Promoters or any other insider group are allowed to give their shares as collateral to procure loans. Pledgingof shares by insiders would be done because it has advantages like generating liquidity without losing control of thefirm. Pledging allows getting a low-cost loan on undervalued securities whose prices would escalate in the future.This practice is accepted all over the world. While this practice helps in overcoming the liquidity constraints facedby companies and promoters, the method may lead to adverse consequences if not monitored and controlled by themarket regulators (Larcker &Tayan, 2010).
5.0 Conclusion
Gavesana Journal of Management / Vol. 11. Issue 1. January - June 2019. 39
Promoters Share Pledging: An Emerging Concern for Indian Stock Market Regulator
In the recent past, the institutional investors who have invested in companies with high insider/promoterpledged shares had expressed concerns. Many of the proxy advisory firms have started to vote against the companieswhich have a considerable magnitude of aggregate pledged shares in terms of total common stock or market value ortrading volume. However, the threshold above which the pledged shares will lead to dissatisfaction among thestakeholders is not yet specified. The appropriate threshold of promoters share pledges could be decided based onfurther research.
Along with stringent disclosure guidelines, the market regulators are expected to come out with clearinstructions on aspects like a) What should be the threshold for insider/promoter share pledges, b) Whatcircumstances could be considered as appropriate for pledging of shares, c) Valuation issues, d) Prudential norms forlenders such as mutual funds and NBFCs for lending on equity-backed bonds and finally e) Mechanism to disclosethe risks involved in share pledges by insiders. These kind of guidelines are expected to protect the interest of theshareholders.
• Asija, A., Marisetty, V. B., & Rangan, S. (n.d.). Do Insiders Who Pledge Their Shares ManipulateReported Earnings? .
• Bang, N. P., Ray, S., Ramachandran, K., & Vishwanathan, A. (2018). Family Businesses: Promoters'Skin in the Game 2001 - 2017 (White Paper). Hyderabad: Thomas Schmidheiny Centre for FamilyEnterprise & ISB. Retrieved from www.isb.edu/fbwm
• Bhasin, M. (2013). Corporate Accounting Scandal at Satyam: A Case Study of India's Enron.1(12), 25 - 47.
• Chan, K., Chen, H. K., Hu, S. Y., & Liu, Y. J. (2015). Share Pledge and Margin Call Pressure.aeaweb.org.
• Dou, Y., Masulis, R. W., & Zein, J. (2019). Shareholder Wealth Consequences of Iniser Pledging ofCompany Stock as Collateral for Personal Loans. ECGI Working Paper Series in Finance. Retrievedfrom www. ecgi.global/content/working-papers
• ET Markets. (2019, February 17). Ind. Inc. Promoters Forced to Draw Loans by Pledging their Holdings.Economic Times.
• Hwang, A. L., Qiao, Y., & Ku, C. (2016). Pledge or Not Pledge? Shares Owned by Insiders Pledged forCollateral. 36 - 54.
• Kant, K. (2019, January 30). Promoters of BSE 500 Firms Raise Number of Pledged Shares by 23% in2018. Business Standard.
• Kumar, R. (2015, January 22). Promoters Pledging Shares Increases Risk. liveMint.
• Larcker, D. F., & Tayan, B. (2010). Pledge (and Hedge) Allegiance to the Company. Rock Center forCorporate Governance at Stanford University Closer Look Series: Topics, Issues and Controversies inCorporate Governance No. CGRP- 11.
• LarckeR, D. F., Tayan, B., & McCall, A. L. (2013). And Then A Miracle Happens!: How Do ProxyAdvisory Firms Develop Their Voting Recommendations? Rock Center for Corporate Governance atStanford University Closer Look Series: Topics, Issues and Controverises in Corporate Governance andLeadership No. CGRP- 31.
• Mudgill,A. (2019, February 13). Promoters Share Pledges: AreAll These 2,942 Stock Untouchable? ETMarkets. Retrieved from https://economictimes.indiatimes.com/markets/stocks/news/promoter-share-pledges-are-all-these-2942-stocks-untouchable/articleshow/67970682.cms
References
NSE-NYSEStern School of Business
EuropeanJournal of Business andSocial Sciences,
ChinaInternationalConference inFinance.
International Journal ofManagement Theory andPractice,
40. Gavesana Journal of Management / Vol. 11. Issue 1. January - June 2019.
Promoters Share Pledging: An Emerging Concern for Indian Stock Market Regulator
• National Stock Exchange. (February, 2019). Market Pulse. NSE.
• Palepu, A. R. (2019, February 21). Anil Ambani to Subhash Chandra - Promoter Debt Risk Ignored bySome Rating Agencies. Retrieved from https://www.bloombergquint.com/bq-blue-exclusive/anil-ambani-to-subhash-chandra-promoter-debt-risk-ignored-by-some-rating-agencies
• Reserve Bank of India. (December, 2014). Financial Stability Report - Trends and Progress of Bankingof India (2013 - 14) - Issue No. 10. RBI. Retrieved from http://www.rbi.org.in
• Reserve Bank of India. (December, 2016). Financial Stability Report (Issue No. 14). RBI. Retrievedfrom http://www.rbi.org.in
• Singh, P. (2018). The Inside Job: Share Pledges by Insiders and Earnings Management.
• Vasudevan, N. (2019, January 30). The Scourge of Promoters' Audacious Shares Pledges. Retrievedfrom ET Markets: https://economictimes.indiatimes.com/markets/stocks/news/the-scourge-of-promoters-audacious-share-pledges/articleshow/67749056.cms
• Verma,V. (2009, March). Why Pledging Got a Bad Name?
• Vyas, J. (2013, June 24). Promoters Use Market Slide to Raise Stake via. CreepingAcquisition Route. ETMarkets.
• Wang,Y. C. (2015). Pledge of Stock and Firm Value: Evidence from theAmendment of the CompanyActof Taiwan. Third Asia-Pacific Conference on Global Business, Economics, Finance and Banking.Retrieved from WWW.globalbizresearch.org
• Wang,Y. C., & Chou, R. K. (2016). The Impact of the Insider Share Pledge Regulations on Stock Tradingand Firm Valuation. Taipei, Taiwan: Department of Finance, National Chengchi University.
• Xavier, D. (2019, February 19). Why Dalal Street is Worried About Promoters Pledging Shares?Rediff.com. Retrieved from https://www.rediff.com/business/report/why-dalal-street-is-worried-about-promoters-pledging-shares/20190219.htm
Gavesana Journal of Management / Vol. 11. Issue 1. January - June 2019. 41
Promoters Share Pledging: An Emerging Concern for Indian Stock Market Regulator
Effective Strategic Talent Acquisition Process - A Conceptual Study
R. Anita*
Abstract
Recruiting and Talent acquisition are undergoing a rapid disruption and challenging the companies to attract theright talented individuals or re-recruit the employees every day. Organisation success largely depends on havingright people on the right job so that formulated business strategy can be implemented. Hence, the organisations thatimplement the talent acquisition strategy which are effective are the ones that are successful while the companiesthat have bad hires will result in reducing of profits. There is a great transformation from just recruitment to talentacquisition. Companies are embracing new technology advances like Artificial Intelligence, big data analytics andothers technologies to reduce the time of sourcing candidates and recruit skilled and talented candidates. This paperuses secondary data from various surveys retrieved from web sources. The study aims to understand the challengesand new trends of talent acquisition, experts' opinion on future talent acquisition process and suggests effectivestrategic talent acquisition process.
Talent acquisition, trends ofTalent acquisition, Challenges
Recruitment is generally used in synonymously with Talent acquisition but it is only a part rather subset of talentacquisition. The basic difference between Talent acquisition and recruitment is the focus. Recruitment focuses onthe present requirement of the company and does not check the person-job fit and only helps in getting the interestedpeople for the jobs that are available. Whereas Talent acquisition is a strategic approach and helps to find the bestperson for the job available. It means it includes from the future skills requirement to the organisational cultural fit.Hence, talent need to be acquired rather than recruited from long term or strategic point of view.
Talent Acquisition is the strategic method of identifying, attracting and selecting the best available skilled personand ensures that right person with the right skills, knowledge and aptitude is employed on the right job to meet thedynamic demands of the every changing business needs. Talent acquisition includes workforce planning, sourcingdecisions, employment branding, candidates relationship management and usage of metrics and analytics tocontinuously monitor and tracking of the candidates performance.
According to Flegley (2006), competition for attracting and retaining the talented personnel and lack of availablehigh skilled and talented employees has become a major priority for organizations.
As we all know that employees are the biggest asset of any company, hence one need to focus the kind of people to beattracted and recruited. The truth is people make the difference and when we do not have the right individual in rightplace the efficiency can dip. Hence, to gain competitive advantage people need to be motivated and be placed in rightjob as per their abilities. If the employees are not motivated they may fall sick frequently and may harm the ability tobe competitive. A recruiter or employer in the present competitive world can add value to the organisation bybuilding psychological bond and emotional connectivity with the employees and continuously building andstrengthening the employment brand.
Present organisation are now having attracting the right and quality talent as one of the main recruitment goal to gainmore competitive advantage. Effective talent acquisition is very important and crucial for any success of business asit saves time and cost. According to SHRM (2016) an effective talent acquisition strategy consists of six elements:employer branding, workforce planning, Sourcing and recruiting the right candidate, leverage of recruitingtechnology, an effective on-boarding programme and application of data analytics.
Keywords:
I. Introduction
*Associate Professor & Dean Academics, Department of Business Management St. Joseph's Degree & PGCollege Gunfoundry, Near Suryalok Complex, Hyderabad, Email id: [email protected]
42. Gavesana Journal of Management / Vol. 11. Issue 1. January - June 2019.
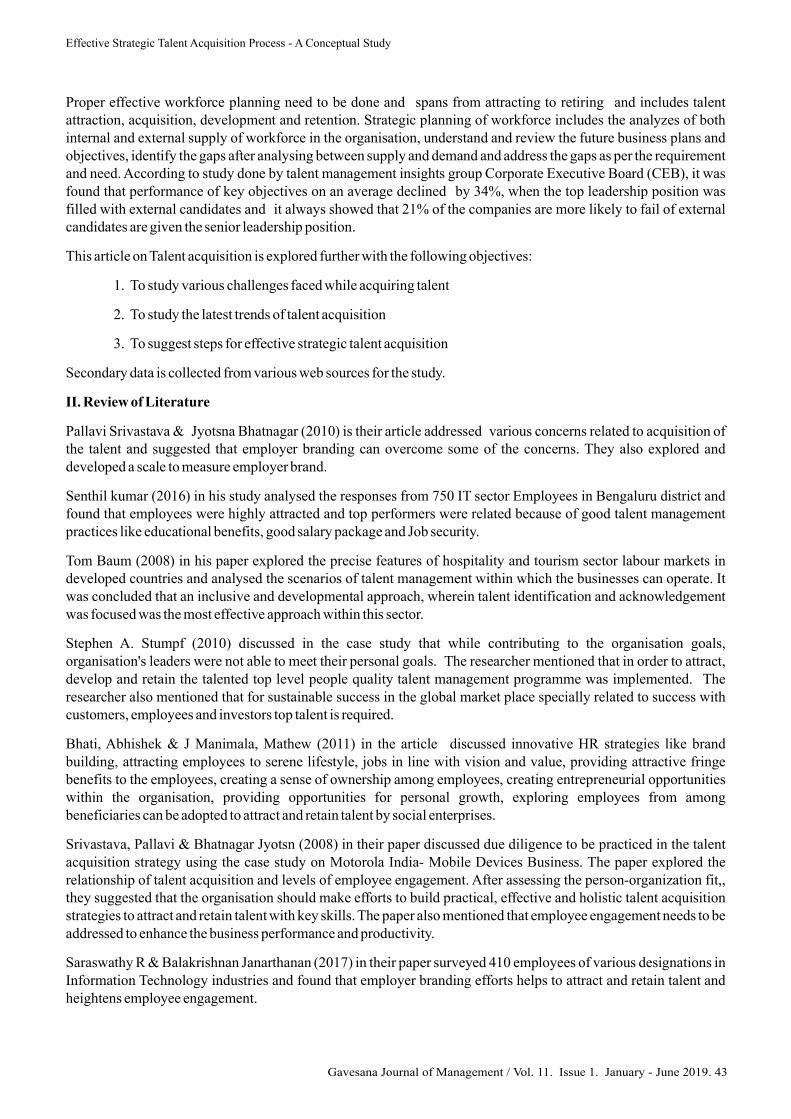
Proper effective workforce planning need to be done and spans from attracting to retiring and includes talentattraction, acquisition, development and retention. Strategic planning of workforce includes the analyzes of bothinternal and external supply of workforce in the organisation, understand and review the future business plans andobjectives, identify the gaps after analysing between supply and demand and address the gaps as per the requirementand need. According to study done by talent management insights group Corporate Executive Board (CEB), it wasfound that performance of key objectives on an average declined by 34%, when the top leadership position wasfilled with external candidates and it always showed that 21% of the companies are more likely to fail of externalcandidates are given the senior leadership position.
This article on Talent acquisition is explored further with the following objectives:
1. To study various challenges faced while acquiring talent
2. To study the latest trends of talent acquisition
3. To suggest steps for effective strategic talent acquisition
Secondary data is collected from various web sources for the study.
Pallavi Srivastava & Jyotsna Bhatnagar (2010) is their article addressed various concerns related to acquisition ofthe talent and suggested that employer branding can overcome some of the concerns. They also explored anddeveloped a scale to measure employer brand.
Senthil kumar (2016) in his study analysed the responses from 750 IT sector Employees in Bengaluru district andfound that employees were highly attracted and top performers were related because of good talent managementpractices like educational benefits, good salary package and Job security.
Tom Baum (2008) in his paper explored the precise features of hospitality and tourism sector labour markets indeveloped countries and analysed the scenarios of talent management within which the businesses can operate. Itwas concluded that an inclusive and developmental approach, wherein talent identification and acknowledgementwas focused was the most effective approach within this sector.
Stephen A. Stumpf (2010) discussed in the case study that while contributing to the organisation goals,organisation's leaders were not able to meet their personal goals. The researcher mentioned that in order to attract,develop and retain the talented top level people quality talent management programme was implemented. Theresearcher also mentioned that for sustainable success in the global market place specially related to success withcustomers, employees and investors top talent is required.
Bhati, Abhishek & J Manimala, Mathew (2011) in the article discussed innovative HR strategies like brandbuilding, attracting employees to serene lifestyle, jobs in line with vision and value, providing attractive fringebenefits to the employees, creating a sense of ownership among employees, creating entrepreneurial opportunitieswithin the organisation, providing opportunities for personal growth, exploring employees from amongbeneficiaries can be adopted to attract and retain talent by social enterprises.
Srivastava, Pallavi & Bhatnagar Jyotsn (2008) in their paper discussed due diligence to be practiced in the talentacquisition strategy using the case study on Motorola India- Mobile Devices Business. The paper explored therelationship of talent acquisition and levels of employee engagement. After assessing the person-organization fit,,they suggested that the organisation should make efforts to build practical, effective and holistic talent acquisitionstrategies to attract and retain talent with key skills. The paper also mentioned that employee engagement needs to beaddressed to enhance the business performance and productivity.
Saraswathy R & Balakrishnan Janarthanan (2017) in their paper surveyed 410 employees of various designations inInformation Technology industries and found that employer branding efforts helps to attract and retain talent andheightens employee engagement.
II. Review of Literature
Gavesana Journal of Management / Vol. 11. Issue 1. January - June 2019. 43
Effective Strategic Talent Acquisition Process - A Conceptual Study
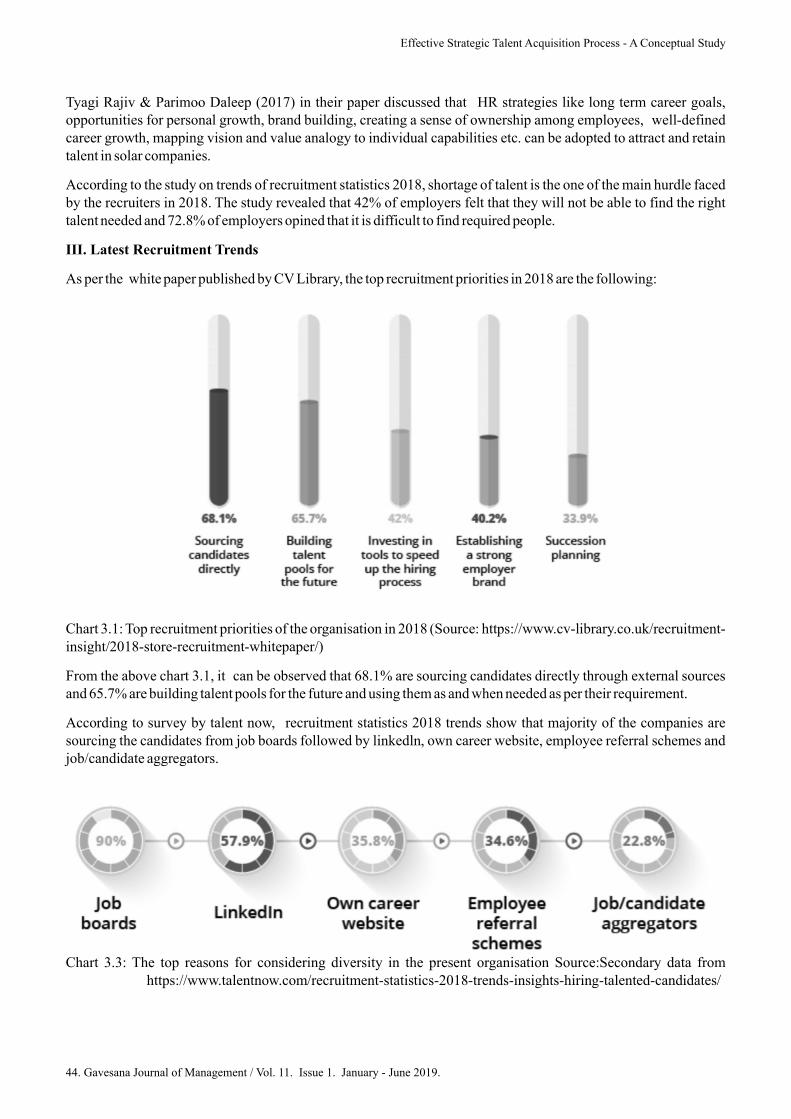
Tyagi Rajiv & Parimoo Daleep (2017) in their paper discussed that HR strategies like long term career goals,opportunities for personal growth, brand building, creating a sense of ownership among employees, well-definedcareer growth, mapping vision and value analogy to individual capabilities etc. can be adopted to attract and retaintalent in solar companies.
According to the study on trends of recruitment statistics 2018, shortage of talent is the one of the main hurdle facedby the recruiters in 2018. The study revealed that 42% of employers felt that they will not be able to find the righttalent needed and 72.8% of employers opined that it is difficult to find required people.
As per the white paper published by CV Library, the top recruitment priorities in 2018 are the following:
Chart 3.1: Top recruitment priorities of the organisation in 2018 (Source: https://www.cv-library.co.uk/recruitment-insight/2018-store-recruitment-whitepaper/)
From the above chart 3.1, it can be observed that 68.1% are sourcing candidates directly through external sourcesand 65.7% are building talent pools for the future and using them as and when needed as per their requirement.
According to survey by talent now, recruitment statistics 2018 trends show that majority of the companies aresourcing the candidates from job boards followed by linkedln, own career website, employee referral schemes andjob/candidate aggregators.
Chart 3.3: The top reasons for considering diversity in the present organisation Source:Secondary data fromhttps://www.talentnow.com/recruitment-statistics-2018-trends-insights-hiring-talented-candidates/
III. Latest Recruitment Trends
44. Gavesana Journal of Management / Vol. 11. Issue 1. January - June 2019.
Effective Strategic Talent Acquisition Process - A Conceptual Study

From the survey report of linkedIn Global Recruiting Trends 2018 it was observed that diversity, data analytics,adopting new interviewing tools and processes and use ofArtificial Intelligence were the top and latest trends.
Diversity means giving all equal opportunities irrespective of gender and ethnicityincluding candidates with disabilities and veterans.
From the above chart 3.3, it can be observed that organisations are going for diversity programme to improve theirculture and company performance.
According to Glasdoor 14.2 % of women hold leadership roles in S & P 500 companies and 4% black hold CEOsposition in the fortune 500 companies.
Organisations are adopting new interviewing tools andprocesses to assess overall skills and capabilities of a candidate in much lesser time.
1. Diversity:
Chart 3.3: The top reasons for considering diversity in the present organisation Source:Secondary datafrom https://www.talentnow.com/recruitment-statistics-2018-trends-insights-hiring-talented-candidates/
2. New interviewing tools and processes:
Chart 3.4: Where traditional interviews fail, Source:https://www.talentnow.com/recruitment-statistics-2018-trends-insights-hiring-talented-candidates/
Gavesana Journal of Management / Vol. 11. Issue 1. January - June 2019. 45
Effective Strategic Talent Acquisition Process - A Conceptual Study
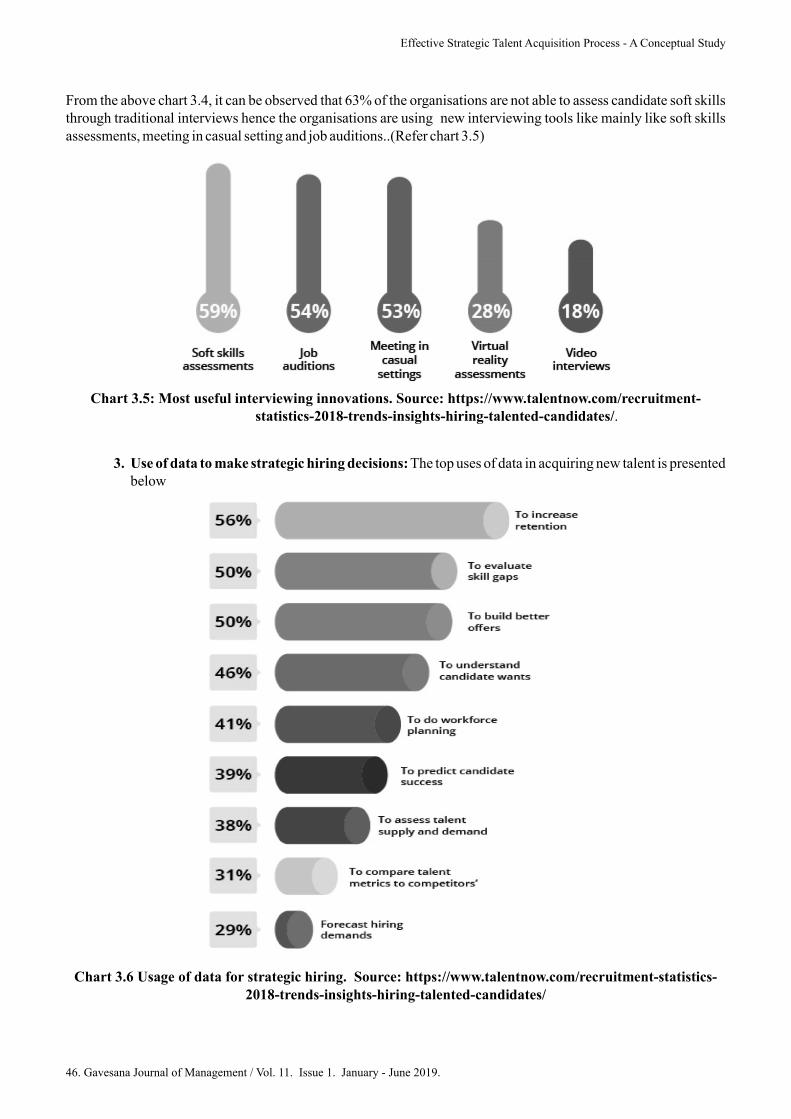
From the above chart 3.4, it can be observed that 63% of the organisations are not able to assess candidate soft skillsthrough traditional interviews hence the organisations are using new interviewing tools like mainly like soft skillsassessments, meeting in casual setting and job auditions..(Refer chart 3.5)
.
The top uses of data in acquiring new talent is presentedbelow
Chart 3.5: Most useful interviewing innovations. Source: https://www.talentnow.com/recruitment-statistics-2018-trends-insights-hiring-talented-candidates/
3. Use of data to make strategic hiring decisions:
Chart 3.6 Usage of data for strategic hiring. Source: https://www.talentnow.com/recruitment-statistics-2018-trends-insights-hiring-talented-candidates/
46. Gavesana Journal of Management / Vol. 11. Issue 1. January - June 2019.
Effective Strategic Talent Acquisition Process - A Conceptual Study

From the chart 3.6 it can be inferred that 56% of the companies are using the data to increase retention and 50% ofthem are using to evaluate the skills gaps and build better offers. Companies are also using the data to understandwhat the candidates wants, plan workforce, predict candidates' success, assess demand and supply of the talent,compare metrics of talent with competitors and forecast hiring demands.
Today majority of the recruiters are not having the ability to effectively use data to make better decisions related torecruitment and improve the recuritment processes though they are well aware of using recruitment technologytools. Only 7% of HR professionals who have people analytics capability are optimizing their usage of analytics.(Source: CIPD)
It was found that hiring managersand HR leaders on an average would rehire only 61% of their recent hires. Recruiters and hiringmanagers were unable to identify the right skill sets in the prospective candidates and the best channelsto source the right talent because of the lack of understanding as well as communication between them.80% recruiters think that they have very high understanding on the jobs and 51% recruiters opined thathiring managers need to communicate clearly what they are looking in the candidate. On contrary 61%of Hiring managers opined that recruiters have only a low to moderate understanding of the jobs and 77%of hiring managers feel that recruiters do not use proper screening techniques or tools for screening the
candidates
for better recruitment and making the hiringprocess more error free.
From the above chart 3.7, it can be observed that 58% of the companies are usingAI for sourcing candidates, 56% ofthem for screening candidates, 55% for nurturing candidates, 42% of them for scheduling interviews and few of thecompanies are using for engaging with candidates and interviewing candidates.AI will be used to create chatbots toautomate the initial communication and candidates' screening. 62% of companies are expected to use AI by 2019(Source: Haptick, Linkdlen)
80% of employers opined that passive candidates can be found using social recruiting, 70% of hiring managersopined that social media is used for successful hiring and 89% of companies plan to use social media to recruitcandidates.
According to the talent now survey 2018 the challenges faced by the recruiters are:
1. Most of the recruiters and employers feel that the labor market is candidate- driven and top candidatesstay available for 10 days only before getting hired.
2. Most of the job seekers opined that reputation of a company is important than the pay increase. It wasfound that 55% of the job seekers do not apply after reading online reviews.
3. Attracting top quality candidates in dynamic market has become difficult because talented job seekersare having multiple offers in hand.
4. Difficulty in balancing the speed of hiring with quality of hires
5. Usage of artificial intelligence (AI) and automation
Chart 3.7: Usage of AI in the year 2018. Source: https://www.talentnow.com/recruitment-statistics-2018-trends-insights-hiring-talented-candidates/
IV. Current Recruitment Challenges Faced by the Recruiters
:
.
Gavesana Journal of Management / Vol. 11. Issue 1. January - June 2019. 47
Effective Strategic Talent Acquisition Process - A Conceptual Study
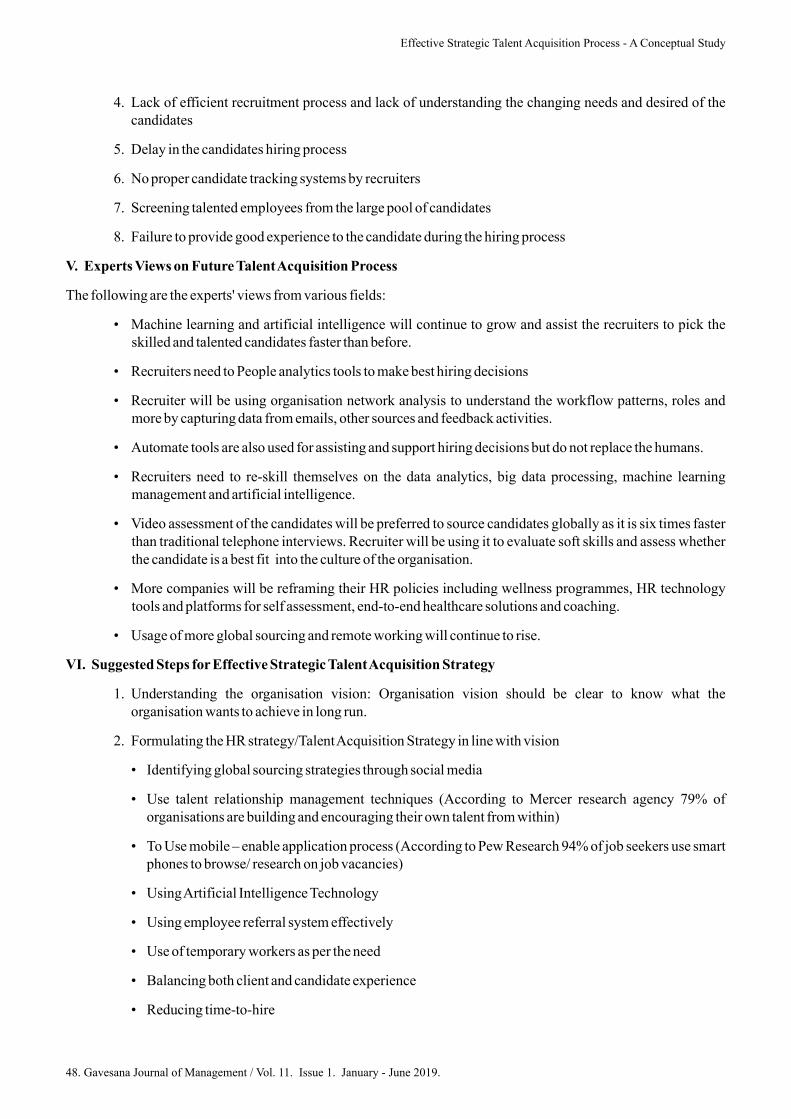
4. Lack of efficient recruitment process and lack of understanding the changing needs and desired of thecandidates
5. Delay in the candidates hiring process
6. No proper candidate tracking systems by recruiters
7. Screening talented employees from the large pool of candidates
8. Failure to provide good experience to the candidate during the hiring process
The following are the experts' views from various fields:
• Machine learning and artificial intelligence will continue to grow and assist the recruiters to pick theskilled and talented candidates faster than before.
• Recruiters need to People analytics tools to make best hiring decisions
• Recruiter will be using organisation network analysis to understand the workflow patterns, roles andmore by capturing data from emails, other sources and feedback activities.
• Automate tools are also used for assisting and support hiring decisions but do not replace the humans.
• Recruiters need to re-skill themselves on the data analytics, big data processing, machine learningmanagement and artificial intelligence.
• Video assessment of the candidates will be preferred to source candidates globally as it is six times fasterthan traditional telephone interviews. Recruiter will be using it to evaluate soft skills and assess whetherthe candidate is a best fit into the culture of the organisation.
• More companies will be reframing their HR policies including wellness programmes, HR technologytools and platforms for self assessment, end-to-end healthcare solutions and coaching.
• Usage of more global sourcing and remote working will continue to rise.
1. Understanding the organisation vision: Organisation vision should be clear to know what theorganisation wants to achieve in long run.
2. Formulating the HR strategy/TalentAcquisition Strategy in line with vision
• Identifying global sourcing strategies through social media
• Use talent relationship management techniques (According to Mercer research agency 79% oforganisations are building and encouraging their own talent from within)
• To Use mobile – enable application process (According to Pew Research 94% of job seekers use smartphones to browse/ research on job vacancies)
• UsingArtificial Intelligence Technology
• Using employee referral system effectively
• Use of temporary workers as per the need
• Balancing both client and candidate experience
• Reducing time-to-hire
V. Experts Views on Future TalentAcquisition Process
VI. Suggested Steps for Effective Strategic TalentAcquisition Strategy
48. Gavesana Journal of Management / Vol. 11. Issue 1. January - June 2019.
Effective Strategic Talent Acquisition Process - A Conceptual Study

3. Implementing the HR strategy : The talent acquisition strategy process need to be implemented as per therequirement of the company
4. Follow up/Expediting the process: The process need to be expedited to understand whether isprogressing as per the plan decided
5. Checking the process: The talent acquisition strategy need to be checked if any deviations are there as perthe standard plan established.
6. Evaluating and corrective action: Any deviations, the organisation need to find out the root cause andtake correction action according to the need.
From the survey and above data analysis result show that most of the companies are sourcing candidates from jobboards, linkedln and employee referral schemes. Diversity programmes need to be effective for improving theorganisation performance. New interviewing tools like assessment of soft skills assessments, meeting in casualsetting and job auditions can be explored and used. There should be proper usage of data to attract talented candidateand retain top performers. HR professionals need to be trained in people analytics to optimally utilise the usage ofanalytics. Good Understanding and effective communication between recruiters and hiring managers should bethere to source the right talent and identify the right skill sets in the prospective candidates. Companies need to beencouraged to use the Artificial Intelligence and Machine learning in hiring process but the areas like buildingrelationship, checking candidates' potential beyond credentials, gauging interpersonal skills in candidates andconvincing the selected candidates to accept offers still require manual interventions. Hence, effective Talentacquisition strategy needs to be implemented to acquire best person – job fit, save time and cost.
• Pallavi Srivastava and Jyotsna Bhatnagar (2010), Employer Brand for Talent Acquisition: AnExploration towards its Measurement, Vision: The Journal of Business Perspective,https://doi.org/10.1177/097226291001400103
• Senthil kumar (2016), Talent Management Practices: An Empirical Study on Attracting and Retainingthe Top Performers with special reference to IT sector in Bengaluru, Acme Intellects InternationalJournal of Research in Management,Social Sciences &Technology, Vol-14 No. 14Apr 2016
• Tom Baum, (2008) "Implications of hospitality and tourism labour markets for talent managementstrategies", International Journal of Contemporary Hospitality Management, Vol. 20 Issue: 7, pp.720-729, https://doi.org/10.1108/09596110810897574
• Stephen A.Stumpf (2010), Talent Management at the Adv Corporation,| Journal of the InternationalAcademy for Case Studies.
• Bhati,Abhishek & J Manimala, Mathew. (2011). TalentAcquisition and Retention in Social Enterprises.Journal of Security and Sustainability Issues. 1. 39-53.
• Srivastava, Pallavi & Bhatnagar, Jyotsna. (2008). Talent acquisition due diligence leading to highemployee engagement: Case of Motorola India MDB. Industrial and Commercial Training. 40. 253-260.10.1108/00197850810886496.
• Saraswathy, R & Balakrishnan, Janarthanan. (2017). Facets of talent retention: role of employee andemployer branding as catalysts. International Journal of Business Forecasting and MarketingIntelligence. 3. 407. 10.1504/IJBFMI.2017.087663.
VII. Discussion and Conclusion
References
Gavesana Journal of Management / Vol. 11. Issue 1. January - June 2019. 49
Effective Strategic Talent Acquisition Process - A Conceptual Study

• Tyagi, Rajiv & Parimoo, Daleep. (2017). Talent Acquisition And Retention Challenge In Indian SolarIndustry–Innovations In HR Strategy. Asian Academic Research Journal of Social Science &Humanities.
• Flegley, S. (2006), 2006 Talent Management Survey Report, SHRM Research,Alexandria, VA
• 2016 Recruiter & Employer Sentiment Study
• The State of Human Capital 2012—Why the human capital function still has far to go
• 65 HR & Recruiting Stats for 2018
• Companies Losing Money to the Skills Gap,According to CareerBuilder Study
• Strategies to Improve the Recruiter and Hiring Manager Relationship
• Millennials: The Job-Hopping Generation
• How Millennials Want to Work and Live
• Engage Millennial Employees with Feedback and Evaluation
• Job Seeker Nation Study 2016 Where Job Seekers Stand on the Economy, Job Security, and the Future ofWork
• Research Reveals the Driving Force behindAmerican Employees andTheir Career Choices
• HR Outlook: Winter 2016-17: views of our profession
• The secret to reducing hiring mistakes? It's in the metrics
• Artificial Intelligence for High-Volume Retail Recruiting
• 2018 NorthAmerican Staffing & Recruiting Trends Report : The Industry's Outlook for 2018
• The Ultimate Collection of Recruiting Stats to Know in 2017
• 23 Surprising Stats on Candidate Experience – Infographic
• https://www.augmenthr.com/blog/why-effective-talent-acquisition-is-vital-for-your-business/
• https://cardinalatwork.stanford.edu/engage/news/four-steps-workforce-planning
• https://www2.deloitte.com/global/en/pages/human-capital/articles/talent-acquisition-revisited.html
• https://www2.deloitte.com/insights/us/en/focus/human-capital-trends/2017/predictive-hiring-talent-acquisition.html
• https://greenvillehr.org/images/downloads/2016_ Conference_ Certificate_and_Presentations/2._1c._regenc--mcintosh-six_key_elements_of_an_effective_talent_acquis i t ion_strategy_august_18_2016.pdf
• https://www.talentnow.com/recruitment-statistics-2018-trends-insights-hiring-talented-candidates/
• https://www2.deloitte.com/insights/us/en/focus/human-capital-trends/2017/predictive-hiring-talent-acquisition.html
• http://hreonline.com/2018-hiring-trend-predictions/
Other Sources of Data
50. Gavesana Journal of Management / Vol. 11. Issue 1. January - June 2019.
Effective Strategic Talent Acquisition Process - A Conceptual Study
• https://www.prnewswire.com/news-releases/44-percent-of-employers-plan-to-hire-in-the-new-year-according-to-careerbuilders-annual-forecast-300578290.html
• h t t p s : / / w w w. b u l l h o r n . c o m / b l o g / 2 0 1 8 / 0 1 / t o p - s t a f f i n g - r e c r u i t i n g - t r e n d s - 2 0 1 8 /https://www.recruitmentgrapevine.com/content/article/news-2018-01-17-the-biggest-challenge-recruiters-are-facing
• http://www.humanresourcestoday.com/2018/recruitment/trends/?open-article-id=7659907&article-title=how-recruitment-and-hiring-trends-will-evolve-in-2018&blog-domain=wordpress.com&blog-title=ceridian
• http://blog.indeed.com/2017/11/27/employer-outlook-2018-survey/
• http://www.morrisbixby.com/2017/12/21/madison-hiring-challenges/
• https://hrtechweekly.com/2017/10/30/top-3-spookiest-hr-statistics/
• http://www.tomlaine.com/top-31-important-employer-branding-statistics/
• https://business.linkedin.com/talent-solutions/blog/talent-on-tap/2018/linkedins-head-of-recruiting-gives-his-take-on-the-top-hiring-trends-for-2018
• https://www.hrtechnologist.com/articles/recruitment-2/2018-recruitment-trends-according-to-experts/
• https://www.recruitmentgrapevine.com/content/article/news-2018-01-17-the-biggest-challenge-recruiters-are-facing
• https://www.cv-library.co.uk/recruitment-insight/2018-store-recruitment-whitepaper/
• https://www.pageuppeople.com/2017/12/15/2018-recruiting-trends/
• https://www.mercer.com.au/our-thinking/wealth/empowerment-in-a-disrupted-world.html
• https://www.pageuppeople.com/en-sg/whitepaper-ebook/driving-a-culture-of-innovation-utm001/
• https://theundercoverrecruiter.com/how-efficient-recruitment-funnel/
• https://www.betterteam.com/social-recruiting-tips
• http://resources.glassdoor.com/50-hr-and-recruiting-stats-2016.html
• https://www.pageuppeople.com/en-sg/resource-hub/recruitment/?search-type=whitepaper-ebook
• 2018 NorthAmerican Staffing & Recruiting Trends Report:
• 2017 UK Recruitment Trends Report
• Top 10 HotArtificial Intelligence (AI) Technologies
• Global Recruiting Trends 2016
• Jobvite SRP2011
• https://www.talentnow.com/staffing-industry-trends-2018-follow-the-changing-industry-dynamics/
Gavesana Journal of Management / Vol. 11. Issue 1. January - June 2019. 51
Effective Strategic Talent Acquisition Process - A Conceptual Study

The Motivational Preferences of Gen Y: An empirical Study on RecentChanges in Motivation of Gen Y
Dr. Poonam Jindal* **
and Dr. Padmaja Nalluri
Abstract
Managing young talent is becoming an area of growing concern in the literature. The purpose of this paper is toinvestigate motivational preferences of Gen Y through a study conducted for Gen Y employees to know theirpreference for factors given by Herzberg's Two Factor theory. Generation Y have specific traits, needs andexpectations and then it is vital that organizations understand these when looking to attract and retain to them. Thepaper deals with defining who Generation Y are – how they behave, what motivates them in organizations andattempts to identify the unique features of Gen Y employees and how their preferences have changed over time. Thepaper is based on an extensive study of Journals, Research papers,Articles, books, online information and a primarystudy conducted for GenYemployees in companies. It concludes that there is not much extra effort required towardsthis but with just innovative thinking and understanding the nature of Gen Y employees, their performance at workcan be drastically improved. This will be a guiding principle for companies to manage their motivation for betterresults at workplace. Research is original in contribution and adds value to the existing literature and corporatepractices
GenY, Motivation, Generations, Herzberg theory, Motivational Factors
What is a “generation”? Strauss and Howe (1991) define a generation to be a cohort group whose lengthapproximates the span of a phase of life and whose boundaries are fixed by peer personality. Peer personality isdefined as a generational persona recognized and determined by common age location. Thus, it is the combinationof being in an age cohort and sharing behavior and beliefs that define a generation.
Mannheim (1952) and later scholars defined a generation as a group of people “who share a common habitus, nexusand culture, a collective memory that serves to integrate” (Everman and Turner, 1998). There are two importantelements to the term “generation”—a common location in historical time and a “distinct consciousness of thathistorical position, shaped by the events and experiences of that time” (Gilleard, 2004). A generation is popularlydefined as “an identifiable group that shares birth years, age, location and significant life events at criticaldevelopmental stages” (Kupperschmidt, 2000); this definition draws on the notion of a common location in time.
There is little empirical and qualitative research on generations and most of the rigorous research has beenconducted by sociologists and historians. There is therefore a strong need to further study the differences in rewards,development and training needs, leadership styles, and motivation of different generations (Paine, 2006), as well asacross other diverse groups of employees. People are the most valuable assets of any organization and managing thatasset is priority of any organization for the competitive advantage. Employees who are called Gen Y or Millennialswill make up 50% of the available talent pool by 2020. It is important for every organization to have the rightknowledge and practices to attract, develop and retain the best from this generation (Kim andYang, 2013).
Millennials bring rich talent, enthusiasm, innovative ideas and diversity at workplace. They are conversant andcomfortable with technology. But workplaces are not ready to match well with their preferences and styles(Erickson, 2008).
Keywords:
1. Introduction
*Assistant Professor HR/OB, Vignana Jyothi Institute of Management, [email protected]** Associate Professor Statistics, Vignana Jyothi Institute of Management, [email protected]
52. Gavesana Journal of Management / Vol. 11. Issue 1. January - June 2019.

In the coming years, this Gen Y workforce is going to be increase day by day in companies. Working with them isdifferent from working with earlier generations. Talent management (TM) is becoming critical factor for the successof any organization specially with this tightened labor market. The best and brightest talent is needed to achievehigher than average. Special attention is needed for employee engagement for Gen Y to develop next-generationleaders (Phillip andAddicks, 2010).
Employers now need to embrace this change and implement new approaches to manage which are specificallytailored to Generation Y. The average tenure of a millennial is 2 years - adopt techniques that retain young talent forlonger (Saxena and Jain, 2012). The requirement for interactive stimulation through online engagement is essentialas the war for talent is becoming tougher. Some employers say no to Gen Y, while others are enjoying the challengesof the latest generation of workers. Companies are on the extremes of denial versus acceptance, excitement versusdread, opportunity versus threat. But it is generally agreed that it is this generation that will transform the waybusiness is carried out for many generations in future.
Gen Y people are found to be complex, technology savvy but highly creative. They expect instant results but alsoclaim development for the long term (Jindal, P. and Shaikh, M. (2017). They are environmentally conscious yethighly mobile. They like freedom at work but tend to value relationships over money. This mystery is challengingfor employers, but organizations cannot overlook them just because it is difficult to manage them. Fortune magazineclaims that they are destined to be the most high-performing generation in history. We need to find out the key tounlock their potential and develop them to be great managers and leaders of the future. Gen Y's are looking for amore personal relationship between employee and employer. When companies address Gen Y and compare themwith older generations, they may find differences in economic, cultural and demographic characteristics. “This isgoing to be the most high-maintenance workforce in history - but I think they're also going to be the most high-performing workforce in history” (Tulgan, 2000). Some of the above-identified characteristics have an impact onthe TM strategies of Gen Y people. Many authors are of the opinion that there is a clear link between the traits andcharacteristics of GenYpeople and the strategies to be adopted for theirTM by the companies.
Herzberg's theory of motivators and hygiene factors: Herzberg (1959) constructed a theory of two-dimensionalfactors affecting people's behaviour towards job or work. He clinched that such factors as supervision, interpersonalrelations, company policy, working conditions, and salary are just hygiene factors rather than motivators. Thatmeans the presence of these factor at work will not motivate employees. Rather, the absence of hygiene factorscreates job dissatisfaction.
In contrast, he resolute from the research results that the motivators were elements that augmented a person's job. Healso originated the five factors that were robust determiners of job satisfaction. Those are achievement, the workitself, recognition, advancement and responsibility. These factors (motivators) were associated with long-termpositive effects in job performance while the hygiene factors dependably formed only short-term changes in jobattitudes and performance, which swiftly fell back to its earlier level.
We can say that satisfiers describe a person's relationship with what she or he does, mainly related to the tasks beingdone. On the other hands, Dissatisfiers have to do with a person's relationship to the environment in which she or hecompletes the job. The dissatisfiers relate to the situation in which the person does what he or she does and satisfiersrelate to what a person does.
With this background, this study aims to identify the unique traits and characteristics of Gen Y people and developstrategies to be adopted by the organizations to motivate and manage them and to bring out their potential to themaximum. This research brings out the preferential choices of Gen Y through a primary survey conducted by takinginputs from Herzberg's two factor theory.
Review of literature is done broadly covering the following aspects. The first section will define the generations,next section focuses on defining Gen Y employees, their traits, features, expectations and characteristics withreference to employment.
2. Literature Review
Gavesana Journal of Management / Vol. 11. Issue 1. January - June 2019. 53
The Motivational Preferences of Gen Y: An empirical Study on Recent Changes in Motivation of Gen Y
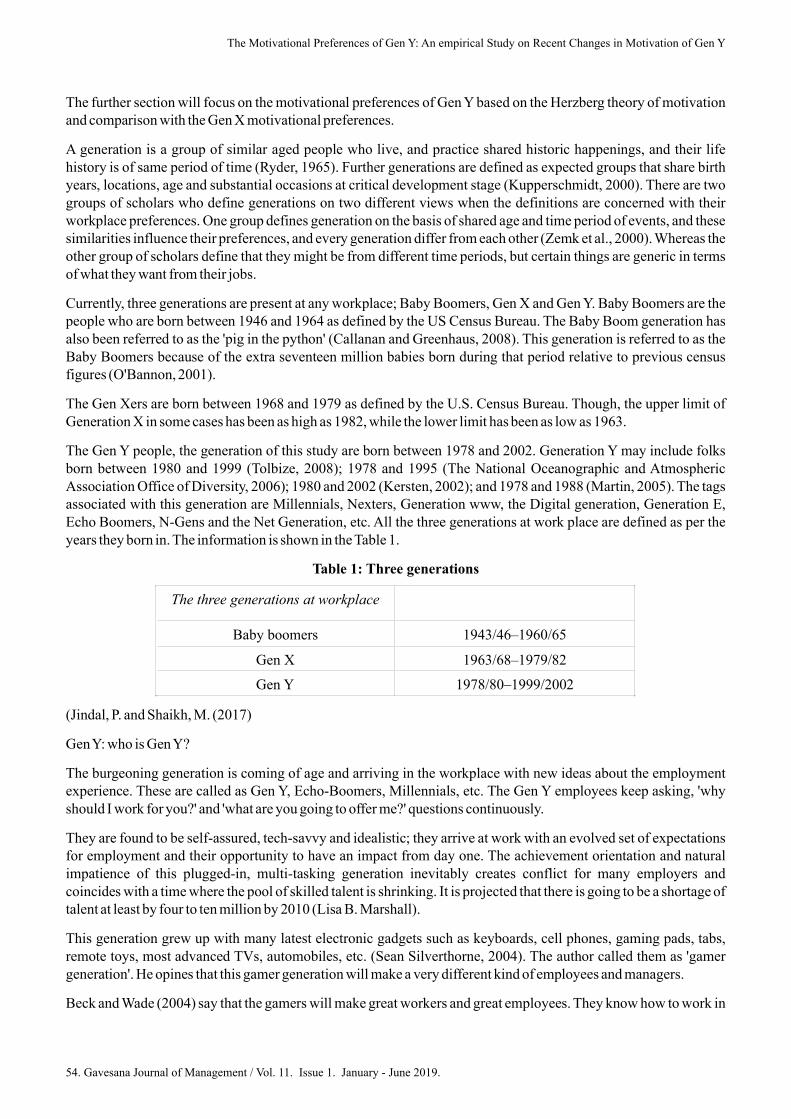
The further section will focus on the motivational preferences of Gen Y based on the Herzberg theory of motivationand comparison with the Gen X motivational preferences.
A generation is a group of similar aged people who live, and practice shared historic happenings, and their lifehistory is of same period of time (Ryder, 1965). Further generations are defined as expected groups that share birthyears, locations, age and substantial occasions at critical development stage (Kupperschmidt, 2000). There are twogroups of scholars who define generations on two different views when the definitions are concerned with theirworkplace preferences. One group defines generation on the basis of shared age and time period of events, and thesesimilarities influence their preferences, and every generation differ from each other (Zemk et al., 2000).Whereas theother group of scholars define that they might be from different time periods, but certain things are generic in termsof what they want from their jobs.
Currently, three generations are present at any workplace; Baby Boomers, Gen X and Gen Y. Baby Boomers are thepeople who are born between 1946 and 1964 as defined by the US Census Bureau. The Baby Boom generation hasalso been referred to as the 'pig in the python' (Callanan and Greenhaus, 2008). This generation is referred to as theBaby Boomers because of the extra seventeen million babies born during that period relative to previous censusfigures (O'Bannon, 2001).
The Gen Xers are born between 1968 and 1979 as defined by the U.S. Census Bureau. Though, the upper limit ofGeneration X in some cases has been as high as 1982, while the lower limit has been as low as 1963.
The Gen Y people, the generation of this study are born between 1978 and 2002. Generation Y may include folksborn between 1980 and 1999 (Tolbize, 2008); 1978 and 1995 (The National Oceanographic and AtmosphericAssociation Office of Diversity, 2006); 1980 and 2002 (Kersten, 2002); and 1978 and 1988 (Martin, 2005). The tagsassociated with this generation are Millennials, Nexters, Generation www, the Digital generation, Generation E,Echo Boomers, N-Gens and the Net Generation, etc. All the three generations at work place are defined as per theyears they born in. The information is shown in the Table 1.
(Jindal, P. and Shaikh, M. (2017)
GenY: who is GenY?
The burgeoning generation is coming of age and arriving in the workplace with new ideas about the employmentexperience. These are called as Gen Y, Echo-Boomers, Millennials, etc. The Gen Y employees keep asking, 'whyshould I work for you?' and 'what are you going to offer me?' questions continuously.
They are found to be self-assured, tech-savvy and idealistic; they arrive at work with an evolved set of expectationsfor employment and their opportunity to have an impact from day one. The achievement orientation and naturalimpatience of this plugged-in, multi-tasking generation inevitably creates conflict for many employers andcoincides with a time where the pool of skilled talent is shrinking. It is projected that there is going to be a shortage oftalent at least by four to ten million by 2010 (Lisa B. Marshall).
This generation grew up with many latest electronic gadgets such as keyboards, cell phones, gaming pads, tabs,remote toys, most advanced TVs, automobiles, etc. (Sean Silverthorne, 2004). The author called them as 'gamergeneration'. He opines that this gamer generation will make a very different kind of employees and managers.
Beck and Wade (2004) say that the gamers will make great workers and great employees. They know how to work in
Table 1: Three generations
The three generations at workplace
Baby boomers 1943/46–1960/65
Gen X 1963/68–1979/82
Gen Y 1978/80–1999/2002
54. Gavesana Journal of Management / Vol. 11. Issue 1. January - June 2019.
The Motivational Preferences of Gen Y: An empirical Study on Recent Changes in Motivation of Gen Y
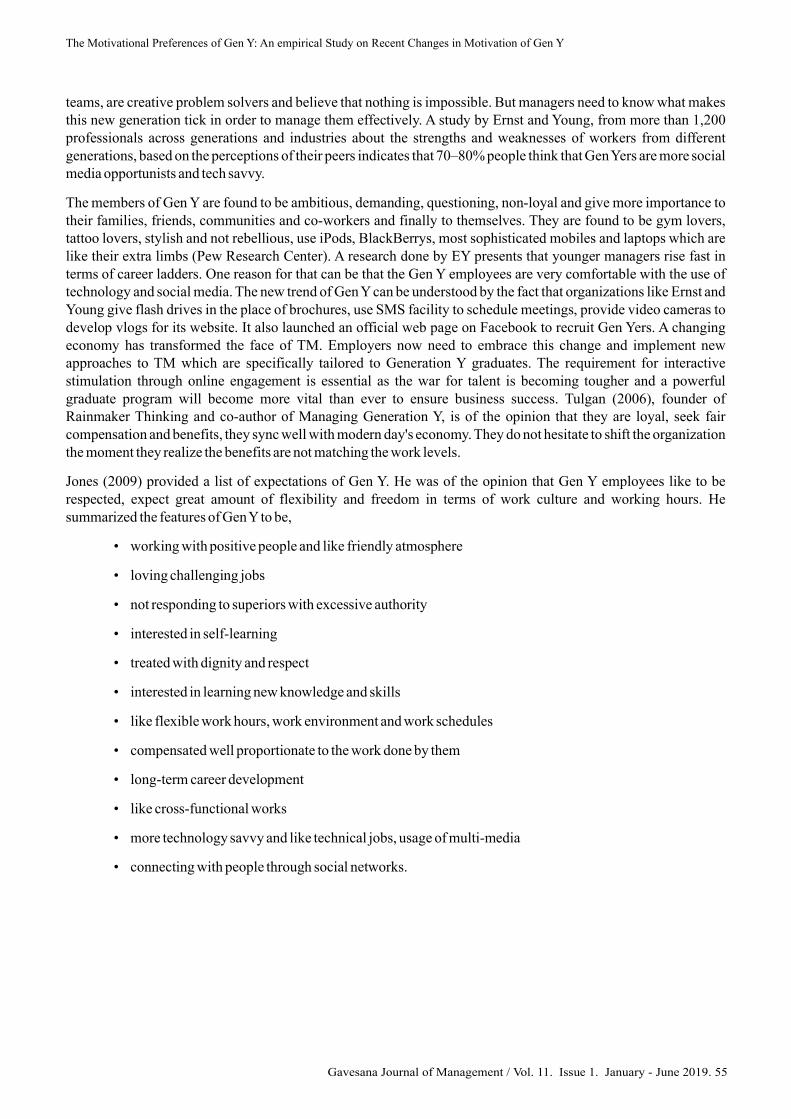
teams, are creative problem solvers and believe that nothing is impossible. But managers need to know what makesthis new generation tick in order to manage them effectively. A study by Ernst and Young, from more than 1,200professionals across generations and industries about the strengths and weaknesses of workers from differentgenerations, based on the perceptions of their peers indicates that 70–80% people think that GenYers are more socialmedia opportunists and tech savvy.
The members of Gen Y are found to be ambitious, demanding, questioning, non-loyal and give more importance totheir families, friends, communities and co-workers and finally to themselves. They are found to be gym lovers,tattoo lovers, stylish and not rebellious, use iPods, BlackBerrys, most sophisticated mobiles and laptops which arelike their extra limbs (Pew Research Center). A research done by EY presents that younger managers rise fast interms of career ladders. One reason for that can be that the Gen Y employees are very comfortable with the use oftechnology and social media. The new trend of Gen Y can be understood by the fact that organizations like Ernst andYoung give flash drives in the place of brochures, use SMS facility to schedule meetings, provide video cameras todevelop vlogs for its website. It also launched an official web page on Facebook to recruit Gen Yers. A changingeconomy has transformed the face of TM. Employers now need to embrace this change and implement newapproaches to TM which are specifically tailored to Generation Y graduates. The requirement for interactivestimulation through online engagement is essential as the war for talent is becoming tougher and a powerfulgraduate program will become more vital than ever to ensure business success. Tulgan (2006), founder ofRainmaker Thinking and co-author of Managing Generation Y, is of the opinion that they are loyal, seek faircompensation and benefits, they sync well with modern day's economy. They do not hesitate to shift the organizationthe moment they realize the benefits are not matching the work levels.
Jones (2009) provided a list of expectations of Gen Y. He was of the opinion that Gen Y employees like to berespected, expect great amount of flexibility and freedom in terms of work culture and working hours. Hesummarized the features of GenYto be,
• working with positive people and like friendly atmosphere
• loving challenging jobs
• not responding to superiors with excessive authority
• interested in self-learning
• treated with dignity and respect
• interested in learning new knowledge and skills
• like flexible work hours, work environment and work schedules
• compensated well proportionate to the work done by them
• long-term career development
• like cross-functional works
• more technology savvy and like technical jobs, usage of multi-media
• connecting with people through social networks.
Gavesana Journal of Management / Vol. 11. Issue 1. January - June 2019. 55
The Motivational Preferences of Gen Y: An empirical Study on Recent Changes in Motivation of Gen Y
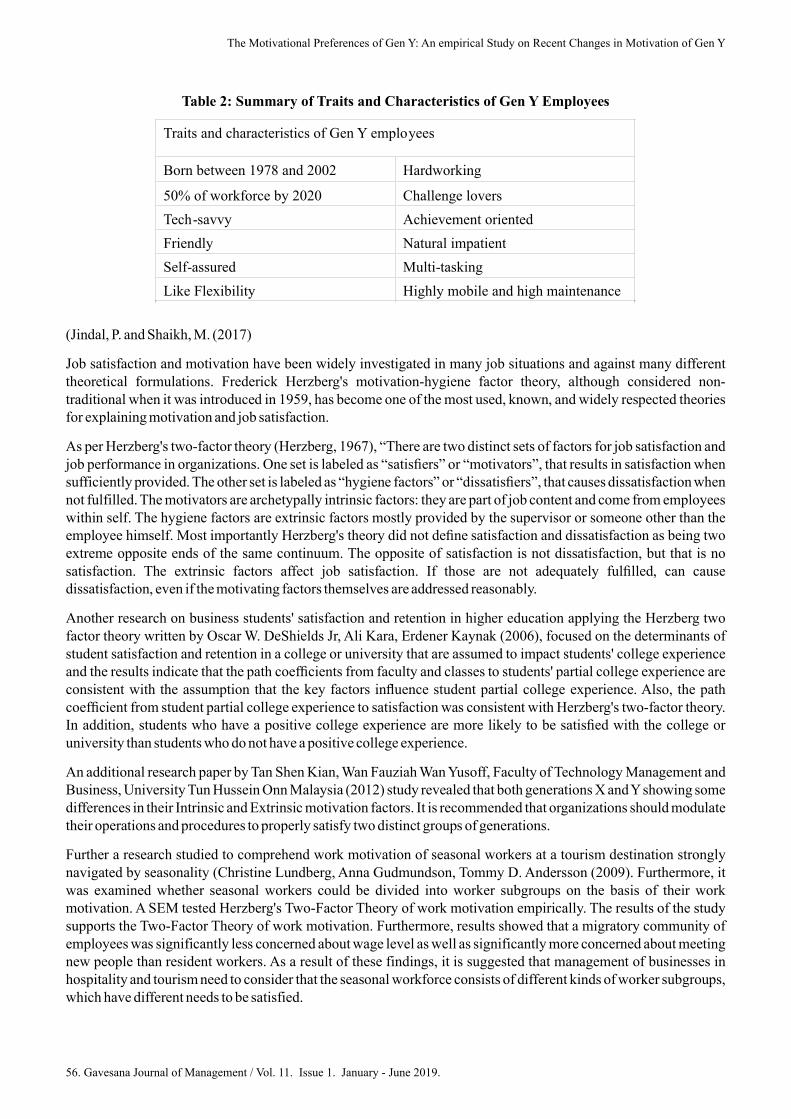
Traits and characteristics of Gen Y employees
Born between 1978 and 2002 Hardworking
50% of workforce by 2020 Challenge lovers
Tech-savvy Achievement oriented
Friendly Natural impatient
Self-assured Multi-tasking
Like Flexibility Highly mobile and high maintenance
Table 2: Summary of Traits and Characteristics of Gen Y Employees
(Jindal, P. and Shaikh, M. (2017)
Job satisfaction and motivation have been widely investigated in many job situations and against many differenttheoretical formulations. Frederick Herzberg's motivation-hygiene factor theory, although considered non-traditional when it was introduced in 1959, has become one of the most used, known, and widely respected theoriesfor explaining motivation and job satisfaction.
As per Herzberg's two-factor theory (Herzberg, 1967), “There are two distinct sets of factors for job satisfaction andjob performance in organizations. One set is labeled as “satisfiers” or “motivators”, that results in satisfaction whensufficiently provided. The other set is labeled as “hygiene factors” or “dissatisfiers”, that causes dissatisfaction whennot fulfilled. The motivators are archetypally intrinsic factors: they are part of job content and come from employeeswithin self. The hygiene factors are extrinsic factors mostly provided by the supervisor or someone other than theemployee himself. Most importantly Herzberg's theory did not define satisfaction and dissatisfaction as being twoextreme opposite ends of the same continuum. The opposite of satisfaction is not dissatisfaction, but that is nosatisfaction. The extrinsic factors affect job satisfaction. If those are not adequately fulfilled, can causedissatisfaction, even if the motivating factors themselves are addressed reasonably.
Another research on business students' satisfaction and retention in higher education applying the Herzberg twofactor theory written by Oscar W. DeShields Jr, Ali Kara, Erdener Kaynak (2006), focused on the determinants ofstudent satisfaction and retention in a college or university that are assumed to impact students' college experienceand the results indicate that the path coefficients from faculty and classes to students' partial college experience areconsistent with the assumption that the key factors influence student partial college experience. Also, the pathcoefficient from student partial college experience to satisfaction was consistent with Herzberg's two-factor theory.In addition, students who have a positive college experience are more likely to be satisfied with the college oruniversity than students who do not have a positive college experience.
An additional research paper by Tan Shen Kian, Wan Fauziah Wan Yusoff, Faculty of Technology Management andBusiness, University Tun Hussein Onn Malaysia (2012) study revealed that both generations X andYshowing somedifferences in their Intrinsic and Extrinsic motivation factors. It is recommended that organizations should modulatetheir operations and procedures to properly satisfy two distinct groups of generations.
Further a research studied to comprehend work motivation of seasonal workers at a tourism destination stronglynavigated by seasonality (Christine Lundberg, Anna Gudmundson, Tommy D. Andersson (2009). Furthermore, itwas examined whether seasonal workers could be divided into worker subgroups on the basis of their workmotivation. A SEM tested Herzberg's Two-Factor Theory of work motivation empirically. The results of the studysupports the Two-Factor Theory of work motivation. Furthermore, results showed that a migratory community ofemployees was significantly less concerned about wage level as well as significantly more concerned about meetingnew people than resident workers. As a result of these findings, it is suggested that management of businesses inhospitality and tourism need to consider that the seasonal workforce consists of different kinds of worker subgroups,which have different needs to be satisfied.
56. Gavesana Journal of Management / Vol. 11. Issue 1. January - June 2019.
The Motivational Preferences of Gen Y: An empirical Study on Recent Changes in Motivation of Gen Y
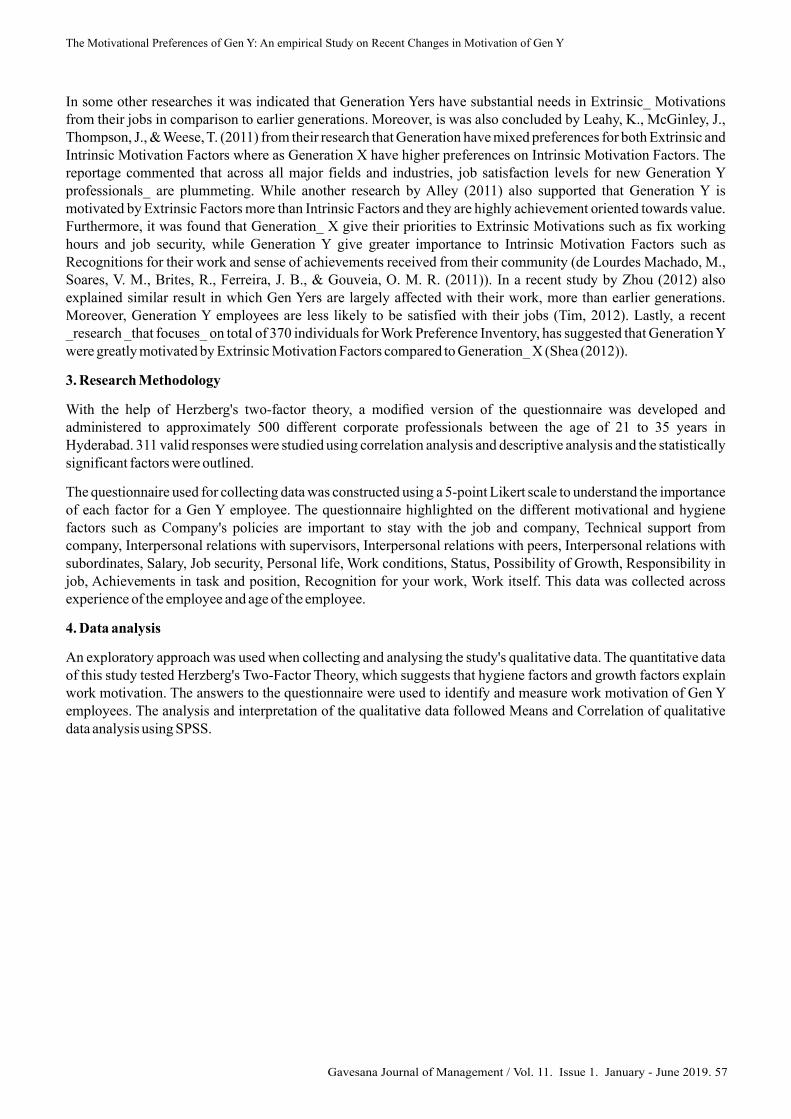
In some other researches it was indicated that Generation Yers have substantial needs in Extrinsic_ Motivationsfrom their jobs in comparison to earlier generations. Moreover, is was also concluded by Leahy, K., McGinley, J.,Thompson, J., & Weese, T. (2011) from their research that Generation have mixed preferences for both Extrinsic andIntrinsic Motivation Factors where as Generation X have higher preferences on Intrinsic Motivation Factors. Thereportage commented that across all major fields and industries, job satisfaction levels for new Generation Yprofessionals_ are plummeting. While another research by Alley (2011) also supported that Generation Y ismotivated by Extrinsic Factors more than Intrinsic Factors and they are highly achievement oriented towards value.Furthermore, it was found that Generation_ X give their priorities to Extrinsic Motivations such as fix workinghours and job security, while Generation Y give greater importance to Intrinsic Motivation Factors such asRecognitions for their work and sense of achievements received from their community (de Lourdes Machado, M.,Soares, V. M., Brites, R., Ferreira, J. B., & Gouveia, O. M. R. (2011)). In a recent study by Zhou (2012) alsoexplained similar result in which Gen Yers are largely affected with their work, more than earlier generations.Moreover, Generation Y employees are less likely to be satisfied with their jobs (Tim, 2012). Lastly, a recent_research _that focuses_ on total of 370 individuals for Work Preference Inventory, has suggested that GenerationYwere greatly motivated by Extrinsic Motivation Factors compared to Generation_ X (Shea (2012)).
With the help of Herzberg's two-factor theory, a modified version of the questionnaire was developed andadministered to approximately 500 different corporate professionals between the age of 21 to 35 years inHyderabad. 311 valid responses were studied using correlation analysis and descriptive analysis and the statisticallysignificant factors were outlined.
The questionnaire used for collecting data was constructed using a 5-point Likert scale to understand the importanceof each factor for a Gen Y employee. The questionnaire highlighted on the different motivational and hygienefactors such as Company's policies are important to stay with the job and company, Technical support fromcompany, Interpersonal relations with supervisors, Interpersonal relations with peers, Interpersonal relations withsubordinates, Salary, Job security, Personal life, Work conditions, Status, Possibility of Growth, Responsibility injob, Achievements in task and position, Recognition for your work, Work itself. This data was collected acrossexperience of the employee and age of the employee.
An exploratory approach was used when collecting and analysing the study's qualitative data. The quantitative dataof this study tested Herzberg's Two-Factor Theory, which suggests that hygiene factors and growth factors explainwork motivation. The answers to the questionnaire were used to identify and measure work motivation of Gen Yemployees. The analysis and interpretation of the qualitative data followed Means and Correlation of qualitativedata analysis using SPSS.
3. Research Methodology
4. Data analysis
Gavesana Journal of Management / Vol. 11. Issue 1. January - June 2019. 57
The Motivational Preferences of Gen Y: An empirical Study on Recent Changes in Motivation of Gen Y
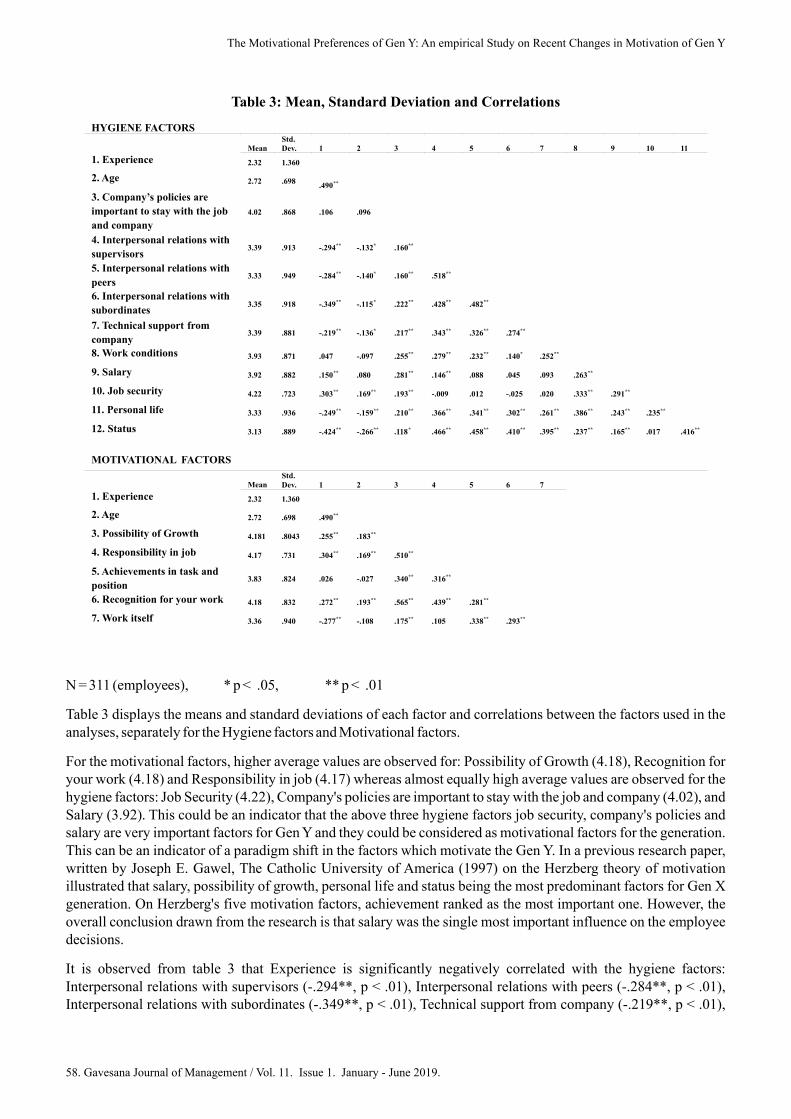
Table 3: Mean, Standard Deviation and Correlations
N = 311 (employees), * p < .05, ** p < .01
Table 3 displays the means and standard deviations of each factor and correlations between the factors used in theanalyses, separately for the Hygiene factors and Motivational factors.
For the motivational factors, higher average values are observed for: Possibility of Growth (4.18), Recognition foryour work (4.18) and Responsibility in job (4.17) whereas almost equally high average values are observed for thehygiene factors: Job Security (4.22), Company's policies are important to stay with the job and company (4.02), andSalary (3.92). This could be an indicator that the above three hygiene factors job security, company's policies andsalary are very important factors for Gen Y and they could be considered as motivational factors for the generation.This can be an indicator of a paradigm shift in the factors which motivate the Gen Y. In a previous research paper,written by Joseph E. Gawel, The Catholic University of America (1997) on the Herzberg theory of motivationillustrated that salary, possibility of growth, personal life and status being the most predominant factors for Gen Xgeneration. On Herzberg's five motivation factors, achievement ranked as the most important one. However, theoverall conclusion drawn from the research is that salary was the single most important influence on the employeedecisions.
It is observed from table 3 that Experience is significantly negatively correlated with the hygiene factors:Interpersonal relations with supervisors (-.294**, p < .01), Interpersonal relations with peers (-.284**, p < .01),Interpersonal relations with subordinates (-.349**, p < .01), Technical support from company (-.219**, p < .01),
HYGIENE FACTORS
MeanStd.Dev. 1 2 3 4 5 6 7 8 9 10 11
1. Experience 2.32 1.360
2. Age 2.72 .698.490**
3. Company’s policies are
important to stay with the job
and company
4.02 .868 .106 .096
4. Interpersonal relations with
supervisors3.39 .913 -.294** -.132* .160**
5. Interpersonal relations with
peers3.33 .949 -.284** -.140* .160** .518**
6. Interpersonal relations with
subordinates3.35 .918 -.349** -.115* .222** .428** .482**
7. Technical support from
company3.39 .881 -.219** -.136* .217** .343** .326** .274**
8. Work conditions 3.93 .871 .047 -.097 .255** .279** .232** .140* .252**
9. Salary 3.92 .882 .150** .080 .281** .146** .088 .045 .093 .263**
10. Job security 4.22 .723 .303** .169** .193** -.009 .012 -.025 .020 .333** .291**
11. Personal life 3.33 .936 -.249** -.159** .210** .366** .341** .302** .261** .386** .243** .235**
12. Status 3.13 .889 -.424** -.266** .118* .466** .458** .410** .395** .237** .165** .017 .416**
MOTIVATIONAL FACTORS
MeanStd.Dev. 1 2 3 4 5 6 7
1. Experience 2.32 1.360
2. Age 2.72 .698 .490**
3. Possibility of Growth 4.181 .8043 .255** .183**
4. Responsibility in job 4.17 .731 .304** .169** .510**
5. Achievements in task and
position3.83 .824 .026 -.027 .340** .316**
6. Recognition for your work 4.18 .832 .272** .193** .565** .439** .281**
7. Work itself 3.36 .940 -.277** -.108 .175** .105 .338** .293**
58. Gavesana Journal of Management / Vol. 11. Issue 1. January - June 2019.
The Motivational Preferences of Gen Y: An empirical Study on Recent Changes in Motivation of Gen Y
Personal life (-.249**, p < .01), and Status (-.424**, p < .01). Also Age is significantly negatively correlated withthe hygiene factors: Interpersonal relations with supervisors (-.132*, p < .05), Interpersonal relations with peers (-.140*, p < .05), Interpersonal relations with subordinates (-.115*, p < .05),Technical support from company (-.136*,p < .05), Personal life (-.159**, p < .01), and Status (-.266**, p < .01). This implies that with gain in experience andage, these hygiene factors become less important to Gen Y.Also, Job Security and Salary are significantly positivelycorrelated with experience and age which further reiterates that they may be considered as motivational factors forGenYer's.
In contrast it is observed that Experience is significantly positively correlated with the motivational factors:Possibility of Growth (-.255**, p < .01), Responsibility in job (-.304**, p < .01) and Recognition for your work (-.272**, p < .01).Also,Age is significantly positively correlated with the motivational factors: Possibility of Growth(-.183**, p < .01), Responsibility in job (-.169**, p < .01) and Recognition for your work (-.193**, p < .01). Thisimplies that with gain in experience and age, these motivational factors gain importance among GenY.
The fundamental purpose of this research was to study the relevant motivation factors for Generation Y employees.Significant differences on extent of satisfaction for both Hygiene and Motivational factors on respondents havebeen confirmed using statistical calculations. Findings arrived from the study has confirmed that generation cohortshave their own groups of characteristics, aspirations, and workplace expectations that will subsequently lead todifferent levels of satisfaction for motivation factors. Moreover, among the fifteen factors employed for this study,the factors Job security, Possibility of growth, Responsibility in job, recognition at work, and salary were found to bethe most predominant in extent of satisfactions for the Gen Y generations. Surprisingly there is a shift found in thepreference of gen y in terms of motivational factors. Salary and job security are becoming motivators for themwhereas work itself is just a hygiene factor for them now.
It is recommended that organizations should reinforce the new ideas for motivational factors towards employees inorder to stimulate Gen Y employees' satisfaction. Organizations also should review current employee appraiser andfeedback systems that will ideally cover multi-generations' work preferences. With effective system execution,employees will be stimulated with better self-recognitions, and higher sense of achievements.
The research was limited to only a small population in Hyderabad whereas it can be extended on a larger scale andtaken forward for further analysis through confirmatory factor analysis. The research also shows that in presentscenario the motivation factors are converted into hygiene factors. Hence companies and organizations need to thinkmore creatively and also discover new motivation factors to retain the GenYworkforce.
• American express report on GenY: http://millennialbranding.com/american-express-study/.
• Boudreau, J.W. and Ramstad, P.M. (2005) 'Talentship, talent segmentation, and sustainability: a new HRdecision science paradigm for a new strategy definition', Human Resource Management, Vol. 44, No. 2,pp.129–136.
• Callanan, G.A. and Greenhaus, J.H. (2008) 'The baby boom generation and career management:Acall toaction',Advances in Developing Human Resources, Vol. 10, No.1, pp.70–85.
• de Lourdes Machado, M., Soares, V. M., Brites, R., Ferreira, J. B., & Gouveia, O. M. R. (2011).Alook toacademics job satisfaction and motivation in Portuguese higher education institutions. Procedia-Socialand Behavioral Sciences, 29, 1715-1724.
• DeShields Jr, O. W., Kara, A., & Kaynak, E. (2005). Determinants of business student satisfaction andretention in higher education: applying Herzberg's two-factor theory. International journal ofeducational management, 19(2), 128-139.
5. Conclusion
6. Scope for Future Research
References
Gavesana Journal of Management / Vol. 11. Issue 1. January - June 2019. 59
The Motivational Preferences of Gen Y: An empirical Study on Recent Changes in Motivation of Gen Y
• Erickson, T. J. (2008) Plugged In: The Generation Y Guide to Thriving at Work. Cambridge, MA:Harvard Business School Press.
• Eyerman, R., & Turner, B. S. (1998). Outline of a theory of generations. European Journal of SocialTheory, 1(1), 91-106.
• Friese, L. and Jowett, C. The Six Ways Generation Y will Transform the Workplace, TalentEgg.•Gawel, J. E. (1997). Herzberg's theory of motivation and Maslow's hierarchy of needs. PracticalAssessment, Research & Evaluation, 5(11), 3.
• Gilleard, C. (2004). Cohorts and generations in the study of social change. Social Theory & Health, 2(1),106-119.
• Herzberg, F. M., & Mausner, B. (1959). B. and Snyderman, BB (1959) The motivation to work. Aufl.,NewYork-London.
• Howe, N. and Strauss, W. (2009) Millennials Rising:The Next Great Generation, NY:Vintage Books.
• http://www.inc.com/sam-bacharach/how-to-motivate-your-gen-y-employees.html.
• http://www.theglobeandmail.com/report-on-business/careers/the-future-of-work/the-six-waysgeneration-y-will-transform-the-workplace/article9615027/.
• http://www.theglobeandmail.com/report-on-business/small-business/sb-tools/top-tens/ten-ways-tomotivate-the-next-generation-of-workers/article5085339/.
• Jones, A. (2009) 'The dos and donts of working with generation Y', by Entry Level Living (BLOG),http://entrylevelliving.wordpress.com/2009/01/07/non-profit-gen/. (access 7 January 2009).
• Jindal, P. and Shaikh, M. (2017) 'Developing and managing young talent: framework of talentmanagement strategies for Gen Y', Int. J. Environment, Workplace and Employment, Vol. 4, No. 3,pp.171–185.
• Kim, J. and Yang, Y.-C. (2013) What can we do to attract and retain young people to our company as wefind it difficult to attract employees at all levels? The ILR Collections at Digital Commons, 0(0),Retrieved from http://digitalcommons.ilr.cornell.edu/student/40/
• Kupperschmidt, B. R. (2000). Tips to help your recruit, manage, and keep generation x employees.Nursing management, 31(3), 58.
• Leahy, K., McGinley, J., Thompson, J., & Weese, T. (2011). Intelligence Community Assessment:Generational Difference inWorkplace Motivation. Intelligence Reform andTransformation, 29(1), 1-16
• Lundberg, C., Gudmundson, A., & Andersson, T. D. (2009). Herzberg's Two-Factor Theory of workmotivation tested empirically on seasonal workers in hospitality and tourism. Tourism management,30(6), 890-899.
• Mannheim, K. (1970). The problem of generations. Psychoanalytic review, 57(3), 378-404.•Martin, C.A. and Tulgan, B. (2006) Managing the Generation Mix: From Urgency to Opportunity, MA,HRD Press.
• O'Bannon, G. (2001) Managing our future: The generation X factor, Public Personnel Management, Vol.30, No. 1, pp. 95–110.
• Paine, J. (2006) 'Cross-generational issues in organizations', The Network News.
• Phillips, D.R. and Addicks, L.K. (2010) 'Engaging a Multi-generational Workforce', InternationalJournal of Facility Management,Vol. 1, No. 1.
60. Gavesana Journal of Management / Vol. 11. Issue 1. January - June 2019.
The Motivational Preferences of Gen Y: An empirical Study on Recent Changes in Motivation of Gen Y
• Ryder, N.B. (1965) 'The cohort as a concept in the study of social change',American sociological review,pp.843–861.
• Saxena, P. and Jain, R. (2012) 'Managing career aspirations of generation y at work place', InternationalJournal of Advanced Research in Computer Science and Software Engineering, Vol. 2, No. 7,pp.114–118.
• Sean Silverthorne (2004) 'Managing the gamer generation', by HBS Working Knowledge (October 18,2004).Available at: http://hbswk.hbs.edu/archive/4429.htm, Retrieved on 10 Jan 2014.
• Strauss, W., & Howe, N. (1991). Generation Z.
• Tan, S. K.,Yusoff,W., & Fauziah, W. (2012). Generation x and y and their work motivation.
• The six ways Generation Y will transform the workplace: http://www.theglobeandmail.com/ reporton-bus ines s /ca ree r s / the - fu ture -o f -w ork / the -s ix -ways -gene ra t ion -y -wi l l - t rans fo rm-theworkplace/article9615027/
• Tolbize, A. (2008) 'Generational differences in the workplace', Research and Training Center ofCommunity Living, Vol. 19, pp.1–13.
• Tulgan, B. (2000) Managing Generation X: How to Bring Out the Best in Young Talent. WW Norton &Company.
• Ulrich, D. (2006) TheTalentTrifecta, Workforce Management, September, pp32–33.
Gavesana Journal of Management / Vol. 11. Issue 1. January - June 2019. 61
The Motivational Preferences of Gen Y: An empirical Study on Recent Changes in Motivation of Gen Y
Kaizen Costing
P A L N S Kalyani*
Abstract
In the view of increasing competition in the world during past decade, US firms have changed radically in theirmanufacturing procedure and thus their competitiveness has been improved. Many advanced techniques viz., TotalQuality Management, Just in Time, Flexible Manufacturing systems, Lean manufacturing, design formanufacturability, process improvement etc, has been adopted to pursue the goal. The aim of the programmes are toimprove quality, reduce cost, increase flexibility and reduce cycle time on the floor of the factory. Support systemslike cost management and finance are generally not keeping in pace with the level of relative operational changesthat are being implemented. The present paper studies about Kaizen Costing and its implementation benefits indetail. It also described about various companies benefited by implementing the technique.
Value Engineering, JointAir-to-Ground Missile (JAGM),
As defined by Yasuhiro Monden, Kaizen Costing is a system of cost reduction with maintenance of products fromthe present cost levels to the desired cost level through a systematic effort. Kaizen is a Japaneese Term whichconnotes continuous improvement.
It is a continuous improvement costing system, a mechanism of managing and controlling costs.
Kaizen Costing is more relatively applicable to comparatively small activities rather than big innovativedevelopments.
• The activities that are planned as per the exigencies are termed asAsset and organization specific.
• The Activities that are carried out at special projects with special emphasis on value chain analysis -Product model.
The pre requisite for Kaizen Costing is the change in the method of setting of standards.
Kaizen costing focuses on "cost reduction" than "cost control".
The Costs which are related to manufacturing stage are taken into consideration by Kaizen Costing, which include:
i. Supply Chain Cost
ii. Legal costs
iii. Manufacturing costs
iv. Wastage
v. Costs of Recruitment
vi. Sales , Marketing and distribution
vii. Disposal of Product
Keywords:
1. Introduction
As perMonden, Kaizen Costing is ofTwo Categories
*Dean Academics, St. Mary's Centenary College, Secunderabad
62. Gavesana Journal of Management / Vol. 11. Issue 1. January - June 2019.
On a monthly basis, the technique tracks the cost reduction plans and the targets are expressed in physical resourcesterms. The team leader is given a target of achieving 1% kaizen costing target and in case of failure, a review bysenior member will be followed. Many Japanese firms are strictly controlling resource consumption. Costreductions are planned and monitored by this technique and the targets are defined in the terms of physical resources.
Rules to be observed for implementation of Kaizen:
• Identify problems on your won
• Mark your problems into Major, minor and difficult
• To start with, select a minor problem and after tackling it, moving to the next level marked problem andcontinue the same activity.
• Continuous improvement on a routine basis must be ensured.
• Status quo must never be admitted.
• Never reject an idea before trying it.
• The experiments need to be shared with contemporaries.
• By sharing the problems with contemporaries, Eliminate previously tried but failed experiments.
• Never hide any problem, always highlight them.
• It encourages collective decision making;
• No emphasis will be laid on current situation by disregarding the ideas which are executed in productionprocess.
• Kaizen technique doesn't strive towards perfection. It can improve present situation at an acceptable cost
• Kaizen permits managers to apply their personal skills and knowledge and to exercise discretion
• There is no particular limit for the teams to implement the level of improvement.
• Kaizen works by setting standards and achieve long term sustainable improvements by continuouslyimproving the standards set.
• It focuses on eliminating wastage, improving systems and processes and thus improves productivity.
• It involves all employees and departments.
• The technique encourages and empowers employees which lead to a better results
• Cost reduction can be ensured through employee suggestion system
• Resources absorption can be reduced through LeanThinking
• It is applicable to all the types of business organizations
• It helps all the stakeholders in the organization
• It is helpful to build team culture in the organization
• It helps in building leadership skills among the people
Principles of Kaizen Costing
Merits of Kaizen
Gavesana Journal of Management / Vol. 11. Issue 1. January - June 2019. 63
Kaizen Costing
• It boosts up the quality of services and thus improves efficiency
• Implementation of this system can improves standardized work documentation
• Implementation of innovative techniques like suggestion system in team meetings, it improvesemployee satisfaction
• Safety in the organization can be improved by organized and cleanup workspace
• It reduces wastages in the business processes
• It is a system that changes permanently
• The technique increases stress on executive management level
• If the technique is not implemented wisely, kaizen costs may lead to diminishing returns
• It may cause frictions in the business processes as many organizations are not prepared to changeeasily
• The staff and team members need to be provided with training regarding Kaizen methodology
• Old habits die hard is aptly applicable in case of this technique
• In case some departments or few people didn't accept this technique, it may ruin the entirephilosophy
Hence, in Kaizen Costing method ensures production of a product while meeting the desired quality, usability,customer satisfaction and reasonable price, to maintain its competitiveness.
Kaizen costing is very adaptable in nature and it is applicable to various sectors includes Banking, Government,Healthcare, retail, transportation etc., It is successfully adopted by people for improving personal lives andachieving development through in house mentoring and life coaching programmes. It was initially coined by Toyotaand it has been regarded as best example for its implementation. Kaizen technique is an effective way to gauge theeffectiveness and here are the various examples to know how it can benefit a particular case.
Kaizen is being used by Toyota, a famous Japanese automotive manufacturer. It has produced and prove with itsresults which are measurable and extremely effective. It focused on continuous improvement of processes throughmini and steady adjustments which enhancing the means things are done. The method was used by Toyoto and alsotaken the benefit of applying the principles at various levels of organization.
Since 2006 when Alan Mulally was appointed as CEO , Ford has adopted the Kaizen technique. Alan Mulallyadopted the same principles at Mark Fields and it helped them to benefit the industry. Ford has implemented thepractices for making their processes are more efficient and also finding various methods to save time by surely andslowly, correct the methodologies from time to time and also it ensures that at every phase the operation is repeatedand implemented in an effective manner.
Nestle has been one of the famous fast moving consumer goods industries and it is considered as best example ofKaizen's implementation in different industries world wide. Nestle has been successful in achieving great
Limitations of Kaizen
Companies Benefitted by implementing Kaizen Costing
Toyota
Ford Motor Company
Nestlé
64. Gavesana Journal of Management / Vol. 11. Issue 1. January - June 2019.
Kaizen Costing
improvements and reducing waste by lowering materials and time wastage. They have taken the implementationseriously by implementing Lean production. Through Lean Production it has found various ways regarding bestusage of available space, resources and utilization of talent and technology.
It is a not for profit, medical research and practice organization which has determined to follow Kaizen by studyinghow it helps Toyota and knowing how it helps in such complicated production operations and improving thepractices.
Mayo Clinic is the best example for Health care sector which is inspired by Toyato. In health care sector – times forwaiting, methods, record handling of patients and paramount utilization of resources in which this technique canmake a difference.
It is a popular American global security, defence, advanced technologies and also an aerospace company ; it islocated in Bethesda. It has approximately 116000 employees across the world and has been selected as one of theTop ten Plans as per Industry Week's during 1998. During the period 1992- 1997, the organization can able to makecost of production to reduce remarkably, by reducing the defect rate to 3.4 case per place and also delivery ordertimings from 42 months to less than 22 months. It is possible by applying lean manufacturing. They have beenawarded with Shingo Prize for Excellence during 2000. They have developed Joint Air to Ground Missle( JAGM)during 2010 and at same instance they also organized various events at Alabama and Florida plants to advancethrough JAGM process.
It is a United states bank working for decades.As perArgusLeader.com, 34 steps are required for opening a checkingaccount at this bank. After implementing Kaizen, this process has been decreased to 24 steps. Kaizen is used toprovide better services to customers and also analyze processes.
The furniture that can be seen in various movies, television shows and commercial offices is produced by anAmerican office furniture company – Herman Miller. It is well known for producing task chairs.
During 2012, Fast Company – A business magazine reported that they enjoyed 500% increase in productivity and1000% increase in quality after adopting Kaizen. The chairs which used to take 82 seconds to come off from the lineis now can be produced in 17 seconds. Hence, it is proved that Kaizen Principles can be adopted by any type ofproduct ie., chairs to cars.
In India, the world's largest democracy, Gujarat is one of the most significant state. During 2012, Kaizen Institute ofIndia reported that Gujarat government, Education Department, with a motive to improve the functionality of publicsector, it has executed 2 weeks of Kaizen training for more than eighty employee. This is one of the best example toprove that it is helpful for not only private sector organizations but also government and municipal organizations.
Kaizen Costing is laid out to redo many value engineering steps until the manufacture of the product continuouslyworking on upgrading the process and thus eliminating the extra costs. Nevertheless, Kaizen Costing is still vital foran enterprise as competitive pressures will force the firms to decrease the product's price over a period of time andalso possible savings in the costs facilitate in achieving the intended profit margins while continually working onreducing cost. Manu companies and people are successful through the concept of Kaizen. However, those who arenew to this idea are inquisitive to know how exactly it applied in the past. Only few specific organizations arepopularly known by adopting Kaizen and achieving best results.
Mayo Clinic
Lockheed Martin
Great Western Bank
Herman Miller
The Gujarat Government
Conclusion
Gavesana Journal of Management / Vol. 11. Issue 1. January - June 2019. 65
Kaizen Costing
References
• Alaghmand,A. (1991). Education Management premises, 1st ed.. Tehran, Payam Noor Publication.Alvani, S.M. (1988). General Management, 1st ed. Tehran, Ney Publication.
• Battens, J. (1981). Possibilities and Expectation. Published By TheAadisionwesley, P. Company.
• Imani, Makasaei. (1995). Kaizen key to Japanese competitive success, Trans.
• Imai, M. (1986).Kaizen:The key to Japanese competitive success. NewYork: McGraw-Hill
• Kaur, M. (2014). Kaizen costing:Acatalyst for change and continuous cost improvement.
• GE-International Journal of Management Research, 2(1), TPS Hand book. (n.d.). Retrieved 14 March2016, TPS_Handbook_v1.pdfYasuhiro
• M., & Kazuki, H. (1991). Target costing and Kaizen costing in Japanese automobile companies. JMAR,3
• Salimi, M.H, Amirkabir University,Tehran. Katz, D., & Kahn L. (1978). The Social Psychology ofOrganizations, Wiley, NewYork.
• Larson, T.J. (1993).Middle Managers, contribution to implemented information technology innovation,Journal of Management Information System, 10, 155-176.
• Madani, D. (1994). Funding and Organization, Journal of Management Studies, 13 and 14.
• Rezaeian, A. (1994). Principles of Management, SAMT Publication. Robins, S. (1990). OrganizationalBehaviour, Trans. Kabiri, Gh.PhD., Center of IslamicAzad University Press.Tehran.
• Rosenfeld, R., & Servo, J.C. (1990). Facilitating innovation in large organizations, In M.A. West and J.L.Farr (EDS) Innovation and Creativity at Work: Psychological and Organization Strategies, JohnWiley&Sons,West Susan, pp. 251-264.
• Yasuhiro, M., & John, L. (1993). How a Japanese Automaker reduces cost. ManagementAccounting
• Yasuhiro, M. (2012).Toyota production system, an integrated approach to just-in-time, 4th ed. CRCPress, Whittle, N. (2011). Paper P2 Performance Management. Financial Management
66. Gavesana Journal of Management / Vol. 11. Issue 1. January - June 2019.
Kaizen Costing

GUIDELINES TO CONTRIBUTORS
Articles submitted to the journal should be original contributions and should not be under consideration for anyother publication at the same time. Submissions may be sent via E-mail to: and one hard copy bypost. The intellectual contributions can be made under any one of the following categories:
1. Research Article: It should be original research article in any discipline of management which includesfinance, operations, human resource, marketing and general management.
2. Book Review/Literature Survey/Case Study :Author should send one copy of the book along with review
3. Doctoral Dissertation:Author can send summary of Ph.D. thesis.4. Case Study: Author should send the scanned copy of the approval taken from the company for doing the
case.
1. For Submission:
• Covering Letter: Title of the paper, Author's Name, Designation, Organization, Official Address,PersonalAddress, Contact Numbers (Official & Personal) and e-mail address.
• Abstract: Should contain in brief – Objectives, Research Questions / Hypothesis, Methodology,Findings and 5-6 Keywords. Word Limit : 250-300 words.
2. Full Paper:
• Format:A-4 Size, MS-Word, 2003-07
• Word Limit: Not to exceed 5000 words
• Font: Times New Roman
• Font Size:Title – 16, Heading – 12 & Text – 11
• Margin: 1.5 – inch on all four sides
• Line spacing: 1
3. Format of the Paper:
• Definitions: Paper should be clear and concise with proper definitions for specialized terms.
• Sections: Introduction, Objectives, Research Questions/ Hypothesis, Methodology, Findings/Results, Conclusions/ Recommendations and Limitations, 5-6 Key Words.
• Annexure: Tables, Charts, Graphs, Quotations, Equations, Articles should be numbered, cited andreferenced properly.
• Abbreviations: Any Abbreviations used should be written in full at first followed by theabbreviations in the parenthesis.
• Referencing:The Harvard System should be used in referencing.
• End notes: To be given with the text citation..
4. Declaration: Author must declare originality of work. The article should not have been published or besubmitted for publication elsewhere.
5. Author will receive two complimentary copies of the journal.
6. Editorial Board's decision will be final.
7. The copyright of all accepted papers will vest withVJIM.
Gavesana Journal of Management,C/o Vignana Jyothi Institute of Management,Veljan Centre, Vignana Jyothi Nagar, Bahcupally, via Kukatpally,Hyderabad - 500090. Tel. 040-2304 4901/02, Fax: 040 2304 4953Email: [email protected]: www.vjim.edu.in
General Information about Submission:
Address for Correspondence:
Editor,
Gavesana Journal of Management / Vol. 11. Issue 1. January - June 2019. 67

www.vjim.edu.in
ContactAddress:
Editor,Gavesana Journal of Management,C/o Vignana Jyothi Institute of Management,Veljan Centre, Vignana Jyothi Nagar, Bahcupally, via Kukatpally,Hyderabad - 500090.Tel. 040-2304 4901/02, Fax: 040 2304 4953Email: [email protected]
Follow us on: