Gasoline Demand, Pricing Policy and Social Welfare … · Gasoline Demand, Pricing Policy and...
28
Gasoline Demand, Pricing Policy and Social Welfare in Saudi Arabia Tarek N. Atalla, Anwar A. Gasim and Lester C. Hunt March 2017 / KS-2017--DP04
Transcript of Gasoline Demand, Pricing Policy and Social Welfare … · Gasoline Demand, Pricing Policy and...

1Gasoline Demand, Pricing Policy and Social Welfare in Saudi Arabia
Gasoline Demand, Pricing Policy and Social Welfare in Saudi ArabiaTarek N. Atalla, Anwar A. Gasim and Lester C. HuntMarch 2017 / KS-2017--DP04

2Gasoline Demand, Pricing Policy and Social Welfare in Saudi Arabia
About KAPSARC
Legal Notice
The King Abdullah Petroleum Studies and Research Center (KAPSARC) is a non-profit global institution dedicated to independent research into energy economics, policy, technology and the environment, across all types of energy. KAPSARC’s mandate is to advance the understanding of energy challenges and opportunities facing the world today and tomorrow, through unbiased, independent, and high-caliber research for the benefit of society. KAPSARC is located in Riyadh, Saudi Arabia.
© Copyright 2017 King Abdullah Petroleum Studies and Research Center (KAPSARC). No portion of this document may be reproduced or utilized without the proper attribution to KAPSARC.
3Gasoline Demand, Pricing Policy and Social Welfare in Saudi Arabia
In the face of low international oil prices, countries in the Gulf Cooperation Council recently implemented fuel price reform across a number of sectors. Saudi Arabia, for example, announced in December 2015 an increase in the gasoline price. We undertook a welfare analysis in this paper to estimate the net gain
in social welfare that resulted from this price increase. Our results show that:
Gasoline demand is generally price inelastic in Saudi Arabia, the current lack of alternative transport modes, particularly within cities, being one possible reason. Our preferred econometric estimates suggest that the price elasticity is between -0.09 and -0.15. Therefore, the gasoline price increase is unlikely to dampen domestic demand significantly.
The gasoline price increase could potentially result in a net gain in social welfare of as much as SAR 2 billion annually at 2010 prices, which is equivalent to 0.1 percent of the Kingdom’s gross domestic product (GDP) in 2015.
These welfare gains do not take into account the external costs of gasoline demand and driving. The gasoline price increase would also offer additional welfare benefits to consumers through reduced greenhouse gas emissions, air pollution, congestion and accidents.
The structure of the Saudi labor market and government spending on public employee salaries suggests that the direct loss for consumers due to the price increase would probably be offset by gains for producers (mainly Saudi Aramco) and the government.
Key Points

4Gasoline Demand, Pricing Policy and Social Welfare in Saudi Arabia
Summary
models. This suggests that increases in the gasoline price will likely not dampen domestic demand significantly. On the other hand, there was less consistency in the estimates of the income elasticity. Given the lack of time series data on household income, GDP and non-oil GDP per capita were used as proxies. When real GDP per capita was used as a measure of household income, the income elasticity was found to be 0.15. When real non-oil GDP per capita was used, however, the income elasticity was found to be 0.61. Furthermore, the additional term suggested that behavioral effects over time generally increased gasoline demand.
Using the estimated demand curve and an approximated supply curve, our welfare analysis revealed that the gain in social welfare would have been between SAR 1 to 2 billion annually at 2010 prices because of the gasoline price increase, which is equivalent to about 0.1 percent of real GDP in 2015. This annual welfare gain would continue to accumulate over the next few years and possibly grow larger as consumers have more time to respond to the price change.
Furthermore, the estimated welfare gain does not take into account the external costs of gasoline demand and driving. Therefore, the gasoline price increase, which would lead to a reduction in both gasoline demand and distances traveled, also offers additional welfare benefits in the form of reductions in greenhouse gas emissions, air pollution,congestion and accidents.
In summary, the welfare estimates suggest that the recent gasoline price increase would yield an overall increase in social welfare, although consumers do incur some loss. Given that producers (mainly Saudi Aramco) gain surplus and that spending on gasoline imports falls, the net positive impact on the government budget and the structure of the Saudi labor market together suggest that the gains would probably be distributed back to Saudi citizens.
The Kingdom of Saudi Arabia (KSA) has experienced rapid economic and population growth over the past several decades. Oil
revenues, one of the drivers of this growth, have also allowed the government to provide electricity, fuel and water at low administered prices. Not surprisingly, energy consumption has grown almost tenfold over this period. In road transport for example, gasoline demand grew from 25 million barrels in 1979 to 204 million barrels in 2015, an average growth of about 6 percent per annum.
In December 2015, the Saudi government announced increases in the administered prices of electricity, fuel and water. In the case of gasoline, the nominal prices for the 91 and 95 octane grades increased from Saudi Riyal (SAR) 0.45 and SAR 0.60 per liter to SAR 0.75 and SAR 0.90, respectively. Similar price changes were also implemented in several Gulf Cooperation Council (GCC) countries at around the same time due to the pressures on government budgets in the face of low international oil prices.
This paper explores the changes to social welfare in Saudi Arabia that may result from these price increases, focusing on gasoline consumption. Our welfare analysis rests on demand and supply curves for gasoline in the Kingdom. The demand curve is estimated using a structural time series model, while the supply curve is assumed to be flat (that is, constant marginal cost) up to the capacity constraint, at which point it is assumed to be vertical.
Gasoline demand per capita was modeled as a function of real income per capita, the real gasoline price, and an additional term that captured the effect of non-economic factors including energy efficiency improvements over time. The estimated demand model revealed that gasoline demand was generally price inelastic.
The estimated gasoline price elasticity ranged between -0.09 and -0.15 for the different demand
5Gasoline Demand, Pricing Policy and Social Welfare in Saudi Arabia
Introduction
The past few decades have seen Saudi Arabia enjoy exponential economic and demographic growth, fueled by its sizable oil
revenues. Between 1979 and 2015, the Kingdom’s real GDP increased from around SAR 1.26 trillion to SAR 2.52 trillion at 2010 prices (SAMA, 2016), its population grew from 9.3 million to 31.5 million (World Bank, 2015) and total primary energy consumption increased from about 22.5 million tonnes of oil equivalent (MTOE) to roughly 200 MTOE (IEA, 2015). During this period, rising oil revenues also allowed the Saudi government to provide electricity, fuel and water at low administered energy prices. Not surprisingly, rapid economic and population growth, alongside such low administered energy prices, contributed to the Kingdom’s tenfold increase in energy consumption over this period.
The road transport sector is one of the largest consumers of energy in KSA, according to MEP (2015a). Rising incomes allowed most households to own private vehicles, while economic development resulted in large cities with extensive road infrastructure and a vast network of highways that connect the numerous cities scattered across the Kingdom. The need for private vehicles to travel is reinforced by the lack of public transportation systems within cities. As highlighted above, the low administered price of gasoline appears to have also played a role in the growth of demand for gasoline, which grew from 25 million barrels in 1979 to 204 million barrels in 2015, an average increase of about 6 percent per annum (MEP, 2015a).
In December 2015, the Saudi government announced increases in the administered prices of electricity, fuel and water, which resulted in the nominal prices for 91- and 95-octane gasoline rising from SAR 0.45 and SAR 0.60 per liter to SAR 0.75 and SAR 0.90, respectively (although these are still below international market prices). These changes represent one of many steps that the Saudi government plans to undertake as part of a much larger strategy launched in April 2016 (Vision 2030, 2016), which is centered on three themes: a thriving economy, a vibrant society and an ambitious nation. Energy price reform is expected to promote greater efficiency in KSA’s energy economy (Reuters, 2016) and reduce the rapid growth in domestic oil consumption.
Understanding and quantifying the impact of energy price increases on social welfare in the Kingdom is important. This paper, therefore, explores the changes to social welfare in Saudi Arabia that may have resulted from the price increases, focusing on gasoline consumption. Our analysis follows the approach in Ahmadian et al. (2007) by estimating a gasoline demand function using the structural time series model (STSM), thus providing estimates of price and income elasticities and an underlying energy demand trend (UEDT) for gasoline in KSA. The preferred econometric estimates for the gasoline demand function are then used to estimate the change in social welfare that might arise from increasing the administered price of gasoline.

6Gasoline Demand, Pricing Policy and Social Welfare in Saudi Arabia
A Brief review of the literature Many studies have attempted to model econometrically gasoline demand for a wide range of countries and groups of countries. These studies cover a wide range of techniques and data periods. A majority of them found that gasoline demand is price and income inelastic in both the short and the long run. For studies that focused explicitly on modeling gasoline demand in KSA (either specifically or within a group or panel), the price elasticity was generally found to be very inelastic, while the income elasticity was also found to be inelastic.
The studies mentioned above generally used time series or panel data models to estimate the price and income elasticities of gasoline demand. Furthermore, some of the models incorporated a measure or proxy to try to capture the impact of improvements in the energy efficiency of the vehicle stock over time. An alternative approach, particularly useful where there are data constraints on energy efficiency and other exogenous variables, is to incorporate a UEDT, as suggested by Hunt et al. (2003a, 2003b). The UEDT captures the influence of exogenous factors that influence demand over time such as energy efficiency and behavior changes, and can be modeled stochastically using Harvey’s (1990) STSM, which arguably results in more realistic econometric models of energy demand.
The STSM/UEDT approach has been used to model fuel demand by a number of researchers. However, the only study that we are aware of that has used the STSM/UEDT approach for Saudi Arabia that is connected to gasoline consumption is Alkhathlan
and Javid (2015), who attempted to analyze the effect of transport and total oil consumption on the environmental quality of Saudi Arabia. They estimated a UEDT for total carbon emissions and carbon emissions from the domestic transport sector. Although connected to the research undertaken here, Alkhathlan and Javid (2015) do not directly estimate a gasoline demand relationship for the Kingdom, nor the associated income and price elasticities. Thus, as far as we are aware, the estimation undertaken in this paper is the first attempt to model gasoline demand for Saudi Arabia using the STSM/UEDT approach.
Econometric estimation methodologyPer capita gasoline demand in the KSA is modeled as a function of real per capita income, the real gasoline price, and a UEDT:
Gt = Gt( Pt,Yt,UEDTt )(1)
where;
Gt= Per Capita Gasoline demand;
Yt= Real Per Capita Income (based on GDP or non-oil GDP);
Pt= Real gasoline price;
UEDTt= Underlying Energy Demand Trend.
Eq. (1) is estimated using a dynamic autoregressive distributed lag specification. For more details on the estimation methodology, see Appendix A.
Econometric Modeling of Gasoline Demand

7Gasoline Demand, Pricing Policy and Social Welfare in Saudi Arabia
DataThis study relies on data for gasoline consumption, gasoline prices, income and population in the Kingdom. The nominal gasoline price series was constructed by analyzing all gasoline-related royal decrees that were issued in Saudi Arabia since 1979. Each royal decree fixed the gasoline price at a nominal level until the next one. If a royal decree was issued in the middle of the year, then the nominal gasoline price for that year was estimated
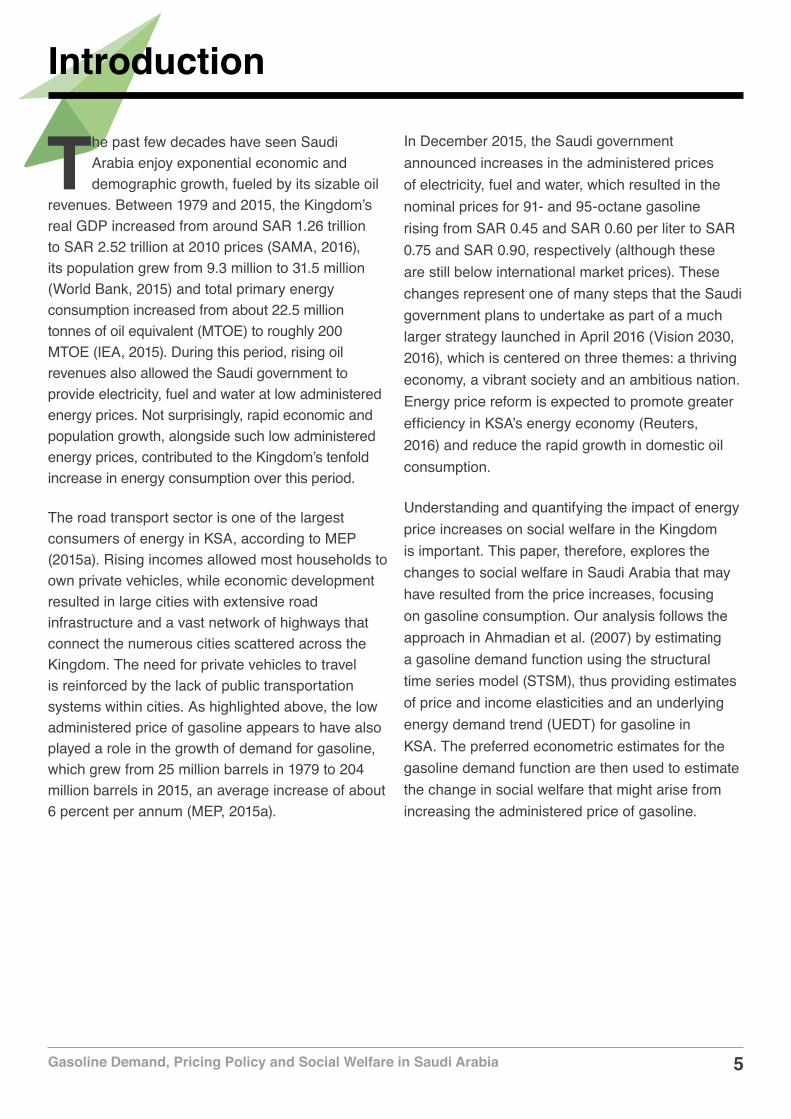
to be a weighted average of the prices before and after the royal decree, where the weight depended on the number of days each price prevailed. In 2007, Saudi Aramco, the state-owned oil company, began to sell 91-octane gasoline in addition to the already available 95-octane. The lower octane gasoline entered the market at SAR 0.45 SAR, which is 25 percent cheaper than the higher grade. Consequently, the price of gasoline from 2007 onwards was estimated to be a weighted sum of the two grades, where the weight depended on the share of consumption of each type (see Figure 1).
Figure 1. Nominal gasoline prices in Saudi Arabia between 1979 and 2016. The weighted average price allows for switching by consumers between different grades of gasoline.
Source: Saudi Aramco (n.d.).
Econometric Modeling of Gasoline Demand
0.0
0.1
0.2
0.3
0.4
0.5
0.6
0.7
0.8
0.9
1.0
2020201520102005200019951990198519801975
Nom
inal
gas
olin
e pr
ices
(SA
R/li
ter)
Weighted average91-octane
95-octane
8Gasoline Demand, Pricing Policy and Social Welfare in Saudi Arabia
The consumer price index (CPI) was then used to deflate the gasoline prices. Finally, real GDP and real non-oil GDP data were obtained from SAMA (2016), gasoline consumption data was collected from MEP (2015a), and population from the World Bank (2015). Total population was used in the analysis instead of only male because women also contribute to the total demand for driving (and thus gasoline) even though they do not currently drive in Saudi Arabia.
The question of what income variable to use, GDP or non-oil GDP, is important. Given the prominence of the oil sector in KSA, there is a positive relationship between real GDP and the price of oil (Algahtani, 2016). Increases in the oil price generally lead to increases in real GDP, while decreases in the oil price exert the opposite effect. Non-oil real GDP is likely to be less sensitive to fluctuations in the oil price, although even non-oil economic sectors depend on oil revenues to some extent. If the aim were to model energy demand at the economy level then the argument for using real non-oil GDP would appear to be relatively strong, an approach taken by Hasanov et al. (2016) for modeling Azerbaijan aggregate electricity demand. However, the argument is less strong when considering gasoline consumers. Therefore, although non-oil GDP may be a better stable measure of Saudi gasoline consumers’ income, it is not completely obvious this is the case at this level. Therefore, both measures are considered for the income variable in the analysis below.
Estimation resultsThe estimated econometric models were reduced to two preferred models. The first is based on real GDP per capita and the second on real non-oil GDP per capita as the measure of income. The estimation period for the two models is 1981 to 2015
in order to allow for two lags in the independent variables in the general model. (See Appendix B for summary statistics and diagnostic test results for the two preferred econometric estimates of gasoline demand.)
The estimated demand curve based on real non-oil GDP per capita as the income driver has limited dynamics, whereas the estimated demand curve based on real GDP per capita has greater dynamics given the presence of the lagged gasoline demand variable.
The estimated long-run income and price elasticities are 0.15 and -0.15, respectively, when real GDP per capita is used as a measure of income, and 0.61 and -0.09, respectively, when real non-oil GDP per capita is used instead. Although there are differences between the two income elasticities depending on which measure of GDP is used, the gasoline price elasticity is consistently small across all models. Therefore, gasoline demand in the Kingdom is generally found to be very price inelastic, which is not dissimilar to the results from previous studies on gasoline demand in KSA, despite the differing methodologies. For the welfare analysis, the estimates of the change in social welfare rest on the size of the price elasticity. Therefore, the estimated price elasticity’s robustness translates into robustness for the welfare analysis.
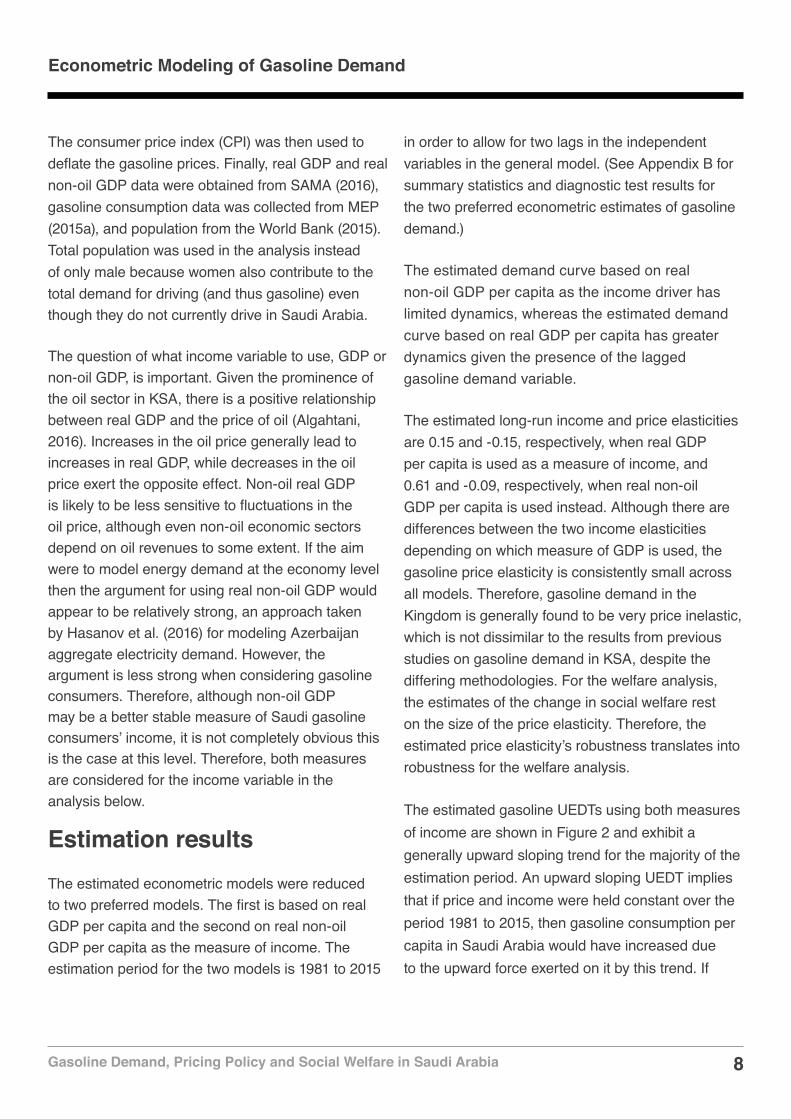
The estimated gasoline UEDTs using both measures of income are shown in Figure 2 and exhibit a generally upward sloping trend for the majority of the estimation period. An upward sloping UEDT implies that if price and income were held constant over the period 1981 to 2015, then gasoline consumption per capita in Saudi Arabia would have increased due to the upward force exerted on it by this trend. If
Econometric Modeling of Gasoline Demand

9Gasoline Demand, Pricing Policy and Social Welfare in Saudi Arabia
Figure 2. The UEDTs from the preferred GDP-based (left y-axis) and non-oil GDP-based (right y-axis) models of gasoline demand in KSA.
improvements in the energy efficiency of passenger cars were to outweigh other exogenous factors, then the UEDT would be expected to be downward sloping, reflecting how greater efficiency leads to a decrease in consumption holding everything else constant. In contrast, upward sloping UEDTs for KSA suggest that either the energy efficiency
of passenger cars decreased over the study period, or that it did increase, but was outweighed by behavioral changes that encouraged greater gasoline consumption. Consumer preferences, for example, may have moved towards larger, heavier cars with lower fuel economy over our study period.
Source: KAPSARC Analysis.
Econometric Modeling of Gasoline Demand
-0.3
-0.2
-0.1
0.0
0.1
0.2
0.3
201520102005200019951990198519802.5
2.6
2.7
2.8
2.9
3.0
3.1
3.2
3.3
UED
T (n
on-o
il G
DP)
UED
T (G
DP)

10Gasoline Demand, Pricing Policy and Social Welfare in Saudi Arabia
Robustness of the elasticity estimatesAt the time of writing, preliminary estimates of actual gasoline consumption in 2016 suggest that demand grew by less than one percent. This slow growth rate breaks the trend over the last ten years, where gasoline demand had been growing faster than six percent on average. The weak growth of gasoline demand in 2016 is largely driven by the roughly 60
percent increase in price, although a slowdown in income and population growth also played a role.
Using provisional 2016 GDP, non-oil GDP, and population data, we also forecast less than one percent growth for gasoline demand in 2016 using both of our models. Comparing actual demand in 2016 to the forecasted demand by our models demonstrates the robustness of our income and, more importantly, price elasticity estimates.
Econometric Modeling of Gasoline Demand

11Gasoline Demand, Pricing Policy and Social Welfare in Saudi Arabia
Welfare Analysis
Methodology for calculating welfareOur welfare analysis revolves around the following thought experiment: Suppose the Saudi government decided in the first hour of January 2015 that the nominal prices for 91- and 95-octane gasoline would rise from SAR 0.45 and SAR 0.60 per liter to SAR 0.75 and SAR 0.90, respectively. In reality, this price increase occurred on Dec. 29, 2015 and had almost no effect on total gasoline consumption in 2015. However, our analysis looks at what would have happened to gasoline demand and annual welfare in the short and the long run if the gasoline price increase occurred at the start of 2015 instead.
The calculation of this change in welfare rests on the demand and supply curves for gasoline in the Kingdom, which are considered in more detail below.
The gasoline demand curve and consumer surplusWhen the price of a good such as gasoline changes, consumers may be better or worse off. The classical approach used by economists to measure the change in the welfare of consumers is through the concept of consumer surplus. Consumer surplus measures the additional monetary benefit or utility or happiness that consumers gain from purchasing a good at a given price (See blue area in Figure 3).
Figure 3. Domestic supply (yellow line) and demand (blue curve) for gasoline in 2015.
Note: The shaded areas reflect the producer and consumer surplus, while the double-sided arrow shows imports.
Source: KAPSARC Analysis.
Actual consumer and producer surplus in 2015
Quantity (billion liters)
Pric
e (2
010
SAR
/lite
r)
PtMt

12Gasoline Demand, Pricing Policy and Social Welfare in Saudi Arabia
To calculate the change in consumer surplus following an increase from Pt (the old price) to Pt* (the new price), we calculate the area to the left of the demand curve between the two prices. In mathematical terms, the change in consumer surplus following a price increase is given by:
(2)
where POPt is the total population at time t. By using the short- and long-run forms of the gasoline demand curve, we can estimate the changes in consumer surplus in both the short and long run. (See Appendix C for further details on this approach.)
The gasoline supply curve and producer surplusThe actual data needed to estimate a supply curve econometrically is not available. However, it can be constructed by examining the structure of the refining industry in the Kingdom. Saudi Arabia has invested heavily in refining throughout the past several decades in order to meet demand, diversify the economy and create job opportunities (MEP, 2015b). However, domestic supply of gasoline has not always met demand and, between 1971 and 2015, Saudi Arabia shifted from being a net importer of gasoline to a net exporter and back again (See Figure 4).
Figure 4. Domestic production and consumption of gasoline between 1971 and 2015.
Source: MEP (2015a).
∆𝐶𝐶𝐶𝐶$ = 𝐺𝐺$(𝑃𝑃$) ∗ 𝑃𝑃𝑃𝑃𝑃𝑃$ 𝑑𝑑𝑃𝑃$./∗./
Welfare Analysis
13Gasoline Demand, Pricing Policy and Social Welfare in Saudi Arabia
Welfare Analysis
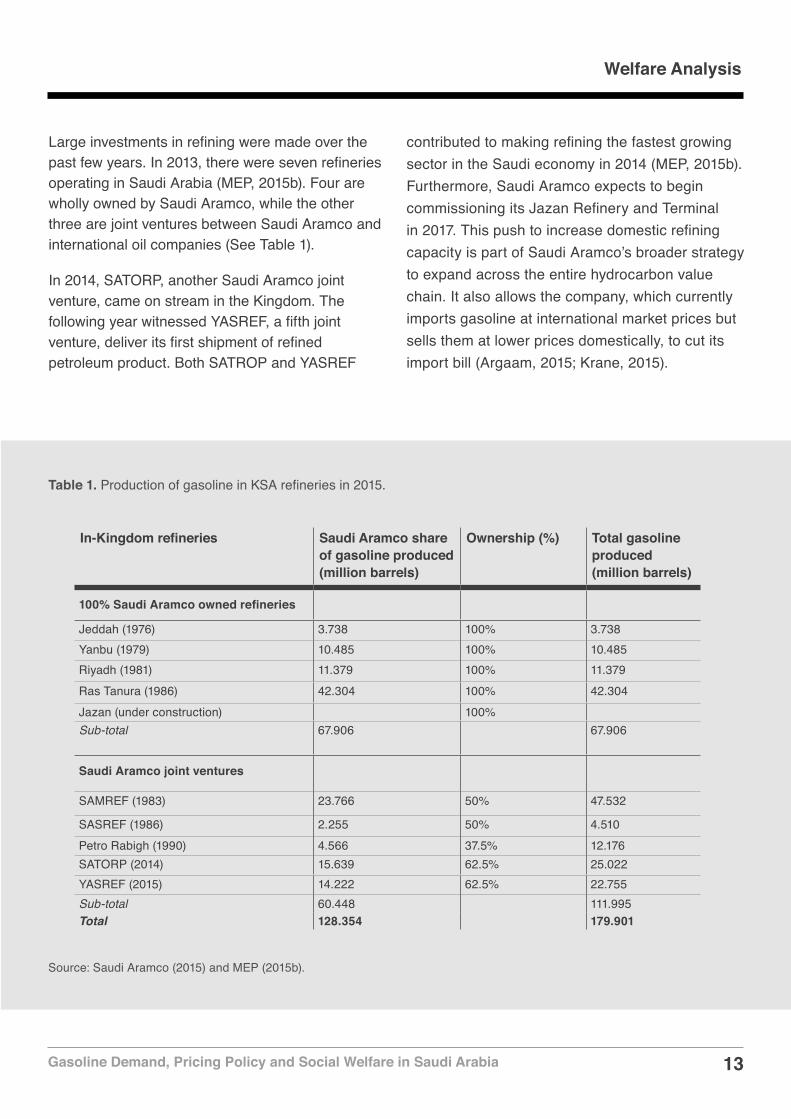
Large investments in refining were made over the past few years. In 2013, there were seven refineries operating in Saudi Arabia (MEP, 2015b). Four are wholly owned by Saudi Aramco, while the other three are joint ventures between Saudi Aramco and international oil companies (See Table 1).
In 2014, SATORP, another Saudi Aramco joint venture, came on stream in the Kingdom. The following year witnessed YASREF, a fifth joint venture, deliver its first shipment of refined petroleum product. Both SATROP and YASREF
contributed to making refining the fastest growing sector in the Saudi economy in 2014 (MEP, 2015b). Furthermore, Saudi Aramco expects to begin commissioning its Jazan Refinery and Terminal in 2017. This push to increase domestic refining capacity is part of Saudi Aramco’s broader strategy to expand across the entire hydrocarbon value chain. It also allows the company, which currently imports gasoline at international market prices but sells them at lower prices domestically, to cut its import bill (Argaam, 2015; Krane, 2015).
Table 1. Production of gasoline in KSA refineries in 2015.
In-Kingdom refineries Saudi Aramco share of gasoline produced (million barrels)
Ownership (%) Total gasoline produced (million barrels)
100% Saudi Aramco owned refineries
Jeddah (1976) 3.738 100% 3.738Yanbu (1979) 10.485 100% 10.485Riyadh (1981) 11.379 100% 11.379Ras Tanura (1986) 42.304 100% 42.304Jazan (under construction) 100%Sub-total 67.906 67.906
Saudi Aramco joint ventures
SAMREF (1983) 23.766 50% 47.532
SASREF (1986) 2.255 50% 4.510Petro Rabigh (1990) 4.566 37.5% 12.176SATORP (2014) 15.639 62.5% 25.022YASREF (2015) 14.222 62.5% 22.755Sub-total 60.448 111.995Total 128.354 179.901
Source: Saudi Aramco (2015) and MEP (2015b).

14Gasoline Demand, Pricing Policy and Social Welfare in Saudi Arabia
Expansions in the domestic supply of gasoline do not occur smoothly. Instead, they happen in discrete steps as new refineries are brought online every few years, as highlighted in Table 1. Economists commonly refer to this as indivisibility of capital (Bhattacharyya, 2011), and it changes the supply curve from a continuous curve to a flat curve with steps whenever new investments expand domestic supply. A flat supply curve implies a fixed marginal cost of production. In the case of Saudi Arabia, we assume that the domestic gasoline supply curve is flat up to the capacity constraint, as shown by the yellow line in Figure 3.
Producer surplus, which is analogous to the concept of consumer surplus, measures the monetary gain that accrues to producers from selling a good at a given price. It is similar to the concept of profits, and can be estimated by calculating the area to the left of the supply curve. To estimate the change in producer surplus from the gasoline price increase (Pt to Pt*), we simply calculate the area to the left of the supply curve between the two prices (see yellow area in Figure 3). Given the flat shape of the domestic gasoline supply curve, this is not difficult to calculate (see Appendix D).
The price-gap approachOur welfare analysis is conducted using the standard price-gap approach (Koplow, 2009). With this approach, the subsidy is considered the gap between a good’s price and its opportunity cost, which in the case of gasoline is the international market price. Locally produced gasoline is considered to be subsidized because the domestic price is lower than the international market price, even though the domestic price is generally above production costs. This is an implicit subsidy as it reflects foregone revenue. On the other hand, the subsidy on imports reflects expenditure since gasoline is purchased at international market prices then sold at much lower prices domestically, giving rise to what we call the ‘import bill.’
On a final note, the average ‘free on board’ spot price of 95-octane gasoline at Jebel Ali port in 2015 is use d as a proxy for international gasoline prices (Platts, 2016).
Welfare Analysis

15Gasoline Demand, Pricing Policy and Social Welfare in Saudi Arabia
Welfare Results
A gasoline price increase affects both gasoline demand and social welfare. According to our GDP-based model, the roughly 60 percent
increase in gasoline price would have reduced gasoline demand from the actual volume of 32.4 billion liters in 2015 to 31 billion in the short run and 30.2 billion liters in the long run. Similarly, our non-oil GDP-based model predicts that the price increase would have reduced gasoline demand from 32.4 billion to 31.2 billion liters in both the short and long run (given that in this model, the estimated short- and long-run price elasticities are the same). Both models confirm that Saudi Arabia would have continued to be a net importer of gasoline following the gasoline price increase.
The change in social welfare (or total surplus) due to the gasoline price increase comprises the sum of changes that occur to three components: consumer surplus, producer surplus and government spending, which includes the import bill (Just et al., 1982). Importing gasoline at international market prices and selling it domestically at lower administered prices has a negative impact on Saudi Aramco’s net profits. If the government provides a transfer to Saudi Aramco to cover this, then any reduction in the import bill results in an equivalent reduction in government spending. Nonetheless, even in the absence of any government transfers, Saudi Aramco would simply absorb the losses, which in turn would translate into foregone revenues for the government. In fact, according to the Ministry of Economy and Planning (MEP, 2015b), oil revenues accounted for 89 percent of total public revenues in 2014. In summary, given that Saudi Aramco is state-owned, any changes to the gasoline import bill translate into changes in government spending.
Because of the position of the domestic supply curve, Saudi Arabia’s status as a net importer of gasoline in 2015 and the not so large increase in price, domestic supply is not affected. Instead, imports fall from Mt to Mt* to ensure that total supply and demand are balanced following the price change (See Figure 5).
The welfare analysis conducted here compares the actual total surplus in 2015 to the total surplus that would have existed in the economy if gasoline prices were raised at the start of 2015. Figure 5 illustrates the breakdown of the net gain in total surplus into three components. First, Figure 5 shows that the gasoline price increase would reduce demand, thereby reducing consumer surplus (shown by the sum of the green and cyan areas). Second, it illustrates that the gasoline price increase would lead to an increase in producer surplus (or profits) for domestic gasoline producers, mainly Saudi Aramco (shown by the green area). This highlights how a relatively large portion of the lost consumer surplus would be transferred to domestic gasoline producers following an increase in the gasoline price. Finally, the original import bill, which was ACDG, would fall to ABEF following the gasoline price increase, which reflects a reduction in government spending. Part of the reduction in government spending would offset the lost consumer surplus due to imports (shown by the cyan area). The remaining part of the reduction in government spending (shown by the yellow area), reflects the net gain in total surplus (i.e., social welfare) to the Saudi economy following the gasoline price increase.

16Gasoline Demand, Pricing Policy and Social Welfare in Saudi Arabia
Short run Long run Short run Long run
Price elasticity -0.098 -0.154 -0.087 -0.087
Consumer surplus -7,834 (-0.31%) -7,907 (-0.31%) -7,935 (-0.31%) -7,983 (-0.32%)
Producer surplus +7,147 (+0.28%) +7,147 (+0.28%) +7,147 (+0.28%) +7,147 (+0.28%)
Fall in government spending
+2,033 (+0.08%) +2,639 (+0.10%) +1,912 (+0.08%) +1,921 (+0.08%)
Total surplus (welfare) +1,346 (+0.05%) +1,879 (0.07%) +1,124 (+0.04%) +1,085 (+0.04%)
Notes: The absolute changes are expressed in SAR 2010 million while the percentage changes, which are expressed relative to real GDP in 2015, are shown in parentheses.
Source: KAPSARC analysis.
Table 2. Changes to surplus and government spending following the price increase.
Non-oil GDP-based model GDP-based model
Welfare Results
Figure 5. Changes to consumer surplus, producer surplus and government spending following the gasoline price increase.Source: KAPSARC analysis.
Changes in surplus
International market price
Quantity (billion liters)
Pric
e (2
010
SAR
/lite
r)
Pt
A F G
BC
Pt *Mt*
Mt
ED

17Gasoline Demand, Pricing Policy and Social Welfare in Saudi Arabia
Table 2 presents the calculated annual net gain in total surplus using the two preferred demand models, for both the short and the long run (holding income and the UEDT constant). This shows that the calculated net gain is between SAR 1-2 billion annually at 2010 prices, and depends strongly on the estimated price elasticity. For the non-oil GDP-based model, with an estimated short- and long-run price elasticity of -0.087, the calculated net gain in welfare is SAR 1.1 billion at 2010 prices. For the GDP-based dynamic model, with estimated short- and long-run price elasticities of -0.098 and -0.154, respectively, the calculated net gain in welfare is SAR 1.3 billion and SAR 1.9 billion at 2010 prices, respectively. As expected, the net gain in social welfare is smaller in the short run because of the smaller price elasticity. The slow vehicle turnover rate, for example, implies that it would take a few years for the vehicle stock in a country to respond to a sudden increase in the gasoline price. In the long run, however, consumers are able to make more changes in response to the price increase, which explains the larger elasticity and in turn the bigger gain in social welfare.
In addition to looking at the impact of the gasoline price increase on social welfare, it is also useful to examine its impact on national revenues. This is especially important given the pressures that have been exerted on the government budget by low international oil prices. In 2015, total actual revenues from gasoline sales were SAR 16.2 billion. (This is calculated by taking the actual gasoline price in 2015 and multiplying it by actual gasoline demand.) In the hypothetical scenario where the price increase occurred at the start of 2015, the total revenues from gasoline sales would have been around SAR 24.3 billion on average across our models. (This is calculated by taking the new gasoline price, accounting for the potential switching of customers between different grades of gasoline, and multiplying it by our estimates of gasoline demand at the new price, which is obtained from our demand curves.) Therefore, we find that the gasoline price increase would have resulted in a revenue uplift of more than SAR 8 billion, most of which would be a gain in government revenues.
Welfare Results

18Gasoline Demand, Pricing Policy and Social Welfare in Saudi Arabia
Summary and Conclusion
Saudi Arabia is entering a period of substantial economic and social change following the government’s announcement of a new vision
for the next 15 years (Vision 2030, 2016). Part of the vision involves energy price reform, thus allowing for prices of energy to increase. This policy change is one way of helping to promote greater efficiency in the Kingdom’s energy economy and to help reduce the rapid growth in domestic oil consumption. This paper, therefore, considers the gasoline price increase that was announced a few months before the new vision. In particular, gasoline demand functions are estimated, which are then used to calculate the potential welfare implications of the gasoline price increase.
The estimated GDP-based model suggests that the long-run price and income elasticities of gasoline are -0.15 and 0.15, respectively, while the non-oil GDP-based model points to elasticities of -0.09 and 0.61, respectively. Although there are differences in the income elasticity across models, the gasoline price elasticity is consistently small. Furthermore, both models produce an upward sloping UEDT for KSA, suggesting that the energy efficiency of the vehicle stock either decreased over the study period or increased but was outweighed by changes in driver behavior that, other things held constant, resulted in greater gasoline consumption per capita.
Therefore, if the Saudi government would like to reduce the future growth in gasoline consumption to something below the 6 percent per annum observed since the end of the 1970s, then the estimated model has two messages for policymakers. First, even if gasoline prices are raised above those announced on Dec. 29, 2015, the low estimated price elasticity suggests that this would not dampen domestic gasoline demand significantly. However, if gasoline prices are raised considerably higher such that expenditure on gasoline is a much larger
proportion of income, then it is possible that the price elasticity would increase. The provision of alternative transport modes within cities might also increase the price elasticity, and thus any further increases in price would lead to a bigger reduction in gasoline consumption. Second, the generally upward sloping UEDT suggests that a key way to limit future residential gasoline consumption would be to improve the energy efficiency of the automobile stock and increase awareness of drivers through education and marketing campaigns.
Focusing on the welfare analysis, we demonstrate that the increase in administered energy prices in KSA announced at the end of 2015, which affected both consumers and producers across a number of sectors, could have a significant positive impact on welfare in the Kingdom. For just the gasoline price increase, our estimates suggest that there would be a welfare increase of about 0.1 percent of real GDP per annum. Furthermore, the revenue uplift from the gasoline price increase would be around SAR 8 billion, which is about 0.3% of GDP, per annum.
The possible welfare gains are noteworthy, but it is worth considering other benefits that might also accrue. Firstly, there are even longer-term changes that might occur in consumer behavior that are not captured by the estimated long-run price elasticity. For example, over a number of years an increase in the gasoline price may encourage consumers to live closer to work, thereby altering the urban sprawl of cities across Saudi Arabia. It could be argued that the estimated long-run price elasticities (and/or the estimated UEDT) in the models above do not adequately capture such changes. Therefore, if this were the case, then the estimates for the net gain in social welfare following the gasoline price increase would be lower bound estimates.
Secondly, the welfare gains that are estimated at between SAR 1-2 billion per annum at 2010 prices

19Gasoline Demand, Pricing Policy and Social Welfare in Saudi Arabia
Summary and Conclusion
would continue to accumulate over the next few years, and possibly grow larger as consumers have more time to respond to the price change. Finally, the welfare calculations above omit any account of external costs. Therefore, the reduction in gasoline demand in KSA, which leads to a reduction in the distances traveled by drivers, offers an additional gain that would come about from the reduction in the external costs due to less emissions, air pollution, congestion and accidents.
In summary, the welfare calculations suggest that the recent gasoline price increase yields an overall increase in social welfare, although given consumers lose surplus, how they will feel about the impact depends on how the additional revenues accrued by the government are used, whether they are redistributed or just used to help alleviate budget deficit problems. It should be noted, however, that
in 2015 roughly 52 percent of government spending was on public employee salaries and benefits (Argaam, 2016). Therefore, given the structure of the Saudi labor market and the portion of government spending that goes to public employees it is likely that the loss in consumer surplus due to the gasoline price increase may be offset by the gain in government revenues that may ultimately be redistributed to citizens.
In conclusion, the results presented here suggest that increasing the domestic gasoline price towards international market prices has the potential to be welfare enhancing. Moreover, assuming that the price increases in electricity and water produce similar welfare enhancements, then the net gain could be as large as a few percent of GDP. Future work could focus on quantifying this potential welfare increase.

20Gasoline Demand, Pricing Policy and Social Welfare in Saudi Arabia
References
Ahmadian, M., Chitnis, M., Hunt, L. C., 2007. Gasoline demand, pricing policy and social welfare in the Islamic Republic of Iran. OPEC Review, 31, 105-124.
Algahtani, G., 2016. The Effect of Oil Price Shocks on Economic Activity in Saudi Arabia: Econometric Approach. International Journal of Business Management, Vol 11, No. 8.
Alkhathlan, K. and Javid, M., 2015. Carbon emissions and oil consumption in Saudi Arabia. Renewable and Sustainable Energy Reviews 48, 105-111.
Argaam. 2015. Saudi Arabia, UAE said to slash gasoline imports by 2016. Available at http://www.argaam.com/en/article/articledetail/id/380068 (Accessed May 16, 2016).
Argaam. 2016. A look at the evolution of salaries and allowances items in the Saudi budget in 15 years. Translated from Arabic. Available at http://www.argaam.com/ar/article/articledetail/id/446226 (Accessed December 14, 2016).
Bhattacharya, S. C. 2011. Energy Economics: Concepts, Issues, Markets, and Governance. London, UK.
Dilaver, Z. and Hunt, L.C., 2011. Industrial electricity demand for Turkey: A structural time series analysis. Energy Economics 33, 426–436.
Harvey, A. C., 1990. Forecasting, structural time series models and the Kalman filter. Cambridge University Press.
Harvey, A. C. and Koopman, S.J., 1992. Diagnostic checking of unobserved-components time series models. Journal of Business & Economic Statistics 10(4), 377-389
Harvey, A. C. and Shephard, N., 1993. Structural Time Series Models. In: Maddala, G.S., Rao, C.R., Vinod, H.D. (Eds.), Handbook of Statistics, Vol. 11, North Holland, Amsterdam, 261-302.
Hasanov, F. J., Hunt, L. C., Mikayilov, C. I., 2016. Modeling and Forecasting Electricity Demand in
Azerbaijan Using Cointegration Techniques. Energies, Forthcoming.
Hunt, L. C., Judge G., Ninomiya, Y., 2003a. Modelling underlying energy demand trends. Chapter 9 in Hunt, L. C., (Ed) Energy in Competitive Market: Essays in Honour of Colin Robinson. Edward Elgar: UK;140-174.
Hunt, L. C., Judge G., Ninomiya, Y., 2003b. Underlying trends and seasonality in UK energy demand: a sectoral analysis."Energy Economics 25(1), 93-118.
IEA. 2015. Extended World Energy Balances. International Energy Agency. France.
Just, R.E., Hueth, D.L., Schmitz, A., 1982. Applied Welfare Economics and Public Policy. Prentice Hall, USA.
Koopman, S. J, Harvey, A.C., Doornik, J. A., Shephard N., 2007. STAMP Version 8 Econometric Software International Timberlake Consultants. London, UK.
Koplow, D., 2009. Measuring energy subsidies using the price-gap approach: What does it leave out? IISD Trade, Investment and Climate Change Series.
Krane, J., 2015. A refined approach: Saudi Arabia moves beyond crude. Energy Policy 82, 99-104.
MEP. 2015a. Data Tables from the Annual Reports. Saudi Ministry of Economy and Planning. Saudi Arabia.
MEP. 2015b. Saudi Economic Report 2014 (SECOR). Saudi Ministry of Economy and Planning. Saudi Arabia.
Platts. 2016. Platts Market Data.
Reuters, 2016. Saudi's Falih says domestic energy price reform to continue from 2017. Available at http://www.reuters.com/article/us-saudi-economy-budget-energy-idUSKBN14B1VJ. (Accessed Feb 2, 2017).

21Gasoline Demand, Pricing Policy and Social Welfare in Saudi Arabia
References
Saudi Aramco. 2015. Saudi Aramco 2015 Facts & Figures. Saudi Arabia.
Saudi Aramco. N.D. Private Communication.
SAMA. 2016. Yearly Statistics: Annual Statistics. Saudi Arabia.
Vision 2030, Kingdom of Saudi Arabia. 2016. Available at http://vision2030.gov.sa/sites/default/files/report/Saudi_Vision2030_EN_0.pdf. (Accessed May 20, 2016).
World Bank. 2015. World Development Indicators. Washington, DC. License: Creative Commons Attribution CC BY 3.0 IGO. doi:10.1596/978-1-4648-0163-1.
22Gasoline Demand, Pricing Policy and Social Welfare in Saudi Arabia
Appendix A: The STSM/UEDT Approach
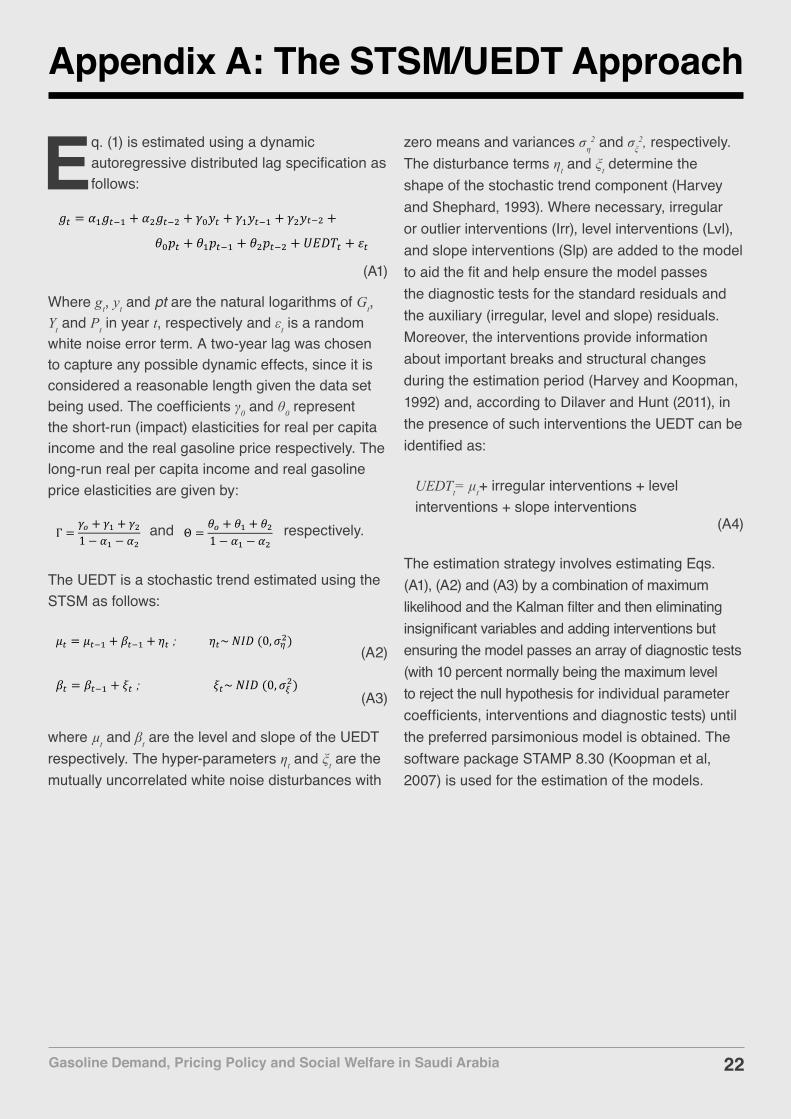
Eq. (1) is estimated using a dynamic autoregressive distributed lag specification as follows:
(A1)
Where gt, yt and pt are the natural logarithms of Gt, Yt and Pt in year t, respectively and εt is a random white noise error term. A two-year lag was chosen to capture any possible dynamic effects, since it is considered a reasonable length given the data set being used. The coefficients γ0 and θ0 represent the short-run (impact) elasticities for real per capita income and the real gasoline price respectively. The long-run real per capita income and real gasoline price elasticities are given by:
and respectively.
The UEDT is a stochastic trend estimated using the STSM as follows:
(A2)
(A3)
where µt and βt are the level and slope of the UEDT respectively. The hyper-parameters ηt and ξt are the mutually uncorrelated white noise disturbances with
𝛽𝛽" = 𝛽𝛽"$% + 𝜉𝜉" ; 𝜉𝜉"~ 𝑁𝑁𝑁𝑁𝑁𝑁 (0, 𝜎𝜎12)
zero means and variances ση2 and σξ
2, respectively. The disturbance terms ηt and ξt determine the shape of the stochastic trend component (Harvey and Shephard, 1993). Where necessary, irregular or outlier interventions (Irr), level interventions (Lvl), and slope interventions (Slp) are added to the model to aid the fit and help ensure the model passes the diagnostic tests for the standard residuals and the auxiliary (irregular, level and slope) residuals. Moreover, the interventions provide information about important breaks and structural changes during the estimation period (Harvey and Koopman, 1992) and, according to Dilaver and Hunt (2011), in the presence of such interventions the UEDT can be identified as:
UEDTt= μt+ irregular interventions + level interventions + slope interventions
The estimation strategy involves estimating Eqs. (A1), (A2) and (A3) by a combination of maximum likelihood and the Kalman filter and then eliminating insignificant variables and adding interventions but ensuring the model passes an array of diagnostic tests (with 10 percent normally being the maximum level to reject the null hypothesis for individual parameter coefficients, interventions and diagnostic tests) until the preferred parsimonious model is obtained. The software package STAMP 8.30 (Koopman et al, 2007) is used for the estimation of the models.
(A4)Θ =𝜃𝜃$ + 𝜃𝜃& + 𝜃𝜃'1 − 𝛼𝛼& − 𝛼𝛼'
𝑔𝑔" = 𝛼𝛼%𝑔𝑔"&% + 𝛼𝛼(𝑔𝑔"&( + 𝛾𝛾*𝑦𝑦" + 𝛾𝛾%𝑦𝑦"&% + 𝛾𝛾(𝑦𝑦"&( +
𝜃𝜃"𝑝𝑝$ + 𝜃𝜃&𝑝𝑝$'& + 𝜃𝜃(𝑝𝑝$'( + 𝑈𝑈𝑈𝑈𝑈𝑈𝑈𝑈$ + 𝜀𝜀$
Γ =𝛾𝛾$ + 𝛾𝛾& + 𝛾𝛾'1 − 𝛼𝛼& − 𝛼𝛼'
𝜇𝜇" = 𝜇𝜇"$% + 𝛽𝛽"$% + 𝜂𝜂" ; 𝜂𝜂"~ 𝑁𝑁𝑁𝑁𝑁𝑁 (0, 𝜎𝜎23)
23Gasoline Demand, Pricing Policy and Social Welfare in Saudi Arabia
Appendix B: Estimation Results and Summary Statistics
Table B1 presents a number of summary statistics and diagnostics tests for the two preferred econometric models of gasoline
demand. The first model uses real GDP per capita as the measure income, while the second model uses real non-oil GDP per capita.
The summary statistics and diagnostics tests include p.e.v. (the prediction error variance), AIC (the Akaike information criterion), R2 (the coefficient of determination), and Rd
2 (the coefficient of determination based on differences). All the normality tests are based on the Bowman-Shenton test distributed approximately as χ2
2, while H(h) is the test for heteroscedasticity, distributed approximately
as F(h,h). These are complemented by the Durbin-Watson statistic (DW), the residual autocorrelation coefficient at lag 1 r(1), distributed approximately as N(0, 1/T), and Q(p,d), which is the Box-Ljung statistic based on the first p residuals autocorrelations and distributed approximately as χd
2. Finally, there is the Predictive Failure test χ f
2 for the last eight years of the estimation period distributed approximately as χ8
2. More importantly, it can be seen that the two preferred models pass all of these diagnostic tests. Table B1 also shows the interventions that were required to ensure that the models passed all the tests. In particular, both models required an intervention for the year 1990 when the Gulf War occurred and oil prices spiked.

24Gasoline Demand, Pricing Policy and Social Welfare in Saudi Arabia
Income based on GDP Income based on non-oil GDP Estimated coefficientsα1 0.3685*** -α2 - -γ0 - -γ1 0.0936*** 0.6149***γ2 - -θ0 -0.0975*** -0.0871***θ1 - -θ2 - -Long-run elasticity estimatesΓ (Income) 0.1482 0.6149Θ (Price) -0.1544 -0.0871Hyper-parametersIrregular 0.000124631 0.000000000Level 0.000000000 0.000309639Slope 0.000001264 0.000009683
InterventionsLvl1983*** Lvl1983***Lvl1987***
Irr1989*** Irr1989***Irr1990*** Irr1990*
Goodness of fitp.e.v. 0.0001448 0.0002956AIC -8.2687 -7.6695R2 0.997 0.992Rd
2 0.941 0.870
Residual diagnostics
Std Error 0.012 0.017Normality 0.22 1.02H(h) H(8) = 1.04 H(9) = 0.24r(1) -0.13 0.03DW 2.20 1.45Q(p, d) χ4
2 = 4.62 χ42 = 6.54
Auxiliary residualsNormality – Irregular 0.85 1.52Normality – Level 1.32 0.20Normality – Slope 2.58 0.47
Pred. failure χ f2 χ8
2 = 9.86 χ82 = 3.99
Table B1. The two preferred econometric estimates of gasoline demand.
Notes: : The *, ** and *** represent significance at the 10%, 5% and 1 % level.Source: KAPSARC analysis.
Appendix B: Estimation Results and Summary Statistics

25Gasoline Demand, Pricing Policy and Social Welfare in Saudi Arabia
Appendix C: Estimating the Change in Consumer Surplus
The two preferred econometric models for gasoline demand in the KSA can be expressed as follows (in the short run):
where Eq. (C1) has real GDP per capita as the income variable (Y) while Eq. (C2) has real non-oil GDP per capita.
The estimated demand curve based on real non-oil GDP per capita as the income driver, Eq. (C2), has limited dynamics with a contemporaneous real price variable and a one-year lagged income variable. This suggests that the adjustment by gasoline consumers to a change in price is completed within a year, whereas the adjustment to a change in income does not start until the year after the income changes, but is completed within that year. However, the estimated demand curve based on real GDP per capita as the income driver, Eq. (C1), has more dynamics with lagged per-capita gasoline demand present in the preferred model, thus giving a greater distinction between the short- and long-run price and income elasticities. That said, given the small size of the estimated coefficient on lagged per capita gasoline demand, the adjustment is still quick, with almost all the adjustment coming through after two years for a real price change and after three years for an income change.
The long-run demand curves for both preferred models can be expressed as follows:
Eq. (C3) is the preferred long-run model based on real GDP per capita, whereas Eq. (C4) is the preferred long-run model based on real non-oil GDP per capita. In the case of the latter, the long-run model is almost the same as the short-run model due to its limited dynamics.
To estimate the change in consumer surplus that follows an increase in the administered price of gasoline, the area underneath the demand curve between the prices before and after the price increase are calculated. Thus, if the administered price changes from Pt to Pt* then the change in consumer surplus in the short run for both models is:
where POPt is the total population at time t. In the long run, the change in consumer surplus for both models is:
The welfare analysis assumes that income, average efficiency of the vehicle stock, and driver behavior and other factors (all of which are captured in the UEDT) remain unaffected by the gasoline price increase. In mathematical terms, the variables Yt and UEDTt do not depend on the gasoline price.
𝐺𝐺" = 𝐺𝐺"$%&.()* ∙ 𝑃𝑃"$&.&*- ∙ 𝑌𝑌"$%&.&*/ ∙ 𝑒𝑒12345
𝐺𝐺" = 𝑃𝑃"%&.&() ∙ 𝑌𝑌"%,&.-,. ∙ 𝑒𝑒01234
(C1)
(C2)
∆𝐶𝐶𝐶𝐶$ = 𝑃𝑃$'(.(*+ ∙ 𝑌𝑌$'.(./.0 ∙ 𝑒𝑒23456 ∙ 𝑃𝑃𝑃𝑃𝑃𝑃$ 𝑑𝑑𝑃𝑃$:6∗:6
(C5)
(C7)
(C3)
(C6)
(C8)
(C4)𝐺𝐺" = 𝑃𝑃"%&.&() ∙ 𝑌𝑌"&.,-. ∙ 𝑒𝑒01234
∆𝐶𝐶𝐶𝐶$ = 𝑃𝑃$'(.(*+ ∙ 𝑌𝑌$(../0 ∙ 𝑒𝑒23456 ∙ 𝑃𝑃𝑃𝑃𝑃𝑃$ 𝑑𝑑𝑃𝑃$:6∗:6
∆𝐶𝐶𝐶𝐶$ = 𝑃𝑃$'(.*+, ∙ 𝑌𝑌$(.*,/ ∙ 𝑒𝑒12345*.+/,
∙ 𝑃𝑃𝑃𝑃𝑃𝑃$ 𝑑𝑑𝑃𝑃$95∗95
∆𝐶𝐶𝐶𝐶$ = 𝑃𝑃$'(.*+, ∙ 𝑌𝑌$(.*,/ ∙ 𝑒𝑒12345*.+/,
∙ 𝑃𝑃𝑃𝑃𝑃𝑃$ 𝑑𝑑𝑃𝑃$95∗95
𝐺𝐺" = 𝑃𝑃"%&.()* ∙ 𝑌𝑌"&.(*- ∙ 𝑒𝑒/0123(.)-*

26Gasoline Demand, Pricing Policy and Social Welfare in Saudi Arabia
Appendix D: Estimating the Change in Producer Surplus
We assume that the supply curve is flat (that is, fixed marginal cost) up to the capacity constraint since the refining
industry is characterized by indivisibility of capital (Bhattacharya, 2011). Furthermore, because of low local fuel prices in Saudi Arabia, particularly over the last decade, we assume that the domestic gasoline supply curve is vertical at the capacity constraint.
Although we do not know the fixed marginal cost of refining in KSA, its exact value has no impact on the change in producer surplus that we wish to estimate. The capacity constraint allows us to express the
domestic supply that is provided in year t, whenever there are imports, as follows:
(D1)
where S_t is the supply of gasoline by domestic producers and M_t the imports.
To estimate the change in producer surplus that results from the price increase, we calculate the area of the following rectangle:
𝑆𝑆" = 𝐺𝐺" ∙ 𝑃𝑃𝑃𝑃𝑃𝑃" − 𝑀𝑀"
∆𝑃𝑃𝑃𝑃 = 𝑃𝑃% ∙ 𝑃𝑃%∗ − 𝑃𝑃% (D2)

27Gasoline Demand, Pricing Policy and Social Welfare in Saudi Arabia
Tarek Atalla
Tarek is a former research associate evaluating energy productivity investments, economics of energy vulnerability, and the effect of climate on energy consumption patterns.
Anwar Gasim
Lester C. Hunt
Anwar is a senior research associate specializing in energy demand, energy efficiency and rebound. He has an MSc in Electrical Engineering from KAUST.
Lester is a senior research fellow at KAPSARC currently on leave from the University of Surrey. His research focuses on modeling energy demand and energy effciency.
About the Authors
About the ProjectKAPSARC’s projects on energy demand model how factors such as income, prices and energy efficiency influence energy demand in different countries, with a strong focus on Saudi Arabia and the Gulf Cooperation Council. The project’s objective is to quantify the influence of each of these factors and estimate the relative levels of energy efficiency across different sectors of the economy. Our energy demand research also looks at the welfare implications of policies that influence energy demand.

28Gasoline Demand, Pricing Policy and Social Welfare in Saudi Arabia
www.kapsarc.org