Gas Natural SDG, S - naturgy.com · Gas Natural SDG, S.A. (“the Company”), the parent company...
88
Gas Natural SDG, S.A. Annual Report 2017 ANNUAL ACCOUNTS Balance sheet Income statement Statement of recognised income and expenses Statement of changes in equity Cash flow statement Notes to the annual accounts
Transcript of Gas Natural SDG, S - naturgy.com · Gas Natural SDG, S.A. (“the Company”), the parent company...

Gas Natural SDG, S.A. Annual Report 2017
ANNUAL ACCOUNTS
Balance sheet
Income statement Statement of recognised income and expenses
Statement of changes in equity Cash flow statement
Notes to the annual accounts

1
Gas Natural SDG, S.A. Balance sheet (million euro)
31.12.17 31.12.16
NON-CURRENT ASSETS 29,453 29,993
Intangible assets (Note 4) 114 195
Goodwill 109 190
Other intangible assets 5 5
Property, plant and equipment (Note 5) 151 153
Land and buildings 134 140
Other property, plant and equipment 17 13
Long-term investments in Group companies and associates (Note 6) 29,015 29,443
Equity instruments 13,400 13,688
Loans to companies 15,615 15,755
Long-term investments (Note 7) 40 74
Equity instruments 5 5
Derivatives 8 59
Other financial assets 27 10
Deferred income tax assets (Note 16) 133 128 CURRENT ASSETS 4,512 2,084
Trade and other receivables (Note 8) 650 670
Trade receivables 121 145
Trade receivables, group companies and associates 345 368
Sundry receivables 155 153
Current tax assets 29 --
Public Administrations -- 4
Short-term investments in Group companies and associates (Note 6) 2,223 883
Loans to companies 1,480 816
Other financial assets 743 67
Short-term investments (Note 7) 85 27
Derivatives 56 --
Other financial assets 29 27
Short-term prepayments and accrued expenses 1 2
Cash and cash equivalents (Note 9) 1,553 502
Cash at banks and in hand 1,453 502
Other cash equivalents 100 -- TOTAL ASSETS 33,965 32,077
Notes 1 to 29 form an integral part of these annual accounts.
2
Gas Natural SDG, S.A. Balance sheet (million euro)
31.12.17 31.12.16
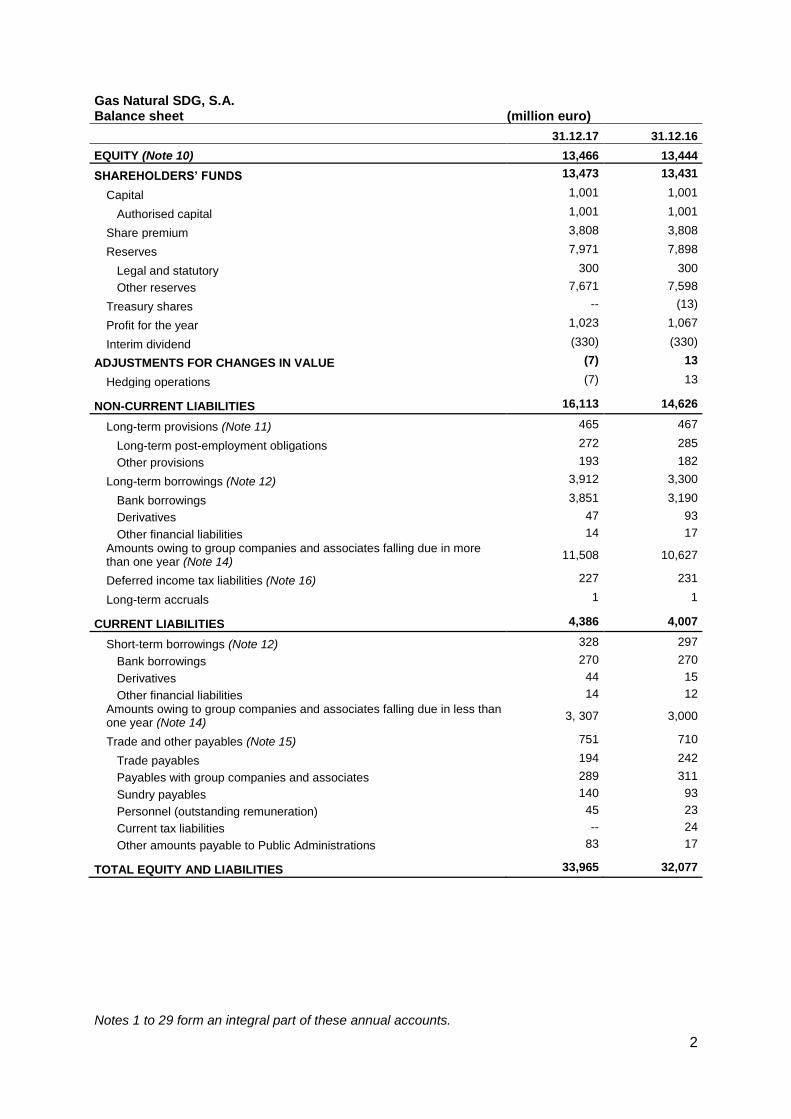
EQUITY (Note 10) 13,466 13,444
SHAREHOLDERS’ FUNDS 13,473 13,431
Capital 1,001 1,001
Authorised capital 1,001 1,001
Share premium 3,808 3,808
Reserves 7,971 7,898
Legal and statutory 300 300
Other reserves 7,671 7,598
Treasury shares -- (13)
Profit for the year 1,023 1,067
Interim dividend (330) (330)
ADJUSTMENTS FOR CHANGES IN VALUE (7) 13
Hedging operations (7) 13
NON-CURRENT LIABILITIES 16,113 14,626
Long-term provisions (Note 11) 465 467
Long-term post-employment obligations 272 285
Other provisions 193 182
Long-term borrowings (Note 12) 3,912 3,300
Bank borrowings 3,851 3,190
Derivatives 47 93
Other financial liabilities 14 17
Amounts owing to group companies and associates falling due in more than one year (Note 14)
11,508 10,627
Deferred income tax liabilities (Note 16) 227 231
Long-term accruals 1 1
CURRENT LIABILITIES 4,386 4,007
Short-term borrowings (Note 12) 328 297
Bank borrowings 270 270
Derivatives 44 15
Other financial liabilities 14 12
Amounts owing to group companies and associates falling due in less than one year (Note 14)
3, 307 3,000
Trade and other payables (Note 15) 751 710
Trade payables 194 242
Payables with group companies and associates 289 311
Sundry payables 140 93
Personnel (outstanding remuneration) 45 23
Current tax liabilities -- 24
Other amounts payable to Public Administrations 83 17
TOTAL EQUITY AND LIABILITIES 33,965 32,077
Notes 1 to 29 form an integral part of these annual accounts.

3
Gas Natural SDG, S.A. Income statement (million euro)
2017 2016
Revenue (Note 17) 5,053 5,062
Sales 3,139 3,088
Income from equity instruments of Group companies and associates (Note 6) 1,470 1,560
Income from marketable securities and other financial instruments of Group companies and associates 444 414
Supplies (Note 18) (3,148) (3,118)
Consumption of goods (3,142) (3,113)
Raw materials and other consumables (6) (5)
Other operating income (Note 21) 383 444
Supplementary income and other operating income 383 443
Operating grants released to the income statement -- 1
Personnel costs (Note 19) (234) (201)
Wages, salaries and related expenses (180) (152)
Social Security (39) (34)
Provisions (15) (15)
Other operating expenses (Note 20) (344) (337)
External services (342) (330)
Taxes (2) (2)
Impairment loss and variation in trade provisions -- (5)
Amortisation expense (Notes 4 and 5) (91) (94)
Impairment and results on disposals of fixed assets (123) (139)
Gain/(loss) on disposals of tangible fixed assets (Note 5) 3 36
Impairment and losses from equity instruments of Group companies and associates (Note 6) (133) (206)
Gain/(loss) on disposals of equity interests in Group companies and associates (Note 6) 7 31
OPERATING PROFIT 1,496 1,617
Financial income 31 30
Negotiable securities and other financial instruments 31 30
- In third parties 31 30
Financial expenses (586) (664)
Borrowings from group companies and associates (482) (569)
Borrowings from third parties (104) (95)
Variation in fair value of financial instruments 1 (1)
Investments 1 (1)
Exchange differences (1) 1
NET FINANCIAL INCOME (Note 22) (555) (634)
PROFIT BEFORE TAXES 941 983
Income tax (Note 16) 82 84
PROFIT FOR THE YEAR 1,023 1,067
Basic and diluted earnings per share in euro 1.02 1.07
Notes 1 to 29 form an integral part of these annual accounts.

4
Gas Natural SDG, S.A. Statement of changes in equity
A) STATEMENT OF RECOGNISED INCOME AND EXPENSES (million euros)
2017 2016
PROFIT FOR THE YEAR 1,023 1,067 INCOME AND EXPENSE RECOGNISED DIRECTLY IN EQUITY (17) 20
Cash flow hedges (31) 24
Actuarial gains and losses and other adjustments (Note 11) 8 3
Tax effect (Note 16) 6 (7)
RELEASES TO INCOME STATEMENT 3 8
Cash flow hedges 4 10
Tax effect (Note 16) (1) (2)
TOTAL INCOME AND EXPENSE RECOGNISED IN EQUITY 1,009 1,095
Notes 1 to 29 form an integral part of these annual accounts.

5
Gas Natural SDG, S.A. Statement of changes in equity
B) TOTAL STATEMENT OF CHANGES IN EQUITY (million euro)
Share capital
Share premium Reserves
Treasury shares
Profit or loss
brought forward
Profit for the year
Interim dividend
Adjustments for changes
in value Total
Balance at 1.1.2016 1,001 3,808 7,873 -- -- 1,024 (408) (13) 13,285
Total recognised revenues and expenses
-- -- 2 -- -- 1,067 -- 26 1,095
Operations with shareholders or owners
- Dividend distribution (Note 10) -- -- -- -- (593) -- (330) -- (923)
- Trading in treasury shares (Note 10) -- -- -- (13) -- -- -- -- (13)
Other changes in equity (Note 10) -- -- 23 -- 593 (1,024) 408 -- --
Balance at 31.12.2016 1,001 3,808 7,898 (13) -- 1,067 (330) 13 13,444
Total recognised revenues and expenses
-- -- 6 -- -- 1,023 -- (20) 1,009
Operations with shareholders or owners
- Dividend distribution (Note 10) -- -- -- -- (671) -- (330) -- (1,001)
- Trading in treasury shares (Note 10) -- -- 1 13 -- -- -- -- 14
Other changes in equity (Note 10) -- -- 66 -- 671 (1,067) 330 -- --
Balance at 31.12.2017 1,001 3,808 7,971 -- -- 1,023 (330) (7) 13,466
Notes 1 to 29 form an integral part of these annual accounts.

6
Gas Natural SDG, S.A. Cash flow statement (million euro)
2017 2016
Profit for the year before tax 941 983 Adjustments to results (1,124) (1,112) Fixed asset depreciation/amortisation (Notes 4 and 5) 91 94 Impairment adjustments 133 211 Change in provisions 8 6 Profit/(loss) on write-offs and disposals of fixed assets (3) (36) Profit/(loss) on write-offs and disposals of financial instruments (7) (31) Financial income (1,945) (2,004) Financial expenses 586 664 Exchange differences 1 (1) Variation in fair value of financial instruments (1) 1 Other income and expenses 13 (16) Changes in working capital 160 28 Debtors and other receivables 114 10 Other current assets -- (1) Creditors and other payables 46 19 Other cash flows from operating activities 695 1,529 Interest paid (593) (640) Dividends received 812 1,560 Interest collected 478 447 Income tax collections/(payments) (2) 162 Cash flows from operating activities 672 1,428
Amounts paid on investments (1,304) (2,071)
Group companies and associates (1,283) (2,047) Property, plant and equipment (16) (16) Other financial assets (5) (8) Amounts collected from divestments 1,032 1,639 Group companies and associates 658 1,571 Property, plant and equipment 12 66 Other financial assets 362 2 Cash flows from investing activities (272) (432)
Collections and payments on equity instruments 14 (13) Acquisition of own equity instruments -- (13) Disposal of own equity instruments 14 -- Collections and payments financial liability instruments 1,638 (394) Issuance 8,983 6,347 Bank borrowings
Short-term bank borrowings 969 801
Payables to Group companies and associates Short-term payables to Group companies and associates
8,014 5,546 Repayment/redemption of (7, 345) (6,741) Bank borrowings (261) (531) Payables to Group companies and associates (7,057) (6,187) Other payables (27) (23) Dividend payments (1,001) (1,331)
Cash flow from financing activities 651 (1,738)
NET INCREASE/DECREASE IN CASH OR CASH EQUIVALENTS 1,051 (742) Cash and cash equivalents at the beginning of the year 502 1,244 Cash and cash equivalents at the year end 1,553 502
Notes 1 to 29 form an integral part of these annual accounts.

7
Gas Natural SDG, S.A.
Contents of the notes to the annual accounts for 2017
Note 1. General information ......................................................................................................................... 8 Note 2. Basis of presentation ....................................................................................................................... 8 Note 3. Accounting policies .......................................................................................................................... 9 Note 4. Intangible assets ............................................................................................................................ 21 Note 5. Property, plant and equipment ....................................................................................................... 21 Note 6. Investments in group companies and associates .......................................................................... 22 Note 7. Investments ................................................................................................................................... 26 Note 8. Trade and other receivables .......................................................................................................... 27 Note 9. Cash and cash equivalents ............................................................................................................ 28 Note 10. Equity ............................................................................................................................................. 28 Note 11. Provisions ...................................................................................................................................... 32 Note 12. Borrowings ..................................................................................................................................... 35 Note 13. Risk management and derivative financial instruments ................................................................. 37 Note 14. Payables to Group companies and associates .............................................................................. 42 Note 15. Trade and other payables .............................................................................................................. 43 Note 16. Tax situation .................................................................................................................................. 44 Note 17. Revenue ........................................................................................................................................ 48 Note 18. Procurements ................................................................................................................................ 48 Note 19. Personnel costs ............................................................................................................................. 48 Note 20. Other operating expenses ............................................................................................................. 49 Note 21. Other operating income ................................................................................................................. 49 Note 22. Net financial income/(expense)...................................................................................................... 50 Note 23. Foreign currency transactions........................................................................................................ 50 Note 24. Information on transactions with related parties............................................................................. 50 Note 25. Information on members of the Board of Directors and Management Committee ......................... 52 Note 26. Contingent liabilities and commitments .......................................................................................... 54 Note 27. Auditors’ fees ................................................................................................................................. 55 Note 28. Environment................................................................................................................................... 55 Note 29. Events after the balance sheet date .............................................................................................. 56 APPENDIX I. GAS NATURAL TAX GROUP COMPANIES ................................................................................... 57

8
Notes to the annual accounts of Gas Natural SDG, S.A. for the year ended 31 December 2017 Note 1. General information Gas Natural SDG, S.A. (“the Company”), the parent company of the Gas Natural Fenosa group (“Gas Natural Fenosa”), was incorporated as a public limited company in 1843 and its registered office for corporate purposes is in Avda. de San Luis 77, Madrid. The company’s corporate purposes, as per its articles of association, comprise the following activities: a) All types of activities related to the gas and electricity business and any other type of existing energy
source, the production and selling of electrical, electro-mechanical and electronic equipment and components, management of architectural projects, civil engineering works, public services and gas and hydro-carbon distribution in general; management of communications and telecommunications networks and maintenance of electro- and gas-related appliances; as well as consulting, business and energy planning services and the rationalisation of energy use, research, development and exploitation of new technologies, communications, computer and industrial security systems; training and selection of human resources and real estate management and development.
b) The activity as a holding company, incorporating companies or holding shares as a stakeholder or
shareholder in other companies no matter what their corporate purposes or nature, by subscribing, acquiring or holding shares, stakes or any other securities deriving from the same, subject to compliance with the legal requirements in each and every case.
The Company’s most relevant ordinary activity is the administration and management of its shareholdings in subsidiaries. It also has gas supply contracts for other Gas Natural Fenosa companies and in the electricity area it acts as representative of the Gas Natural Fenosa generation and supply companies before the Electricity Market. The Company’s shares are listed on the four Spanish stock exchanges, the continuous market and form part of the Ibex 35 stock index. Note 2. Basis of presentation The Company’s annual accounts for 2016 were approved by the annual general meeting of shareholders on 20 April 2017. The annual accounts for 2017, which were drawn up and signed by the Company’s Board of Directors on 6 February 2018, will be submitted to the general shareholders’ meeting for approval; they are expected to be approved without any changes. The accompanying Annual accounts have been prepared on the basis of the Company’s accounting records and are presented in accordance with prevailing commercial legislation and the provisions of the Chart of Accounts introduced under Royal Decree 1514/2007 (16 November), as amended by Royal Decree 1159/2010 (17 September) and Royal Decree 602/2016 (2 December), so as to present fairly the Company’s equity and financial position at 31 December 2017, and the results, changes in equity and cash flows of Gas Natural SDG, S.A. for then ended. The figures set out these Annual accounts are expressed in million euros, unless otherwise stated. The consolidated Annual accounts of Gas Natural Fenosa for 2017 have been prepared in accordance with the International Financial Reporting Standards adopted by the European Union (IFRS-EU), in accordance with Regulation (EU) 1606/2002 of the European Parliament and the Council. The main figures disclosed in the consolidated Annual accounts, which have been audited, are as follows:

9
Total assets 47,322
Equity attributed to the parent company 14,734
Non-controlling interests 3,571
Revenue 23,306
Net income after tax attributed to the parent Company 1,360
Note 3. Accounting policies The main accounting principles applied by the Company to prepare these annual accounts are described below. 3.1. Intangible assets Intangible assets are carried at acquisition price or production cost, or at fair value in the case of assets acquired through a business combination, less accumulated amortisation and any recognised impairment losses.
a) Goodwill Goodwill represents the excess, on the date of acquisition, of the cost of a business combination over the fair value of the net identifiable assets acquired at the date of the operation. Consequently, goodwill is only recognised when it has been acquired for valuable consideration and relates to the future economic profits from assets that have not been identified individually and recognised separately. Goodwill is amortised over ten years using the straight-line method. Goodwill is tested annually to analyse possible impairment losses. It is recognised in the consolidated balance sheet at cost value less amortisation and any cumulative impairment adjustments. The impairment of goodwill cannot be reversed. b) Other intangible assets
Research expenditure is recognised in the income statement when incurred. Costs associated directly with the production of computer software programs that are likely to generate economic profits greater than the costs related to their production are recognised as intangible assets. The direct costs include the personnel costs that has developed the computer programs. Computer software development costs recognized as assets are amortised on a straight–line basis in four to five years as from the time the assets are prepared to be brought into use. The Company has no intangible assets with an indefinite useful life. 3.2. Property, plant and equipment a) Cost
Property, plant and equipment are carried at acquisition price or production cost, or at the value attributed to the asset if it is acquired as part of a business combination. Financial costs relating to financing for plant projects during the plant construction period to the date the asset is ready for use form part of property, plant and equipment. Renewal, extension or improvement costs are capitalised as an increase in the asset's value only when its capacity, productivity or useful life increases. Own work capitalised under Property, plant and equipment relates to the direct cost of production.

10
Expenses arising from actions designed to protect and improve the environment are expensed in the year they are incurred. When such costs entail additions to property, plant and equipment the purpose of which is to minimise the environmental impact and to protect and improve the environment, they are accounted for as an increase in the value of property, plant and equipment. Gains and losses on disposals are determined by comparing proceeds with carrying amounts. These are included in the Income statement. b) Depreciation
The assets are depreciated on a straight-line basis over their useful lives or the concession term, if shorter. Estimated useful lives are as follows:
Estimated useful life years
Buildings 33 – 50
Computer hardware 4
Vehicles 6
Other 3 - 20
The assets’ residual values and useful lives are reviewed, and adjusted if appropriate, at each Balance sheet date. When the carrying value of an asset is greater than its estimated recoverable amount or when it is no longer useful, its value is written down immediately to its recoverable amount (Note 3.3). 3.3. Impairment of assets Assets are tested for impairment provided that an event or change in circumstances indicates that their carrying amount might not be recoverable. Additionally, investments in group companies and associates, long-term investments, goodwill and intangible assets that are not in use are tested annually for impairment. When the recoverable amount is less than the asset’s carrying amount, an impairment loss is recognised through profit and loss for the amount of the difference between the two. The recoverable amount is calculated at the higher of an asset’s fair value less costs of sale and value in use calculated by applying the discount cash flow method. The Company considers value in use as the recoverable amount, calculated as described below. For the purposes of assessing impairment losses, assets are grouped together at the lowest level for which there are separately identifiable cash flows. Assets and goodwill are assigned to these cash-generating units (CGUs). In the case of investments in group companies, barring investments the recoverable amount of which is determined based on the investee's equity (Note 3.4) and goodwill, the cash flows employed are based on the Strategic Plan approved by the Company, updated by the most recent budgets possible, extended to five years on the basis of regulations and expected market evolution, drawing on available industry forecasts and historical experience of price trends and volumes produced. The cash flows after the projected period are extrapolated using the growth rates estimated for each CGU or group of CGUs, and in no case exceed the average long-term growth rate for the business in which they operate. In all cases, they are lower than the growth rates stated in the strategic plan. Additionally, in order to estimate future cash flows in the calculation of residual values, all maintenance investments have been considered and, if applicable, renewal investments necessary to maintain the CGUs' production capacity.

11
The nominal growth rates used for each CGU or financial assets are as follows:
Growth 2017 (%)
Growth 2016 (%)
Gas distribution in Spain 1.0 1.0
Gas distribution Latin America 1.2-3.0 2.6-3.0
Electricity distribution Spain 1.2 1.2
Electricity distribution Latin America 1.6 -3.0 1.6 -3.0
Unión Fenosa Gas 1.8 1.8
Electricity Spain 2.2 2.2
International electricity 1.0-4.0 1.0-4.6
The parameters taken into account to determine the above growth rates, which represent the long-term growth of each line of business, are in line with the long-term growth of the country, obtained from estimated inflation for the period 2021 to 2045 according to the Economist Intelligence Unit (EIU). The discount rates before tax used to calculate the recoverable value of each CGU or group of CGUs are as follows:
Rates 2017 (%) Rates 2016 (%)
Gas distribution in Spain 6.2 6.2
Gas distribution Latin America 10.0-17.0 10.0-17.0
Electricity distribution Spain 5.2 5.2
Electricity distribution Latin America 8.8-11.5 8.8-16.6
Unión Fenosa Gas 13.4 11.9
Electricity Spain 6.3 6.1
International electricity 6.5-12.8 5.8-12.8
The parameters used in the breakdown of the above discount rates have been:
- Risk free bond: 10-year Bond reference market for the CGU, obtained from Bloomberg.
- Market risk premium: Estimate of the variable interest of each country at 10 years.
- Deleveraged Beta: According to average of each sector in each case, obtained from Bloomberg.
- Local current interest rate swaps: 10-year swap, obtained from Bloomberg.
- Equity-debt ratio: Sector average. The Unión Fenosa Gas discount rate, using the same parameters as the above, is calculated taking into account the contribution of each line of business to the consolidated figure of Unión Fenosa Gas. Apart from the discount rates, the most sensitive aspects that are included in the projections used and are based on industry forecasts and historical experience are as follows: In the case of the investment in Gas Natural Fenosa Generación, S.L.U. and Gas Natural Fenosa Renovables, S.L.U.:
- Electricity generated. Market demand evolution has been estimated based on the consensus expressed by several international bodies. The share has been estimated based on Gas Natural Fenosa's market share in each technology and on the expected evolution of each technology's share of the total market.
- Electricity price. Market electricity prices used have been calculated using models that cross
expected demand with supply forecasts, taking into account the foreseeable evolution of generation capacity in Spain, based on sector forecasts.

12
- Fuel costs. Estimated by reference to long-term supply contracts concluded by Gas Natural Fenosa, the forecast evolution of price curves and market experience.
- Operation and maintenance costs. Estimated from historical costs of managed park.
- Taxes established by Law 15/2012. For the investment in Unión Fenosa Gas, S.A.:
- Gas supply costs In accordance with the prices of the long-term contracts entered into by Unión Fenosa, S.A. and expected price fluctuations in spot markets.
- Gas volumes to be obtained from each supply source.
- Selling price of natural gas. Valued using predictive modelling based on the forecast performance
of price curves and experience in the markets where Union Fenosa Gas, S.A. operates. As a result of the above process, in 2017 the recoverable values of the CGUs' assets, calculated using the methodology described, were, except for the interest in Union Fenosa Gas higher than the carrying amounts recognised in these consolidated annual accounts, with the exception, basically, of the holding in Unión Fenosa Gas, S.A (Note 6). In 2016, impairment analyses did not reveal the need to post additional impairment losses or to reverse the impairments made in the previous year, except for the shares in Unión Fenosa Gas, S.A., in which an impairment losses was recognised (Note 6). The Company has carried out a sensitivity analysis of the unfavourable variations which, drawing on historical experience, may reasonably impact on the aforementioned sensitive parameters on which the recoverable amounts of CGUs have been determined. Specifically, the most relevant sensitivity analyses performed are as follows:
Increase Decrease
Discount rate 50 basis points -
Growth rate - 50 basis points
Electricity generated - 5%
Electricity price - 5%
Fuel and gas supply costs 5% -
Operating and maintenance costs 5% -
These sensitivity analyses performed separately for each basic assumption would not affect the conclusions drawn to the effect that the recoverable amount exceeds the carrying amount, except for Unión Fenosa Gas, S.A., the recoverable value of which is roughly equivalent to its carrying amount. So that, an increase of 50 basis points in the discount rate, keeping the rest of the hypothesis unchanged, would imply a deterioration in the value of Union Fenosa of 58 million euros.
3.4. Financial assets and liabilities
Investments in the equity of group and multi-group companies and associates These are stated at the lower of cost of acquisition or fair value, if the investments are acquired through a business combination, and the recoverable value. The recoverable value is determined as the larger of fair value minus cost of sale and the current value of the cash flows generated by the investment. If there is no better evidence of recoverable value, recoverable value will be the equity of the investee company adjusted by any tacit capital gains subsisting at the valuation date. The value adjustment, and as the case may be, its reversal, is recorded on the income statement in which it takes place. In non-cash contributions of a business to a group company, the investment is measured at the carrying amount of the assets and liabilities contributed, as per the consolidated Annual accounts on the transaction date. The consolidated Annual accounts of the largest group or subgroup into which the assets and liabilities are integrated, where the parent is a Spanish company, are used.

13
In mergers and spin-offs between group companies that involve the group's parent, directly or indirectly, the assets and liabilities acquired are measured at the amount that would be reflected in the group's Consolidated Annual accounts following the transaction. The difference between the cost of the shares handed over and the carrying amount of the assets and liabilities acquired, in the group's Consolidated annual accounts, is recognised under “Reserves” in the balance sheet.
Investments Purchases and sales of investments are recognized on trade-date, which is the date on which the Company commits to purchase or sell the asset, and are classified under the following categories: a) Loans and receivables These are non-derivative financial assets, with fixed or determinable pay outs, that are not listed on an active market, and for which there is no plan to trade in the short-term. They include current assets, except for those maturing after twelve months as from the balance sheet date that are classified as non-current assets. They are initially recorded at their fair value and then at their amortised cost using the effective interest rate method. A provision is set up for impairment of receivables when there is objective proof that all the outstanding amounts will not be paid. The provision is the difference between the book value of the asset and the present value of the estimated future cash flows discounted at the effective interest rate. b) Held-to-maturity financial assets These are assets representing debt with fixed or determinable pay outs and fixed maturity which the Company plans to and can hold until maturity. The valuation criteria for these investments are the same as those for loans and financial receivables. c) Fair value financial assets through profit or loss. These are assets acquired for short-term sale. Derivatives form part of this category unless they are designated as hedges. These financial assets are stated, both initially and in later valuations, at their fair value, and the changes in their value are taken to the income statement for the year. d) Available-for-sale financial assets Available-for-sale financial assets are non-derivative debt or equity instruments that are not designated in either category. The are recognised at fair value. Unrealised gains and losses that arise from changes in fair value are recorded in equity. When these assets are sold or impaired over a lengthy period of time, the accumulated adjustments to the reserves due to valuation adjustments are included in the Income statement as gains and losses. The fair values of quoted investments are based on current bid prices. In the case of shareholdings in unlisted companies, fair value is determined using valuation techniques that include the use of recent transactions between willing and knowledgeable parties, references to other instruments that are substantially the same and the analysis of discounted future cash flows. If none of these techniques can be used to determine fair value, investments are carried at cost less any impairment loss. Financial assets are written off when the contractual rights to the asset's cash flows have expired or they have been transferred; in the latter case, the risks and rewards of ownership must have been substantially transferred. Financial assets are not written off, and a liability is recognised in the same amount as the payment received, in asset assignments where the risks and rewards of ownership are retained.

14
Cash and cash equivalents Cash and cash equivalents include cash at hand, time deposits with financial entities and other short-term investments noted for their great liquidity with an original maturity no longer than three months as from the acquisition date. Borrowings Borrowings are initially recognised at their fair value, net of the transaction costs that they may have incurred. Any difference between the amount received and the repayment value is recognised in the income statement during the period of repayment using the effective interest rate method. Borrowings are classified as current liabilities unless they mature in more than twelve months as from the balance sheet date, or include tacit one-year prorogation clauses that can be exercised by the Company. Trade and other payables Trade and other current payables are financial liabilities that fall due in less than twelve months that are stated at their fair value and do not accrue explicit interest. They are accounted for at their nominal value. Those maturing in more than twelve months are considered non-current payables.
3.5. Financial derivatives and other financial instruments Derivatives are initially recognised at fair value on the date a derivative contract is entered into and are subsequently remeasured at their fair value. The method of recognising the resulting gain or loss depends on whether the derivative in designated as a hedging instrument, and if so, the nature of the asset being hedged. The Company documents at the inception of the transaction and periodically, the relationship between hedging instruments and hedged items, as well as its risk management objective. Additionally, the aims of risk management and hedging strategies are periodically reviewed. A hedge is considered to be highly effective when the changes in the fair value or the cash flows of the assets hedged are offset by the change in the fair value or cash flows of the hedging instrument, with an effectiveness ranging from 80% to 125%. The market value of the different financial instruments is calculated using the following procedures:
Derivatives listed on an official market are calculated on the basis of their year-end quotation.
Derivatives that are not traded on official markets are calculated on the basis of the discounting of cash flows based on year end market conditions, based on market conditions as at Consolidated balance sheet date or, for some non-financial items, on best estimation on forward curves of said non-financial item.
Fair values are adjusted by the expected impact of the risk of counterparty credit observable in positive valuation scenarios and the impact of own credit risk in observable negative valuation scenarios. The embedded derivatives in other non-financial instruments are booked separately as derivatives only when their economic characteristics and tacit risks are not closely related to the instruments in which they are embedded and when the whole is not being booked at fair value through profit and loss. For accounting purposes, the operations are classified as follows: 1. Derivatives eligible for hedge accountings
a) Fair value hedge
Changes in the fair value of derivatives that are designated and qualified as fair value hedges are recognised in the Income statement, together with any changes in the fair value of the hedged asset or liability that are attributable to the hedged risk.

15
b) Cash flow hedge
The effective portion of changes in the fair value of derivatives that are designated and qualify as cash flow hedges are recognised in equity. The gain or loss relating to the ineffective portion is recognised immediately in the Income statement. Amounts accumulated in equity are reclassified to the Income statement in the periods when the hedged item will affect profit or loss. c) Hedges of net foreign investments Fair value hedge accounting is applied to the differences arising from the exchange rates on loans in foreign currency for financing foreign investments in group and multi-group companies and associates made in the same functional currency. 2. Derivatives that do not qualify for hedge accounting Certain derivative instruments do not qualify for hedge accounting. Such derivatives are classified as at fair value through profit or loss, and changes in the fair value of any derivative instruments that do not qualify for hedge accounting are recognised immediately in the Income statement. 3. Energy purchase and sale agreements During the normal course of its business the Company enters into energy purchase and sale agreements which in most cases include “take or pay” clauses. by virtue of which the buyer takes on the obligation to pay the value of the energy contracted irrespective of whether the buyer receives it or not. These agreements are executed and maintained in order to meet the needs of receipt of physical delivery of energy projected by the Company in accordance with the energy purchase and sale estimates made periodically, which are monitored systematically and adjusted always may be by physical delivery. Consequently, these are negotiated contracts for “own use”, and, accordingly, lie beyond the standards on valuation of financial instruments. 3.6. Non-current assets held for sale and discontinued operations
The Company classifies as held-for-sale assets those assets for which, at the year end, active initiatives have been initiated for their sale, which is estimated to take place within the next twelve months. These assets are stated at the lower of their carrying value and fair value minus the costs necessary for their sale and are not subject to depreciation, since the date they are classified as non-current assets held for sale. Additionally, the Company considers discontinued activities the components (cash generating units or groups of cash generating units) that make up a business line or geographic area of operations, which are significant and which can be considered separately from the rest, and which have been sold or disposed by other means or which meet the conditions to be classified as held-for-sale. Entities acquired solely for resale are also classed as discontinued operations. 3.7. Share capital Share capital is represented by ordinary shares. Incremental costs directly attributable to the issue of new shares or options, net of taxes, are deducted from equity as a deduction from Reserves or share premium in the case of issues of capital with premiums. Dividends on ordinary shares are recognised as a deduction from equity in the period they are approved. Acquisitions of treasury shares are recorded at acquisition cost, deducted from equity until disposal. The gains and losses on disposal of treasury shares are recognised under "Reserves" in the Balance sheet.

16
3.8. Earnings per share Basic earnings per share are calculated as a quotient between profit or loss for and the average weighted number of ordinary shares in circulation during this period excluding the average number of treasury stock held by the Company. Diluted earnings per share are calculated as a quotient between profit or loss for attributable to the ordinary shareholders adjusted by the effect attributable to the potential ordinary shares having a dilutive effect and the average weighted number of ordinary shares in circulation during this period, adjusted by the average weighted number of ordinary shares that would be issued if all the potential ordinary shares were converted into ordinary shares of the Company. Accordingly, the conversion is considered to take place at the beginning of the period or at the time of issue of the potential ordinary shares, if these have been placed in circulation during the period itself. 3.9. Provisions for employee obligations a) Post-employment pension obligations and the like
- Defined contribution plans The Company, together with other group companies, is the promoter of a joint occupational pension plan, which is defined contribution plan for retirement and a defined benefit plan for the so-called risk contingencies, which are assured. Additionally, there is a defined contribution plan for a group of executives, for which the Company undertakes to make certain contributions to an insurance policy. Gas Natural Fenosa guarantees this group a yield of 125% of the CPI of the contributions made to the insurance policy. All the risks have been transferred to the insurance company, since it insures the guarantee indicated above. The contributions made have been recognised in “Staff costs” in the Income statement.
- Defined benefit plans For certain groups of employees there are commitments for defined benefit schemes in relation to the payment of supplements on retirement, death and disability pensions, in accordance with the benefits agreed by the entity, which have been transferred out of the company in the form of single premium insurance policies under Royal Decree 1588/1999, 15 October, which adopted the Regulations on the instrumentation of pension commitments. The liability recognised on the Balance sheet in respect of defined benefit pension plans is the present value of the defined benefit obligation at the Balance sheet date less the fair value of plan assets, together with adjustments for unrecognised actuarial gains or losses and past service costs. The defined benefit obligation is calculated annually by independent actuaries using the projected unit credit method. The present value of the defined benefit obligation is determined by discounting the estimated future cash outflows using interest rates of high-quality corporate bonds that are denominated in the currency in which the benefits will be paid, and that have terms to maturity approximating to the terms of the related pension liability. Actuarial losses and gains arising from changes in actuarial assumptions or from differences between assumptions and reality are recognised entirely in the period in which they arise, directly in equity reserves. Past service costs are recognised immediately in the Income statement, in "Staff costs". b) Other post-employment benefit obligations
The Company provides post-employment benefits to its retirees. The entitlement to these benefits is usually conditional on the employee remaining in service up to retirement age and the completion of a minimum service period. The expected costs of these benefits are accrued over the period of employment using an accounting methodology similar to that used for defined benefit pension plans. Actuarial gains and losses arising from changes in actuarial assumptions, are charged or credited to income in “Reserves”.
17
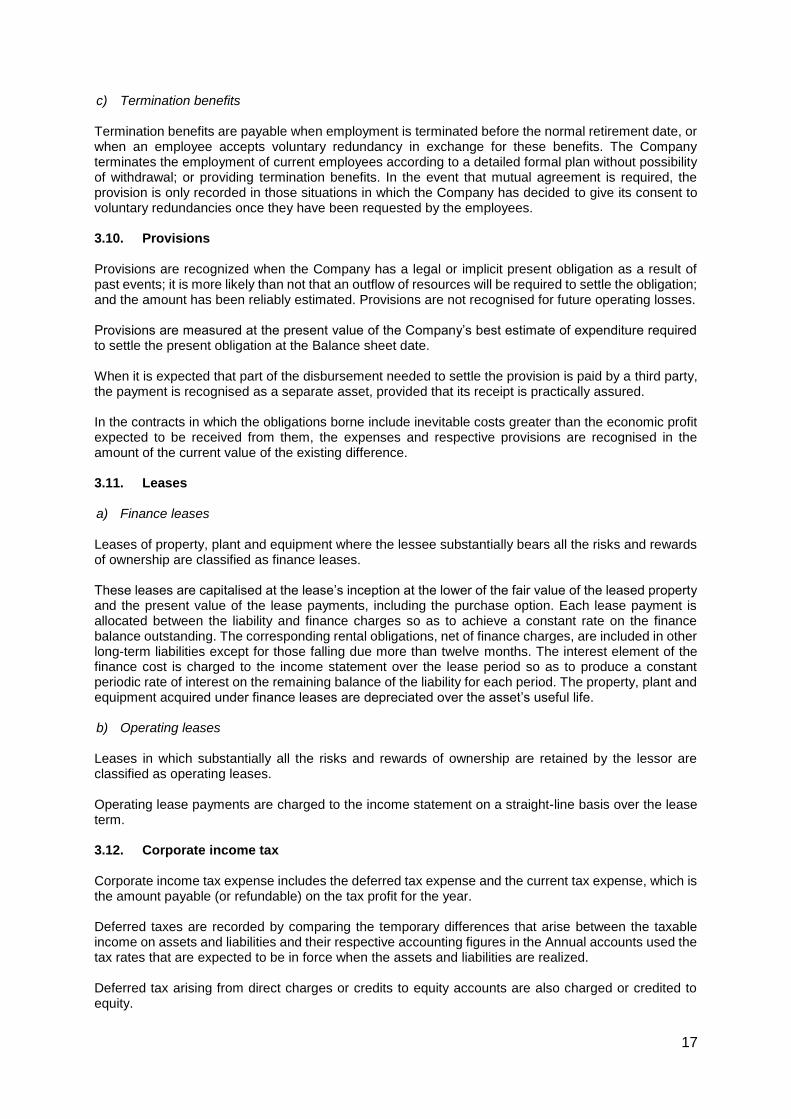
c) Termination benefits
Termination benefits are payable when employment is terminated before the normal retirement date, or when an employee accepts voluntary redundancy in exchange for these benefits. The Company terminates the employment of current employees according to a detailed formal plan without possibility of withdrawal; or providing termination benefits. In the event that mutual agreement is required, the provision is only recorded in those situations in which the Company has decided to give its consent to voluntary redundancies once they have been requested by the employees. 3.10. Provisions Provisions are recognized when the Company has a legal or implicit present obligation as a result of past events; it is more likely than not that an outflow of resources will be required to settle the obligation; and the amount has been reliably estimated. Provisions are not recognised for future operating losses. Provisions are measured at the present value of the Company’s best estimate of expenditure required to settle the present obligation at the Balance sheet date. When it is expected that part of the disbursement needed to settle the provision is paid by a third party, the payment is recognised as a separate asset, provided that its receipt is practically assured. In the contracts in which the obligations borne include inevitable costs greater than the economic profit expected to be received from them, the expenses and respective provisions are recognised in the amount of the current value of the existing difference. 3.11. Leases a) Finance leases
Leases of property, plant and equipment where the lessee substantially bears all the risks and rewards of ownership are classified as finance leases. These leases are capitalised at the lease’s inception at the lower of the fair value of the leased property and the present value of the lease payments, including the purchase option. Each lease payment is allocated between the liability and finance charges so as to achieve a constant rate on the finance balance outstanding. The corresponding rental obligations, net of finance charges, are included in other long-term liabilities except for those falling due more than twelve months. The interest element of the finance cost is charged to the income statement over the lease period so as to produce a constant periodic rate of interest on the remaining balance of the liability for each period. The property, plant and equipment acquired under finance leases are depreciated over the asset’s useful life. b) Operating leases
Leases in which substantially all the risks and rewards of ownership are retained by the lessor are classified as operating leases. Operating lease payments are charged to the income statement on a straight-line basis over the lease term. 3.12. Corporate income tax Corporate income tax expense includes the deferred tax expense and the current tax expense, which is the amount payable (or refundable) on the tax profit for the year. Deferred taxes are recorded by comparing the temporary differences that arise between the taxable income on assets and liabilities and their respective accounting figures in the Annual accounts used the tax rates that are expected to be in force when the assets and liabilities are realized. Deferred tax arising from direct charges or credits to equity accounts are also charged or credited to equity.

18
Deferred tax assets and tax credits are recognised only to the extent that it is probable that future taxable income will be available against which to offset temporary differences and apply tax credits. When tax rates change, deferred tax assets and liabilities are reestimated. These amounts are charged or credited to losses or profits, or to reserves, depending on the account to which the original amount was charged or credited. 3.13. Recognition of income and expenses a) General Sales are recognised when products are delivered to the customer and have been accepted by the customer, even if they have not been invoiced, or if applicable, services are rendered, and it is probable that the economic benefits associated with the transaction will flow to the entity. Net turnover for the year includes the estimate of the energy supplied that has not yet been invoiced The expenses are recognised on an accruals basis, immediately in the case of disbursements that are not going to generate future economic profits or when the requirements for recording them as assets are not met. Sales are stated net of tax and discounts. b) Other income and expenses In accounting for revenues from the service provision agreements is used the percentage realisation method in which, when the income can be reliably estimated, it is recorded on the basis of the degree of progress in the completion of the contract at the year end, calculated as a proportion of the costs incurred at that date of the estimated costs required to fulfil the contract.
If the income from the contract cannot be estimated reliably, the costs (and respective income) are recorded in the period in which they are incurred, provided that the former can be recovered. The contract margin is not recorded until there is certainty of its materialisation, based on cost and income planning.
In the event that the total costs exceed the contract revenues, this loss is recognised immediately in the Income statement for the year. Interest incomes and expenses are recognised using the effective interest method. Dividend income is recognised when the right to collect the dividend is established. The holding of shares in Group companies and associates is deemed to be the Company's most relevant ordinary activity from which periodic revenue is obtained. In accordance with the stance adopted by the Spanish Institute of Accounting and Auditing ("ICAC") in connection with the calculation of net revenue in holding companies (Reply number 2 in ICAC Official Gazette number 79), dividends from Group companies and associates, and interest received on loans granted to Group companies and associates, are recognised as “Revenue”. Additionally, the item “Impairment and results on disposal of equity instruments of Group companies and associates” is included in “Operating profit/(loss)”. 3.14. Foreign currency transactions Foreign currency transactions are translated to euro using the exchange rates in force at the transaction dates. Gains and losses resulting from the settlement of these transactions and translation at the year-end exchange rates of monetary assets and liabilities denominated in foreign currency are recognised in the income statement. 3.15. Transactions between related parties In general, transactions between related parties are recorded initially at their fair value. If the agreed price differs from its fair value, the difference is recorded taking into account the economic reality of the operation. The later valuation is made in accordance with the provisions of the respective legislation.

19
Notwithstanding the above, in merger, de-merger or non-cash contribution operations of a business, the assets that make up the acquired business are stated at the amount corresponding to the same once the operation takes place in the Consolidated Annual accounts of Gas Natural Fenosa. In these cases, the difference that could arise between the net value of the assets and liabilities of the acquired company, adjusted by the balance of the groupings of grants, donations and bequests received, or any value adjustments or capital or share premiums, as the case may be, issued by the merging company, is recorded under “Reserves” in the balance sheet. 3.16. Business combinations Business combinations are recorded using the acquisition method. The cost of an acquisition is calculated using the fair value of the assets given, the equity instruments issued and the liabilities incurred or borne on the transaction date plus the costs directly attributable to the acquisition. The valuation process required in order to use the acquisition method is completed within the period of one year as from the acquisition date. The identifiable assets acquired and the liabilities or contingent liabilities incurred or borne as a result of the transaction, are initially stated at their fair value at the date of acquisition, provided that this can be reliably measured. The surplus cost of the acquisition in relation to the fair value of the shareholding of the Company in the net identifiable assets acquired is recorded as goodwill. If the cost of acquisition is less than the fair value of the net assets acquired, the difference is recognised directly in the Income statement. 3.17. Cash flow statement The cash flow statements has been prepared using the indirect method and contain the use of the following expressions and their respective meanings:
a) Operating activities: activities that constitute ordinary Company revenues, as well as other activities that cannot be qualified as investing or financing.
b) Investing activities: acquisition, sale or disposal band other means of assets in the long-term and other investments not included in cash and cash equivalents.
c) Financing activities: activities that generate changes in the size and composition of equity and liabilities that do not form part of operating activities.
3.18. Significant accounting estimates and judgments The preparation of Annual accounts requires the formulation of estimates and judgments. The valuation standards that require a large number of estimates are set out below: a) Intangible assets and Property, plant and equipment (Notes 3.1 and 3.2) The determination of useful life of intangible assets and property, plant and equipment requires estimates of their degree of use, as well as expected technological evolution. The assumptions regarding the degree of use, technological framework and future development involve a significant degree of judgement, insofar as the timing and nature of future events are difficult to foresee. b) Impairment of assets (Note 3.3) The estimated recoverable value of the CGU applied to the impairment tests has been determined using the discounted cash flows based on the projections approved by the Company, which have historically been substantially met. c) Derivatives or other financial instruments (Note 3.5)
The fair value of financial instruments traded in active markets is based on quoted market prices at the Balance sheet date. The quoted market price used for financial assets is the current bid price.

20
The fair value of financial instruments that are not traded in an active market is determined by using valuation techniques. The Company uses a variety of methods and makes assumptions that are based on market conditions existing at each balance sheet date. Other techniques, such as estimated discounted cash flows, are used to determine fair value for the remaining financial instruments. The fair value of interest rate swaps is calculated as the present value of the estimated future cash flows. The fair value of forward foreign exchange contracts is determined using quoted forward exchange rates at the Balance sheet date. The fair value of commodity derivatives is calculated by using forward prices curves. The recoverable value of the investments in the equity of group and multi-group companies and associates is determined as the greater of their fair value less costs of sale and the current value of the cash flows from the investment. The carrying value less impairment provision of trade receivables and payables are assumed to approximate their fair values. The fair value of financial liabilities for disclosure purposes is estimated by discounting the future contractual cash flows at the current market interest rate that is available to the Company for similar financial instruments. d) Provisions for employee benefits (Note 3.9) A number of assumptions must be used to calculate pension costs, other costs of post-retirement benefits and other post-retirement liabilities. The Company estimates at each year end the provision necessary to meet its pension liabilities and the like, in accordance with the advice from independent actuaries. The changes affecting such assumptions may result in the recording of different amounts and liabilities. The most significant assumptions for the measurement of pension or post-retirement benefit liabilities are energy consumption by beneficiaries during retirement, retirement age, inflation and the discount rate employed. Social security coverage assumptions are also essential to determine other post-retirement benefits. Future changes to these assumptions will have an impact on future pension costs and liabilities. e) Provisions (Note 3.10)
The Company makes an estimate of the amounts to be settled in the future, including amounts relating to contractual obligations, outstanding litigation, restoration of land or other liabilities. These estimates are subject to the interpretation of current events and circumstances, projections of future events and estimates of their financial effects f) Income tax (Note 3.12) The calculation of the income tax expense requires interpretations of tax legislation in the jurisdictions in which the Company operates. The determination of expected outcomes of outstanding disputes and litigation requires the preparation of significant estimates and judgment. The Company evaluates the recoverability of the deferred income tax assets based on estimates of future taxable income. Deferred tax liabilities are recognised based on estimates of the net assets that will not be tax deductible in the future.

21
Note 4. Intangible assets Set out below there is an analysis of movements in intangible assets:
Computer software
Other intangible assets Subtotal Goodwill Total
Cost 2 -- 2 815 817
Accumulated amortization (2) -- (2) (543) (545)
Carrying value at a 01/01/2016 -- -- -- 272 272
Investment 4 1 5 -- 5
Amortisation charge -- -- -- (82) (82)
Carrying value at 31/12/2016 4 1 5 190 195
Cost 6 1 7 815 822
Accumulated amortization (2) -- (2) (625) (627)
Carrying value at a 01/01/2017 4 1 5 190 195
Amortisation charge -- -- -- (81) (81)
Carrying value at a 31/12/2017 4 1 5 109 114
Cost 6 1 7 815 822
Accumulated amortization (2) -- (2) (706) (708)
Carrying value at a 31/12/2017 4 1 5 109 114
Goodwill derives from the vertical merger of Unión Fenosa, S.A. completed in 2009 and is attributable to the benefits and synergies arising from the integration with the Gas Natural Fenosa Group. In 2016, due to changes in accounting regulations, the amortisation of this goodwill commenced and the option was chosen to calculate the effect of the change in the goodwill amortisation from the acquisition date of the assets concerned against the goodwill reserve. Intangible assets include, at 31 December 2017, fully amortised assets still in use totalling Euros 2 million (Euros 2 million at 31 December 2016). Note 5. Property, plant and equipment Set out below is an analysis showing movements in Property, plant and equipment during 2017 and 2016:
Land and buildings Other PPE Total
Cost 248 34 282
Accumulated depreciation (81) (22) (103)
Carrying value at a 01/01/2016 167 12 179
Investment 12 3 15
Divestment (23) -- (23)
Depreciation charge (10) (2) (12)
Reclassifications and transfers (6) -- (6)
Carrying value at 31/12/2016 140 13 153
Cost 201 33 234
Accumulated depreciation (61) (20) (81)
Carrying value at a 01/01/2017 140 13 153
Investment 12 4 16
Divestment (8) -- (8)
Depreciation charge (7) (3) (10)
Reclassifications and transfers (3) 3 --
Carrying value at a 31/12/2017 134 17 151
Cost 197 40 237
Accumulated depreciation (63) (23) (86)
Carrying value at a 31/12/2017 134 17 151

22
In November 2017, the Company sold the building located in calle Lérida, Madrid, for Euros 12 million, generating a capital gain before income tax of Euros 3 million. The Company has entered into an operating lease without a purchase option for a period of ten years which may be extended for a further five-year period with the acquiring company. At the date of the transaction the remaining useful life of the property transferred was considerably greater than the maximum lease period. In December 2016, Gas Natural SDG, S.A., General de Edificios y Solares, S.L. and Unión Fenosa Distribución, S.A., 100% owned subsidiaries of Gas Natural Fenosa, sold four buildings located in Madrid (Avenida San Luis, 77, Antonio López, 193, Acanto, 11-13 and Avenida América, 38). Gas Natural SDG, S.A. sold the building located in Avenida América 38, for Euros 64 million, generating a pre-tax capital gain of Euros 36 million. The Company and the acquiring companies entered into operating lease agreements without any purchase option for a term of 10 years for each of these properties, which may be extended for a further five years except for the building in Avenida América 38 (Note 26). At the date of the transaction, the remaining useful lives of the properties was considerably greater than the maximum lease period, in all cases. In 2017 there have been disposals of fully-depreciated assets totalling Euros 4 million (Euros 7 million at 31 December 2016). Property, plant and equipment include fully-depreciated assets still in use totalling Euros 15 million at 31 December 2017 (Euros 16 million in 2016). It is the Company’s policy to take out insurance where deemed necessary to cover risks that could affect its property, plant and equipment. At 31 December 2017 and 31 December 2016, the Company had no investment commitments. Note 6. Investments in group companies and associates A breakdown of the investments in group companies and associates is as follows:
At 31.12.17 At 31.12.16
Equity instruments 13,400 13,688 Loans 15,615 15,755
Non-current 29,015 29,443
Loans 1,480 816 Other financial assets 743 67
Current 2,223 883
TOTAL 31,238 30,326
Movements during the year in non-current investments in group companies and associates are as follows:
Shareholdings
in group companies
Loans to group companies
Shareholdings in associates
Total
Balance at 1.01.2016 14,602 14,695 11 29,308
Additions 40 1,584 -- 1,624
Divestments (759) (259) -- (1,018)
Reclassification -- (266) -- (266)
Charge/reversal provisions (206) -- -- (206)
Exchange differences -- 1 -- 1
Balance at 31.12.2016 13,677 15,755 11 29,443
Additions 26 2 -- 28
Divestments (180) (12) (1) (193)
Reclassification -- (124) -- (124)
Charge/reversal provisions (133) -- -- (133)
Exchange differences -- (6) -- (6)
Balance at 31.12.2017 13,390 15,615 10 29,015

23
2017 The most significant movements in the item “Shareholdings in Group companies and associates” in 2017 relate to: - Capital contribution to offset losses in Gas Natural S.U.R. SDG, S.A. in the amount of Euros 26
million. - Capital reduction through a reimbursement of contributions in Clover Financial and Treasury
Services, D.A.C in the amount of USD 75 million. The reduction in the shareholding has generated a Euros 7 million profit due to the effect of the exchange rate.
- Decrease in the carrying amount of the holding due to the distribution of reserves by Global Power
Generation, S.A. in the amount of Euros 17 million. - In August 2017, it made up the sale of 20% of the Gas Distribution Spain business to a long-term
infrastructure investor consortium made up of Allianz Capital Partners (ACP) and Canada Pension Plan Investment Board (CPPIB) was agreed in the amount of Euros 1,500 million. The operation is expected to be completed during the year 2018, once the corresponding authorizations are obtained. It involves a transfer without any loss of control for Gas Natural Fenosa.
2016 The most significant movements in the heading “Shareholdings in Group companies and associates” in 2016 related to: - Capital contribution to offset losses posted by the company Gas Natural Exploración, S.L. in the
amount of Euros 30 million. - Capital contribution to offset losses in Gas Natural S.U.R. SDG, S.A. in the amount of Euros 10
million. - Capital reduction through the reimbursement of contributions in Clover Financial and Treasury
Services, D.A.C. in the amount of USD 825 million. The reduction in the shareholding has generated a Euros 33 million profit due to the effect of the exchange rate.
- Sale of the 50% shareholding in Nueva Generadora del Sur, S.A to Gas Natural Generación, S.L.U.
at its carrying amount of Euros 1 million.
- Capital reduction in Natural Re, S.A. in the amount of Euros 4 million. - The distributions of reserves by Global Power Generation, S.A. and Gasifica, S.A. amounting to
Euros 64 million and Euros 1 million, respectively, has been recorded as a decrease in the carrying value of shareholdings.
- During the year Gasifica, S.A. was dissolved, leading to a reduction in the investment of Euros 3
million and a loss of Euros 2 million. The cumulative provision for the impairment of shareholdings in Group companies and associates totals Euros 1,620 million at 31 December 2017 (Euros 1,487 million at 2016), relating basically to the following companies: - Gas Natural Exploración, S.L.: the recoverable amount has been calculated on the basis of its
equity. No impairment has been recognised during 2017. The provision at 31 December 2017 totals Euros 213 million (Euros 213 million at 31 December 2016).
- Unión Fenosa Gas, S.A.: in 2017 impairment was recognised with respect to the interest in Unión
Fenosa Gas, S.A. amounting to Euros 109 million due to the change in the contribution to the consolidated figure of the holding in said company. (Note 3.3.) provides details of the assumptions relating to the discount and growth rates. The other assumptions have not been altered.

24
In 2016 an impairment of Euros 174 million was recognised with respect to the interest in Unión Fenosa Gas, S.A. due to the need to update the assumption concerning the supply cost in view of the forecast evolution of the energy scenario for Unión Fenosa Gas, S.A. and the change in the contribution to consolidation. In previous years an impairment of the interest in Unión Fenosa Gas, S.A. amounting to Euros 1,088 million had been recognised basically due to the substantial failure of the Egyptian supplier to comply with the agreements to re-establish supplies of gas to the Damietta (Egypt) liquefaction plant and the change in the contribution to the consolidated figure of the interest in that company. The provision at 31 December 2017 totals Euros 1,371 million (Euros 1,262 million at 31 December 2016).
Financial income for dividends received from investments in equity instruments of group companies and associates during the years 2017 and 2016, correspond to the following companies:
2017 2016
Sagane, S.A. 335 177 Gas Natural Servicios SDG, S.A. 179 62 Gas Natural Distribución Latinoamérica, S.A. 178 -- Nedgia, S.A. 156 354 Gas Natural Aprovisionamientos SDG, S.A. 155 242 Gas Natural Comercializadora, S.A. 134 326 Unión Fenosa Distribución, S.A. 133 241 Gas Natural Fenosa Internacional, S.A. 88 -- Global Power Generation, S.A. 41 58 Clover Financial And Treasury Services, D.A.C. 40 45 General de Edificios y Solares, S.L. 19 2 Gas Natural Capital Markets, S.A. 8 2 Gas Natural Almacenamientos Andalucía, S.A. 1 8 Gas Natural Fenosa Engineering, S.L.U. 1 3 Compañía Española de Industria Electroquímica, S.A. 1 -- Other 1 -- Unión Fenosa Preferentes, S.A. -- 29 Gas Natural Informática, S.A. -- 5 Gas Natural Fenosa Finance, B.V. -- 3 Gasifica, S.A. -- 2 Unión Fenosa Minería, S.A. -- 1
TOTAL 1,470 1,560

25
The breakdown of shareholdings in group companies is set out below:
Data at 31 December 2017
% interest Equity
Company Registered
Office Activity
Carrying value 2017
Carrying value 2016
Direct Indirect Total Capital Reserves
(1) Profit/(loss)
Interim dividend
Other (2)
Gas Natural Aprovisionamientos SDG, S.A. Spain Gas marketing 18 18 100.0 -- 100.0 1 19 128 (120) 7
Gas Natural Fenosa LNG, S.L. Spain Gas marketing 2 2 100.0 -- 100.0 2 -- -- -- --
La Energía, S.A. Spain Gas marketing 11 11 100.0 -- 100.0 11 5 -- -- --
Sagane, S.A. Spain Gas marketing 42 42 100.0 -- 100.0 95 22 192 (190) (1)
Unión Fenosa Gas, S.A. Spain Gas marketing 1,065 1,179 50.0 -- 50.0 33 660 (57) -- 9
Gas Natural Comercializadora, S.A. Spain Gas and electricity marketing 121 121 100.0 -- 100.0 3 102 (17) -- 24
Gas Natural S.U.R. SDG, S.A. Spain Gas and electricity marketing 70 44 100.0 -- 100.0 2 27 (22) -- (2)
Gas Natural Servicios SDG, S.A. Spain Gas and electricity marketing 106 106 100.0 -- 100.0 3 51 10 (10) (1)
Unión Fenosa Distribución, S.A. Spain Electricity distribution 1,630 1,630 100.0 -- 100.0 833 440 154 (125) 337
Holding de Negocios de Gas, S.A.U. Spain Gas distribution -- -- 100.0 -- 100.0 -- -- -- -- --
Gas Natural Fenosa Generación, S.L.U. Spain Electricity generation 3,897 3,897 100.0 -- 100.0 552 1,280 (456) -- 4
Gas Natural Fenosa Renovables, S.L.U. Spain Electricity generation 397 397 100.0 -- 100.0 90 115 13 -- --
Global Power Generation, S.A. Spain Electricity generation 1,514 1,556 75.0 -- 75.0 20 1,850 54 (51) (48)
P.H. La Perla, S.A. Costa Rica Electricity generation -- -- 100.0 -- 100.0 -- -- -- -- --
Toledo PV A.I.E. Spain Electricity generation -- -- 33.3 -- 33.3 -- 1 1 -- --
Gas Natural Almacenamientos Andalucía, S.A. Spain Gas infrastructures 8 8 100.0 -- 100.0 -- 8 2 -- --
Gas Natural Exploración, S.L. Spain Gas infrastructures 9 9 100.0 -- 100.0 15 (5) 1 -- --
Petroleum, Oil & Gas España, S.A. Spain Gas infrastructures 41 41 32.3 67.7 100.0 4 20 (4) -- 2
Natural Re, S.A. Luxembourg Insurance 9 9 100.0 -- 100.0 4 63 (11) -- 11
Compañía Española de Industrias Electroquímicas, S.A. Spain Services 4 4 98.5 -- 98.5 3 13 1 -- --
General de Edificios y Solares, S.L. Spain Services 63 63 100.0 -- 100.0 34 35 11 -- --
Clover Financial and Treasury Services, D.A.C. Ireland Financial services 542 680 100.0 -- 100.0 -- 355 33 -- 204
Gas Natural Capital Markets, S.A. Spain Financial services -- -- 100.0 -- 100.0 -- -- 6 -- --
Gas Natural Fenosa Finance, B.V. Netherlands Financial services 7 7 100.0 -- 100.0 -- 6 1 -- (2)
Unión Fenosa Financiación, S.A. Spain Financial services 11 11 100.0 -- 100.0 1 -- -- -- --
Unión Fenosa Preferentes, S.A.U. Spain Financial services -- -- 100.0 -- 100.0 -- 1 1 -- 109
Gas Natural Informática, S.A. Spain IT services 20 20 100.0 -- 100.0 20 8 (2) -- --
Gas Natural Fenosa Engineering, S.L. Spain Engineering services 24 24 100.0 -- 100.0 -- 18 (1) -- 1
Nedgia S.A. Spain Holding company 1,981 1,981 100.0 -- 100.0 300 1,682 372 (140) --
Gas Natural Distribución Latinoamérica, S.A. Spain Holding company 558 558 100.0 -- 100.0 402 236 173 (149) --
La Propagadora del Gas, S.A. Spain Holding company 10 10 100.0 -- 100.0 10 1 -- -- --
Gas Natural Fenosa Internacional, S.A. Spain Holding company 944 944 100.0 -- 100.0 250 332 93 (88) 37
Unión Fenosa Minería, S.A. Spain Holding company 286 305 100.0 -- 100.0 11 169 2 -- --
TOTAL 13,390 13,677
Appendix I to Gas Natural Fenosa's consolidated annual accounts provides a breakdown of other indirect shareholdings.
(1) Includes the share premium, reserves, prior-year losses and retained earnings.
(2) Includes measurement adjustments, other equity instruments and grants, donations and bequests.

26
The non-current loans to group companies which at 31 December 2017 total Euros 15,615 million mature in 2019 (at 31 December 2016, Euros 15,755 million maturing in 2018). Set out below are movements during 2017 and 2016 in loans and other current financial assets:
Loans to group
companies Other financial
assets Total
Balance at 1.1.2016 727 3 730
Additions 424 64 488
Divestments (673) -- (673)
Reclassifications 338 -- 338
Balance at 31.12.2016 816 67 883
Additions 882 740 1,622
Divestments (594) (64) (658)
Reclassifications 376 -- 376
Balance at 31.12.2017 1,480 743 2,223
There are no significant differences between carrying values and fair values in the balances under Loans to group companies and other receivables. The heading Loans to group companies includes loans to Group companies amounting to Euros 962 million (Euros 84 million in 2016) and cash pooling balances with investee companies, as manager of the Group's centralised cash system amounting to Euros 481 million (Euros 700 million in 2016). It also includes accrued unmatured interest of Euros 37 million (Euros 32 million in 2016). At 31 December 2017, loans to Group companies and associates have borne interest at a rate of 2.66% (2.54% in 2016) in the case of non-current amounts, and 1% (1% in 2016) in the case of current amounts. Dividends pending collection at 31 December 2017 amounted to Euros 739 million, recorded under “Other current financial assets” (Euros 64 million at 31 December 2016).
Note 7. Investments The breakdown of investments by category is as follows:
At 31 December 2017
Available-for-sale financial assets
Loans and receivables
Assets at fair value through profit or
loss Hedging
derivatives Total
Equity instruments 5 -- -- -- 5
Derivatives (Note 13) -- -- -- 8 8
Other financial assets -- 27 -- -- 27
Non-current investments 5 27 -- 8 40
Derivatives (Note 13) -- -- 43 13 56
Other financial assets -- 29 -- -- 29
Current investments -- 29 43 13 85
Total 5 56 43 21 125

27
At 31 December 2016
Available-for-sale financial assets
Loans and receivables
Assets at fair value through profit or
loss Hedging
derivatives Total
Equity instruments 5 -- -- -- 5
Derivatives (Note 13) -- -- 31 28 59
Other financial assets -- 10 -- -- 10
Non-current investments 5 10 31 28 74
Other financial assets -- 27 -- -- 27
Current investments -- 27 -- -- 27
Total 5 37 31 28 101
Available-for-sale financial assets All available-for-sale financial assets relate to unlisted shareholdings at 31 December 2017 and 31 December 2016. Loans and receivables The breakdown of Loans and other receivables is as follows:
At 31.12.17 At 31.12.16
Loans to companies 2 2
Gas system income deficit financing 19 -
Deposits and guarantee deposits 6 8
Non-current 27 10
Deposits and guarantee deposits 29 27
Current 29 27
Total 56 37
The heading “Gas system revenue deficit financing” includes temporary mismatches between gas system revenues and costs accumulated in 2017, funded by Gas Natural Fenosa pursuant to Law 18/2014 of 17 October. This amount has been acquired by the Company from the distribution companies of Gas Natural Fenosa and will be recovered through gas system settlements as the right to the recovery of this amount is generated in the following five years, recognising a market interest rate. The amount of this financing has been recognised based on the estimated recovery period.
Note 8. Trade and other receivables The breakdown of this account is as follows: At 31.12.17 At 31.12.16
Trade receivables 145 169
Trade receivables, group companies and associates 345 368
Sundry receivables 38 77
Provision (24) (24)
Derivatives (Note 13) 117 76
Current income tax asset 29 --
Public Administration -- 4
Total 650 670
In general, amounts billed pending collection do not bear interest, being the average maturity period less than 20 days.

28
Movements in the bad debt provision are as follows:
2017 2016
At 1 January (24) (21)
Net charge for the year (Note 20) -- (5)
Other -- 2
At 31 December (24) (24)
Note 9. Cash and cash equivalents Cash and cash equivalents include:
At 31.12.17 At 31.12.2016
Cash at banks and in hand 1,453 502
Other cash equivalents 100 --
Total 1,553 502
At 31 December 2017, investments in Cash equivalents mature in less than three months at a weighted effective interest rate of 0.073%.
Note 10. Equity The main items of Equity are as follows: Share capital and share premium The variations during the years 2017 and 2016 in the number of shares and share capital and share premium accounts have been as follows:
Number of shares Share capital Share premium Total
At 01 January 2016 1,000,689,341 1,001 3,808 4,809
Changes: -- -- -- --
At 31 December 2016 1,000,689,341 1,001 3,808 4,809
Changes: -- -- -- --
At 31 December 2017 1,000,689,341 1,001 3,808 4,809
All issued shares are fully paid up and carry equal voting and dividend rights. The Spanish Companies Act specifically allows the use of the “Share premium balance” to increase capital and imposes no specific restrictions on its use. The most relevant holdings in the Company’s share capital at 31 December 2017 and 2016, in accordance with the public information available or the communication issued by the Company itself, are as follows:
% interest in share capital
2017 2016
- Fundación Bancaria Caixa d'Estalvis i Pensions de Barcelona, “la Caixa”(1) 24.4 24.4
- Repsol, S.A. 20.1 20.1
- Global Infrastructure Partners III (2) 20.0 20.0
- Sonatrach 4.0 4.0
(1) Through Criteria Caixa S.A.U. (2) Global Infrastructure Partners III, whose investment manager is Global Infrastructure Management LLC, holds its interest indirectly through GIP III Canary 1, S.à.r.l.

29
On 21 September 2016 the shareholders of Gas Natural Fenosa, Criteria Caixa, S.A.U. (la Caixa) and Repsol, S.A. (Repsol) reported the sale to GIP III Canary 1, S.à.r.l. (GIP) of shares representing 20% (10% Criteria and 10% Repsol) of the Company’s capital in accordance with the sale and purchase agreement concluded on 12 September 2016. As a result of this sale, the agreement between ‘‘la Caixa” and Repsol concerning Gas Natural of 11 January 2000, amended on 16 May 2002, 16 December 2002 and 20 June 2003, was terminated and the composition of the Board of Directors and Board committees of Gas Natural Fenosa changed; in addition, the Regulations of its Board of Directors envisages a majority of two thirds of Board members for the approval of certain reserved matters. The Company’s Board of Directors is empowered, within a maximum period of five (5) years as from 20 April 2017, to increase capital by Euros 500,344,670 for monetary consideration on one or more occasions, when and in the amount it so determines, by issuing voting or non-voting common, preference or redeemable shares, at a premium or otherwise, to be paid in cash, without the need for further shareholder approval, including the power to totally or partially override pre-emptive subscription rights up to 20% of the amount of capital stock at the date of this authorisation, and to amend the Articles of Association as may be required as a result of any capital increase(s) undertaken by virtue of the aforementioned authorisation, allowing for incomplete subscription, all in conformity with the provisions of Article 297.1.b) of the Spanish Capital Companies Act; this power may be sub-delegated to the Executive Committee. All the Company’s shares are traded on the four official Spanish Stock Exchanges and the “Mercado continuo” and form part of Spain’s Ibex 35 stock index. The Company's share price at 31 December 2017 was Euros 19.25 (Euros 17.91 at 31 December 2016). Reserves Reserves includes the following:
2017 2016
Legal reserve 200 200
Statutory reserve 100 100 RD 7/96 revaluation reserve -- 225
Goodwill reserve 191 496 Voluntary reserves 7,200 6,603 Other reserves 280 274
7,971 7,898
At the annual general meeting held on 20 April 2017, the shareholders agreed to the transfer to voluntary reserves of Euros 305 million from the Goodwill reserve and Euros 225 million from the Royal Decree-Law 7/96 Revaluation reserve. Legal reserve Appropriations to the legal reserve are made in compliance with the Spanish Capital Companies Act, which stipulates that 10% of the profits must be transferred to this reserve until it represents at least 20% of share capital. The legal reserve can be used to increase capital in the part that exceeds 10% of the capital increased. Except for the use mentioned above, and as long as it does not exceed 20% of share capital, the legal reserve can only be used to offset losses in the event of no other reserves being available. Statutory reserve Under the Company’s Articles of Association, 2% of net profit for the year must be allocated to the statutory reserves until it reaches at least 10% of share capital. Revaluation reserve The revaluation reserve can be used to offset accounting losses, increase share capital, or can be allocated to freely distributable reserves, provided that that the monetary gain has been realised. The part of the gain that will be considered realised is the part relating to the amortisation recorded or when

30
the revaluated assets have been transferred or written off the books of account. Goodwill reserve Law 22/2015 on Auditing eliminated the requirement to record annually the restricted reserve for at least 5% of the goodwill figuring under assets on the balance sheet, stipulating that in periods commencing as from 1 January 2016, the goodwill reserve is to be reclassified to voluntary reserves and will be available in the amount that exceeds the goodwill recognised under assets on the balance sheet. Voluntary and other reserves Relates basically to voluntary reserves for undistributed profits, also including the effects of the measurement of shareholdings in group companies as a result of transactions between group companies recognised in the same amounts stated in Gas Natural Fenosa's Consolidated annual accounts. Treasury shares Movements during 2017 and 2016 involving the Company’s treasury shares are as follows:
Number of shares In million euro
% Capital
At 01 January 2016 -- -- --
Acquisitions 3,049,189 53 0.3% Disposals (2,298,644) (40) (0.2%)
At 31 December 2016 750,545 13 0.1%
Acquisitions 7,623,586 147 0.8%
Share Acquisition Plan (336,625) (7) (0.1%)
Disposals (8,037,506) (153) (0.8%)
At 31 December 2017 -- -- --
On 14 May 2015, the shareholders in general meeting authorised the Board of Directors to purchase, within five years, in one or more operations, a maximum of 10% of share capital or the maximum figure applicable under legislation prevailing at the time of acquisition. The relevant Company shares must be fully paid in and the nominal value of the shares directly or indirectly acquired, added to those already held by the Company and its subsidiaries, may not exceed 10% of share capital or any other limit established by law. In 2017 the profit made on transactions involving treasury shares of Gas Natural Fenosa amounted to Euros 0.5 million, recognised under “Other reserves” (Euros 0.4 million profit in 2016). The minimum and maximum acquisition price will be the share price on the continuous market of the Spanish stock exchanges, within an upper or lower fluctuation of 5%. Earnings per share Basic earnings per share are calculated by dividing profit by the weighted average number of ordinary shares in issue during the year.
At 31.12.17 At 31.12.16
Profit for the year 1,023 1,067
Weighted average number of ordinary shares in issue 1,000,478,210 1,000,468,342
Earnings per share (in Euros):
- Basic 1.02 1.07
- Diluted 1.02 1.07

31
The average weighted number of ordinary shares used in the calculation of earnings per share in 2017 and 2016 is as follows:
2017 2016
Weighted average number of ordinary shares 1,000,689,341 1,000,689,341
Weighted average number of treasury shares (211,131) (220,999)
Weighted average number of shares in issue 1,000,478,210 1,000,468,342
The Company has no financial instruments that could dilute the earnings per share. Dividends Set out below is a breakdown of the payments of dividends made in 2017 and 2016:
2017 2016
% of
Nominal Euros per
share Amount
% of Nominal
Euros per share
Amount
Ordinary shares 100% 1.00 1,001 133% 1,33 1,331
Other shares (without voting rights, redeemable, etc.)
- - - - - -
Total dividends paid 100% 1.00 1,001 133% 1.33 1,331
a) Dividends charged to income statement
100% 1.00 1,001 133% 1.33 1,331
b) Dividends charged to reserves or share premium account
- - - - - -
c) Dividends in kind - - - - - -
2017 The proposal for the distribution of 2016 profits approved by the Annual General Meeting held on 20 April 2017 included the payment of a supplementary dividend of Euros 0.67 per share, for a total amount of Euros 671 million, paid on 27 June 2017. On 25 July 2017, the Company’s Board of Directors resolved to pay an interim dividend of Euros 0.330 per share out of 2017 results, for a total of Euros 330 million, which was paid on 27 September 2017. The Company had sufficient liquidity to pay out the dividend at the approval date, with the necessary liquidity to proceed to payment pursuant to the Spanish Companies Act. The provisional liquidity statement drawn up by the Directors on 25 July 2017 as follows:
Profit after tax 449
Reserves to be recognised --
Maximum amount distributable 449
Forecast interim dividend payment 330
Cash resources 302
Undrawn credit facilities 6,940
Total liquidity 7,242

32
On 6 February 2018, the Board of Directors approved the following proposal for the distribution of the Company's net profit for 2017, for submission to the Annual General Meeting:
Available for distribution
Profit/(loss) 1,023
Distribution
To Voluntary reserve 22
To Dividend 1,001
This proposal for the distribution of profits prepared by the Board for approval by the Annual General Meeting includes the payment of a supplementary dividend of Euros 0.67 per share for each qualifying share outstanding at the proposed date of payment, 27 June 2018. The voting rights attaching to the treasury shares, except for the right to the free assignment of new shares, will be allocated proportionally to the remaining shares. 2016 Included the payment of an interim dividend of Euros 0.408 per share out of 2015 profits, for a total amount of Euros 408 million, agreed on 30 October 2015 and paid out on 8 January 2016. The Annual General Meeting held on 4 May 2016 approved the payment of a supplementary dividend of Euros 0.592 per share, for a total amount of Euros 593 million, paid on 30 June 2016. On 22 July 2016, the Company’s Board of Directors approved an interim dividend of Euros 0.330 per share of 2016, for a total of Euros 330 million, which was paid on 27 September 2016.
Note 11. Provisions The breakdown of provisions at 31 December 2017 and 2016 is as follows: At 31.12.17 At 31.12.16
Provisions for employee obligations 272 285
Other provisions 193 182
Non-current provisions 465 467
Provisions for employee obligations
A breakdown of the provisions related to employee obligations is as follows: 2017 2016
Pensions and other
similar obligations
Other obligations
with personnel Total
Pensions and other
similar obligations
Other obligations
with personnel Total
At 1 January 275 10 285 274 9 283
Contributions charged to profits 6 6 12 8 7 15
Payments during the year (18) -- (18) (10) -- (10)
Changes recognised directly in equity
(8) -- (8) (4) -- (4)
Transfers and other applications 7 (6) 1 7 (6) 1
At 31 December 262 10 272 275 10 285

33
Pensions and other similar liabilities Most of the Company’s post-employment obligations consist of the contribution of defined amounts to occupational pension plan systems. Nevertheless, at 31 December 2017 and 31 December 2016, the Company held the following defined benefit obligations for certain groups of workers:
- Pensions to retired workers, the disabled, widows and orphans and other related groups. - Defined benefit supplement obligations with retired personnel of the legacy Unión Fenosa group
who retired before November 2002 and a residual part of current personnel. - Coverage of retirement and death for certain employees. - Gas subsidy for current and retired personnel. - Electricity for current and retired personnel. - Obligations with employees that took early retirement until they reach official retirement age and
early retirement plans. - Salary supplements and contributions to social security for a group of employees taking early
retirement until they can access ordinary retirement. - Health care and other benefits.
The amounts recognised in the Balance sheet for pensions and similar obligations, as well as the movement in the current value of the obligations and the fair value of the plan assets are determined as follows:
Present value of obligations 2017 2016
At 1 January 1,080 1,057
Service cost for the year 2 2
Interest cost 13 20
Changes recognised directly in equity (36) 65
Benefits paid (71) (71)
Transfers and other 7 7
At 31 December 995 1,080
Fair value of plan assets
At 1 January 805 783
Expected yield 9 14
Contributions 7 (2)
Changes recognised directly in equity (28) 69
Benefits paid (60) (59)
Transfers and other -- --
At 31 December 733 805
Provisions for pensions and similar obligations 262 275
The amounts recognised in the income statement for all the above-mentioned defined benefit plans are as follows:
2017 2016
Service cost for the year 2 2
Interest cost 13 20
Expected return on plan assets (9) (14)
Total charge to the income statement 6 8

34
Benefits to be paid in the coming years for the above-mentioned commitments are as follows:
2017 2016
1 to 5 years 1 2
5 to 10 years 22 37
More than 10 years 239 236
Provisions for pensions and similar obligations 262 275
The plan assets expressed as a percentage of total assets are as follows:
% of total 2017 2016
Bonds 100% 100 %
Cumulative actuarial gains and losses, net of the tax effect, recognised directly in equity amount to a positive figure of Euros 3 million in 2017 (negative in the amount of Euros 3 million in 2016). The change recognised in equity relates to actuarial losses and gains derived basically from adjustments to:
2017 2016
Financial assumptions (13) 22
Experience 5 (26)
At 31 December (8) (4)
Actuarial assumptions applied are as follows:
At 31.12.17 At 31.12.16
Discount rate (p.a.) 0.0 a 2.25% 0.0 a 1.8%
Expected return on plan assets (p.a.) 0.0 a 2.25% 0.0 a 1.8%
Future salary increases (p.a.) 2.0% 2.0%
Future pension increases (p.a.) 2.0% 2.0%
Inflation rate (annual) 2.0% 2.0%
Mortality table PERMF 2000 PERMF 2000
Life expectancy:
Men
Retired during the year 22.9 22.5
Retiring within 20 years 42.7 42.5
Women
Retired during the year 27.4 27.0
Retiring within 20 years 48.6 48.4
These assumptions are applicable to all the obligations homogeneously irrespective of the origin of their collective bargaining agreements. The interest rates used to discount post-employment commitments are applied based on the period of each commitment and the reference curve is calculated applying observable rates for high-credit-quality corporate bonds (AA) issued in the Eurozone. The costs of health care have been measured on the basis of the expected costs of the premiums of the different medical care policies taken out. A 1% variation in the increase in the cost of these premiums would not have a significant impact on the liability recognised at 31 December 2017 and 31 December 2016, nor would it cause a relevant variation in the normal, financial costs for future years in relation to that recognised in 2017 and 2016.

35
Other obligations with personnel The Company operates a variable multi-annual remuneration system aimed at strengthening the commitment of the management to achieving the economic objectives of the group directly related to those established in the current Strategic Plans, approved by the Board of Directors and communicated to the financial markets and the achievement of which, along with their permanence in the group, grants the right to receive a variable remuneration in cash in the first quarter of the year after their termination. At 31 December 2017 a provision has been recorded corresponding to the remuneration programmes 2015-2017, 2016-2018 and 2017-2019 amounting to Euros 19 million (Euros 19 million at 31 December 2016), of which Euros 10 million is classified as non-current in 2017 (Euros 9 million 2016). Other non-current provisions The movement in other non-current provisions is as follows:
2017 2016
At 1 January 182 198
– Appropriations (1) 2 1
– Reversals -- (10)
Payments (4) (7)
Transfers and other 13 --
At 31 December 193 182
(1) Includes Euros 2 million and Euros 1 million in 2017 and 2016, respectively, relating to the financial update of provisions.
“Non-current provisions” mainly includes provisions posted to cover obligations deriving mainly from tax claims (Note 16), litigation and arbitration, and other liabilities. No provision for onerous contracts was deemed necessary at 31 December 2017 or 2016. At 31 December 2017, the estimated payment dates for these obligations are between one and five years (Euros 3 million), between five and 10 years (Euros 49 million) and more than 10 years (Euros 141 million) (2016: Euros 7 million at between one and five years, Euros 0 million at between five and 10 years and Euros 175 million at more than 10 years). Note 12. Borrowings
The breakdown of borrowings at 31 December 2017 and 2016 is as follows:
At 31.12.17 At 31.12.16
Borrowings from financial institutions 3,851 3,190
Derivatives (Note 13) 47 93
Other financial liabilities 14 17
Non-current borrowings 3,912 3,300
Borrowings from financial institutions 270 270
Derivatives (Note 13) 44 15
Other financial liabilities 14 12
Current borrowings 328 297
Total 4,240 3,597

36
The carrying amounts and fair value of the non-current borrowings are as follows:
Carrying amount
Fair value
At 31.12.17 At 31.12.16 At 31.12.17 At 31.12.16 Bank borrowings, derivatives and other financial liabilities
3,912 3,300 3,912 3,301
The fair value of loans with fixed interest rates is estimated on the basis of the discounted cash flows over the remaining terms of such debt. The discount rates were determined based on market rates available at 31 December 2017 and 31 December 2016 on borrowings with similar credit and maturity characteristics. The movement in borrowings is as follows:
2017 2016
At 1 January 3,597 3,780
Increase 913 859
Decrease (270) (1,042)
At 31 December 4,240 3,597
The following tables describe borrowings and maturities at 31 December 2017 and 2016, taking into account the impact of derivative hedges.
2018 2019 2020 2021 2022 2023 and beyond
Total
At 31 December 2017:
Fixed 200 261 287 170 137 1,263 2,318
Floating 128 250 722 278 527 17 1,922
Total 328 511 1,009 448 664 1,280 4,240
2017 2018 2019 2020 2021 2022 and beyond
Total
At 31 December 2016:
Fixed 156 232 630 127 84 92 1,321
Floating 141 192 500 348 471 624 2,276
Total 297 424 1,130 475 555 716 3,597
Setting aside the impact of derivatives on borrowings, fixed-rate debt would amount to Euros 337 million of total borrowings at 31 December 2017 (Euros 104 million at 31 December 2016) and variable-rate debt would amount to Euros 3,812 million at 31 December 2017 (Euros 3,385 million at 31 December 2016). The following tables describe the gross borrowings denominated in foreign currencies at 31 December 2017 and at 31 December 2016 and their maturities, taking into account the impact of the derivative hedges:

37
2018 2019 2020 2021 2022 2023 and beyond
Total
At 31 December 2017:
Euro debt 315 400 746 448 664 1,280 3,853
USD debt 13 111 263 -- -- -- 387
Total 328 511 1,009 448 664 1,280 4,240
2017 2018 2019 2020 2021 2022 and beyond
Total
At 31 December 2016:
Euro debt 264 409 705 475 555 716 3,124
USD debt 33 15 425 -- -- -- 473
Total 297 424 1,130 475 555 716 3,597
Borrowings bore an average effective interest rate in 2017 of 1.31% (1.53% in 2016) including the derivatives assigned to each transaction. At 31 December 2017, this includes Euros 9 million in interest pending payment (Euros 6 million at 31 December 2016). These payables include bank borrowings totalling Euros 1,656 million (Euros 1,169 million at 31 December 2016) that are subject to the fulfilment of certain covenants. Most of the drawn financial debt includes a clause that relates to the change of control whose trigger depends on some of these events happening at the same time: not belonging to none of the present reference shareholders in a significant percentage; losing the Rating Agencies investment grade or non capacity to fulfil the financial obligations of the contract. Likewise, there are borrowings amounting to Euros 2,851 million that could be subject to early repayment in case of a change of control. Most of this amount correspond to infrastructure financial founds from de European Inversion Bank than require, apart from the change of control event, a reduction in the rating and have specific repayment terms longer than the early repayment scenarios. At the preparation date of these annual accounts, the Company is not in breach of its financial obligations or of any type of obligation that could give rise to the early maturity of its financial commitments. We set out below the most relevant financial instruments: Bank borrowings Bank borrowings also include other bilateral bank loans of Euros 1,645 million at 31 December 2017 (Euros 1,537 million at 31 December 2016), no amounts having been drawn down on credit lines. Institutional financing The Company records balances payable to the Official Credit Institute (ICO) relating to instruments for a total amount of Euros 235 million (Euros 112 million in 2016). Additionally, financing granted by the European Investment Bank (EIB) to the Company has been drawn down in the amount of Euros 2,240 million (2016: Euros 1,811 million, with Euros 300 million drawable).
Note 13. Risk management and derivative financial instruments Risk management Gas Natural Fenosa has a series of standards, procedures and systems for identifying, measuring and managing different types of risk which are made up of the following basic action principles:
- Guaranteeing that the most relevant risks are correctly identified, evaluated and managed.

38
- Segregation at the operating level of the risk management functions.
- Assuring that the level of risk exposure of Gas Natural Fenosa in its business is in line with the objective risk profile and achievement of its annual, strategic objectives.
- Ensuring the appropriate determination and review of the risk profile by the Risk Committee, proposing global limits by risk category, and assigning them to the Business Units.
On 23 June 2016 UK voters supported the departure of their country from the European Union (“Brexit”). Although the exit of the UK will be accompanied by lengthy negotiations the duration of which is currently unknown, the first repercussions have already arisen in both the capital and currency markets. However, Gas Natural Fenosa's exposure to the risk derived from Brexit is practically zero. Interest rate risk The fluctuations in interest rates modify the fair value of the assets and liabilities that accrue a fixed interest rate and the cash flows from assets and liabilities pegged to a floating interest rate, and, accordingly, affect equity and profit, respectively. The purpose of interest rate risk management is to balance floating and fixed borrowings in order to reduce borrowing costs within the established risk parameters. The Company employs financial swaps to manage exposure to interest rate fluctuations, swapping floating rates for fixed rates.
The financial debt structure at 31 December 2017 and 2016 (Note 12), after taking into account the hedges arranged through derivatives, is as follows:
At 31.12.17 At 31.12.16
Fixed interest rate 2,318 1,321
Floating interest rate 1,922 2,276
Total 4,240 3,597
The floating interest rate is mainly subject to the fluctuations of the Euribor and the Libor. The sensitivity of results and equity (measurement adjustments) to interest rate fluctuations is as follows: Increase/decrease in interest rates
(basis points) Effect on profit before
tax Effect on equity before
tax
2017 +50 (10) 131
-50 10 (131)
2016 +50 (11) 80
-50 11 (80)
Exchange rate risk The variations in the exchange rates can affect the fair value of: - Counter value of cash flows related to the purchase-sale of raw materials denominated in currencies
other than local or functional currencies. - Debt denominated in currencies other than local or functional currencies. - Operations and investments in non-Euro currencies, and, accordingly, the counter value of equity
contributed and results. In order to mitigate these risks the Company finances, to the extent possible, its investments in local currency. Furthermore, it tries to match, whenever possible, costs and revenues indexed in the same currency, as well as amounts and maturities of assets and liabilities arising from operations denominated in non-Euro currencies.

39
For open positions, the risks in investments in non-functional currencies are managed through financial swaps and foreign exchange fluctuation insurance when its marginal contribution to the risk is relevant and can exceed the risk limits established. The non-Euro currency with which the Company operates most is the US Dollar. The sensitivity of the Company’s profits and consolidated equity (“Adjustments for changes in value”) to a 5% variation (increase or decrease) in the US dollar/euro exchange rate is as follows:
2017 2016
Effect on profit before tax +5% -- --
- 5% -- --
Effect on equity before tax +5% -- --
- 5% -- --
Commodity price risk The Company purchases gas to be supplied to other Group companies. Due to its activity as a holding company, the Company is exposed to the risk of fluctuations in commodities prices, the determination of which is basically subject to crude oil prices and those of its by-products. Additionally, in the electricity generation business Gas Natural Fenosa is exposed to CO2 emission allowances fluctuation risk and electricity prices variations. The exposure to these risks is managed and mitigated through the monitoring of its position regarding these commodities, seeking to balance purchase and supply obligations, and the diversification and management of supply contracts. When it is not possible to achieve a natural hedge the position is managed, within reasonable risk parameters, through derivatives to reduce exposure to price risk, generally through hedging instruments. In electricity and CO2 emission allowances trading by the Company, risk is insignificant due to the low volume of transactions and the established limits placed, both on the amount and maturity date.
Increase / decrease in the electricity sale price
Effect on profit before tax Effect on equity before tax
2017 +10% -- --
-10% -- --
2016 +10% -- --
-10% -- --
Gas Natural Fenosa has no relevant investments in upstream businesses or commodities production, therefore a low price scenario in commodities would have no significant impact on asset values. Business segment sensitivity to the prices of oil, gas, coal and electricity is explained below:
- Gas and electricity distribution. It is a regulated activity with revenue and profit margins are linked to distribution infrastructure management services rendered, irrespective of the prices of the commodities distributed. In any event, a fall in the price of gas could increase consumption, having a favourable impact on revenue and thus contributing to the stability of Gas Natural Fenosa's results.
- Gas and electricity. Profit margins on gas and electricity supply activities are directly affected by commodity prices. In this regard, Gas Natural Fenosa has a risk policy that stipulates the tolerance range, based on applicable risk limits, among other aspects. Measures employed to keep risk within the stipulated limits include active supply management, balanced acquisitions and sales formulae, and specific hedging so as to maximise the risk-profit relationship.

40
Credit risk Credit risk is defined as the potential loss resulting from the possible nonfulfillment of the contractual obligations of counterparties with which the Group does business. Gas Natural Fenosa performs solvency analyses on the basis of which credit limits are assigned and any necessary provisions are determined. Based on these models, the probability of customer default can be measured and the expected commercial loss can be kept under control. In addition, credit quality and portfolio exposure are monitored on a recurring basis to ensure that potential losses are within the limits provided for by internal regulations. This allows a certain capacity to anticipate events in credit risk management. Furthermore, the outstanding trade receivables are stated on the balance sheet net of provisions for bad debts (Note 8), estimated by the Company based on the age of the debt and the experience of previous years in line with the prior segregation of customer portfolios and the current economic environment. With respect to other exposures to counterparties in transactions involving financial derivatives and the investment of cash surpluses, credit risk is mitigated by carrying out such operations with reputable financial institutions holding “BB ”ratings or higher, in accordance with the credits ratings granted by Moody’s, S&P and Fitch. No significant defaults or losses arose in 2017 or 2016. The ageing analysis of financial assets concluded that there were no unimpaired, past due financial assets at 31 December 2017 and 2016. The impaired financial assets are broken down in Note 8. Concerning supplier credit risk, the solvency of each supplier of products and services is guaranteed through the recurring analysis of their financial information, particularly prior to new engagements. To this end, the relevant assessment criteria are applied depending on the supplier's criticality in terms of service or concentration. This procedure is supported by control mechanisms and systems and supplier management. At 31 December 2017 and 2016 Gas Natural Fenosa does not have significant concentrations of credit risk. Liquidity risk The Company has liquidity policies that ensure compliance with its payment commitments, diversifying the coverage of financing needs and debt maturities. A prudent management of the liquidity risk includes maintaining sufficient cash and realisable assets and the availability of sufficient funds to cover credit obligations. At 31 December 2017, available cash totalled Euros 8,400 million (Euros 7,883 million in 2016), including cash and cash equivalents of Euros 1,553 million (Euros 502 million in 2016), undrawn bank financing and credit lines to the amount of Euros 6,847 million (Euros 7,381 million in 2016). There is also unused capacity to issue debt on the capital markets (Note 14). Capital management The main purpose of the Company’s capital management is to ensure a financial structure that can optimise capital cost and maintain a solid financial position, in order to combine value creation for the shareholder with the access to the financial markets at a competitive cost to cover financing needs. Gas Natural Fenosa considers the following to be objective indicators of capital management: maintaining a long-term leverage ratio of approximately 50%.

41
The Company's long-term credit rating is as follows:
2017 2016
Moody’s Baa2 Baa2
Standard & Poor’s BBB BBB
Fitch BBB+ BBB+
Derivative financial instruments The breakdown of derivative financial instruments by category and maturity is as follows:
At 31.12.17 At 31.12.16
Assets Liabilities Assets Liabilities
Hedging derivative financial instruments 8 47 28 61
Fair value hedge
- Interest rate and foreign exchange rate -- 6 -- 40
Cash flow hedge
- Interest rate 8 41 28 21
Other financial instruments -- -- 31 32
- Interest rate and foreign exchange rate -- -- 31 32
Derivative financial instruments – non current 8 47 59 93
Hedging derivative financial instruments 13 -- -- 15
Fair value hedge
- Exchange rate 3 -- -- 10
Cash flow hedge
- Interest rate 1 -- -- 5
- Exchange rate 9 -- -- --
Other financial instruments 161 166 76 82
- Price of commodities 117 122 76 82
- Interest rate and foreign exchange rate 43 43 -- --
- Exchange rate 1 1 -- --
Derivative financial instruments current 174 166 76 97
Total 182 213 135 190
Other financial instruments include the derivatives not qualifying for hedge accounting. The impact on the Income statement of derivative financial instruments is as follows:
2017 2016
Operating
Financial Operating
Financial
results results results results
Cash flow hedge -- (4) -- (10)
Other financial instruments (1) (2) (28) (2)
Total (1) (6) (28) (12)

42
The breakdown of derivatives at 31 December 2017 and 2016, their fair value and maturities of their notional values is as follows:
At 31.12.17
Fair value Notional value
2018 2019 2020 2021 2022 Later years Total
INTEREST RATE HEDGES:
Cash flow hedges:
Financial swaps (EUR) (8) 95 95 844 63 91 2,484 3,672
Financial swaps (USD) 1 228 -- -- -- -- -- 228
Financial swaps (NOK) (25) -- -- -- -- -- 101 101
EXCHANGE RATE HEDGES:
Cash flow hedges:
Financial swaps (USD) 9 489 -- -- -- -- -- 489
Fair value hedges:
Financial swaps (USD) (6) -- -- -- 160 -- -- 160
Foreign exchange insurance (USD) 3 193 -- -- -- -- -- 193
OTHER:
Commodities price derivatives (EUR) (3) 4 -- -- -- -- -- 4
Commodities price derivatives (USD) (2) -- -- -- -- -- -- --
(31) 1,009 95 844 223 91 2,585 4,847
31.12.16
Fair value Notional value
2017 2018 2019 2020 2021 Later years Total
INTEREST RATE HEDGES:
Cash flow hedges:
Financial swaps (EUR) 23 684 -- -- -- -- 1,500 2,184
Financial swaps (USD) -- 166 259 - -- -- -- 425
Financial swaps (NOK) (21) -- -- -- -- -- 101 101
EXCHANGE RATE HEDGES:
Fair value hedges:
Financial swaps (USD) (40) -- -- 60 -- 160 -- 220
Foreign exchange insurance (USD) (10) 219 -- -- -- -- -- 219
OTHER:
Commodities price derivatives (EUR) (6) 13 -- -- -- -- -- 13
Financial swaps (MXN) (1) - -- -- -- -- -- -
(55) 1,082 259 60 -- 160 1,601 3,162
Note 14. Payables to Group companies and associates
The breakdown by maturity of borrowings from group companies is as follows:
Maturity At 31.12.17 At 31.12.16
2017 -- 3,000
2018 3,307 1,556
2019 1,311 1,199
2020 1,116 1,639
2021 1,417 1,531
2022 1,743 1,742
2023 872 --
Subsequent years 5,049 2,960
Total 14,815 13,627

43
Payables to Group companies mainly relate to issues of Gas Natural Capital Markets, S.A. and Gas Natural Fenosa Finance, B.V. under the European Medium-Term Notes (EMTN) programme. This programme was created in 1999; following a number of extensions, the latest in November 2017, the programme limit is Euros 15,000 million (Euros 14,000 million in 2016). At 31 December 2017, principal drawn down totalled Euros 11,205 million (Euros 10,205 million in 2016) and the amount of Euros 3,795 million was available (Euros 3,795 million in 2016). In April 2017, Gas Natural Capital Markets, S.A. issued bonds under the EMTN programme amounting to Euros 1,000 million which was used to carry out a repurchase of obligations amounting to Euros 1,000 million maturing in 2018, 2020 and 2021, so there was no movement of cash. Specifically, bonds issued amounting to Euros 11,205 million, would be susceptible to early maturing as long as this change of control may produce more than two steps or two full notches falling in at least two of the three ratings it may have as well as all the ratings falling under investment grade and provided that the Rating Agency express that this reduction in the rating is due to the change of control. Also included is the amount payable to Gas Natural Finance, B.V. for Euro Commercial Paper (ECP) issues, Euros 0 million having been utilised (Euros 100 million in 2016), with Euros 1,000 million remaining available (Euros 900 million in 2016). The balances payable to Gas Natural Fenosa Finance, B.V. in respect of perpetual subordinated debentures amounting to Euros 1,500 million (Euros 1,500 million 2016) and the debt with Unión Fenosa Preferentes, S.A. relating to preferred shares totalling Euros 110 million (Euros 110 million in 2016) are also included. Borrowings from group companies include interest accrued pending maturity of Euros 288 million (Euros 350 million in 2016). Cash-pooling balances with Group companies amounting to Euros 1,642 million are also included (Euros 1,163 million in 2016). Borrowings from group companies and associates accrued an average interest rate of 3.51% in 2017 (4.2% in 2016). There are no significant differences between the carrying amounts and fair values of Payables to Group companies and associates.
Note 15. Trade and other payables The breakdown at 31 December 2017 and 2016 is as follows:
At 31.12.17 At 31.12.16
Trade payables 194 242
Trade payables, Group companies and associates 289 311
Derivatives (Note 13) 122 82
Other payables 18 11
Personnel (outstanding remuneration) 45 23
Public Administrations 83 17
Current tax liabilities -- 24
Total 751 710
Most payables do not accrue interest and have contractual maturity dates of less than 30 days, in the case of gas purchases and within the legal limits, for other suppliers. At 31 December 2017, Euros 25 million was recognised under the heading Personnel (outstanding remuneration) in relation to termination benefits resulting from agreements with employees to terminate their employment contracts, to be paid in the first quarter of 2018.

44
Information on average supplier payment period. Additional Provision 3 “Duty of disclosure” of Law 15/2010/5 July The average payment period is in accordance with Law 15/2010 on measures to combat late payment in business operations. Information disclosed under the Resolution of 29 January 2016 of the Institute of Accountants and Auditors concerning the details to be included in the notes to the annual accounts concerning the average supplier payment period is as follows:
2017 2016
Amount Amount
Total payments (thousand euro) 4,452,183 3,993,686
Total payments outstanding (thousand euro) 79,532 88,041
Average supplier payment period (days) (1) 20 22
Transactions paid ratio (days) (2) 20 22
Transactions pending payment ratio (days) (3) 23 24
(1) Calculated on the basis of amounts paid and pending payment.
(2) Average payment period in transactions paid during the year.
(3) Average age, suppliers pending payment balance.
The accompanying ratios do not include situations that could distort calculations, such as Trade payables, Group companies and associates.
Note 16. Tax situation The Company is the parent of tax consolidated group 59/93, which includes all the companies resident in Spain that are at least 75% directly or indirectly owned by the parent company and that fulfil certain requirements, entailing the overall calculation of the group's taxable income, deductions and tax credits. The tax consolidated group for 2017 is analysed in Appendix I. Corporate income tax is calculated on the basis of economic or accounting profit obtained by application of generally accepted accounting principles, which do not necessarily coincide with taxable profit, understood as taxable income for corporate income tax purposes. The reconciliation of accounting profit for the years 2017 and 2016 to taxable income is as follows:
At 31.12.17 At 31.12.16
Accounting profit before tax 941 983
Permanent differences (1,264) (1,278)
Temporary differences:
Arising during current year 43 28
Arising in prior years (23) (28)
Taxable income (303) (295)
Permanent differences mainly relate to the application of the tax consolidation system and the double taxation exemption for dividends and income derived from the transfer of shares under Article 21 of Law 27/2014 on Corporate Income Tax, which has led to negative permanent differences of Euros 1,264 million resulting mainly from negative adjustments for dividends accruing during the year (Euros 1,560 million in 2016) and impairment of shareholdings in Group companies and associates amounting to Euros 133 million (Euros 206 million in 2016).

45
In 2017 the Company posted a tax loss of Euros 303 million (Euros 295 million in 2016), which is recovered from the Tax Group companies due to the taxable income generated by them during the year. Law 27/2014 maintained the non-tax deductibility of impairment losses on equity interests, which had been introduced under Law 16/2013 with effect from 1 January 2013. In 2017 and 2016 the impairment losses recognised for shareholdings were not treated as tax deductible. Items yet to be included in the tax base after having filed the final corporate income tax return for 2016 are the following:
Company
Amounts pending
inclusion in tax base in 2016
Amounts included in
2017
Amounts pending
inclusion in tax base in 2017
Other 1 (1) --
1 (1) --
Income tax expense is as follows:
2017 2016
Current-year tax (77) (84)
Deferred tax (5) --
Total (82) (84)
Current corporate income tax is the result of applying a 25% tax rate to taxable income. In the tax consolidated group, tax credits applied in 2017 amounted to Euros 9 million (Euros 7 million in 2016) and no tax losses were offset. Adjustments are also included for prior-year taxable differences, entailing a decrease in the expense of Euros 13 million (increase of Euros 10 million in 2016). On 3 December 2016 Royal Decree-Law 3/2016 was published, adopting tax measures for the consolidation of public finances, which introduced relevant changes in the corporate income tax area. Among other matters, with effect from 1 January 2016 the obligation is laid down to reverse provisions for the impairment of shareholdings that would have been deductible before 2013 in a maximum term of five years, the offsetting of tax losses for large companies is limited to 25% of the preliminary tax base and the application of the tax credit for domestic or international double taxation generated or pending application is restricted to 50% of preliminary gross tax payable Additionally, effective from 1 January 2017, losses on the transfer of shares will not be deductible. In 2017 and 2016 these measures did not have a significant impact on the Company’s financial statements. Incomes that qualify to the tax credit for reinvestment of extraordinary profits provided by Article 42 of the revised Corporate Income Tax Act introduced under Legislative Royal Decree-Law 4/2004 (5 March) and the resulting investments made in previous periods are explained in the annual accounts for the relevant years. The relevant breakdown is as follows:
Year of sale Amount obtained
from sale Amount reinvested
Income qualifying for deduction
Year reinvested
2011 2 2 1 2011
2014 412 412 209 2014
Total 414 414 210
The reinvestment was made in fixed assets related to economic activities carried out by the Company itself or any other company included in the Consolidated Tax Group by virtue of the provisions of article 75 of the Corporate Income Tax Act.

46
Income qualifying for the tax scheme for transfers of assets made in compliance with competition law (Additional Provision 4 of the revised CIT Act) is explained below:
Year of sale Amount obtained
from sale Amount
reinvested Initial capital gain
Capital gain included in tax
base at year end
Capital gain yet to be included in tax base at year
end
2002 917 917 462 19 443
2003 39 39 20 -- 20
2004 292 292 177 9 168
2005 432 432 300 1 299
2006 309 309 226 -- 226
2009 161 161 87 -- 87
2010 752 752 551 -- 551
2011 450 450 394 -- 394
2012 38 38 32 -- 32
Total 3,390 3,390 2,249 29 2,220
The reinvestment has been made in fixed assets used in business activities both by the Company and by the other companies in the tax group, pursuant to Article 75 of the Corporate Income Tax Act. A breakdown of the tax effect of each item on the Statement of Recognised Income and Expenses is as follows:
At 31.12.17 At 31.12.16
Gross Tax effect Net Gross Tax effect Net
Cash flow hedges (27) 7 (20) 34 (8) 26
Actuarial gains and losses and other adjustments 8 (2) 6 3 (1) 2
(19) 5 (14) 37 (9) 28
A breakdown of deferred taxes is as follows:
At 31.12.17 At 31.12.16
Deferred tax assets: 133 128
- Non-current 126 118
- Current 7 10
Deferred tax liabilities: (227) (231)
- Non-current (227) (231)
Net deferred tax (94) (103)
Movements and breakdown of deferred asset accounts are as follows:
Deferred tax assets Provisions Tax
credits
Valuation of assets and
financial instruments Goodwill Other Total
At 1.1.2016 112 4 4 10 3 133
Creation (reversal) (4) -- -- 1 -- (3)
Movements linked to equity adjustments (1) -- (1) -- -- (2)
Transfers and other (2) 2 -- -- -- --
At 31.12.2016 105 6 3 11 3 128
Creation (reversal) 4 -- -- 1 -- 5
Movements linked to equity adjustments (2) -- 3 -- -- 1
Transfers and other 4 (4) -- (1) -- (1)
At 31.12.2017 111 2 6 11 3 133

47
Deferred tax liabilities
Differences in
Depreciation Deferred gains Other Total
At 1.1.2016 4 210 20 234
Creation (reversal) (1) -- (2) (3)
Movements linked to equity adjustments -- -- 7 7
Transfers and other -- -- (7) (7)
At 31.12.2016 3 210 18 231
Creation (reversal) -- -- -- --
Movements linked to equity adjustments -- -- (4) (4)
Transfers and other -- (13) 13 --
At 31.12.2017 3 197 27 227
In 2015, the demerger of the nuclear power generation business from the Company to Gas Natural Fenosa Generación, S.L.U. was completed. Pursuant to Article 76.3 of Law 27/2014, this operation was defined as a non-cash contribution of a line of business and was thus subject to the special scheme provided by Title VII, Chapter VIII of that law. The information requirements established by the aforementioned standard are included in the Notes to the Annual Accounts that forms part of the Company's Annual Accounts for the year 2015. In 2014, the demerger of the thermal and hydraulic generation business from the Company to Gas Natural Fenosa Generación, S.L.U. was completed. Pursuant to Article 83.3 of Royal Decree-Law 4/2004 whereby the Corporate Income Tax Act (CIT Act) was approved, this operation is defined as a non-cash contribution of a line of business and is thus subject to the special scheme provided for in Title VII, Chapter VIII of said Act. The information requirements established by the aforementioned standard are included in the Notes to the Annual Accounts that forms part of the Company's Annual Accounts for the year 2014. In 2009, the companies Unión Fenosa, S.A. and Unión Fenosa Generación S.A. were merged into the Company under the special tax scheme for mergers, spin-offs, asset contributions, share exchanges and changes of registered address of European companies or European cooperatives from one European Union Member State to another, provided by Title VII, Chapter VIII TRLIS. The information requirements stipulated in the special tax scheme are fulfilled in the notes to the Company's 2009 annual accounts. At 31 December 2017 there are no ongoing inspection proceedings that affect the main government taxes. The Company's tax group is open to inspection for 2011 and subsequent periods and the taxes to which it is subject. On 3 November 2017 an unfavourable judgment was received from the Supreme Court in relation to the tax inspection assessments resulting from inspections on corporate income tax for 2003-2005, due to the application of the deduction for export activities. These assessments had been fully provided (Note 11) for and amounted to Euros 4 million, which has been fully offset by balances to be returned by Public Administration. As a result, among other things, of the different interpretations to which current tax legislation lends itself, additional liabilities could arise as a result of an inspection. The Company considers, however, that any liabilities that might arise would not significantly affect these Annual accounts. Gas Natural Fenosa has recorded provisions for obligations deriving from a number of tax claims. There are no cases in which litigation or uncertain tax treatments are individually significant (Note 11).

48
Note 17. Revenue Sales break down as follows:
2017 2016
Electricity sales 1,714 1,460
Natural gas sales 1,420 1,620
Other sales 5 8
Income from equity instruments of Group companies and associates (Note 6) 1,470 1,560
Income from marketable securities and other financial instruments of Group companies and associates 444 414
Total 5,053 5,062
Electricity and gas sales are made basically in the domestic market and relate to gas and electricity sales to other Gas Natural Fenosa companies. The Company has gas supply contracts for other Gas Natural Fenosa companies and in the electricity area it acts as representative of the Gas Natural Fenosa generation and supply companies with respect to the Electricity Market.
Note 18. Procurements This caption includes gas and electricity purchases related to the activity of sales of gas and electricity to other companies of Gas Natural Fenosa.
Note 19. Personnel costs The breakdown of this account in the income statement for 2017 and 2016 is as follows:
2017 2016
Wages and salaries 151 144
Termination benefits 29 8
Social security costs 26 22
Defined contribution plans 13 13
Defined benefit plans (Note 11) 2 2
Other 13 12
Total 234 201
The average number of Company employees in 2017 and 2016 is as follows:
2017 2016
Executives 494 478
Middle managers 204 192
Specialists 738 709
Workers 348 357
Total 1,784 1,736

49
The average number of Company employees during 2017 and 2016 with a disability equal to or greater than 33% is as follows:
2017 2016
Men Women Men Women
Executives 3 -- 3 --
Middle managers 1 1 -- 1
Specialists 12 13 11 12
Workers 7 10 8 9
Total 23 24 22 22
The number of Company employees at the end of 2017 and 2016 broken down by category and gender is as follows:
2017 2016
Men Women Men Women
Executives 332 172 323 159
Middle managers 112 102 110 88
Specialists 345 412 340 375
Workers 92 252 94 257
Total 881 938 867 879
Note 20. Other operating expenses A breakdown of this heading on the income statement account for 2017 and 2016 is as follows:
2017 2016
Taxes 2 2
Leases, royalties, operation and maintenance 80 79
Professional services and insurance 58 60
Advertising and other commercial services 26 25
Contribution Gas Natural Fenosa Foundation 7 2
Impairment losses and changes in trade provisions (Note 9) -- 5
Other 171 164
Total 344 337
The Company makes contributions to the Gas Natural Fenosa Foundation to enable it to carry out its energy and environmental projects in the community area, as well to fund international initiatives and the activities of the Gas Museum and historical archive. In the community area, the Gas Natural Fenosa Foundation has broadened its activities to place greater emphasis on its community initiatives, defining new strategic lines for actions aimed at palliating energy vulnerability.
Note 21. Other operating income This account includes Euros 380 million in transactions with group companies and associates in 2017 (Euros 370 million in 2016).

50
Note 22. Net financial income/(expense)
The breakdown of this account in the Income statement for 2017 and 2016 is as follows:
2017 2016
Income from marketable securities and other financial instruments 31 30
Total financial income 31 30
Cost of borrowings (545) (633)
Interest expense on pensions (Note 11) (4) (6)
Other financial expense (37) (25)
Total financial expense (586) (664)
Variation in fair value of financial instruments 1 (1)
Trading portfolio and other available-for-sale assets 1 (1)
Net exchange differences (1) 1
Net financial income/(expense) (555) (634)
Note 23. Foreign currency transactions
Transactions effected in foreign currencies are analysed below, the main currency being the US dollar:
2017 2016
Sales 713 624
Income from equity instruments of Group companies and associates 40 46
Income from marketable securities and other financial instruments of Group
companies and associates
9 4
Purchases (772) (886)
Services received (23) (23)
Total (33) (235)
Note 24. Information on transactions with related parties The following are related parties for the purposes of this Note:
- Significant Company shareholders, i.e. those directly or indirectly owning an interest of 5% or more, and those who, though not significant, have exercised the power to propose the appointment of a member of the Board of Directors.
Based on this definition, the Company’s significant shareholders are Fundación Bancaria Caixa d’Estalvis i Pensions de Barcelona ("la Caixa"), Repsol, S.A. (Repsol) and Global Infrastructure Partners III (GIP) and subsidiaries.
- Directors and executives of the Company and their immediate families. The term “director” means a member of the Board of Directors; “executive” means a member of the Management Committee of Gas Natural Fenosa and the Internal Audit Director. Operations with directors and executives are disclosed in Note 25.
- Group companies or entities. Transactions effected between group companies form part of the ordinary course of business and they have been done at market conditions.
The aggregated amounts of operations with significant shareholders are as follows (in thousand Euros):

51
2017 2016
Income and expense (in thousand Euros) “La
Caixa” Repsol GIP
“La Caixa”
Repsol GIP (*)
Financial expenses 1,007 -- -- 1,515 -- --
Receipt of services 7,315 1 -- 9,378 1 --
Purchases of goods -- 2,408 -- -- 2,331 --
Other expenses (1) 20,796 -- -- 10,125 -- --
Total expenses 29,118 2,409 -- 21,018 2,332 --
Financial income 5 -- -- 148 -- --
Provision of services -- -- -- -- 39 --
Total income 5 -- -- 148 39 --
2017 2016
Other transactions (in thousand Euros) “La
Caixa” Repsol GIP
“La Caixa”
Repsol GIP (*)
Financing agreements, loans and capital contributions(lender) (2)
1,152,621 -- -- 341,770 -- --
Financing agreements, loans and capital contributions(borrower) (3)
100,000 -- -- 100,000 -- --
Warranties and guarantees received 160,000 -- -- 100,000 -- --
Dividends and other profits distributed 244,558 200,859 200,138 424,923 367,291 66,045
Other operations (4) 666,476 -- -- 173,884 -- --
(*) Since 21 September 2016.
(1) Includes contributions to pension plans, group insurance policies, life insurance and other expenditure.
(2) Includes cash and cash equivalents. (3) At 31 December 2017, credit lines contracted with ”la Caixa” amounted to Euros 569,000
thousand (Euros 569,000 thousand at 31 December 2016), of which no amounts having been utilised. ”La Caixa” also has shares of other loans totalling Euros 100,000 thousand (Euros 100,000 thousand at 31 December 2016).
(4) In 2017, the item “Other transactions” with ”la Caixa” includes Euros 565,568 thousand in respect of foreign exchange hedges and Euros 100,908 thousand in respect of interest rate hedges (Euros 72,976 thousand and Euros 100,908 thousand at 31 December 2016).
The aggregated amounts of operations with group companies and associates are as follows (in million Euros):
2017 2016
Expenses, income and other transactions Group
companies
Jointly-controlled
entities and associates
Group companies
Jointly-controlled
entities and associates
Financial expenses (496) -- (575) --
Lease expenses (39) (6) (53) (6)
Receipt of services (28) -- (24) --
Purchases of goods (2,329) -- (2,215) --
Total expenses (2,892) (6) (2,867) (6)
Financial income 444 -- 431 1
Dividends received 1,486 1 1,623 2
Sale of goods 3,533 -- 3,154 --
Other income 375 5 369 1
Total income 5,838 6 5,577 4
Sale of Property, plant and equipment, intangible and other assets -- -- 6 --
Other transactions -- -- 6 --

52
The item “Purchases of goods” relates basically to electricity purchased from the other Group companies, since the Company is their market representative. Under the heading "Dividends received" are included the dividend payments from voluntary reserves, registered as a lower value on investments in group companies (Note 6). Sales of natural gas under supply contracts and electricity, acting as representative of the group companies for the market, are included under "Sale of goods". The heading "Other income" includes income from services rendered in accordance with the nature and extent thereof (Note 21). Costs shared between the Company and other group companies are allocated on the basis of business or cost generation parameters. Detailed definitions are prepared of services to be provided and of related activities or tasks in order to determine the measurement indicators used to calculate costs allocated. Transactions between companies are objective, transparent, non-discriminatory and always effected at arm's length.
Note 25. Information on members of the Board of Directors and Management Committee Remuneration of the members of the Board of Directors In accordance with the By-laws and the General Meeting resolution of 14 May 2015, the Company may earmark a maximum of Euros 5 million for Board directors’ remuneration each year. The amount accrued by the members the Board of Directors of Gas Natural SDG, S.A., for belonging to the Board of Directors, Executive Committee (EC), Audit Committee (AC) and Appointments and Remuneration Committee (ARC), totalled Euros 4,668 thousand (Euros 4,573 thousand in 2016), broken down in euros as follows: Office Board EC AC ARC Total
Mr. Isidro Fainé Casas Chairman 550,000 550,000 - - 1,100,000
Mr. Josu Jon Imaz San Miguel First Deputy Chairman 126,500 126,500 - - 253,000
Mr. William Alan Woodburn Second Deputy Chairman 126,500 126,500 - 25,000 278,000
Mr. Rafael Villaseca Marco Chief Executive Officer 126,500 126,500 - - 253,000
Mr. Ramón Adell Ramón Director 126,500 126,500 40,000 - 293,000
Mr. Enrique Alcántara-García Irazoqui Director 126,500 - 40,000 - 166,500
Mr. Xabier Añoveros Trías de Bes Director 126,500 - 40,000 - 166,500
Mr. Marcelino Armenter Vidal Director 126,500 126,500 - - 253,000
Mr. Mario Armero Montes Director 126,500 - - - 126,500
Mr. Francisco Belil Creixell Director 126,500 126,500 - 25,000 278,000
Ms. Benita María Ferrero-Waldner Director 126,500 126,500 - - 253,000
Mr. Alejandro García-Bragado Dalmau Director 126,500 - - 25,000 151,500
Ms. Cristina Garmendia Mendizábal Director 126,500 - 40,000 25,000 191,500
Ms. Helena Herrero Starkie Director 126,500 - 40,000 - 166,500
Mr. Miguel Martínez San Martín Director 126,500 126,500 - 25,000 278,000
Mr. Rajaram Rao Director 126,500 126,500 40,000 - 293,000
Mr. Luis Suárez de Lezo Mantilla Director 126,500 - 40,000 - 166,500
2,574,000 1,688,500 280,000 125,000 4,667,500
As the remuneration for belonging to the Board of Directors and the various Board Committees has remained unchanged, the increase is due solely to the higher number of Committee members as a result of changes in the Company’s corporate governance following the alteration in September 2016 of the Company’s shareholder structure. In this respect, the Executive Committee has increased by two members, the Audit Committee has increased by four members and the Appointments and Remuneration Committee has increased by two members. In 2017, as in 2016, no amounts were received for other items. In 2017, the Chief Executive Officer did not receive any amounts by reason of his membership of investee company Boards of Directors (Euros 37 thousand in 2016). These amounts are deducted from the CEO’s annual variable remuneration.

53
The amounts accrued to the Chief Executive Officer for executive functions in respect of fixed remuneration, annual variable remuneration, multi-year variable remuneration and other items totalled Euros 1,285 thousand, Euros 1,131 thousand, Euros 757 thousand and Euros 16 thousand, respectively, in 2017 (Euros 1,212 thousand, Euros 1,002 thousand, Euros 813 thousand and Euros 18 thousand in 2016). Contributions to pension plans and group insurance policies, together with life insurance premiums paid, totalled Euros 321 thousand in 2017 (Euros 318 thousand in 2016). Funds accumulated due to these contributions amount to Euros 3,648 thousand at 31 December 2017 (Euros 3,241 thousand at 31 December 2016). The members of the Board of Directors of the Company have not received remuneration from profit sharing, bonuses or indemnities, and have not been given loans or advances. Neither have they received shares or share options during the year, nor have they exercised options or have options to be exercised. The members of the Board of Directors are covered with the same liability policy that insures all managers and directors of Gas Natural Fenosa. The premium paid in 2017 by Gas Natural SDG, S.A. for the entire policy amounted to Euros 109 thousand (Euros 101 thousand in 2016). The CEO’s contract was amended in October 2016 to remove the clause under which the contract would be terminated in the event of a material change in Gas Natural Fenosa’s shareholders and its duration was extended to cover the entire term of his current appointment as a Company director. It contains an agreement whereby six months’ prior notice must be provided by the CEO except in the event of force majeure, an exclusivity pact for the period during which he is to fulfil his functions and a confidentiality agreement for both the duration of the contract and post-termination. The CEO’s contract provides for an indemnity of three yearly payments of his full emoluments at the date of the contractual amendment for certain termination events: by decision of the company, excepting a serious and culpable breach of his professional obligations giving rise to serious damage to the interests of Gas Natural SDG, S.A.; by decision of the CEO; or due to the completion of the contract. In addition, as consideration for a post-contractual no-competition agreement with a duration of one year, an indemnity equivalent to one year’s full remuneration is provided for. The contract provides for the obligation on the Company’s part to arrange third party liability insurance. Transactions with Directors The Directors have the obligation to avoid conflicts of interest as established by Regulation of the Board of Gas Natural SDG, SA and Articles 228 and 229 of the Capital Companies Law. Additionally, these articles require that conflicts of interest incurred by the board shall be reported in the annual accounts. The Directors of Gas Natural SDG, SA have not reported any conflict of interest to the Board of Directors that has to be notified. In the operations with related parties (significant shareholders) that have been submitted for approval by the Board, subject to a favourable report of the Appointments and Remuneration Committee or Audit Committee, the Directors representing the related party involved have abstained. During the years 2017 and 2016, the members of the Board have not carried out related transactions outside the ordinary course or transactions that are not conducted under normal market conditions with the Company or Group companies. Management Committee remuneration For the sole purposes of the information contained in this section, “senior management personnel” refers to the members of the Management Committee, excluding the CEO, whose remuneration has been included in the previous section, and the Internal Audit Director.

54
During 2017 a total of 11 persons formed part of the Management Committee. One person joined the committee in April. The amounts accrued to management personnel in respect of fixed remuneration, annual variable remuneration, multi-year variable remuneration and other items totalled Euros 5,507 thousand, Euros 2,595 thousand, Euros 1,641 thousand and Euros 108 thousand, respectively, in 2017 (Euros 4,827 thousand, Euros 2,553 thousand, Euros 1,852 thousand and Euros 120 thousand in 2016). Contributions to pension plans and group insurance policies, together with life insurance premiums paid, totalled Euros 2,564 thousand in 2017 (Euros 2,389 thousand in 2016). Funds accumulated due to these contributions amount to Euros 26,367 thousand at 31 December 2017 (Euros 22,121 thousand at 31 December 2016). The executives have received no remuneration in respect of profit sharing or bonuses and no loans have been granted to them. No advances had been granted to management personnel at 31 December 2017 (Euros 175 thousand at 31 December 2016). At 31 December 2017, Gas Natural Fenosa had granted collateral for management personnel loans amounting to Euros 754 thousand. No collateral had been granted at 31 December 2016. No indemnities were received during 2017 or 2016. The contracts of the executives contain a clause that stipulates a indemnity between two and three and a half remuneration pay in certain cases of termination of laboral contract and an indemnity equivalent to one year’s fixed remuneration for the post-employment no-competition clause for a period of two years.
Note 26. Contingent liabilities and commitments Guarantees As at 31 December 2017 and 2016 guarantees provided by Gas natural Fenosa were as follows: - Guarantees provided to third parties basically related to investment commitments of group
companies amounting to Euros 138 million (Euros 251 million at 31 December 2016).
- Guarantees related to economic obligations derived from its participation in the Spanish electricity system (MEFF and OMIE) totalling Euros 200 million (Euros 104 million at 31 December 2016).
- Financial guarantees corresponding to the guarantee of compliance with the loan obligations
received by investees amounting Euros 100 million (Euros 113 million at 31 December 2016).
- Debt issue guarantees made by the group companies, Gas Natural Capital Markets, S.A., Gas Natural Finance, B.V., Unión Fenosa Preferentes, S.A.U. and Gas Natural mexico S.A. de CV for an amount of Euros 12,879 million (Euros 11,982 million at 31 December 2016).
- Guarantees for gas supply and transport contracts obligations as well as charter contracts for gas
tankers of the group companies Gas Natural Aprovisionamientos, S.A. and Gas Natural Europe, S.A.S.
- Irrevocable guarantee by Gas Natural SDG, S.A. of all the liabilities and commitments of Vayu Ltd
and its subsidiaries in Ireland at 31 December 2017 pursuant to Section 357 of the 2014 Companies Act of Ireland in order to file the consolidated financial statements of Gas Natural Fenosa instead of its separate financial statements, on the basis of the exemption allowed under Section 1 (b) of said Act.
Given that the aforementioned guarantees are basically granted in order to guarantee compliance with contractual obligations or investment commitments, the events that would lead to its execution, and therefore the disbursement in cash, would be breaches by Gas Natural Fenosa of its obligations in relation to the ordinary course of its activity, which is considered to have a probability of remote occurrence. Gas Natural Fenosa estimates that the liabilities not foreseen at 31 December 2017, if any, that could arise from guarantees furnished, would not be significant.

55
Contractual commitments At 31 December 2017, the Company is party to several gas supply contracts with “take or pay” clauses negotiated for “own use” (Note 3.5), by virtue of which it has gas purchase rights for the period 2017-2040 in the amount of Euros 8,056 million, calculated on the basis of natural gas prices at 31 December 2017 (2016: Euros 8,358 million based on natural gas prices at 31 December 2016). Operating lease obligations breakdown as follows:
2017 2016
Up to one year 20 18
Between 1 and 5 years 73 70
Between 5 and 10 years 43 48
136 136
Includes the rent of the “Torre del Gas” building owned by Torre Marenostrum, S.L., for which the Company has an operating lease without a purchase option until the year 2019, extended at market value for successive periods of three years, on a discretionary basis for the Company and an obligatory basis for Torre Marenostrum S.L. It also includes operating leases without a purchase option of five properties in Madrid (Avenida San Luis 77, Antonio López 193, Acanto 11-13, Avenida América 38 and Calle Lérida) for a ten-year term which may be extended for five years except in the case of Avenida América 38 (Note 5). Contingent liabilities The Company reports no relevant contingent liabilities relating to litigation or arbitration at the date of these annual accounts.
Note 27. Auditors’ fees The fees accrued in thousand Euros by the different companies trading under the PwC brand are as follows:
Thousand Euros
2017 2016
PwC
Auditores, S.L.
PwC other network
Total PwC
Auditores, S.L.
PwC other network
Total
Auditing services 912 -- 912 674 -- 674
Assurance services and services related to the audit (1)
383 -- 383 289 -- 289
Other services (1) 146 881 1,027 137 -- 137
Total fees 1,441 881 2,322 1,100 -- 1,100
(1) In PwC Auditores, S.L., these items include verification reports of non-financial information, comfort letters and advice on sustainability.
Note 28. Environment Environmental actions
The Environmental Strategy is based on four environmental pillars that are defined according to the key vectors of the company’s environmental management system:
− Climate and Air: Reducing emissions through our operations and promoting the use of sustainable
energy.
− Water: Promoting the efficient and responsible use of water.
− Natural Capital: Minimising the impacts on ecosystems and promoting natural capital.
− Circular Economy: Optimising resource consumption and enhancing resource recirculation.

56
This is achieved through environmental management of Gas Natural Fenosa based on the ISO 14001 model, the correct functioning of which is verified periodically, providing the tools required to assure environmental management. In this context, in 2017 the adaptation to the 2015 reference framework was completed and the certification of environmental management was extended to electricity and gas distribution companies in Chile. With respect to air and the climate, Gas Natural Fenosa bases its strategy on five lines of action: the reduction of emissions in its operations through low-carbon energy and renewable energy sources, the reduction of emissions through energy efficiency, the development of sustainable products and services, the integration of the climate variable into internal management and the calculation of impact and performance. During 2017, there has been an increase in direct CO2 emissions compared with 2016 as a direct result of a significant reduction in non-emission generation in Spain due to adverse weather conditions, which has led to an increase in heat production and therefore an increase in CO2 emissions. As a result, specific emission per unit of energy generated has also increased compared with 2016. With regard to water management, in 2017 actions were carried out focusing on optimising consumption and reducing waste discharges, promoting sustainable use in stakeholders, inclusion in decision-making and determining impact and performance. In spite of this, in 2017 there was an increase in water use, primarily due to the increased demand in the activity of coal-fired and combined cycle power plants. In 2017, Gas Natural Fenosa has conducted multiple actions in the natural capital and biodiversity area, all of which are aligned with the reduction in and compensation for its impacts, the enhancement of the value of the natural surroundings and the determination of its impact on natural capital. Within the axis of the circular economy, actions have been carried out associated with the optimisation of raw materials consumption, reduction of waste generation, contribution to the development of regulations and the determination of impact and performance. The environmental activities undertaken in 2017 amounted to Euros 10 million, Euros 1 million relating to environmental investment and Euros 9 million relating to the costs of environmental management at facilities (Euros 7 million related to environmental management at facilities in 2016). Possible contingencies, indemnities and other environmental-related risks in which Gas Natural Fenosa could be incur are adequately covered by subscribed liability insurance policies.
Note 29. Events after the balance sheet date On 16 January 2018 Gas Natural Fenosa Finance, B.V., through its Euro Medium Term Notes (EMTN) programme, in which the Company acts as guarantor, carried out a bond issue amounting to Euros 850 million, maturing in January 2028 with an annual coupon of 1.5%. The resources obtained by this issuance have been allocated to a repurchase of bonds with maturities between 2019 and 2023 that have been completed on 23 January 2018, for an amount of Euros 916 million.
************

57
APPENDIX I. GAS NATURAL TAX GROUP COMPANIES
The companies in the Gas Natural tax group are as follows:
Gas Natural SDG, S.A. La Energía, S.A.
Boreas Eólica 2, S.A. La Propagadora del Gas Latam, S.L.U.
Compañía Española de Industrias Electroquímicas, S.A. La Propagadora del Gas, S.A.
Energías Ambientales de Somozas, S.A. Lignitos de Meirama, S.A.
Energías Especiales Alcoholeras, S.A. Nedgia, S.A.
Europe Maghreb Pipeline Limited Nedgia Andalucía, S.A.
Explotaciones Eólicas Sierra de Utrera, S.L. Nedgia Aragón, S.A.
Fenosa Wind, S.L.U. Nedgia Balears, S.A.
Fenosa, S.L.U. Nedgia Castilla-La Mancha, S.A.
Gas Natural Almacenamiento Andalucía, S.A. Nedgia Castilla y León, S.A.
Gas Natural Aprovisionamientos SDG, S.A. Nedgia Catalunya, S.A.
Gas Natural Capital Markets, S.A. Nedgia Cegas, S.A.
Gas Natural Comercializadora, S.A. Nedgia Madrid, S.A.
Gas Natural Distribución Latinoamérica, S.A. Nedgia Navarra, S.A.
Gas Natural Exploración, S.L. Nedgia Redes Distribución de Gas, S.A.
Gas Natural Fenosa Electricidad Colombia, S.L. Nedgia Rioja, S.A.
Gas Natural Fenosa Engineering, S.L. Operación y Mantenimiento Energy, S.A.
Gas Natural Fenosa Generación, S.L.U. Parque Eólico El Hierro, S.L.
Gas Natural Fenosa Ingeniería y Desarrollo de Generación, S.L.U. Parque Eólico Montamarta, S.L.
Gas Natural Fenosa Internacional, S.A. Parque Eólico Nerea, S.L.
Gas Natural Fenosa LNG, S.L. Parque Eólico Peñarroldana, S.L.
Gas Natural Fenosa Renovables, S.L.U. Petroleum Oil & Gas España, S.A.
Gas Natural Informática, S.A. Sagane, S.A.
Gas Natural Redes GLP, S.A. Sociedad de Tratamiento Hornillos, S.L.
Gas Natural S.U.R. SDG, S.A. Societat Eòlica de L'Enderrocada, S.A.
Gas Natural Servicios SDG, S.A. Sociedad Parque Eólico Mouriños, S.L.U.
Gas Natural Transporte SDG, S.L. Tratamiento Almazán, S.L.
Gas Natural Wind 4, S.L.U. Tratamiento Cinca Medio, S.L.
General de Edificios y Solares, S.L. Unión Fenosa Distribución, S.A.
Global Power Generation, S.A. Unión Fenosa Financiación, S.A.
Holding de Negocios de Gas, S.A.U. Unión Fenosa Minería, S.A.
JGC Cogeneración Daimiel, S.L. Unión Fenosa Preferentes, S.A.U.

Gas Natural SDG, S.A. 2017 Annual Report
DIRECTORS’ REPORT

Directors' Report for the financial year ended 31 December 2017
Contents
1. Company situation 1 2. Business evolution and results 6 3. Sustainability 9 4. Main risks and uncertainties 18 5. Forecast Group performance 22 6. Sustainable innovation 23 7. Additional information 27 8. Annual Corporate Governance Report 28

1
1. Company situation The long-term commitment to value creation and sustainable management is specified in the Corporate Responsibility Policy, which provides the common framework for action that guides the company's socially responsible conduct; it was approved and updated by the Board of Directors in December 2015, based on international best practices and the recommendations enshrined in the Code of Good Governance of Listed Companies. This policy undertakes eight commitments to the company's stakeholders: 1. Commitment to results 2. Service excellence 3. Responsible environmental management 4. Interest in people 5. Health and safety 6. Responsible supply chain 7. Social commitment 8. Integrity and transparency
These commitments are horizontal and are present throughout the company's business process, based on the generation of economic, social and environmental wealth.
Gas Natural Fenosa is an integrated energy group supplying gas and electricity to almost 18 million customers. It focuses on the gas distribution and supply and on generating, distributing and supplying electricity. It also operates other business lines, such as energy services, which enhance the diversification of activities and revenues, staying at the forefront of new market trends, meeting customers' specific needs and offering them an integrated service not confined to selling energy. Gas Natural Fenosa's mission is:
To meet the needs of…
With vision… Based on our values
Our shareholders Offering increasing sustainable profitability > Commitment to results > Customer-oriented > Sustainability > Interest in people > Social responsibility > Integrity
Our customers Being leaders in continuous growth and with a multinational presence, offering high-quality products that respect the environment
Our employees Offering opportunities for professional and personal development
Society Contributing positively through a commitment to global citizenship
Gas Natural Fenosa's business model is implemented through a number of companies in Spain, elsewhere in Europe, and in Latin America and Africa, and is underpinned by the following main businesses:
Networks – Gas distribution 41% of EBITDA: Spain and Latin America
Networks – Electricity distribution 26% of EBITDA: Spain and Latin America
Gas 20% of EBITDA: Infrastructure and supply
Electricity 15% of EBITDA: Spain and International Note: -2% other activities
Gas Natural Fenosa has a differentiated business model, with 85% of EBITDA from regulated or quasi-regulated activities and 49% from international projects. Throughout the value chain, Gas Natural Fenosa's business model stands apart as a leader in the gas sector and a key player in the electricity sector, in both cases ensuring a regular supply of gas and electricity, which is essential to providing a quality service and fulfilling the company's social mission; providing a broad range of value-added services and fostering sustainable innovation to drive development.

2
1.1. Corporate governance
1.1.1. Corporate Governance Model
Gas Natural Fenosa is governed in accordance with the principles of efficiency and transparency in line with the main existing recommendations and standards, and it adopts advanced corporate governance practices for this purpose. The corporate governance terms of reference mainly comprise: − Articles of Association (updated in 2017) − Regulations of the Board of Directors and its committees (updated in 2016) − Regulations of the General Meeting of Shareholders (updated in 2015) − Internal Code of Conduct in connection with the Securities Markets − Human Rights Policy − Code of Ethics (updated in 2015) On 21 September 2016, the shareholders of Gas Natural Fenosa, Criteria Caixa, S.A.U. (Criteria) and Repsol, S.A. (Repsol) announced the sale to GIP III Canary 1 S.à.r.l. (GIP) of 20 % (10% each by Criteria and Repsol) of Gas Natural SDG, S.A., as established in the sale agreement signed on 12 September 2016. As a result of that sale in 2016, the composition of Gas Natural Fenosa's Board of Directors and committees was modified and a condition was introduced into the Regulation of the Board of Directors that a majority of two-thirds of directors would be required to approve certain reserved matters. During 2017 the General Meeting approved by co-optation the following Directors:
- Mr. Alejandro García-Bragado (Proprietary Criteria) - Mr. Marcelino Armenter (Proprietary Criteria) - Mr. William Woodburn (Proprietary GIP) - Mr. Rajaram Rao (Proprietary GIP) - Mr. Mario Armero (Proprietary GIP) - Ms. Helena Herrero (independient)
1.1.2. Shareholders' Meeting Shareholders who, either individually or collectively with others, hold 100 shares may attend the meeting provided that they are shareholders of record at least five days in advance. Attendance at the 2017 Shareholders' Meeting (%): 82.00%
13.34%
18.00%
68.66%
Represented No Quorum Attendants
1.1.3. Board of Directors
Gas Natural Fenosa structures the functioning of its highest management body, the Board of Directors, a through its functioning in Plenary and in Commissions, in response to the requirements of the Capital Companies Law. Therefore, the Board of Directors of Gas Natural Fenosa has an Audit Committee and the Appointments and Remuneration Committee, which exercise the functions entrusted to them by the Law.

3
Additionally, the Board of Directors has an Executive Committee, which deals with resolving the most operational matters over which the Board has competence. During 2017, the Board of Directors debated, within the scope of its powers, the main matters considered that are as follows:
- Monthly, half-year and annual monitoring and supervision of business development. - Approval of accounts and other actions required by accounting regulations and/or stock
market. - Strategic discussion aimed at preparing the new Strategic Plan 2018-2020. - Budget, financing plan, investment plan and other actions in terms of activity
programming and financial discipline. - Efficiency plan. - Company's registered offices transfer. - Examination of the main risks of the Company and its control systems. - Corporate operations, among which are the divestments made in Italy, Colombia and in
the gas distribution business in Spain. - Actions in matters of corporate governance: in addition to the usual (Annual Corporate
Governance Report, Annual Remuneration Report,…), this year there has been external advice in the process of evaluating the functioning of the Board of Directors and its Committees, in accordance with the best corporate governance practices.
- General Meeting, including proposal for appointment of new directors and proposal for dividend distribution.
- Social Corporate Responsability. Composition of the Board of Directors and its committees (at 31 December 2017) Board of Directors Executive
Committee Audit Committee
Appointments and Remuneration Committee
Category of director
Seniority on Board
Chairman Mr. Isidro Fainé Casas Chairman
Proprietary 18/05/2015 First Deputy Chairman Mr. Josu Jon Imaz San Miguel Board member
Proprietary 21/09/2016
Second Deputy Chairman
Mr. William Alan Woodburn Board member Board member Proprietary 30/09/2016
Managing Director Mr. Rafael Villaseca Marco Board member
Executive Director
28/01/2005
Director Mr. Ramón Adell Ramón Board member Chairman Independent 18/06/2010 Director Mr. Enrique Alcántara-García
Irazoqui Board member
Proprietary 27/06/1991
Director Mr. Xabier Añoveros Trías de Bes Board member
Independent 20/04/2012 Director Mr. Marcelino Armenter Vidal Board member
Proprietary 21/09/2016
Director Mr. Mario Armero Montes Proprietary 21/09/2016 Director Mr. Francisco Belil Creixell Board member
Chairman Independent 14/05/2015
Director Ms. Benita María Ferrero-Waldner Board member
Independent 14/05/2015 Director Mr. Alejandro García-Bragado
Dalmau Board member Proprietary 21/09/2016
Director Ms. Cristina Garmendia Mendizábal
Board member Board member Independent 14/05/2015
Director Ms. Helena Herrero Starkie Board member
Independent 04/05/2016 Director Mr. Miguel Martínez San Martín Board member
Board member Proprietary 14/05/2015
Director Mr. Rajaram Rao Board member Board member Proprietary 21/09/2016 Director Mr. Luis Suárez de Lezo Mantilla Board member
Proprietary 26/02/2010
Non-director Secretary Mr. Manuel García Cobaleda Non-director Secretary
Non-director Secretary
Non-director Secretary
N/A 29/10/2010
There were no director removals or appointments in 2017.

4
Board of Directors profile (%)
Board of Directors activities and performance Number of meetings of the Board of Directors and its committees
Board of Directors Executive Committee
Audit Committee Appointments and Remuneration
Committee
2017 15 3 10 5
2016 15 6 7 8
1.1.4. Management Committee
In terms of management structure dependent on the Managing Director there is a Management Committee composed of:
Mr. Rafael Villaseca Marco: Managing Director Mr. Carlos J. Álvarez Fernández: Chief Financial Officer Mr. Sergio Aranda Moreno: General Manager – Latin America Mr. Antonio Basolas Tena: General Manager - Strategy and Development Mr. José Mª Egea Krauel: General Manager - Energy Planning Mr. Manuel Fernández Álvarez: General Manager - Wholesale Energy Business Mr. Antonio Gallart Gabás: Chairman of Compañía General de Electricidad, S.A. Mr. Manuel García Cobaleda: General Counsel and Secretary of the Board of Directors Mr. Jordi García Tabernero: General Manager - Communication and Institutional Relations Mr. Daniel López Jordà: General Manager - Retail Energy Business Mr. Antoni Peris Mingot: General Manager - Regulated Business Ms. Rosa María Sanz García: General Manager - People and Resources
1.1.5. Remuneration policy
Board of Directors
The annual report on director remuneration was presented as a separate item for a consultative vote at the Shareholders' Meeting in 2017.
Directors' remuneration for their membership of the Board and its committees consists solely of fixed amounts determined on the basis of the positions they hold.
Based on a favourable report from the Appointments and Remuneration Committee, the Board of Directors resolved to maintain in 2017, without any changes, the remuneration for membership of the Board of Directors and Executive Committee (in force since 2007) and for membership of the Appointments and Remuneration Committee and the Audit Committee (in force since 2015).
5.9%
58.8%
35.3%
Type of Director
Executive
Proprietary
Independent
47%
12%
35%
6%
Skills
Industrial engineering and energy Finance, accounting and audit
Legal and adminstration Management

5
Remuneration for membership of the Board of Directors and its committees (Euros/year):
Chairman of the Board of Directors 550.000
Director 126.500
Chairman of the Executive Committee 550.000
Member of the Executive Committee 126.500
Member of the Appointments and Remuneration Committee 25.000
Member of the Audit Committee 40.000
The CEO's remuneration for his executive functions is based on the following:
Item Objective Criteria
Fixed remuneration
Remunerate the level of responsibility attached to these functions.
Ensure that the remuneration is competitive vis-à-vis comparable companies.
Annual variable remuneration
Link remuneration with the company's performance in the short term.
Calculated on the basis of attainment of the objectives for the year: economic (EBITDA, net profit, working capital/revenues), efficiency (achievement of synergies), business growth (net increase in no. of gas connection points and sales of LNG in other countries) and quality, security and safety (accident rate, environmental ratios and customer satisfaction).
Multi-year variable remuneration
Strengthen the commitment to achieving the goals set out in the strategic plans.
It is calculated by applying the degree of attainment of the economic goals related to optimisation and financial discipline (EBITDA, net debt/EBITDA, market capitalisation and enterprise value/EBITDA), each weighted 25%.
The 2015-2017, 2016-2018 and 2017-2019 remuneration programmes are currently in force.
Other items Safeguard the company's benefits.
Health and life insurance.
Energy rebate.
The remuneration is supplemented by pension plans and a group health insurance policy.
Total remuneration earned by the Board of Directors in 2017, by type (Euros thousand)
2,574
2,074
1,285
1,131
757
16
For sitting on the Board
For sitting on the Board committees
Fixed remuneration
Short-term variable remuneration
Pluri-annual variable remuneration
Other items
Management Committee The general remuneration policy for members of the Management Committee is determined by the Board of Directors on the basis of a proposal by the Appointments and Remuneration Committee.
The remuneration model contains the same components as above for the CEO's executive functions, although it has specific individual objectives in addition to the group objectives.

6
Total remuneration earned by the Management Committee and head of Internal Audit1 in 2017, by type (Euros thousand)
5,507
2,595
1,641
108
Fixed remuneration
Short-term variable remuneration
Pluri-annual variable remuneration
Other items
1 In accordance with CNMV Circular 5/2013, for the purposes of remuneration, senior management includes executives who report directly to the company's chief executive and also the head of internal audit.
2. Business evolution and results The main financial aggregates of Gas Natural SDG and their performance are as follows:
2017 2016 %
Net turnover 5,053 5,062 (0.2)
Operating profit 1,496 1,617 (7.5)
Profit for the year 1,023 1,067 (4.1)
Shareholders’ equity 13,473 13,431 0.3
Net equity 13,466 13,444 0.2
Current liabilities 4,240 3,597 17.9
Gas Natural SDG, S.A., is a company that develops its activity basically through the tendency of other group and associated companies shares, so information bellow refers to de Consolidated group of Gas Natural Fenosa. 2.1. Highlights and main aggregates 2.1.1. 2017 Highlights January to March − Gas Natural Fenosa issues Euros 1,000 million in notes with a 1.375% annual coupon,
maturing in 10 years.
− Continues to be a member of the FTSE4Good sustainability index, for the fifteenth consecutive year.
− The company is ranked Gold Class in the 2017 RobecoSam sustainability index.
− Gas Natural Fenosa earmarks Euros 4.5 million to tackle vulnerability in vulnerable clients.
− Once again, the company is certified as one of Spain's Top Employers based on its employees' work conditions.
− Gas Natural Fenosa issues Euros 1,000 million in notes with a 1.125% annual coupon, maturing in 7 years.

7
April to June − Gas Natural Fenosa Renovables will invest Euros 700 million after being awarded 667 MW
of wind capacity in an auction held by the Spanish government.
− Gas Natural Fenosa takes part in the European Make Power Clean initiative to foster a cleaner electricity market in Europe.
− The Integrated Control Centre (ICC) for the company's hydroelectric plants is opened in Ourense.
July to September − Gas Natural Fenosa is granted a Euros 450 million loan from the European Investment
Bank (EIB) to finance wind farms and electricity distribution in Spain. It also signs a Euros 200 million loan agreement with Instituto de Crédito Oficial (ICO) to help fund its investment plan through 2020.
− Gas Natural Fenosa signs its first "sustainable loan", for Euros 330 million, with ING.
− The company is awarded 250 MW of photovoltaic capacity in the new renewables auction which will result in Euros 165 million investments.
− Gas Natural Fenosa signs an agreement to sell a non-controlling 20% stake in its gas distribution business in Spain for Euros 1,500 million.
− Gas Natural Fenosa is one of the winners in DuPont's International Safety and Sustainability Awards.
− Gas Natural Fenosa is leader in the gas utilities sector of the Dow Jones Sustainability Index.
− Actualidad Económica ranks Gas Natural Fenosa among top five best companies to work for.
− Gas Natural Fenosa, through its subsidiary GPG, launches commercial operations at its first photovoltaic power plant in Brazil (68MW).
October to December − Gas Natural Fenosa agrees to sell its companies and assets in Italy to 2i Rete Gas and
Edison.
− Gas Natural Distribución to become Nedgia in compliance with the principle of unbundling under European Directive 2009/73/EC (gas).
− Gas Natural Fenosa launches its first green bonds in a Euros 800 million issue to finance renewable projects with a 0.875% annual coupon.
− Gas Natural Fenosa agrees to sell its stake in gas distribution in Colombia to Canadian fund Brookfield.
− The company teams up with Norwegian tech firm Connect LNG to develop DirectLink LNG, the world's first floating LNG ship-to-shore transfer system.
− The company is again included in the Euronext Vigeo Europe 120 and Euronext Vigeo Eurozone 120 indices.
Financial performance (Euros million)
Notes to financial information
− The consolidated income statement and operating figures for 2016 have been re-stated due
to the discontinuation of the following operations: gas distribution in Italy and Colombia, electricity distribution in Moldova, gas supply in Italy and electricity generation in Kenya in application of IFRS 5.

8
Main financial aggregates
2017 2016 %
Revenue 23,306 21,908 6.4 EBITDA 3,915 4,664 (16.1) Income attributable to equity holders of the parent 1,360 1,347 1.0 Net capital expenditure 1,597 2,225 (28.2) Net borrowings (at 31/12) 15,154 15,423 (1.7)
EBITDA by geography in 2017 (%) EBITDA by business in 2017 (%) Capital expenditure by business in
2017 (%)
Spain51.5%
International48.5%
Networks67.6%
Electricity14.8%
Gas19.6%
Others-2.0%
Networks66.6%Gas
3.7%
Electricity19.4%
Others10.3%
Main financial ratios 2017 2016
Leverage 45.3% 44.8% EBITDA/Cost of net financial debt 6.4x 6.3x Net financial debt/EBITDA 3.9x 3.3x ROA (return on assets) 2.9% 2.9%
Main stock market ratios and shareholder remuneration
2017 2016
Average no. of shares ('000)1 1,000,478 1,000,468 Share price at 31/12 (Euros) 19.25 17.91 Market capitalisation at 31/12 (Euros million) 19,263 17,922 Earnings per share (Euros)1 1.36 1.35 Payout (%) 73.6 74.3
Total dividend2 1,001 1,001
Dividend per share 1.00 1.00
Price-earnings ratio (P/E) 14.2 13.3
EV/EBITDA 8.8 7.1 1 Calculated considering the weighted average number of shares during the year. 2 Based on the total equivalent amount used to pay dividends. In 2017, this included a supplementary dividend amounting to Euros 671 million, pending approval by shareholders at the General Meeting.
2.1.2. Operational performance
Distribution 2017 2016
Gas distribution (GWh) 460,014 426,510
Electricity distribution (GWh) 53,670 65,586
Gas distribution connections ('000) 10,491 10,224
Electricity connection points ('000) 7,415 7,324
Gas distribution network (km) 116,181 113,083
Length of electricity transmission and distribution network (km) 214,399 215,894

9
Gas 2017 2016
Gas supply in Spain (GWh) 176,053 178,916
Gas supply in rest of world (GWh) 183,978 146,541
Total gas supply (GWh) 360,031 325,457
Electricity 2017 2016
Installed capacity in Spain (MW) 12,716 12,716
Installed capacity in rest of world (MW) 2,732 2,590
Total installed capacity (MW) 15,448 15,306
Net production in Spain (GWh) 27,953 28,504
Net production in rest of world (GWh) 18,436 17,857
Total net production (GWh) 46,389 46,361
3. Sustainability
3.1. Environmental and social performance
Main aggregates
Unit 2017 2016
Direct greenhouse gas emissions MtCO2e 20.5 19.6
Emission factor for electricity generation (1) tCO2/GWh 431 411
Installed capacity free of emissions (2) % 22.3 22.1
Net production free of emissions (2) % 9.7 16.4
Activity with ISO 14001 environmental certification (3) % 87.7 86.3 (1) Factor for power generation facilities operated by Gas Natural Fenosa and in which has a controlling interest (Corporate
Responsibility Report perimeter).
(2) By historic traceability, including nuclear power generation.
(3) Taking into account only the Ebitda of companies with environmental impact.The ebitda of the certificated activity with ISO 14001
represents the 78.8% of total ebitda.
Integrated environmental management
In 2017, Gas Natural Fenosa activities that have a significant environmental impact was covered by the environmental management model set out in the ISO 14001 standard. It should be pointed out that the system was successfully switched over to the 2015 version of the standard over the course of the year. Variations are due to the increase in certified businesses and disinvestments made by the group which had been certified according to this standard. In 2017, environmental certification was extended to electricity and gas distribution companies in Chile. Environmental planning is included in the Quality, Environment, Security and Health Plan. This plan consists of strategies and lines of action which define the working guidelines for each period. There were 257 environmental management-related objectives defined in 2017 with satisfactory fulfilment of the plan. Environmental training is a basic tool for preventing and reducing environmental impacts and improving environmental operational control in our activities. In this sense, a total of 3,826 hours of training were received by 1,572 participants in 2017, with plan objectives being met by 140% and 133%, respectively. Environmental Strategy to 2020
The Environmental Strategy is based on four environmental and two transversal pillars. The environmental pillars are defined according to the key vectors of the company’s environmental management system:

10
- Climate and Air Quality: Reducing emissions through our operations and promoting the use of sustainable energy.
- Water: Promoting the efficient and responsible use of water. - Natural Capital: Minimising the impacts on ecosystems and promoting natural capital. - Circular Economy: Optimising resource consumption and enhancing resource
recirculation.
The transversal pillars are necessary for integrating environmental sustainability into the decision-making process within the group’s businesses.
In turn, these pillars have been transposed into 22 lines of action (16 environmental and 6 transversal). Each line of action is divided into a series of actions that sets out the guidelines to enable each business to define objectives (specific actions).
The Strategy is instrumented through the Gas Natural Fenosa’s environmental management model, based on the international ISO 14001 standard, and forms a basic part of the company‘s integrated management system (IMS) for quality, the environment, and health and safety.
1. Climate and air quality
The climate and air quality pillar aims to reduce emissions through our operations and to promote the use of sustainable energy. The lines of action associated with this pillar are:
- Reducing emissions through the operations.
- Reducing emissions by means of energy efficiency.
- Developing sustainable services and products.
- Integrating internal climate change management.
- Determining impact and performance.
Thermal power stations operation increased significantly in 2017 compared to 2016 as a consequence of the lower availability of renewable resources in Spain. The lack of rains and wind hindered normal operations of zero-emissions installations, making it necessary to bring in manageable and CO2-emitting energies to satisfy demand. As a result, emission values were recorded that were significantly higher than those of 2016, a year with more favourable weather conditions, although not as high as those recorded in 2015. Gas Natural Fenosa is firmly committed to sustained growth in its renewable energy generation installations. Given the circumstances described, power generated from renewable energy sources was lower than the previous year’s figure. Despite 2017 being a dry year with less wind, lower environmental impact was appreciated when compared to years with similar weather patterns, such as 2012. Mention should be made of the new developments in renewable technologies taking place in Brazil and those earmarked for 2018 in the Canary Islands. Gas Natural Fenosa takes an active role in the global business initiatives and climate action and in the most relevant international forums, such as the United Nations Conference of the Parties. In 2017, there was an increase in absolute emissions of SO2, NOx and total suspended particles (TSP) into the atmosphere, due to increased operations of the thermal power stations, caused by the decrease in renewables production (hydroelectricity and wind power) in Spain. Likewise, there was significant progress made in relation to the development of renewable gas and the promotion of sustainable, low-emission mobility.

11
2. Water
For the purpose of promoting the efficient and responsible use of water, the lines of action associated with this pillar are:
- Optimising water consumption and reducing water discharge.
- Fostering the sustainable use of water among our stakeholders.
- Including water in the decision-making process.
- Determining impact and performance.
In general terms, there was a significant increase in the volume of water consumed in 2017, mainly owing to increased demand created by activity at coal-fired and combined-cycle power stations.
3. Natural capital
The aim or this pillar is to minimise the impacts on ecosystems and to promote natural capital. In this sense, the associated lines of action are:
- Reducing and compensating for our impacts and enhancing the value of natural
environments.
- Determining our impact on natural capital.
- Determining impact and performance.
The company continues to extend the focus of its environmental management towards valuing natural capital, in other words, the reserves of renewable and non-renewable natural assets found in nature, in order to identify and assess the dependency and impact (both positive and negative) of its activities. The company conducted a large number of actions to preserve biodiversity, some of these in response to the requirements set out by the environmental authorities and others of a voluntary nature.
4. Circular economy
Gas Natural Fenosa focuses its efforts in the field of circular economy on optimising resource consumption and enhancing resource recirculation. For this purpose, the following lines of action have been developed:
- Optimising the consumption of raw materials.
- Reducing the production of waste and encouraging its transformation into by-products.
- Contributing to the development of circular economy regulation.
- Determining impact and performance.
In 2017, generation of the most significant non-hazardous waste increased compared to 2016. Owing to reasons previously explained, mention must be made of increased ash and slag production.

12
3.2. Interest in People
Main aggregates
Social performance 2017 2016 % Var.
Number of employees at the end of 2017 15,375 15,502 (0.8)
Voluntary rotation index (%) 2.9 2.5 16.0%
Integration index (persons with disability)1 2.57 2.42 6.2%
Training time per employees 38.4 51.0 (24.6%)
1 Spain
People management strategy
During 2017, the strategy of managing people at Gas Natural Fenosa focused on levers of
cultural transformation, employee experience, strategic planning of people and new models of
organisational performance.
Areas and levers of the people management strategy
Organizational performance
Cultural development
Leadership and talent
Smart simplicity
Cultural transformation
Strategic planning of people
- New organizational models
- Target culture
- We take care of the experience
- Evolution of people management processes
- Evolution of people management processes
- Diversity
- Role-modelling - Internationalization of the
group profile
- Strategic workforce
planning
Extended workforce
Employee experience
Leadership
- Subcontracting borders
- Employee journey
- Employee journey - Model of relationship Gas
Natural Fenosa-Suppliers
- Employer branding
- Employer branding - Occupational risk
management
- Meritocracy
Human resources operating model
- HR analytics - CSC productivity
Gas Natural Fenosa pretends to offer its employees stable, quality employment together with a solid, structured and attractive professional career, where 96% of the positions have open-ended contracts. In this regard, we can highlight the fact that 84% of employees declare they have a high level of commitment to the company (Workplace Climate Survey 2017). In 2017, the talent management cycle has been applied to all professionals that hold executive positions, and it has been integrated into the new talent management digital platform “Evolution”, based on SAP technology. In-class training sessions have taken place in all countries directed to guarantee experience in using the new platform and the understanding of the annual talent cycle.
Through the global talent management model, the company assesses professional skills,
individual development plans, talent segmentation and internal mobility and promotion.

13
The model is implemented in all countries, with the aim of offering development opportunities for
all professionals through customized learning actions, mobility, project assignment or by joining
coaching and mentoring programs.
Internal mobility is a fundamental pillar of commitment to people and to that end employees
have the possibility of internal mobility through the digital communication platforms.
For Gas Natural Fenosa it is essential to promote diversity and equal opportunities in an
environment of respect, understanding and ongoing dialogue, with a special focus on the
inclusion of individuals with various disabilities and extending this commitment to suppliers and
collaborating companies.
In 2017, the company’s commitment to diversity remained strong, consolidating the Integrated Diversity Plan (IDP) which brings together specific initiatives for people management, classified into three areas: gender, disabilities and age.
Gas Natural Fenosa continued to promote an appropriate work-life balance through a significant
number of flexible employment measures, services and benefits adapted to employees' needs.
Compensation and remuneration
Gas Natural Fenosa’s remuneration policy seeks to respond to equity on an internal scale and
competitiveness from the market point of view. There are two models:
- The remuneration level of employees included in the collective bargaining agreement
depends on the professional group and subgroup to which they belong.
- For those not included in the agreement, it is established on an individual basis
according to the remuneration policy approved by the Board of Directors’ Appointments
and Remuneration Committee.
The remuneration package of Gas Natural Fenosa employees is supplemented with a social
benefits system, which includes a joint promotion pension plan, the main vehicle of funding
post-employment commitments.
Internal communication with employees
The purpose of internal communication has the aim to contribute towards compliance with the
company’s strategic objectives based on growth, safety, leadership, innovation and the client as
the focal point, supported through the different business areas and with the aim of contributing
to increase the pride and the sense of belonging.
Gas Natural Fenosa has a range of channels to disseminate these messages, such as the
corporate Intranet and the magazine Natural, which is distributed internationally. During 2017
we have been working on creating a new corporate channel for the informative contents which
hitherto were disclosed on the Intranet, which will be called Naturalnews and the launch of
which is scheduled for the beginning of 2018. This is a move towards communication that is
more digital, with a friendly design, accessible through mobile devices, multi-language,
interactive with new informative content to increase employees’ satisfaction and encourage their
participation and collaboration.
More than 950 news items were published in 2017 on Naturalnet along with some 40 videos
with major participation by employees. The magazine Natural has also been redesigned to
make it more attractive and supportive.
Yammer, the company's corporate social network, is growing more consolidated and already
has almost 9,000 registered users at international level.

14
3.3. Tax policies
Tax strategy and Policy for controlling and managing tax risks At a meeting on 9 January 2018, the Board of Directors adopted the Tax strategy and Policy for controlling and managing tax risks, which sets out the basic principles guiding Gas Natural Fenosa's tax function and the main lines of action to mitigate tax risks and guide proper oversight of same.
The basic principles underlying the tax strategy of Gas Natural Fenosa are as follows:
- Responsibility in fulfilling tax obligations. - Low tax risk profile. - Adoption of tax treatments for economic reasons. - Transparency in tax information. - Cooperation with the tax authorities.
The main lines of the Policy for controlling and managing tax risks are as follows:
- Clearly defined tax-related governance. - Tax risk oversight procedures derived from Compliance. - Procedures for assessing and exercising oversight over grey areas. - Supervision of the Tax Control Framework - Regular reports to the Board of Directors on the tax situation.
All of Gas Natural Fenosa's tax policies are aligned with:
- Gas Natural Fenosa's Corporate Responsibility Policy, which establishes that one of the commitments and principles of action is to "adopt responsible business management practices and comply with all tax obligations in all jurisdictions in which the company operates, accepting the commitment to accountability and collaboration with the corresponding tax agencies."
- Gas Natural Fenosa's Code of Ethics, which establishes that "all employees of the group must comply with the laws in force in the countries where they conduct their activities, thereby heeding the spirit and objectives of the laws and behaving ethically in all their actions."
- the Code of Best Tax Practices, adopted on 20 July 2010 in plenary session by the Foro de Grandes Empresas, a body established by the Spanish Internal Revenue Service with the country's largest companies, including Gas Natural SDG, S.A. That Code contains recommendations from the tax authorities, which have been adopted voluntarily by Gas Natural Fenosa, with the aim of improving the application of the tax system by enhancing legal certainty, reducing litigation, fostering reciprocal cooperation based on good faith and legitimate trust, and the application of responsible tax policies.
To align that Gas Natural Fenosa's tax practices with those principles, the group has a General Standard governing the Tax Control Framework that has been designed in accordance with the guidelines of the Organization for Economic Cooperation and Development (OECD) for multinational companies, as well as for the design and implementation of a Tax Control Framework.
Gas Natural Fenosa also has a Risk Map that specifically identifies tax risks and disputes about the interpretation or application of tax law. The main issues of significance for tax purposes are detailed in Note 16 ("Tax situation") to the Annual Accounts of Gas Natural SDG, S.A. Tax havens
The creation or acquisition of interests in entities domiciled in countries or territories that are designated as tax havens must be reported to the Board of Directors through the Audit Committee.
In accordance with the Spanish regulations that determine which countries are considered to be tax havens (Royal Decree 1080/1991, of 5 July, and Royal Decree 116/2003, of 31 January),

15
Gas Natural Fenosa had only two holdings in companies incorporated in such territories, which were in process of redomiciliation or liquidation:
- A 95% stake in Buenergía Gas & Power, Ltd., domiciled in the Cayman Islands. This is a company that indirectly owns a stake in just one industrial holding: Ecoeléctrica, S.A., the company that generates electricity using a combined cycle plant in Puerto Rico; the latter is taxed in Puerto Rico and Gas Natural Fenosa does not obtain any tax advantage from this arrangement. On 2 February 2018 a change of registered office to Puerto Rico has been completed, which is in public registry process.
- The 52.2% stake in Gasoducto del Pacífico (Cayman), Ltd., domiciled in the Cayman Islands. This is a dormant company that was acquired by the group as a result of the acquisition of the CGE group and does not provide any tax advantage to Gas Natural Fenosa. The company was fully liquidated on 12 January 2018, and it will be dissolved once it is struck off the public record within three months from that date.
The only intercompany transactions with those companies in the year 2017 are dividends received, as follows:
Recipient Distributor Amount (Euros
thousand)
Global Power Generation, S.A. Buenergía Gas & Power, Ltd. 49,504
Tax contribution Gas Natural Fenosa gives priority to fulfilling its obligation to pay the taxes that are due in each territory in accordance with the applicable regulations.
Gas Natural Fenosa's total tax contribution amounted to Euros 3,272 million in 2017 (Euros 3,419 million in 2016). The following table shows the breakdown of the taxes actually paid by Gas Natural Fenosa in each country, segmented into those that represent an actual expense for the group ("own taxes") and those that the company withholds from or charges to other taxpayers (third-party taxes):
Own taxes Third-party taxes Total
Country Income tax (1) Others (2) Total VAT Tax on
hydrocarbons Others (3) Total
2017 2016 2017 2016 2017 2016 2017 2016 2017 2016 2017 2016 2017 2016 2017 2016
Spain 112 199 537 512 649 711 845 1,007 342 352 228 229 1,415 1,588 2,064 2,299
Argentina 15 10 67 42 82 52 19 13 - - 34 22 53 35 135 87
Brazil 51 38 67 49 118 87 74 58 - - 7 9 81 67 199 154
Colombia 60 75 57 78 117 153 - 7 - - 11 14 11 21 128 174
Chile 101 42 11 11 112 53 81 117 - - 22 18 103 135 215 188
Mexico 66 31 4 3 70 34 57 39 - - 19 11 76 50 146 84
Panama 10 89 9 7 19 96 - - - - 4 3 4 3 23 99
Rest of LatAm 8 12 1 1 9 13 4 2 - - 4 3 8 5 17 18
Total LatAm 311 297 216 191 527 488 235 236 - - 101 80 336 316 863 804
Italy 4 19 7 7 11 26 27 27 35 42 5 5 67 74 78 100
Remainder 11 10 28 23 39 33 143 128 76 49 9 6 228 183 267 216
Total 438 525 788 733 1,226 1,258 1,250 1,398 453 443 343 320 2,046 2,161 3,272 3,419
(1) Income tax actually paid in the year that figures in the Cash Flow Statement in the Consolidated Annual Accounts. Does not include accrued amounts. The reconciliation between
reported "income tax" and that which would result from applying the nominal tax rate in force in the parent company's home country (Spain) to "Profit before taxes" is detailed in Note 21
("Tax situation") to the consolidated financial statements.
(2) Includes energy taxes in Spain amounting to Euros 260 million in 2017 (Euros 244 million in 2016), local taxes, employer social security contributions and other specific taxes in each
country.
(3) Includes basically employee withholdings and employee social security contributions.

16
3.4. Integrity and transparency
The Code of Ethics of Gas Natural approved by the Board of Directors, is the document that establishes guidelines that must govern the ethical behaviour of managers and employees of Gas Natural Fenosa, in their daily work, with regard to relationships and interactions with all its stakeholders. The principles for the company’s employees are related to corruption and bribery, respect for people, professional development, equal opportunities, relation with collaborating companies, occupational health and safety, and caring for the environment, among others. In addition, Gas Natural Fenosa has an Anticorruption Policy, which establishes the principles which must be used to guide the conduct of all employees and administrators of the companies of the group with regard to the prevention, detection, investigation and correction of any corrupt practice within the organisation. In 2017, 2% of the notifications received were related to alleged fraud, none of which had any significant impact. 29% of the notifications were related to “Respect for people" chapter of the Code of Ethics, and they were all solved appropriately. None of them were related to discrimination. Gas Natural Fenosa expects a high level of commitment in fulfilling its Code of Ethics and Anticorruption Policy of all its employees. Therefore, emphasis is placed on transmitting a culture of integrity of the company. Its breach is analysed according to internal procedures, legal regulations and existing agreements. During 2017, we managed various disciplinary situations from complaints made to the Code of Ethics Committee, or from situations covered in the Code of Ethics or the Anticorruption Policy. In total, 3 misdemeanours, 4 serious offences and 17 very serious offences, of which 13 have resulted in dismissals through breach of the Code of Ethics, were handled. The Code of Ethics Committee also has a multi-year work plan, which includes actions in the short- and medium-term, with the ultimate goal of extending the code to the highest possible number of activities and people at the company. The company set up local committees in Argentina, Brazil, Colombia, Chile, Italy, Mexico, Moldova, Panama and South Africa.
Protocol of Investigation and Response to irregular conduct and fraud The protocol defines the action procedure and system to ensure that any notification from any employee, supplier or external partner of Gas Natural Fenosa concerning allegedly irregular or fraudulent conduct can be formulated and reported in a safe and confidential way in compliance with prevailing legislation, as well as the system for establishing all of the procedures required to enable an efficient investigation into irregular conduct and fraud reported.
The Gas Natural Fenosa reporting channel, through which all the employees and suppliers can send the Code of Ethics Committee queries or notify breaches of the code, in good faith, in a confidential manner and without fear of reprisal.
Crime Prevention Model
The company has a Crime Prevention Model that is updated every year, and which incorporates the control structure that already exists at Gas Natural Fenosa to efficiently prevent the occurrence of criminal offences set out in Organic Law 5/2010 on reform of the Penal Code. From an organisational standpoint, the Board of Directors has assigned the functions of Autonomous Body, described in Organic Law 1/2015, to the Compliance Assessment Committee, which is responsible for taking significant decisions in relation to the regular monitoring and oversight of the working and compliance with the Crime Prevention Model.

17
The model contains 21 crimes that have been identified, together with definitions of their impact and probability of occurrence, mechanisms for their control and minimisation, and responsibilities with regard to their fulfilment. Each year, the model is assessed by an independent third party. In 2017, it issued a satisfactory report on its design and effectiveness. Although fraud and corruption are covered in the crime prevention system, the company worked to improve and update its internal regulations and define specific protocols and mechanisms in this area. The Gas Natural Fenosa Anticorruption Policy complies with national and international legislation on corruption and bribery, and mainly that dictated by the Spanish Penal Code. This policy has the object of establishing the principles which must be used to guide the conduct of all employees and administrators of the companies of Gas Natural Fenosa with regard to the prevention, detection, investigation and correction of any corrupt practice within the organisation. The policy establishes fourteen principles of action, including aspects such as promoting integrity and transparency in the processing of information, money laundering, conflicts of interest and relationships with third parties. The focus of the Gas Natural Fenosa Anticorruption programme covers three key areas:
− Establishment of an antifraud and anticorruption culture through training and
awareness.
− Implementation of proactive measures to assess the risk of fraud and corruption,
monitoring and controls.
− Development of measures and response plans in the event of situations that constitute
fraud and corruption. These plans and measures include the investigation of the
episodes, the definition of solutions and the establishment of disciplinary measures.
In all operations involving risk, the company conducts due diligence processes systematically, both for high-risk suppliers, and company relationships with third parties (partners, joint ventures, etc.). The counterpart due diligence procedure aims to ensure that, across the board, reputational risk and corruption are analysed and assessed efficiently and in a standard way when third parties intervene in business relationships of the companies forming the group. In the security area, in 2017 there were 7,010 investigation and antifraud cases of action that took place in Argentina, Brazil, Colombia, Spain, Mexico, Moldova and Panama. Human Rights Policy Since 2011, Gas Natural Fenosa has a Human Rights Policy approved by the Management Committee. 0The policy has been developed and approved in response to society's growing demands. It is particularly applicable in locations in which local legislation does not provide a sufficient level of protection for human rights. The policy establishes ten commitments, which were determined on the basis of the main risks that affect human rights in the company, and accepts the UN Guiding Principles on Business and Human Rights.

18
Human Rights Policy Principles
1. Avoiding any practices which are discriminatory or which might compromise people's dignity
2. Eradicating the use of child labour
3. Helping to ensure freedom of association and collective negotiation
4. Protecting people's health
5. Offering dignified employment
6. Commitment towards people linked to suppliers, contractors and collaborating companies
7. Supporting and publicly promoting respect for human rights
8. Respecting for indigenous communities and traditional ways of life
9. Protecting facilities and people on the basis of respect for human rights
10. Helping to fight corruption
The company encourages the policy to be known and to be complied with using a communication and training plan, which includes a compulsory online course for all employees, seminars based around explaining principles of the policy and conflicts which could arise, and guidance sessions about the policy and its role in business activity. Towards the end of 2017, the course had been completed by 10,132 people. 4. Main risks and uncertainties
4.1. Risk management model Gas Natural Fenosa's risk management model seeks to ensure that the company's performance is predictable in all aspects that are of relevance to its stakeholders. This requires establishing the risk tolerance by setting limits for the main risk categories. In this way, the company can anticipate the consequences of certain risks and be perceived in the market as a sound, stable company, with all the benefits that entails. Gas Natural Fenosa has a framework integrating the vision of governance, risks and compliance so as to provide a 360º view of the group's processes, existing controls and the associated risks.
Corporate governance Preventive risk management, which includes issues beyond the mere economic sphere of the company's activities, is a core feature of Gas Natural Fenosa's corporate governance. Within the framework of its risk management and control policy, the company analyses and approves its risk profile each year and establishes the necessary measures to mitigate risks. Additionally, Audit Committee monitors the operation of risk management and control systems.
Risk
management
Corporate
governance
Internal audit
and
Compliance

19
Risk management Gas Natural Fenosa constantly analyses its overall risk profile by identifying, characterising and measuring the risks with the greatest potential impact on the company's financial statements. In this way, it determines the maximum accepted level of risk exposure and the admissible limits. These limits are assigned to each risk category as well as in overall terms; the result is the target overall risk profile. Internal audit and Compliance The Internal Audit units are responsible for performing the assurance and control function. To this end, the Internal Audit function has a risk-based approach, which provides independent assurance not linked to management about the effectiveness of the internal control system and of risk measurement and management in all areas of the group. Risk management bodies Guaranteeing the predictability and sustainability of the company's operational and financial performance is a key aspects of risk management at Gas Natural Fenosa, and is supported by a number of bodies with clearly identified areas of responsibility.
Audit Committee Supervises the company's internal control and risk management systems. Risk Committee Entrusted with determining and reviewing the company's target risk profile. It also exercises oversight to ensure that the entire organisation understands and accepts its responsibility for identifying, assessing and managing the main risks. Risk Units In charge of monitoring and reporting risks and ensuring that they fall within the limits defined in the target risk profile by the Risks Committee.
Businesses In charge of managing risk in all their areas of action. They identify trends and positions that may entail risk and report them to the Risk Units. They also apply the guidelines and criteria established by the Risk Units. Other corporate areas In charge of tracking and managing certain risks which are specific in nature or need to be managed in a specific way. Notable examples are the Environment and Quality Assurance Unit, which handles environmental and climate change risk, and the Reputation and Sustainability Unit, which manages reputational risk. Both operate in coordination with the Risk Units
4.2 Risk categories Each business unit has specific information on the main types of risk that may affect it. The goal is to facilitate decision-making, which is positive for the company since it enhances profitability, predictability and efficiency.
Risk
Committee
Risk units
Businesses
Other corporate areas
Audit Committee

20
The system addresses basically three categories of risk:
− Market risk, understood as the uncertainty related to commodity prices, exchange rates and interest rates, which may impact the company's balance sheet, procurement costs or ability to raise funding in the capital markets. It is measured using two yardsticks: in the short term, focused on the income statement, and in the long term, focused on enterprise value, including the capacity to generate cash flow and its stability, variations in the funding structure, and volatility in the applicable discount rates.
− Credit risk, i.e. the risk to the financial solvency of the company's receivables. It also
incorporates the short-term measurement of returns on placing cash surpluses with financial institutions, the aim being to select the most efficient portfolios.
− Operating risk, i.e. the possibility of financial losses as a result of failures in processes,
internal systems or other factors. It enables risk to be measured objectively, which is decisive for raising awareness in the company and in improving management of exposure, all of which have an essential impact on the reinsurance market's perception of Gas Natural Fenosa's operational excellence.
Risk type Description Management Metric Trend
Market risks
Commodity prices
Gas
Volatility in the international markets that determine gas prices.
Physical and financial hedges. Portfolio management
Stochastic
Decoupling of long-term contracts from hub prices.
Electricity
Volatility in the Spanish and Portuguese electricity markets
Physical and financial hedges. Optimisation of the power generating fleet.
Stochastic
Penetration by renewables with zero marginal cost and intermittent production.
Exchange rate Volatility in international currency markets.
Geographic diversification. Hedging via local-currency funding and derivatives. Monitoring the net position.
Stochastic
Uncertainty about growth prospects in Latin America.
Interest rates Volatility in funding rates.
Financial hedges. Diversification of funding sources.
Stochastic
Increase financial strength in a context of agile deleveraging.
Credit risk
Credit
Uncertainty about performance of bad debt ratios as a result of the economic cycle.
Analysis of customer solvency to define specific contractual conditions. Debt collection process.
Stochastic
Spain is expected to recover slowly, in line with the process of macroeconomic normalisation.
Operational risks
Regulatory
Exposure to regulatory review of the criteria and returns recognised for regulated activities.
Step up communications with regulators. Adjust efficiency and capital expenditure to recognised rates.
Scenarios
Different business units at different stages of maturity.

21
Risk type Description Management Metric Trend
Volume
of gas
Mismatch between gas supply and demand.
Optimisation of contracts and assets worldwide.
Stochastic
Temporarily slack demand in Spain.
of electricity
Reduction of the available thermal gap. Uncertainty about volume of hydroelectric output.
Optimisation of the balance between supply and generation.
Stochastic
Slack demand in Spain, impacting the thermal gap due to renewables' growing share.
Operational: insurable risks
Accidents, damage and non-availability of Gas Natural Fenosa assets.
Continuous improvement plans. Optimisation of total cost of risk and of hedges.
Stochastic
Development of specific oversight units.
Operational: image and reputation
Impaired perception of Gas Natural Fenosa by stakeholders.
Identification and tracking of potential reputational events. Transparency.
Scenarios.
Stabilisation of RepTrak index score.
Operational: environment
Harm to the natural and/or social environment. Development of environmental regulations.
Emergency plans at facilities with risk of environmental accident. Specific insurance policies. End-to-end environmental management.
Scenarios.
Implementation of an Integrated Management System that is audited and certified each year by Aenor.
Operational: climate change
Changes in environmental factors as a result of climate change. Regulation aimed at combating it.
Corporate positioning vis-à-vis climate change.
Scenarios/ Stochastic.
Uncertainty about policy developments to encourage energy efficiency.
Operational: geopolitical exposure
Company-owned assets or supply contracts in geographical areas whose political equilibrium is delicate.
Diversification by country and region. Specific insurance policies.
Scenarios/ Stochastic.
Stagnation of the situation in the Middle East/North Africa.
Metrics used: - Stochastic: production of trend lines for the main magnitudes, taking the maximum deviation from the
benchmark scenario to be the risk, within a pre-set confidence interval. Those magnitudes are generally EBITDA, earnings after taxes, cash flow and value.
- Scenarios: analysis of the impact with respect to the benchmark scenario of a limited number of
possible incidents.
Financial risks (interest rate, exchange rate, commodity price, credit and liquidity risk) are detailed in Note 13 to the Annual Accounts of Gas Natural SDG, S.A. 4.3. Opportunities Gas Natural Fenosa's main opportunities are as follows: − Generation mix: Gas Natural Fenosa's generating fleet, which is dominated by CCGTs,
has the necessary flexibility to adapt to different market situations and is a valuable asset for seizing opportunities related to volatility in prices and demand volume in the gas and electricity markets.

22
− Portfolio of natural gas and LNG procurements: Management of gas pipelines, stakes in plants and the fleet of LNG carriers make it possible to meet the needs of the Group's various businesses in a flexible, diversified way by optimising for different energy scenarios. Specifically, because of its LNG carrier fleet, Gas Natural Fenosa is one of the world's leading LNG operators and a key player in the Atlantic and Mediterranean.
− Balanced structural position in businesses and regions, many of them with stable flows
that are independent of commodity prices, making it possible to optimise the capture of energy demand growth and maximise new business opportunities in new markets.
− International generation: Increase the renewable energy generating capacity at an
international level given the cost-competitiveness of renewable energies and Gas Natural Fenosa's presence in growth markets.
− Technological development and innovation: Gas Natural Fenosa focuses on research,
development and innovation as a means of generating a reliable, sustainable energy supply.
5. Forecast Group performance 5.1. Foundations of strategy
In order to achieve its goals, Gas Natural Fenosa defines medium-term strategies that are updated regularly to adapt to the current and future situation, taking account of the specific features of the company's various lines of business.
The strategic planning cycle is defined as a recurring process that starts from a reflection on strategy, is materialised in each business and corporate unit's business plans and is integrated into the group's integrated business plan.
Energy planning cycle
Reflection on strategy − Formal adoption of the group's
medium-term vision. − Top-down approach.
Business plans − Formal statement of goals for
the business and corporate units.
− Bottom-up approach. Integrated business plan.
− Formal statement of goals for the group, integrating the business plans.
Tracking and reporting − Single source of management
information for the group and the business and corporate units.
− Strategic information management to support decision-making.
Budget − Operations budget. − Capex budget.
Coordination of the strategic planning, annual budgeting and continuous tracking processes facilitates agile and effective decision-making.
5.2. Gas Natural Fenosa strategy framework
The company's strategic vision for 2016-2020 adopted a number of commitments for 2018 and aspirations for 2020 and defined the outlook for the business areas and financial goals for the group in that period. Gas Natural Fenosa plans to present is 2018-2020 Strategic Plan, with updated targets for the group.
Business plans
Reflection on strategy
Budget Tracking and reporting

23
The key components of Gas Natural Fenosa's Strategic Plan are:
Portfolio
management
Efficiency
plan
Market context
evolution
Business
plan
Management
“as usual”
Framed by tracking of the business environment, the strategic plan establishes:
− Business management model and
objectives. − Execution of a new efficiency plan. − Continuous management of the business
portfolio and its strategic fit. The strategic plan is materialised in the form of business plans.
5.3. Group outlook
The Strategic Vision 2016-2018 was grounded in three growth areas (networks, power
generation and gas supply), the goal being to enable Gas Natural Fenosa to continue
expanding in the future:
- Networks: in the area of gas, investment in gas networks in Chile and Mexico, entry into
the gas distribution business in the Arequipa (Peru) region, new licences and additional
growth as a result of conversion of the new liquefied petroleum gas (LPG) connection
points in Spain; in the area of electricity, investment in smart grids in Spain, investments
to meet additional demand in Chile and Panama, electricity subtransmission in Chile
driven by new renewable energy projects.
- Electricity generation: improve generating fleet efficiency and performance by adding
3,500 MW overall; 2,500 MW in renewables (Spain and other countries) and 500-1,000
MW in CCGTs that will contribute to developing the downstream LNG business. Growth
and development of the international power generation business via GPG.
- Gas supply: new gas procurement contracts totalling about 11 bcm in the two Cheniere
projects (Sabine Pass and Corpus Christi) and the Yamal LNG project in Russia;
additionally, existing gas supply contracts will be adapted and renegotiated to reflect
benchmark market conditions. The LNG carrier fleet will be expanded by four vessels
(two of which were added in 2016) and a mobile regasification unit. Because of their
larger size, they represent almost 1 million cubic metres of additional capacity. EBITDA
is expected to increase by around 10%.
The Strategic Plan 2018-2020 will update the strategies to be implemented to ensure that Gas
Natural Fenosa maintains the trend of organic growth in 2018 and subsequent years.
6. Sustainable innovation
Gas Natural Fenosa, in order to address the new challenges and opportunities posed by the business environment, has promoted the implementation of a model of innovation that seeks to respond to the technological changes that the sector is facing and a strong innovative culture at the company.

24
Innovation overview
Below we detail the 5 major blocks into which the company has structured its innovation activities:
- Social Innovation. The company has been working to mitigate situations of energy
vulnerability since 2014 with prevention actions, through agreements with local and
regional governments, and activities to raise awareness with participation on forums
and chat groups about poverty. These actions intensified during 2017 through the
Vulnerability Plan.
- Marketing Innovation. This particular line encompasses all of the company’s efforts to
find out the actual and specific needs of each one of its customers, and to make sure
that they have at their disposal cutting-edge products that help them in their day-to-day
life. One of the major initiatives within this kind of innovation is the CEX (Customer
Experience) project through which the company introduces a new methodology in which
the customer is the starting point and the centre of activity.
- Organisational Innovation. In this framework we consider those actions targeted at
covering the needs that arise with regard to new business models, those that have
entailed a new organisation in the work and those that have been for the purpose of
minimising risks and increasing quality and safety in the organisation’s practices.
- Innovation in Product. Here, we can highlight the PIDIM (Smart Platform for the Sizing
and Design of Multigeneration Facilities) project for the purpose of designing,
developing and introducing facilities for the distributed generation of heating and cooling
electricity that operates in the cloud by receiving data such as the customer’s
consumption. With this initiative we aim to promote the energy rehabilitation of buildings
and to characterise the energy demand of these buildings to calculate the baseline of
consumption of the building and to forecast savings. In this sphere we should also
highlight development of the Sustainable Logistics Train (SLT) in the quest for a
feasible and economic solution for the sustainable management of the so-called “last
mile” logistic, where the dissemination of services for customers is often in places
where there is restricted traffic access.
- Process Innovation. We can point to the Integrated Control Centre (ICC) of hydraulic
facilities, headquartered in A Batundeira (Velle - Ourense), which allows centralised and
remote control management of the exploitation, operation and maintenance of all the
company’s power plants and dams in Spain.
The overall figure in 2017 for investment in innovation totalled 99 million euros, as follows:

25
Investment in innovation (millions of euros)
Innovation Plan
The Innovation Plan is structured by five multidisciplinary working networks and eight technological innovation areas.
Liquefied Natural Gas (LNG)
Gas Natural Fenosa develops innovation projects in three areas of action: optimisation of the LNG logistics chain (Small Scale), development of LNG as a cleaner and more efficient transport fuel (Bunkering) and development of the LNG Measure. One key project is the DirectLink LNG – Floating Universal Transfer System (UTS), developed during 2016 and 2017. This is an integral patented solution for the transfer and bunkering of LNG from ship to shore, an alternative to the costly traditional infrastructures (port and jetties) and with minimum environmental impact.
Generation
Renewables and storage
Gas Natural Fenosa develops innovation projects in four areas of action:
- Renewable energy: a commitment to a balanced energy mix, so that the emission-free
generation technologies and the low-emission technologies represent a significant
volume of the total installed capacity.
- Wind energy: with initiatives to monitor the condition of the assets, through
measurement systems, smart models and data maintaining and optimizing the
performance of the facilities through the implementation of improvements or tests.
- Hydraulic energy: a commitment to the introduction of new technologies both in areas of
environmental control as well as in the establishment of mobility systems and remote
monitoring, without overlooking improved performance of its hydraulic facilities.
- Storage: focusing on an even greater increase in quality and reliability of supply, on
developing joint solutions with customers and also on allowing a greater and easier
integration of renewable-source electricity into the grid.

26
Highlights the project Windex, developed in 2017, which involves application of sensor systems and development of information-processing tools to increase the useful and structural life of wind farms in a safe way.
Reduction of emissions and energy efficiency
The company is carrying out a range of technological developments at its facilities. In addition, the company continues to work to improve the efficiency of its coal and combined-cycle plants. Highlights the project Optimisation of fuel through lasers developed during 2017, which helps to significantly reduce NOx at the Meirama Thermal Power Plant.
Grids
The company’s commitment is two-fold of acting. - Revitalisation of gas networks: where challenges focus on achieving greater automation of
the grid (remote action, reduction of cut-offs and interruptions, improved operational
efficiency and maintenance and increased energy performance) and greater interaction with
the customer (energy efficiency and active management of demand).
- Electricity grids 4.0: focusing on digitalisation of the electricity distribution grids, moving
forward in the management of operation and maintenance of the grid, and integrating the
customer into the information flows, whilst simultaneously improving the levels of safety at
work and the quality of supply.
Customer
Gas Natural Fenosa has two action lines open in the field of innovation associated to the customer.
- Smart Client: focusing on providing products and services with high value-added for different types of end customers. This Innovation area promotes initiatives based mainly on three core actions: GEDIS and Self-consumption, Integration of new solutions and Data Analytics.
- Energy efficiency and mobility.
One of the most important projects is the Remote Building Analytics Platform, based on the development of an energy management tool (virtual audit) for customers of the SMEs market. Data from smart meters are fed into the tool and these data allow us to define specific segmentation of customers for the purpose of proposing energy efficiency measures and actions in masse.
Automation and management of information
It is a cross-sectional area that aims to bring together projects already being developed in the company to gain synergies and enhance results. Highlights the project Energy Harvesting UP4, which consists in testing the concept at laboratory level of a device based on a sheet of piezoelectric material to generate small amounts of electricity. The device is put into a gas tube and energy is produced through the flow interaction structure. The aim is to capture energy to feed sensors that will be installed in the gas network.

27
7. Additional information 7.1. Treasury shares On 14 May 2015, the shareholders in general meeting authorised the Board of Directors to purchase, within five years, in one or more operations, a maximum of 10% of share capital or the maximum figure applicable under legislation prevailing at the time of acquisition. The relevant Company shares must be fully paid in and the nominal value of the shares directly or indirectly acquired, added to those already held by the Company and its subsidiaries, may not exceed 10% of share capital or any other limit established by law. The minimum and maximum acquisition price will be the share price on the continuous market of the Spanish stock exchanges, within an upper or lower fluctuation of 5%. Movements during 2017 and 2016 involving the treasury shares of Gas Natural SDG, S.A. are as follows:
Number of shares Amounts in million euro % Share
capital
At 1 January 2016 - - -
Acquisitions 3,049,189 53 0.3% Disposals (2,298,644) (40) (0.2%)
At 31 December 2016 750,545 13 0.1%
Acquisitions 7,623,586 147 0.8% Share Acquisition Plan (336,625) (7) - Disposals (8,037,506) (153) (0.8%)
At 31 December 2017 - - -
In 2017, the profit on transactions involving treasury shares of Gas Natural Fenosa amounted to Euros 0.5 million, recognised under “Other reserves” (Euros 0.4 million profit in 2016). Note 10 of the Notes to the Annual accounts of Gas Natural SDG, S.A. contains all the information on treasury shares.
7.2. Average supplier payment period Disclosure of deferrals of payment to suppliers Additional Provision 3 “Duty of disclosure” of Law 15/2010/5 July The total amount of payments made during the year, with details of payment periods, in accordance with the maximum legal limit under Law 15/2010 of July 5, which laid down measures against late payment, is as follows:
2017 2016
Amount Amount
Total payments (euro) 4,452,183,472 3,993,685,684
Total payments outstanding (euro) 79,531,676 88,041,054
Average supplier payment period (days) (1) 20 22
Transactions paid ratio (days) (2) 20 22
Transactions pending payment ratio (days) (3) 23 24
(1) Calculated on the basis of amounts paid and pending payment. (2) Average payment period in transactions paid during the year. (3) Average age, suppliers pending payment balance.
7.3. Events after the reporting date Events after the reporting date are described in Note 29 to the Annual Accounts of Gas Natural SDG, S.A.

28
8. Annual Corporate Governance Report Attached as an annex and forming an integral part of this Directors' Report is the Annual Report on Corporate Governance 2017, as required by article 526 of the Capital Companies Act.
*************************