Gary W. Phillips American Institutes for Research United States Department of Education Public...
12
Gary W. Phillips American Institutes for Research United States Department of Education Public Hearings December 1, 2009, Denver, Colorado
-
Upload
claire-curtis -
Category
Documents
-
view
213 -
download
0
Transcript of Gary W. Phillips American Institutes for Research United States Department of Education Public...

Gary W. PhillipsAmerican Institutes for Research
United States Department of Education Public HearingsDecember 1, 2009, Denver, Colorado

The goals of the next generation assessment system envisioned by the Race to the Top cannot be reached with our existing testing paradigm.
Our existing system of state assessments are ◦ uncoordinated◦ non-comparable◦ non-aggregatable ◦ non-scalable◦ too expensive ◦ too slow
Gary W. Phillips 2

1.Common standards
2.Computer-adaptive tests
3.Better Measures of Growth
Gary W. Phillips 3

Common content standards in each state consortium that are internationally competitive and lead to high school graduates who are ready for well paying careers and postsecondary schooling.
Common item bank (developed by teachers across the consortium), common test blueprints, and each state would administer comparable tests that are equated to the consortia common scale.
At least 85% of each state test would cover all the consortia common content standards (the other 15% would be state supplements to the common content standards).
Gary W. Phillips 4
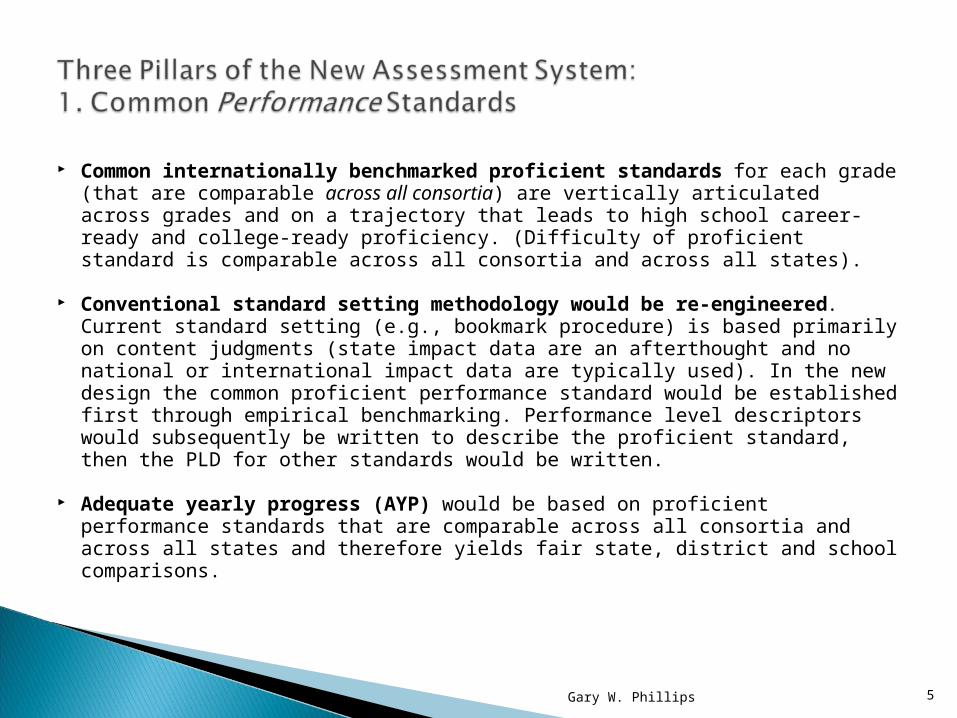
Common internationally benchmarked proficient standards for each grade (that are comparable across all consortia) are vertically articulated across grades and on a trajectory that leads to high school career-ready and college-ready proficiency. (Difficulty of proficient standard is comparable across all consortia and across all states).
Conventional standard setting methodology would be re-engineered. Current standard setting (e.g., bookmark procedure) is based primarily on content judgments (state impact data are an afterthought and no national or international impact data are typically used). In the new design the common proficient performance standard would be established first through empirical benchmarking. Performance level descriptors would subsequently be written to describe the proficient standard, then the PLD for other standards would be written.
Adequate yearly progress (AYP) would be based on proficient performance standards that are comparable across all consortia and across all states and therefore yields fair state, district and school comparisons.
Gary W. Phillips 5

Gary W. Phillips 6
Page in Estimated Standard Proportion Standard Proportion PhillipsBookmark State Proportion Error of in U.S. Error of in Korea (2009)Ordered Scaled Above NAEP- Above TIMSS- Above Benchmark
Item Booklet Scores Cut-Score Equivalent NAEP-Equiv Equivalent TIMSS-Equiv Grade45 740 0.00 A 345 2.5 0.04 A 645 7.1 0.30 A44 715 0.02 329 2.2 0.09 610 6.1 0.45 A-43 714 0.02 328 2.1 0.10 608 6.0 0.45 A-42 711 0.02 326 2.1 0.11 604 5.9 0.47 A-41 711 0.02 326 2.1 0.11 604 5.9 0.47 A-40 709 0.02 325 2.1 0.11 601 5.9 0.48 A-39 708 0.02 324 2.1 0.12 600 5.8 0.49 B+38 705 0.03 322 2.0 0.13 596 5.7 0.51 B+37 703 0.04 321 2.0 0.14 593 5.6 0.52 B+36 703 0.04 321 2.0 0.14 593 5.6 0.52 B+35 700 0.04 319 2.0 0.15 589 5.5 0.54 B+34 698 0.05 318 1.9 0.16 586 5.5 0.55 B+33 698 0.05 318 1.9 0.16 586 5.5 0.55 B+32 696 0.06 316 1.9 0.17 583 5.4 0.56 B+31 694 0.06 315 1.9 0.18 580 5.3 0.57 B+30 690 0.08 312 1.9 0.20 574 5.2 0.60 B29 690 0.08 312 1.9 0.20 574 5.2 0.60 B28 685 0.11 309 1.8 0.22 567 5.1 0.63 B27 684 0.11 308 1.8 0.23 566 5.0 0.63 B26 680 0.13 306 1.7 0.25 560 4.9 0.66 B25 680 0.13 306 1.7 0.25 560 4.9 0.66 B24 679 0.13 305 1.7 0.26 559 4.9 0.66 B23 678 0.13 304 1.7 0.26 557 4.9 0.67 B22 676 0.15 303 1.7 0.27 555 4.8 0.68 B21 674 0.15 302 1.7 0.29 552 4.8 0.69 B20 671 0.18 300 1.7 0.30 548 4.7 0.70 B-19 667 0.21 297 1.6 0.33 542 4.6 0.73 B-18 664 0.24 295 1.6 0.35 538 4.5 0.74 B-17 663 0.24 294 1.6 0.36 536 4.5 0.75 B-16 654 0.31 288 1.5 0.42 524 4.4 0.79 C+15 653 0.31 288 1.5 0.43 522 4.4 0.79 C+14 646 0.39 283 1.5 0.48 512 4.3 0.82 C+13 643 0.39 281 1.5 0.50 508 4.3 0.83 C+12 641 0.39 280 1.5 0.52 505 4.3 0.84 C+11 638 0.43 278 1.5 0.54 501 4.3 0.85 C+10 634 0.48 275 1.5 0.57 495 4.3 0.87 C9 630 0.48 273 1.5 0.60 490 4.3 0.88 C8 627 0.53 271 1.5 0.62 486 4.3 0.89 C7 627 0.53 271 1.5 0.62 486 4.3 0.89 C6 625 0.53 269 1.5 0.63 483 4.3 0.89 C5 624 0.53 269 1.5 0.64 481 4.3 0.90 C4 614 0.64 262 1.5 0.70 467 4.4 0.92 C-3 607 0.70 257 1.5 0.75 457 4.5 0.94 C-2 595 0.76 249 1.6 0.81 440 4.8 0.96 D+1 559 0.87 226 1.9 0.94 390 5.9 0.99 D-
NAEP-Equivalent
ScaledScore
Basic
= 2
62
Hig
h =
55
0
TIMSS-Equivalent
ScaledScore
In
term
ed
iate
= 4
75
Lo
w=
40
0
Pro
fic
ien
t =
29
9
State Math 2009, Grade 8 NAEP- equivalents to State Standard TIMSS- equivalents to State Standard
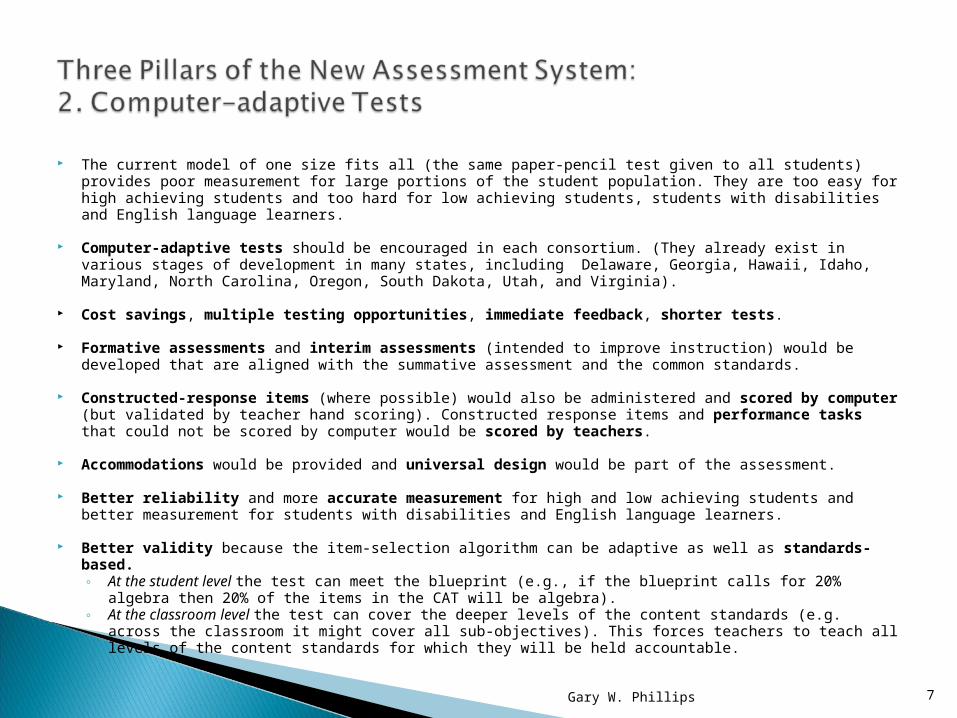
The current model of one size fits all (the same paper-pencil test given to all students) provides poor measurement for large portions of the student population. They are too easy for high achieving students and too hard for low achieving students, students with disabilities and English language learners.
Computer-adaptive tests should be encouraged in each consortium. (They already exist in various stages of development in many states, including Delaware, Georgia, Hawaii, Idaho, Maryland, North Carolina, Oregon, South Dakota, Utah, and Virginia).
Cost savings, multiple testing opportunities, immediate feedback, shorter tests.
Formative assessments and interim assessments (intended to improve instruction) would be developed that are aligned with the summative assessment and the common standards.
Constructed-response items (where possible) would also be administered and scored by computer (but validated by teacher hand scoring). Constructed response items and performance tasks that could not be scored by computer would be scored by teachers.
Accommodations would be provided and universal design would be part of the assessment.
Better reliability and more accurate measurement for high and low achieving students and better measurement for students with disabilities and English language learners.
Better validity because the item-selection algorithm can be adaptive as well as standards-based.◦ At the student level the test can meet the blueprint (e.g., if the blueprint calls for 20% algebra then 20% of
the items in the CAT will be algebra).◦ At the classroom level the test can cover the deeper levels of the content standards (e.g. across the
classroom it might cover all sub-objectives). This forces teachers to teach all levels of the content standards for which they will be held accountable.
Gary W. Phillips 7

With current growth models we frequently see negative growth for the top students and find our lowest achieving students are the fastest learners. Both of these patterns are usually artifacts of the ceiling and floor effects of our current testing paradigm. These artifacts would be ameliorated by computer-adaptive testing.
Common vertical scale would be needed to measure growth across grades (within each consortium) which would facilitate the measurement of student grade-to-grade growth and the application of student growth models.
Value-added indices and teacher effectiveness measures would be comparable and more accurate.
Statewide longitudinal data system would be required that uses a unique statewide student identifier with student data that are transferable and linked to teachers and schools and maintained throughout K-12.
More reliable measures of growth. Growth measures are inherently less reliable than status measures. However, because computer adaptive testing provides more reliable measures of status they therefore provide more reliable measures of growth.
Gary W. Phillips 8

Implements the vision of Race to the Top with high quality assessments based on fewer, clearer, higher standards.
Improves NCLB by correcting two of its fundamental problems (too many content standards and too many performance standards).
Scalable to a large number of states by taking advantage of innovation and technology.
Better measurement for a wider range of students in the general population, can be implemented in alternate assessments in the 1% population, and eliminates the need for a modified assessment for the 2% population.
Feasible and meets all professional and technical standards by the AERA, NCME and APA.
Affordable and in the long run would cost about half as much as paper-pencil tests.
Benefits the feds (comparable data for states, districts, schools).
Benefits the states (cheaper, faster, better assessments with some local flexibility).
Gary W. Phillips 9

The entire assessment system within each consortia would be placed on a vertical scale (e.g., from grade 3 through high school). The vertical scale would reflect the incrementally increasing difficulty of the content standards as the student moves up the grades and would be used to improve the accuracy of student growth models and provide better measures of teacher and principal effectiveness.
In addition to a vertical scale, the performance standards would be vertically articulated. For example, the proficient standard would be established in such a way that they would reflect an orderly progression of increasing higher and higher expectations as the student moves up the grades. They would be on an upward trajectory leading to an internationally benchmarked, career-ready and college-ready proficiency standard in high school.
Gary W. Phillips 10
Each consortia of states would need to fund empirical research on how well the high school test predicts college and career success. Recent work by the National Assessment Governing Board (related to validating the 12th grade NAEP) would inform this process.
The predictive validity studies and an evaluation of the validity of the international benchmarking should be done by an independent group (e.g., the National Academy of Sciences).
Gary W. Phillips 11
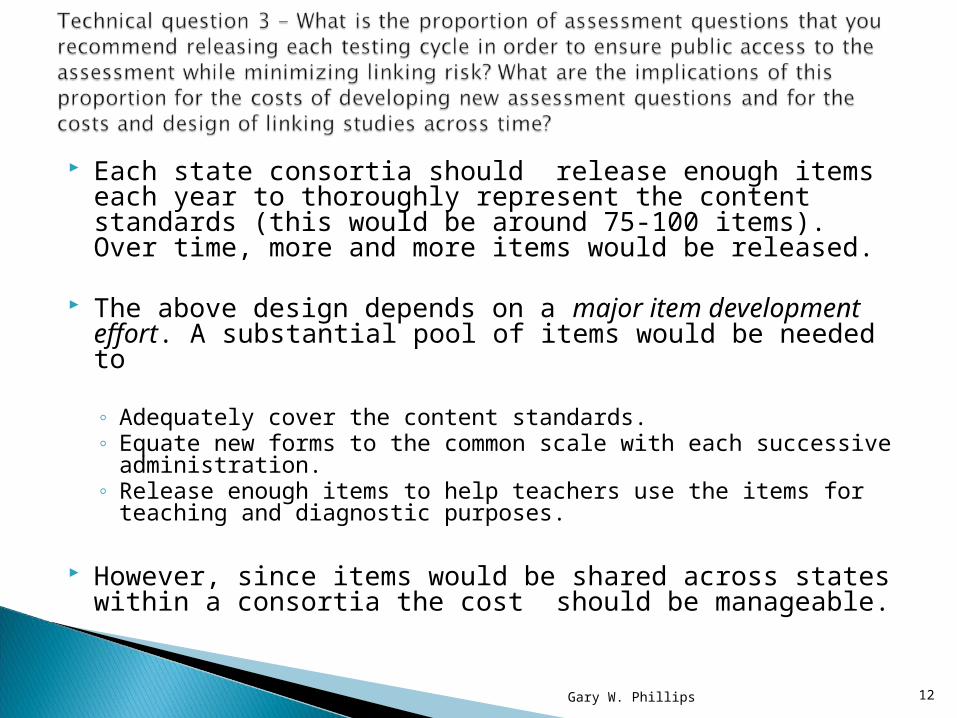
Each state consortia should release enough items each year to thoroughly represent the content standards (this would be around 75-100 items). Over time, more and more items would be released.
The above design depends on a major item development
effort. A substantial pool of items would be needed to
◦ Adequately cover the content standards. ◦ Equate new forms to the common scale with each successive
administration.◦ Release enough items to help teachers use the items for
teaching and diagnostic purposes.
However, since items would be shared across states within a consortia the cost should be manageable.
Gary W. Phillips 12


![Children’s Hearings (Scotland) Bill - Scottish Parliament Hearings (Scotland) Bill... · Children’s Hearings (Scotland) Bill [AS INTRODUCED] CONTENTS Section PART 1 THE NATIONAL](https://static.fdocuments.net/doc/165x107/5b015e577f8b9a0c028e2a03/childrens-hearings-scotland-bill-scottish-hearings-scotland-billchildrens.jpg)