Gartner Analyst Relations Forum Market Share Market Share Analysis Forecast Forecast Analysis Market...
25
This presentation, including any supporting materials, is owned by Gartner, Inc. and/or its affiliates and is for the sole use of the intended Gartner audience or other authorized recipients. This presentation may contain information that is confidential, proprietary or otherwise legally protected, and it may not be further copied, distributed or publicly displayed without the express written permission of Gartner, Inc. or its affiliates. © 2013 Gartner, Inc. and/or its affiliates. All rights reserved. Gartner Analyst Relations Forum Gartner Symposium/ITxpo Orlando Florida October 8, 2013
Transcript of Gartner Analyst Relations Forum Market Share Market Share Analysis Forecast Forecast Analysis Market...
This presentation, including any supporting materials, is owned by Gartner, Inc. and/or its affiliates and is for the sole use of the intended Gartner audience or other authorized recipients. This presentation may contain information that is confidential, proprietary or otherwise legally protected, and it may not be further copied, distributed or publicly displayed without the express written permission of Gartner, Inc. or its affiliates. © 2013 Gartner, Inc. and/or its affiliates. All rights reserved.
Gartner Analyst Relations Forum
Gartner Symposium/ITxpo
Orlando Florida
October 8, 2013
1
Gartner Research Update Peter Sondergaard
SVP, Global Research
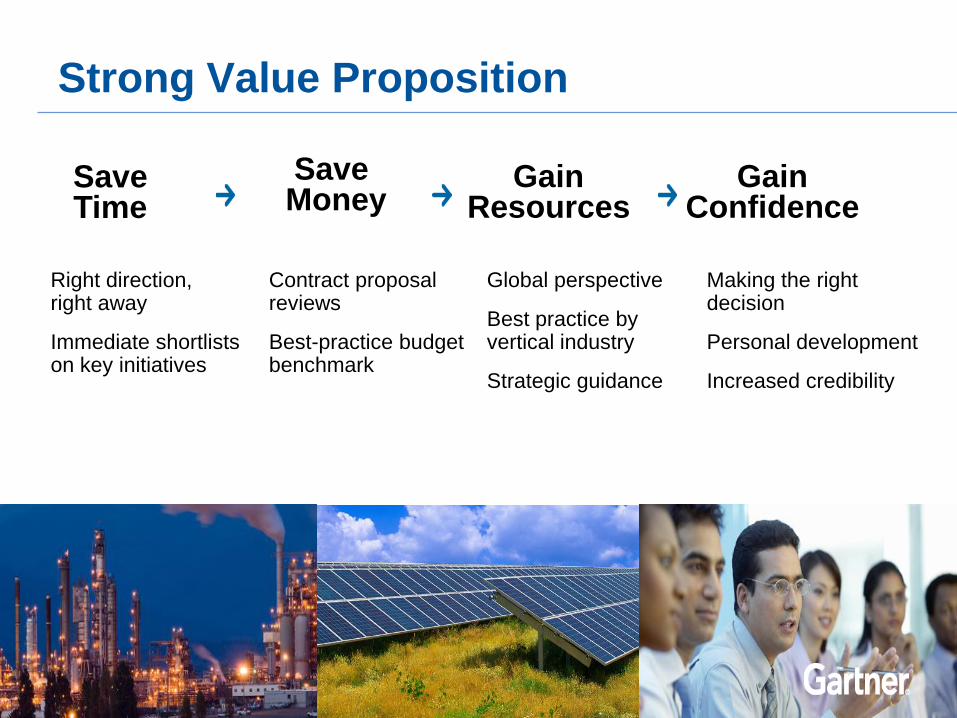
Strong Value Proposition
Right direction, right away
Immediate shortlists on key initiatives
Contract proposal reviews
Best-practice budget benchmark
Global perspective
Best practice by vertical industry
Strategic guidance
Making the right decision
Personal development
Increased credibility
Save Time
Save Money
Gain Resources
Gain Confidence
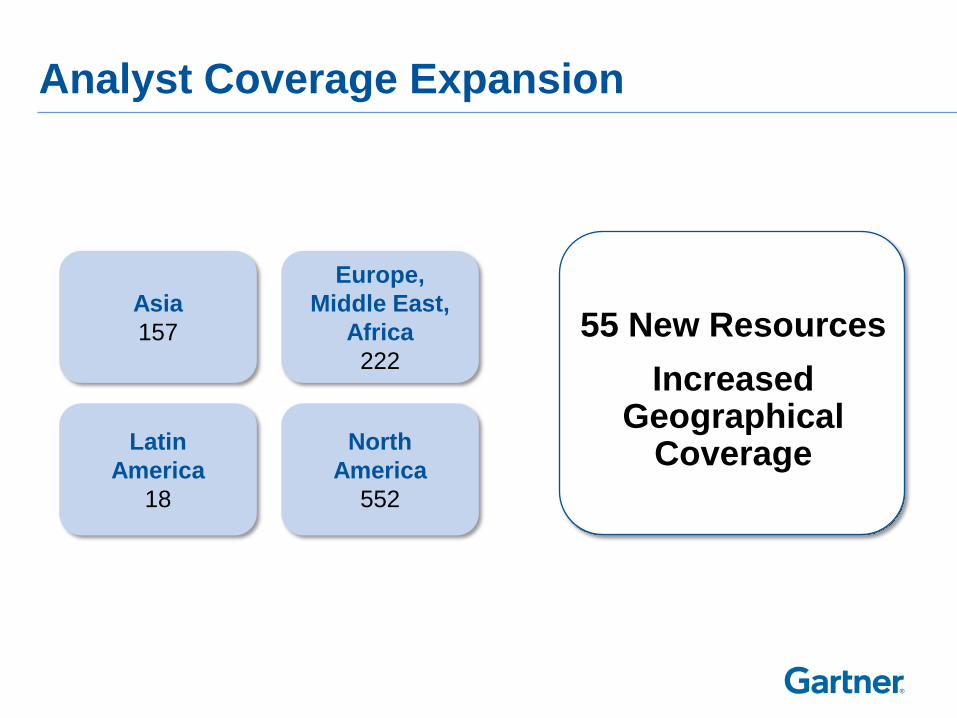
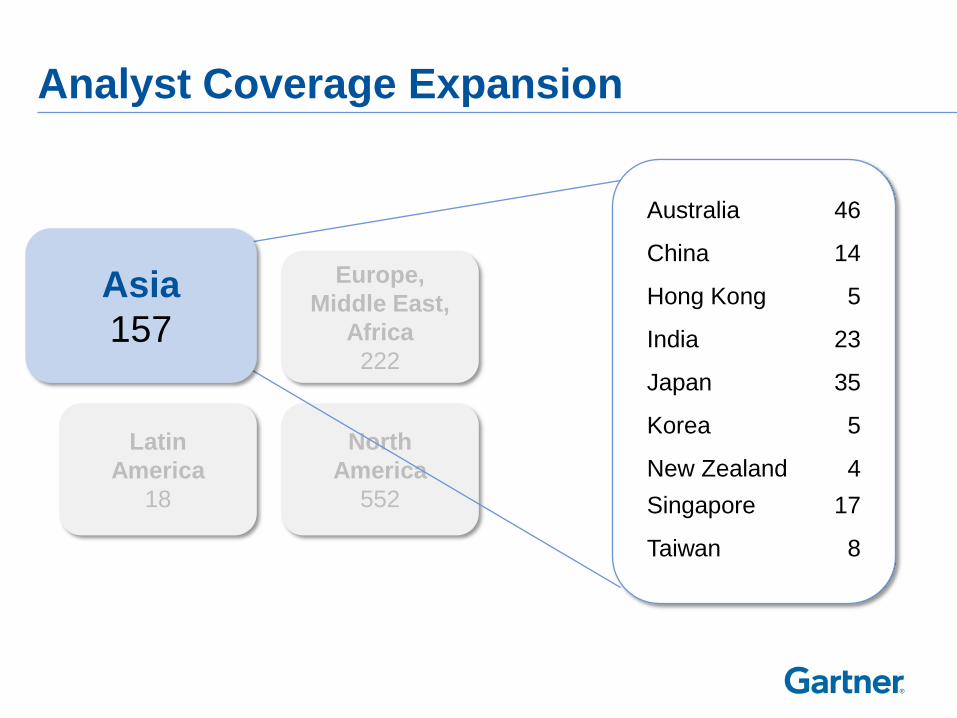
Analyst Coverage Expansion
55 New Resources
Increased Geographical
Coverage
Asia
157
Europe,
Middle East,
Africa
222
Latin
America
18
North
America
552
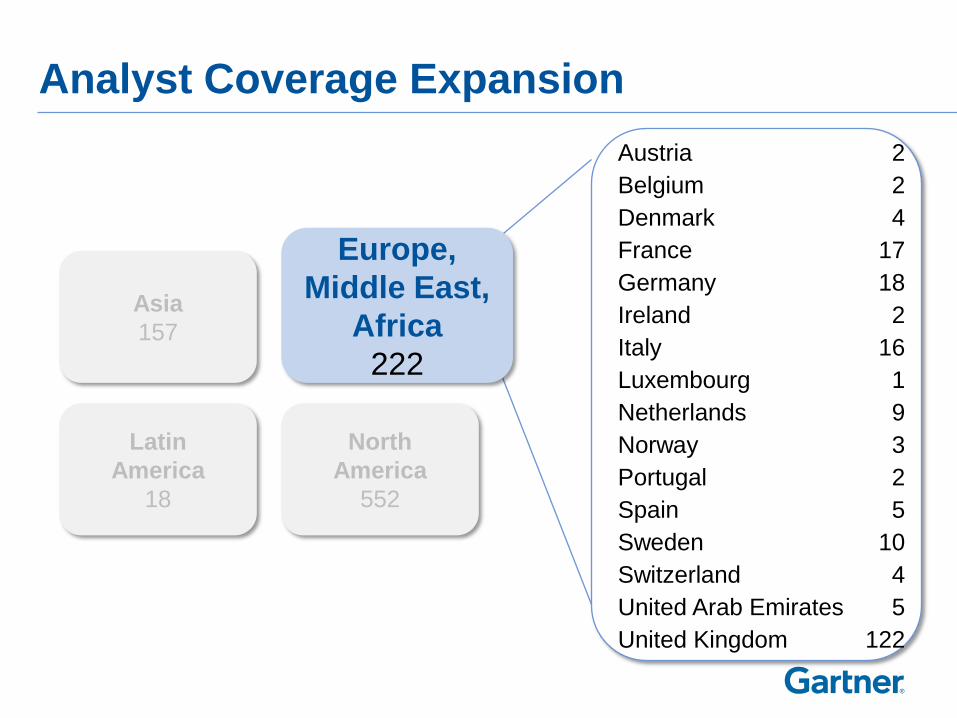
Analyst Coverage Expansion
Australia 46
China 14
Hong Kong 5
India 23
Japan 35
Korea 5
New Zealand 4
Singapore 17
Taiwan 8
Europe,
Middle East,
Africa
222
Latin
America
18
North
America
552
Asia
157
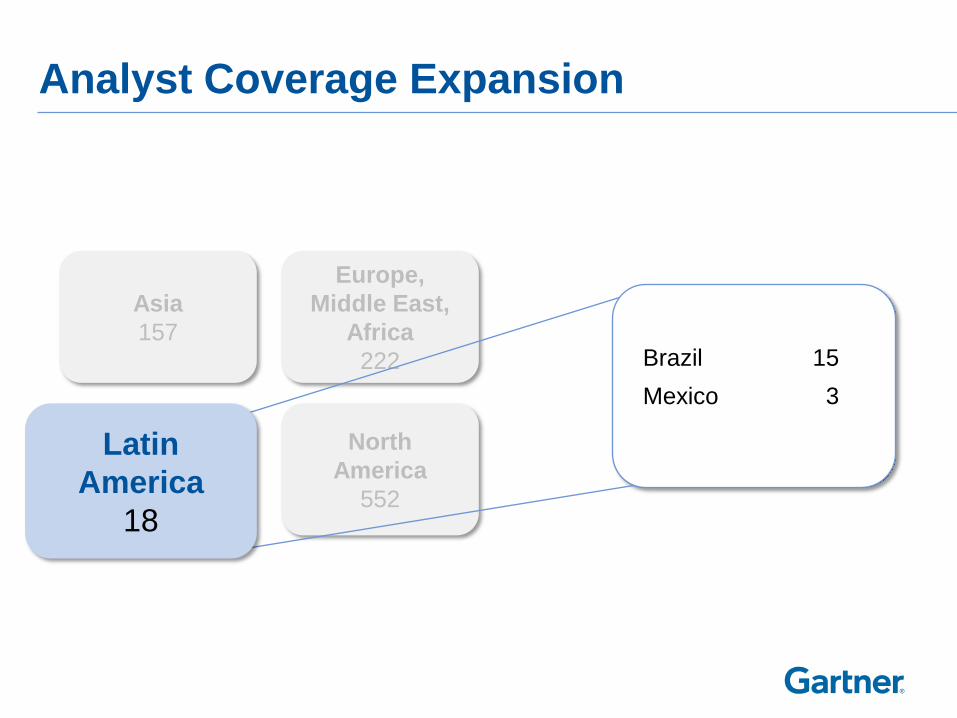
Analyst Coverage Expansion
Latin
America
18
North
America
552
Asia
157
Austria 2
Belgium 2
Denmark 4
France 17
Germany 18
Ireland 2
Italy 16
Luxembourg 1
Netherlands 9
Norway 3
Portugal 2
Spain 5
Sweden 10
Switzerland 4
United Arab Emirates 5
United Kingdom 122
Europe,
Middle East,
Africa
222
Analyst Coverage Expansion
North
America
552
Asia
157 Brazil 15
Mexico 3
Europe,
Middle East,
Africa
222
Latin
America
18
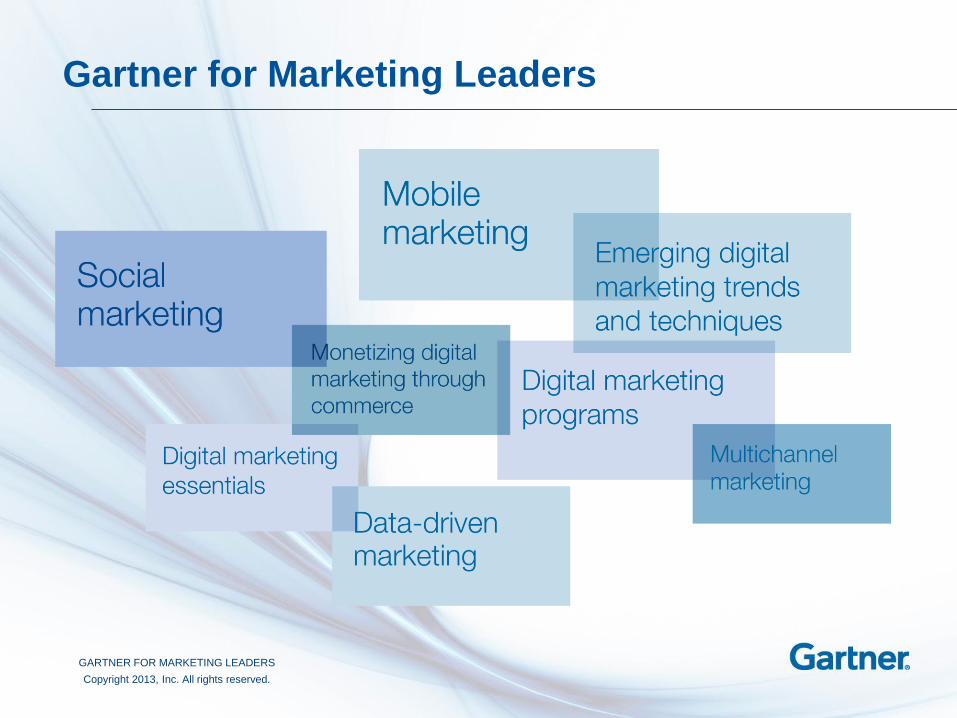
Gartner for Marketing Leaders
GARTNER FOR MARKETING LEADERS
Copyright 2013, Inc. All rights reserved.
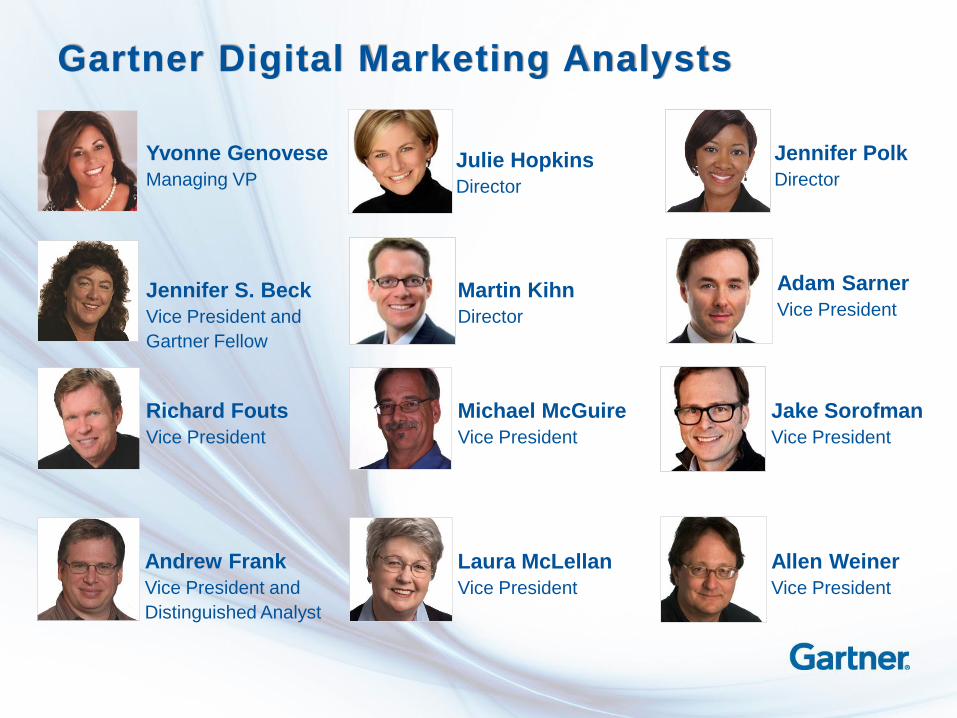
Andrew Frank
Vice President and
Distinguished Analyst
Laura McLellan
Vice President
Allen Weiner
Vice President
Richard Fouts
Vice President
Michael McGuire
Vice President
Jake Sorofman
Vice President
Yvonne Genovese
Managing VP
Julie Hopkins
Director
Jennifer Polk
Director
Jennifer S. Beck
Vice President and
Gartner Fellow
Martin Kihn
Director
Adam Sarner
Vice President
Gartner Digital Marketing Analysts
Analyst Experience Continues to be an area of strength
• Minimum 12 years of experience at time of hire
• 60% have 20+ years of industry experience
• 50% have a postgraduate degree
• 35% speak two or more languages
Vendor Briefing 2014 Scheduling Enhancements
• Gartner analysts attended over 16,000 briefings in the last 12 months
• Briefings were presented by over 3,400 distinct vendors
• New in Q1 2014
- Scheduling options will be sent to you with a live URL link
- You can confirm the date and time knowing the analyst calendar is available
- Selected times will be confirmed with an calendar invitation
11
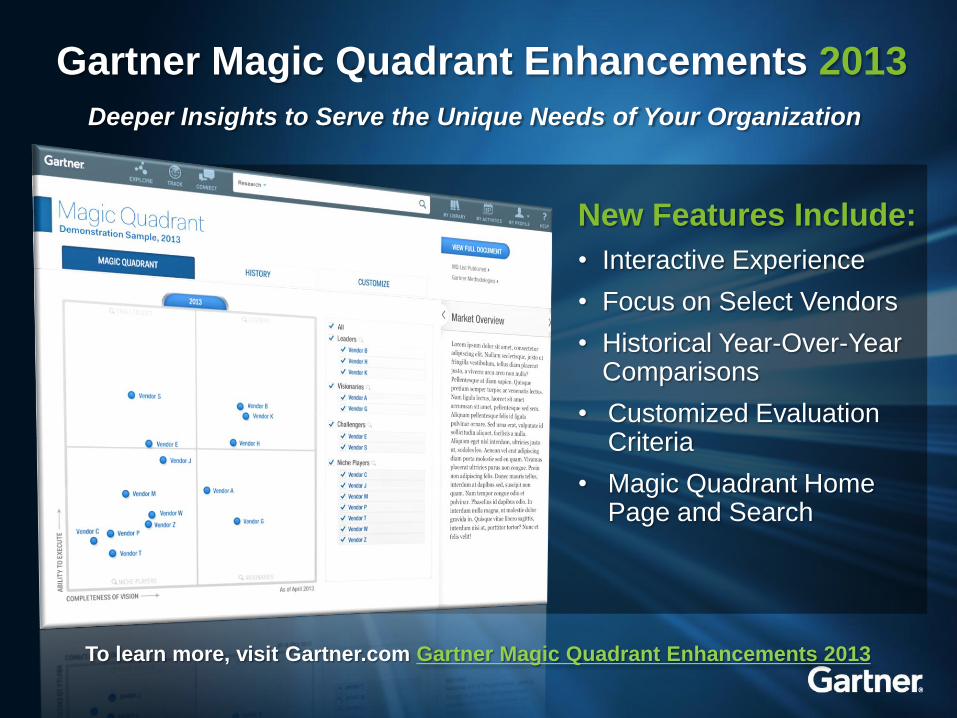
Gartner Magic Quadrant Enhancements 2013
Deeper Insights to Serve the Unique Needs of Your Organization
New Features Include:
• Interactive Experience
• Focus on Select Vendors
• Historical Year-Over-Year Comparisons
• Customized Evaluation Criteria
• Magic Quadrant Home Page and Search
To learn more, visit Gartner.com Gartner Magic Quadrant Enhancements 2013
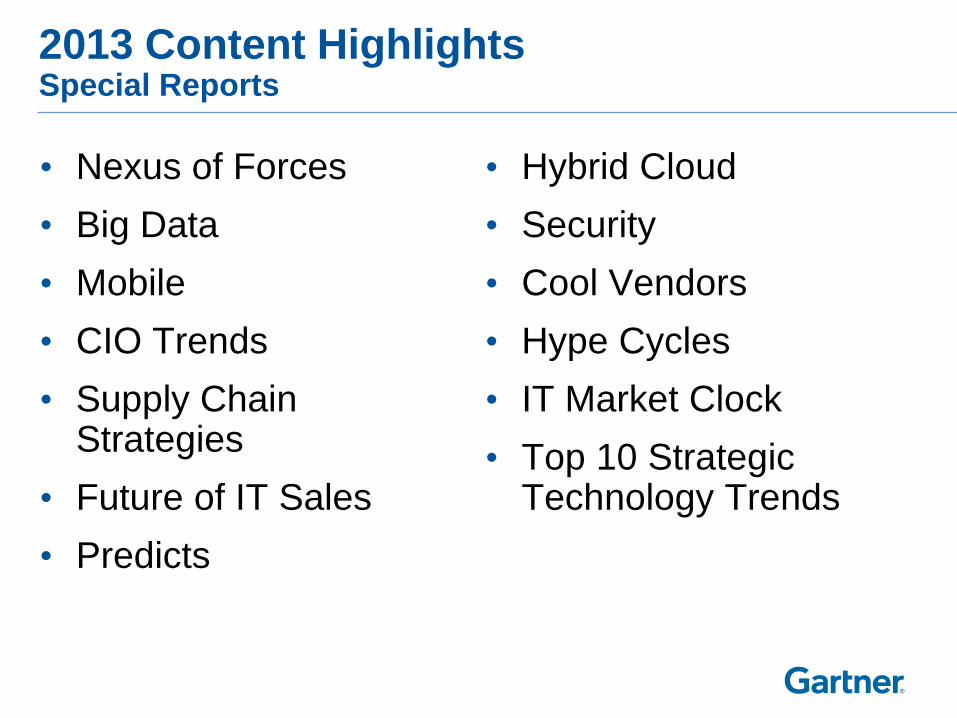
2013 Content Highlights Special Reports
• Nexus of Forces
• Big Data
• Mobile
• CIO Trends
• Supply Chain Strategies
• Future of IT Sales
• Predicts
• Hybrid Cloud
• Security
• Cool Vendors
• Hype Cycles
• IT Market Clock
• Top 10 Strategic Technology Trends
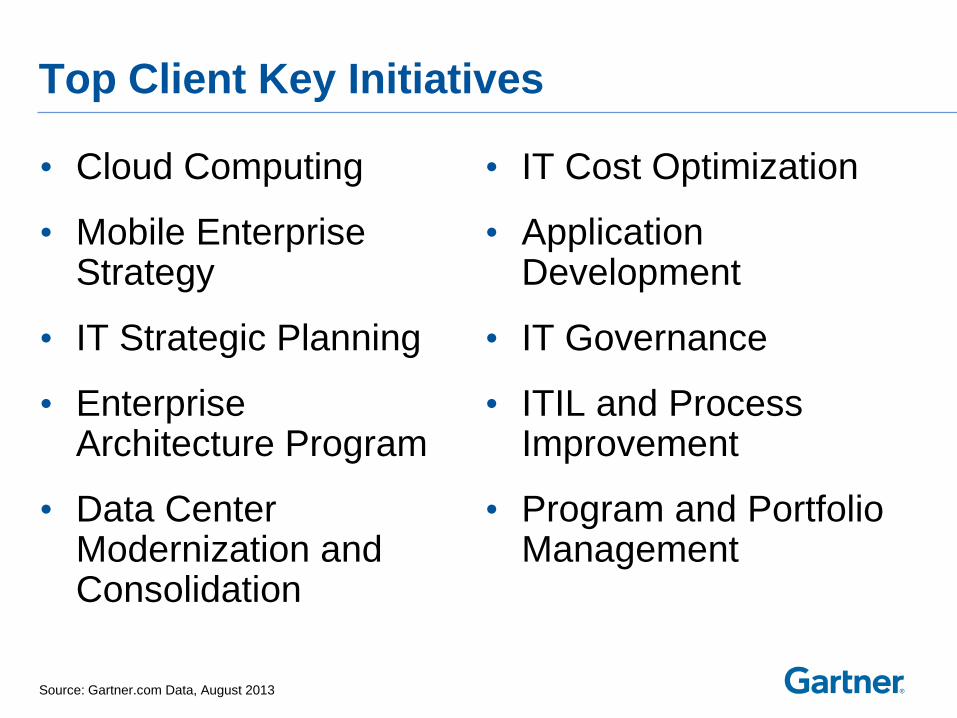
Top Client Key Initiatives
• Cloud Computing
• Mobile Enterprise Strategy
• IT Strategic Planning
• Enterprise Architecture Program
• Data Center Modernization and Consolidation
• IT Cost Optimization
• Application Development
• IT Governance
• ITIL and Process Improvement
• Program and Portfolio Management
Source: Gartner.com Data, August 2013
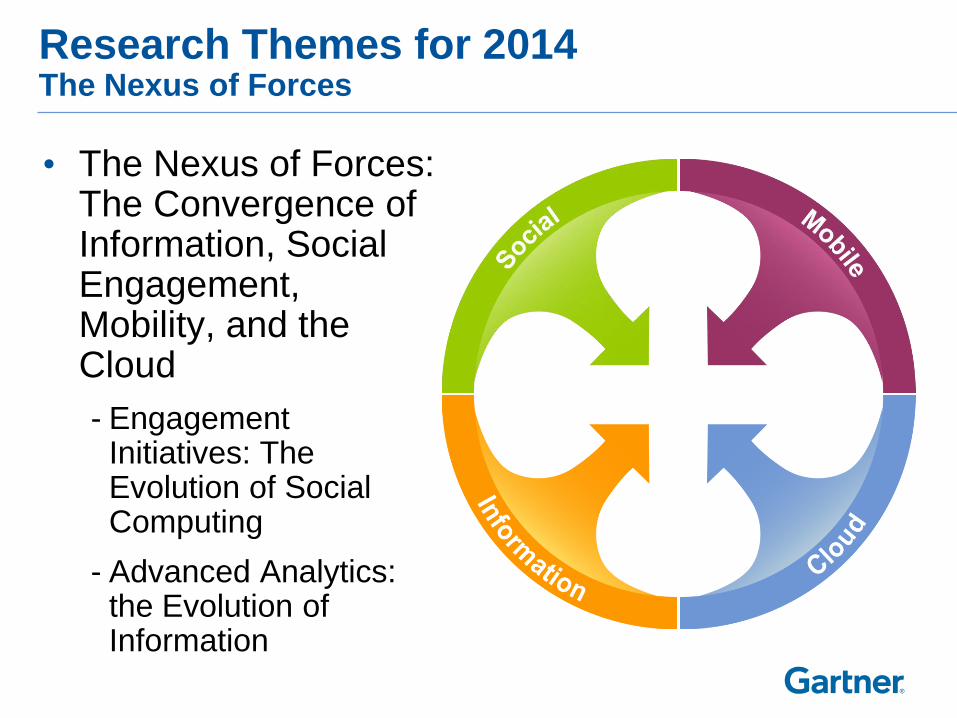
Research Themes for 2014 The Nexus of Forces
• The Nexus of Forces: The Convergence of Information, Social Engagement, Mobility, and the Cloud
- Engagement Initiatives: The Evolution of Social Computing
- Advanced Analytics: the Evolution of Information
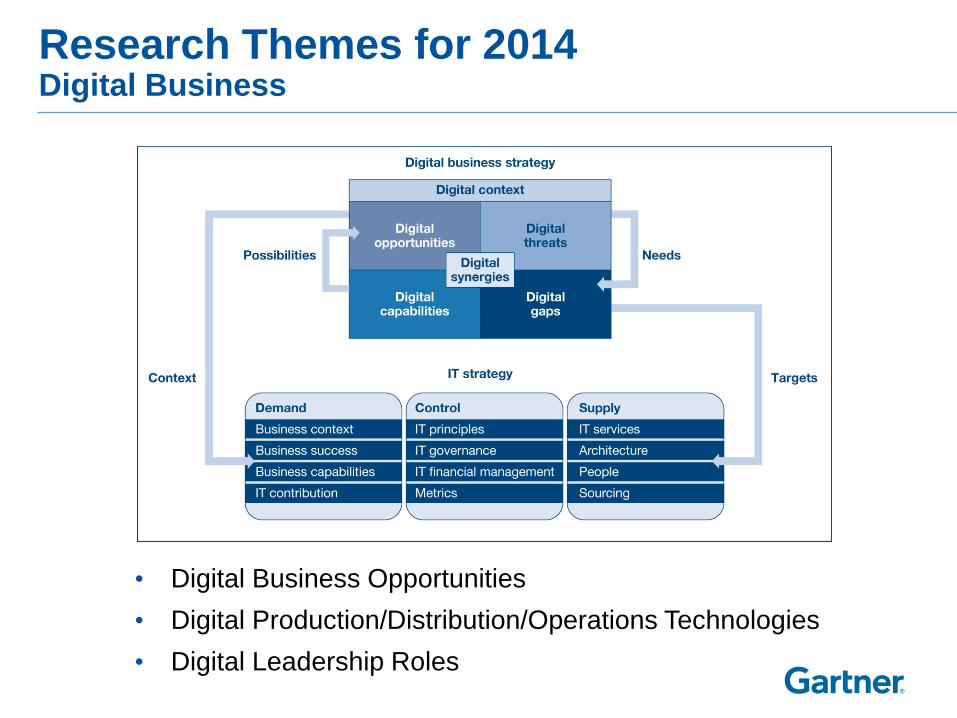
Research Themes for 2014 Digital Business
• Digital Business Opportunities
• Digital Production/Distribution/Operations Technologies
• Digital Leadership Roles
Special Reports - 2014
• Smart Machines and Digital Technologies
• Mobile Applications in Business
• Security Futures
• Every Budget Is an IT Budget: Implications on IT Strategy, Governance, Organization, and Operations
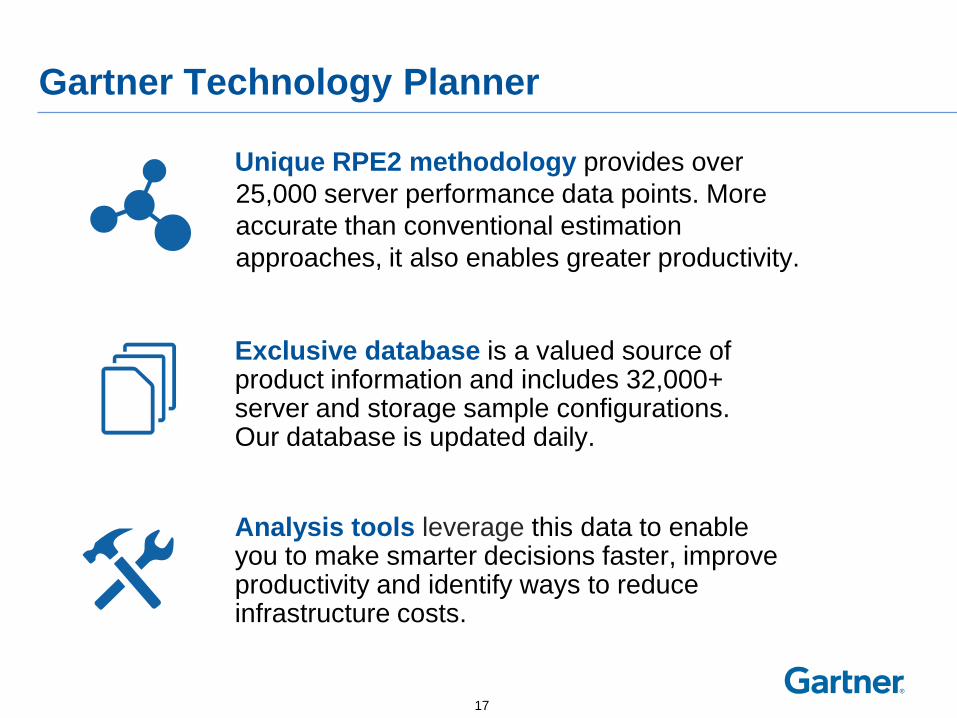
Gartner Technology Planner
Unique RPE2 methodology provides over
25,000 server performance data points. More
accurate than conventional estimation
approaches, it also enables greater productivity.
Analysis tools leverage this data to enable you to make smarter decisions faster, improve productivity and identify ways to reduce infrastructure costs.
Exclusive database is a valued source of product information and includes 32,000+ server and storage sample configurations. Our database is updated daily.
17
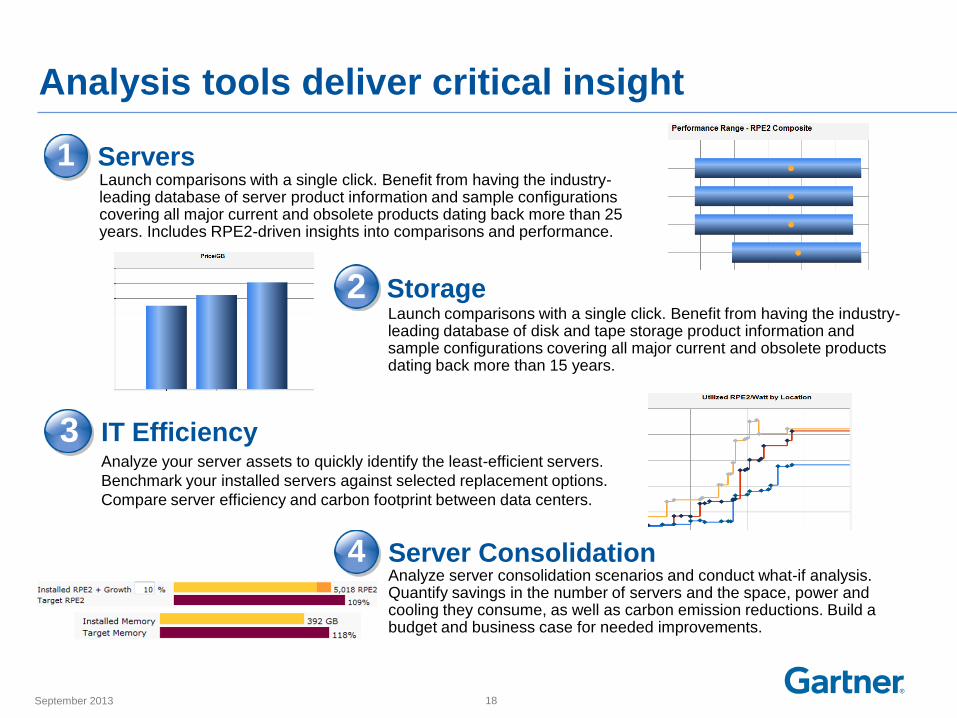
Analysis tools deliver critical insight
September 2013 18
Server Consolidation Analyze server consolidation scenarios and conduct what-if analysis. Quantify savings in the number of servers and the space, power and cooling they consume, as well as carbon emission reductions. Build a budget and business case for needed improvements.
4
2 Storage Launch comparisons with a single click. Benefit from having the industry-leading database of disk and tape storage product information and sample configurations covering all major current and obsolete products dating back more than 15 years.
3 IT Efficiency Analyze your server assets to quickly identify the least-efficient servers.
Benchmark your installed servers against selected replacement options.
Compare server efficiency and carbon footprint between data centers.
1 Launch comparisons with a single click. Benefit from having the industry-leading database of server product information and sample configurations covering all major current and obsolete products dating back more than 25 years. Includes RPE2-driven insights into comparisons and performance.
Servers
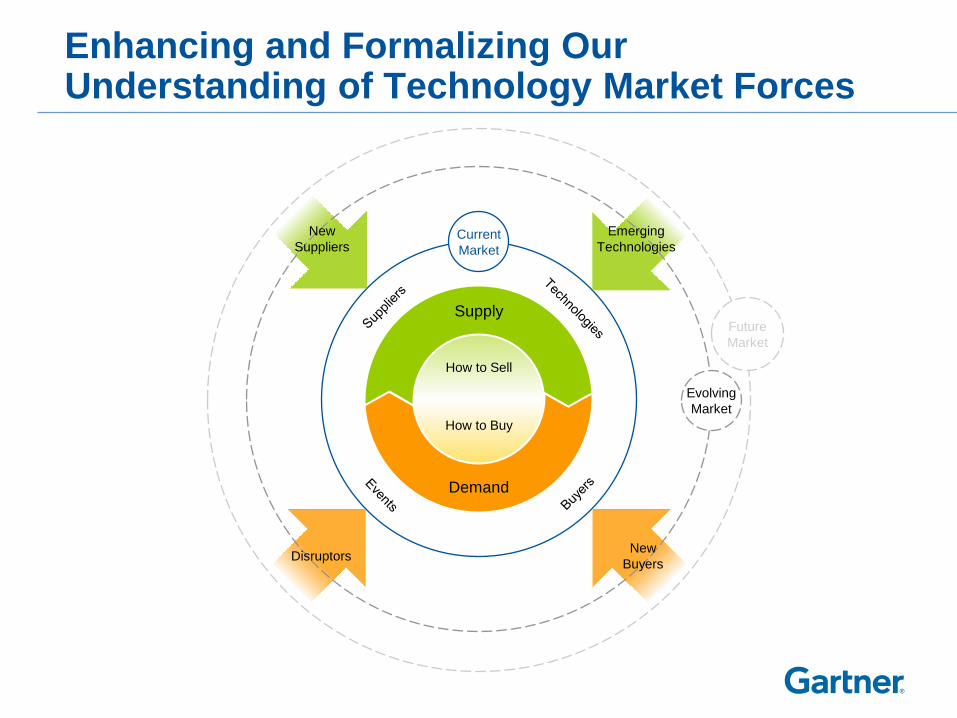
Enhancing and Formalizing Our Understanding of Technology Market Forces
How to Sell
How to Buy
Supply
Demand
Disruptors New
Buyers
New
Suppliers
Emerging
Technologies Current
Market
Evolving
Market
Future
Market
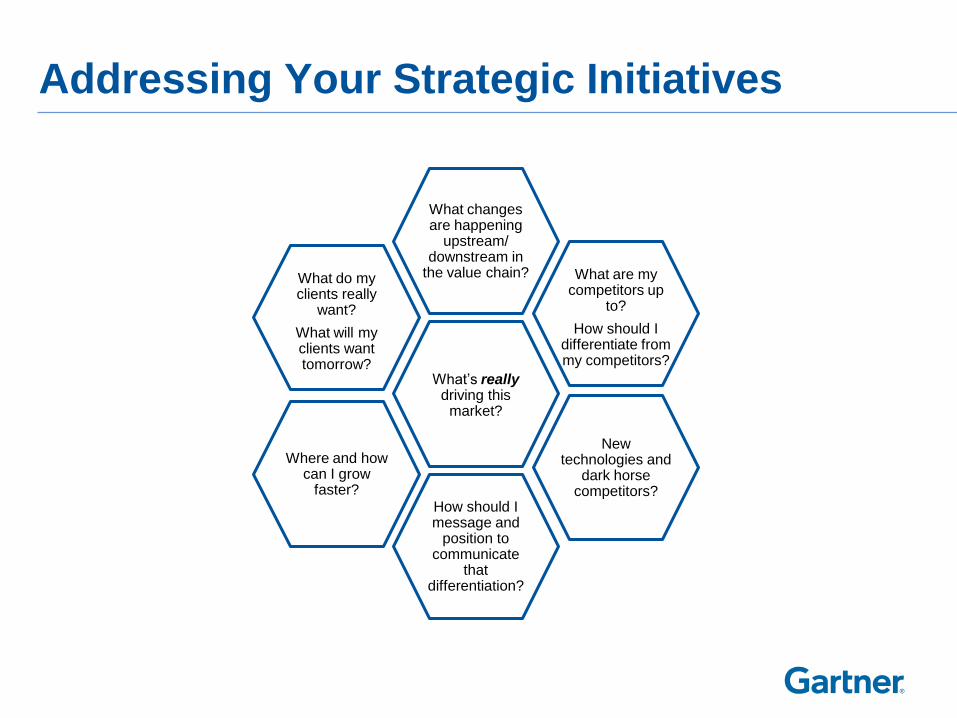
Addressing Your Strategic Initiatives
What’s really driving this
market?
What changes are happening
upstream/ downstream in
the value chain? What are my competitors up
to?
How should I differentiate from my competitors?
Where and how can I grow
faster?
What do my clients really
want?
What will my clients want tomorrow?
New technologies and
dark horse competitors?
How should I message and
position to communicate
that differentiation?
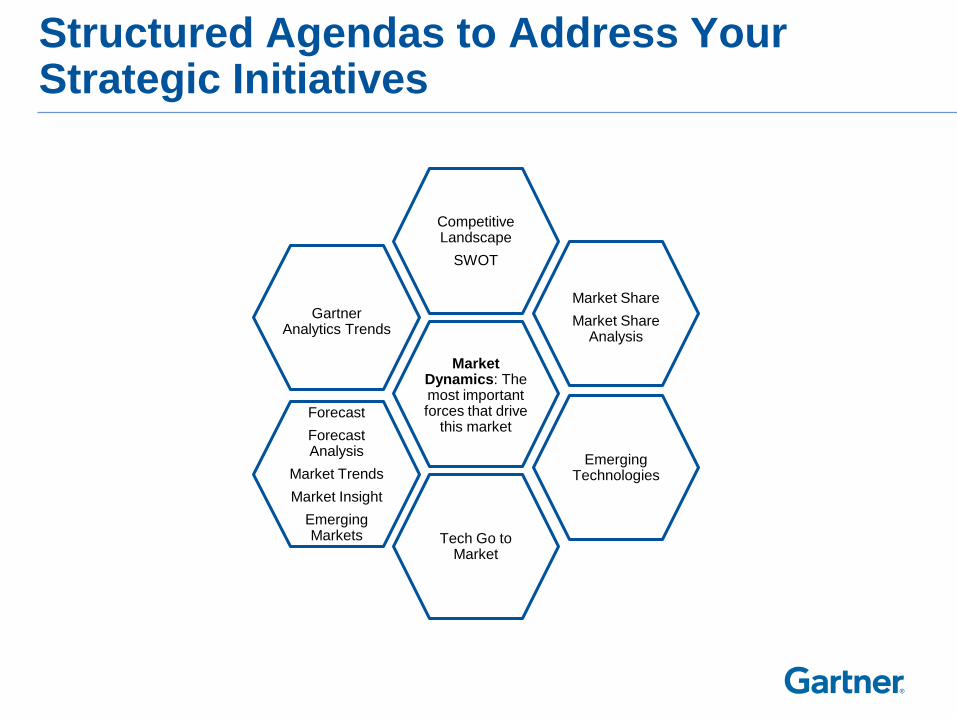
Structured Agendas to Address Your Strategic Initiatives
Market Dynamics: The most important forces that drive
this market
Competitive Landscape
SWOT
Market Share
Market Share Analysis
Forecast
Forecast Analysis
Market Trends
Market Insight
Emerging Markets
Gartner Analytics Trends
Emerging Technologies
Tech Go to Market
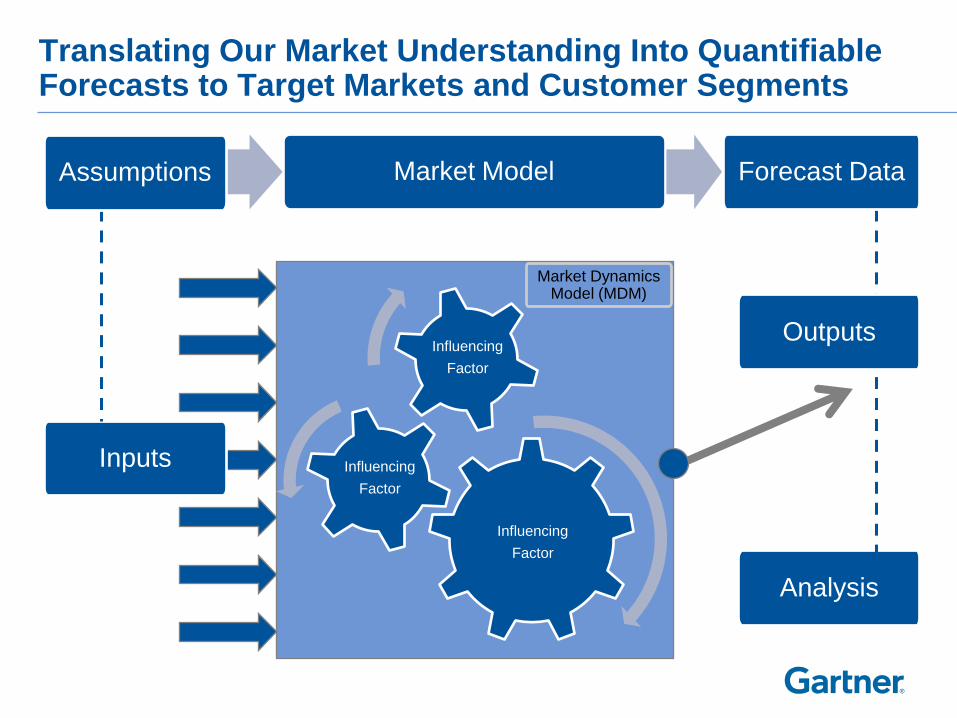
Translating Our Market Understanding Into Quantifiable Forecasts to Target Markets and Customer Segments
Market Model
Influencing
Factor
Influencing
Factor
Influencing
Factor
Inputs
Analysis
Outputs
Assumptions Forecast Data
Market Dynamics Model (MDM)
Strong Value Proposition
• Continued client support and research investment worldwide
• Continuous process improvement and content evolution
• Content focused on the issues most important to our end user and technology provider clients
23
Thank You!