GARAVAGLIA Elsa 1, a * TEDESCHI Cristina 2,b and PEREGO ... · Probabilistic evaluation of concrete...
12
Probabilistic evaluation of concrete durability subject to accelerated decay by salt crystallization GARAVAGLIA Elsa 1, a * , TEDESCHI Cristina 2,b and PEREGO Sara 3,c 1 Politecnico di Milano, Department of Civil and Environmental Engineering, Milan, Italy 2 Politecnico di Milano, Department of Civil and Environmental Engineering, Milan, Italy 3 Politecnico di Milano, Department of Civil and Environmental Engineering, Milan, Italy a [email protected], b [email protected], c [email protected] *corresponding author Keywords: concrete durability, crystallization tests, laser profilometer, probabilistic model Abstract. Physical and chemical attack, caused by external environment factors, such as humidity, temperature and the presence of salts, and also by the concrete characteristics, such as porosity and the mix design, may develop alterations in the components of the concrete (cement and aggregates). These changes are manifested by the erosion or the expansion of the surface, causing a progressive decrease of the mechanical strength of the structure which adversely affects its stability. To investigate the decay caused by the presence of sulphates in concrete structures, durability tests were carried out on concrete specimens in accordance to RILEM Recommendation MS-A1.The decay caused by salt crystallization was quantified through a laser-triangulation CMOS-CCD profilometer and its development over time was modelled through an appropriate probabilistic model. Introduction Some substances, either occurring naturally or resulting from human activity, in the present in soil or in the water, can cause decay in concrete due to chemical reactions that developed with the constituents of the cement matrix. Durability of concrete structures is influenced by sodium sulphate (Na2SO4) attack and also by environmental conditions [1], such as temperature, pH value and sulphate concentration in the salt solution. The sulphate attack is larger in concrete exposed to wet-dry cycling. When water evaporates, sulphate ions [2, 3, 4] can accumulate on the concrete surface, increasing in concentration and their potential, causing deterioration [5]. Porous concrete is susceptible to weathering caused by salt crystallization. Under drying conditions, salt solutions can rise to the surface by capillary action and, as a result of surface evaporation, the solution phase becomes supersaturated and salt crystallization occurs, sometimes generating pressures large enough to cause cracking and scaling [6]. Sulphate attack on concrete structures has been the subject of several experimental studies, with the damage caused by secondary ettringite formation being predominant at low concentration of sodium sulfate [7, 8, 9, 10], while the damage caused by the formation of gypsum predominates at high concentration of sodium sulfate [11]. Few studies however cover the damage of concrete due to crystallization of water soluble sulphate salts [12] with the use of laser scanner to evaluate the damage after wet-dry cycles on concrete blocks [13]. In this study, with the objective of investigating durability against sulphate attack, salt crystallization tests were carried out according to RILEM procedure [14] on concrete cubic specimens. The loss of the surface material was assumed as a significant measure of the decay. The damage was measured each month by a laser-triangulation CMOS-CCD profilometer which records the variation of the vertical section of the specimens. The randomness due to the salt crystallization and to the environmental attacks, led to the study of the damage through a probabilistic approach where the decay process of the concrete is assumed as a stochastic process. The first results obtained on a set of concrete specimens are discussed in this paper.
Transcript of GARAVAGLIA Elsa 1, a * TEDESCHI Cristina 2,b and PEREGO ... · Probabilistic evaluation of concrete...
Probabilistic evaluation of concrete durability subject to accelerated decay by salt crystallization
GARAVAGLIA Elsa1, a *, TEDESCHI Cristina2,b and PEREGO Sara3,c 1 Politecnico di Milano, Department of Civil and Environmental Engineering, Milan, Italy 2 Politecnico di Milano, Department of Civil and Environmental Engineering, Milan, Italy 3 Politecnico di Milano, Department of Civil and Environmental Engineering, Milan, Italy
[email protected], [email protected], [email protected]
*corresponding author
Keywords: concrete durability, crystallization tests, laser profilometer, probabilistic model Abstract. Physical and chemical attack, caused by external environment factors, such as humidity, temperature and the presence of salts, and also by the concrete characteristics, such as porosity and the mix design, may develop alterations in the components of the concrete (cement and aggregates). These changes are manifested by the erosion or the expansion of the surface, causing a progressive decrease of the mechanical strength of the structure which adversely affects its stability. To investigate the decay caused by the presence of sulphates in concrete structures, durability tests were carried out on concrete specimens in accordance to RILEM Recommendation MS-A1.The decay caused by salt crystallization was quantified through a laser-triangulation CMOS-CCD profilometer and its development over time was modelled through an appropriate probabilistic model.
Introduction
Some substances, either occurring naturally or resulting from human activity, in the present in soil or in the water, can cause decay in concrete due to chemical reactions that developed with the constituents of the cement matrix. Durability of concrete structures is influenced by sodium sulphate (Na2SO4) attack and also by environmental conditions [1], such as temperature, pH value and sulphate concentration in the salt solution. The sulphate attack is larger in concrete exposed to wet-dry cycling. When water evaporates, sulphate ions [2, 3, 4] can accumulate on the concrete surface, increasing in concentration and their potential, causing deterioration [5].
Porous concrete is susceptible to weathering caused by salt crystallization. Under drying conditions, salt solutions can rise to the surface by capillary action and, as a result of surface evaporation, the solution phase becomes supersaturated and salt crystallization occurs, sometimes generating pressures large enough to cause cracking and scaling [6].
Sulphate attack on concrete structures has been the subject of several experimental studies, with the damage caused by secondary ettringite formation being predominant at low concentration of sodium sulfate [7, 8, 9, 10], while the damage caused by the formation of gypsum predominates at high concentration of sodium sulfate [11]. Few studies however cover the damage of concrete due to crystallization of water soluble sulphate salts [12] with the use of laser scanner to evaluate the damage after wet-dry cycles on concrete blocks [13].
In this study, with the objective of investigating durability against sulphate attack, salt crystallization tests were carried out according to RILEM procedure [14] on concrete cubic specimens. The loss of the surface material was assumed as a significant measure of the decay. The damage was measured each month by a laser-triangulation CMOS-CCD profilometer which records the variation of the vertical section of the specimens. The randomness due to the salt crystallization and to the environmental attacks, led to the study of the damage through a probabilistic approach where the decay process of the concrete is assumed as a stochastic process. The first results obtained on a set of concrete specimens are discussed in this paper.
Specimens details and laboratory tests development
The specimens of concrete (150mm x 150mm x150mm) were cast in two different time intervals with a concrete mix design prepared with 0,45 water to cement ratio, 250 Kg/m3 cement content (CEM II / A-LL 42.5 R, chemical composition reported in Table 1) and 32mm maximum siliceous aggregate size. The concrete cubes, called 1R8, 2R7, were curing in a laboratory controlled environmental at 20°C and 90% RH for 28 days.
Table 1 Chemical composition of the cement
Cement C3A [%] C4AF [%] SO3 [%] CEM II / A-LL 42.5 R 6,08 7,90 3,15
After curing, the specimens were subjected to durability tests according to RILEM
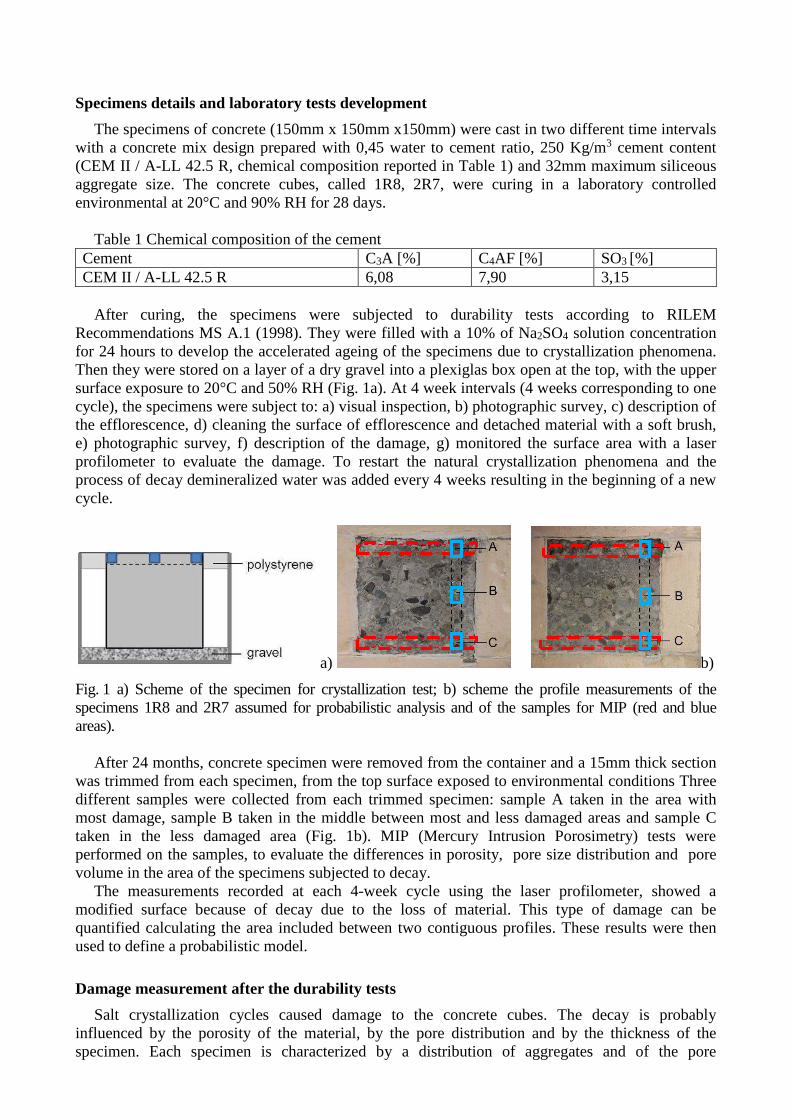
Recommendations MS A.1 (1998). They were filled with a 10% of Na2SO4 solution concentration for 24 hours to develop the accelerated ageing of the specimens due to crystallization phenomena. Then they were stored on a layer of a dry gravel into a plexiglas box open at the top, with the upper surface exposure to 20°C and 50% RH (Fig. 1a). At 4 week intervals (4 weeks corresponding to one cycle), the specimens were subject to: a) visual inspection, b) photographic survey, c) description of the efflorescence, d) cleaning the surface of efflorescence and detached material with a soft brush, e) photographic survey, f) description of the damage, g) monitored the surface area with a laser profilometer to evaluate the damage. To restart the natural crystallization phenomena and the process of decay demineralized water was added every 4 weeks resulting in the beginning of a new cycle.
a) b)
Fig. 1 a) Scheme of the specimen for crystallization test; b) scheme the profile measurements of the specimens 1R8 and 2R7 assumed for probabilistic analysis and of the samples for MIP (red and blue areas).
After 24 months, concrete specimen were removed from the container and a 15mm thick section
was trimmed from each specimen, from the top surface exposed to environmental conditions Three different samples were collected from each trimmed specimen: sample A taken in the area with most damage, sample B taken in the middle between most and less damaged areas and sample C taken in the less damaged area (Fig. 1b). MIP (Mercury Intrusion Porosimetry) tests were performed on the samples, to evaluate the differences in porosity, pore size distribution and pore volume in the area of the specimens subjected to decay.
The measurements recorded at each 4-week cycle using the laser profilometer, showed a modified surface because of decay due to the loss of material. This type of damage can be quantified calculating the area included between two contiguous profiles. These results were then used to define a probabilistic model.
Damage measurement after the durability tests
Salt crystallization cycles caused damage to the concrete cubes. The decay is probably influenced by the porosity of the material, by the pore distribution and by the thickness of the specimen. Each specimen is characterized by a distribution of aggregates and of the pore
characteristics. that change for each specimen even if the specimens were cast using the same mix design. The characteristics just described, together with the thickness of the specimens (150 mm), influence the capillary rise and the salts crystallization in the material. Effects of the crystallization were analyzed with reference to monthly visual inspections:
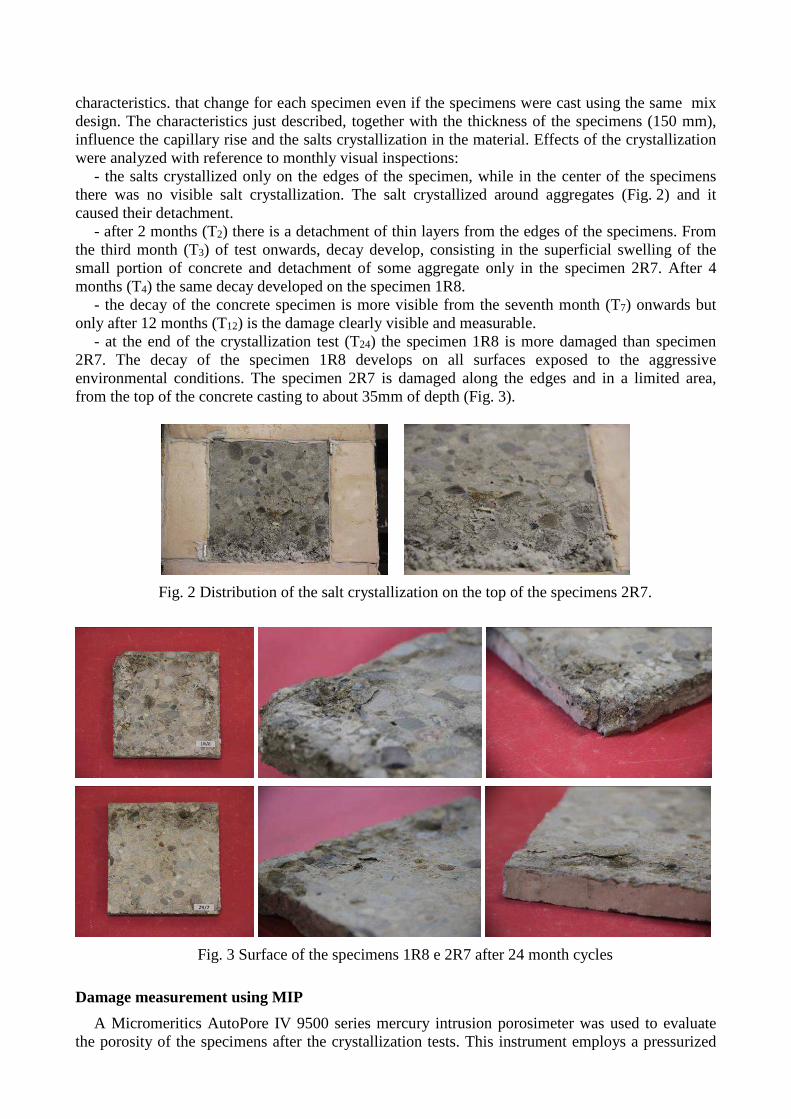
- the salts crystallized only on the edges of the specimen, while in the center of the specimens there was no visible salt crystallization. The salt crystallized around aggregates (Fig. 2) and it caused their detachment.
- after 2 months (T2) there is a detachment of thin layers from the edges of the specimens. From the third month (T3) of test onwards, decay develop, consisting in the superficial swelling of the small portion of concrete and detachment of some aggregate only in the specimen 2R7. After 4 months (T4) the same decay developed on the specimen 1R8.
- the decay of the concrete specimen is more visible from the seventh month (T7) onwards but only after 12 months (T12) is the damage clearly visible and measurable.
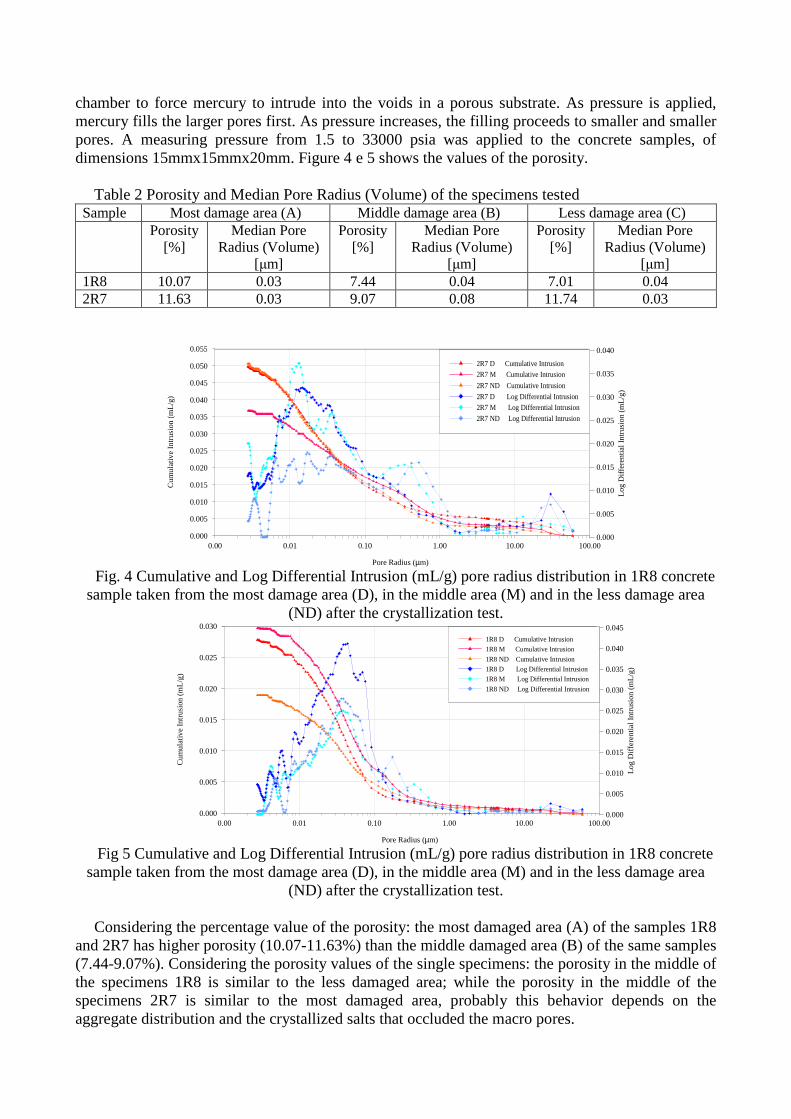
- at the end of the crystallization test (T24) the specimen 1R8 is more damaged than specimen 2R7. The decay of the specimen 1R8 develops on all surfaces exposed to the aggressive environmental conditions. The specimen 2R7 is damaged along the edges and in a limited area, from the top of the concrete casting to about 35mm of depth (Fig. 3).
Fig. 2 Distribution of the salt crystallization on the top of the specimens 2R7.
Fig. 3 Surface of the specimens 1R8 e 2R7 after 24 month cycles
Damage measurement using MIP
A Micromeritics AutoPore IV 9500 series mercury intrusion porosimeter was used to evaluate the porosity of the specimens after the crystallization tests. This instrument employs a pressurized
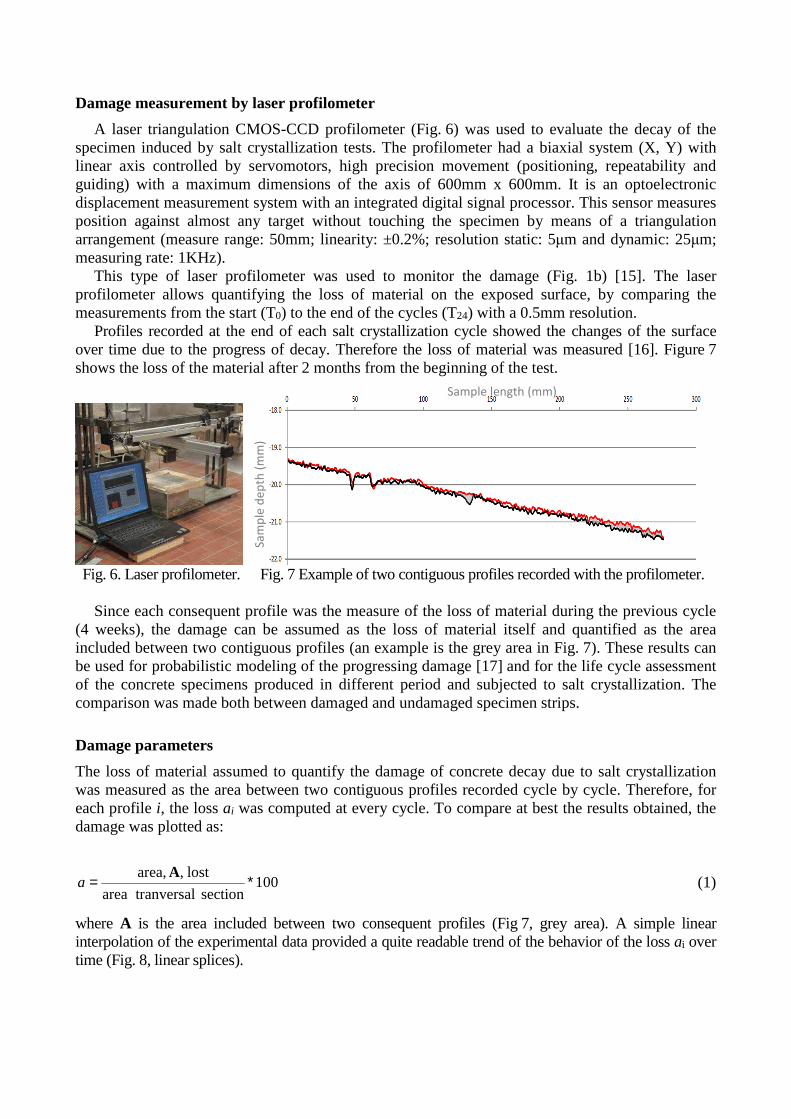
chamber to force mercury to intrude into the voids in a porous substrate. As pressure is applied, mercury fills the larger pores first. As pressure increases, the filling proceeds to smaller and smaller pores. A measuring pressure from 1.5 to 33000 psia was applied to the concrete samples, of dimensions 15mmx15mmx20mm. Figure 4 e 5 shows the values of the porosity.
Table 2 Porosity and Median Pore Radius (Volume) of the specimens tested
Sample Most damage area (A) Middle damage area (B) Less damage area (C) Porosity
[%] Median Pore
Radius (Volume) [µm]
Porosity [%]
Median Pore Radius (Volume)
[µm]
Porosity [%]
Median Pore Radius (Volume)
[µm] 1R8 10.07 0.03 7.44 0.04 7.01 0.04 2R7 11.63 0.03 9.07 0.08 11.74 0.03
0.00 0.01 0.10 1.00 10.00 100.00
Pore Radius (µm)
0.000
0.005
0.010
0.015
0.020
0.025
0.030
0.035
0.040
Log
Diff
eren
tial I
ntr
usi
on
(mL/
g)
0.000
0.005
0.010
0.015
0.020
0.025
0.030
0.035
0.040
0.045
0.050
0.055
Cum
ulat
ive
Intr
usio
n (m
L/g
)
2R7 D Cumulative Intrusion
2R7 M Cumulative Intrusion
2R7 ND Cumulative Intrusion
2R7 D Log Differential Intrusion
2R7 M Log Differential Intrusion
2R7 ND Log Differential Intrusion
Fig. 4 Cumulative and Log Differential Intrusion (mL/g) pore radius distribution in 1R8 concrete
sample taken from the most damage area (D), in the middle area (M) and in the less damage area (ND) after the crystallization test.
0.00 0.01 0.10 1.00 10.00 100.00
Pore Radius (µm)
0.000
0.005
0.010
0.015
0.020
0.025
0.030
0.035
0.040
0.045Lo
g D
iffer
entia
l In
tru
sio
n (m
L/g
)
0.000
0.005
0.010
0.015
0.020
0.025
0.030
Cum
ulat
ive
Intr
usio
n (m
L/g
)
1R8 D Cumulative Intrusion
1R8 M Cumulative Intrusion
1R8 ND Cumulative Intrusion
1R8 D Log Differential Intrusion
1R8 M Log Differential Intrusion
1R8 ND Log Differential Intrusion
Fig 5 Cumulative and Log Differential Intrusion (mL/g) pore radius distribution in 1R8 concrete
sample taken from the most damage area (D), in the middle area (M) and in the less damage area (ND) after the crystallization test.
Considering the percentage value of the porosity: the most damaged area (A) of the samples 1R8
and 2R7 has higher porosity (10.07-11.63%) than the middle damaged area (B) of the same samples (7.44-9.07%). Considering the porosity values of the single specimens: the porosity in the middle of the specimens 1R8 is similar to the less damaged area; while the porosity in the middle of the specimens 2R7 is similar to the most damaged area, probably this behavior depends on the aggregate distribution and the crystallized salts that occluded the macro pores.
Damage measurement by laser profilometer
A laser triangulation CMOS-CCD profilometer (Fig. 6) was used to evaluate the decay of the specimen induced by salt crystallization tests. The profilometer had a biaxial system (X, Y) with linear axis controlled by servomotors, high precision movement (positioning, repeatability and guiding) with a maximum dimensions of the axis of 600mm x 600mm. It is an optoelectronic displacement measurement system with an integrated digital signal processor. This sensor measures position against almost any target without touching the specimen by means of a triangulation arrangement (measure range: 50mm; linearity: ±0.2%; resolution static: 5µm and dynamic: 25µm; measuring rate: 1KHz).
This type of laser profilometer was used to monitor the damage (Fig. 1b) [15]. The laser profilometer allows quantifying the loss of material on the exposed surface, by comparing the measurements from the start (T0) to the end of the cycles (T24) with a 0.5mm resolution.
Profiles recorded at the end of each salt crystallization cycle showed the changes of the surface over time due to the progress of decay. Therefore the loss of material was measured [16]. Figure 7 shows the loss of the material after 2 months from the beginning of the test.
Fig. 6. Laser profilometer. Fig. 7 Example of two contiguous profiles recorded with the profilometer.
Since each consequent profile was the measure of the loss of material during the previous cycle (4 weeks), the damage can be assumed as the loss of material itself and quantified as the area included between two contiguous profiles (an example is the grey area in Fig. 7). These results can be used for probabilistic modeling of the progressing damage [17] and for the life cycle assessment of the concrete specimens produced in different period and subjected to salt crystallization. The comparison was made both between damaged and undamaged specimen strips.
Damage parameters
The loss of material assumed to quantify the damage of concrete decay due to salt crystallization was measured as the area between two contiguous profiles recorded cycle by cycle. Therefore, for each profile i, the loss ai was computed at every cycle. To compare at best the results obtained, the damage was plotted as:
100section tranversal area
lost, area,∗=
Aa (1)
where A is the area included between two consequent profiles (Fig 7, grey area). A simple linear interpolation of the experimental data provided a quite readable trend of the behavior of the loss ai over time (Fig. 8, linear splices).
Sample length (mm)
Sa
mp
le d
ep
th (
mm
)
0.000
0.010
0.020
0.030
0.040
0.050
0.060
0.070
0.080
0 41 82 123 164 205 246 287 328 369 410 451 492 533 574 615 656 697 738
Loss
of
surf
ace
ma
teri
al
[%]
τ [months]
0 2 4 6 8 10 12 14 16 18
0.000
0.010
0.020
0.030
0.040
0.050
0.060
0.070
0.080
-287 -246 -205 -164 -123 -82 -41 0 41 82 123 164 205 246 287 328 369 410 451 492 533 574 615 656 697 738 779 820
Loss
of
surf
ace
ma
teri
al
[%]
τ [months]
0 2 4 6 8 10 12 14 16 18
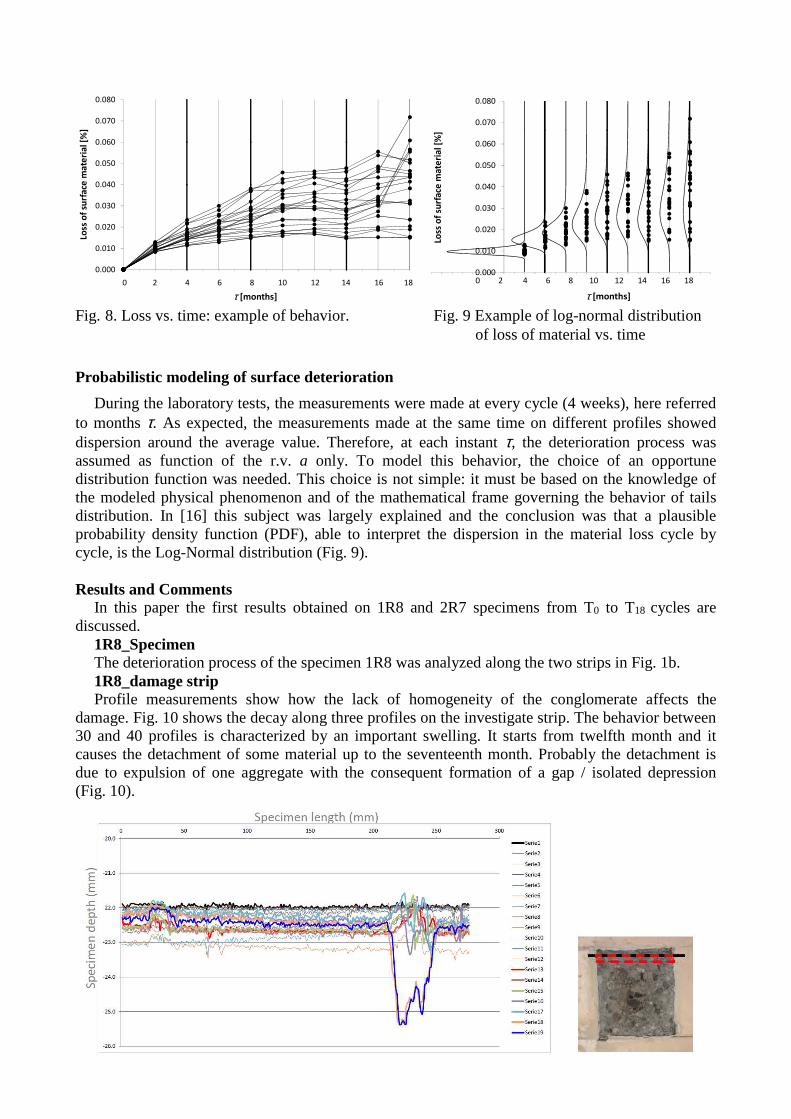
Fig. 8. Loss vs. time: example of behavior. Fig. 9 Example of log-normal distribution of loss of material vs. time
Probabilistic modeling of surface deterioration
During the laboratory tests, the measurements were made at every cycle (4 weeks), here referred to months τ. As expected, the measurements made at the same time on different profiles showed dispersion around the average value. Therefore, at each instant τ, the deterioration process was assumed as function of the r.v. a only. To model this behavior, the choice of an opportune distribution function was needed. This choice is not simple: it must be based on the knowledge of the modeled physical phenomenon and of the mathematical frame governing the behavior of tails distribution. In [16] this subject was largely explained and the conclusion was that a plausible probability density function (PDF), able to interpret the dispersion in the material loss cycle by cycle, is the Log-Normal distribution (Fig. 9).
Results and Comments
In this paper the first results obtained on 1R8 and 2R7 specimens from T0 to T18 cycles are discussed.
1R8_Specimen The deterioration process of the specimen 1R8 was analyzed along the two strips in Fig. 1b. 1R8_damage strip Profile measurements show how the lack of homogeneity of the conglomerate affects the
damage. Fig. 10 shows the decay along three profiles on the investigate strip. The behavior between 30 and 40 profiles is characterized by an important swelling. It starts from twelfth month and it causes the detachment of some material up to the seventeenth month. Probably the detachment is due to expulsion of one aggregate with the consequent formation of a gap / isolated depression (Fig. 10).
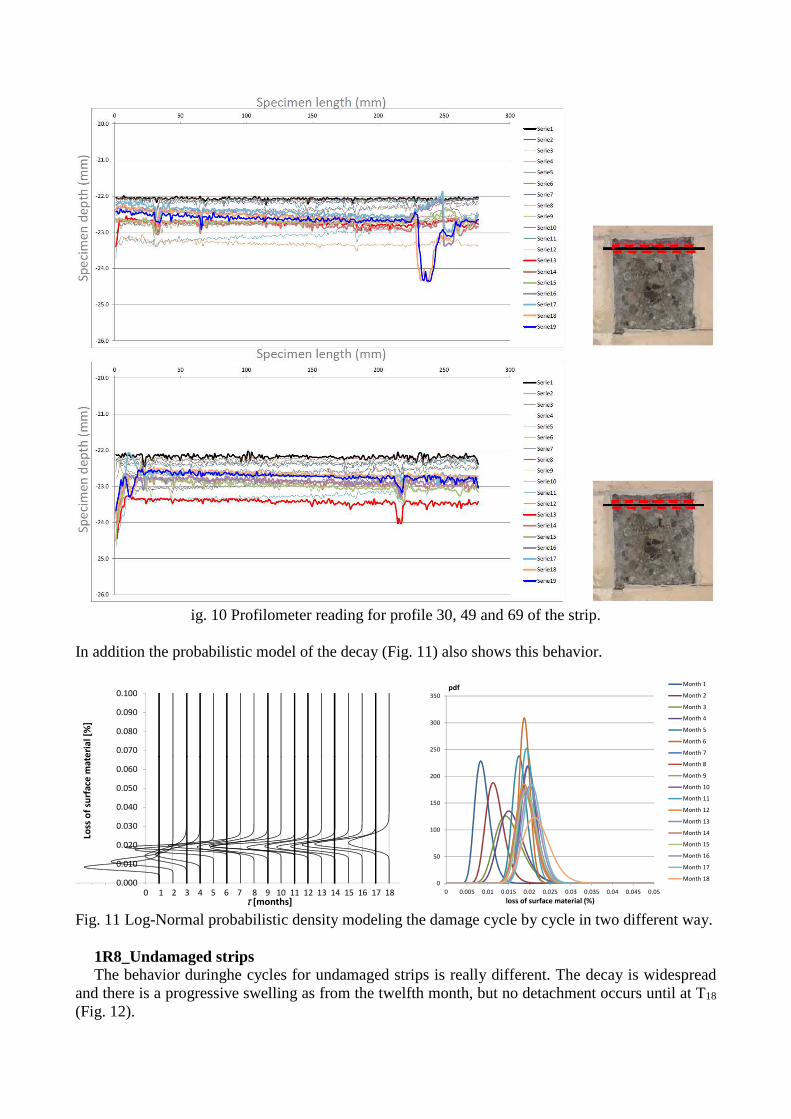
ig. 10 Profilometer reading for profile 30, 49 and 69 of the strip. In addition the probabilistic model of the decay (Fig. 11) also shows this behavior.
0.000
0.010
0.020
0.030
0.040
0.050
0.060
0.070
0.080
0.090
0.100
-205 -164 -123 -82 -41 0 41 82 123 164 205 246 287 328 369 410 451 492 533 574 615 656 697 738 779
Loss
of
surf
ace
ma
teri
al
[%]
τ [months]0 1 2 3 4 5 6 7 8 9 10 11 12 13 14 15 16 17 18
0
50
100
150
200
250
300
350
0 0.005 0.01 0.015 0.02 0.025 0.03 0.035 0.04 0.045 0.05
loss of surface material (%)
Month 1
Month 2
Month 3
Month 4
Month 5
Month 6
Month 7
Month 8
Month 9
Month 10
Month 11
Month 12
Month 13
Month 14
Month 15
Month 16
Month 17
Month 18
Fig. 11 Log-Normal probabilistic density modeling the damage cycle by cycle in two different way.
1R8_Undamaged strips The behavior duringhe cycles for undamaged strips is really different. The decay is widespread
and there is a progressive swelling as from the twelfth month, but no detachment occurs until at T18 (Fig. 12).
-26.0
-25.5
-25.0
-24.5
-24.0
-23.5
-23.0
-22.5
-22.0
0 50 100 150 200 250 300
Serie1
Serie2
Serie3
Serie4
Serie5
Serie6
Serie7
Serie8
Serie9
Serie10
Serie11
Serie12
Serie13
Serie14
Serie15
Serie16
Serie17
Serie18
Serie19
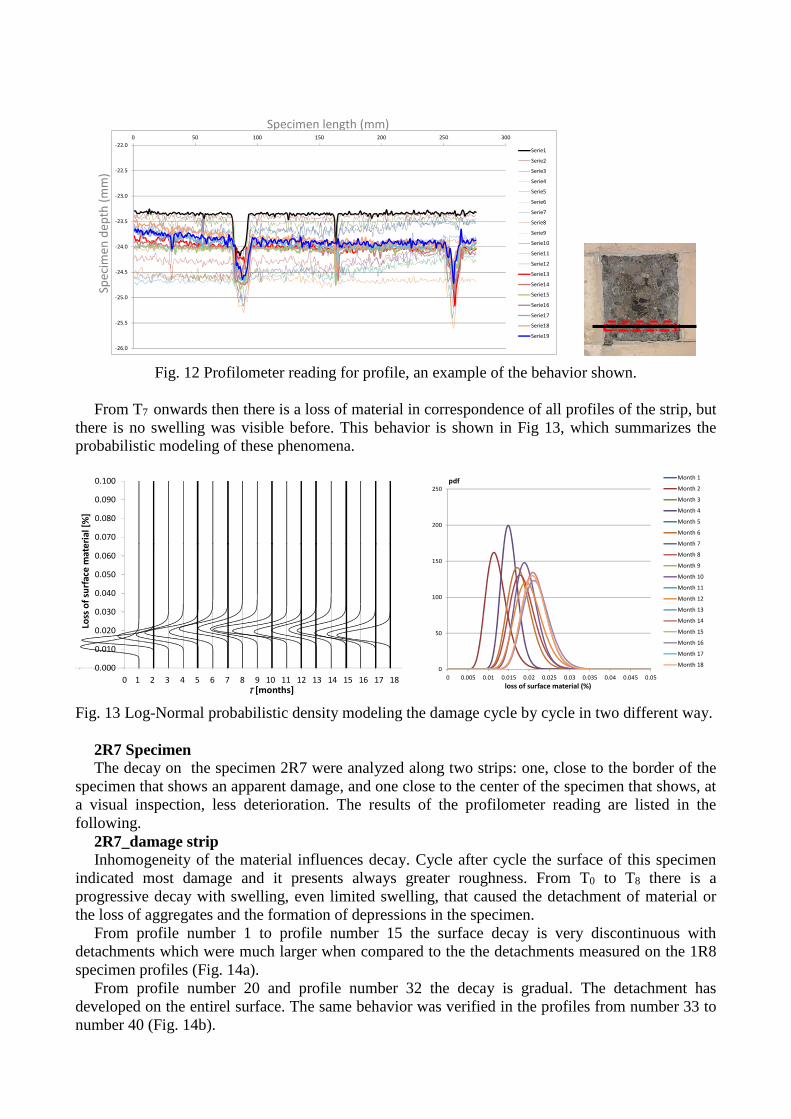
Fig. 12 Profilometer reading for profile, an example of the behavior shown. From T7 onwards then there is a loss of material in correspondence of all profiles of the strip, but
there is no swelling was visible before. This behavior is shown in Fig 13, which summarizes the probabilistic modeling of these phenomena.
0.000
0.010
0.020
0.030
0.040
0.050
0.060
0.070
0.080
0.090
0.100
-123 -82 -41 0 41 82 123 164 205 246 287 328 369 410 451 492 533 574 615 656 697 738 779
Loss
of
surf
ace
ma
teri
al
[%]
τ [months]0 1 2 3 4 5 6 7 8 9 10 11 12 13 14 15 16 17 18
0
50
100
150
200
250
0 0.005 0.01 0.015 0.02 0.025 0.03 0.035 0.04 0.045 0.05
loss of surface material (%)
Month 1
Month 2
Month 3
Month 4
Month 5
Month 6
Month 7
Month 8
Month 9
Month 10
Month 11
Month 12
Month 13
Month 14
Month 15
Month 16
Month 17
Month 18
Fig. 13 Log-Normal probabilistic density modeling the damage cycle by cycle in two different way.
2R7 Specimen The decay on the specimen 2R7 were analyzed along two strips: one, close to the border of the
specimen that shows an apparent damage, and one close to the center of the specimen that shows, at a visual inspection, less deterioration. The results of the profilometer reading are listed in the following.
2R7_damage strip Inhomogeneity of the material influences decay. Cycle after cycle the surface of this specimen
indicated most damage and it presents always greater roughness. From T0 to T8 there is a progressive decay with swelling, even limited swelling, that caused the detachment of material or the loss of aggregates and the formation of depressions in the specimen.
From profile number 1 to profile number 15 the surface decay is very discontinuous with detachments which were much larger when compared to the the detachments measured on the 1R8 specimen profiles (Fig. 14a).
From profile number 20 and profile number 32 the decay is gradual. The detachment has developed on the entirel surface. The same behavior was verified in the profiles from number 33 to number 40 (Fig. 14b).
Specimen length (mm)
Sp
eci
me
n d
ep
th (
mm
)
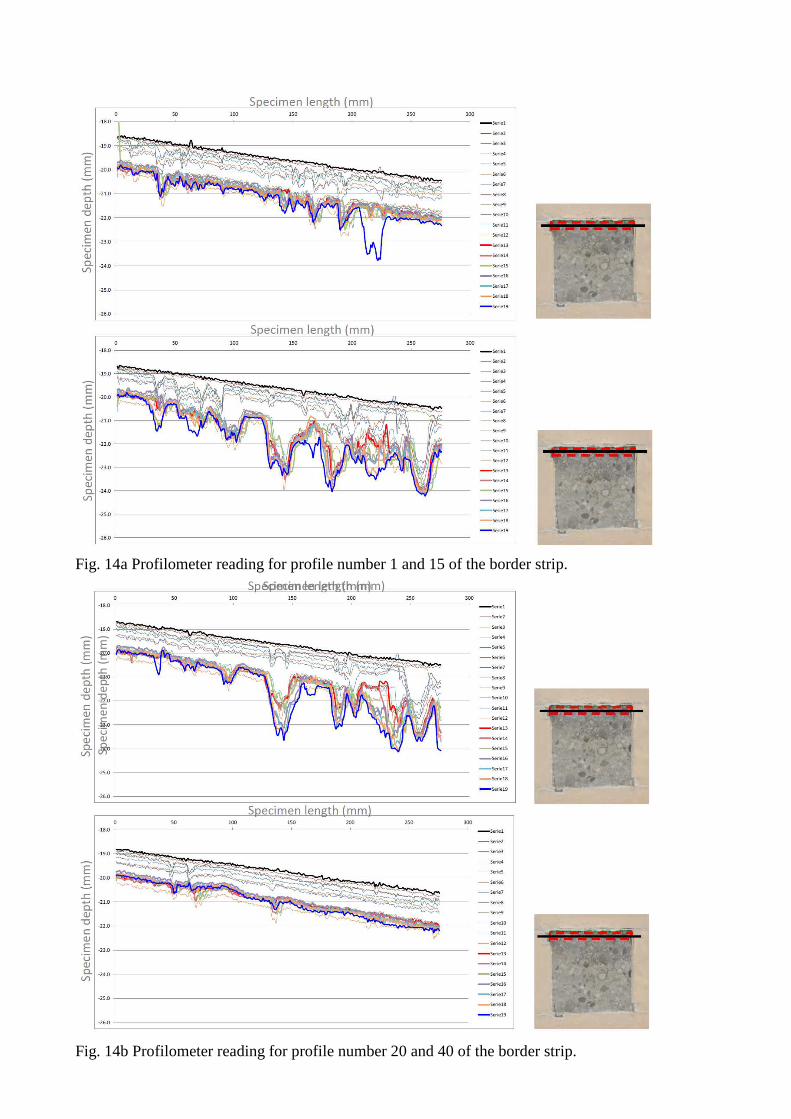
Fig. 14a Profilometer reading for profile number 1 and 15 of the border strip.
Fig. 14b Profilometer reading for profile number 20 and 40 of the border strip.
Specimen length (mm)
Sp
eci
me
n d
ep
th (
mm
)
0.000
0.010
0.020
0.030
0.040
0.050
0.060
0.070
0.080
0.090
0.100
-574 -533 -492 -451 -410 -369 -328 -287 -246 -205 -164 -123 -82 -41 0 41 82 123 164 205 246 287 328 369 410 451 492 533 574 615 656 697 738 779 820
Loss
of
surf
ace
ma
teri
al
[%]
τ [months]
0 2 4 6 8 10 12 14 16 18
0.024
0
100
200
300
400
500
600
0 0.005 0.01 0.015 0.02 0.025 0.03 0.035 0.04 0.045 0.05
loss of surface material (%)
Month 1
Month 2
Month 3
Month 4
Month 5
Month 6
Month 7
Month 8
Month 9
Month 10
Month 11
Month 12
Month 13
Month 14
Month 15
Month 16
Month 17
Month 18
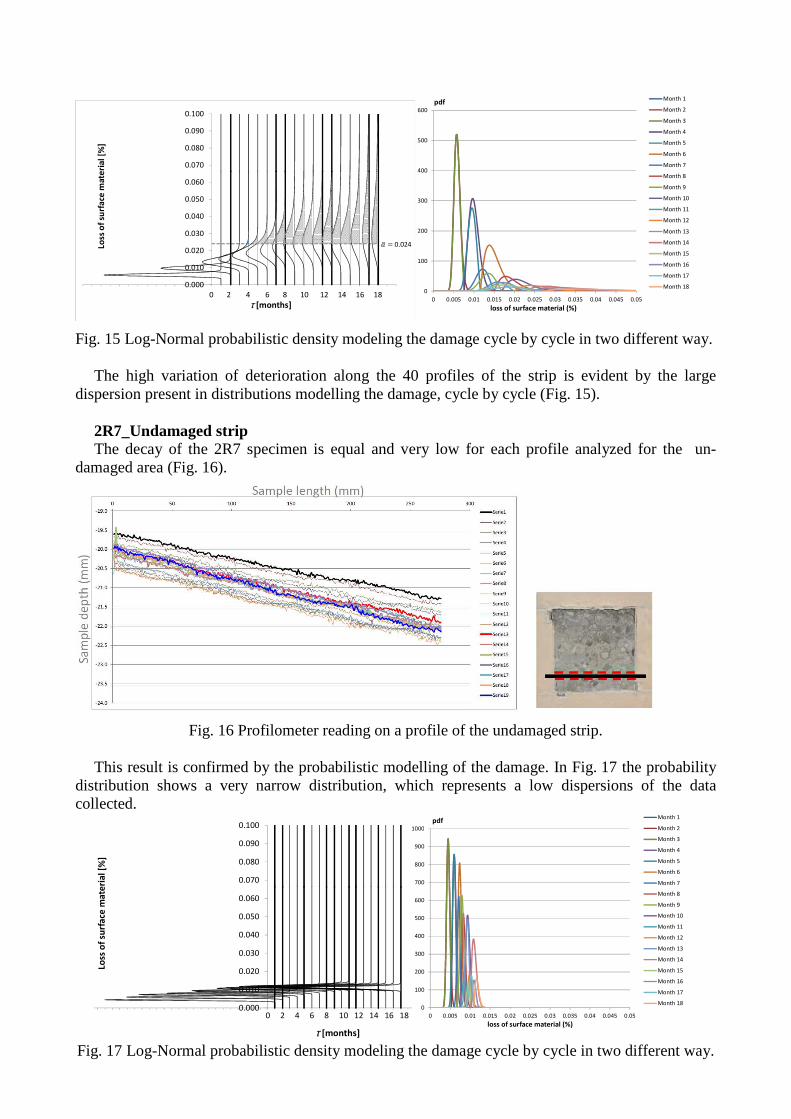
Fig. 15 Log-Normal probabilistic density modeling the damage cycle by cycle in two different way. The high variation of deterioration along the 40 profiles of the strip is evident by the large
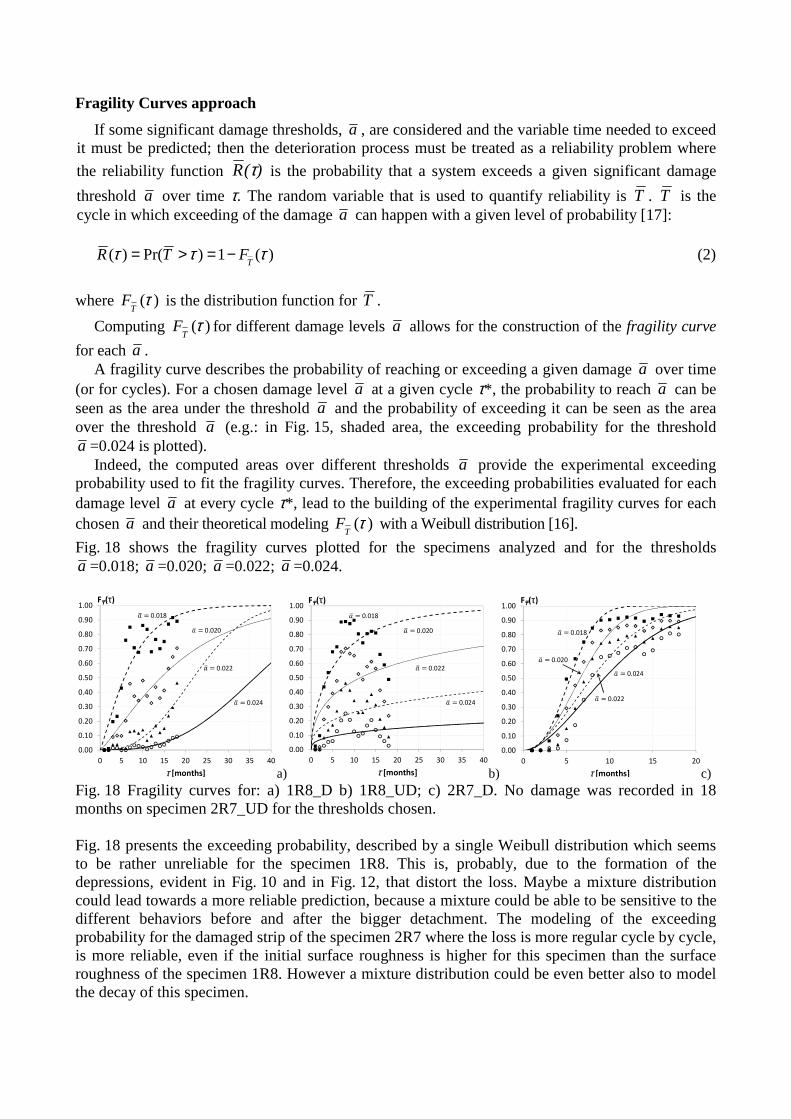
dispersion present in distributions modelling the damage, cycle by cycle (Fig. 15). 2R7_Undamaged strip The decay of the 2R7 specimen is equal and very low for each profile analyzed for the un-
damaged area (Fig. 16).
Fig. 16 Profilometer reading on a profile of the undamaged strip. This result is confirmed by the probabilistic modelling of the damage. In Fig. 17 the probability
distribution shows a very narrow distribution, which represents a low dispersions of the data collected.
0.000
0.010
0.020
0.030
0.040
0.050
0.060
0.070
0.080
0.090
0.100
-984-943-902-861-820-779-738-697-656-615-574-533-492-451-410-369-328-287-246-205-164-123-82 -41 0 41 82 123164205246287328369410451492533574615656697738779820
Loss
of
surf
ace
ma
teri
al
[%]
τ [months]
0 2 4 6 8 10 12 14 16 180
100
200
300
400
500
600
700
800
900
1000
0 0.005 0.01 0.015 0.02 0.025 0.03 0.035 0.04 0.045 0.05
loss of surface material (%)
Month 1
Month 2
Month 3
Month 4
Month 5
Month 6
Month 7
Month 8
Month 9
Month 10
Month 11
Month 12
Month 13
Month 14
Month 15
Month 16
Month 17
Month 18
Fig. 17 Log-Normal probabilistic density modeling the damage cycle by cycle in two different way.
Fragility Curves approach
If some significant damage thresholds, a , are considered and the variable time needed to exceed it must be predicted; then the deterioration process must be treated as a reliability problem where
the reliability function )(R τ is the probability that a system exceeds a given significant damage
threshold a over time τ. The random variable that is used to quantify reliability is T . T is the cycle in which exceeding of the damage a can happen with a given level of probability [17]:
)(1)Pr()( τττ
TFTR −=>= (2)
where )(τT
F is the distribution function for T .
Computing )(τT
F for different damage levels a allows for the construction of the fragility curve
for each a . A fragility curve describes the probability of reaching or exceeding a given damage a over time
(or for cycles). For a chosen damage level a at a given cycle τ*, the probability to reach a can be seen as the area under the threshold a and the probability of exceeding it can be seen as the area over the threshold a (e.g.: in Fig. 15, shaded area, the exceeding probability for the threshold a =0.024 is plotted).
Indeed, the computed areas over different thresholds a provide the experimental exceeding probability used to fit the fragility curves. Therefore, the exceeding probabilities evaluated for each damage level a at every cycle τ*, lead to the building of the experimental fragility curves for each chosen a and their theoretical modeling )(τ
TF with a Weibull distribution [16].
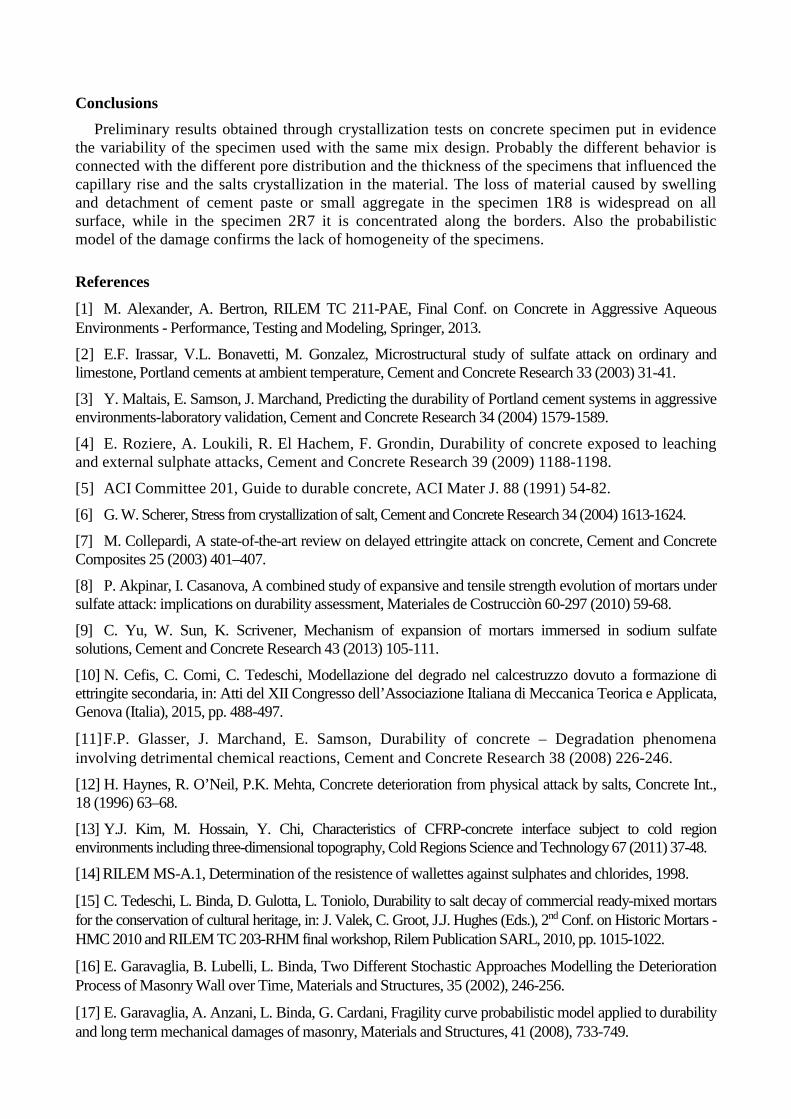
Fig. 18 shows the fragility curves plotted for the specimens analyzed and for the thresholds a =0.018; a =0.020; a =0.022; a =0.024.
0.00
0.10
0.20
0.30
0.40
0.50
0.60
0.70
0.80
0.90
1.00
0 5 10 15 20 25 30 35 40
F₸(τ)
τ [months]
0.024
0.022
0.020
0.018
a)
0.00
0.10
0.20
0.30
0.40
0.50
0.60
0.70
0.80
0.90
1.00
0 5 10 15 20 25 30 35 40
F₸(τ)
τ [months]
0.024
0.022
0.020
0.018
b)
0.00
0.10
0.20
0.30
0.40
0.50
0.60
0.70
0.80
0.90
1.00
0 5 10 15 20
F₸(τ)
τ [months]
0.024
0.022
0.020
0.018
c) Fig. 18 Fragility curves for: a) 1R8_D b) 1R8_UD; c) 2R7_D. No damage was recorded in 18 months on specimen 2R7_UD for the thresholds chosen. Fig. 18 presents the exceeding probability, described by a single Weibull distribution which seems to be rather unreliable for the specimen 1R8. This is, probably, due to the formation of the depressions, evident in Fig. 10 and in Fig. 12, that distort the loss. Maybe a mixture distribution could lead towards a more reliable prediction, because a mixture could be able to be sensitive to the different behaviors before and after the bigger detachment. The modeling of the exceeding probability for the damaged strip of the specimen 2R7 where the loss is more regular cycle by cycle, is more reliable, even if the initial surface roughness is higher for this specimen than the surface roughness of the specimen 1R8. However a mixture distribution could be even better also to model the decay of this specimen.
Conclusions
Preliminary results obtained through crystallization tests on concrete specimen put in evidence the variability of the specimen used with the same mix design. Probably the different behavior is connected with the different pore distribution and the thickness of the specimens that influenced the capillary rise and the salts crystallization in the material. The loss of material caused by swelling and detachment of cement paste or small aggregate in the specimen 1R8 is widespread on all surface, while in the specimen 2R7 it is concentrated along the borders. Also the probabilistic model of the damage confirms the lack of homogeneity of the specimens.
References
[1] M. Alexander, A. Bertron, RILEM TC 211-PAE, Final Conf. on Concrete in Aggressive Aqueous Environments - Performance, Testing and Modeling, Springer, 2013.
[2] E.F. Irassar, V.L. Bonavetti, M. Gonzalez, Microstructural study of sulfate attack on ordinary and limestone, Portland cements at ambient temperature, Cement and Concrete Research 33 (2003) 31-41.
[3] Y. Maltais, E. Samson, J. Marchand, Predicting the durability of Portland cement systems in aggressive environments-laboratory validation, Cement and Concrete Research 34 (2004) 1579-1589.
[4] E. Roziere, A. Loukili, R. El Hachem, F. Grondin, Durability of concrete exposed to leaching and external sulphate attacks, Cement and Concrete Research 39 (2009) 1188-1198.
[5] ACI Committee 201, Guide to durable concrete, ACI Mater J. 88 (1991) 54-82.
[6] G. W. Scherer, Stress from crystallization of salt, Cement and Concrete Research 34 (2004) 1613-1624.
[7] M. Collepardi, A state-of-the-art review on delayed ettringite attack on concrete, Cement and Concrete Composites 25 (2003) 401–407.
[8] P. Akpinar, I. Casanova, A combined study of expansive and tensile strength evolution of mortars under sulfate attack: implications on durability assessment, Materiales de Costrucciòn 60-297 (2010) 59-68.
[9] C. Yu, W. Sun, K. Scrivener, Mechanism of expansion of mortars immersed in sodium sulfate solutions, Cement and Concrete Research 43 (2013) 105-111.
[10] N. Cefis, C. Comi, C. Tedeschi, Modellazione del degrado nel calcestruzzo dovuto a formazione di ettringite secondaria, in: Atti del XII Congresso dell’Associazione Italiana di Meccanica Teorica e Applicata, Genova (Italia), 2015, pp. 488-497.
[11] F.P. Glasser, J. Marchand, E. Samson, Durability of concrete – Degradation phenomena involving detrimental chemical reactions, Cement and Concrete Research 38 (2008) 226-246.
[12] H. Haynes, R. O’Neil, P.K. Mehta, Concrete deterioration from physical attack by salts, Concrete Int., 18 (1996) 63–68.
[13] Y.J. Kim, M. Hossain, Y. Chi, Characteristics of CFRP-concrete interface subject to cold region environments including three-dimensional topography, Cold Regions Science and Technology 67 (2011) 37-48.
[14] RILEM MS-A.1, Determination of the resistence of wallettes against sulphates and chlorides, 1998.
[15] C. Tedeschi, L. Binda, D. Gulotta, L. Toniolo, Durability to salt decay of commercial ready-mixed mortars for the conservation of cultural heritage, in: J. Valek, C. Groot, J.J. Hughes (Eds.), 2nd Conf. on Historic Mortars - HMC 2010 and RILEM TC 203-RHM final workshop, Rilem Publication SARL, 2010, pp. 1015-1022.
[16] E. Garavaglia, B. Lubelli, L. Binda, Two Different Stochastic Approaches Modelling the Deterioration Process of Masonry Wall over Time, Materials and Structures, 35 (2002), 246-256.
[17] E. Garavaglia, A. Anzani, L. Binda, G. Cardani, Fragility curve probabilistic model applied to durability and long term mechanical damages of masonry, Materials and Structures, 41 (2008), 733-749.