APEC CHILE 2019 “Connecting People, Building Future” APEC ...

Gaps Assessment on APEC Energy Efficiency and Conservation Work Toward Fulfilling the
Leaders’ Energy Intensity Reduction GoalEnergy Working Group Submitted December 2017
APRIL 12, 2018 EGEE&C Meeting Washington D.C.

Introduction
Dr. Eugenie Birch, FAICP Amanda T. Lloyd, MCP, AICP Alon Abramson, MS
At the 19th APEC Economic Leaders' Meeting in 2011, leaders declared their aspiration to reduce energy intensity by 45 percent by 2035.
The report presents an assessment of gaps in energy efficiency and conservation work by the Energy Working Group, particularly the Expert Group on Energy Efficiency and Conservation (EGEE&C), to ensure continued progress toward the Leaders’ energy intensity reduction goal.
The study’s outcomes are designed to help the EWG and EGEE&C develop project priorities in areas most relevant to the needs facing the APEC region, and ultimately provide guidance to APEC economies on beneficial energy efficiency efforts.
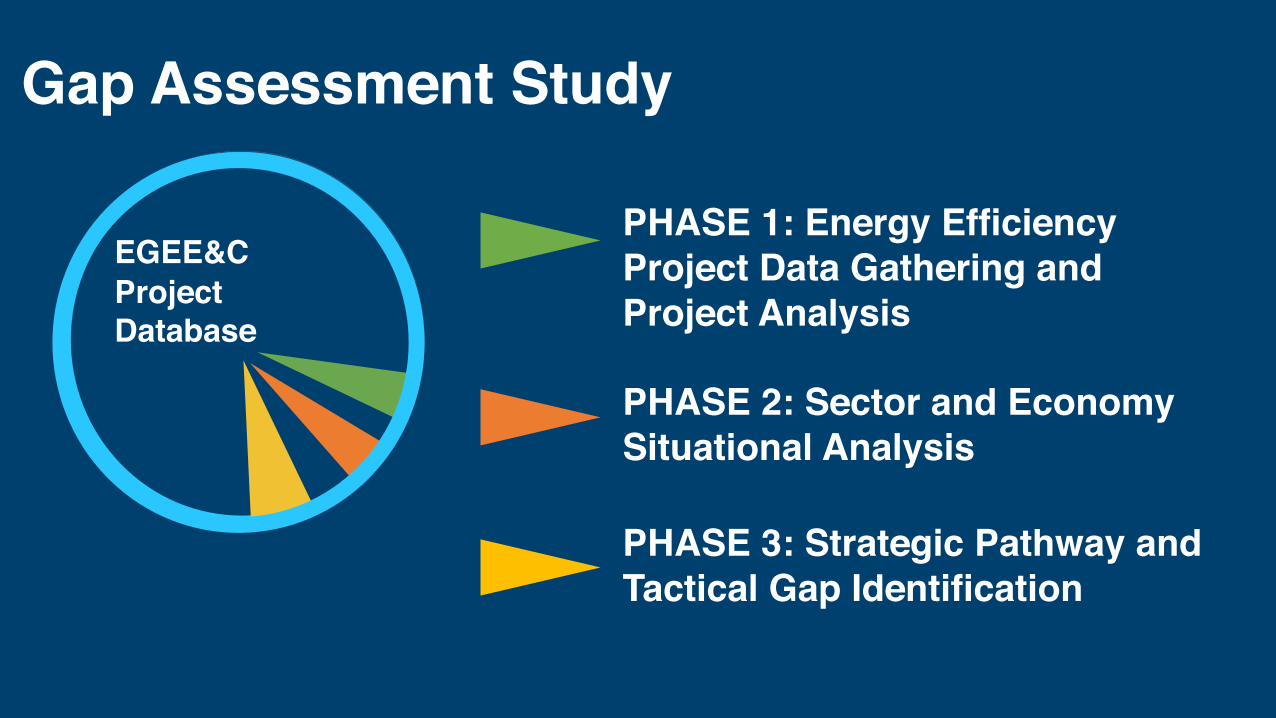
Gap Assessment Study
EGEE&C
ProjectDatabase
PHASE 1: Energy Efficiency Project Data Gathering and Project Analysis
PHASE 2: Sector and Economy Situational Analysis
PHASE 3: Strategic Pathway and Tactical Gap Identification

Gap Assessment Study
EGEE&C
ProjectDatabase PHASE 1: Energy
Efficiency Project Data Gathering and Project Analysis

Phase 1: Data Gathering, Project Analysis Database Development
3 Audiences Type Categories1. Appliances, Lighting, and Other Equipment2. Buildings3. Cross-Cutting/Low-Carbon Development4. Grid/Energy5. Industrial 6. Transportation 7. Government/Municipal8. Job Development/Education
1. Knowledge Transfer Mechanisms2. Knowledge Exchange Programs3. Joint Programs/Research4. Assisting Public Sector5. Assisting Private Sector6. International Organizational Links
6 Project Strategy Categories
8 Sector and Practice Categories
1. Knowledge Firms2. Manufactures/Businesses3. Policy Makers/Public Entities
25 sub-categories, but dominant category was #3.
Project Description1. Name, APEC Project Number2. Project Year. Project Funding3. Proposing and Participating Economies4. Summary Description

Phase 1: Data Gathering and Project AnalysisPROJECTS: 188DATES: 1993 - session 2, 2016 Examples of Project Analysis

Gap Assessment Study
EGEE&C
ProjectDatabase PHASE 2: Sector and
Economy Situational Analysis

Phase 2: Sector and Economy Situational Analysis
Critical Factors
International Energy Agency (IEA)
CONTEXT
DRIVERS
BARRIERS
OPPORTUNITIES
EMERGING TRENDS
SCALE
GLOBAL
APEC-WIDE
ECONOMY SPECIFIC

Phase 2: Sector and Economy Situational Analysis
BUILDINGS
TRANSPORTATION
INDUSTRY
DRIVERSTRENDS
Secto
ral
Macro-Economic
Technological
DemandSectorProfiles
Economy ProfilesREGULATIONS
POLICIES
SOCIO-ECONOMIC
APERC ENERGY SCENARIOS

Phase 2: Analysis BUILDING SECTOR Highlighted Drivers and Trends
six sub-sectors all considered to be high-energy intensity categories: Ironand Steel; Chemicals and Petrochemicals; Non-metallic Minerals; Food and Tobacco; Paper, Pulp,and Printing; and Non-ferrous metals
Urbanization and Development • Developed urban centers must deal with
retrofitting existing building stock while new urban areas must focus on new construction
Rising Incomes • As incomes rise, average household size
decrease, adding more units and appliances onto the grid, and increasing demand. Only 62/193 COP21 signatories have building energy codes
Geography and climate • Geography and climate drives heating
and cooling demands, priorities for building code standards and best available technologies
Energy Access • Increasing clean energy access
(electricity) is a U.N. New Urban Agenda goal, increasing demand. Many APEC economies have large populations that burn biomass (e.g. wood) for heating and cooking.

Assessment BUILDING SECTOR APERC Energy Efficiency Scenario Insights (projected to 2040)
APEC-Wide
Over 88% of the total sector efficiency gains come from seven economies • China (115 MToe) • United States (73 MToe) • Russia (21 MToe) • Japan (14 MToe) • Canada (12 Mtoe) • Indonesia (10 Mtoe) • Mexico (7 Mtoe)
Economy-level
Economies with the greatest efficiency gains from improving efficiency in the building sector are: • Hong Kong, China • Singapore • Malaysia • Canada • Japan

Phase 2: AnalysisTRANSPORTATION SECTOR Highlighted Drivers
Geography and land use planning ● Large land masses like Canada, United
States, China, Russia, and Australia increase demand for truck freight, air travel. Widely dispersed urban centers and sprawling development encourage driving without transit or rail investments.
Fuel standards and labeling ● An estimated 900+ million new LDVs are
expected in APEC by 2040, as vehicle ownerships rates rise with economic growth.
Economy Regulatory Environment ● Strong regulations in transit, rail,
incentives for new technologies like electric vehicles and smart fleet management
Public heath and emissions goals ● Commitments to air pollution and public
health investments; electric vehicles reduce emissions but places greater demand on electricity supply/grid and urban infrastructure

AssessmentTRANSPORTATION SECTOR APERC Energy Efficiency Scenario Insights (out to 2040)
Economy-level
● Five economies see 50+% of additional savings over BAU from transportation: Papua New Guinea (80%), Viet Nam (70%), Peru (64%), and Malaysia (57%).
● Six see nearly half of scenario savings from this sector: Australia (47%), Brunei Darussalam (46%), Mexico (47%), Thailand (46%), Singapore (45%), and Indonesia (43%).
APEC-WIDE – Road energy largest share
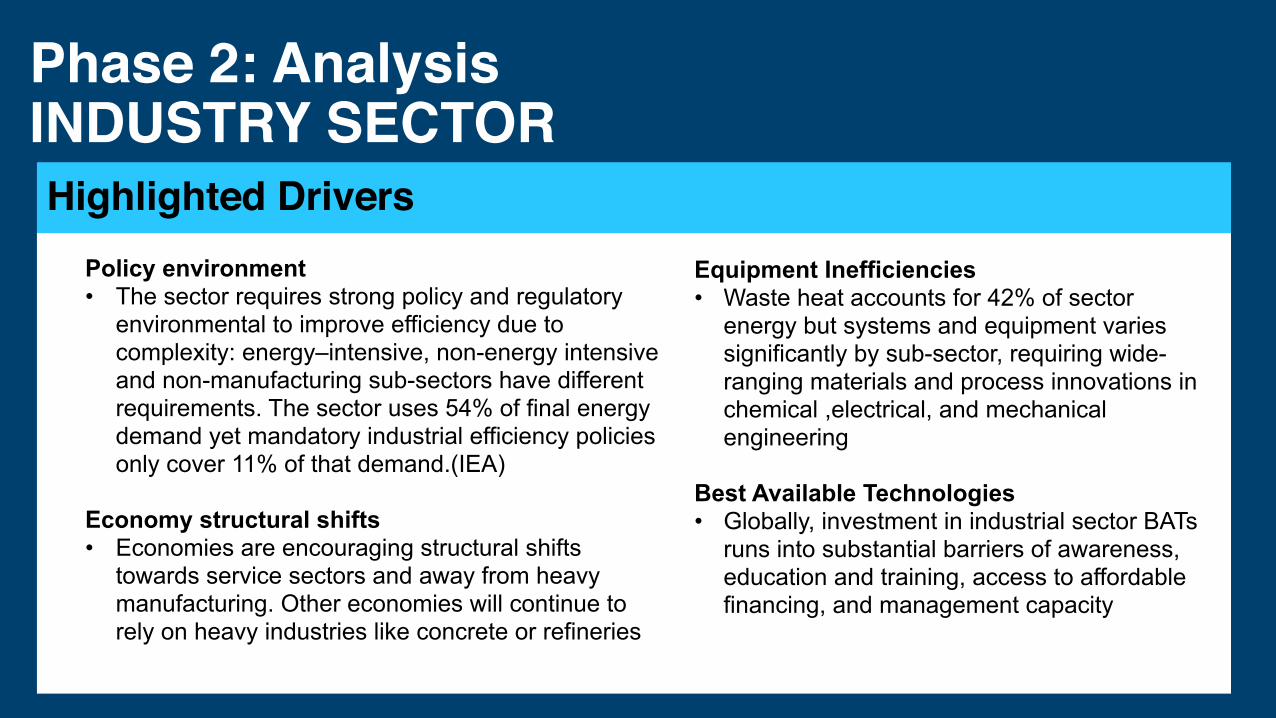
Phase 2: Analysis INDUSTRY SECTORHighlighted Drivers
Policy environment • The sector requires strong policy and regulatory
environmental to improve efficiency due to complexity: energy–intensive, non-energy intensive and non-manufacturing sub-sectors have different requirements. The sector uses 54% of final energy demand yet mandatory industrial efficiency policies only cover 11% of that demand.(IEA)
Economy structural shifts • Economies are encouraging structural shifts
towards service sectors and away from heavy manufacturing. Other economies will continue to rely on heavy industries like concrete or refineries
Equipment Inefficiencies • Waste heat accounts for 42% of sector
energy but systems and equipment varies significantly by sub-sector, requiring wide-ranging materials and process innovations in chemical ,electrical, and mechanical engineering
Best Available Technologies • Globally, investment in industrial sector BATs
runs into substantial barriers of awareness, education and training, access to affordable financing, and management capacity

Phase 2: AnalysisINDUSTRY SECTOR APERC Energy Efficiency Model Insight
six sub-sectors all considered to be high-energy intensity categories: Ironand Steel; Chemicals and Petrochemicals; Non-metallic Minerals; Food and Tobacco; Paper, Pulp,and Printing; and Non-ferrous metals
Widest range of potential sector savings across APEC:
Some economies do not see any additional savings (e.g. Hong Kong, China, and Papua New Guinea). China dominates sector savings: 53% of total sector demand and greatest coverage (37%) by mandatory efficiency regulations.
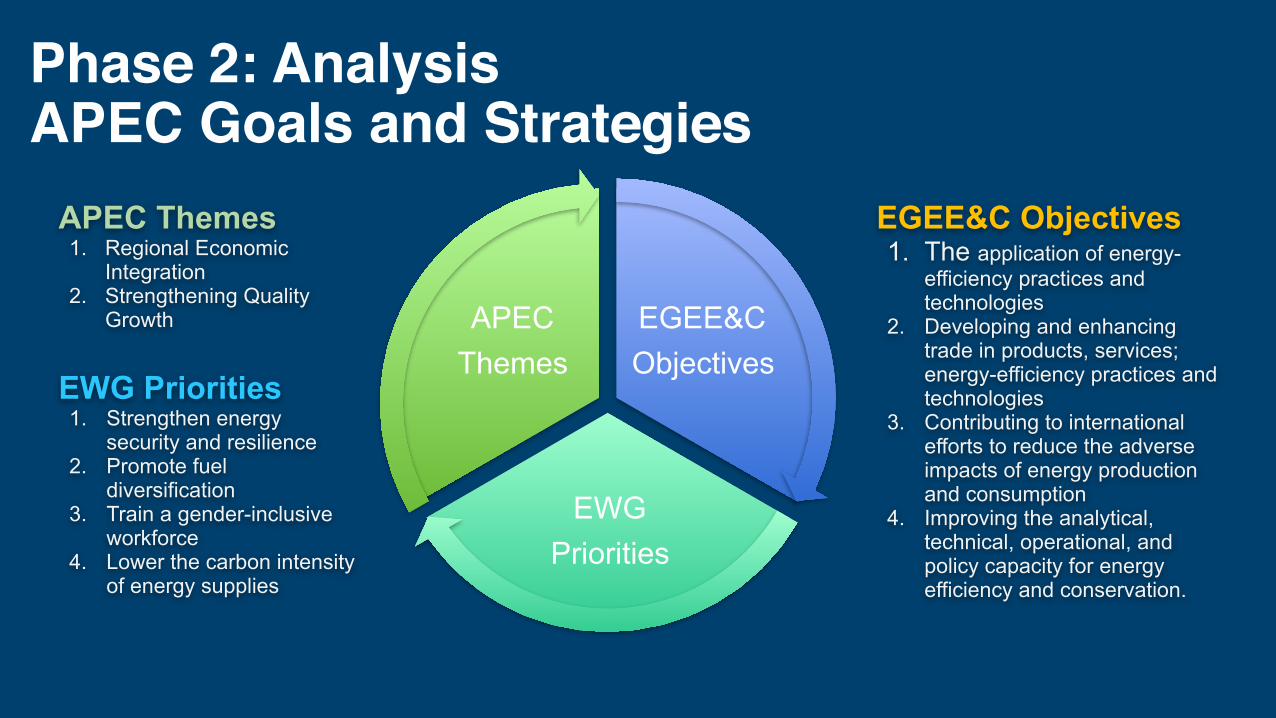
Phase 2: AnalysisAPEC Goals and Strategies
APEC Themes 1. Regional Economic
Integration 2. Strengthening Quality
Growth
EWG Priorities 1. Strengthen energy
security and resilience 2. Promote fuel
diversification 3. Train a gender-inclusive
workforce 4. Lower the carbon intensity
of energy supplies
EGEE&C Objectives 1. The application of energy-
efficiency practices and technologies
2. Developing and enhancing trade in products, services; energy-efficiency practices and technologies
3. Contributing to international efforts to reduce the adverse impacts of energy production and consumption
4. Improving the analytical, technical, operational, and policy capacity for energy efficiency and conservation.
EGEE&C Objectives
EWG Priorities
APEC Themes

DEMAND SECTOR DRIVERS
ECONOMIC PROFILES
Strategic and Tactical Gaps
APEC GOALS, OBJECTIVES
PROJECT ANALYSIS

Gap Assessment Study
EGEE&C
ProjectDatabase
PHASE 3: Strategic Pathway and Tactical Gap Identification
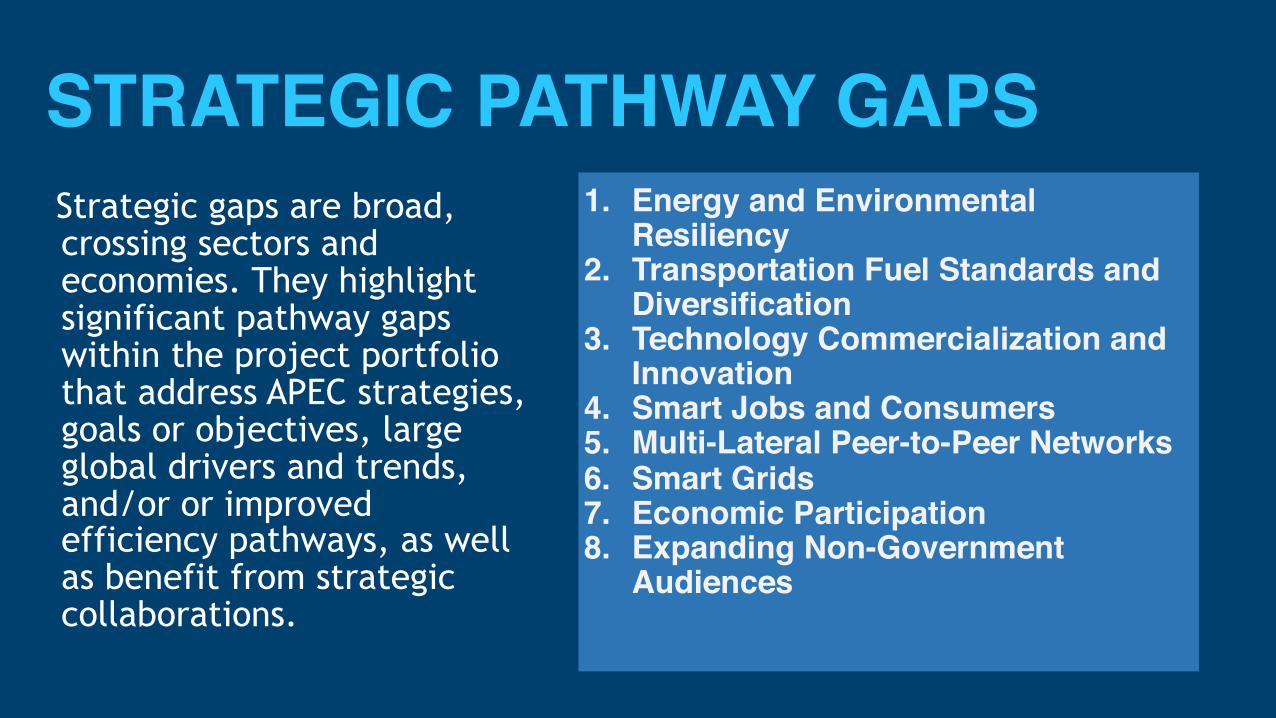
STRATEGIC PATHWAY GAPSStrategic gaps are broad, crossing sectors and economies. They highlight significant pathway gaps within the project portfolio that address APEC strategies, goals or objectives, large global drivers and trends, and/or or improved efficiency pathways, as well as benefit from strategic collaborations.
1. Energy and Environmental Resiliency
2. Transportation Fuel Standards and Diversification
3. Technology Commercialization and Innovation
4. Smart Jobs and Consumers 5. Multi-Lateral Peer-to-Peer Networks 6. Smart Grids 7. Economic Participation 8. Expanding Non-Government
Audiences

TACTICAL GAPSTactical gaps dig down deeper into sectors, and project categories, identifying finer-grained issues and more specific resources or practice gaps that can be addressed in the short-term. They are organized into three demand sectors and two cross-sector domains: 1. Buildings 2. Transportation 3. Industry4. Cross-cutting/Low Carbon 5. Appliances and Equipment

STRATEGIC GAPS1.Energy and Environmental Resiliency
Like ‘Smart Communities’, resiliency is a broad framework that encompasses multiple sectors across all economies.
Greater energy efficiency improves the resilience of communities to more effectively handle climate change and other stresses to physical, economic and cultural systems.
• The Energy Resiliency Task Force • Emergency Preparedness Working
Group Working Group Collaborations
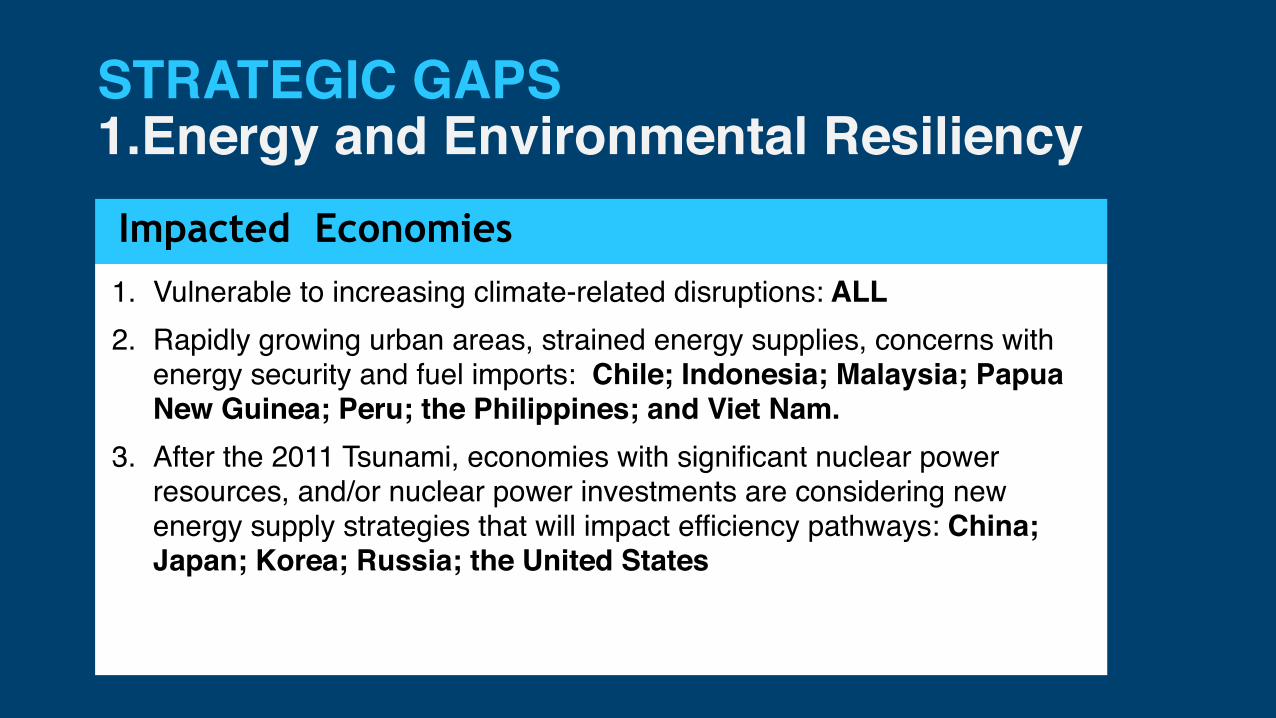
STRATEGIC GAPS1.Energy and Environmental ResiliencyImpacted Economies1. Vulnerable to increasing climate-related disruptions: ALL 2. Rapidly growing urban areas, strained energy supplies, concerns with
energy security and fuel imports: Chile; Indonesia; Malaysia; Papua New Guinea; Peru; the Philippines; and Viet Nam.
3. After the 2011 Tsunami, economies with significant nuclear power resources, and/or nuclear power investments are considering new energy supply strategies that will impact efficiency pathways: China; Japan; Korea; Russia; the United States

STRATEGIC GAPS2. Transportation Fuel Standards, Diversification
LDVs make up 73% of the transportation sector’s energy use in APEC economies and APERC forecasts that China (60%) and South East Asia (21%) will account for 80 percent of the 900 million new vehicles in APEC by 2040.
Working Group Collaborations
Transportation Working Group. Since 2010, projects sponsored by both the Transportation Working Group (TPTWG) and EWG have focused on intermodal strategies, electric vehicles (EV) infrastructure, and integration with low carbon land use planning. No projects deal specifically with fuel economy standards.

STRATEGIC GAPS2. Transportation Fuel Standards, Diversification
Impacted Economies
● Economies with rapidly growing vehicle ownership rates and/or economies with minimal fuel economy standards or labeling requirements: Australia; China; Indonesia; Malaysia; Papua New Guinea; Peru; Thailand; Viet Nam.

STRATEGIC GAPS3. Technology Commercialization and
Innovation
Technology commercialization and innovation – transforming research and intellectual assets into marketable ideas and products – is a gap across the project portfolio. Policy makers are the largest target audience for projects, with few private sector participants overall. Many outcome documents (particularly for low-carbon model towns) have identified significant private sector commercial or market barriers to implementation.
Working Group Collaborations
The Policy Partnership on Science, Technology and Innovation Working Group (PPSTI). Discussions with PPSTI around technology innovation and markets could identify opportunities for efficiency-related capacity training and workshops.

STRATEGIC GAPS3. Technology Commercialization and
Innovation
Impacted Economies
! While all economies should be concerned with technology and innovation, economies with high rates of Intellectual Property (IP) and strong research universities may be particularly interested in capturing the value of commercialization of energy efficiency innovations. ○ Four APEC economies were in the top 5 PCT (patent
cooperation treaty) patent applicants in 2016 (WIPO statistics): United States (1); Japan (2); China (3); Korea (5)

STRATEGIC GAPS3. Smart Jobs and Consumers
As the Energy Smart Communities Initiative and Low-Carbon Model town have demonstrated, cities rely on data analytics to build smart grids, buildings, transport, and industries.
APEC economies need resources to train energy efficiency installers, auditors, logistics managers, and many other professionals who can measure and certify energy performance, manage complex energy systems, and forecast and analyze energy use across communities.
Working Group Collaborations
Human Resources Development Working Group. (HRDWG) Developing 21st Century Knowledge and Skills For All
Policy Partnership on Women and the Economy Working Group (PPWEWG) The Working Group themes include “Breaking Barriers to Economic Integration of Women in the Global Market”; Financial, economic, digital literacy and inclusion for access to capital;
STRATEGIC GAPS4. Smart Jobs and Consumers
Impacted Economies
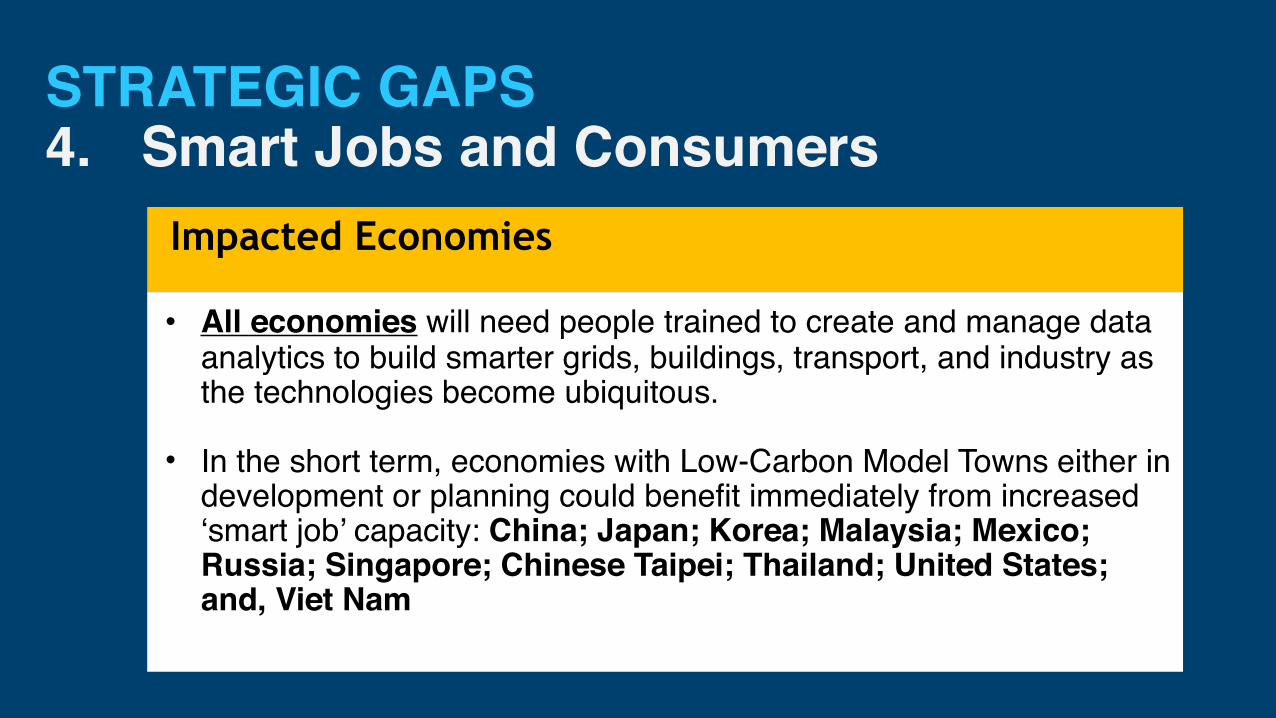
• All economies will need people trained to create and manage data analytics to build smarter grids, buildings, transport, and industry as the technologies become ubiquitous.
• In the short term, economies with Low-Carbon Model Towns either in development or planning could benefit immediately from increased ‘smart job’ capacity: China; Japan; Korea; Malaysia; Mexico; Russia; Singapore; Chinese Taipei; Thailand; United States; and, Viet Nam

STRATEGIC GAPS5. Multi-lateral Peer-to-Peer Networks
Projects that describe multi-lateral organization linkages have increased steadily since the launch of low-carbon initiatives. Only three projects before 2010 mentioned this type of collaboration. However, they appear to be on a largely ad hoc or project-by-project basis. The creation of agreements or regular joint professional symposia or training workshops could help formalize ties, strengthen relationships, and make expert outreach and collaborations easier to sustain.
Possible Collaborations
Multi-lateral organizations that have already been invited to work sessions and conferences include: SMES the International Energy Agency (IEA), World Bank, United Nations, OECD, ISO, Asia LEDS Forum, and the Asian Development Bank.
All economies will benefit from more cross-collaborations and peer-to-peer networks with other multilateral organizations

STRATEGIC GAPS6. Smart Grids
As APEC economies increase their investments in smart consumer technology, the demand sectors will become dependent on smart grid integration. Maintaining the strong strategic focus on supply-side barriers for smart grids can help ensure that demand side efficiency strategies stay aligned with supply side innovation and investments. Top concerns for utilities are technology obsolescence, interoperability and system security.
Collaboration and Implementation
Low Carbon Model Towns (LCMTs) emphasize the challenging market and technical barriers to successfully implementing smart grids, including incentives, policy, and consumer behavior in both new and emerging urban centers.
STRATEGIC GAPS6. Smart Grids
Impacted Economies
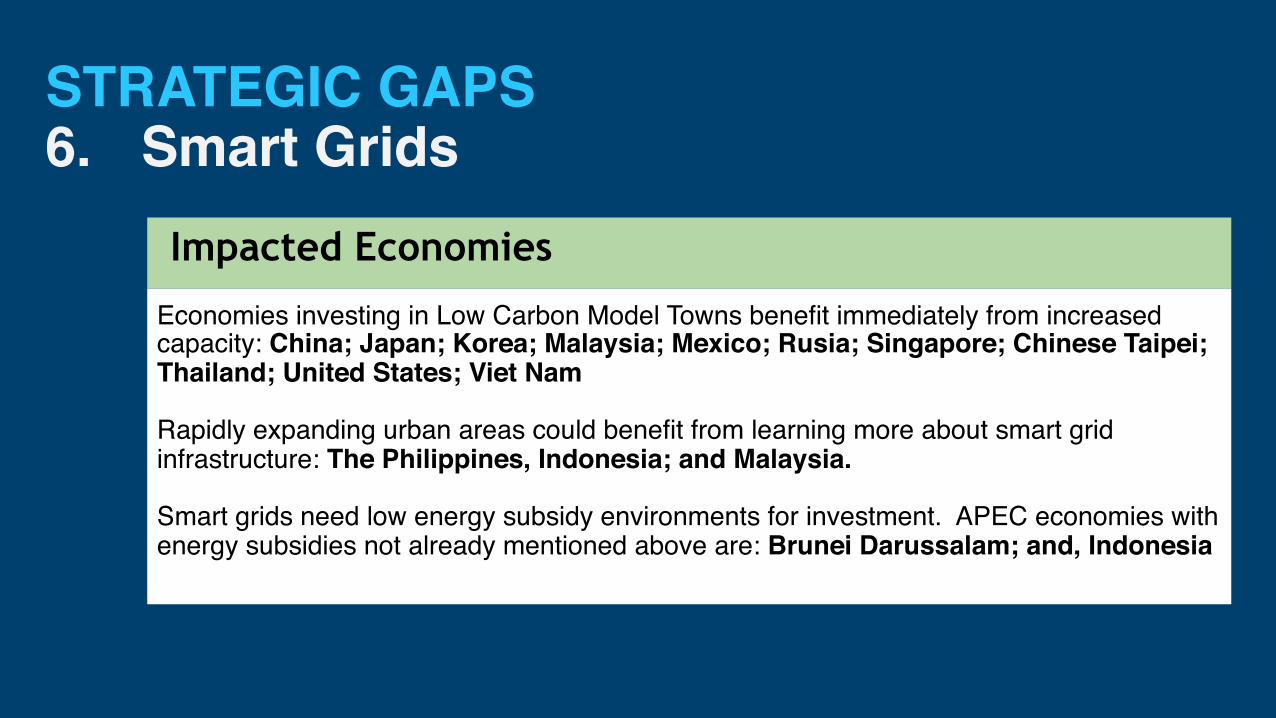
Economies investing in Low Carbon Model Towns benefit immediately from increased capacity: China; Japan; Korea; Malaysia; Mexico; Rusia; Singapore; Chinese Taipei; Thailand; United States; Viet Nam
Rapidly expanding urban areas could benefit from learning more about smart grid infrastructure: The Philippines, Indonesia; and Malaysia.
Smart grids need low energy subsidy environments for investment. APEC economies with energy subsidies not already mentioned above are: Brunei Darussalam; and, Indonesia

STRATEGIC GAPS7. Economic Participation
Over the last decade China, The United States, and Japan have proposed over 60% of the projects. Economies that have participated in fewer than 10% of projects are Brunei Darussalam; Canada; Hong Kong, China; Chile; Indonesia; Mexico; Malaysia; New Zealand; Russia; Singapore; and Viet Nam. There is no record of participation by Papua New Guinea.
As the 2016 APEC Supply and Demand Outlook and the PREE reports make clear, every economy has substantial energy efficiency opportunities and could benefit participating in workshops across all the demand sectors.
CollaborationCollaboration
Low participation reasons are hard to discern from project analysis or economy-sector profiles. However, many economies are very active in other Working Groups – identifying projects in which those Working Group interests overlap may increase interest in participating or proposing projects under EGEE&G.

STRATEGIC GAPS8. Expanding Non-Government Audiences
Policymakers are the primary audience for both capacity building and knowledge sharing. The history of APEC started around senior official and ministerial level dialogue and the Bogor Goals, created in 1994 to promote free and open trade.
The top two audiences for energy efficiency projects have been national energy offices and sub-national energy offices, distantly followed by NGOs and code officials.
With the focus on integrated smart communities, these audiences would benefit from increased participation by utilities, financial investors, commercial/private sector and academics to better understand the barriers and risks that other groups have identified such as investment risks, consumer behavior and communication barriers, utilities efficiencies, and energy efficiency policy and regulations at city and regional scales.

TACTICAL GAPS
1. Buildings 2. Transportation 3. Industry4. Cross-cutting/Low
Carbon 5. Appliances and
Equipment
TACTICAL GAPSBuildings
1. Building Envelopes (New and Existing): The IEA, in the tracking clean energy research, have rated building envelopes as “not on track” in 2017 to meet low-carbon emissions targets. Progress needs to happen more quickly and economies need to create clear signals that energy efficient building envelopes are critically important for energy intensity goals
2. Expanding Appliance Standards: The focus of standards and harmonization efforts has been on lighting, air conditioners, and refrigerators - with very successful results. There are seven major appliance categories - the previous three plus computers/monitors, televisions, clothes washers/dryers, and water heating, which need increased attention.
TACTICAL GAPSTransportation1. Light Duty Vehicle FUel Standards and Labeling: Across
APEC, LDVs are expected to increase by over 900 million vehicles by 2040 and APERC forecasts that the vast majority will be in China (60%) and South East Asia (21%). The sector also accounts for 23% of global CO2 emissions, making the sector critical in emissions reduction strategies.
1. Integrated Land Use Planning: In addition to integration into low carbon city town planning, opportunities to improve transportation system efficiencies will need to be continuously promoted in land use patterns in both urban and rural areas. The Transportation Working Group’s recent focus on intermodal issues such as supply chain connectivity, ports, aviation and shipping could be extended to land use planning to increase energy efficient smart community planning.

TACTICAL GAPSIndustry
1. Whole Sector Focus. The industrial sector, as a whole, is a gap. Since 1993, there have been only 20 industry sector projects. Unlike other sectors, the proportion of projects dropped after 2009 and those seven projects have no clear theme among them. A few projects focused on inefficiencies such as co-generation and combined heat and power.
Industry is the largest sector in the APEC region and it will remain so throughout the APEC outlook period, with a 1% annual average growth rate and one third of the energy demand in 2040. IEA research indicates that decoupling industrial production from CO2 emissions is critical to achieving targets.

TACTICAL GAPSCross-Cutting/Low-Carbon1. Complementing “cross-sector” frameworks with technical
capacity training: Cross-cutting low-carbon projects have dwarfed single or sector projects over the last seven to eight years. These projects have often resulted in 50, 60+ recommendations for filling policy gaps, promoting consumer behavior, and regulating technical standards. As a result, one of the frequent project outcomes has been requests for more technical capacity building to address to the challenges of the frameworks like Low Emissions Development (LED) and the LCMT.
2. Harmonizing frameworks with multi-lateral organizations: Continuing efforts to harmonize integrated energy and low-carbon development frameworks will help reduce trade barriers, increase cooperation, and support harmonization efforts within the energy efficiency domains such as appliance standards and testing, labeling programs and the adoption of initiatives such as NZEB.
TACTICAL GAPSAppliances & Equipment1. Internet-of-Things and Smart Appliances: Internet-connectivity
is changing the way appliances and equipment use energy. Smart communities will be “on” all the time through 24/7 monitoring, motion detectors, security, metering, sensors and other as-yet-to-be-determined options. Energy standards for appliances and systems will need to address internet use, security, and data protocols before they are integrated into smart grid management systems to ensure greater market update, interoperability, and regulation.
2. Industrial Equipment Standards and Labeling: The focus on industrial equipment has been low over the last twenty years; the main priority was building equipment such as refrigerators and lighting. According to the IEA, the industry sector currently uses 54% of global final energy demand. Equipment inefficiencies combine with mechanical and thermal limitations make this a major area of improvement.

In Summary A Unifying FrameworkThe impact of a unifying strategic framework in the project portfolio is clear.
The focus of the energy efficiency project portfolio shifted substantially with the launch of low-carbon pathways initiatives and the agreement by APEC leaders in 2011 to increase the 2007 energy intensity goal.
• A unified purpose and message • A clear set of cross-cutting sustainable community planning
criteria• Helps align APEC economies with widely varying sectors • Highlighted energy efficiency co-benefits within other APEC
Working Group priorities. • Reduced previous project gaps• Make analysis a little more complex, but worth the effort
INDUSTRY
GRIDS
BUILDINGSJOBS
TRANSPORT
SMART

Thank you
If you have any questions please contact : Cary Bloyd Senior Staff Scientist Pacific Northwest National Laboratory
The full report is available on APEC.org