Exploring Regional Equality: Determinants of the Rural-Urban Wage Gap
date post
21-Dec-2015Category
view
215download
0
Gap Analysis: GIS, maps and a new Gap Analysis: GIS, maps and a new view of regional conservationview of regional conservation
Southwest Regional GAP ProjectArizona, Colorado, Nevada, New Mexico, Utah
US-IALE 2004, Las Vegas, Nevada: Transdisciplinary Challenges in Landscape Ecology
Kathryn Thomas
U.S. Geological Survey
Southwest Biological Science Center

What is a gap?What is a gap?
A “gap” is the lack of representation or under-representation of vegetation types or vertebrate species, the biotic
elements of biological diversity, on lands managed for conservation
How do we analyze gaps?How do we analyze gaps?
Gap analysis identifies the gaps through a spatial analysis. The land cover map is intersected with the stewardship
map and the vertebrate habitat maps are intersected with the stewardship map.
What is the fundamental assumption?What is the fundamental assumption?
The best time to ensure a biotic element (vegetation types or vertebrate species) does not become endangered is
while it is still relatively common. GAP does not determine what is adequate representation for the biodiversity elements.

Five steps to identifying conservation gapsFive steps to identifying conservation gaps
• Map land cover
• Map vertebrate species distribution
• Map land stewardship and management status
• Conduct the gap analysis
• Make map products and gap analysis results available and facilitate their implementation

Summary tables
Total mapped area of each biodiversity element in different land stewardship and
management status categories
Representation of biotic element with respect to management status
0 - <1%
1 - < 10%
10 - < 20%
20 - < 50%
> = 50%
The processThe process The productsThe products

Land stewardship
Management status
How much biotic conservation lands exist for the How much biotic conservation lands exist for the study area and who manages them?study area and who manages them?

Land stewardship/Management status: Example from Land stewardship/Management status: Example from first generation New Mexico GAPfirst generation New Mexico GAP

Land cover (ecological systems)
Land Stewardship/Management status
Who are the stewards of the ecological Who are the stewards of the ecological systems?systems?
How is each ecological system represented How is each ecological system represented among the management status categories?among the management status categories?

Land cover/Land stewardship: Example from Land cover/Land stewardship: Example from first generation New Mexico GAPfirst generation New Mexico GAP

Land cover/Management status: Example from Land cover/Management status: Example from first generation New Mexico GAPfirst generation New Mexico GAP

Vertebrate Species Predicted Habitat
Land stewardship/Management status
Who are the stewards of vertebrate habitat?Who are the stewards of vertebrate habitat?
How is each vertebrate habitat represented How is each vertebrate habitat represented among the management status categories?among the management status categories?

Status 1 Status 2 Status 3 Status 4
Common Name Scientific Name Statewidearea (ha) Area
(ha)% Area
(ha)% Area (ha) % Area (ha) %
Bullfrog Rana catesbeiana 412,442 1,407 0.34 15,241 3.7 46,000 11.15 349,794 84.81
Barking frog Eleutherodactylus augusti 1,003,862 3,302 0.33 9,051 0.9 465,952 46.42 525,557 52.35
Western chorus frog Pseudacris triseriata 9,613,323 125,311
1.3 471,502 4.9 3,130,369 32.56 5,886,141 61.23
Northern cricket frog Acris crepitans 20,113 0 0 1,733 8.62 5,657 28.13 12,723 63.26
Chiricahua leopard frog Rana chiricahuensis 26,608 1,891 7.11 816 3.07 12,166 45.72 11,735 44.1
Vertebrate habitat/Management status: Example Vertebrate habitat/Management status: Example from first generation New Mexico GAPfrom first generation New Mexico GAP

Common name
Scientific name
Statewide area (ha)
BLM
NPS
FWS
USFS
Military
State Park
State Trust
St. Wild. Area
Tribal
Private
Bullfrog
Rana catesbeiana
412,442
4.810
0.110
2.450
2.100
0.200
0.030
2.860
0.560
9.980
72.000
Barking frog
Eleutherodactylus augusti
1,003,862
45.470
0.330
0.000
0.030
0.010
0.005
21.230
0.060
0.000
31.120
Western chorus frog
Pseudacris triseriata
9,613,323
8.620
0.340
0.230
28.020
0.130
0.010
7.960
0.180
9.850
44.420
Northern cricket frog
Acris crepitans
20,113
13.100
0.000
0.000
0.000
0.000
0.000
6.500
0.130
0.000
56.750
Chiricahua leopard frog
Rana chiricahuensis
26,608
9.600
0.000
0.000
45.970
0.000
0.000
4.960
0.020
0.000
39.450
Vertebrate habitat/Land stewardship: Example Vertebrate habitat/Land stewardship: Example from first generation New Mexico GAPfrom first generation New Mexico GAP

Where are the protected lands in relationship Where are the protected lands in relationship to the distribution of the vegetation types and to the distribution of the vegetation types and vertebrate species?vertebrate species?

% distribution on BLM: 81%
% protected statewide: 0.5%
% BLM protected: 0.0%
Saltbush Fans & Flats
Protected lands
Spatial view of land cover: Example from first Spatial view of land cover: Example from first generation Wyoming GAPgeneration Wyoming GAP
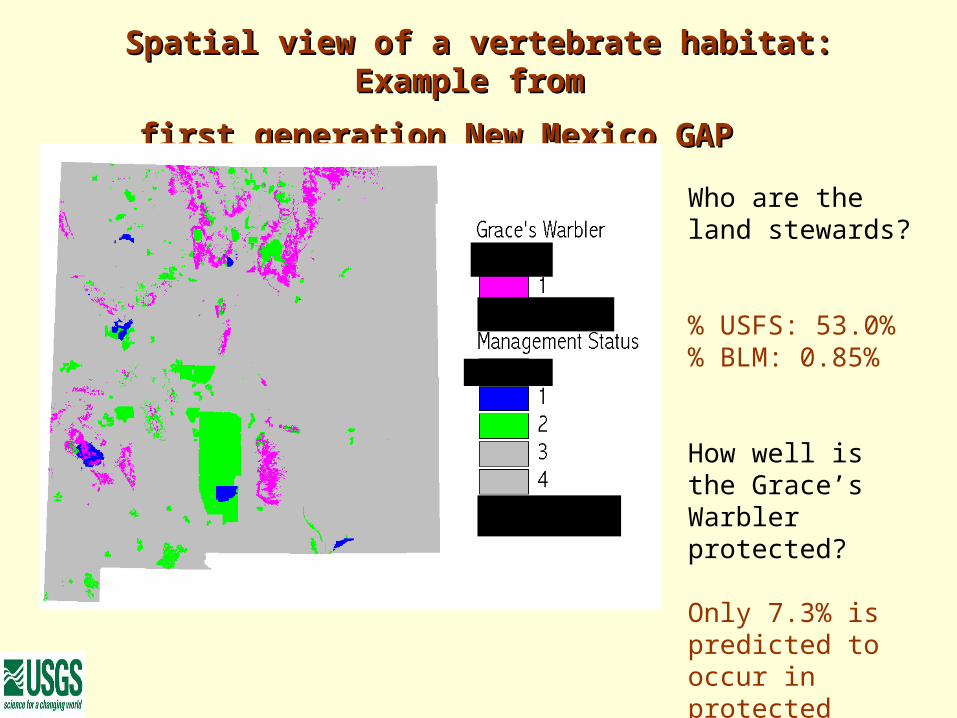
Spatial view of a vertebrate habitat: Example from Spatial view of a vertebrate habitat: Example from
first generation New Mexico GAPfirst generation New Mexico GAP
Who are the land stewards?
% USFS: 53.0%% BLM: 0.85%
How well is the Grace’s Warbler protected?
Only 7.3% is predicted to occur in protected (1&2) areas

Limitations of gap analysisLimitations of gap analysis
•Does not specifically assess habitat quality •Should not replace for intensive local inventories or single species diversity planning•Is not a nationwide inventory of biological resources•Does not provide an accuracy assessment of analysis results•Does not account for historic losses in range/aerial extent•Does not predict biotic element variability

Unique features of a gap analysisUnique features of a gap analysis
•Provide information on common and/or ordinary species•Provide quantitative data on the biotic elements of an area•Provides data throughout the range of a vertebrate species or vegetation type•Can be done on local, state, regional or national extent

SWReGAPSWReGAP
• Stewardship• Management status• Stewardship of ecological types• Management status of ecological types• Stewardship of vertebrate habitat• Management status of vertebrate habitat

Gap analysis and conservation planningGap analysis and conservation planning
• Are biotic elements well represented within protected (status 1 and 2) lands?
• What conservation opportunities exist on status 3 managed lands?
• What opportunities exist for private landowners to contribute to conservation of biotic elements?