GAO-17-424, DRINKING WATER: Additional Data and ...
103
DRINKING WATER Additional Data and Statistical Analysis May Enhance EPA's Oversight of the Lead and Copper Rule Report to Congressional Requesters September 2017 GAO-17-424 United States Government Accountability Office
Transcript of GAO-17-424, DRINKING WATER: Additional Data and ...

DRINKING WATER
Additional Data and Statistical Analysis May Enhance EPA's Oversight of the Lead and Copper Rule
Report to Congressional Requesters
September 2017
GAO-17-424
United States Government Accountability Office

United States Government Accountability Office
Highlights of GAO-17-424, a report to congressional requesters
September 2017
DRINKING WATER
Additional Data and Statistical Analysis May Enhance EPA’s Oversight of the Lead and Copper Rule
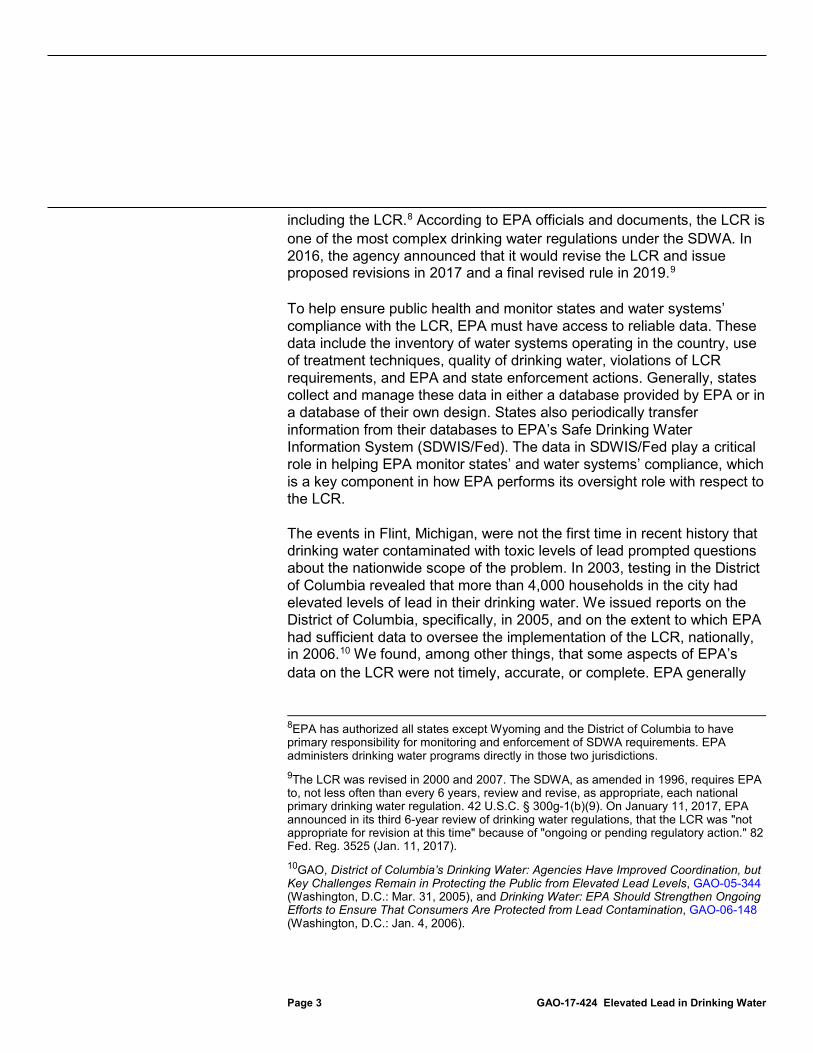
What GAO Found Available Environmental Protection Agency (EPA) data, reported by states, show that of the approximately 68,000 drinking water systems subject to the Lead and Copper Rule (LCR), at least 10 percent had at least one open violation of the rule; however these and other data are not complete. When the LCR was promulgated in 1991, all water systems were required to collect information about the infrastructure delivering water to customers, including lead pipes (see figure). However, because the LCR does not require states to submit information on known lead pipes to EPA, the agency does not have national-level information about lead infrastructure. After the events in Flint, Michigan, and other cities, EPA asked states to collect information on the locations of lead pipes, and all but nine, which had such difficulties as finding historical documentation, indicated a plan or intent to fulfill the request. According to EPA guidance, knowledge of lead pipes is needed for studies of corrosion control. GAO reported in March 2013 that with limited funding for federal programs, the need to target such funds efficiently increases. By EPA requiring states to report data on lead pipes, key decision makers would have information about the nation’s lead infrastructure.
Example of Potential Lead in the Pipe Infrastructure from Source to Homes
Through discussion groups, state regulators identified 29 factors that may contribute to water systems’ noncompliance with the LCR. In conducting a statistical analysis using EPA data on selected factors, such as the size of the population served and type of source water, GAO found that such factors were associated with a higher likelihood of water systems having reported violations of the LCR. EPA’s current approach to oversight of the LCR targets water systems with sample results that exceed the lead action level. While this approach is reasonable because such water systems have a documented lead exposure risk, EPA officials in 3 of the 10 regional offices told GAO that it is not sustainable over time because of limited resources. Under federal standards for internal control, management should identify, analyze, and respond to risks related to achieving the defined objectives. By developing a statistical analysis that incorporates multiple factors to identify water systems that might pose a higher likelihood for having reported violations of the LCR to supplement its current approach, EPA could better target its oversight to such water systems.
View GAO-17-424. For more information, contact Alfredo Gómez at (202) 512-3841 or [email protected].
Why GAO Did This Study Drinking water contaminated with lead in Flint, Michigan, renewed awareness of the danger lead poses to the nation’s drinking water supply. Lead exposure through drinking water is caused primarily by the corrosion of plumbing materials, such as pipes, that carry water from a water system to pipes in homes. EPA set national standards to reduce lead in drinking water with the LCR, which applies to all water systems providing drinking water to most of the U.S. population, except places where people do not remain for long, such as campgrounds. States generally have primary responsibility for enforcing the LCR, and data help EPA monitor states’ and systems’ compliance with the LCR.
GAO was asked to review the issue of elevated lead in drinking water. Among other objectives, this report examines (1) what available EPA data show about LCR compliance among water systems and (2) factors that may contribute to LCR noncompliance. GAO analyzed EPA data on violations and enforcement of the LCR from July 1, 2011, through December 31, 2016, interviewed EPA officials in headquarters and the 10 regional offices; conducted a statistical analysis of the likelihood of reported LCR violations; and held discussion groups with a nonprobability sample of regulators representing 41 states.
What GAO Recommends GAO is making three recommendations, including for EPA to require states to report data on lead pipes and develop a statistical analysis on the likelihood of LCR violations to supplement its current oversight. EPA agreed with GAO’s recommendations.

Page i GAO-17-424 Elevated Lead in Drinking Water
Letter 1
Background 6 Available EPA Data Show Sample Results, Use of Corrosion
Control, Violations, and Enforcement Actions Taken, but Data Are Not Complete 19
EPA Uses Available Data to Monitor Compliance with the LCR, and Officials Said That They Have Increased the Use of Data in the Last Year 30
Certain Factors May Contribute to Water Systems’ Noncompliance with the LCR 33
Conclusions 40 Recommendations for Executive Action 41 Agency Comments 42
Appendix I Objectives, Scope, and Methodology 45
Appendix II Additional Analysis of Available EPA Data on Reported Sample Results, Violations, and Enforcement for the Lead and Copper Rule 53
Appendix III Key Factors State Regulators Identified That May Contribute to Noncompliance with the Lead and Copper Rule 62
Appendix IV Content Analysis of the Transcripts of Discussion Groups on Factors That May Contribute to Noncompliance with the Lead and Copper Rule 76
Appendix V Statistical Analysis to Identify Water Systems with a Higher Likelihood for LCR Violations 79
Appendix VI EPA Guidance to the Public on Addressing Lead in Drinking Water 89
Contents

Page ii GAO-17-424 Elevated Lead in Drinking Water
Appendix VII Comments from the Environmental Protection Agency 92
Appendix VIII GAO Contact and Staff Acknowledgments 95
Related GAO Products 96
Tables
Table 1: Factors Most Frequently Identified by State Regulators in GAO’s Review That May Contribute to Noncompliance with the Lead and Copper Rule 34
Table 2: Water Systems Included in GAO’s Analysis of EPA’s SDWIS/Fed Data as of December 31, 2016 46
Table 3: EPA’s 10 Regional Offices and the States and Territories within Those Regions 49
Table 4: Water Systems Reporting Sample Results over the Lead and Copper Rule’s Lead Action Level, from January 1, 2014, to December 31, 2016 54
Table 5: Water Systems (Including Schools and Day Care Centers) with Reported Sample Results Exceeding the Lead Action Level of 15 Parts per Billion in EPA’s SDWIS/Fed, by Region and Size, from January 1, 2014 to December 31, 2016 55
Table 6: Medium and Large Water Systems Reporting Sample Results under the Lead and Copper Rule’s Lead Action Level, 2016 56
Table 7: Number of Water Systems (Including Schools and Day Care Centers) with at Least One Open LCR Violation Reported in EPA’s SDWIS/Fed, by Size, as of December 31, 2016 57
Table 8: Number of Schools and Day Care Centers with at Least One Open LCR Violation Reported in EPA’s SDWIS/Fed, as of December 31, 2016 58
Table 9: EPA Data on Federal and State Enforcement Actions and Outcomes Reported in EPA’s 10 Regions, from July 1, 2011, to December 31, 2016 59

Page iii GAO-17-424 Elevated Lead in Drinking Water
Table 10: The Five Most Frequently Reported Enforcement Actions Taken by States for LCR Violations Reported in EPA’s SDWIS/Fed, from July 1, 2011, to December 31, 2016 60
Table 11: Water Systems Designated as Returned to Compliance for at Least One Violation in the EPA’s SDWIS/Fed, by Size, from July 1, 2011, to December 31, 2016 61
Table 12: Factors Most Frequently Identified by State Regulators as Contributing to Noncompliance of the Lead and Copper Rule (LCR) 65
Table 13: Additional Factors Identified by State Regulators as Contributing to Noncompliance with the Lead and Copper Rule (LCR) 71
Table 14: Factors Identified by State Regulators as Contributing to Compliance with the Lead and Copper Rule (LCR) 75
Table 15: Accuracy of Logistic Regression Models in Predicting Lead and Copper Rule (LCR) Violations from January 1, 2015, to December 31, 2016 87
Figures
Figure 1: Example of How a Water System Delivers Drinking Water 8
Figure 2: Lead and Copper Rule Requirements for Water Systems, Including Schools and Day Care Centers with Their Own Water Supplies 12
Figure 3: Typical Responsibilities of Key Stakeholders in Implementing the Lead and Copper Rule 17
Figure 4: Factors That May Influence Compliance with the Lead and Copper Rule, as Identified by State Regulators 64
Figure 5: Example of Information about Lead Hazards in Drinking Water for the Public from the Environmental Protection Agency’s Website 90

Page iv GAO-17-424 Elevated Lead in Drinking Water
Abbreviations CDC Centers for Disease Control and Prevention EPA Environmental Protection Agency LCR Lead and Copper Rule SDWIS/Fed Safe Drinking Water Information System SDWIS Prime Safe Drinking Water Information System Prime SDWA Safe Drinking Water Act
This is a work of the U.S. government and is not subject to copyright protection in the United States. The published product may be reproduced and distributed in its entirety without further permission from GAO. However, because this work may contain copyrighted images or other material, permission from the copyright holder may be necessary if you wish to reproduce this material separately.

Page 1 GAO-17-424 Elevated Lead in Drinking Water
441 G St. N.W. Washington, DC 20548
September 1, 2017
Congressional Requesters
The discovery of drinking water contaminated with toxic levels of lead in the city of Flint, Michigan, renewed awareness about the danger that lead poses to public health when it enters drinking water. The severe adverse health effects associated with even low levels of exposure to lead are widely known by health experts. Lead poses the greatest risk to infants, young children under the age of 6, and pregnant women because it can cause learning and behavioral problems in children and premature birth in pregnant women, among other physiological effects. Lead exposure through the drinking water supply occurs primarily through the corrosion of pipes that systems use to deliver water to customers, pipes inside of a household or building, or plumbing fixtures.1 The total number of lead pipes is unknown. However, according to estimates in an April 2016 study, there are at least 6.1 million homeowner- and water system-owned pipes with lead that deliver drinking water to about 15 million to 22 million people—5 to 7.5 percent of the nation’s population.2 Industry estimates indicate that the average cost to replace each of these pipes at about $5,000, which would mean a total cost of at least an estimated $30 billion nationwide.3
As part of the 1986 amendments to the Safe Drinking Water Act (SDWA), Congress authorized the Environmental Protection Agency (EPA) to set
1Lead exposure occurs through various pathways, including soil, dust, food, and drinking water. The Environmental Protection Agency estimates that drinking water can make up 20 percent or more of a person’s total exposure to lead. Infants who consume mostly mixed formula can receive 40 percent to 60 percent of their exposure to lead from drinking water. 2David A. Cornwell, Richard A. Brown, and Steve H. Via, National Survey of Lead Service Line Occurrence, Journal American Water Works Association, vol. 108, no. 4 (2016), pp.E182-pp.E191. 3The American Water Works Association, an organization representing water professionals, provided this mid-range estimate in an article in the January/February 2017 edition of the Environmental Law Institute’s Policy Journal, The Environmental Forum.
Letter

Page 2 GAO-17-424 Elevated Lead in Drinking Water
national standards to reduce lead in drinking water under a 1991 treatment technique rule,4 known as the Lead and Copper Rule (LCR).5 Of the estimated 151,000 water systems operating in the United States, the LCR applies to about 68,000 water systems (about 45 percent of all water systems).6 The LCR does not apply to an estimated 83,000 water systems (about 55 percent of all water systems) that provide water in a place, such as a gas station or campground, where people do not remain for long periods of time. Approximately 8,000 of the 68,000 water systems are schools and daycare facilities with their own water supplies, according to EPA.7 In total, the LCR applies to water systems serving about 312 million people, most of the U.S population. EPA has indicated that there are no safe levels of lead in drinking water. Therefore, the LCR requires water systems to monitor drinking water at customers’ taps and, if lead levels are higher than the LCR allows, to take additional actions to control corrosion, inform the public, and in some circumstances replace lead service lines under the systems’ control. States generally have primary responsibility for monitoring and enforcement of SDWA requirements,
4See 40 C.F.R. pt. 141, subpt I. The Lead and Copper Rule also includes requirements to minimize copper in drinking water. This report examines only the requirements applicable to lead. 5In addition to EPA, other federal agencies play a role in reducing the effects of lead. The U.S. Department of Housing and Urban Development, among other things, enforces regulations aimed at preventing lead exposure through paint and paint chips and dust, the largest contributor of lead exposure, particularly for children. The Centers for Disease Control and Prevention, an agency within the U.S. Department of Health and Human Services, is responsible for developing lead poisoning prevention programs and policies, collecting and tracking state data on blood lead levels in children nationwide, and providing funding to state and local health departments. 6EPA classifies water systems according to the number of people they serve and whether they serve the same customers year-round or on an occasional basis. A community water system supplies water to the same population year-round. A non-transient non-community water system regularly supplies water to at least 25 of the same people at least 6 months per year and includes schools, office buildings, and hospitals that have their own water systems. According to data in EPA’s Safe Drinking Water Information System as of December 31, 2016, there were 50,017 community water systems and 17,564 non-transient, non-community water systems in the United States. A large system serves more than 50,000 people, a medium system serves from 3,301 to 50,000 people, and a small system serves 3,300 to 25 people. In this report, when we reference any water systems, we are referring to those subject to the LCR. 7According to EPA’s website, as of May 2017, there were an estimated 98,000 public schools and 500,000 child care centers not regulated under the SDWA.
Page 3 GAO-17-424 Elevated Lead in Drinking Water
including the LCR.8 According to EPA officials and documents, the LCR is one of the most complex drinking water regulations under the SDWA. In 2016, the agency announced that it would revise the LCR and issue proposed revisions in 2017 and a final revised rule in 2019.9
To help ensure public health and monitor states and water systems’ compliance with the LCR, EPA must have access to reliable data. These data include the inventory of water systems operating in the country, use of treatment techniques, quality of drinking water, violations of LCR requirements, and EPA and state enforcement actions. Generally, states collect and manage these data in either a database provided by EPA or in a database of their own design. States also periodically transfer information from their databases to EPA’s Safe Drinking Water Information System (SDWIS/Fed). The data in SDWIS/Fed play a critical role in helping EPA monitor states’ and water systems’ compliance, which is a key component in how EPA performs its oversight role with respect to the LCR.
The events in Flint, Michigan, were not the first time in recent history that drinking water contaminated with toxic levels of lead prompted questions about the nationwide scope of the problem. In 2003, testing in the District of Columbia revealed that more than 4,000 households in the city had elevated levels of lead in their drinking water. We issued reports on the District of Columbia, specifically, in 2005, and on the extent to which EPA had sufficient data to oversee the implementation of the LCR, nationally, in 2006.10 We found, among other things, that some aspects of EPA’s data on the LCR were not timely, accurate, or complete. EPA generally
8EPA has authorized all states except Wyoming and the District of Columbia to have primary responsibility for monitoring and enforcement of SDWA requirements. EPA administers drinking water programs directly in those two jurisdictions. 9The LCR was revised in 2000 and 2007. The SDWA, as amended in 1996, requires EPA to, not less often than every 6 years, review and revise, as appropriate, each national primary drinking water regulation. 42 U.S.C. § 300g-1(b)(9). On January 11, 2017, EPA announced in its third 6-year review of drinking water regulations, that the LCR was "not appropriate for revision at this time" because of "ongoing or pending regulatory action." 82 Fed. Reg. 3525 (Jan. 11, 2017). 10GAO, District of Columbia’s Drinking Water: Agencies Have Improved Coordination, but Key Challenges Remain in Protecting the Public from Elevated Lead Levels, GAO-05-344 (Washington, D.C.: Mar. 31, 2005), and Drinking Water: EPA Should Strengthen Ongoing Efforts to Ensure That Consumers Are Protected from Lead Contamination, GAO-06-148 (Washington, D.C.: Jan. 4, 2006).

Page 4 GAO-17-424 Elevated Lead in Drinking Water
agreed with our findings and recommendations. In response, EPA took some steps to improve the data, as discussed later in the report.
You asked us to review the issue of elevated lead in drinking water, and this report is the first in a series to respond to your request.11 Our objectives were to examine (1) what the available EPA data show about compliance with and enforcement of the LCR among water systems, including schools; (2) how EPA uses these data to monitor compliance; and (3) factors, if any, that may contribute to water systems’ noncompliance with the LCR.
To examine what the available EPA data show about reported compliance with and enforcement of the LCR, including among water systems and schools (and day care centers) with their own water supplies, we reviewed LCR data for community water systems and non-transient non-community water systems listed as active in EPA’s SDWIS/Fed database from July 1, 2011, to December 31, 2016, because the period provides the most recent available compliance data without a change in the regulations.12 To assess the reliability, completeness, and accuracy of LCR compliance data in SDWIS/Fed, we interviewed EPA officials and reviewed EPA data reliability assessments, recent EPA file reviews for selected states, a 2017 EPA OIG report on the reliability of SDWIS/Fed compliance data, data verification reports and our past reports on the reliability of the data in SDWIS/Fed.13 According to these recent EPA assessments, the EPA OIG report, and our January 2006 and June 2011 reports, 14 some of the data in the SDWIS/Fed database are not complete. In part, because of the incompleteness of reported data on
11We have ongoing work on testing and monitoring for lead hazards in the majority of the nation’s K-12 public schools that are not subject to the LCR. 12The data we analyzed correspond to systems listed as active in SDWIS/Fed as of December 31, 2016; but the violations data we analyzed corresponded to events that took place over a wider span of time. Specifically, some of the violations data that we analyzed corresponded to compliance period begin dates as early as 1986. We included all violations in our analysis with a compliance status code of “O” (open) or “K” (known), regardless of the compliance period begin date. 13Environmental Protection Agency, Office of Inspector General, EPA Is Taking Steps to Improve State Drinking Water Program Reviews and Public Water Systems Compliance Data, 17-P-0326 (Washington, D.C.: July 18, 2017). 14GAO-06-148 and Drinking Water: Unreliable State Data Limit EPA’s Ability to Target Enforcement Priorities and Communicate Water Systems’ Performance. GAO-11-381. Washington, D.C.: June 17, 2011.

Page 5 GAO-17-424 Elevated Lead in Drinking Water
sample results, violations, and enforcement actions we found the data to be of undetermined reliability and we note specific limitations to the data in the body of this report. In this report we describe the available data about water systems’ compliance with the LCR and EPA’s enforcement actions as they are reported in SDWIS/Fed.
To examine how EPA uses these data to monitor compliance, we interviewed officials from EPA headquarters and its 10 regional offices on the agency’s approach to enforcing the LCR. To identify any factors that may contribute to noncompliance with the LCR, we conducted discussion groups with a nonprobability sample of state drinking water regulators representing 41 states and 1 territory.15 Findings from the discussion groups cannot be generalized to all state regulators but provide illustrative examples. We conducted a literature review of 31 studies about the detection of lead in drinking water and violations of drinking water regulations to identify factors associated with elevated concentrations of lead in public drinking water, human exposure to lead in drinking water, or violations of drinking water laws and regulations. We used the data in SDWIS/Fed for 2 selected statesOhio and Texasto conduct a statistical analysis that calculated a system’s likelihood of a violation using selected factors, such as the size of the population served and the type of source water. Although some of the data in the SDWIS/Fed database are not complete, we selected these 2 states because EPA reviews of the completeness and accuracy of LCR data reported by these states did not find significant discrepancies. We reviewed EPA’s reviews on the reliability of data the states provide to SDWIS/Fed and interviewed EPA and state officials to determine that these 2 states had sufficiently reliable data for our purposes of illustrating a statistical approach. We compared EPA’s use of these data to inform management decisions against federal standards for internal control.16 Finally, we reviewed federal regulations; EPA guidance to states and water systems, action plans, memorandums, and letters; and other relevant documentation. Appendix I contains a more detailed description of our objectives, scope, and methodology.
15We invited regulators from all states and territories to participate. In total, we conducted eight, 1-hour discussion groups over the telephone in September and October 2016. 16GAO, Standards for Internal Control in the Federal Government, GAO-14-704G, (Washington, D.C.: September 2014).
Page 6 GAO-17-424 Elevated Lead in Drinking Water
We conducted this performance audit from February 2016 to September 2017 in accordance with generally accepted government auditing standards. Those standards require that we plan and perform the audit to obtain sufficient, appropriate evidence to provide a reasonable basis for our findings and conclusions based on our audit objectives. We believe that the evidence obtained provides a reasonable basis for our findings and conclusions based on our audit objectives.
This section provides information on (1) the known health effects of lead in drinking water; (2) how water systems deliver drinking water to the public and where lead may be present; (3) the requirements of the LCR; (4) LCR data that states report to EPA; and (5) the roles of federal, state, and local entities in implementing the LCR.
EPA, the Centers for Disease Control and Prevention (CDC), and others have indicated that the rates of lead contamination in the U.S. population have decreased over the years.17 However, lead remains a significant concern to public health because lead is persistent and can accumulate in the body over time with long-lasting effects, particularly for children and pregnant women. According to EPA documents, low levels of lead exposure in children are linked to hyperactivity, anemia, lower intelligence quotient (IQ), physical and learning disabilities, and slowed growth. In pregnant women, lead can store in bones and be released as maternal calcium used to form the bones of the fetus, reduce fetal growth, and increase risk of miscarriage and stillbirth. For adults, lead can have detrimental effects on cardiovascular, renal, and reproductive systems; and, it can prompt memory loss. The presence of lead in the bloodstream can disappear relatively quickly, but bones can retain the toxin for decades.
According to the National Institutes of Health and CDC documents, medications can remove some lead from the body but cannot undo the damage lead causes, although additional services may mitigate some of
17Environmental Protection Agency, American’s Children and the Environment, Third Edition (Washington, D.C.: January 2013). Centers for Disease Control, Morbidity and Mortality Weekly Report, vol. 66, no. 5 (Feb. 10, 2017); and American Academy of Pediatrics, Prevention of Childhood Lead Toxicity, Pediatrics, vol. 138, no. 1 (2016).
Background
Health Effects of Lead in Drinking Water

Page 7 GAO-17-424 Elevated Lead in Drinking Water
the damage.18 Recognizing that vigilance and collaboration are necessary to ensure that children negatively affected by lead exposure receive services designed to compensate for lead’s effect on the brain, and behavior of children, some medical experts promote early-childhood intervention, education, and other programs. According to CDC documents, early intervention for children can help improve IQ scores, academic readiness, and language development as well as decrease placement in special education classes. For these reasons, EPA and others recommend the prevention of lead exposure before it occurs.19
Water systems depend on distribution systems, both simple and complex, composed of interconnected components to deliver drinking water from a source to their customers. Source water can be either surface (streams, rivers, and lakes) or ground (aquifers). As figure 1 illustrates, the distribution system used to deliver water from the source can include a network of pipes and other components. A distribution system comprises water towers, pipes, pumps, and other components to deliver treated water from treatment systems to consumers. Particularly among larger water systems, distribution systems may contain thousands of miles of pipes, including water mains.20
18National Institute of Environmental Health Sciences, Lead and Your Health, (Research Triangle Park, N.C.: October 2013). 19American Academy of Pediatrics, Prevention of Childhood Lead Toxicity. Environmental Protection Agency, Children’s Health Protection Advisory Committee, Childhood Lead Poisoning Prevention Letter, (Feb. 14, 2013); and National Institute of Environmental Health Sciences, Lead and Your Health. 20Water mains are the pipes that transport the water from the source and treatment plant.
How Water Systems Deliver Drinking Water

Page 8 GAO-17-424 Elevated Lead in Drinking Water
Figure 1: Example of How a Water System Delivers Drinking Water
Note: According to EPA, the pipes running from the drinking water treatment plant to lead service lines are not generally viewed as being possible sources of lead.
There are 1 million miles of drinking water mains in the country, according to a 2017 American Society of Civil Engineers study.21 Service lines are the smaller pipes that connect the water mains to homes and buildings and can also include smaller pipes used for connecting a service line to the water mains (e.g., called pigtail and gooseneck pipes). In contrast to most other drinking water contaminants, lead is rarely found in the source water. More commonly, lead enters drinking water after the water comes into contact with water mains; service lines; smaller pipes that connect 21American Society of Civil Engineers, 2017 Infrastructure Report Card: A Comprehensive Assessment of America’s Infrastructure (Reston, VA: 2017).

Page 9 GAO-17-424 Elevated Lead in Drinking Water
the two; and other plumbing materials that contain lead, such as faucets and water coolers. Schools and day care centers with their own water supplies generally rely on well-water systems using groundwater to deliver drinking water.
According to the 2017 American Society of Civil Engineers study and EPA documents, communities, both urban and rural, have aging and deteriorating drinking water infrastructure, which, according to EPA documents, can contribute to lead hazards in drinking water. Since the early 1970s, when several medical studies confirmed that lead exposure negatively impacts health, measures have been taken to reduce the public’s exposure to lead in drinking water, including the enactment of amendments to the SDWA in 1986 and 1996, the enactment of the Lead Contamination Control Act in 1988, the issuance of the LCR in 1991, and amendments to state building codes prohibiting the use of lead pipes.22
The LCR generally requires water systems to minimize lead in drinking water by controlling the corrosion of metals in the infrastructure they use to deliver water and in household plumbing.23 EPA has stated that the LCR is one of the most complicated drinking water regulations for states to implement because of the need to control the corrosion of pipes and plumbing fixtures as water is delivered to consumers.24 The corrosion of pipes results from a chemical interaction between water and pipes that wears the metal away and allows particles of metal to flake away over 22American Water Works Association, Communicating About Lead Service Lines: A Guide for Water Systems Addressing Service Line Repair and Replacement, (2014); American Journal of Public Health, The Lead Industry and Lead Water Pipes “A Modest Campaign” (September 2008); and Richard Rabin; P.J. Landrigan, R.H. Whitworth, R.W. Baloh, W.F. Barthel, N.W. Staehling, and B.F. Rosenblum , “Neuropsychological Dysfunction in Children with Chronic Low-Level Lead Absorption,” The Lancet, vol. 308, no. 7909 (1975), 708-712. 23Congress passed the Lead Contamination Control Act of 1988, which banned the manufacture and sale of drinking water coolers and water fountains containing lead-lined tanks and those that are not lead free within the meaning of the act. 24Congress amended SDWA in 1986 to generally prohibit the new installation of lead pipes and solder. In 1996 Congress amended SDWA to generally prohibit the sale of pipes and plumbing fixtures that are not lead free, as defined in the act. In 2011, Congress passed the Reduction of Lead in Drinking Water Act lowering the maximum allowable lead content in “lead free” materials. In 2011, Congress amended SDWA changing the definition of “lead free” with respect to pipes, plumbing, fixtures and fittings from containing “not more than 8 percent lead” to “not more than a weighted average of 0.25 percent lead (0.2 percent with respect to solder and flux).”
The Lead and Copper Rule

Page 10 GAO-17-424 Elevated Lead in Drinking Water
time. All large water systems (serving populations larger than 50,000) are generally required to install corrosion control treatment. While the majority of the U.S. population receives its drinking water from medium and large water systems, most water systems are small.
Characteristics of water can affect the occurrence and rate of corrosion. For example, corrosion occurs more frequently in soft water—water with low concentrations of calcium and magnesium—and also in acidic water, or water with low pH.25 Water systems control corrosion by adjusting the pH and alkalinity of water or by adding corrosion inhibitors.26 The LCR establishes corrosion control as the required treatment technique for large water systems and, for medium and small systems, the required treatment technique when the federal lead action level is exceeded (also known as an action level exceedance).27 Lead concentrations exceeding an action level of 15 parts per billion, or 0.015 milligrams per liter (mg/L), in over 10 percent of tap water samples (i.e., the 90th percentile level) are an indicator that corrosion control is needed or is not working correctly.28 A water system’s 90th percentile sample result does not exceed the lead action level if it is equal to or less than 15 parts per billion. As figure 2 illustrates, the LCR also requires water systems to identify locations
25According to the U.S. Geological Survey’s website, pH is a measure of how acidic or basic water is. The range goes from 0 to 14, with 7 being neutral. A pH of less than 7 indicates acidity, whereas a pH of greater than 7 indicates a base. 26The most commonly used corrosion inhibitors include orthophosphate, polyphosphate, and poly-orthophosphate blends. They generally work by binding lead and copper into their structures and preventing them from dissolving into the water. 27In a 2015 memorandum to states on the use of corrosion control by large water systems, EPA stated that key steps for corrosion control include monitoring, corrosion control studies, installation of treatment, and follow-up sample collection, among other things. Environmental Protection Agency, Memorandum: Lead and Copper Rule Requirements for Optimal Corrosion Control Treatment for Large Drinking Water Systems (Washington, D.C.: Nov. 3, 2015). 28For water systems taking more than 5 samples, the 90th percentile is calculated by placing the sample results in ascending order (from lowest to highest) and assigning each sample a number, with 1 being assigned to the lowest results value. Water systems are then to multiply the total number of samples by 0.9. The result of that calculation corresponds to the number of the sample that is considered to be the 90th percentile sample result. For example, if a water system collects 10 samples, the 90th percentile level corresponds to the 9th highest sample (i.e., 10 samples multiplied by 0.9). For water systems that collect 5 samples, the LCR requires the sample results to also be placed in ascending order. The average of the results of the 4th and 5th samples is the 90th percentile sample result. For water systems taking fewer than 5 samples, the sample result with the highest concentration is considered the 90th percentile value.

Page 11 GAO-17-424 Elevated Lead in Drinking Water
where lead may be present and periodically obtain tap water samples from those locations (of which single-family homes are the highest priority).29
29The LCR allows certain water systems whose test results are consistently below the federal action level to reduce the frequency of monitoring (taking drinking water samples) and the number of samples collected. In addition, the LCR permits all water systems that meet water quality control parameters reflecting optimized corrosion control, as specified by the state, to also qualify for reduced monitoring.

Page 12 GAO-17-424 Elevated Lead in Drinking Water
Figure 2: Lead and Copper Rule Requirements for Water Systems, Including Schools and Day Care Centers with Their Own Water Supplies
aIn this report, we use “distribution system” to refer to the physical infrastructure that water systems use to deliver drinking water from a source to their customers and can include a network of pipes and other components. bHigh-risk locations, which the Lead and Copper Rule calls “tier 1” locations, are single-family homes or buildings with lead pipes, served by lead service lines, or copper pipes with lead solder installed after 1982. cThe required frequency and number of samples to be collected are primarily based on the number of people served and previous sample results. Standard monitoring is conducted at 6-month intervals, but systems can, after meeting certain criteria, sample less frequently. See Environmental Protection Agency guidance 816-R-10-004 for details.

Page 13 GAO-17-424 Elevated Lead in Drinking Water
dAll large water systems are generally required to use corrosion control. Small and medium-sized water systems are required to install or modify existing corrosion control treatment after their 90th percentile sample results exceed the lead action level. However, small and medium-sized systems may discontinue corrosion control treatment installation if they have sample results at or below the lead action level for two consecutive 6-month monitoring periods. If small and medium water systems that have discontinued corrosion control treatment installation report a subsequent 90th percentile sample result over the lead action level, they must continue with the installation of corrosion control. Any such system that has treatment in place must continue to operate and maintain it.
Under the LCR, an action level exceedance requires the water system and state to take a number of additional steps. Those additional steps require that small and medium water systems install or modify corrosion control treatment, and water systems of all sizes provide information (known as public education) about the harmful effects of lead to consumers and vulnerable populations (e.g., schools, if the water system serves a school, and public health departments).30 Water systems are also required to test and, if necessary, treat the source water. If, after installing corrosion control and treating source water, a system continues to have 90th percentile sample results that exceed the lead action level, the LCR requires the water system to begin replacing lead service lines, if they exist. In most communities, lead service lines are partially owned by the water system and partially owned by the homeowner. The LCR allows for a partial replacement when an owner of a home or building is unable or unwilling to pay for replacement of the portion of the service line not owned by the water system.31
In an October 2016 study, EPA noted that sample requirements under the LCR are complex for many reasons, one reason being that it is the only drinking water regulation in which homeowners or consumers collect the
30Large water systems are generally required to use corrosion control techniques regardless of whether they have previously reported sample results over the lead action level. 31In 2010, EPA asked its Science Advisory Board to evaluate the data regarding the effectiveness of the partial lead service line replacement, in comparison to full line replacement. The Science Advisory Board found the quantity and quality of the data inadequate to fully determine the effectiveness of partial lead service line replacement. In addition, despite the limitations, the Science Advisory Board concluded that partial lead service lines have not been shown to reliably reduce drinking water lead levels in the short term and potentially even longer and are frequently associated with short-term elevated drinking water levels for some period of time after replacement. Environmental Protection Agency, SAB Evaluation of the Effectiveness of Partial Lead Service Line Replacements, EPA-SAB-11-015 (Washington, D.C.: Sept. 28, 2011)

Page 14 GAO-17-424 Elevated Lead in Drinking Water
drinking water samples.32 Water systems are in compliance with the LCR when they follow the various federal requirements for collecting samples, reporting, installing treatments, providing public education, and replacing lead service lines; as well as when they follow any state requirements that are more stringent than the federal requirements. States and EPA can take several different types of enforcement actions when water systems fail to complete requirements in these areas. Sample results that exceed the lead action level do not by themselves constitute violations of the LCR.
The SDWA, as amended in 1996, requires EPA to review and revise, as appropriate, each national primary drinking water regulation, including the LCR, at least once every 6 years. The 1991 LCR was revised in 2000 and 2007. EPA initiated an extensive review of the LCR in 2004 after widespread increases in lead levels were detected in the District of Columbia’s water following a water treatment change. EPA promulgated short-term revisions and clarifications in 2007 and has continued working on comprehensive revisions. In 2016, the agency announced that it would revise the LCR and issue proposed revisions in 2017 and a final revised rule in 2019. EPA also released a Lead and Copper Rule Revisions White Paper in 2016 that outlined potential elements of the rule under consideration for revision such as use of corrosion control practices, requirements for collecting samples, and lead service line replacement.33
32Environmental Protection Agency, Lead and Copper Rule Revisions White Paper (Washington, D.C.: October 2016). All community waters systems and non-transient non-community water systems must collect samples. The required frequency and number of samples to be collected are primarily based on the number of people served and previous sample results. Standard monitoring is conducted at 6-month intervals, but systems can, after meeting certain criteria, sample less frequently. The LCR requires water systems to collect samples at locations that may be particularly susceptible to high lead concentrations (of which single- and multi-family homes are the highest priority). Samples from residences must be collected from cold water kitchen or bath taps, and those collected from non-residential areas must be collected from interior taps. The number of samples to be collected depends on the size of the water system. For more information on the LCR’s requirements for the frequency of sample collection, number of samples water systems are required to collect, and from where those samples are required to be taken, see Environmental Protection Agency, Lead and Copper Rule Monitoring and Reporting Guidance for Public Water Systems, EPA 816-R-10-004, (Washington, D.C.: March 2010). 33Environmental Protection Agency, Lead and Copper Rule Revisions White Paper. See also, Congressional Research Service, Lead in Flint, Michigan’s Drinking Water, IN10446, (Washington: D.C.: Feb. 16, 2016).

Page 15 GAO-17-424 Elevated Lead in Drinking Water
The LCR generally requires that water systems submit data to states to demonstrate their compliance with the treatment technique required by the rule. The LCR also requires states to submit some of these data to EPA’s SDWIS/Fed database on a quarterly basis. Specifically, states are required to submit the following data to EPA:
• for large and medium water systems, all 90th percentile sample results (i.e., sample results that meet, fall below, and exceed the lead action level);
• for small water systems, 90th percentile sample results that exceed the lead action level;
• on water systems that have been designated as having achieved corrosion control because the state has determined that the source water is minimally corrosive;
• on water systems that were required to install corrosion control treatment, source water treatment, and lead service line replacement and have completed the applicable requirements as a result of having sample results exceed the lead action level;
• on water systems that have begun the process of replacing lead service lines;
• on water systems that have new violations of the LCR; and
• on enforcement actions taken in response to violations of the LCR.
For corrosion control, the LCR requires the states to report what EPA refers to as “milestone” data to the SDWIS/Fed database:
• data on the status of required actions, such as installing corrosion control treatment, as required, after reporting sample results that exceed the lead action level; and
• data on those water systems deemed to have corrosion already under control, such as when the water is minimally corrosive.34
The states collect and manage relevant data (including violations and enforcement information) in either a database provided by EPA—known as the Safe Drinking Water Information System/State—or in a data system of their own design. States must then transfer the data from one
34The LCR requires states to report milestone data on water systems that have begun the process of replacing their lead service lines.
LCR Data That States Report to EPA
Page 16 GAO-17-424 Elevated Lead in Drinking Water
of those databases into SDWIS/Fed. In 2010, EPA announced that it would redesign SDWIS/Fed. We reported in June 2011 that EPA officials expected this redesign of SDWIS/Fed to expand the amount of data that EPA receives electronically from states.35 The name of the redesigned database is SDWIS Prime, which according to EPA officials, is expected to be complete by 2018.
Generally, the responsibility for reducing lead in drinking water and ensuring safe drinking water overall, is shared by EPA, states, and, local water systems. As shown in figure 3, EPA is responsible for national implementation of the LCR and setting standards; overseeing states’ implementation of the LCR; providing infrastructure funding, training, and technical assistance to states and water systems; and conducting some enforcement activities. However, the primary responsibility for ensuring that drinking water is free of lead resides with states and local water systems.
35GAO-11-381.
Roles of Federal, State, and Local Entities in Implementing the LCR

Page 17 GAO-17-424 Elevated Lead in Drinking Water
Figure 3: Typical Responsibilities of Key Stakeholders in Implementing the Lead and Copper Rule
aThe water system may collect the samples or may allow residents to collect the samples after instructing the residents of the procedures for collecting samples. bThe LCR only requires water systems to replace lead service lines that they own. The LCR does not require homeowners to replace their portion of lead service lines, but if they choose to do so they are generally responsible for the associated costs.
Page 18 GAO-17-424 Elevated Lead in Drinking Water
Generally, states with primary enforcement responsibility initiate enforcement actions against water systems that do not comply with the LCR and other drinking water regulations.36 However, EPA can also issue orders necessary to protect human health where a contaminant in a public water system presents an imminent and substantial endangerment.37 According to a 2013 EPA drinking water compliance report,38 states generally implement and enforce the LCR, and other drinking water regulations, in the following ways:
• provide technical assistance through such actions as offering training, holding public information meetings, and lending monitoring equipment;
• take informal actions such as field visits, reminder letters, telephone calls, and notices of violation; and
• take formal actions such as issuing citations, administrative orders with or without penalties, civil and criminal cases, and emergency orders.
Since 2009, according to an EPA document, the agency’s enforcement strategy, in collaboration with states, has focused on identifying water systems with a history of violations across multiple drinking water rules for enforcement actions in states, territories, and tribal regions. To facilitate this strategy, EPA’s headquarters staff are to review data on violations in EPA’s SDWIS/Fed using an Enforcement Targeting Tool to identify systems that merit action by states based on the seriousness of their violations.39 EPA staff also are to use these data to determine whether 36Under the SDWA, EPA generally delegates primary enforcement responsibility (also called primacy) for water systems to states and Indian tribes if they meet certain requirements. According to EPA headquarters officials, these states are referred to as primacy agencies. 3742 U.S.C. § 300i. EPA may do so if appropriate state and local authorities have not acted to protect human health. Id. 38Environmental Protection Agency, Providing Safe Drinking Water in America: 2013 National Public Water Systems Compliance Report, EPA 305-R-15-001 (Washington, D.C.: 2013). 39The Enforcement Targeting Tool assigns a score to each water system based on an accounting of unresolved violations over a 5-year period. Because some violations may have more serious health consequences than others, the tool assigns each violation a “weight” or number of points based on the potential threat to public health. Water systems whose scores meet or exceed a certain threshold—EPA has set the threshold at 11 points—are considered to have serious compliance problems and are placed on a priority list of water systems that the states and EPA are to target for enforcement.

Page 19 GAO-17-424 Elevated Lead in Drinking Water
water systems are achieving the agency’s national targets for compliance. According to the EPA FY 2014-2018 Strategic Plan, the agency’s goal is for 92 percent of water systems that provide drinking water year-round to meet all applicable health-based drinking water standards by 2018.40
The available EPA data show sample results, use of corrosion control, violations, and enforcement actions taken for the 68,000 water systems from July 2011 to December 2016, but data are not complete. The available data reported by states in EPA’s SDWIS/Fed database show at least 2 percent of drinking water systems with sample results exceeding the lead action level (from 2014 to 2016), and at least 10 percent of water systems being out of compliance with the LCR (i.e., having at least one reported violation) as of December 31, 2016. In addition, the state-reported data in SDWIS/Fed show 99 percent of enforcement actions were taken by states, as expected because states generally have primary responsibility for monitoring and enforcement of the SDWA requirements, including the LCR. According to recent EPA assessments, the EPA OIG report, and our January 2006 and June 2011 reports, some of the data in the SDWIS/Fed database are not complete.41 Specifically, the data are underreported, and therefore, data available in SDWIS/Fed likely understate the number of sample results, violations, and enforcement actions that actually occurred. In addition, the available EPA data on water systems’ use of corrosion control are not complete. We also found that because the LCR does not require states to submit certain data to EPA, EPA’s SDWIS/Fed database does not contain data on key parts of the rule, such as the presence or location of lead pipes—information that water systems use to identify the locations from which they will draw tap samples—or complete sample results for small water systems.
40Environmental Protection Agency, FY 2014-2018 EPA Strategic Plan, (Washington, D.C.: Apr. 10, 2014). 41Environmental Protection Agency, Office of Inspector General, EPA Is Taking Steps to Improve State Drinking Water Program Reviews and Public Water systems Compliance Data, GAO-06-148 and GAO-11-381.
Available EPA Data Show Sample Results, Use of Corrosion Control, Violations, and Enforcement Actions Taken, but Data Are Not Complete

Page 20 GAO-17-424 Elevated Lead in Drinking Water
EPA’s SDWIS/Fed database contains descriptive data on, for example, drinking water sample results, corrosion control, violations, and enforcement actions, as required by the LCR.
The available state-reported data in EPA’s SDWIS/Fed database show that of the approximately 68,000 drinking water systems subject to the LCR, at least 1,430 water systems (2 percent) had 90th percentile sample results that exceeded the lead action level of 15 parts per billion from 2014 to 2016. EPA officials told us that they analyze these sample data over a 3-year period rather than yearly to ensure that the majority of water systems will have submitted sample results.42 These 1,430 systems serve a population of approximately 3 million people. Of the 1,430 systems with sample results exceeding the lead action level, 258 (18 percent) were schools and day care centers with their own water supplies. As we reported in January 2006, the LCR sample data in SDWIS/Fed were underreported; recent EPA file reviews in selected states found that sample data were not always reported to SDWIS/Fed; and a 2017 EPA Office of Inspector General report indicated that sample data, specifically, are potentially underreported.43 Appendix II provides additional information about the available EPA data on sample results, reported violations, and enforcement. In addition, some state regulators with whom we interviewed in 2016 told us that homeowners and water systems may take LCR samples improperly as we discuss later in this report. See appendix III for these state regulators’ views on challenges associated
42According to EPA’s guidance to water systems, standard tap samples should be taken every 6 months. However, if water systems meet certain requirements they can collect tap samples once every year; once every 3 years; or for a limited number of small water systems, once every 9 years. 43GAO-06-148, GAO-11-381, and Environmental Protection Agency, Office of Inspector General, EPA Is Taking Steps to Improve State Drinking Water Program Reviews and Public Water Systems Compliance Data, 17-P-0326 (Washington, D.C.: July 18, 2017). In GAO-06-148, we recommended, among other things, that EPA ensure that data on water systems’ test results, corrective action milestones, and violations are current, accurate, and complete. In GAO-11-381, we recommended, among other things, that EPA work with the states to establish a goal, or goals, for the completeness and accuracy of data on monitoring violations. These recommendations are still open.
Available EPA Data Show Sample Results, Violations, and Enforcement Actions Taken, but Data on Water Systems’ Use of Corrosion Control Are Not Complete
Sample Results

Page 21 GAO-17-424 Elevated Lead in Drinking Water
with waters systems’ implementation of the sample requirements under the LCR.
The 2015 Report of the Lead and Copper Working Group to the National Drinking Water Advisory Council noted the importance of corrosion control because it is intended to achieve a water quality that minimizes lead in water.44 Our analysis of the available state-reported data in EPA’s SDWIS/Fed database on corrosion control from July 2011 to December 2016, shows that the database contained milestone data for 904 water systems on the status of required actions about corrosion control treatment after a sample result exceeded the lead action level, and 1,479 water systems were deemed to have corrosion already under control.45 In addition, 34 water systems had milestone data in SDWIS/Fed for lead service line replacement. For the approximately 68,000 water systems subject to the LCR, 1,665 systems, had milestone data in SDWIS/Fed, or about 2 percent of all water systems from July 2011 to December 2016. According to EPA officials, when including milestone data available prior to July 1, 2011, almost half of these systems have submitted the required information regarding corrosion control milestones.46 Each water system can have up to three types of milestone data (i.e., status of required actions about corrosion control, systems deemed to have corrosion already under control, and lead service line replacement) in SDWIS/Fed. In June 2017, EPA officials said that all water systems subject to the LCR are expected to have data on corrosion control in SDWIS/Fed.47 However, these officials also said that states may not report the data to SDWIS/Fed because of technical limitations with some state databases and confusion among some state officials about how to report the data to SDWIS/Fed.
44Environmental Protection Agency, National Drinking Water Advisory Council, Report of the Lead and Copper Rule Working Group to the National Drinking Water Advisory Council: Final, (August 2015). 45States can report data for multiple milestones for the same water system. For example, states can report that a system has been deemed to have corrosion under control and, if that same system reported sample results that exceeded the action level, also had to take the required actions related to corrosion control treatment. 46In August 2017, EPA officials told us that based on their analysis, 47 percent of water systems had data on corrosion control in SDWIS/Fed as of December 31, 2016; and, that any analysis should include data prior to July 1, 2011. We did not have access to EPA’s milestone data on corrosion control prior to July 1, 2011. 47The available SDWIS/Fed data showed 34 water systems with milestone data for lead service line replacement from July 1, 2011, to December 31, 2016.
Use of Corrosion Control

Page 22 GAO-17-424 Elevated Lead in Drinking Water
Of the 983 large systems in the SDWIS/Fed database, milestone data were available for 13 from July 2011 to December 2016, and 5 of those systems had sample results exceeding the lead action level at some point over that time period. Of the small and medium water systems for this period that installed corrosion control treatment because their sample results exceeded the lead action level,48 milestone data were available for 884 water systems.49
We reported in January 2006 that EPA did not have complete milestone data, including data on corrosion control.50 Specifically, we reported that EPA had, at that time, collected milestone data for about 28 percent of water systems. At the time of our 2006 report, EPA officials told us that in most instances water systems should have data on corrosion control treatment and that it was more likely the case that states were not reporting the data rather than a case of noncompliance by water systems. We recommended that EPA ensure that data on water systems’ test results, corrective action milestones, and violations were current, accurate, and complete. EPA generally agreed with our recommendation, but has not fully implemented it. In 2016, EPA highlighted its response to our January 2006 recommendation through such efforts as having staff review SDWIS/Fed data for accuracy and timeliness and promoting electronic reporting of the drinking water data states submit to SDWIS/Fed.
In addition, EPA headquarters officials said in June 2017 that the agency also worked with the states on reporting corrosion control data by
48Under the LCR, small and medium drinking water systems can discontinue the steps required for installing corrosion control treatment if the 90th percentile sample results fall below the federal action level for two consecutive 6-month monitoring periods. If these systems exceed the federal action level during a subsequent monitoring period, they must recommence with steps to install corrosion control treatment from the point in the process they previously had not completed. 49In this report, we discuss the number of water systems reporting sample results over the lead action level for a 3-year period and the full 5 1/2 period of the SDWIS/Fed data that we analyzed. For the 3-year period, from January 2014, to December 2016, there were 1,419 small and medium systems (of the total 1,430 systems) reporting sample results over the lead action level. From July 1, 2011, to December 31, 2016, there were 2,470 small and medium water systems (of the total 2,493 water systems) reporting samples results over the lead action level. Some systems reporting sample results exceeding the action level may not have milestone data reported in SDWIS/Fed because they have not yet completed the required actions. 50GAO-06-148.

Page 23 GAO-17-424 Elevated Lead in Drinking Water
conducting webinars and in-person training that included information about reporting data to SDWIS/Fed. For example, EPA conducted a three-part series of LCR 101 webinars. EPA officials said that the webinars in this series reached over 1,600 attendees with individual webinars ranging from 227 to 551 viewers. EPA’s efforts regarding training sound promising, but it may be too early to see the impact of these efforts to work with states on reporting milestone data on corrosion control to SDWIS/Fed. We continue to believe that EPA should take steps to ensure that data, including those on milestones, are current, accurate, and complete.
The available data reported by states in EPA’s SDWIS/Fed database show that of the approximately 68,000 drinking water systems subject to the LCR, states reported that at least 6,567 water systems (about 10 percent) had at least one reported open violation of the LCR as of December 2016.51 In total, these 6,567 water systems had a total of at least 12,884 open violations as of December 2016. As we reported in January 2006 and June 2011, the violations data in SDWIS/Fed were underreported.52 Recent EPA file reviews in selected states found that some violations data were not reported to SDWIS/Fed.
LCR violations fall into two categories: (1) monitoring and reporting and (2) treatment technique. Monitoring and reporting violations generally refer to a water system
• failing to collect samples of drinking water from the tap, within the distribution system, and from source water and
• failing to report sample results to the states.
Treatment technique violations, which EPA considers to be health-based violations, generally refer to a water system failing to take actions as required after water samples exceed the federal lead action level.
The two most frequent violations were for not following requirements for (1) monitoring and reporting routine follow-up and (2) initial tap
51States make determinations about violations based on the requirements of the LCR. Violations are considered open when the state has not determined that a water system is in compliance with the specific requirement for which it received the violation. 52GAO-06-148 and GAO-11-381.
Violations
Page 24 GAO-17-424 Elevated Lead in Drinking Water
sampling.53 Taking samples from homes is the only way that water systems, states, and ultimately EPA can obtain the indicators needed to determine whether corrosion control treatment is needed or if corrosion control treatments already installed are working, in addition to other treatment technique requirements. The third most frequent violation was lead consumer notification, which states or water systems are to do in writing, about the results of the samples taken from homes or buildings they occupy regardless of the presence of lead in the samples taken, known as lead consumer notice violations. These notifications are to provide consumers with information about their drinking water sample results so that they can determine what actions to take to reduce their exposure to lead if lead is present.54
Of the approximately 68,000 water systems subject to the LCR, approximately 7,000 schools and daycare centers make up about 10 percent.55 As their missions would indicate, these schools and daycare centers provide drinking water to children, one of the populations most at-risk for adverse health effects from even small amounts of lead. Most of the schools and daycare centers in the EPA data we analyzed were classified as small water systems.56 EPA data show that schools and daycare centers comprise about 10 percent (664 water systems) of the 6,567 water systems with at least one open violation of the LCR as of December 31, 2016. Much like the overall group of water systems, schools and daycare centers were most frequently violating the LCR
53Initial tap sampling is a violation that applies to new water systems or water systems that were previously not required to take tap samples for lead or water systems that did not conduct two consecutive rounds of initial tap sampling. 54Under the Water Infrastructure Improvements for the Nation Act, not later than June 14, 2017, EPA must, in collaboration with owners and operators of public water systems and states, establish a strategic plan for how EPA, primacy agencies, and owners and operators of public water systems will provide targeted outreach, education, technical assistance, and risk communication to populations affected by the concentration of lead in public water systems. 55An EPA official confirmed that if the primary service area for a water system is a school or daycare center, then that water system can be considered a school or daycare center. According to EPA’s website, as of May 2017, there are an estimated 98,000 public schools and 500,000 child care centers not regulated under the Safe Drinking Water Act. The approximately 7,000 schools and daycare centers we identified that are subject to the LCR are those with their own water supplies. 56According to our analysis, of the approximately 7,000 schools and daycare centers, 64 were classified as medium and 1 (a school) was classified as large.

Page 25 GAO-17-424 Elevated Lead in Drinking Water
requirements for not (1) monitoring and reporting routine follow-up (2) initial tap sampling, and (3) lead consumer notification.
The available data reported by states in the SDWIS/Fed database show reported information on the enforcement actions taken by states and EPA against water systems that have violated requirements of the LCR. States reported taking 98 percent of the enforcement actions from July 1, 2011, to December 31, 2016, as would be expected given that states generally have primary responsibility for enforcement of the LCR. In our January 2006 report, we found that because sample results, milestones, and violations data for the LCR in SDWIS/Fed were underreported, it was difficult to assess the adequacy of enforcement.57 We then found in June 2011 that the enforcement data, generally, in SDWIS/Fed were incomplete.58 States and EPA can take a range of enforcement actions both formal and informal. Formal enforcement actions include issuing state administrative orders with or without penalties, filing state or federal civil and criminal cases, and issuing emergency orders.59 Informal enforcement actions include reminder notices of a violation, formal notices of violation, public notification requests,60 and state referrals of cases to EPA. According to a 2013 EPA compliance report, the number of enforcement actions in a year does not necessarily correlate with the number of violations that are reported in the same year. The two most frequently reported enforcement actions taken were informalstate violation/reminder notice, which inform water systems that the system has open violations, and state public notification requested, in which the state requests a copy of the information water systems sent to homeowners.61 Most of the EPA officials we interviewed in the 10 regional offices told us 57GAO-06-148. 58GAO-11-381. 59According to EPA, civil administrative actions are nonjudicial enforcement actions taken by EPA or a state under its own authority. For example, EPA or a state can issue an administrative order requiring compliance with any applicable SDWA requirement. In addition, under section 1431 of the SDWA, EPA may issue orders necessary to protect human health where a contaminant in a public water system presents an imminent and substantial endangerment. EPA may do so if appropriate state and local authorities have not acted to protect human health. 60Under the LCR, any water system that is subject to the public education requirements must send written documentation to the state that contains, among other things, a demonstration that the system has delivered the required public education materials. 61Violations are considered open when the state has not indicated, in SDWIS/Fed, that a water system has met applicable requirements or criteria.
Enforcement

Page 26 GAO-17-424 Elevated Lead in Drinking Water
that states primarily rely on informal actions and technical assistance and training because they are the most effective means of getting water systems to comply with regulations.
The LCR does not require states to submit data to EPA’s SDWIS/Fed database on (1) location of lead pipes or (2) all sample results for small water systems. As a result, EPA does not have available data on either the location of lead pipes or complete sample results for small water systems. Water systems were required to collect information on the presence of lead pipes when the LCR was promulgated in 1991, but there is currently no requirement that this information be reported to EPA. States are to submit to SDWIS/Fed on a quarterly basis all 90th percentile sample results for large and medium water systems (including those that exceed the lead action level). However, for small water systems, states are required to submit data to SDWIS/Fed only for those 90th percentile sample results that exceed the lead action level. As a result, sample results for small water systems are not complete in SDWIS/Fed.
When the LCR was promulgated in 1991, all drinking water systems were required to collect information about the infrastructure that delivered water to customers, including any known lead pipes and lead service lines. The purpose of this effort, referred to as a materials evaluation, was to identify locations that may have been particularly susceptible to high lead or copper concentrations, which would become the pool of targeted sample sites. Water systems that must replace their lead service lines under the LCR also must report their materials evaluations to their respective states. In addition, a 1980 EPA regulation required community water systems to identify, among other things, whether lead from piping, solder, caulking, interior lining of distribution mains, alloys, and home plumbing was present in their distribution system and report this information to the state.62 However, the LCR does not require states to report information on known lead pipes and service lines to EPA’s SDWIS/Fed database.63 As a result, the agency may not have information at the national level about the lead infrastructure in the country.
In February 2016, in light of the events in Flint, Michigan, and other U.S. cities, EPA asked states to collect information about the locations of lead service lines and publish the information on local or state websites to 6240 C.F.R. 141.42(d). 63According to EPA, another revision to the LCR is expected in 2019.
EPA’s SDWIS/Fed Database Does Not Contain Data on the Presence of Lead Pipes and Complete Sample Results for Small Systems
Collection of Data on the Presence of Lead Pipes Was a 1991 LCR Requirement
Page 27 GAO-17-424 Elevated Lead in Drinking Water
better inform the public. In a July 2016 letter to the Environmental Council of States and the Association of State and Territorial Health Officials, EPA noted that some states had successfully taken action to fulfill the request, citing (1) water systems with online searchable databases that provide information on lead service lines and (2) several states that were requiring water systems to update their inventories of lead service lines.64 In the letter, EPA also noted that many states identified challenges in identifying lead service lines but that improving knowledge of lead service lines is important to ensure that water systems are (1) collecting drinking water samples from valid high-risk locations, as required under the LCR, (2) managing the risks associated with disruption of lead service lines, and (3) providing information to customers on how to assess and mitigate risks posed by lead.
In written responses to EPA’s letter, most (37) of the 50 states (or primacy agencies) indicated that they had fulfilled or intended to fulfill EPA’s request to work with water systems to collect and make public information about lead pipes.65 Four states indicated that they were considering EPA’s request. However, 9 states indicated that they would not or did not intend to fulfill EPA’s request because of challenges in finding the historical documentation about lead pipes used to create original sample plans or dedicating staff resources to do so. In addition, in their responses to EPA’s letter, 13 states noted that the LCR does not require states to maintain information about water systems’ lead pipes or to provide the information to the public.66 EPA stated in its 2016 Lead and Copper Rule Revisions White Paper that it was considering a proposal in the upcoming revision to the LCR for water systems to update their information on lead service lines and share the results of their “materials evaluation.” In June 2017, EPA headquarters officials said that the
64Environmental Protection Agency, July 6, 2016, Letter to the Environmental Council of States and the Association of State and Territorial Health Officials, accessed May 19, 2017, https://www.epa.gov/sites/production/files/2016-07/documents/lcr_ashto-ecos_follow-up_letter_7.6.16.pdf 65EPA received responses to its letter from 54 states and primacy agencies. Specifically, 49 states, and EPA’s region 8 office which oversees the drinking water program in Wyoming, Guam, Navajo Nation, Northern Mariana Islands, and Puerto Rico. 66Drinking water systems were to collect information about their infrastructure, including any known lead service lines, under the 1991 LCR.
Page 28 GAO-17-424 Elevated Lead in Drinking Water
agency was evaluating all options outlined in its 2016 white paper as well as recommendations related to lead pipes by other stakeholders.67
According to EPA technical guidance on corrosion control, knowledge about lead service lines is needed for studies of corrosion control treatments. In addition, the National Drinking Water Advisory Council stated in its 2015 final report that knowledge about the location of lead service lines is essential to ensuring replacement and outreach to customers who are most likely to have a lead service line. We reported in March 2013 that, as the nation faces limited budgets and funding for federal programs, the importance of targeting federal funds to communities with the greatest need and spending funds efficiently increases.68 For example, the Water Infrastructure Improvements for the Nation Act, enacted in December 2016, directs EPA to establish a grant program for reducing the lead in drinking water by, among other things, replacing publicly owned lead service lines and assisting homeowners with replacing the lead service lines on their property. In addition, EPA’s 2016 action plan identifies the reduction of lead risks as a priority area. By requiring, in the upcoming revision of the LCR, that states report the available information about lead pipes in its SDWIS/Fed (or in future redesigns, such as SDWIS Prime) database, EPA and congressional decision makers would have important information at the national level on what is known about lead infrastructure in the country, thereby facilitating the agency in its oversight role.
In a 2016 report on how science and technology can address drinking water challenges, the President’s Council of Advisors on Science and Technology stated that, sample data are essential for evaluating the performance of a drinking water system.69 While the LCR requires small water systems to report all 90th percentile sample results (i.e., results that meet, fall below, and exceed the lead action level) to the states, it does not require the states to report all of this information to EPA through the SDWIS/Fed database. EPA headquarters officials said that the agency 67EPA officials said that in addition to the options outlined in the 2016 white paper, the agency was giving extensive consideration to the national experience in implementing the LCR as well as the experience in Flint, MI, as it develops proposed revisions to the LCR. 68GAO, Water Infrastructure: Approaches and Issues for Financing Drinking Water and Wastewater Infrastructure, GAO-13-451T (Washington, D.C.: Mar. 13, 2013). 69Executive Office of the President, President’s Council of Advisors on Science and Technology, Report to the President: Science and Technology to Ensure the Safety of the Nation’s Drinking Water, (Washington, D.C.: December 2016).
Data on Drinking Water Sample Results for Small Systems

Page 29 GAO-17-424 Elevated Lead in Drinking Water
had not required states to submit the results for all small systems due to the reporting burden on states. According to EPA’s reporting guidance for states, however, reporting all sample results to the SDWIS/Fed database for small water systems that do not exceed the lead action level is encouraged and will be accepted. EPA officials told us that SDWIS/Fed contained complete sample results for about 20,000 of the approximately 58,000 small water systems, or about 30 percent, of the 68,000 water systems.
Officials we interviewed in 1 of EPA’s 10 regional offices said that the lack of all 90th percentile sample results for small systems prevents the agency from observing such systems in SDWIS/Fed. In June 2017, EPA headquarters officials said that having all 90th percentile sample results for small systems would give the agency a more complete national picture of lead in drinking water. According to information on EPA’s website, small water systems can face unique managerial, financial and operational challenges in consistently providing drinking water that meets EPA standards and requirements.70 In 2016, EPA’s Office of Inspector General reported that small water systems are less likely to have the technical, managerial, and financial capacity to conduct actions that would ensure safe drinking water.71 The SDWA requires that EPA assist states in ensuring that water systems acquire and maintain technical, managerial, and financial capacity. In addition, the SDWA also authorizes EPA to provide technical assistance to small public water systems to enable such systems to achieve and maintain compliance with applicable national primary drinking water regulations, including the LCR.
Because it does not have complete 90th percentile sample results on small water systems, EPA does not have information on how such
70 Environmental Protection Agency, Building the Capacity of Drinking Water Systems, accessed May 18, 2017, https://www.epa.gov/dwcapacity/learn-about-small-drinking-water-systems. 71Environmental Protection Agency, Office of Inspector General, Enforcement and Compliance Drinking Water: EPA Needs to Take Additional Steps to Ensure Small Community Water Systems Designated as Serious Violators Achieve Compliance, 16-P-0108, (Washington, D.C.: March 2016). An EPA request for grant applications provides definitions for technical, managerial, and financial capacity. Technical capacity refers to the physical infrastructure of the water system and the ability of personnel to adequately operate and maintain the system and apply the necessary knowledge. Managerial capacity refers to the management structure and practices of the system such as staffing and communication with customers and regulators. Financial capacity refers to the financial resources of the system.
Page 30 GAO-17-424 Elevated Lead in Drinking Water
systems are managing the reduction of lead in their drinking water. Small systems represent the majority of water systems reporting samples that have exceeded the lead action level, but states are not required to submit all 90th percentile sample results for small systems in the SDWIS/Fed database; this would require a revision to EPA’s regulations. By requiring, in the upcoming LCR revision, that states report all 90th percentile sample results for small systems in the SDWIS/Fed database, EPA would have data to track the changes in lead levels over time among small systems and would be better positioned to assist states in early intervention for small water systems that are near the lead action level where appropriate. In June 2017, EPA officials said that as states move toward more modernized data flows using electronic reporting and SDWIS Prime, the burden for reporting should be significantly lowered.
EPA officials said that they analyze data in their SDWIS/Fed database and meet quarterly with state regulators to monitor compliance across all drinking water rules and that, in the last year, in response to the events in Flint, Michigan, they have increased their use of these data to monitor compliance and address implementation of the LCR.
EPA applies its Enforcement Targeting Tool to the violations data associated with the more than 90 drinking water contaminants regulated under SDWA for the purpose of identifying systems that merit action by states based on the seriousness of their violations. Specifically, the Enforcement Targeting Tool assigns a score to each water system based on, among other criteria, the types of violations and number of unresolved violations over the previous 5-year period. The Enforcement Targeting Tool assigns higher scores to health-based violations, such as treatment technique violations. Water systems whose scores meet or exceed a certain threshold are given higher enforcement priority for states (and EPA, if necessary). EPA officials we interviewed in all 10 of the regional offices said that they meet quarterly with state regulators to discuss the results generated by the Enforcement Targeting Tool and generally considered it to be a success. EPA headquarters officials agreed that the Enforcement Targeting Tool was a success, even with the agency’s challenges with the SDWIS/Fed data, including using data that are not always complete and accurate. However, these officials also told us that the Enforcement Targeting Tool was not designed for and therefore would not be appropriate for monitoring compliance with any single regulation, including the LCR. In April 2017, EPA headquarters officials told us that as of January 2017, the Enforcement Targeting Tool includes information on water systems’ most recent 90th percentile sample result and the
EPA Uses Available Data to Monitor Compliance with the LCR, and Officials Said That They Have Increased the Use of Data in the Last Year

Page 31 GAO-17-424 Elevated Lead in Drinking Water
number of 90th percentile sample results exceeding the lead action level over the previous 5-year time period.
EPA officials told us that they also conduct on-site file reviews of one to two states each year. File reviews involve regional staff comparing information on a sample of water systems in states’ databases with that in SDWIS/Fed to identify any discrepancies and to assess states’ compliance decisions. EPA headquarters officials told us that the agency developed a protocol for conducting file reviews and provided training on this protocol for the regions. Staff have discretion on how to prioritize the states in their regions. These file reviews cover all of the drinking water regulations, which allows them to also periodically assess how well states were implementing the LCR. According to EPA officials, in 2011, these file reviews replaced the data verification audits, which were discontinued in 2010; were designed to be generalizable to all water systems; and involved contractors comprehensively reviewing states’ water system inventories and violations and enforcement data and comparing them against the information in SDWIS/Fed. Agency officials said that the agency can no longer conduct these audits due to a lack of resources.72
EPA headquarters officials told us that the agency had begun using SDWIS/Fed data, in the last year, in response to the discovery of drinking water contaminated with elevated levels of lead in Flint, Michigan, as part of a two-pronged approach for reviewing states’ and water systems’ implementation of the LCR.
• The first part of EPA’s approach was to identify all of the water systems that reported sample results exceeding the federal action level from 2013 to 2016. EPA officials said that they requested that state officials provide updates on the status of each of the approximately 2,400 water systems identified as reporting such results. The purpose of this approach, according to EPA officials, was to determine whether the states and water systems were properly following the LCR’s requirements after a water system’s sample results exceeded the federal lead action level. In addition, the approach would allow, if necessary, states and EPA to have an
72EPA officials also told us that there were differences in frequency of the two types of efforts. For example, before 2010, EPA hired contractors to conduct data verification audits every 3 to 5 years; from 2007 to 2009 these contractors conducted 17 such audits. In contrast, EPA headquarters officials we interviewed said that EPA regional staff conducted five to seven file reviews from 2011 to 2012. EPA officials said that they did not have a schedule for file reviews.

Page 32 GAO-17-424 Elevated Lead in Drinking Water
opportunity for early intervention. EPA officials said that previously they had not systematically and uniformly analyzed all of the water systems in their database with sample results that exceed the federal lead action level or asked states, at any one time, to provide updates on all of the water systems with sample results exceeding the action level. Instead, EPA headquarters officials said that staff in the regional offices generally had worked with individual states on individual cases of water systems with sample results exceeding the action level as a part of the agency’s routine oversight efforts. EPA headquarters officials said that one outcome of their effort since the discovery in Flint, Michigan, was “lessons learned” about the importance of knowing where lead service lines are located and the need for states to focus more attention on small water systems and schools with their own water supplies. EPA officials we interviewed in some of the 10 regional offices said that meetings with state officials to discuss the water systems that had exceeded the lead action level had been beneficial because agency officials gained a better understanding of how states understood and implemented the requirements of the LCR.73 However, officials in 3 of the 10 regional offices said that they would ask states to provide these updates less frequently because of limited staff resources. EPA headquarters officials told us that an additional outcome of this approach was insight, for EPA staff, into the types of training state regulators may need about the implementation of LCR requirements.
• The second part of EPA’s approach, according to headquarters officials, was to review state protocols and practices against all of the requirements of the LCR to ensure that states were implementing the rule, including protocols and procedures for using corrosion control treatments.74 After reviewing state protocols and practices, EPA requested that states take such actions as providing information on their websites and documenting protocols and practices for greater transparency.75 In addition, EPA staff in the 10 regional offices conducted meetings with the state officials in their regions. Some of these EPA officials also told us that the agency determined that
73EPA officials in 8 of the 10 regional offices said that they would continue to ask states to provide updates on the water systems that exceeded the action level. 74According to its July 2016 letter to state agencies, EPA also asked states to publicize on websites sample results and guidance for citizens in order to increase transparency of LCR data. 75Environmental Protection Agency, Letter to Commissioners on State Actions with the Lead and Copper Rule, (Washington, D.C.: Feb. 29, 2016).

Page 33 GAO-17-424 Elevated Lead in Drinking Water
generally states were implementing the LCR appropriately. However, EPA identified weaknesses among states and water systems with identifying lead pipes and understanding the requirements for installing and maintaining corrosion control. In response, EPA officials told us that they updated guidance to states and water systems and offered training and written technical guidance on implementing corrosion control.76 Specifically, EPA officials said, they offered in-person training for state regulators in each of the 10 EPA regions on implementing the corrosion control requirements of the LCR.
Through discussions with state regulators, we identified multiple factors that may contribute to water systems’ noncompliance with the LCR. To determine whether such factors were associated with a higher likelihood of having a reported violation of the LCR, we conducted a statistical analysis that calculated a system’s likelihood of a violation using selected factors, such as the size of the population served and source water, and currently available EPA data and found that incorporating multiple factors in the analysis may help identify water systems at a higher likelihood of violating the LCR.
Based on our analysis of transcripts of discussion groups, state regulators representing 41 states and 1 territory identified 29 factors that may contribute to water systems’ noncompliance with the LCR.77 We also reviewed 31 studies and summarized the factors the authors identified.78 Table 1 identifies the 10 factors state regulators most frequently identified.
76Environmental Protection Agency, EPA 816-B-16-003. 77Appendix IV provides a description of the content analysis of the transcripts of the discussion groups. 78Appendix III provides information on all of the factors that state regulators identified in our discussions as well as examples of how those factors, individually and together, may contribute to violations of the LCR.
Certain Factors May Contribute to Water Systems’ Noncompliance with the LCR
Certain Factors May Contribute to Water Systems’ Noncompliance with the LCR
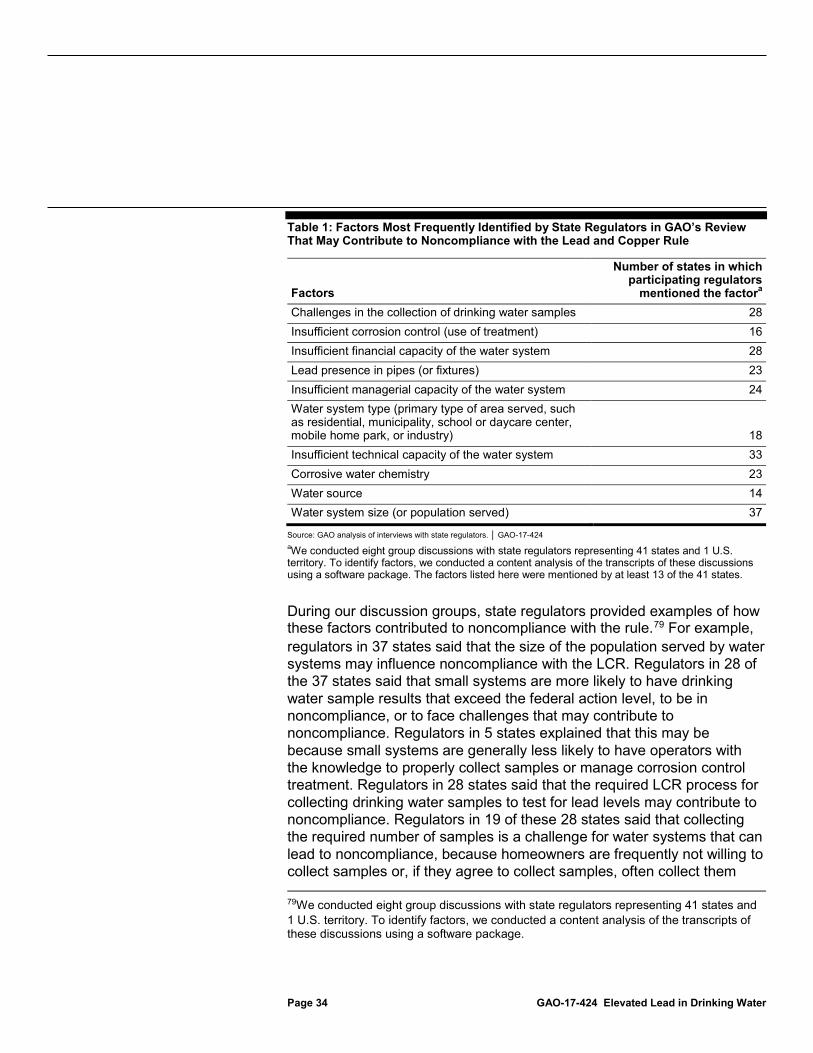
Page 34 GAO-17-424 Elevated Lead in Drinking Water
Table 1: Factors Most Frequently Identified by State Regulators in GAO’s Review That May Contribute to Noncompliance with the Lead and Copper Rule
Factors
Number of states in which participating regulators
mentioned the factora Challenges in the collection of drinking water samples 28 Insufficient corrosion control (use of treatment) 16 Insufficient financial capacity of the water system 28 Lead presence in pipes (or fixtures) 23 Insufficient managerial capacity of the water system 24 Water system type (primary type of area served, such as residential, municipality, school or daycare center, mobile home park, or industry) 18 Insufficient technical capacity of the water system 33 Corrosive water chemistry 23 Water source 14 Water system size (or population served) 37
Source: GAO analysis of interviews with state regulators. │ GAO-17-424 aWe conducted eight group discussions with state regulators representing 41 states and 1 U.S. territory. To identify factors, we conducted a content analysis of the transcripts of these discussions using a software package. The factors listed here were mentioned by at least 13 of the 41 states.
During our discussion groups, state regulators provided examples of how these factors contributed to noncompliance with the rule.79 For example, regulators in 37 states said that the size of the population served by water systems may influence noncompliance with the LCR. Regulators in 28 of the 37 states said that small systems are more likely to have drinking water sample results that exceed the federal action level, to be in noncompliance, or to face challenges that may contribute to noncompliance. Regulators in 5 states explained that this may be because small systems are generally less likely to have operators with the knowledge to properly collect samples or manage corrosion control treatment. Regulators in 28 states said that the required LCR process for collecting drinking water samples to test for lead levels may contribute to noncompliance. Regulators in 19 of these 28 states said that collecting the required number of samples is a challenge for water systems that can lead to noncompliance, because homeowners are frequently not willing to collect samples or, if they agree to collect samples, often collect them 79We conducted eight group discussions with state regulators representing 41 states and 1 U.S. territory. To identify factors, we conducted a content analysis of the transcripts of these discussions using a software package.

Page 35 GAO-17-424 Elevated Lead in Drinking Water
improperly.80 For example, homeowners may sample from an infrequently used faucet (e.g., outside spigot) instead of the required drinking water tap. Regulators in 20 states also described how the type of water system can lead to noncompliance. For example, they said that water systems for which water management and treatment are not the primary missions, such as schools, mobile home parks, and other entities, have challenges complying with the LCR.
These regulators also told us that the presence of multiple factors could, together, contribute to violations of the LCR. For example, a regulator in one state said that the presence of lead in the pipes, combined with corrosive water, could lead to sample results that exceed the federal lead action level for a water system. A 90th percentile sample result that exceeds the lead action level is not by itself a violation. However, if the same water system did not conduct the required corrosion control treatment study for any reason, including because it lacked the financial capacity to pay for the study, the system would be in violation of the LCR. 81 Appendix III provides information on all of the factors that state regulators in the 41 states and 1 territory identified in our discussions as well as examples of how those factors, individually and together, may contribute to violations of the LCR.
The 31 academic studies we reviewed associated certain factors with elevated concentrations of lead in public drinking water, human exposure to lead in drinking water, or violations of drinking water laws and regulations. These studies identified the potential effects of, among other factors,
• the presence of lead in pipes or lead solder, within the water system’s pipes;
• natural disturbances within drinking water pipes, such as stagnant or soft water;
80Regulators in the remaining nine states said that the improper collection of water samples by water systems is a challenge or they discussed specific challenges that small systems face in collecting water samples. 81Under the SDWA, a state or EPA may grant an exemption extending deadlines for compliance with a treatment technique if it finds, among other things, that (1) due to compelling factors (which may include economic factors), the water system is unable to comply with the requirement and (2) the exemption will not result in an unreasonable risk to human health. 42 U.S.C. 300g-5. A system granted an exemption may generally receive up to 3 years to install the required treatment technique.

Page 36 GAO-17-424 Elevated Lead in Drinking Water
• operator actions to address lead in drinking water, such as the use of corrosion control to decrease the presence of lead and the use of chemical treatments to decrease the presence of other contaminants that may increase the presence of lead;
• a water system’s capacity to address existing lead challenges, such as the size of the population it serves and whether the system is publically or privately owned; and
• state and local policies designed to reduce drinking water violations or human exposure to lead in water.
Our interviews with state regulators and review of academic studies suggest that certain factors could indicate whether water systems are at a higher likelihood for having a reported violation of the LCR. We selected four system characteristics that were consistent with the factors reported by state regulators in discussion groups and were available in SDWIS/Fed to conduct a statistical analysis:
• the population served by (or size of) the drinking water system,
• whether the drinking water system was publicly- or privately-owned,
• whether the drinking water system used groundwater or surface water as a source and
• whether the drinking water system was classified as a community water system or a non-transient non-community water system.
We also included the factor of whether a system had sample results that exceeded the lead action level. SDWIS/Fed does not include data on such factors as the presence of lead service lines or technical, managerial, and financial capacity.
We were unable to develop a nationwide statistical model referred to as a logistic regression analysis.82 A logistic regression analysis can identify factors that are associated with a violation and can estimate a drinking water system’s likelihood of a violation based on these factors. We have previously found that regression analysis can identify entities, regulated
82A multivariate logistic regression model is an equation, which is developed through statistical procedures, that estimates the individual influence of each factor on the likelihood of a violation while simultaneously accounting for the influence of the other factors. See app. V for additional information.
Use of a Statistical Analysis Could Help Identify Systems at Higher Likelihood of LCR Violations
Page 37 GAO-17-424 Elevated Lead in Drinking Water
by a federal program, that pose a higher likelihood for a particular outcome.83 However, during our review of the reliability of EPA’s data on violations, we could not verify that the limitations in the completeness of the data identified in our June 2011 report had been sufficiently addressed, nationwide.84 Specifically, in June 2011, we found that EPA had not been able, among other things, to resume the comprehensive and routine data verification audits that would provide it with current information on the completeness of the data states provide to SDWIS/Fed. As a result, in June 2011, we recommended that EPA resume data verification audits to routinely evaluate the quality of selected drinking water data on health-based and monitoring violations that the states provide to EPA. These audits should also evaluate the quality of data on the enforcement actions that states and other primacy agencies have taken to correct violations. EPA partially agreed with our recommendation and stated that it has found that data verification audits provide valuable information on data completeness but did not commit to conducting such audits beyond 2011. Instead, EPA said that until the next generation of SDWIS (SDWIS Prime) is deployed, thus enabling the agency to view compliance monitoring data and compliance determinations directly, it will consider using data verification audits to evaluate data quality. As of October 2016, EPA reported that it has not conducted another data verification audit.
Because of the limitations of using SDWIS/Fed data to conduct a nationwide analysis, we sought to use such data to conduct an analysis for individual states to determine whether factors could predict the likelihood that a water system would violate the LCR.85 As such, we used 83For example, in 2007 we found that regression analysis could improve the ability of the Federal Motor Carrier Safety Administration to detect motor carriers, such as trucks and buses that pose a high risk of highway crashes. GAO, Motor Carrier Safety: A Statistical Approach Will Better Identify Commercial Carriers That Pose High Crash Risks Than Does The Current Federal Approach, GAO-07-585, (Washington, D.C.: June 11, 2007). 84GAO-11-381. In June 2011 we reported, among other things, that 91 percent of the errors from EPA’s 2009 data verification audits were the result of states (or EPA acting as the state agency) not issuing a violation and not reporting that violation to SDWIS/Fed. In addition, we also found that states did not report or inaccurately reported monitoring and reporting violations. 85We first selected the eight most populous statesCalifornia, Texas, Florida, New York, Illinois, Pennsylvania, Ohio, and Georgia. Of these eight states, EPA had recently (since 2014) conducted file reviews to verify whether information in the states’ databases and files were consistent with what was in SDWIS/Fed for California, New York, Ohio, and Texas. Of the four states with recent file reviews, EPA found few or no discrepancies between the LCR data in the state systems and in SDWIS/Fed for Ohio and Texas.

Page 38 GAO-17-424 Elevated Lead in Drinking Water
data from Ohio and Texas to examine the potential for developing a statistical analysis to identify drinking water systems at higher likelihood of having a reported violation. EPA found few or no discrepancies between the LCR data in these state systems and in SDWIS/Fed for the time period of our statistical analysis, 2013 to 2016. The results of our analysis are not generalizable to other states.
To conduct an analysis for the two states, we developed a series of logistic regression models for these states using (1) LCR violations data for Ohio and Texas in SDWIS/Fed for 2013 and 2014 and (2) the four factors for which data were available in SDWIS/Fed (size of the population served, ownership, source water, and water system type). Our models estimated the likelihood that a water system in those two states would have a reported violation of the LCR based on these factors. We found that water systems with certain factors had a higher likelihood of having a reported violation of the LCR than water systems without those factors. For example, in both states, a water system serving 100 people was more likely to have a reported violation of the LCR than a water system serving 1,000 people. In addition, systems with a previous sample result that exceeded the lead action level were more likely to have a reported violation of the LCR than systems without a previous sample result that exceeded the lead action level.
We then tested the ability of our models to predict subsequent rates of having reported violations. Specifically, we compared the estimates from our models to violations that were actually reported in SDWIS/Fed in 2015 and 2016. We found that water systems that we identified as having higher likelihoods of having a reported violation, based on our models, had significantly higher rates of reported violations in 2015 and 2016. The results of our analysis indicate that multiple factors, in addition to whether a system had sample results that exceeded the lead action level, could be used to predict water systems with a higher likelihood of having a reported violation of the LCR.
Our analysis suggests that a statistical analysis of EPA data could be used to identify water systems with a higher likelihood of having a reported violation of the LCR. However, we identified two key limitations, among others, based on the state of the data in SDWIS/Fed as of December 2016. The first was the quality of the data for the purposes of conducting an analysis. We could not be confident in the specific results of a nationwide or, for some states, a state-specific analysis, because we did not have the necessary assurances of the accuracy and completeness of the SDWIS/Fed data, issues about which we previously
Page 39 GAO-17-424 Elevated Lead in Drinking Water
reported in January 2006 and June 2011.86 EPA headquarters officials told us in June 2011 and April 2016 that their upcoming SDWIS/Fed upgrade, SDWIS Prime, could give the agency direct access to state data. Having complete and accurate data for all states or a nationally representative sample of states would allow for a nationwide analysis.
The second limitation was that data are not available for many of the factors identified by state regulators that may contribute to water systems’ noncompliance with the LCR. Our analysis was limited to those four factors for which states submit data to EPA’s SDWIS/Fed. Because data were unavailable for all potentially relevant factors, we were unable to include information on the presence of lead pipes, lack of financial capacity, and lack of technical capacity. EPA headquarters officials told us that they were considering the development of indicators of capacity. For example, these officials said that potential indicators suggesting a drinking water system is challenged by capacity are the drinking water system (1) not having raised rates in 20 years; (2) not having recently used asset management; or (3) having experienced difficulty in retaining trained operators. Data on the presence of lead pipes, financial capacity, technical capacity, and other factors may allow for stronger logistic regression models that more accurately identify water systems with a higher likelihood for violations.87 Appendix V provides a technical description of the statistical analysis we conducted.
According to EPA, the agency promulgated the LCR to protect public health by minimizing the levels of lead in the drinking water supply.88 EPA’s current approach for oversight of the LCR targets water systems with sample results that exceed the lead action level. This approach is reasonable because water systems that exceed the action level have a known and documented lead exposure risk and are required under the LCR to take actions that are considered health-based. This approach, however, primarily incorporates one factorsample results that exceed 86GAO-06-148 and GAO-11-381. 87The statistical analysis illustrated in this report would not predict a specific crisis involving a specific water system. However, theoretically, a statistical analysis that incorporated more data on a wider variety of factors could have identified patterns in the population of water systems so that the particular factors present in a single water system may have been targeted for increased oversight. 88Environmental Protection Agency, Lead and Copper Rule Revisions White Paper. Appendix VI provides an example of a 2005 EPA brochure for the public on lead hazards in drinking water, including health effects.

Page 40 GAO-17-424 Elevated Lead in Drinking Water
the lead action leveland does not include the potential of having reported violations across all of the requirements of the LCR. In addition, EPA officials we interviewed in 3 of the 10 regional offices said that they do not have the resources to sustain the agency’s current approach. Under federal standards for internal control, management should identify, analyze, and respond to risks related to achieving the defined objectives. Although EPA may not have the resources to continue the use of its current approach of following up on all sample results that exceed the lead action level, our analysis illustrates that EPA collects data that, where complete and accurate, could be incorporated into a risk-based analysis. For example, such an analysis could be used in individual states or geographical areas, while EPA is taking steps to improve its data and implement SDWIS Prime. A statistical, risk-based analysis, whether it is used for individual states or nationwide, may provide EPA with an additional tool by which it may be able to efficiently target its limited resources for oversight of water systems and meet its goal of reducing the risk of lead exposure. By developing a statistical analysis that incorporates multiple factors—including those currently in SDWIS/Fed and others such as the presence of lead pipes and the use of corrosion control—to identify water systems that might pose a higher likelihood for violating the LCR once complete violations data are obtained such as through SDWIS Prime, EPA could supplement its current efforts to better target its oversight to the water systems that present a higher risk of violating the LCR.
EPA has taken several actions to increase transparency about lead hazards, focus on water systems’ sample results over the federal lead action level, and ensure a better understanding of how states and water systems interpret and implement the LCR. However, most states are not submitting data to the SDWIS/Fed database on water systems’ use of corrosion control as required by the LCR. We continue to believe that EPA should take actions to address our 2006 recommendation. Further, by requiring that states report the available information about lead pipes in EPA’s SDWIS/Fed database nationally, EPA and congressional decision makers would have important information at the national level about lead infrastructure, thereby facilitating the agency in its oversight role.
The LCR does not require states to submit data to EPA’s SDWIS/Fed database on all 90th percentile sample results for small water systems, only to provide sample results that exceed the lead action level. EPA has long acknowledged the challenges experienced by small water systems,
Conclusions

Page 41 GAO-17-424 Elevated Lead in Drinking Water
as evidenced in the data for samples that exceed the lead action level and violations for taking samples as required and reporting sample results. The upcoming revision of the LCR provides an opportunity for EPA to require states to report all 90th percentile sample results for small systems. By doing so, EPA would have data to track the changes in lead levels over time among small systems and would be better positioned to assist states in early intervention for small water systems that are near the lead action level where appropriate. EPA also has an opportunity to enhance its oversight of the LCR by using statistical analyses to analyze those data that it currently collects and has determined to be complete. With the LCR applying to about 68,000 water systems across the country (or approximately 45 percent of all drinking water systems), it is important to target limited resources to those water systems that pose the highest likelihood of a violation. By developing a statistical analysis that incorporates multiple factors—including those currently in SDWIS/Fed and others such as the presence of lead pipes and the use of corrosion control—to identify water systems that might pose a higher likelihood for violating the LCR, EPA could supplement its current efforts and better target its oversight to the water systems that present a higher likelihood of violating the LCR, particularly when complete violations data are more readily available through upgrades, such as SDWIS Prime.
We are making the following three recommendations to EPA:
• The Assistant Administrator for Water of EPA’s Office of Water should require states to report available information about lead pipes to EPA’s SDWIS/Fed (or a future redesign such as SDWIS Prime) database, in its upcoming revision of the LCR; (Recommendation 1)
• The Assistant Administrator for Water of EPA’s Office of Water should require states to report all 90th percentile sample results for small water systems to EPA’s SDWIS/Fed (or a future redesign such as SDWIS Prime) database, in its upcoming revision of the LCR; (Recommendation 2) and
• The Assistant Administrator for Water of EPA’s Office of Water and the Assistant Administrator of EPA’s Office of Enforcement and Compliance Assurance should develop a statistical analysis that incorporates multiple factors—including those currently in SDWIS/Fed and others such as the presence of lead pipes and the use of corrosion control—to identify water systems that might pose a higher likelihood for violating the LCR once complete violations data are obtained, such as through SDWIS Prime. (Recommendation 3)
Recommendations for Executive Action
Page 42 GAO-17-424 Elevated Lead in Drinking Water
We provided a draft of this report to EPA for review and comment. In its written comments, reproduced in appendix VII, EPA stated that it generally agreed with all three of our recommendations and the importance of ensuring that the agency has the information needed to ensure effective oversight of the drinking water programs. EPA also provided technical comments which we incorporated, as appropriate.
EPA stated that our first two recommendations relate to the LCR revisions: (1) report available information about lead pipes to EPA’s database and (2) report all 90th percentile sample results for small water systems to EPA’s SDWIS/Fed (or a future design such as SDWIS Prime). As a result, EPA said that it would consider our recommendations along with those of other stakeholders as the agency continues to support the development of the proposed LCR for publication in the Federal Register and follows the public review and comment process in 2018. In addition, EPA said that the agency would continue to work with states to develop SDWIS Prime and another electronic reporting tool, which will facilitate electronic reporting, which in turn will increase data accuracy and completeness.
In response to our third recommendation, EPA stated that it agrees with the concept of our third recommendation to develop a national statistical analysis that could identify water systems with a higher likelihood of violating the LCR and that the agency previously tried to build a similar tool but faced challenges due to variations between selected factors and violations between states. EPA also said that while developing a national tool would be a challenge, it would be beneficial to both the agency and state primacy agencies.
As agreed with your offices, unless you publicly announce the contents of this report earlier, we plan no further distribution until 30 days from the report date. At that time, we will send copies of this report to the appropriate congressional committees; the Administrator of the Environmental Protection Agency, and other interested parties. In addition, this report will be available at no charge on the GAO website at http://www.gao.gov.
Agency Comments

Page 43 GAO-17-424 Elevated Lead in Drinking Water
If you or your staff members have any questions about this report, please contact me at (202) 512-3841 or [email protected]. Contact points for our Offices of Congressional Relations and Public Affairs may be found on the last page of this report. Key contributors to this report are listed in appendix VIII.
J. Alfredo Gómez Director, Natural Resources and Environment
Page 44 GAO-17-424 Elevated Lead in Drinking Water
List of Requesters
The Honorable Frank Pallone, Jr. Ranking Member Committee on Energy and Commerce House of Representatives
The Honorable Paul Tonko Ranking Member Subcommittee on Environment Committee on Energy and Commerce House of Representatives
The Honorable Rosa L. DeLauro House of Representatives
The Honorable Mike Quigley House of Representatives

Appendix I: Objectives, Scope, and Methodology
Page 45 GAO-17-424 Elevated Lead in Drinking Water
This report examines the issue of elevated lead in drinking water and the Environmental Protection Agency’s (EPA) use of compliance data for oversight of the Lead and Copper Rule (LCR). Our objectives were to examine (1) what the available EPA data show about compliance with and enforcement of the LCR among water systems, including schools; (2) how EPA uses these data to monitor compliance; and (3) factors, if any, that may contribute to water systems’ noncompliance with the LCR. We compared our evidence on EPA’s a use of these data for oversight of the LCR to Standards for Internal Control in the Federal Government.1 According to these standards, internal control is a process by an entity’s oversight body, management, and other personnel that provides reasonable assurance that the objectives of an entity will be achieved. An effective internal control system increases the likelihood that an entity will achieve its objectives. For this review, we used the standard for one of the five components of internal controlrisk assessmentas criteria.
To examine what the EPA data show about reported compliance and enforcement, we reviewed LCR data in EPA’s Safe Drinking Water Information System (SDWIS/Fed) for the time period July 1, 2011, to December 31, 2016. We chose this time period because it provided the most recent history of available compliance data without a change in the regulations at the time of our analysis. The LCR data contained information on 67,581 active community water systems and non-transient non-community water systems, including those that were schools or daycare centers with their own water supply. Table 2 provides the water systems, by type and size, included in our analysis. The LCR divides water systems into three broad categories: small, medium, and large. Size is a factor in determining the number of samples that must be collected as well as the applicability and timing of some of the LCR requirements.
1GAO, Standards for Internal Control in the Federal Government, GAO-14-704G (Washington, D.C.: September 2014).
Appendix I: Objectives, Scope, and Methodology

Appendix I: Objectives, Scope, and Methodology
Page 46 GAO-17-424 Elevated Lead in Drinking Water
Table 2: Water Systems Included in GAO’s Analysis of EPA’s SDWIS/Fed Data as of December 31, 2016
Number of water systems, by size Small
(25 to 3,300) Medium
(3,301 to 50,000) Large
(more than 50,000) Total Water systems (excluding schools and daycare centers) 50,844 8,390 974 60,208 Schools 5,786 61 1 5,848 Day Care centers 1,165 3 0 1,168 Sub-Total 57,795 8,454 975 67,224 Water systems-othera NA NA NA 357 Total NA NA NA 67,581
Legend: EPA = Environmental Protection Agency; SDWIS/Fed = Safe Drinking Water Information System; NA = Total not presented in the table. Source: GAO analysis of EPA’s SDWIS/Fed data. │ GAO-17-424
aWater systems-other are those water systems without a known primary service area in EPA’s Safe Drinking Water Information System.
We reviewed the available data on corrosion control, drinking water sample results, violations of the requirements of the LCR, and state and EPA enforcement actions. We also described the data by population served/size, whether the water system was a school or daycare center, and whether the water system was a community water system or a non-transient non-community water system, among other factors. We analyzed data on sample results for a 3-year time period (from January 2014 to December 2016) and for a 5 1/2-year period (from July 2011 to December 2016). EPA officials told us that they analyze sample data over a 3-year period rather than yearly to ensure that the majority of water systems will have submitted sample results.2 When presenting a comparison of the sample data and the milestone data on corrosion control, we used the 5 1/2-year period for both sets of data. For violations data, we presented open violations as of December 2016.3 Violations are considered open when the state has not determined that a water system is in compliance with the specific requirement for which it received the
2According to EPA’s guidance to water systems, standard tap samples should be taken every 6 months. However, if water systems meet certain requirements they can collect tap samples once every year, once every 3 years; or for a very limited number of small water systems, once every 9 years. 3We defined open violations as those with a compliance code of “O” (open) or “K” (known). According to EPA officials, “K” refers to violations for which the compliance period/end date is known but have not been returned to compliance, and therefore, are considered as open violations (because they have not been closed).

Appendix I: Objectives, Scope, and Methodology
Page 47 GAO-17-424 Elevated Lead in Drinking Water
violation. Finally, we presented data on enforcement actions for a 5 1/2-year period (July 2011 through December 2016) to ensure that we provided the most complete picture of the range of state and federal actions taken and to avoid comparisons with the violations data. According to a 2013 EPA compliance report, enforcement data, in any one year, do not necessarily correlate with violations data.4 In addition, the compliance report states that enforcement actions can be initiated against violations that occurred in a previous year, one enforcement action may address numerous violations at the same system; and it can take several years for a system to return to compliance.
We reviewed the data available in the SDWIS/Fed database and the compliance requirements in the LCR to evaluate those aspects of the LCR for which implementation data were available.5 We interviewed officials from EPA’s Office of Water and Office of Enforcement and Compliance Assurance on the reliability, completeness and accuracy of LCR data in SDWIS/Fed. In addition, we reviewed EPA data reliability assessments, recent file reviews for selected states, a 2017 EPA OIG report on the reliability of SDWIS/Fed sample data, data verification reports and past GAO reports on the reliability of the data in SDWIS/Fed.6 For example, EPA’s file reviews in some states found that not all violations data were reported to SDWIS/Fed, which could lead to undercounting. In addition, some state regulators told us that samples may be collected incorrectly by some homeowners, which could lead to inaccurate sample results. EPA has stated on its website that the agency acknowledges challenges related to the data in SDWIS/Fed, specifically underreporting of some data by states. GAO has also reported on EPA’s challenges with SDWIS/Fed.7 Based on this, the compliance data in SDWIS/Fed likely underreport the actual number of sample results that
4Environmental Protection Agency, Providing Safe Drinking Water in America: 2013 National Public Water Systems Compliance Report, 305R15001 (Washington, D.C.: 2013). 5See 40 C.F.R. pt. 141. subpt I. 6Environmental Protection Agency, Office of Inspector General, EPA Is Taking Steps to Improve State Drinking Water Program Reviews and Public Water Systems Compliance Data, 17-P-0326 (Washington, D.C.: July 18, 2017). 7GAO, Drinking Water: EPA Should Strengthen Ongoing Efforts to Ensure That Consumers Are Protected from Lead Contamination. GAO-06-148, (Washington, D.C.: Jan. 4, 2006) and Drinking Water: Unreliable State Data Limit EPA’s Ability to Target Enforcement Priorities and Communicate Water Systems’ Performance, GAO-11-381, (Washington, D.C.: June 17, 2011).
Appendix I: Objectives, Scope, and Methodology
Page 48 GAO-17-424 Elevated Lead in Drinking Water
exceed the lead action level, milestones, violations, and enforcement actions, which we note in this report. Because of the incompleteness of reported data on sample results, violations, and enforcement actions, and because of concerns raised by state officials about sample data, we found the data to be of undetermined reliability. For this review, we describe the data about water systems’ compliance with the LCR compliance and EPA’s enforcement actions as they are reported in SDWIS/Fed for the purpose of providing a current assessment of EPA’s use of the data.
To examine how EPA uses LCR data to monitor compliance we conducted semistructured interviews with EPA officials. We used a standard set of questions to interview officials in EPA’s headquarters and in each of the 10 regional offices. Our standard set of open-ended questions for EPA’s 10 regional offices asked about state actions responding to EPA’s requests about, among other things, implementation of the LCR, the use of SDWIS/Fed data, enforcement tools, and compliance with the LCR among water systems and schools. We conducted in-person interviews with officials responsible for monitoring compliance in states within EPA regions 1, 2, 3, 4, 5, and 7. We identified these regions based on a 2016 survey8 that estimated that these regions have the highest number of lead service lines. We spoke with officials in EPA regions 6, 8, 9, and 10 on the telephone. Table 3 provides a list of the EPA regions and the states under the regulatory jurisdiction of those regions. Our in-person interviews with officials in EPA regions 1through 5 and 7 were in offices located in Boston, Massachusetts; New York, New York; Philadelphia, Pennsylvania; Atlanta, Georgia; Chicago, Illinois; and Lenexa, Kansas, respectively. In these cities, we also met with state primacy agencies and local water systems and other local officials, when possible, to obtain examples of compliance and enforcement practices and implementation challenges. Specifically, we met with state drinking water officials in Massachusetts and Georgia. We met with officials representing local water systems in Atlanta, Boston, New York, Chicago, and Kansas City, Missouri. In total, we held 10 interviews with EPA staff in the regional offices and seven interviews with state and local officials in the cities we visited. We also reviewed EPA policy documents that outlined the agency’s enforcement approach and documents related to EPA’s request that states take certain actions following the events in Flint, 8David A. Cornwell, Richard A. Brown, and Steve H. Via, National Survey of Lead Service Line Occurrence, Journal American Water Works Association, vol. 108, no. 4 (2016), accessed http://dx.doi.org/10.5942/jawwa.2016.108.0086.

Appendix I: Objectives, Scope, and Methodology
Page 49 GAO-17-424 Elevated Lead in Drinking Water
Michigan.9 Finally, we reviewed federal regulations; EPA guidance to states and water systems on how to implement the LCR; the 2016 action plan; information on what constitutes a violation of the LCR, action plans, and other relevant documents.10
Table 3: EPA’s 10 Regional Offices and the States and Territories within Those Regions
EPA region States and territories in the EPA region Region 1 Connecticut, Massachusetts, Maine, New Hampshire, Rhode Island, Vermont Region 2 New Jersey, New York, Puerto Rico, U.S. Virgin Islands Region 3 Delaware, District of Columbia, Maryland, Pennsylvania, Virginia, West Virginia Region 4 Alabama, Florida, Georgia, Kentucky, Mississippi, North Carolina, South Carolina, Tennessee Region 5 Illinois, Indiana, Michigan, Minnesota, Ohio, Wisconsin Region 6 Arkansas, Louisiana, New Mexico, Oklahoma, Texas Region 7 Kansas, Iowa, Missouri, Nebraska Region 8 Colorado, Montana, North Dakota, South Dakota, Utah, Wyoming Region 9 Arizona, California, Hawaii, Nevada, Pacific Islands Region 10 Alaska, Idaho, Oregon, Washington
Source: Environmental Protection Agency (EPA) │ GAO-17-424
To identify the factors that may influence water systems’ risk of noncompliance with the LCR, we conducted a content analysis of information provided by state regulators in discussion groups. To assess whether selected factors available in SDWIS/Fed could be used to predict reported violations, we conducted a statistical analysis of EPA data to develop an illustrative model. We conducted a literature review to identify factors associated with elevated concentrations of lead in public drinking water, human exposure to lead in drinking water, or violations of drinking water laws and regulations.
Discussion groups with state regulators. We conducted discussion groups with a nonprobability sample of state drinking water regulators to
9Environmental Protection Agency, Letter to Commissioners on State Actions with the Lead and Copper Rule, (Washington, D.C.: Feb. 29, 2016) and Drinking Water Enforcement Response Policy, (Washington, D.C.: Dec. 8, 2009). 10Environmental Protection Agency, Lead and Copper Rule 2007 Short-Term Regulatory Revisions and Clarifications State Implementation Guidance, EPA816-R-08-009, (Washington, D.C.: June 2008); Lead and Copper Rule Monitoring and Reporting Guidance for Public Water Systems, EPA 816-R-10-004, (Washington, D.C.: March 2010); and Drinking Water Action Plan, (Washington, D.C.: November 2016).

Appendix I: Objectives, Scope, and Methodology
Page 50 GAO-17-424 Elevated Lead in Drinking Water
contribute to our understanding of the potential factors that may influence noncompliance with the LCR. We invited regulators from all states and territories to participate via email. In total, we conducted eight, 1-hour discussion groups over the telephone in September and October 2016. Regulators representing 41 states and 1 territory participated in these discussion groups.11 Each discussion group had from 2 to 8 states or territory, and each state or territory had a primary designated spokesperson. During each discussion group, the GAO moderator asked participants to list one or two factors that, in their experience, most strongly influence a water system’s ability to comply with the LCR. Each state provided a list of factors. The moderator then asked participants to elaborate on how the factors reported could influence compliance. When necessary, the moderator asked probing questions to further clarify participants’ comments. Two or three analysts transcribed each session and combined and reconciled notes to develop transcripts for each of the discussion groups. We conducted a content analysis of the transcripts from the eight discussion groups to identify the factors most frequently reported by the participants in the groups. Two GAO analysts independently classified each comment using qualitative analysis software. The findings from these discussion groups may not be generalizable to all state regulators. We provide a narrative description of the results of our discussions with the state regulators in appendix III and a technical description of the content analysis we conducted in appendix IV.
Statistical analysis. We conducted a statistical analysis to illustrate whether predictive modeling could be used to identify water systems with a higher likelihood of a reported violation of the LCR. To conduct our analysis, we used the same data from EPA’s SDWIS/Fed for systems listed as active as of December 31, 2016 as mentioned above. We selected two statesOhio and Texasbecause EPA’s file reviews indicated that there were not significant discrepancies during the scope and time period of our analysis, which focused on 2013 to 2016, in the
11The states and territory that participated in the discussion groups were: Alabama, Alaska, California, Colorado, Delaware, Florida, Hawaii, Idaho, Illinois, Indiana, Iowa, Kansas, Kentucky, Louisiana, Maine, Maryland, Michigan, Minnesota, Mississippi, Missouri, Montana, Nebraska, Nevada, New Hampshire, New Jersey, New Mexico, North Carolina, North Dakota, Ohio, Oklahoma, Oregon, Pennsylvania, Puerto Rico, Rhode Island, South Carolina, Tennessee, Texas, Virginia, West Virginia, Wisconsin and Wyoming. Massachusetts and Georgia regulators did not participate in the discussion groups but met with us for in-person interviews.

Appendix I: Objectives, Scope, and Methodology
Page 51 GAO-17-424 Elevated Lead in Drinking Water
LCR data reported by these states to SDWIS/Fed.12 We reviewed EPA’s 2016 file reviews of data the states provide to SDWIS/Fed and interviewed EPA and state officials for Texas and received written responses to our questions from Ohio. For each of the sampled systems, EPA reviewed state records to determine whether the state was correctly identifying violations and reporting those violations to SDWIS/Fed. Although, unlike EPA’s previous reviews, EPA’s 2016 file reviews are not based on generalizable samples, they were conducted for a broad range of drinking water systems in each of the states. Based on the results of EPA’s reviews, we determined that these two states had sufficiently reliable data for our purposes of illustrating a statistical approach. The results of our analysis for these two states are not generalizable to other states. Our analysis included three steps. We first conducted a bivariate analysis to determine whether the following four factors correspond to violations of the LCR for 2013 to 2014: (1) size of the population served; (2) water source (groundwater or surface water); (3) ownership (public or private); and (4) whether the system is a community water system or non-transient, non-community water system. We also included the factor of whether sample results exceeded the lead action level. We then developed a series of multivariate logistic regression models. Specifically, multivariate logistic regression modeling is statistical method for analyzing the potential influence of each individual factor on the likelihood of a binary outcome (e.g., a violation) while simultaneously accounting for the potential influence of the other factors. We selected this type of model because it could account for the factors simultaneously. Lastly, to test whether our models could be used to identify systems with a higher likelihood of a future violation, we compared the values generated by our models to actual violations reported in the SDWIS/Fed data in 2015 to 2016. We provide a technical description of the statistical analysis we conducted, including determinations about the reliability of the data and the limitations of the analysis, in appendix V.
Literature review. We reviewed studies concerning detection of lead in drinking water and violation of drinking water regulations. These studies were identified through searches by GAO research librarians for peer-
12We first selected the eight most populous statesCalifornia, Texas, Florida, New York, Illinois, Pennsylvania, Ohio, and Georgia. Of these eight states, EPA had recently (since 2015) conducted file reviews to verify whether information in the states’ databases and files were consistent with what was in SDWIS/Fed for California, New York, Ohio, and Texas. Of the four states with recent file reviews, EPA did not find any discrepancies between the LCR data in the state systems and in SDWIS/Fed for Ohio and Texas.
Appendix I: Objectives, Scope, and Methodology
Page 52 GAO-17-424 Elevated Lead in Drinking Water
reviewed materials in such databases as ProQuest, Scopus, Academic One-File, and Web of Science. Librarians conducted searches using such terms and phrases as lead and copper, water supply, drinking water, lead exposure and lead poisoning alone and in combination with one another. We also identified and reviewed relevant publications by trade groups, think tanks, and other nongovernmental organization. We narrowed a preliminary selection of results by reviewing abstracts and introductions, where applicable. Based on that preliminary review, we determined that 31 sources fit within the scope of our engagement objectives. We then reviewed the data and key findings of each of these 31 sources to formulate and refine some hypotheses concerning violations of the LCR and detection of lead in drinking water. The hypotheses were reviewed by a GAO technical expert to ensure that they were sufficiently supported by the cited corresponding research.

Appendix II: Additional Analysis of Available EPA Data on Reported Sample Results, Violations, and Enforcement for the Lead and Copper Rule
Page 53 GAO-17-424 Elevated Lead in Drinking Water
Environmental Protection Agency (EPA) data from July 1, 2011, to December 31, 2016, can provide information on compliance by water systems and enforcement by states and EPA regarding the Lead and Copper Rule (LCR). This appendix provides additional information from our analysis of what the EPA data in the agency’s Safe Drinking Water Information System (SDWIS/Fed) show about compliance with and enforcement of the LCR. The LCR requires water systems to monitor drinking water at customer taps, and if lead levels are elevated, take additional actions to control corrosion, inform the public, and in some circumstances replace lead service lines under the systems’ control. States generally have primary responsibility for monitoring and enforcement of Safe Drinking Water Act requirements, including the LCR.1 In this appendix, we provide additional results of our analysis of the LCR data for (1) sample results, (2) violations, and (3) enforcement. We reported in January 2006, that the LCR data, and in June 2011, the data in SDWIS/Fed generally, were not accurate or complete.2 According to EPA, some of the violations data are underreported. In addition, a 2017 EPA Office of Inspector General report indicated that sample data, specifically, are potentially underreported.3 In addition, some state regulators with whom we interviewed in 2016 told us that homeowners and water systems may take LCR samples improperly as we discuss in this report. See, also, appendix III for these state regulators’ views on waters systems’ challenges with implementing the sample requirements under the LCR. We present the data that were available in the SDWIS/Fed database at the time of our review.
The LCR requires that all water systems periodically obtain tap water samples and for sample results that exceed an action level of 15 parts per billion (ppb) to determine if corrosion control treatments are working
1EPA has authorized all states except Wyoming and the District of Columbia to have primary responsibility for monitoring and enforcement of Safe Drinking Water Act requirements. EPA administers drinking water programs directly in those two jurisdictions. 2GAO, Drinking Water: EPA Should Strengthen Ongoing Efforts to Ensure That Consumers Are Protected from Lead Contamination, GAO-06-148 (Washington, D.C.: Jan. 4, 2006), and Drinking Water: Unreliable State Data Limit EPA’s Ability to Target Enforcement Priorities and Communicate Water Systems’ Performance. GAO-11-381. Washington, D.C.: June 17, 2011. 3Environmental Protection Agency, Office of Inspector General, EPA Is Taking Steps to Improve State Drinking Water Program Reviews and Public Water Systems Compliance Data, 17-P-0326 (Washington, D.C.: July 18, 2017).
Appendix II: Additional Analysis of Available EPA Data on Reported Sample Results, Violations, and Enforcement for the Lead and Copper Rule
Sample Results

Appendix II: Additional Analysis of Available EPA Data on Reported Sample Results, Violations, and Enforcement for the Lead and Copper Rule
Page 54 GAO-17-424 Elevated Lead in Drinking Water
properly. EPA requires states to report (1) sample results for any water system whose 90th percentile sample results exceed the federal action level of 15 parts per billion; and, (2) sample results for large and medium water systems even if the sample results do not exceed the lead action level.4 From January 1, 2014, to December 31, 2016, there were approximately 1,430 water systems reporting sample results over the lead action level (see table 4), the majority of which were small water systems. EPA officials told us that they analyze these sample data over a 3-year period rather than yearly to ensure that the majority of water systems will have submitted 90th percentile sample results.5
Table 4: Water Systems Reporting Sample Results over the Lead and Copper Rule’s Lead Action Level, from January 1, 2014, to December 31, 2016
Number of water systems, by size Small
(25 to 3,300) Medium
(3,301 to 50,000) Large
(more than 50,000) Total Water systems reporting sample results over the lead action level 1,364 55 11 1,430
Source: GAO analysis of the Environmental Protection Agency’s Safe Drinking Water Information System data. │ GAO-17-424
Note: The data represent sample results for water systems that were active from July 1, 2011, to December 31, 2016.
The available EPA data show that almost all of the water systems (1,364, or 95 percent) reporting sample results that exceeded the lead action level from 2014 to 2016 were small and, together, served a population of about 505,000. In contrast, the remaining 66 large and medium water systems (5 percent) reporting sample results that exceeded the lead action level from 2014 to 2016, together, served a population of 2.7 million. In addition, as shown in table 5, states within EPA’s regions 1 and
4Water systems taking more than 5 samples are required to place results in ascending order (from lowest to highest) and assign each sample a number, with 1 being assigned to the lowest results value. Water systems are then to multiply the total number of samples by 0.9. The result of that calculation is the number of the sample that is considered to be the 90th percentile sample result. Water systems serving a population equal to or less than 100 are required to collect 5 samples. The LCR requires these sample results to also be placed in ascending order. The average of the results of the 4th and 5th samples is the 90th percentile sample result. The size of the water system determines the number of samples the LCR requires. 5According to EPA’s guidance to water systems, standard tap samples should be taken every 6 months. However, if water systems meet certain requirements they can collect tap samples once every year, once every 3 years, or once every 9 years.

Appendix II: Additional Analysis of Available EPA Data on Reported Sample Results, Violations, and Enforcement for the Lead and Copper Rule
Page 55 GAO-17-424 Elevated Lead in Drinking Water
3 had the highest number of water systems that reported sample results exceeding the lead action level. EPA headquarters officials we interviewed provided possible explanations for why 90th percentile sample results would be higher in these states. They said that there are more lead service lines in the northeastern states, such as those within regions 1 and 3. See table 5.
Table 5: Water Systems (Including Schools and Day Care Centers) with Reported Sample Results Exceeding the Lead Action Level of 15 Parts per Billion in EPA’s SDWIS/Fed, by Region and Size, from January 1, 2014 to December 31, 2016
Number of water systems, by size
EPA region Small
(25 to 3,300) Medium
(3,301 to 50,000)
Large (more than
50,000) Total number of
water systems Region 1 Connecticut, Massachusetts, Maine, New Hampshire, Rhode Island, Vermont 205 4 4 213 Region 2 New Jersey, New York, Puerto Rico, U.S. Virgin Islands 123 4 2 129 Region 3 Delaware, District of Columbia, Maryland, Pennsylvania, Virginia, West Virginia 215 8 2 225 Region 4 Alabama, Florida, Georgia, Kentucky, Mississippi, North Carolina, South Carolina, Tennessee 159 6 1 166 Region 5 Illinois, Indiana, Michigan, Minnesota, Ohio, Wisconsin 175 13 2 190 Region 6 Arkansas, Louisiana, New Mexico, Oklahoma, Texas 188 10 0 198 Region 7 Kansas, Iowa, Missouri, Nebraska 59 0 0 59 Region 8 Colorado, Montana, North Dakota, Utah, South Dakota, Wyoming 72 5 0 77 Region 9 Arizona, California, Hawaii, Nevada, Pacific Islands 91 4 0 95 Region 10 Alaska, Idaho, Oregon, Washington 77 1 0 78 Total 1,364 55 11 1,430
Legend: EPA = Environmental Protection Agency; SDWIS/Fed = Safe Drinking Water Information System. Source: GAO analysis of EPA’s SDWIS/Fed data. │ GAO-17-424
Note: The data represent sample results exceeding the lead action level for water systems that were active as of December 2016. Lead sample results are those reported under contaminant PB90;
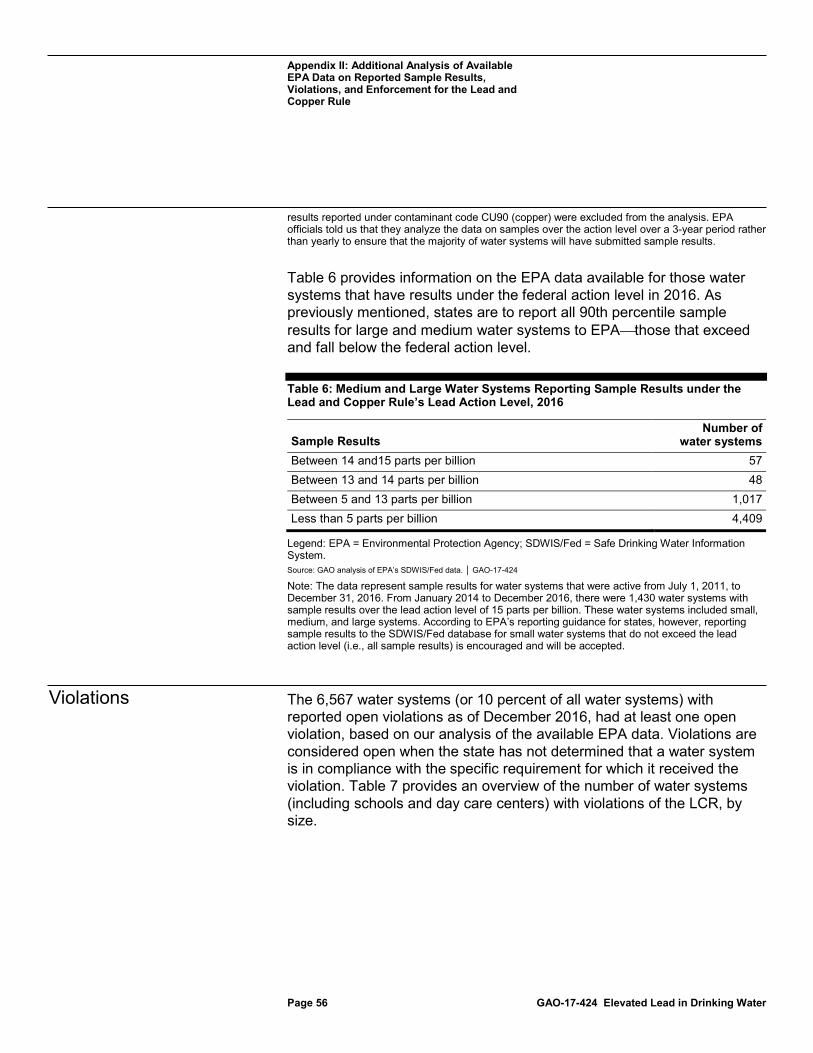
Appendix II: Additional Analysis of Available EPA Data on Reported Sample Results, Violations, and Enforcement for the Lead and Copper Rule
Page 56 GAO-17-424 Elevated Lead in Drinking Water
results reported under contaminant code CU90 (copper) were excluded from the analysis. EPA officials told us that they analyze the data on samples over the action level over a 3-year period rather than yearly to ensure that the majority of water systems will have submitted sample results.
Table 6 provides information on the EPA data available for those water systems that have results under the federal action level in 2016. As previously mentioned, states are to report all 90th percentile sample results for large and medium water systems to EPAthose that exceed and fall below the federal action level.
Table 6: Medium and Large Water Systems Reporting Sample Results under the Lead and Copper Rule’s Lead Action Level, 2016
Sample Results Number of
water systems Between 14 and15 parts per billion 57 Between 13 and 14 parts per billion 48 Between 5 and 13 parts per billion 1,017 Less than 5 parts per billion 4,409
Legend: EPA = Environmental Protection Agency; SDWIS/Fed = Safe Drinking Water Information System. Source: GAO analysis of EPA’s SDWIS/Fed data. │ GAO-17-424
Note: The data represent sample results for water systems that were active from July 1, 2011, to December 31, 2016. From January 2014 to December 2016, there were 1,430 water systems with sample results over the lead action level of 15 parts per billion. These water systems included small, medium, and large systems. According to EPA’s reporting guidance for states, however, reporting sample results to the SDWIS/Fed database for small water systems that do not exceed the lead action level (i.e., all sample results) is encouraged and will be accepted.
The 6,567 water systems (or 10 percent of all water systems) with reported open violations as of December 2016, had at least one open violation, based on our analysis of the available EPA data. Violations are considered open when the state has not determined that a water system is in compliance with the specific requirement for which it received the violation. Table 7 provides an overview of the number of water systems (including schools and day care centers) with violations of the LCR, by size.
Violations

Appendix II: Additional Analysis of Available EPA Data on Reported Sample Results, Violations, and Enforcement for the Lead and Copper Rule
Page 57 GAO-17-424 Elevated Lead in Drinking Water
Table 7: Number of Water Systems (Including Schools and Day Care Centers) with at Least One Open LCR Violation Reported in EPA’s SDWIS/Fed, by Size, as of December 31, 2016
Number of water systems, by size
Small (25 to 3,300)
Medium (3,301 to
50,000)
Large (more than
50,000) Total Monitoring and reporting violations Monitoring and reporting follow-up/routine 3,094 317 25 3,436 Initial tap sampling 1,404 130 9 1,543 Lead consumer notice 1,119 169 10 1,298 Monitoring and reporting follow-up/routine quality parameters follow-upa 374 46 12 432 Monitoring and reporting routine source water initial and follow-up/routineb 133 6 0 139 Treatment technique violations Corrosion control and source water treatment study/recommendation 218 13 2 233 Public education 145 8 1 154 Corrosion control and source water treatment installation 26 4 8 38 Maximum permissible levels 11 2 0 13 Lead service line replacement 0 0 0 0
Legend: EPA = Environmental Protection Agency; LCR = Lead and Copper Rule; SDWIS/Fed = Safe Drinking Water Information System. Source: GAO analysis of EPA’s SDWIS/Fed data. │ GAO-17-424
Note: The data represent open violations for water systems that were active as of December 31, 2016. Water systems can have multiple monitoring and reporting and treatment technique violations. Violations are considered open when the state has not indicated, in SDWIS/Fed, that a water system has met applicable requirements or criteria. In EPA’s SDWIS/Fed database, we defined open violations as those designated with an “O” (open) or a “K” (known) on the variable compliance status code. According to EPA officials, “known” means the violation is not open but the system has not yet been designated as returned to compliance. According to an EPA document, some of the data in the database are underreported. aAccording to EPA guidance for water systems, water quality parameters samples (e.g., to analyze pH, alkalinity, and calcium) are used to determine the corrosivity of the water and, if needed, to help states to determine the type of corrosion control to install and how the treatment should operate. The LCR requires large systems to conduct some water quality parameter monitoring. Medium and small systems do not have to collect water quality parameter samples unless their 90th percentile samples exceed the lead action level. bAccording to EPA guidance for water systems, source water samples are used to determine the contribution of source water to total tap water lead levels, assist water systems and states in designing an overall treatment plan for reducing lead at the tap, and to help the state in determining whether source water treatment is necessary to reduce lead levels at the tap.
Table 8 provides a summary of the available EPA data on the violations of the LCR among schools and daycare centers.

Appendix II: Additional Analysis of Available EPA Data on Reported Sample Results, Violations, and Enforcement for the Lead and Copper Rule
Page 58 GAO-17-424 Elevated Lead in Drinking Water
Table 8: Number of Schools and Day Care Centers with at Least One Open LCR Violation Reported in EPA’s SDWIS/Fed, as of December 31, 2016
Number of schools and daycare centers with violations Schools Daycare centers Total Monitoring and reporting violations Monitoring and reporting follow-up/routine 232 59 291 Initial tap sampling 118 44 162 Lead consumer notice 94 22 116 Monitoring and reporting follow-up/routine water quality parametersa 77 11 88 Monitoring and reporting source water initial and follow-up/routineb 21 8 29 Treatment technique violations Public education 23 4 27 Corrosion control and source water treatment study/recommendation 35 15 50 Corrosion control and source water treatment installation 4 1 5 Maximum permissible levels 2 0 2 Lead service line replacement 0 0 0
Legend: EPA = Environmental Protection Agency; LCR = Lead and Copper Rule; SDWIS/Fed = Safe Drinking Water Information System. Source: GAO analysis of EPA’s SDWIS/Fed. │ GAO-17-424
Note: Water systems can have multiple monitoring and reporting and treatment technique violations. The data represent open violations for water systems that were active as of December 31, 2016. Violations are considered open when the state has not indicated, in SDWIS/Fed, that a water system has met applicable requirements or criteria. In EPA’s SDWIS/Fed database, we defined open violations as those designated with an “O” (open) or a “K” (known) on the variable compliance status code. According to EPA officials, “known” means the violation is not open but the system has not yet been designated as returned to compliance. According to an EPA document, some data in SDWIS/Fed are underreported. aAccording to EPA guidance for water systems, water quality parameters samples (to analyze pH, alkalinity, and calcium) are used to determine the corrosivity of the water and if needed, to help states to determine the type of corrosion control to install and how the treatment should operate. The LCR requires large systems to conduct some water quality parameter monitoring. Medium and small systems do not have to collect water quality parameter samples unless their 90th percentile samples exceed the lead action level. bAccording to EPA guidance for water systems, source water samples are used to determine the contribution of source water to total tap water lead levels, assist water systems and states in designing an overall treatment plan for reducing lead at the tap, and to help the state in determining whether source water treatment is necessary to reduce lead levels at the tap.
The available EPA data show that from July 1, 2011 to December 31, 2016, 99 percent of the 589,827enforcement actions and outcomes were taken by states, as would be expected given that states generally have primary responsibility for enforcement of the LCR . Enforcement actions
Enforcement Actions and Outcomes

Appendix II: Additional Analysis of Available EPA Data on Reported Sample Results, Violations, and Enforcement for the Lead and Copper Rule
Page 59 GAO-17-424 Elevated Lead in Drinking Water
in SDWIS/Fed include actions taken and what we considered in our analysis as outcomes, such as the receipt of information or a water system having achieved compliance. The enforcement codes in SDWIS/Fed that we defined as outcomes were: federal civil case concluded, federal bilateral compliance agreement signed, federal public notification received, federal no longer subject to rule, federal compliance achieved, federal variance/exemption issued, state civil case concluded, state bilateral compliance agreement signed, state public notification received, state no longer subject to rule, state compliance achieved, and state variance/exemption issued. Collectively, outcomes represented 43 percent (256,107) of the enforcement data in the database. Table 9 provides the number of enforcement actions and outcomes reported from July 1, 2011, to December 31, 2016, at the federal and state levels. The data show that states in regions 6 and 4 had the highest numbers of enforcement actions and outcomes.
Table 9: EPA Data on Federal and State Enforcement Actions and Outcomes Reported in EPA’s 10 Regions, from July 1, 2011, to December 31, 2016
Number of actions Number of outcomes
EPA region Federal State Total Region 1 Connecticut, Massachusetts Maine, New Hampshire, Rhode Island, Vermont 1 20,460 13,976 34,437 Region 2 New Jersey, New York, Puerto Rico, U.S. Virgin Islands 145 20,952 11,803 32,900 Region 3 Delaware, District of Columbia, Maryland, Pennsylvania, Virginia, West Virginia 90 42,231 29,827 72,148 Region 4 Alabama, Florida, Georgia, Kentucky, Mississippi, North Carolina, South Carolina, Tennessee 43 36,649 60,256 96,948 Region 5 Illinois, Indiana, Michigan, Minnesota, Ohio, Wisconsin 34 29,286 20,660 49,980 Region 6 Arkansas, Louisiana, New Mexico, Oklahoma, Texas 243 90,229 59,331 149,803 Region 7 Kansas, Iowa, Missouri, Nebraska 3 20,395 15,336 35,734 Region 8 Colorado, Montana, North Dakota, Utah, South Dakota, Wyoming 106 25,965 13,864 39,935

Appendix II: Additional Analysis of Available EPA Data on Reported Sample Results, Violations, and Enforcement for the Lead and Copper Rule
Page 60 GAO-17-424 Elevated Lead in Drinking Water
Number of actions Number of outcomes
EPA region Federal State Total Region 9 Arizona, California, Hawaii, Nevada, Pacific Islands 2 21,374 12,044 33,420 Region 10 Alaska, Idaho, Oregon, and Washington 4,064 21,448 19,010 44,522 4,731 328,989 256,107 589,827
Source: GAO analysis of the Environmental Protection Agency’s Safe Drinking Water Information System data. │ GAO-17-424
Table 10 shows the five most frequently reported enforcement actions taken by states for LCR violations as they were reported in SDWIS/Fed as of December 31, 2016.
Table 10: The Five Most Frequently Reported Enforcement Actions Taken by States for LCR Violations Reported in EPA’s SDWIS/Fed, from July 1, 2011, to December 31, 2016
Enforcement action Number of actions Percentage of
all enforcement actions State violation/reminder notice 117,734 35 State public notification requested 112,343 34 State formal notice of violation issued 51,276 15 State administrative/compliance order without penalty issued 13,077 4 State unspecifieda 12,343 4 Subtotaltop five enforcement actions 306,773 92 Totalall enforcement actions 333,720 100
Legend: EPA = Environmental Protection Agency; LCR = Lead and Copper Rule; SDWIS/Fed = Safe Drinking Water Information System. Source: GAO analysis of EPA’s Safe Drinking Water Information System data as of December 31, 2016. │ GAO-17-424
Note: Water systems could receive multiple enforcement actions. The total number of enforcement actions in EPA’s SDWIS/Fed database includes actions taken and, what we defined as outcomes, such as compliance achieved or public notification received. We excluded the following codes from our analysis: federal civil case concluded, federal bilateral compliance agreement signed, federal public notification received, federal no longer subject to rule, federal compliance achieved, federal variance/exemption issued, state civil case concluded, state bilateral compliance agreement signed, state public notification received, state no longer subject to rule, state compliance achieved, and state variance/exemption issued.. Collectively, these outcomes represented 43 percent (256,107) of the enforcement action data in the database. According to a 2013 EPA compliance report, the number of enforcement actions in a year does not necessarily correlate with the violations that are reported in the same year. According to an EPA document, some of the data in SDWIS/Fed are underreported. aState unspecified did not provide a specific enforcement action in SDWIS/Fed data we used in our analysis.
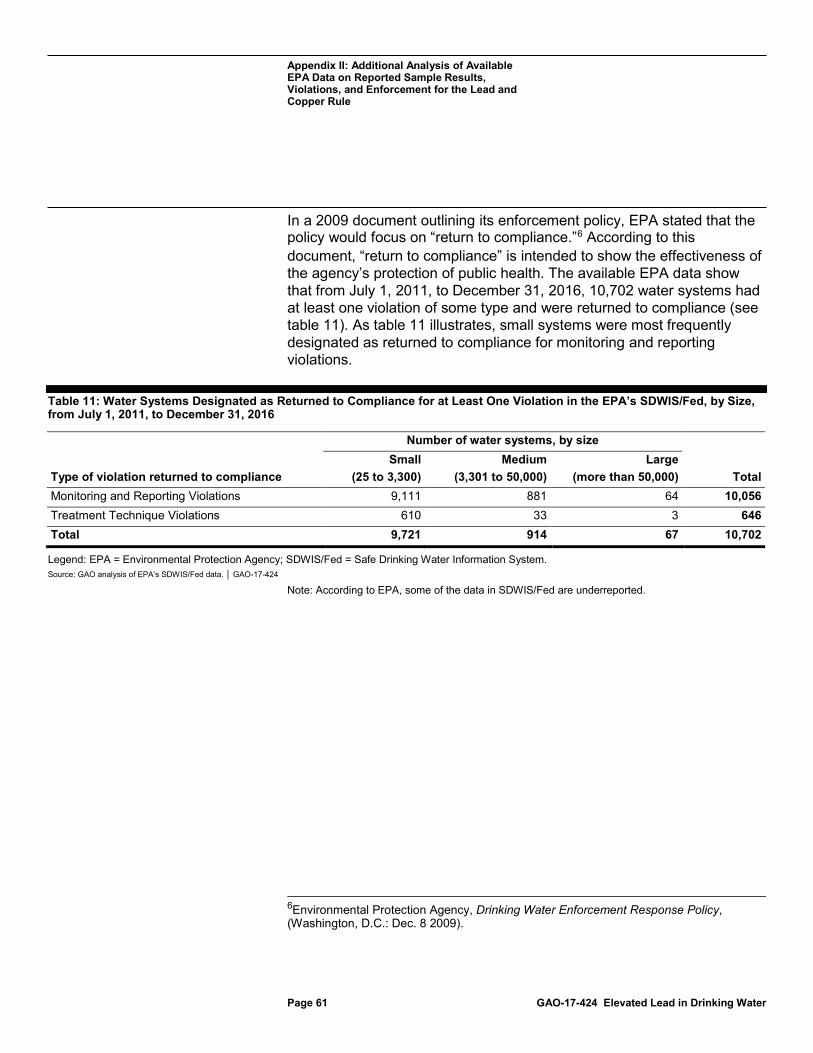
Appendix II: Additional Analysis of Available EPA Data on Reported Sample Results, Violations, and Enforcement for the Lead and Copper Rule
Page 61 GAO-17-424 Elevated Lead in Drinking Water
In a 2009 document outlining its enforcement policy, EPA stated that the policy would focus on “return to compliance.”6 According to this document, “return to compliance” is intended to show the effectiveness of the agency’s protection of public health. The available EPA data show that from July 1, 2011, to December 31, 2016, 10,702 water systems had at least one violation of some type and were returned to compliance (see table 11). As table 11 illustrates, small systems were most frequently designated as returned to compliance for monitoring and reporting violations.
Table 11: Water Systems Designated as Returned to Compliance for at Least One Violation in the EPA’s SDWIS/Fed, by Size, from July 1, 2011, to December 31, 2016
Number of water systems, by size
Type of violation returned to compliance Small
(25 to 3,300) Medium
(3,301 to 50,000) Large
(more than 50,000) Total Monitoring and Reporting Violations 9,111 881 64 10,056 Treatment Technique Violations 610 33 3 646 Total 9,721 914 67 10,702
Legend: EPA = Environmental Protection Agency; SDWIS/Fed = Safe Drinking Water Information System. Source: GAO analysis of EPA’s SDWIS/Fed data. │ GAO-17-424
Note: According to EPA, some of the data in SDWIS/Fed are underreported.
6Environmental Protection Agency, Drinking Water Enforcement Response Policy, (Washington, D.C.: Dec. 8 2009).

Appendix III: Key Factors State Regulators Identified That May Contribute to Noncompliance with the Lead and Copper Rule
Page 62 GAO-17-424 Elevated Lead in Drinking Water
State drinking water regulators who participated in discussion groups we conducted identified 29 factors that may contribute to noncompliance with the Lead and Copper Rule (LCR).1 Of these factors, the state regulators most frequently mentioned size, technical capacity, and sample collection, among other factors. State regulators mentioned other factors less frequently, including requirements to comply with multiple drinking water regulations and the number of water samples required to be collected by the LCR as also contributing to noncompliance. Regulators in 12 states identified factors that they thought specifically helped water systems comply with the LCR. We obtained this information from drinking water state regulators representing 41 states and 1 territory through eight discussion groups held in September and October 2016. The purpose of the discussion groups was to develop an understanding of the factors that may influence noncompliance with the LCR. We analyzed the transcripts of those discussion groups using a content analysis software package. For a detailed description of the methodology we used to conduct these groups and analyze the content of these discussions, see appendix I and appendix IV.
State regulators who participated in our discussion groups identified 29 factors that may contribute to water systems’ noncompliance with the LCR. The LCR requires water systems to identify locations where lead may be present and periodically obtain tap water samples from those locations (of which single-family homes are the highest priority).2 When a water system’s 90th percentile sample result for lead exceeds 15 parts per billion, the system has exceeded the federal action level (also known
140 C.F.R. pt. 141, subpt. 1. 2The LCR allows certain water systems whose test results are consistently below the federal action level to reduce the frequency of monitoring (taking drinking water samples) and the number of samples collected. In addition, the LCR permits all water systems that meet water quality control parameters reflecting optimized corrosion control, as specified by the state, to also qualify for reduced monitoring.
Appendix III: Key Factors State Regulators Identified That May Contribute to Noncompliance with the Lead and Copper Rule
State Regulators Identified 29 Factors That May Contribute to Noncompliance with the LCR

Appendix III: Key Factors State Regulators Identified That May Contribute to Noncompliance with the Lead and Copper Rule
Page 63 GAO-17-424 Elevated Lead in Drinking Water
as an action level exceedance).3 Sample results that exceed the lead action level do not by themselves constitute violations of the LCR.
Under the LCR, an action level exceedance requires the water system and state to take additional steps. Those additional steps require that small and medium water systems install or modify corrosion control treatment and water systems of all sizes provide information (known as public education) about the harmful effects of lead to consumers and vulnerable populations (such as schools if the water system serves a school and public health departments).4 Water systems are also required to test and, if necessary, treat the source water. If, after installing corrosion control and treating source water, a system continues to have 90th percentile sample results that exceed the lead action level, the LCR requires the water system to begin replacing its lead service lines, if they exist.
As part of our analysis, we grouped the 29 factors into seven broad groups: (1) water system characteristics, (2) water system operations, (3) characteristics of water, (4) sample procedures required to comply with the LCR, (5) actions that states take to ensure water systems comply with the LCR, (6) actions that the Environmental Protection Agency (EPA) can take to assist with compliance, and (7) features of the LCR regulation. Figure 4 provides these seven groups and the factors that fell into each one.
3For water systems taking more than 5 samples, the 90th percentile is calculated by placing the sample results in ascending order (from lowest to highest) and assigning each sample a number, with 1 being assigned to the lowest results value. Water systems are then to multiply the total number of samples by 0.9. The result of that calculation is the number of the sample that is considered to be the 90th percentile sample result. For water systems that collect 5 samples, the LCR requires the sample results to also be placed in ascending order. The average of the results of the 4th and 5th samples is the 90th percentile sample result. For water systems taking fewer than 5 samples, the sample result with the highest concentration is considered the 90th percentile value. 4Large water systems are generally required to use corrosion control techniques regardless of whether they have previously experienced action level exceedances.

Appendix III: Key Factors State Regulators Identified That May Contribute to Noncompliance with the Lead and Copper Rule
Page 64 GAO-17-424 Elevated Lead in Drinking Water
Figure 4: Factors That May Influence Compliance with the Lead and Copper Rule, as Identified by State Regulators
aThe LCR generally requires water systems to minimize lead in drinking water by controlling the corrosion of metals in the infrastructure they use to deliver water and in household plumbing. bCorrosion control refers to the treatment process that systems use to reduce the likelihood that lead from plumbing materials will enter drinking water that they deliver to consumers. cEngagement refers the extent to which system operators are engaged with the state to understand compliance with the LCR. dPublic education is the outreach that systems must conduct after their 90th percentile water sample result exceeds the federal action level for lead. eSimultaneous compliance refers to the obligation that systems have to comply with various Safe Drinking Water Act regulations. fState review refers to the authority that states have to approve or reject aspects of water systems’ proposals or actions related to the LCR, such as changes to corrosion control treatment. gFinancial capacity refers, generally, to the financial resources of the system. hManagerial capacity refers to the management structure and practices of the system such as staffing and communication with customers and regulators. iWater system ownership refers to a system being either publicly- or privately-owned.

Appendix III: Key Factors State Regulators Identified That May Contribute to Noncompliance with the Lead and Copper Rule
Page 65 GAO-17-424 Elevated Lead in Drinking Water
jTechnical capacity refers to the physical infrastructure of the water system and the ability of personnel to adequately operate and maintain the system and apply the appropriate knowledge. kWater system type refers to the type of population systems serve and whether they serve the same customers year-round or on an occasional basis. lWater chemistry refers to the water quality conditions that may impact corrosivity or the release of lead in drinking water. mPurchased water refers to water that systems purchase from another water system. nWater stability refers to maintaining the source water’s conditions so as to not disrupt corrosion control.
State regulators we interviewed most frequently identified 10 factors that may contribute to noncompliance of the LCR. Among those were size, technical capacity of operators, and the collection of drinking water samples. The 10 factors fell into the following broad groups: (1) water system characteristics, (2) water system operations, (3) characteristics of water, and (4) sample procedures. To identify the factors most frequently identified by the state regulators as contributing to noncompliance, we focused on those factors that were mentioned by regulators in at least 13 of the 41 states participating in the discussion groups (30 percent). Table 12 provides a description of each factor, the definition we used for our analysis and the number of states in which officials mentioned the factor.
Table 12: Factors Most Frequently Identified by State Regulators as Contributing to Noncompliance of the Lead and Copper Rule (LCR)
Factor Definition
Number of states in which participating officials mentioned the factor
Water System Characteristics Water system size (or population served)
The three broad size categories that water systems fall into for the purposes of the LCR: (1) small, serving 25 to 3,300 people; (2) medium, serving 3,301 to 50,000 people; and (3) large, serving over 50,000 people.
37
Technical capacity of water system
The ability of personnel to adequately operate and maintain the system and to apply the necessary technical knowledge—such as, knowledge necessary for certification—to comply with the law and regulations. Operator competency, qualifications, skills and knowledge are included in this definition. An operator is a person who operates, repairs, maintains and is directly employed by or is an appointed volunteer for a public drinking water system.
33
Financial capacity of water system
The financial resources of the water system, such as having sufficient revenue, funding, setting user rates, and operation budget and planning.
28
State Regulators Most Frequently Identified 10 Factors That May Contribute to Noncompliance with the LCR

Appendix III: Key Factors State Regulators Identified That May Contribute to Noncompliance with the Lead and Copper Rule
Page 66 GAO-17-424 Elevated Lead in Drinking Water
Factor Definition
Number of states in which participating officials mentioned the factor
Lead presence in pipes (or fixtures)
Pipes and fixtures, among other components, in a water system’s distribution system may contain lead. A distribution system is the physical system, and materials, that water systems use to carry water to their users. It is composed of, among other things, pipes, treatment plant, distribution system, water meters, plumbing and individual fixtures. The LCR required systems to complete a materials evaluation—also known as a materials survey—of their distribution systems in part in order to identify lead pipes or fixtures.
23
Managerial capacity of water system
The management structure and practices of the water system, such as ownership accountability, staffing, and communication with customers and regulators.
24
Water system type The Environmental Protection Agency (EPA) classifies water systems according to quantity and type of population served and whether they serve the same customers year-round or on an occasional basis. The three main types of water systems are: the (1) community water system which supplies water to the same population year-round; and (2) non-transient non-community water system that regularly supplies water to at least 25 of the same people at least 6 months per year; and (3) transient non-community water system that supplies water in a place where people do not remain for long periods of time, such as a gas station or campground. Some examples of a non-transient non-community water system are schools, factories, office buildings, and hospitals that have their own water system. All community water systems and non-transient non-community water systems are subject to the LCR.
18
LCR Sample Procedures Collection of drinking water samples
The process by which water samples must be and are collected to test for lead levels. The LCR requires water systems to identify locations where lead may be present and periodically obtain tap water samples from those locations (of which single- and multi-family homes are the highest priority). Under the LCR, first-draw samples are to come from interior taps that can be used for human consumption (that is, the kitchen or bathroom taps) and where the water has stood in the pipes for at least 6 hours. The LCR established a system for prioritizing the selection of sample sites. The highest-priority sites are single-family homes with copper pipes and lead solder or with lead pipes and/or served by lead service lines.
28

Appendix III: Key Factors State Regulators Identified That May Contribute to Noncompliance with the Lead and Copper Rule
Page 67 GAO-17-424 Elevated Lead in Drinking Water
Factor Definition
Number of states in which participating officials mentioned the factor
Water Characteristics Water chemistry The water quality conditions that may impact the release of lead in
drinking water, such as the pH of the water (acidity); alkalinity (capacity to neutralize acid), and hardness (sum of calcium and magnesium in water). The chemistry of the water affects its corrosiveness the ability of a substance to break down (corrode) materials.
23
Water source The primary source of drinking water used by the water system. Two main types of water sources are surface water and ground water. Surface water comes from sources open to the atmosphere, such as rivers, lakes, and reservoirs. Groundwater comes from aquifers (natural reservoirs below the earth’s surface).
14
Water System Operations Corrosion control (use of treatment)
The treatment that water systems use to reduce the dissolving of lead in plumbing materials during water delivery to consumers.
16
Source: GAO analysis of interviews with state regulators, federal regulation, EPA documents and published GAO reports. │ GAO-17-424
State regulators who participated in the discussion groups explained how each of these factors may contribute to noncompliance. In most instances, regulators also described what they observed as relationships between factors and how, together, multiple factors could contribute to noncompliance.
• Size. Regulators in 37 states said that the size of the population served by water systems may influence noncompliance with the LCR. Regulators in 28 of the 37 states said that small systems (serving populations of 3,300 and fewer) are more likely to have drinking water sample results that exceed the federal action level, to be in noncompliance, or face challenges that may lead to noncompliance. Most of these regulators mentioned the size of a system and the technical, managerial, or financial capacity of the system as factors that, together, may influence noncompliance.5 For example, regulators in 10 states said that small systems are more likely to receive a violation because they are generally less likely to have operators with the knowledge to properly collect samples (sample collection) or manage corrosion control treatment (technical capacity)
5Technical capacity refers to the physical infrastructure of the water system and the ability of personnel to adequately operate and maintain the system and apply the appropriate knowledge. Managerial capacity refers to the management structure and practices of the system such as staffing and communication with customers and regulators. Financial capacity refers to the financial resources of the system.

Appendix III: Key Factors State Regulators Identified That May Contribute to Noncompliance with the Lead and Copper Rule
Page 68 GAO-17-424 Elevated Lead in Drinking Water
or have the financial resources to pay for corrosion control treatment or to hire professional help to do so (financial capacity). A regulator from 1 state provided an example of a small water system in noncompliance because it has a part-time operator with little training on the rule and with other professional responsibilities, such as snow removal and animal control, which prevent this operator from providing drinking water test results to homeowners whose water was tested within the required timeframe.
• Technical capacity. Regulators in 33 states said that the technical capacity of water systems may influence noncompliance with the LCR. Regulators in 18 of the 33 states said that water systems that do not have personnel with the knowledge to adequately operate a system or who understand the LCR are less likely to have the skill set to interpret and implement the LCR appropriately.
• Sample collection. Regulators in 28 states said if systems fail to collect drinking water samples, improperly collect samples, or have other problems with collecting samples they may be out of compliance with the LCR. For example, regulators in 9 of these 28 states said that some water systems struggle to find enough homeowners willing to collect water samples for testing and regulators in 3 states said that this may cause the systems to collect samples from taps that are not used for drinking water, contrary to the LCR. In addition, regulators in 14 states said that even when systems are able to find homeowners willing to collect drinking water samples, the homeowners themselves may collect the samples improperly. A regulator from 1 state provided an example of a homeowner who was out of town for the weekend and upon return collected a water sample from tap water that sat stagnant for 4 days, which is problematic because the sample taken should be representative of everyday use. Sample results that exceed the lead action level do not by themselves constitute violations of the LCR.
• Financial capacity. Regulators in 28 states said that water systems that do not have sufficient financial resources will experience challenges complying with the LCR, including paying for chemicals and professional help needed to install corrosion control treatment. For example, a regulator in 1 state said that a system without adequate financial resources may not be able to pay for the required, and often costly, corrosion control study.
• Presence of lead. Regulators in 23 states said that the presence of lead in the pipes may influence noncompliance with the LCR. Regulators in 9 of the 23 states said that the presence of lead in pipes increases the likelihood that drinking water samples will exceed the

Appendix III: Key Factors State Regulators Identified That May Contribute to Noncompliance with the Lead and Copper Rule
Page 69 GAO-17-424 Elevated Lead in Drinking Water
federal action level; and require a system to perform additional actions. Regulators in 11 of the 23 states specifically said that a water system with old infrastructure is more likely have lead service lines.6 Regulators in 9 states identified the presence of lead service lines and managerial capacity as factors that may work together. These regulators said that water systems that maintain good records of the materials in their distribution systems7 know about the presence of lead service lines and may be better able to collect drinking water samples from the appropriate locations.
• Managerial capacity. Regulators in 24 states said that the managerial capacity of water systems may influence noncompliance with the LCR. Regulators in 16 of the 24 states said that water systems that do not have effective management structures and practices will have problems keeping up with the rule requirements and deadlines. Regulators in 6 states explained that proper data and records management help systems comply with the LCR.
• Water chemistry. Regulators in 23 states said that the chemistry of the water may influence noncompliance with the LCR. Regulators in 20 of the 23 states said that having corrosive water increases the likelihood of samples that exceed the action level—which is not a violation—and will require a system to perform additional actions. For example, if these systems do not install corrosion control or manage it properly—for example, because the operator does not understand water chemistry—the system will get a violation, according to regulators in 6 states.
• Corrosion control. Regulators in 16 states said that the corrosion control may influence noncompliance with the LCR. Specifically, regulators in 15 of the 16 states said that water systems that have installed corrosion control treatment are more likely to be in compliance with the LCR because corrosion control is the primary method used to prevent lead from entering drinking water. A regulator from 1 state said that despite the corrosive water that exists in that state, water systems are not getting samples that exceed the action level and are staying in compliance because they have corrosion control installed. Regulators also discussed how the size of the
6In 1986, the Safe Drinking Water Act was amended to prohibit the use of pipes and plumbing fixtures that are not lead free within the meaning of the act. 42 U.S.C. § 300g-6.
7A distribution system is the physical infrastructure that water systems use to deliver drinking water from a source to customers and can include a network of pipes and other components.

Appendix III: Key Factors State Regulators Identified That May Contribute to Noncompliance with the Lead and Copper Rule
Page 70 GAO-17-424 Elevated Lead in Drinking Water
system and corrosion control, together, can influence compliance. Regulators in 5 states said that large water systems are generally in compliance with the LCR because the rule requires them to install corrosion control treatment.8
• Type. Regulators in 18 states said that the type of water system may influence noncompliance with the LCR. Regulators in 14 of the 18 states said schools and daycare facilities with their own water supplies experience challenges in complying with the LCR, and regulators in 6 states explained that it is because their primary mission is not water delivery and management. A regulator in 1 state said that they had a school submit improper samples because school officials collected samples after the summer break during which the faucets had not been used for 6 weeks, thus not being representative of normal drinking water use. Sample results that exceed the lead action level do not by themselves constitute violations of the LCR.
• Source. Regulators in 14 states said that the source of drinking water may influence noncompliance and offered a range of opinions as to how corrosive or non-corrosive groundwater may influence actions. State regulators frequently discussed source water, water chemistry, and corrosion control as factors that presented themselves together. State regulators in 4 states said that systems using ground water can more easily comply with the LCR because ground water is non-corrosive compared to surface water. In contrast, regulators in 4 states said that the ground water in other parts of the country is more corrosive. However, regulators in 5 states said that systems with corrosive water sources are still able to comply when they properly install and manage corrosion control treatment.
State regulators who participated in our discussion groups identified additional factors that may contribute to water systems’ noncompliance with the LCR, though less frequently. These regulators cited factors such as compliance with multiple drinking water rules, the number of samples that systems are required to collect under the LCR, and the complexity of the LCR. Table 13 describes each factor less frequently mentioned as contributing to noncompliance, the definition of the factor, and the number of states in which officials mentioned the factor. Some of these factors are more specific attributes that may impact of some the 10 factors that were
8All large water systems are generally required to use corrosion control. Small and medium water systems are required to install or modify existing corrosion control treatment after their 90th percentile sample results exceed the lead action level.
State Regulators Identified Additional Factors That May Influence Noncompliance

Appendix III: Key Factors State Regulators Identified That May Contribute to Noncompliance with the Lead and Copper Rule
Page 71 GAO-17-424 Elevated Lead in Drinking Water
most frequently identified by state regulators. For example, regulators told us about several aspects of water (age, stability, and flow) that may impact water chemistry.
Table 13: Additional Factors Identified by State Regulators as Contributing to Noncompliance with the Lead and Copper Rule (LCR)
Factor Definition
Number of states in which officials
mentioned each factor Water System Operation Simultaneous compliance Water systems’ obligation to comply with all existing Safe Drinking Water
Act regulations. 9
Public education The public education outreach steps that water systems must conduct after their 90th percentile sample result exceeds the federal action level. The LCR requires water systems to develop public education with specific language and information and deliver it to their consumers within 60 days after the end of their monitoring period in which the exceedance occurred, and community water systems must repeat it once every 12 months while exceedances continue.
6
Maintenance The process of maintaining a water system to comply with the LCR. 3 LCR sample procedures Number of samples required to be collected by the LCR
The number of samples that water systems must collect in a reporting period. In a standard reporting period, small systems must collect 5, 10 or 20 samples; medium systems must collect 40 or 60 samples; and large systems must collect 60 or 100 samples.
9
LCR characteristics Complexity of the LCR According to the Environmental Protection Agency (EPA) and state
regulators, the LCR is one of the most complex drinking water regulations under the Safe Drinking Water Act.
8
LCR Regulation published by EPA in 1991 to control lead and copper in drinking water.
7
EPA Actions EPA guidance General guidance provided by EPA to water systems, including guidance
to properly collect water samples, including both the site selection and sample collection processes.
7
EPA training Training that EPA provides to states and water systems on the LCR on such topics as sample collection, reporting requirements, and optimal corrosion control treatment.
1
Water System Characteristics Ownership of water system A water system may either be publicly or privately owned. Publicly-
owned water systems are typically municipalities, townships, counties, or other public entities. These entities can be governed by boards, mayors, managers, or city or town councils. Privately-owned water systems are typically governed by corporate entities, homeowner associations, or sole proprietors.
5

Appendix III: Key Factors State Regulators Identified That May Contribute to Noncompliance with the Lead and Copper Rule
Page 72 GAO-17-424 Elevated Lead in Drinking Water
Factor Definition
Number of states in which officials
mentioned each factor Geography of water system The geographic location of the water system, which can include its state
or region. 3
Water Characteristics Purchased water Water that systems purchase from another (wholesale) water system(s).
This includes a “consecutive system,” which is a public water system that buys or otherwise receives some or all of its finished water from one or more wholesale systems. Delivery may be through a direct connection or through the distribution system of one or more consecutive systems.
5
Age of water The amount of time water remains in a distribution system; which is a function of water demand, system operation, and system design.
4
Water stability Maintaining the source water’s pH level and alkalinity as it goes through the distribution system so as to not disrupt corrosion control.
4
Water flow rate The rate at which water flows at any point in the distribution system. 3 State Actions State enforcement The enforcement response that states initiate when a drinking water
violation is identified and is not resolved by a water system on its own, or when compliance assistance does not return the violating system to compliance. Enforcement actions include a variety of escalating informal and formal actions as the state or EPA attempts to return a violating public water system to compliance as quickly as possible.
2
State review The authority that states have to approve or reject aspects of water systems’ proposals or actions related to the LCR. For example, proposals to make long-term changes in water treatment, changes in source water, or installation of new corrosion control treatments.
5
Source: GAO analysis of interviews with state regulators, federal regulation, EPA documents and published GAO reports. │ GAO-17-424
The regulators participating in our discussion groups provided examples of these less frequently mentioned factors, below:
• Simultaneous compliance. Regulators in nine states said that systems that have to simultaneously comply with multiple drinking water regulations can lead to noncompliance with the LCR and regulators in three of the nine states explained that this is because changes to water treatment to address one problem can create additional problems. For example, regulators in five states said that systems that have to comply with a rule aimed at reducing drinking water exposure to disinfection byproducts may require a reduction in the pH level of their water, and this, in turn, may affect the effectiveness of their control corrosion treatment. Much like other factors, this causes samples results to exceed the federal action level which subjects the water system to additional rule requirements.

Appendix III: Key Factors State Regulators Identified That May Contribute to Noncompliance with the Lead and Copper Rule
Page 73 GAO-17-424 Elevated Lead in Drinking Water
• Lead and Copper Rule. Regulators in seven states said that aspects of the LCR may influence noncompliance. Regulators in two of the seven states said that the LCR does not require states to routinely approve material surveys or for systems to update these surveys periodically, which can prevent water systems from knowing if they are collecting samples from high-risk sites. In addition, regulators in four states said that the LCR allows too much time for systems to complete requirements, such as the installation of corrosion control treatment and the issuance of public education notices to consumers. For example, a regulator in one state provided an example of a system that started the process of installing corrosion control. However, the system stopped the treatment installment because, as allowed by the LCR, the system sampled the water again and did not exceed the action level. Regulators in three of the states also said that the LCR does not allow state regulators to invalidate samples that they know were taken using poor practices at the sample site.9,10
• EPA guidance. Regulators in seven states said that EPA’s guidance may contribute to noncompliance, and according to regulators in four states, this is because the guidance may not be clear which may cause states and water systems to incorrectly implement the LCR. For example, regulators in three states said that EPA guidance on sample procedures and public education was confusing for states and water systems because it is not clear about the timeframes that systems should adhere to when repeating the collection of water samples or providing public education to ensure that they conduct these actions properly and in accordance with the LCR.
9Under the LCR, a state can invalidate water samples if (1) the laboratory establishes that improper sample analysis caused erroneous results, (2) the state determines that the sample was taken from a site that did not meet the site selection criteria, (3) the sample container was damaged in transit, or (4) there is substantial reason to believe that the sample was subject to tampering. 40 C.F.R. § 141.86 (f)(1). EPA takes a strict interpretation of the invalidation requirements in the LCR. If a water system allows residents to collect samples as part of the targeted sample pool, the system may not challenge the accuracy of sample results because it believes there were errors in sample collection. 40 C.F.R. 141.86(b)(2). The state may only invalidate samples based on the criteria described in 40 C.F.R. 141.86(f)(1). 10In its recommendations for the long-term revisions to the LCR, EPA’s National Drinking Water Advisory Council recommended that EPA expand the sample invalidation criteria to include specific grounds for invalidating samples, such as taking samples from abandoned or infrequently used taps, and taking samples from exterior taps not typically used for consumption. Environmental Protection Agency, National Drinking Water Advisory Council, Report of the Lead and Copper Rule Working Group to the National Drinking Water Advisory Council (August 2015).

Appendix III: Key Factors State Regulators Identified That May Contribute to Noncompliance with the Lead and Copper Rule
Page 74 GAO-17-424 Elevated Lead in Drinking Water
Regulators also identified several additional factors that could lead to noncompliance or to 90th percentile sample results over the action level and thus additional requirements for water systems to implement, which could increase the chances of a violation. For example, regulators mentioned that the ownership of a water system could be a factor and provided the example of privately-owned, small water systems with less knowledgeable or available operators. Regulators also said that the age of the water can interfere with corrosion control and that some systems buying treated water are not doing any treatment themselves. Finally, regulators in two states said that water systems that are geographically isolated may not be able to access alternative water sources if their existing source water is corrosive or to attract operators with the skills to implement the LCR.
Regulators in 12 states specifically identified factors that they thought helped water systems comply with the LCR (see table 14). Regulators in 7 states said that assistance from the states helps water systems comply with the LCR by providing systems with information about the requirements of the rule, training or technical assistance including using state rural water associations.11 Regulators in 4 different states said that the engagement of the water system with the state regulatory office—for example, through training—places the system in a better position to implement the LCR because they are gaining an understanding of the requirements. Further, regulators in 1 state said that support from state and local decision makers provides water system managers with the tools they need to implement the rule appropriately.
11The National Rural Water Association is a nonprofit organization that provides technical assistance, training, and legislative representation to water systems serving rural communities. The association has 49 state associations located throughout the country to serve all 50 states, tribally-owned systems, and the water systems in U.S. territories.
Regulators in 12 States Identified Operator Engagement, State Assistance and Local Support as Factors Helping Water Systems Comply with the LCR

Appendix III: Key Factors State Regulators Identified That May Contribute to Noncompliance with the Lead and Copper Rule
Page 75 GAO-17-424 Elevated Lead in Drinking Water
Table 14: Factors Identified by State Regulators as Contributing to Compliance with the Lead and Copper Rule (LCR)
Factor Definition
Number of states in which officials
mentioned each factor State Actions State assistance The technical and financial assistance that states may provide to water
systems to help them comply with the LCR. 7
Support from decision makers Support that decision makers at the local and state levels can provide to help public water systems either remain in or return to compliance. Local authorities can support water systems by helping them comply with state and federal regulations, hire staff, set budgets and adjust water rates.
1
Water System Operations Engagement of the water system
Extent to which water system operators are in communication with the state to understand compliance with the LCR.
4
Source: GAO analysis of interviews with state regulators, Environmental Protection Agency documents and published GAO reports. │ GAO-17-424

Appendix IV: Content Analysis of the Transcripts of Discussion Groups on Factors That May Contribute to Noncompliance with the Lead and Copper Rule
Page 76 GAO-17-424 Elevated Lead in Drinking Water
We conducted eight discussion groups with drinking water regulators representing 41 states and 1 territory to develop an understanding of the potential factors that may influence noncompliance with the Lead and Copper Rule (LCR). These were hour-long discussions conducted over the telephone. We held these discussion groups in September and October 2016. From two to eight states participated in each discussion group and each state had a primary designated spokesperson. For more information about our overall methodology, see appendix I.
In each discussion group, the moderator asked two questions. First, the moderator asked participants to list one or two factors that most influence a water system’s ability to comply with the LCR. Each state provided a list of factors. After all of the states responded, the moderator noted the factors provided by the group participants and asked for consensus on the list of factors reported.1 Second, the moderator asked participants to elaborate on how the factors reported could influence compliance. When necessary, the moderator asked probing questions to further clarify participants’ comments. Two or three analysts transcribed each session and combined and reconciled notes to develop transcripts for each of the discussion groups.
Using the factors that participants mentioned in each discussion group, we compiled an initial aggregate list of factors. We reviewed the initial list to determine if certain factors were closely related and could be combined. To check for completeness, we reviewed the transcripts and noted factors that participants repeatedly mentioned throughout the discussion groups but that were missing from the current list, and we added them to the list. This allowed us to delete some factors and incorporate them into other factors under which we determined they could reasonably fit. For example, we determined that “water chemistry” and “water corrosivity” were too closely related to be separate factors, so we combined them. Our goal was to develop a list of complete, distinct and mutually exclusive factors based on the information that participants shared in the discussion groups.
1The moderator asked for consensus on the list of factors that were mentioned by the group participants, not on the validity of the factors in influencing compliance with the LCR.
Appendix IV: Content Analysis of the Transcripts of Discussion Groups on Factors That May Contribute to Noncompliance with the Lead and Copper Rule
Discussion Groups
Identifying and Defining Factors

Appendix IV: Content Analysis of the Transcripts of Discussion Groups on Factors That May Contribute to Noncompliance with the Lead and Copper Rule
Page 77 GAO-17-424 Elevated Lead in Drinking Water
We took additional steps to ensure that we identified significant factors by conducting a word frequency count in all of the discussion group transcripts using a content analysis software package. We grouped similar wordsfor example, “system,” “systems and systems’” so that they were counted together. We determined that the top 11 words identified by the frequency count—which were mentioned 100 times or more—represented factors that we already had in our list.2 We also determined that the top 50 words identified by the frequency count —which were mentioned 32 times or more—represented factors that were already on our list.
To have a clear and consistent understanding of each factor for classification purposes, we defined each factor using information from the LCR, other federal regulations, Environmental Protection Agency guidance to states and water systems, and published GAO reports. Using the factors and their definitions, we developed a guide to use in the classification process.
To identify broad themes when classifying comments in the transcripts, we developed groups under which the factors could reasonably fit. We took steps to make every group distinct and mutually exclusive and to ensure that every factor fell into its associated category. For example, we determined the factors “system size,” “system type,” and “financial capacity of system,” could naturally be grouped under “water system characteristics”. Over the course of several meetings, four analysts reviewed and finalized the factors and their associated groups. We agreed on a final list of 29 factors, which included issues like “system size,” “corrosion control,” and “water source.” The 29 factors were placed under seven groups, including “water system characteristics,” “water system operations,” and “characteristics of water.” For a detailed discussion of these factors, see appendix III.
To analyze the content of the discussion groups, using a content analysis software package, two analysts independently classified each comment in the transcripts into the factors we defined, and one analyst analyzed the classification to identify the factors that were most frequently reported. During the classification process, the analysts classified each participant’s
2The word frequency count excluded common words that were not meaningful to our analysis, such as prepositions and conjunctions.
Analysis
Appendix IV: Content Analysis of the Transcripts of Discussion Groups on Factors That May Contribute to Noncompliance with the Lead and Copper Rule
Page 78 GAO-17-424 Elevated Lead in Drinking Water
individual statements in the transcripts separately. For the purposes of analysis, we defined an individual comment to be a statement made by a single individual. Across the eight discussion groups, there were a total of 225 such comments. Some comments were brief and covered a single issue while others were extensive and covered multiple issues. The analysts applied multiple classifications if statements covered a range of factors. For example, a statement made by a specific drinking water regulator could have been classified as relating to the source of the water and the size of the system. The analysts only coded statements made in response to the moderators’ questions. The analysts did not code statements that did not discuss factors or directly answer the moderators’ questions. After independently coding the transcripts, we used software to run an intercoder reliability report. The two analysts met on three occasions to compare and discuss the coding results. In instances where the analysts applied different codes to the same statement, they discussed their reasoning and reached agreement on which codes were the most appropriate. Each analyst then updated the database to reflect the agreements reached.
We also used software to identify the factors most frequently reported by the participants. We determined these by identifying the number of states that reported each factor (regardless of how many times a factor was mentioned) because this approach presented the number of states that agreed on the validity of each factor as contributing to noncompliance. To do this, we used software to cross-tabulate the factors that were classified with the states that participated in the discussion groups. During the classification process, we classified each participant’s statements as (1) the state the participant represented and (2) the factors that the statement covered. For example, an individual statement could have been classified as “Texas” and “water source.” Thus, for each factor, the cross tabulation showed which states made statements that were classified into that factor. We also ran a cross tabulation of the seven broad groups (under which the factors were grouped) and the states that reported each group. We identified the factors that were most frequently reported by focusing on those that were reported by at least 30 percent of the states, and reported this information in the report.

Appendix V: Statistical Analysis to Identify Water Systems with a Higher Likelihood for LCR Violations
Page 79 GAO-17-424 Elevated Lead in Drinking Water
To identify any factors that may contribute to noncompliance with the Lead and Copper Rule (LCR), we conducted discussion groups with a nonprobability sample of state drinking water regulators representing 41 states and 1 territory.1 We conducted a literature review of 31 academic studies about the detection of lead in drinking water and violations of drinking water regulations to corroborate our findings from the discussion groups. Our discussion groups with state regulators and review of academic studies suggested that certain factors could indicate whether water systems are at a higher likelihood for violating the LCR. To determine whether data on these factors could be used to predict LCR violations, we developed a series of statistical models, specifically multivariate logistic regression models.2 To conduct our analysis, we used the available data from the Environmental Protection Agency’s (EPA) Safe Drinking Water Information System (SDWIS/Fed) database for community water systems and non-transient non-community water systems active as of December 31, 2016, in 2 states, Ohio and Texas. We selected these states because recent EPA file reviews did not find significant discrepancies in the LCR violations data reported to SDWIS/Fed. In both states, we found that water systems with some factors were significantly more likely to violate the LCR than systems without those factors. Furthermore, we found that our models, which were based on data for 2013 and 2014, could predict systems with a higher likelihood of a violation in 2015 and 2016 significantly better than chance. Our analysis is limited because it is based on 2 states and thus, not generalizable to other states. It is also based on a subset of the relevant factors that might predict LCR violations and therefore is illustrative of the potential for statistical models to predict violations rather than the definitive model of violations.
1The states and territory that participated in the discussion groups were Alabama, Alaska, California, Colorado, Delaware, Florida, Hawaii, Idaho, Illinois, Indiana, Iowa, Kansas, Kentucky, Louisiana, Maine, Maryland, Michigan, Minnesota, Mississippi, Missouri, Montana, Nebraska, Nevada, New Hampshire, New Jersey, New Mexico, North Carolina, North Dakota, Ohio, Oklahoma, Oregon, Pennsylvania, Puerto Rico, Rhode Island, South Carolina, Tennessee, Texas, Virginia, West Virginia, Wisconsin, and Wyoming. Massachusetts and Georgia did not participate in the discussion groups but met with us for in-person interviews. 2A multivariate logistic regression model is an equation, which is developed through statistical procedures, that estimates the individual influence of each factor on the likelihood of a violation while simultaneously accounting for the influence of the other factors.
Appendix V: Statistical Analysis to Identify Water Systems with a Higher Likelihood for LCR Violations
Appendix V: Statistical Analysis to Identify Water Systems with a Higher Likelihood for LCR Violations
Page 80 GAO-17-424 Elevated Lead in Drinking Water
In a review of previous GAO reports and peer-reviewed literature, we found that statistical models have been used to predict the risk of a violation for regulated entities. For example, in October 2016, we reported on the potential for statistical models to identify motor carriers that posed a high risk of a highway crash.3 In addition, several peer-reviewed studies have developed statistical models to predict the likelihood of drinking water systems violating Safe Drinking Water Act requirements.4 Based on this prior research, we considered predictive modeling as a potential approach to identify drinking water systems with a higher likelihood of violating the LCR. The specific steps we took to conduct this analysis are described below.
To conduct our analysis, we used the available data on community water systems and non-transient non-community water systems active in SDWIS/Fed as of December 31, 2016. We analyzed data for drinking water systems that serve more than 25 people, which is EPA’s size threshold for a public drinking water system. EPA’s SDWIS/Fed database contains descriptive data on water systems (e.g., size, location, and water source), drinking water sample results, violations, and enforcement actions, as required by the LCR. Generally, states with primary enforcement responsibility initiate enforcement actions against water systems that do not comply with the LCR and other drinking water regulations. The LCR requires states to submit certain data to EPA’s SDWIS/Fed database on a quarterly basis.
In our discussion groups with state regulators and review of academic studies and peer-reviewed literature, we identified 29 factors that may influence a drinking water system’s noncompliance with the LCR (see apps. I and III). We examined the SDWIS/Fed database to identify data elements that might represent these factors. Of the factors that were
3GAO, Motor Carriers: Better Information Needed to Assess Effectiveness and Efficiency of Safety Interventions, GAO-17-49 (Washington, D.C.: Oct. 27, 2016). 4T. Rahman, M. Kohli, S. Megdal, S. Aradhyula, and J. Moxley, “Determinants of Environmental Noncompliance by Public Water Systems,” Contemporary Economic Policy, vol. 28, no. 2 (2010): 264-274. Rafael Guerrero-Preston, José Norat, Mario Rodriguez, Lydia Santiago, and Erick Suárez, “Determinants of Compliance with Drinking Water Standards in Rural Puerto Rico between 1996 and 2000: A Multilevel Approach,” Puerto Rico Health Sciences Journal, vol. 27, no. 3 (2008): 229-235. William A. Pike, “Modeling Drinking Water Quality Violations with Bayesian Networks,” Journal of the American Water Resources Association, vol. 40, no. 6 (December 2004): 1563-1578.
Analytical Approach
Available Data
Selected Factors

Appendix V: Statistical Analysis to Identify Water Systems with a Higher Likelihood for LCR Violations
Page 81 GAO-17-424 Elevated Lead in Drinking Water
consistent with findings reported in the literature we reviewed and reported by state regulators in discussion groups, we selected four that were available in SDWIS/Fed to conduct a statistical analysis:
• the population served by (or size of) the drinking water system,
• whether the drinking water system was publicly or privately owned,
• whether the drinking water system used groundwater or surface water as a source, and
• whether the drinking water system was classified as a community water system or a non-transient non-community water system.
In addition, EPA’s current approach for targeting oversight of the LCR is to identify water systems with sample results that exceed the lead action level. Therefore, we also included the factor of whether the system had sample results exceeding the lead action level.
We conducted steps to assess the reliability, completeness, and accuracy of the LCR compliance data in SDWIS/Fed for the purpose of conducting this analysis. We determined that data in SDWIS/Fed were not sufficiently reliable to conduct a nationwide statistical model of LCR violations. We could not verify that the limitations in the completeness of the data identified in our June 2011 report had been sufficiently addressed nationwide.5 Thus, we could not be assured that the LCR violations data submitted to SDWIS/Fed were sufficiently complete, accurate, or comparable across the states. Instead, we used the data in SDWIS/Fed to conduct an illustrative analysis for two statesOhio and Texas. We selected these states because EPA’s recent reviews of the completeness and accuracy of LCR data reported by these states did not find significant
5GAO, Drinking Water: Unreliable State Data Limit EPA’s Ability to Target Enforcement Priorities and Communicate Water Systems’ Performance, GAO-11-381 (Washington, D.C.: June 17, 2011). In June 2011 we reported, among other things, that 91 percent of the errors in EPA’s data verification audits from 2007 to 2009 were the result of states (or EPA acting as the state agency) not issuing a violation and not reporting that violation to SDWIS/Fed. In addition, we found that states did not report or inaccurately reported monitoring and reporting violations.
Data Reliability

Appendix V: Statistical Analysis to Identify Water Systems with a Higher Likelihood for LCR Violations
Page 82 GAO-17-424 Elevated Lead in Drinking Water
discrepancies in LCR violations data.6 We examined EPA’s reviews and either obtained written responses to questions or interviewed EPA and state officials to determine that these two states had sufficiently reliable data for this purpose. EPA’s reviews were not based on statistically representative samples of drinking water systems in these states. Therefore, we cannot conclude definitively that the agency has addressed problems with the completeness and accuracy of violations data. However, we found that these states had sufficiently reliable data for the purpose of testing the feasibility of statistical modeling to predict drinking water systems with a higher likelihood of violating the LCR.
Before developing the logistic regression model, we analyzed whether or not each water system in the two states violated the LCR from January 1, 2013, to December 31, 2014, with respect to each of the four selected factors. We conducted this analysis with cross tabulations and graphical analysis. In cross tabulations, each of the factors we examined was significantly associated with LCR violations, although the nature of these relationships varied between the states. In general, in both states, privately owned systems were more likely to violate the LCR than publically-owned systems, community water systems were less likely to violate the LCR than non-community non-transient water systems; and systems that had sample results exceeding the lead action level were more likely to violate the LCR than those that had not. In Ohio, water systems that used groundwater were more likely to violate the LCR than surface water systems, whereas, in Texas, water systems that used purchased groundwater were less likely to violate the LCR.
In graphical analysis, we found that the likelihood of a violation was related to the size of the population served by the water system. For example, in Ohio, grouped data plots displayed a negative, linear relationship between the likelihood of a violation and the number of
6We first selected the eight most populous statesCalifornia, Texas, Florida, New York, Illinois, Pennsylvania, Ohio, and Georgia. Of these eight states, EPA had recently (since 2015) conducted file reviews to verify whether information in the states’ databases and files were consistent with what was in SDWIS/Fed for California, New York, Ohio, and Texas. Of the four states with recent file reviews, we determined we determined that two statesOhio and Texashave sufficiently reliable data for the purpose of evaluating the potential for predictive modeling of LCR violations through a proof-of-concept exercise.
Bivariate Analysis

Appendix V: Statistical Analysis to Identify Water Systems with a Higher Likelihood for LCR Violations
Page 83 GAO-17-424 Elevated Lead in Drinking Water
people served by a system.7 In Texas, these plots displayed a negative, linear relationship for systems serving 3,300 people or fewer and a positive linear relationship for systems serving larger populations. The threshold of 3,300 people is the threshold that the LCR uses to distinguish small systems.
The results of these cross tabulations were illustrative of factors influencing violations, but they provided only a partial assessment of the relationship between LCR violations and the factors. This is because the cross tabulations compared LCR violations with each factor individually without accounting for the influence of the other factors. For example, we found in our analysis that while systems that had exceeded the lead action level were more likely to have a violation than systems that had not exceeded this level, such systems are also more likely to serve smaller populations. Because these factors are related, bivariate cross tabulations cannot distinguish between their respective influences on the likelihood that a system violated the LCR. To account for multiple factors simultaneously, we developed logistic regression models.
We developed a series of logistic regression models for each state to determine whether factors collectively could identify the likelihood that a water system would violate the LCR. A logistic regression model is an equation, which is developed through statistical procedures, that estimates the individual association of each factor with the likelihood of a violation, while simultaneously accounting for the association between each of the other factors and the likelihood of a violation. It provides a basis for combining multiple variables to predict outcomes and is more inclusive than the bi-variate analysis described in the previous section.
Our models sought to predict LCR violations based on the four selected factors identified previously, namely:
• the population served by (or size of) the drinking water system,
• whether the drinking water system was publicly- or privately-owned,
• the type of source water used by a drinking water system, such as ground water or surface water; and
7Our analysis plotted the log odds of (i.e., the logarithm of the odds ratio) of a violations versus the size of the population served (log10) for groups of systems ranked by the size of the population served.
Logistic Regression Models

Appendix V: Statistical Analysis to Identify Water Systems with a Higher Likelihood for LCR Violations
Page 84 GAO-17-424 Elevated Lead in Drinking Water
• whether the drinking water system was classified as a community water system or a non-transient non-community water system.
We also included whether the system had a sample result exceeding the lead action level during the monitoring period from January 1, 2012, to December 31, 2014. We specified different logistic regression models for each state because of differences in the distributions of the data between the states. For example, in Ohio, nearly all non-transient, non-community water systems used ground water as their primary source water, which made it difficult to disentangle the unique effects of community water systems from those of ground water systems. Therefore, we collapsed non-community water systems using groundwater and non-community water systems not using ground water into a single group for analysis. In Texas, the relationship between the likelihood of a violation and size of the population served shifted as the number of people served by a system reached 3,300. Therefore, we added a term to our logistic regression equation for Texas that allowed us to account for the difference in the relationship between size and the likelihood of a violation or systems below the 3,300 threshold and systems above that threshold.
To test the adequacy of these models, we verified that our data contained a sufficient number of systems with each combination of characteristics, that it adequately fit the data based on the chi-squared goodness-of-fit tests, and that estimated effects were generally stable across multiple model specifications. We tested for nonlinear relationships between the likelihood of a violation and the size of the population served by a system and we transformed the variable accordingly. We also tested for interaction effects between the categorical system characteristics and the size of the population served by the system. In each state, we tested several model specifications to identify the combinations and transformations of variables that best met these conditions.
Among the models we tested, the best-fitting model for Ohio included explanatory variables for whether the system had a sample result exceeding the lead action level, whether the system was privately owned, the size of the population served by the system, whether the system was a non-community water system using groundwater, and whether the system was a non-community water system not using ground water. This model also included an interaction term between community water systems using groundwater and the size of the population served by the system. The data for this model included 1,849 systems, of which 137 violated the LCR in the compliance periods that began in 2013 and 2014 and 1,712 of which did not. The model had an adequate fit to the data
Appendix V: Statistical Analysis to Identify Water Systems with a Higher Likelihood for LCR Violations
Page 85 GAO-17-424 Elevated Lead in Drinking Water
based on chi-squared and Hosmer-Lemeshow goodness-of-fit tests, and it had a good accuracy in predicting LCR violations in 2013 or 2014 based on the area under the Receiver Operator Characteristic (ROC) curve.
The best-fitting model for Texas included explanatory variables for whether the system had a sample result exceeding the lead action level; whether the system was privately owned; whether the system was a community water system; whether the system used groundwater as a source of water; the size of the population served by the system; and a linear spline term, which accounted for a different relationship between system size and the likelihood of a violation for systems served more than 3,300 people. Data for this model included 5,395 systems, of which 2,321 violated the LCR in the compliance periods that began in 2013 and 2014 and 3,074 of which did not. The model had an adequate fit to the data based on the chi-squared and Hosmer-Lemeshow goodness–of-fit tests, and a moderate accuracy in predicting violations in 2013-14 based on the area under the ROC curve.
In each model, we found that certain factors were consistently associated with violations. For example, in both states, water systems that had reported a previous sample result exceeding the lead action level were significantly more likely to violate the LCR. The size of the population served was a statistically significant predictor of a violation in both states but in different ways. In Ohio, water systems were less likely to violate the LCR as their size increased. In Texas, water systems were less likely to violate the LCR as the size of their population increased to 3,300 but were more likely to violate the LCR as the size of the population over 3,300 increased. These patterns persisted in our models even after accounting for whether the system was privately owned, whether the system was a community water system and whether the system used groundwater as a source of water. These three other factors were also associated with the likelihood of a violation in some of our models, but the direction, magnitude and the significance of these associations were not consistent This could be the result of strong associations among the factors, which would make it difficult for the models to precisely estimate their association with violations. Because this imprecision, we do not report the associations between these three factors and the likelihood of a violation. Since the purpose of these models was to identify drinking water systems with a higher likelihood of a violation, rather than to estimate the influence of specific factors on the likelihood of a violation, we focus on the predictive accuracy of these models as described in the next section.

Appendix V: Statistical Analysis to Identify Water Systems with a Higher Likelihood for LCR Violations
Page 86 GAO-17-424 Elevated Lead in Drinking Water
To test whether our models could be used to predict water systems with a higher likelihood of a future violation, we compared the predicted violation results from our models to actual violations that were reported in SDWIS/Fed for 2015 and 2016. Our models, which were based on data from 2013 and 2014, predicted subsequent violations in 2015 and 2016 significantly better than chance. Systems with higher average predicted probabilities of violations had higher observed rates of violations in the subsequent year than systems with lower predicted probabilities, and this difference was statistically significant. To make this determination, we took three steps. First, we used our models to estimate the likelihood that each system violated the LCR in 2013 or 2014 based on the factors identified in the logistic regression models. Second, we divided the water systems into five equally sized groups, referred to as quintiles, based on their estimated likelihood of a violation. Third, we compared the percentage of systems that violated the LCR in 2015 or 2016 across each of these five groups.
We found that systems in the highest likelihood group, based on our models of 2013 to 2014 data, had significantly higher violation rates in 2015 and 2016 as compared to systems in the lowest likelihood group. This result was true for each of the two states and for each of the models that we tested in those states. The tests of predictive accuracy in 2015 and 2016 for the best-fitting models in each state are shown in table 15. For example, in Ohio, 7.9 percent of systems in the fifth quintilethe group with the highest violation likelihood scoresviolated the LCR in 2015 or 2016 as compared to 2.4 percent of those in the first quintile, the group with the lowest likelihood scores. Similarly in Texas, 43.1 percent of systems with the highest likelihood scores violated the LCR in 2015 or 2016 as compared to 21.4 percent of those in the lowest likelihood group.
Predictive Accuracy

Appendix V: Statistical Analysis to Identify Water Systems with a Higher Likelihood for LCR Violations
Page 87 GAO-17-424 Elevated Lead in Drinking Water
Table 15: Accuracy of Logistic Regression Models in Predicting Lead and Copper Rule (LCR) Violations from January 1, 2015, to December 31, 2016
Likelihood of a violation quintilea
Ohio Texas
Number of systems with
a violation Total systems
Percentage of systems
with a violation in 2015 or 2016
Number of systems
with a violation Total systems
Percentage of systems
with a violation in 2015 or 2016
First 9 369 2.4 231 1079 21.4 Second 11 370 3.0 281 1078 26.1 Third 30 370 8.1 320 1079 29.7 Fourth 26 374 7.0 451 1080 41.8 Fifth 29 366 7.9 465 1079 43.1
Source: GAO analysis. │ GAO-17-424 aWe divided drinking water systems into quintiles according to their likelihood of an LCR violation. We estimated the likelihood of a violation based on the predicted values from the best-fitting logistic regression model for each state in 2013 and 2014. Quintiles were ordered according to the likelihood of a violation, such that the first quintile includes the 20 percent of drinking water systems that had the lowest likelihood of a violation and the fifth quintile includes the 20 percent of drinking water systems that had the highest likelihood of a violation.
Based on our illustrative analysis, we found that statistical models could be used to predict water systems with a higher likelihood of violating the LCR. However, our analysis was subject to certain limitations. First, our models used only data for factors available in SDWIS/Fed. They did not include other factors that might be important to predicting violations, such as the treatment technique used by a drinking water system; the presence of lead pipes in a community; or the technical, financial, and managerial capacity of a drinking water system. Second, our models were limited to the two states for which we could obtain reasonable assurances of data reliability, and therefore, the results are not generalizable to other states. While we found some commonalities in the factors that may contribute to violations between the states, we also found several differences between them, suggesting that specific factors may influence violations differently in different states. Finally, while we took several steps to confirm that the data for these states were sufficiently reliable for the purpose of developing illustrative regression models to predict violations, we cannot be confident that the inaccuracies and incompleteness that we and EPA identified in June 2011 have been addressed nationwide. Reliable and sufficient data for additional states would increase the external validity of future analysis. Additionally, data for additional explanatory variables mentioned in the literature and by state regulatorssuch as the presence of lead service lines and the
Discussion

Appendix V: Statistical Analysis to Identify Water Systems with a Higher Likelihood for LCR Violations
Page 88 GAO-17-424 Elevated Lead in Drinking Water
technical, financial, and managerial capacity of a systemwould allow for a more fully specified model with the potential to increase the explanatory power of those models. Taken together, reliable data for a broader sample and a fuller range of explanatory variables could potentially improve the usefulness of models predicting LCR violations.

Appendix VI: EPA Guidance to the Public on Addressing Lead in Drinking Water
Page 89 GAO-17-424 Elevated Lead in Drinking Water
The Environmental Protection Agency (EPA) provides information on its website for the public on lead hazards in drinking water. EPA’s website includes, among other documents, a February 2005 fact sheet for the public entitled Is There Lead in My Drinking Water? (see fig. 5).1
1Environmental Protection Agency, Is There Lead in My Drinking Water? accessed May 16, 2017, https://nepis.epa.gov/Exe/ZyPDF.cgi?Dockey=500025PW.txt.
Appendix VI: EPA Guidance to the Public on Addressing Lead in Drinking Water

Appendix VI: EPA Guidance to the Public on Addressing Lead in Drinking Water
Page 90 GAO-17-424 Elevated Lead in Drinking Water
Figure 5: Example of Information about Lead Hazards in Drinking Water for the Public from the Environmental Protection Agency’s Website

Appendix VI: EPA Guidance to the Public on Addressing Lead in Drinking Water
Page 91 GAO-17-424 Elevated Lead in Drinking Water

Appendix VII: Comments from the Environmental Protection Agency
Page 92 GAO-17-424 Elevated Lead in Drinking Water
Appendix VII: Comments from the Environmental Protection Agency
Appendix VII: Comments from the Environmental Protection Agency
Page 93 GAO-17-424 Elevated Lead in Drinking Water

Appendix VII: Comments from the Environmental Protection Agency
Page 94 GAO-17-424 Elevated Lead in Drinking Water
Appendix VIII: GAO Contact and Staff Acknowledgments
Page 95 GAO-17-424 Elevated Lead in Drinking Water
J. Alfredo Gómez, (202) 512-3841 or [email protected]
In addition to the individual named above, Diane Raynes (Assistant Director); Jennifer Beddor; David Blanding, Jr.; Mark Braza; Richard P. Johnson; Tahra Nichols; Jerry Sandau, and Karen Villafana made key contributions to this report. In addition, Sarah Gilliland, Lindsay Juarez, Maureen Lackner, Dan Royer, and Kiki Theodoropoulos made important contributions to this report.
Appendix VIII: GAO Contact and Staff Acknowledgments
GAO Contact
Staff Acknowledgments

Related GAO Products
Page 96 GAO-17-424 Elevated Lead in Drinking Water
Water Infrastructure: Information on Selected Midsize and Large Cities with Declining Populations. GAO-16-785. Washington, D.C.: September 15, 2016.
Water Infrastructure: EPA and USDA Are Helping Small Water Utilities with Asset Management; Opportunities Exist to Better Track Results. GAO-16-237. Washington, D.C.: January, 27, 2016.
Environmental Health: EPA Has Made Substantial Progress but Could Improve Processes for Considering Children’s Health. GAO-13-254. Washington, D.C.: August 12, 2013.
Drinking Water: Unreliable State Data Limit EPA’s Ability to Target Enforcement Priorities and Communicate Water Systems’ Performance. GAO-11-381. Washington, D.C.: June 17, 2011.
Environmental Health: High-level Strategy and Leadership Needed to Continue Progress toward Protecting Children from Environmental Threats. GAO-10-205. Washington, D.C.: January 28, 2010.
Drinking Water: The District of Columbia and Communities Nationwide Face Serious Challenges in Their Efforts to Safeguard Water Supplies. GAO-08-687T. Washington, D.C.: April 15, 2008.
Drinking Water: EPA Should Strengthen Ongoing Efforts to Ensure That Consumers Are Protected from Lead Contamination. GAO-06-148. Washington, D.C.: January 4, 2006.
District of Columbia’s Drinking Water: Agencies Have Improved Coordination, but Key Challenges Remain in Protecting the Public from Elevated Lead Levels. GAO-05-344. Washington, D.C.: March 31, 2005.
Drinking Water: Safeguarding the District of Columbia’s Supplies and Applying Lessons Learned to Other Systems. GAO-04-974T. Washington, D.C.: July 22, 2004.
Related GAO Products
(100630)

The Government Accountability Office, the audit, evaluation, and investigative arm of Congress, exists to support Congress in meeting its constitutional responsibilities and to help improve the performance and accountability of the federal government for the American people. GAO examines the use of public funds; evaluates federal programs and policies; and provides analyses, recommendations, and other assistance to help Congress make informed oversight, policy, and funding decisions. GAO’s commitment to good government is reflected in its core values of accountability, integrity, and reliability.
The fastest and easiest way to obtain copies of GAO documents at no cost is through GAO’s website (http://www.gao.gov). Each weekday afternoon, GAO posts on its website newly released reports, testimony, and correspondence. To have GAO e-mail you a list of newly posted products, go to http://www.gao.gov and select “E-mail Updates.”
The price of each GAO publication reflects GAO’s actual cost of production and distribution and depends on the number of pages in the publication and whether the publication is printed in color or black and white. Pricing and ordering information is posted on GAO’s website, http://www.gao.gov/ordering.htm.
Place orders by calling (202) 512-6000, toll free (866) 801-7077, or TDD (202) 512-2537.
Orders may be paid for using American Express, Discover Card, MasterCard, Visa, check, or money order. Call for additional information.
Connect with GAO on Facebook, Flickr, LinkedIn, Twitter, and YouTube. Subscribe to our RSS Feeds or E-mail Updates. Listen to our Podcasts. Visit GAO on the web at www.gao.gov and read The Watchblog.
Contact:
Website: http://www.gao.gov/fraudnet/fraudnet.htm E-mail: [email protected] Automated answering system: (800) 424-5454 or (202) 512-7470
Katherine Siggerud, Managing Director, [email protected], (202) 512-4400, U.S. Government Accountability Office, 441 G Street NW, Room 7125, Washington, DC 20548
Chuck Young, Managing Director, [email protected], (202) 512-4800 U.S. Government Accountability Office, 441 G Street NW, Room 7149 Washington, DC 20548
James-Christian Blockwood, Managing Director, [email protected], (202) 512-4707 U.S. Government Accountability Office, 441 G Street NW, Room 7814, Washington, DC 20548
GAO’s Mission
Obtaining Copies of GAO Reports and Testimony Order by Phone
Connect with GAO
To Report Fraud, Waste, and Abuse in Federal Programs
Congressional Relations
Public Affairs
Strategic Planning and External Liaison
Please Print on Recycled Paper.