GAO-07-383 Ambulance Providers: Costs and Expected · PDF file ·...
61
United States Government Accountability Office GAO Report to Congressional Committees AMBULANCE PROVIDERS Costs and Expected Medicare Margins Vary Greatly May 2007 GAO-07-383
Transcript of GAO-07-383 Ambulance Providers: Costs and Expected · PDF file ·...

United States Government Accountability Office
GAO Report to Congressional Committees
AMBULANCE PROVIDERS
Costs and Expected Medicare Margins Vary Greatly
May 2007
GAO-07-383
What GAO Found
United States Government Accountability Office
Why GAO Did This Study
HighlightsAccountability Integrity Reliability
May 2007
AMBULANCE PROVIDERS
Costs and Expected Medicare Margins Vary Greatly
Highlights of GAO-07-383, a report to congressional committees
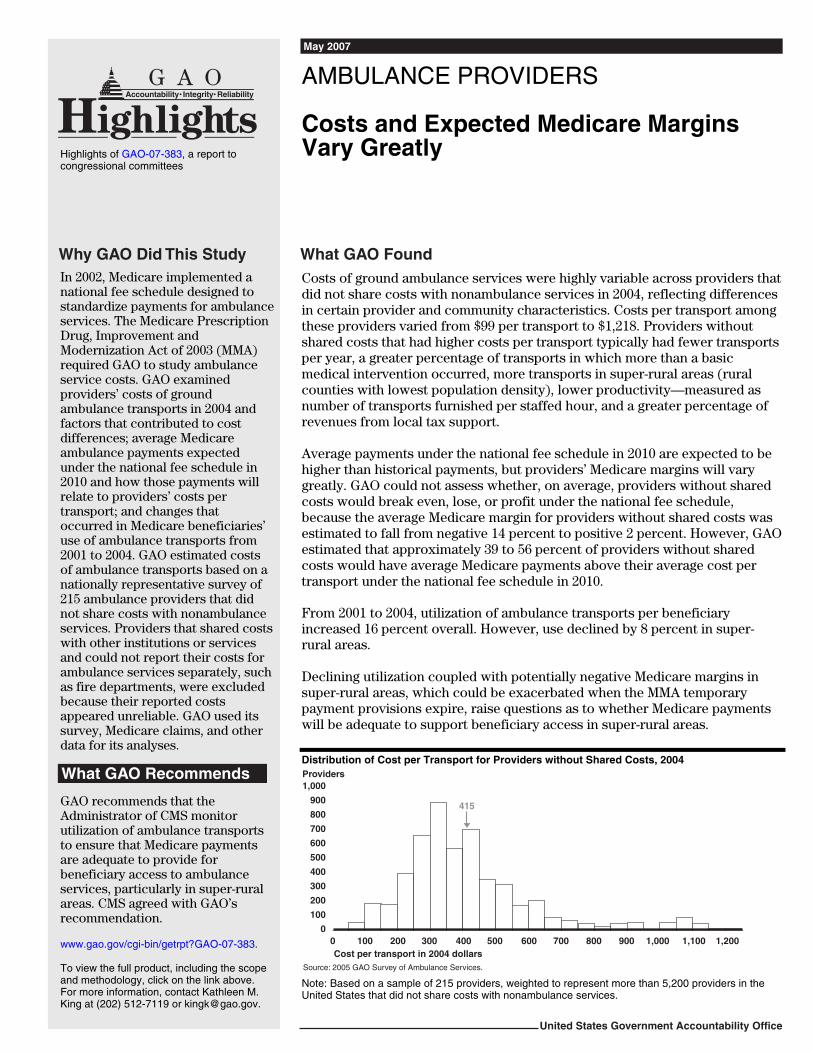
In 2002, Medicare implemented a national fee schedule designed to standardize payments for ambulance services. The Medicare Prescription Drug, Improvement and Modernization Act of 2003 (MMA) required GAO to study ambulance service costs. GAO examined providers’ costs of ground ambulance transports in 2004 and factors that contributed to cost differences; average Medicare ambulance payments expected under the national fee schedule in 2010 and how those payments will relate to providers’ costs per transport; and changes that occurred in Medicare beneficiaries’ use of ambulance transports from 2001 to 2004. GAO estimated costs of ambulance transports based on a nationally representative survey of 215 ambulance providers that did not share costs with nonambulance services. Providers that shared costs with other institutions or services and could not report their costs for ambulance services separately, such as fire departments, were excluded because their reported costs appeared unreliable. GAO used its survey, Medicare claims, and other data for its analyses.
What GAO Recommends
GAO recommends that the Administrator of CMS monitor utilization of ambulance transports to ensure that Medicare payments are adequate to provide for beneficiary access to ambulance services, particularly in super-rural areas. CMS agreed with GAO’s recommendation.
Costs of ground ambulance services were highly variable across providers that did not share costs with nonambulance services in 2004, reflecting differences in certain provider and community characteristics. Costs per transport among these providers varied from $99 per transport to $1,218. Providers without shared costs that had higher costs per transport typically had fewer transports per year, a greater percentage of transports in which more than a basic medical intervention occurred, more transports in super-rural areas (rural counties with lowest population density), lower productivity—measured as number of transports furnished per staffed hour, and a greater percentage of revenues from local tax support. Average payments under the national fee schedule in 2010 are expected to be higher than historical payments, but providers’ Medicare margins will vary greatly. GAO could not assess whether, on average, providers without shared costs would break even, lose, or profit under the national fee schedule, because the average Medicare margin for providers without shared costs was estimated to fall from negative 14 percent to positive 2 percent. However, GAO estimated that approximately 39 to 56 percent of providers without shared costs would have average Medicare payments above their average cost per transport under the national fee schedule in 2010. From 2001 to 2004, utilization of ambulance transports per beneficiary increased 16 percent overall. However, use declined by 8 percent in super-rural areas. Declining utilization coupled with potentially negative Medicare margins in super-rural areas, which could be exacerbated when the MMA temporary payment provisions expire, raise questions as to whether Medicare payments will be adequate to support beneficiary access in super-rural areas. Distribution of Cost per Transport for Providers without Shared Costs, 2004 Providers
0
100
200
300
400
500
600
700
800
900
1,000
Source: 2005 GAO Survey of Ambulance Services.
415
Cost per transport in 2004 dollars8007006005004003002001000 1,2001,1001,000900
Note: Based on a sample of 215 providers, weighted to represent more than 5,200 providers in the United States that did not share costs with nonambulance services.
www.gao.gov/cgi-bin/getrpt?GAO-07-383. To view the full product, including the scope and methodology, click on the link above. For more information, contact Kathleen M. King at (202) 512-7119 or [email protected].
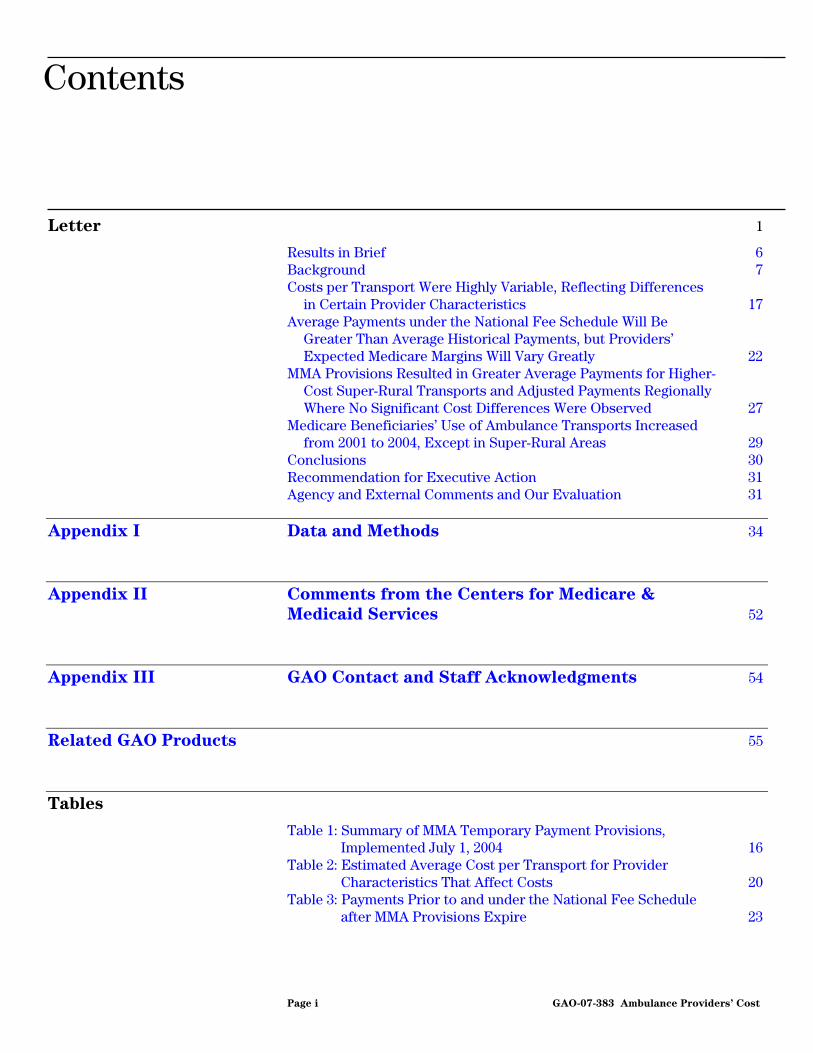
Contents
Letter 1
Results in Brief 6Background 7 Costs per Transport Were Highly Variable, Reflecting Differences
in Certain Provider Characteristics 17 Average Payments under the National Fee Schedule Will Be
Greater Than Average Historical Payments, but Providers’ Expected Medicare Margins Will Vary Greatly 22
MMA Provisions Resulted in Greater Average Payments for Higher-Cost Super-Rural Transports and Adjusted Payments Regionally Where No Significant Cost Differences Were Observed 27
Medicare Beneficiaries’ Use of Ambulance Transports Increased from 2001 to 2004, Except in Super-Rural Areas 29
Conclusions 30 Recommendation for Executive Action 31 Agency and External Comments and Our Evaluation 31
Appendix I Data and Methods 34
Appendix II Comments from the Centers for Medicare &
Medicaid Services 52
Appendix III GAO Contact and Staff Acknowledgments 54
Related GAO Products 55
Tables
Table 1: Summary of MMA Temporary Payment Provisions, Implemented July 1, 2004 16
Table 2: Estimated Average Cost per Transport for Provider Characteristics That Affect Costs 20
Table 3: Payments Prior to and under the National Fee Schedule after MMA Provisions Expire 23
Page i GAO-07-383 Ambulance Providers’ Cost
Table 4: Expected Average Medicare Margins under the National Fee Schedule for Providers without Shared Costs in 2004 Dollars 24
Table 5: Average Payments prior to MMA Implementation and after Implementation 28
Table 6: Percentage Changes in Average Payments prior to MMA Implementation and after Implementation, by Region 29
Table 7: Ambulance Transports per 1,000 Beneficiaries in Urban, Rural, and Super-Rural Areas 30
Table 8: Provider and Local Area Characteristics Included in Analysis of Average Cost per Transport, 2004 41
Table 9: Results for Average Cost of an Ambulance Transport Regression—Estimated Effects of Selected Provider and Local Area Characteristics on the Average Cost of Ambulance Transports for Providers, Not Including Impact of Productivity and Community Tax Support 43
Table 10: Results for Average Cost of an Ambulance Transport Regression—Estimated Effects of Selected Provider and Local Area Characteristics on the Average Cost of Ambulance Transports for Providers, Including Impact of Productivity and Community Tax Support 44
Table 11: Census Divisions 47 Table 12: Average Mile per Transport, First Half of 2004 49 Table 13: Mileage Rates 50
Figures
Figure 1: Medicare Ambulance Payment Formula under the National Fee Schedule 13
Figure 2: National Fee Schedule and Regional Fee Schedule 15 Figure 3: Distribution of Cost per Transport for Providers without
Shared Costs in 2004 18 Figure 4: Expected Medicare Margins for Urban, Rural, and Super-
Rural Providers without Shared Costs 26
Page ii GAO-07-383 Ambulance Providers’ Cost

Abbreviations
ALS advanced life support BLS basic life support CF conversion factor CMS Centers for Medicare & Medicaid Services CPI-U Consumer Price Index for All Urban Consumers EMS emergency medical services EMT emergency medical technician GPCI geographic practice cost index MMA Medicare Prescription Drug, Improvement and Modernization Act of 2003 MSA metropolitan statistical area NECMA New England county metropolitan area NFS national fee schedule RVU relative value unit
This is a work of the U.S. government and is not subject to copyright protection in the United States. It may be reproduced and distributed in its entirety without further permission from GAO. However, because this work may contain copyrighted images or other material, permission from the copyright holder may be necessary if you wish to reproduce this material separately.
Page iii GAO-07-383 Ambulance Providers’ Cost
United States Government Accountability Office
Washington, DC 20548
May 23, 2007
The Honorable Max Baucus Chairman The Honorable Charles E. Grassley Ranking Member Committee on Finance United States Senate
The Honorable John D. Dingell Chairman The Honorable Joe Barton Ranking Member Committee on Energy and Commerce House of Representatives
The Honorable Charles B. Rangel Chairman The Honorable Jim McCrery Ranking Member Committee on Ways and Means House of Representatives
In 2005, ambulance service providers completed more than 12.6 million ground transports for Medicare beneficiaries.1 Medicare paid more than $4 billion for ground ambulance transports and is likely the largest single payer of ambulance services in the United States.
As part of a series of Medicare payment reforms in 1997, Congress required the Health Care Financing Administration, now the Centers for Medicare & Medicaid Services (CMS), to develop a national fee schedule for Medicare ambulance services, which was implemented in 2002.2 Historically, CMS had used two methods to pay for ambulance services, which resulted in wide variations in payment for the same service among different types of ambulance service providers. In particular, CMS had
1We use the term providers to refer to all types of organizations that provide ambulance transports for Medicare beneficiaries.
242 U.S.C. § 1395m(l).
Page 1 GAO-07-383 Ambulance Providers’ Cost

used one method—reasonable costs3—to pay hospital-based providers. It used another method—reasonable charges4—to pay other, nonhospital-based types of ambulance service providers. This meant that hospital-based and nonhospital-based providers were paid different amounts for the same ambulance services.
In 2002, CMS began phasing in a national fee schedule that established a single payment method for all ambulance services regardless of the type of provider.5 This fee schedule standardized Medicare payments for ambulance services. In general, providers strive to keep their costs of delivering a service at or below the standard fee schedule rate for that service. Under the Medicare ambulance national fee schedule, providers that have costs of delivering ambulance services above the fee schedule payment lose the difference between the payment amount and their costs, while providers with costs below the fee schedule payment are able to keep the difference between the payment amount and their costs. In aggregate, these differences are known as Medicare margins and express whether the provider makes a profit or loss on its Medicare transports. Some providers rely heavily on Medicare revenues and adequate Medicare margins help ensure the continuing availability of beneficiaries’ access to ambulance services.
CMS phased in the ambulance national fee schedule from April 2002 through December 2005. During this transition, the new fee schedule payments were blended with the previous reasonable-cost payments for hospital-based providers and reasonable-charge payments for nonhospital-based providers. In 2003, Congress passed the Medicare Prescription Drug, Improvement and Modernization Act (MMA), which introduced several temporary payment provisions, including a regional fee schedule that overlapped with the transition to the national fee schedule.6 Beginning in
3Reasonable-cost payments were based on the provider’s cost of providing ambulance services as reported on cost reports.
4Reasonable-charge payments were based on the bill from the ambulance service provider but were subject to an upper limit.
5The national fee schedule applies to ground and air ambulance services, but this report and our analysis are limited to ground ambulance services only, which include water ambulance services and account for nearly all ambulance services. We use the terms service, transport, and ambulance service to refer to ground ambulance transport services only.
6Pub. L. No. 108-173, § 414, 117 Stat. 2066, 2278-80 (2003).
Page 2 GAO-07-383 Ambulance Providers’ Cost
July 2004, these temporary payment provisions were expected to add about $840 million to Medicare payments for ambulance services through December 2009, when the last of these provisions are set to expire.
The Medicare, Medicaid, and SCHIP Benefits Improvement and Protection Act of 20007 and the MMA required GAO to study ambulance service costs. As discussed with the congressional committees of jurisdiction, in this report we (1) examined the differences in providers’ costs of ambulance transports in 2004 and the factors that contributed to these cost differences, (2) assessed how the ambulance national fee schedule in 2010 is expected to affect average ambulance payments and how those payments will relate to providers’ costs per transport, (3) determined the effect of MMA temporary payment provisions on ambulance payments, and (4) described the change that occurred in Medicare beneficiaries’ use of ambulance transports from 2001 to 2004.
To examine differences in costs of providing ambulance transports, we conducted a national survey of ambulance providers in 2005. In our survey, we requested information about providers’ costs, revenues, transports, and organizational characteristics for their most recently completed fiscal year.8 We selected a stratified,9 random sample of 500 eligible providers that billed Medicare, and we received 321 completed questionnaires for a response rate of 64 percent. We used this nationally representative sample of 321 providers to describe the ambulance industry.10 However, after excluding two cost outliers, our analysis was further limited to a subgroup of providers that (1) did not share costs with other institutions or services or (2) shared costs but reported costs of ambulance services separately from the costs of their other services. Our analysis and findings are nationally representative of this subgroup of ambulance providers, which we refer to as providers without shared
7Pub. L. No. 106-554, appendix F, § 436, 114 Stat. 2763, 2763A-527 (2000).
8The GAO Survey of Ambulance Services asked providers to report on their organizations’ costs of providing ground ambulance services. As such, the survey measures organizations’ expenses, or spending, for ground ambulance services.
9The sample was stratified by five types of ambulance providers: hospital-based, volunteer, fire-based, government, and freestanding.
10To make our survey sample representative of all Medicare ambulance providers, we computed a sample weight for each respondent provider.
Page 3 GAO-07-383 Ambulance Providers’ Cost
costs.11 We excluded 104 providers that shared costs of ambulance services with other institutions or nonambulance services and could not distinguish their costs for providing ambulance services from other costs, including but not limited to all fire departments. We excluded these providers because their reported costs appeared to be unreliable. The resulting sample size for our analysis was 215 providers without shared costs. Although our sample is nationally representative of an estimated 5,200 providers without shared costs, the small sample size along with the variability of responses reduces the precision of our estimates, increasing the range of the 95 percent confidence intervals we report. A 95 percent confidence interval is the range within which we expect the true population estimate to fall 95 percent of the time, and it is the range of the confidence interval that expresses the precision of our estimates.
To examine factors that contributed to differences in costs, we used our survey data and Medicare data supplemented by data from two other sources. The Oil Price Information Service was our source for the average annual retail price of fuel by zip code, and the United States Postal Service supplied building rents because it tracks its facility costs in each zip code. We used regression analysis to analyze the relationships between various provider and local area characteristics and cost per transport among providers without shared costs. We also compared Medicare claims data for all nonrespondents with those of respondent providers without shared costs and determined that our cost estimates were not biased by nonresponse. See appendix I for details regarding our survey, other data sources, data limitations, and the analytic methods we employed.
To assess the effect of the ambulance national fee schedule on payments, we used Medicare claims data to compute average payments for ambulance transports in 2001, before the implementation of the ambulance national fee schedule, and in 2004, 2 years after the phase-in of the fee schedule had begun. For Medicare payment analyses, payments were expressed in 2004 dollars to exclude the effects of inflation. We also
11We applied our sample weights to the subgroup so the providers were nationally representative of all ambulance service providers without shared costs.
Page 4 GAO-07-383 Ambulance Providers’ Cost

compared average payments for urban, rural, and super-rural transports.12 We used Medicare claims data and payment formulas as specified in federal regulations to simulate average payments under the national fee schedule in 2010, after all of the MMA provisions expire, but computed these payments in 2004 dollars, the year that best reflects the cost data collected in our survey. To compare the simulated Medicare payments under the national fee schedule for providers without shared costs with the costs per transport of those providers, we computed providers’ Medicare margins—the percentage difference between average Medicare payments and providers’ costs per transport.13 All costs per transport and provider margins are based solely on our sample of providers without shared costs, and for this reason, these estimates are reported with their confidence intervals.
We also assessed the effect of the MMA temporary payment provisions on payments in 2004 using Medicare claims data by examining the change in payments from the first half of the year, before the MMA changes went into effect, with the second half of the year, when MMA payment provisions had their maximum effect. To assess the change in Medicare beneficiaries’ use of ambulance transports from 2001 to 2004, we used Medicare claims and CMS enrollment data, which contain information about beneficiaries, to compute transports per 1,000 beneficiaries for both years.
We tested the internal consistency and reliability of our survey data and all non-Medicare data sources and determined that all data sources were adequate for our purposes. We conducted our work from July 2004 through April 2007 in accordance with generally accepted government auditing standards.
12To define urban, rural, and super-rural transports, CMS uses the metropolitan statistical areas (MSA) definitions established by the Office of Management and Budget. During the period of our study, CMS defined urban transports as those that originate within MSAs and New England county metropolitan areas (NECMA), rural transports as those that originate in rural counties that are outside of MSAs and NECMAs as well as small towns and rural areas within MSAs or NECMAs that are isolated from central areas by distance or other features, such as mountains. CMS defines super-rural transports as those that originate in the bottom 25 percent of rural areas as defined by population density.
13This comparison assumes that providers’ cost structures under the fee schedule would be the same as they were in 2004.
Page 5 GAO-07-383 Ambulance Providers’ Cost
Costs of ground ambulance transports were highly variable across providers without shared costs, reflecting differences in certain provider characteristics. Costs per transport for providers without shared costs averaged $415, but varied from $99 to $1,218 per transport—a range of more than $1,100. Contributing to the variability were differences in providers’ volume and mix of transports; service area (urban, rural, or super-rural); productivity, which we defined as the number of transports per staffed hour; and the percentage of total revenue derived from local tax support. Providers without shared costs had higher costs per transport when they had fewer transports per year, a greater percentage of transports in which more than a basic medical assessment or intervention occurred, and more transports from super-rural areas than providers without shared costs that did not have these characteristics. In addition, providers without shared costs that had lower productivity and those receiving a greater percentage of revenues from local tax support had higher costs per transport than providers without shared costs that had higher productivity and less local tax support. Other provider and local area characteristics, such as type of provider, region as determined by census division, building rent, and price of fuel, did not significantly affect average costs per transport among providers without shared costs.
Results in Brief
Average payments under the national fee schedule in 2010, after all of the MMA temporary payment provisions are set to expire, are expected to be higher than payments in 2001, but Medicare margins for providers without shared costs will vary greatly. In 2010, average ambulance national fee schedule payments are estimated to be 3 percent higher overall than payments in 2001, after adjusting for inflation and assuming that providers bill the maximum amounts allowed. Further, a greater percentage than the overall increase in payments will accrue to rural and super-rural transports, on average, while urban transports will receive a decrease in payments under the national fee schedule in 2010. We could not assess whether providers without shared costs will break even, lose, or profit, on average, under the ambulance national fee schedule after the MMA temporary payment provisions expire, because the 95 percent confidence interval for the average expected Medicare margin for providers without shared costs spanned from negative 14 percent to positive 2 percent when we took into account the number of respondents in our sample and the range of their reported costs. However, across all providers without shared costs, we estimated that 39 to 56 percent will have average Medicare payments above their average costs per transport under the ambulance national fee schedule in 2010.
Page 6 GAO-07-383 Ambulance Providers’ Cost

The MMA’s temporary payment provisions, which included base- and mileage-rate increases as well as the introduction of a regional fee schedule, resulted in raised average ambulance payments overall, particularly for super-rural transports, which we determined were typically more costly to provide. However, regional payment adjustments by census division under the MMA did not appear to be warranted on the basis of regional cost differences. The regional fee schedule increased payments substantially for some regions but not others. After controlling for various characteristics that affected the costs of providing ambulance transports, we did not discern any significant differences in average cost per transport across regions.
From 2001 to 2004, Medicare beneficiaries’ use of ambulance transports increased overall, even in those regions that had a decrease in average payments after the MMA was implemented. However, beneficiaries’ use in super-rural areas decreased by 8 percent over the same period. The decline in the use of super-rural ambulance transports did not appear to be related to any significant change in the population of Medicare beneficiaries residing in super-rural areas.
In light of the variability in ambulance providers’ Medicare margins and the potential for negative margins to have an impact on beneficiary access, we recommend that the Administrator of CMS monitor utilization of ambulance transports to ensure that Medicare payments are adequate to provide for beneficiary access to ambulance services, particularly in super-rural areas. In its comments on a draft of this report, CMS stated that it agreed with our recommendation. External commenters generally agreed with our findings.
Ground ambulance services are provided by a wide range of organizations that differ in their organizational structure, types of services offered, staffing, and revenue sources. Local conditions—including whether providers are affiliated with other organizations; whether their service areas are predominately urban, rural, or super-rural; and the amount of community-dedicated revenues—contribute to this diversity.
Background
In addition, communities have few, if any, tools to help them decide the optimal organizational structure, staffing, or amount of funding for ambulance services, given local conditions. Although there have been
Page 7 GAO-07-383 Ambulance Providers’ Cost
efforts to establish national performance or quality standards,14 there is limited information about how to best evaluate the costs of providing ambulance services in a community. In recent years, industry associations and federal agencies have worked to develop a data system and mechanisms for measuring the performance of emergency medical services (EMS); however, these tools cannot yet be applied to measure performance and evaluate the efficiency of ambulance services.15 The lack of data and performance standards makes it difficult to assess whether any given provider is delivering quality care or whether services are being provided efficiently.
Organizational structures differ in that some ambulance providers are affiliated with another institution, such as a hospital or fire department, and in that providers may or may not offer other types of services, such as hospital services, fire suppression, rescue, or wheelchair transportation. Providers affiliated with another institution or that offer other types of services may share resources and operational costs, such as building space, administrative support, or personnel, with these other entities and services. About two-fifths of the ambulance industry shared operational costs with other institutions or services in 2004.16 Nine percent of the ambulance industry was affiliated with a hospital, while 37 percent was affiliated with a fire department and 21 percent was affiliated with another government agency. Other communities (33 percent of the ambulance industry in 2004) were served by freestanding, for-profit or not-for-profit provider organizations.
The types of services offered and the staff employed also vary among providers. Some providers perform only emergency transports, in
14The Commission on Accreditation of Ambulance Services and the Commission of Accreditation of Medical Transport Systems have established ambulance service accreditation standards.
15The National Association of State EMS Officials has worked with other industry associations and federal partners to develop tools for measuring the performance of EMS systems: (1) EMS system indicators, which were released for public comment and are being finalized; (2) the National EMS Information Management System; and (3) a cost framework for cost analysis in EMS research. The American Ambulance Association published its Community Guide to Ensure High-Performance Emergency Ambulance
Services in 2004.
16Unless otherwise noted, all background information on the ambulance industry is from the GAO 2005 Survey of Ambulance Services. These estimates are based on the 321 total providers that responded to our survey.
Page 8 GAO-07-383 Ambulance Providers’ Cost
response to a 911 or equivalent call, while other providers offer nonemergency transports, which are typically transfers from one facility to another and may be scheduled in advance. In 2004, 45 percent of the ambulance industry performed only emergency transports; 55 percent performed emergency and nonemergency transports. Some providers perform only basic life support (BLS)17 transports because their staff are not certified to perform more intensive medical assessments and interventions, such as advanced life support (ALS)18 and other more complex services. In 2004, 9 percent of the ambulance industry specialized in only ALS and more complex Medicare transports, such as those requiring one or more ALS services or respiratory care; 14 percent performed only BLS Medicare transports; and 86 percent provided a mix of BLS, ALS, and more complex Medicare transports.19 Fire departments are more likely to be specialized in ALS and more complex services. According to the fire departments that responded to our survey, 70 percent of their Medicare transports, on average, required ALS or more complex services; for other providers ALS and more complex transport services constituted only 49 percent of their Medicare transports.
Ambulance providers use of a variety of staff to deliver services to their communities. First, providers and communities determine what proportion of their staff will be emergency medical technicians (EMT) trained to perform BLS services, and what proportion will be EMT-intermediates or paramedics, who have training to perform more intensive ALS interventions.20 In 2004, 77 percent of providers that completed our survey reported having at least one staff member trained as a paramedic,
17BLS services include basic, noninvasive interventions to reduce morbidity and mortality associated with acute out-of-hospital medical and traumatic emergencies.
18ALS services include advanced, invasive, and pharmacological interventions to reduce morbidity and mortality associated with acute out-of-hospital medical and traumatic emergencies.
19Under the Medicare program, there are seven levels of ambulance transports. BLS and ALS transports each constitute two levels, emergency or nonemergency. The remaining levels of service—ALS Level 2 and specialty care transport (both of which involve invasive or specialized care) and paramedic ALS intercept (when a paramedic provides ALS services but does not transport the patient)—made up less than 2 percent of all Medicare transports in 2004.
20EMT-Basic personnel are trained in BLS services only. EMT-Intermediate personnel are qualified to perform essential advanced techniques and to administer a limited number of medications. Paramedics have the competencies of EMT-Intermediate personnel in addition to other enhanced skills and can administer additional interventions and medications.
Page 9 GAO-07-383 Ambulance Providers’ Cost

nurse, or physician, but the remaining 23 percent of respondent providers relied on staff with less training than a paramedic. Other staffing choices include whether to employ career-oriented paid staff, rely on volunteers, or use a mix of paid and volunteer staff. Some providers choose to employ cross-trained staff.21 In 2004, two-fifths of the ambulance industry relied substantially on volunteer staff.22 In addition, providers and communities make different choices about whether to maintain backup vehicles and staff or to rely to a greater extent on nearby providers for backup assistance.
Providers’ service areas can be urban, rural, super-rural, or a mix of areas. During 2004, CMS defined urban transports as those that originate within metropolitan statistical areas (MSA) and New England county metropolitan areas (NECMA), rural transports as those that originate in rural counties that are outside of MSAs and NECMAs,23 and super-rural transports as those that originate in the bottom 25 percent of rural areas as defined by population density. About half of the ambulance providers served predominately urban areas, and the other half served predominately rural and super-rural areas.24 However, three-fourths of all Medicare transports originated in urban areas. Therefore, rural and super-rural providers performed fewer transports on average than urban providers. In addition, rural and super-rural transports were longer than urban transports, on average, requiring more time and resources per transport. In 2004, urban Medicare transports averaged 7 miles, while rural Medicare transports averaged 13 miles and Medicare transports from super-rural areas averaged 20 miles.
Providers have several potential revenue sources depending on their communities and their choices about funding ambulance services.
21Cross-trained staff typically refers to firefighters who are also trained as EMTs.
22We defined substantial use of volunteer staff as 20 percent or more of staff hours spent providing ambulance services, exclusive of administration.
23Rural areas can also be small towns and rural areas within large metropolitan counties that are isolated from central areas by distance or other features, such as mountains.
24From this point forward in the report, we refer to providers that served predominately urban, rural, and super-rural areas as urban, rural, and super-rural providers, respectively. We classified providers as super-rural if 60 percent or more of their Medicare transports in 2004 originated in a super-rural zip code. We classified providers as rural if they did not meet the super-rural definition and 60 percent or more of their Medicare transports in 2004 originated in rural or super-rural zip codes. We defined providers as urban if they did not meet the rural or super-rural classifications.
Page 10 GAO-07-383 Ambulance Providers’ Cost
Revenue sources can include community tax support (such as revenue from local governments); charitable donations; state and federal grants; subscription programs;25 and reimbursements from Medicare or Medicaid patients, and private health insurance companies. Not all providers receive revenues from all sources, and the mix and amount of revenues available may vary.26 For example, 48 percent of the ambulance industry indicated that a state or local government approves the fees they may choose to charge. In communities that limit ambulance providers’ fees, providers may bill Medicare (and other payers) less than the allowed amount and therefore do not receive the maximum Medicare payment allowed for their services. In 2004, Medicare payments for ambulance transports accounted for 31 percent of the providers’ revenues, on average, while Medicare beneficiaries accounted for about 40 percent of their transports during that same year.27 However, the percentage of Medicare revenues among providers ranged from less than 1 percent to 80 percent. Furthermore, different communities provide different levels of tax support to address specific issues, such as ensuring a minimum level of service in remote areas or being equipped with more sophisticated transport vehicles or having more highly trained staff.
25A subscription program is an arrangement in which an ambulance service provider is paid an annual fee for providing emergency transportation for a community.
26In 2004, the annual spending of providers that responded to our survey ranged from less than $10,000 to more than $70 million.
27This estimate is based on a smaller sample of 209 providers that reported Medicare revenues and total revenues on the GAO 2005 Survey of Ambulance Services.
Page 11 GAO-07-383 Ambulance Providers’ Cost
The ambulance national fee schedule was part of a series of payment reforms to make Medicare a more equitable and prudent purchaser of health care services. Phased in from April 2002 through December 2005, the national fee schedule standardized payment rates and reduced wide variations in payments for the same service.
Medicare Ambulance National Fee Schedule
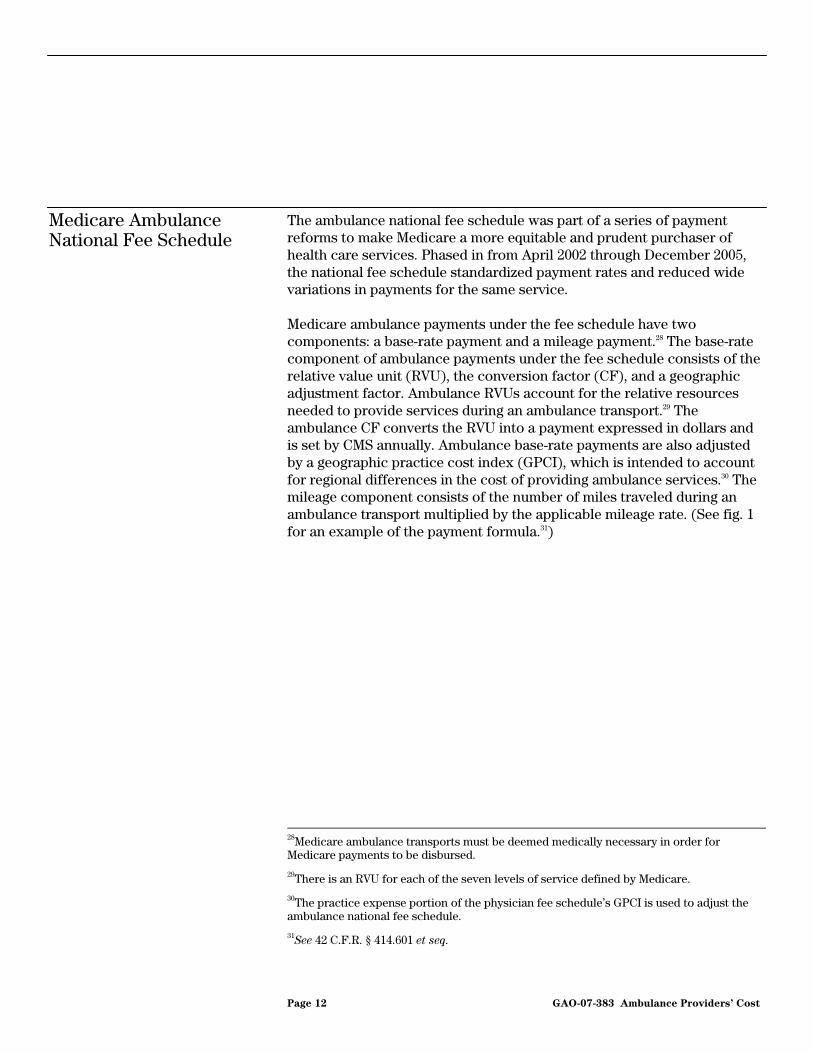
Medicare ambulance payments under the fee schedule have two components: a base-rate payment and a mileage payment.28 The base-rate component of ambulance payments under the fee schedule consists of the relative value unit (RVU), the conversion factor (CF), and a geographic adjustment factor. Ambulance RVUs account for the relative resources needed to provide services during an ambulance transport.29 The ambulance CF converts the RVU into a payment expressed in dollars and is set by CMS annually. Ambulance base-rate payments are also adjusted by a geographic practice cost index (GPCI), which is intended to account for regional differences in the cost of providing ambulance services.30 The mileage component consists of the number of miles traveled during an ambulance transport multiplied by the applicable mileage rate. (See fig. 1 for an example of the payment formula.31)
28Medicare ambulance transports must be deemed medically necessary in order for Medicare payments to be disbursed.
29There is an RVU for each of the seven levels of service defined by Medicare.
30The practice expense portion of the physician fee schedule’s GPCI is used to adjust the ambulance national fee schedule.
31See 42 C.F.R. § 414.601 et seq.
Page 12 GAO-07-383 Ambulance Providers’ Cost
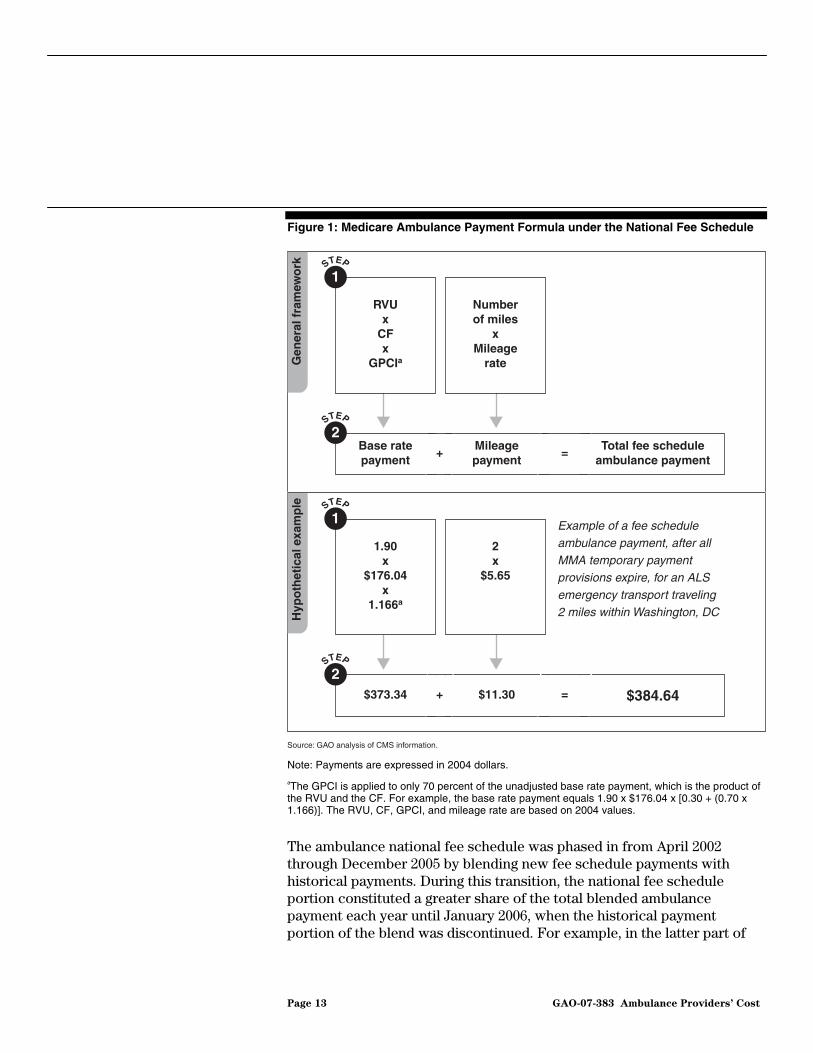
Figure 1: Medicare Ambulance Payment Formula under the National Fee Schedule
Source: GAO analysis of CMS information.
1.90 x
$176.04x
1.166a
2x
$5.65
1STEP
$373.34 $11.30
2STEP
$384.64+ =
RVU x
CFx
GPCIa
Number of miles
xMileage
rate
1STEP
Base ratepayment
Mileagepayment
2STEP
Total fee scheduleambulance payment
+ =
Example of a fee schedule ambulance payment, after all MMA temporary payment provisions expire, for an ALS emergency transport traveling 2 miles within Washington, DC
Gen
eral
fra
mew
ork
Hyp
oth
etic
al e
xam
ple
Note: Payments are expressed in 2004 dollars.
aThe GPCI is applied to only 70 percent of the unadjusted base rate payment, which is the product of the RVU and the CF. For example, the base rate payment equals 1.90 x $176.04 x [0.30 + (0.70 x 1.166)]. The RVU, CF, GPCI, and mileage rate are based on 2004 values.
The ambulance national fee schedule was phased in from April 2002 through December 2005 by blending new fee schedule payments with historical payments. During this transition, the national fee schedule portion constituted a greater share of the total blended ambulance payment each year until January 2006, when the historical payment portion of the blend was discontinued. For example, in the latter part of
Page 13 GAO-07-383 Ambulance Providers’ Cost

2002, total ambulance payments were a blend of 20 percent under the national fee schedule and 80 percent under the historical payment system. In 2004, the blend was 60 percent national fee schedule and 40 percent historical payment system. (See fig. 2 for further details on the blending of historic payments and national fee schedule payments.)
MMA Temporary Payment Provisions
The MMA introduced several temporary ambulance payment provisions that were implemented in 2004, the last of which expires at the end of 2009. CMS estimates that these payment adjustments will add $840 million to Medicare ambulance services over the 5 years they are in effect. The MMA provisions increased payment rates for urban and rural transports and for transports 51 miles or greater. The MMA also provided a significant base rate increase for transports originating in super-rural areas and provided for a new regional fee schedule based on the nine census divisions.32
The regional fee schedule was designed to ease the transition from the historical payment system to the national fee schedule. The introduction of the regional fee schedule overlapped with the phase-in of the national fee schedule. The regional fee schedule gave temporarily higher ambulance payments than what would generally be paid under the national fee schedule to ambulance providers in census divisions that had historically higher payments. If the regional base-rate payment was determined to be greater than the national base-rate payment for a particular region, then the region received the more advantageous blend of the regional fee schedule base-rate payment and the national fee schedule base-rate payment. For example, in the second half of 2004 under the regional fee schedule, affected regions received a blend of 80 percent of their regional fee schedule base-rate payment and 20 percent of the national fee schedule base payment rate. This base-rate payment was then further blended with historical payments as a part of the gradual phase-in of the ambulance national fee schedule.33 The regional fee schedule component of the base rate blend was reduced each year from 2005 through 2007, and expires at the end of 2009. (See fig. 2 for further details
32In this report we use the term regions to refer to the nine census divisions as defined by the U.S. Census Bureau. See table 11 in app. I for a description of the nine census divisions.
33The national fee schedule portion blend with historical payments includes mileage payments. The regional fee schedule is only applicable to the base rate payment.
Page 14 GAO-07-383 Ambulance Providers’ Cost
on the blending of historical, national fee schedule, and regional fee schedule payments.)
Figure 2: National Fee Schedule and Regional Fee Schedule
0
20
40
60
80
100
2010200920082007200620052004e20032002b2001a
Percentage of total reimbursement
Year
Regional fee schedule base rate payment
National fee schedule base rate payment
Source: GAO analysis of CMS information.
0
20
40
60
80
100
201020092008200720062005200420032002b2001a
Year
Historic fee schedule payment
National fee schedule payment
Percentage of total reimbursement
10080
20
60
40
40
60c
20
80c100c 100d 100d 100d 100
Regional fee schedule in effect from July 1, 2004 through Dec. 31, 2009
Regional fee schedule in effect from July 1, 2004 through Dec. 31, 2009
A.Blend of historical reasonable costs and charges and national fee schedule payments, including mileage
B.Blend of regional fee schedule base rate payment and national fee schedule base rate payment, excluding mileage
100
20
80d
20
80d
20
80d
40
60c
60
40c
80
20c
Note: All years refer to calendar years unless otherwise specified.
aJanuary 1, 2001 through March 31, 2002.
bApril 1, 2002 through December 31, 2002.
cThe national fee schedule payment portion includes MMA increases of 1 percent and 2 percent for urban and rural transports, respectively, and an approximate 23 percent base rate increase for super-rural transports.
Page 15 GAO-07-383 Ambulance Providers’ Cost

dThe national fee schedule payment portion includes an MMA base rate increase of approximately 23 percent for super-rural transports only.
eJuly 1, 2004 through December 31, 2004.
In addition to providing for a regional fee schedule, the MMA temporarily required higher payment rates for super-rural transports. As a result, base rate payments for transports originating in super-rural areas increased about 23 percent. The MMA also provided for a 25 percent increase in the mileage rate for every ambulance mile traveled exceeding 50. Finally, the MMA required an increase in payment rates for mileage and transports originating in urban and rural areas by 1 percent and 2 percent, respectively. (See table 1 for MMA temporary payment provisions and their expiration dates.)
Table 1: Summary of MMA Temporary Payment Provisions, Implemented July 1, 2004
Payment provision Expiration date
The regional fee schedule December 31, 2009
An increase in the base rate for super-rural transportsa December 31, 2009
A 25 percent increase in the urban and rural mileage rate for every ambulance mile exceeding 50
December 31, 2008
A 1 percent and 2 percent increase for urban and rural transports and mileage, respectively
December 31, 2006
Source: 42 U.S.C. § 1395m(l)(10)-(13).
aCMS determined that this increase would be approximately 23 percent. 69 Fed. Reg. 40288 (July 1, 2004).
Medicare Margins and Costs
A provider’s Medicare margin under a fee schedule generally depends on whether the provider’s costs of delivering a service are below its Medicare payments for the service. Under the ambulance national fee schedule, providers with costs per transport less than the Medicare payment for that transport are able to retain the difference between the fee schedule payment and their costs per transport. Likewise, providers with costs per transport above the national fee schedule payment will lose the difference between the Medicare payment and their costs per transport. Therefore, ambulance providers that can control their costs per transport may have an advantage over those that cannot control their costs per transport.
Page 16 GAO-07-383 Ambulance Providers’ Cost
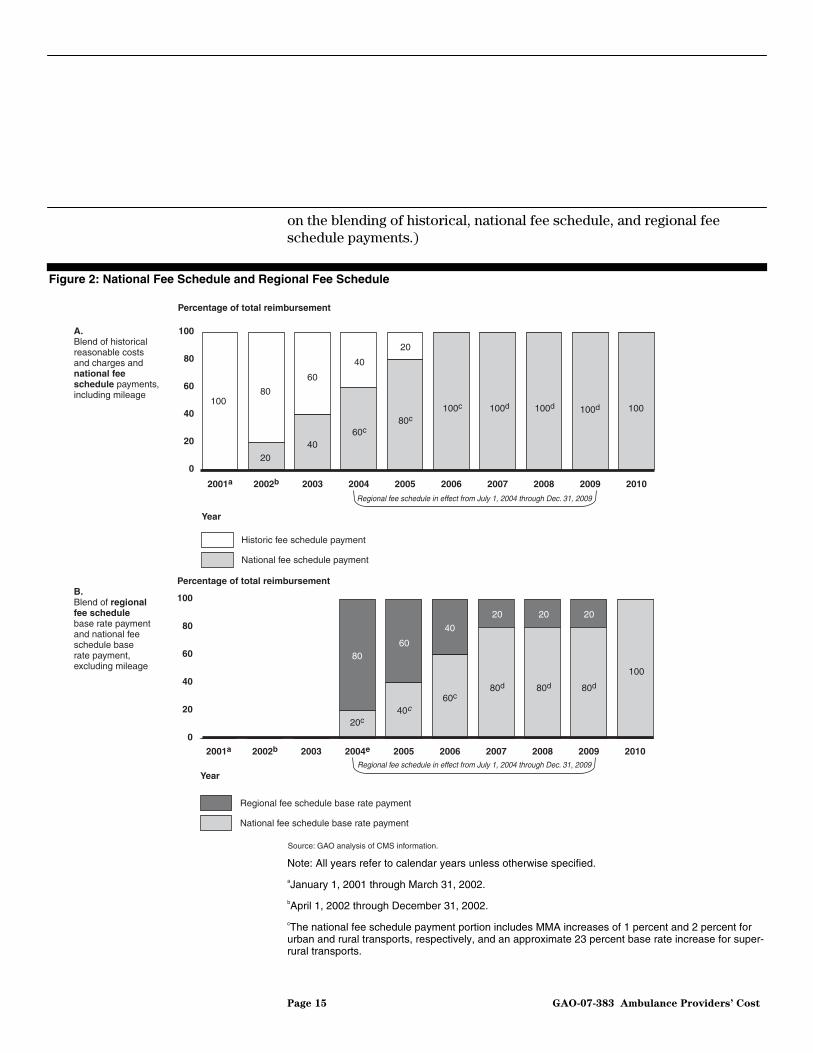
A 2003 GAO study found that transport costs are likely to be higher in less densely populated rural areas because rural providers furnish fewer transports and because fewer transports were linked to higher costs per transport.34 As a result, we recommended that CMS adjust payments for transports in rural counties with particularly low population density to help ensure Medicare beneficiaries’ access to ambulance services in those areas. Subsequently, the MMA increased payments for super-rural transports from July 1, 2004, through December 31, 2009. The report also found that the majority of ambulance providers’ costs were related to readiness—the availability of ambulance and crew for immediate emergency response—and were fixed costs. Fixed costs, such as staff on call, vehicles, building space, and administration, generally do not increase as the number of transports increases. Fuel costs and supplies are not fixed costs because they increase with the number of transports.
Costs of ground ambulance transports were highly variable across providers without shared costs; an average ambulance transport ranged from a low of $99 to a high of $1,218 during 2004, the year for which we gathered data. The variability of costs per transport reflected differences in certain characteristics—volume and mix of transports; service areas (urban, rural, and super-rural); productivity, which we defined as transports per staffed hour; and amount of local tax support.35 As expected, low volume, a greater percentage of ALS and more complex transports, and more transports from super-rural areas were key characteristics that helped explain why some providers without shared costs had higher costs per transport. Two other provider characteristics—productivity and amount of local tax support—were also associated with higher costs per transport for providers without shared costs. Other provider and local area characteristics—such as type of provider, region, building rent, and price of fuel—did not significantly affect average costs per transport among providers without shared costs.
Costs per Transport Were Highly Variable, Reflecting Differences in Certain Provider Characteristics
34GAO, Ambulance Services: Medicare Payments Can Be Better Targeted to Trips in Less
Densely Populated Rural Areas, GAO-03-986 (Washington, D.C.: Sept. 19, 2003).
35Transports per staffed hour is the total number of transports divided by the total number of hours that an ambulance and crew were staffed and available to respond to an emergency call.
Page 17 GAO-07-383 Ambulance Providers’ Cost

Providers’ average costs for a ground ambulance transport varied from $99 to $1,218—a range of more than $1,100—across providers without shared costs in 2004. Figure 3 shows the wide variation in the reported costs per transport among providers without shared costs. Five percent of providers without shared costs had average costs per transport that were less than $152, while 5 percent of providers had average costs per transport more than $913. From our sample of providers without shared costs, we estimated the average cost per transport at $415, with a 95 percent confidence interval—the range within which we expect the population average cost per transport to fall 95 percent of the time—of $381 to $450.36 This means that the actual average cost per transport across ambulance providers in the United States without shared costs was from $381 to $450 in 2004.
Providers’ Reported Costs per Transport Were Highly Variable
Figure 3: Distribution of Cost per Transport for Providers without Shared Costs in 2004
Providers
0
100
200
300
400
500
600
700
800
900
1,000
Source: 2005 GAO Survey of Ambulance Services.
415
Cost per transport in 20048007006005004003002001000 1,2001,1001,000900
Note: Based on a sample of 215 providers, weighted to represent more than 5,200 providers in the United States that did not share costs with nonambulance services.
36Because our cost information is estimated from a sample of providers, all costs per transport are reported with confidence intervals. The range of the confidence interval is affected by the variability of the responses within the sample and the size of the sample. See app. I for a full discussion of our sample, methods, and computations.
Page 18 GAO-07-383 Ambulance Providers’ Cost

When we categorized providers without shared costs by service area and compared the average costs per transport across the groups, average cost per transport among super-rural providers was statistically significantly different from that of urban providers, but rural providers’ average cost per transport was not statistically significantly different from that of urban providers. The average cost per transport for super-rural providers without shared costs was $538,37 statistically significantly different from the $370 average cost per transport for urban providers without shared costs. The 95 percent confidence interval for average costs per transport among super-rural providers without shared costs ranged from $448 to $628 and among urban providers without shared costs ranged from $326 to $414. The average cost per transport among rural providers without shared costs was $409 within a confidence interval spanning $354 to $465, an interval that overlapped with the average costs per transport estimates for both urban and super-rural providers without shared costs.
Certain Provider Characteristics Contributed to Differences in Costs per Transport
The variability of costs per transport among providers without shared costs reflected differences in certain provider characteristics. The provider characteristics that contributed to significant differences in costs per transport were volume, mix of transports, service area, productivity, and amount of local tax support.38 (See table 2 and app. I for a full description of our methods.)
37The average cost per transport of super-rural providers without shared costs was based on the average costs of survey respondents without shared costs that served predominantly super-rural areas, and reflects the different characteristics of those respondents, including the volume of trips they provided. It is different from the estimated average cost of a super-rural transport based on our regression analysis.
38For each characteristic, we measured its effect on providers’ average cost per transport, independent of other characteristics, by assuming the national average value for the other variables.
Page 19 GAO-07-383 Ambulance Providers’ Cost

Table 2: Estimated Average Cost per Transport for Provider Characteristics That Affect Costs
Provider characteristics Assigned values Estimated average cost
per transporta
Volume of transports 2,000 or less $464
2,001 – 3,000 388
3,001 – 4,000 327
4,001 – 5,000 330
5,001 – 6,000 276
6,001 or more 330
Mix of transports Only BLS 360
ALS or more intensive services 476
Service area Urban only 358
Rural only 420b
Super-rural only 545
1 transport per 8 hours (0.12) 437Productivity—transports per staffed hour 5 transports per 8 hours (0.64) 386
Local tax support No tax support 392
Local tax support as 81% of revenues
632
Sources: GAO analysis of 2005 GAO Survey of Ambulance Services and 2004 Medicare claims.
aThe estimated average cost per transport is for providers without shared costs. It was created by assigning a value to the provider characteristic of interest for all cases and using the national average value for the other characteristics. See app. I. for detailed information about our methods.
bThe estimated cost of a rural transport was not significantly different from the estimated cost of an urban transport.
Providers without shared costs that had lower transport volumes generally had higher average costs than providers without shared costs with higher transport volumes. Our analysis affirms the finding of our prior work, that volume of transports was the main characteristic affecting providers’ costs per transport.39 Because most ambulance costs are fixed, and therefore do not increase significantly when a provider completes more transports, it is expected that as the number of transports provided increases, associated costs per transport will be lower. In 2004, the volume of transports completed by a provider without shared costs ranged from 21 to more than 50,000. Estimated average cost per transport is reduced, from $464
39GAO-03-986.
Page 20 GAO-07-383 Ambulance Providers’ Cost
for providers without shared costs completing 2,000 or fewer transports a year to $327 for those completing from 3,001 to 4,000 transports. Although estimated average cost per transport is slightly higher for 4,001 to 5,000 transports, rising to $330, and again above 6,000 transports, rising to $330, every other volume category of provider without shared costs had lower estimated average costs per transport than the lowest volume group of 2,000 transports or less.
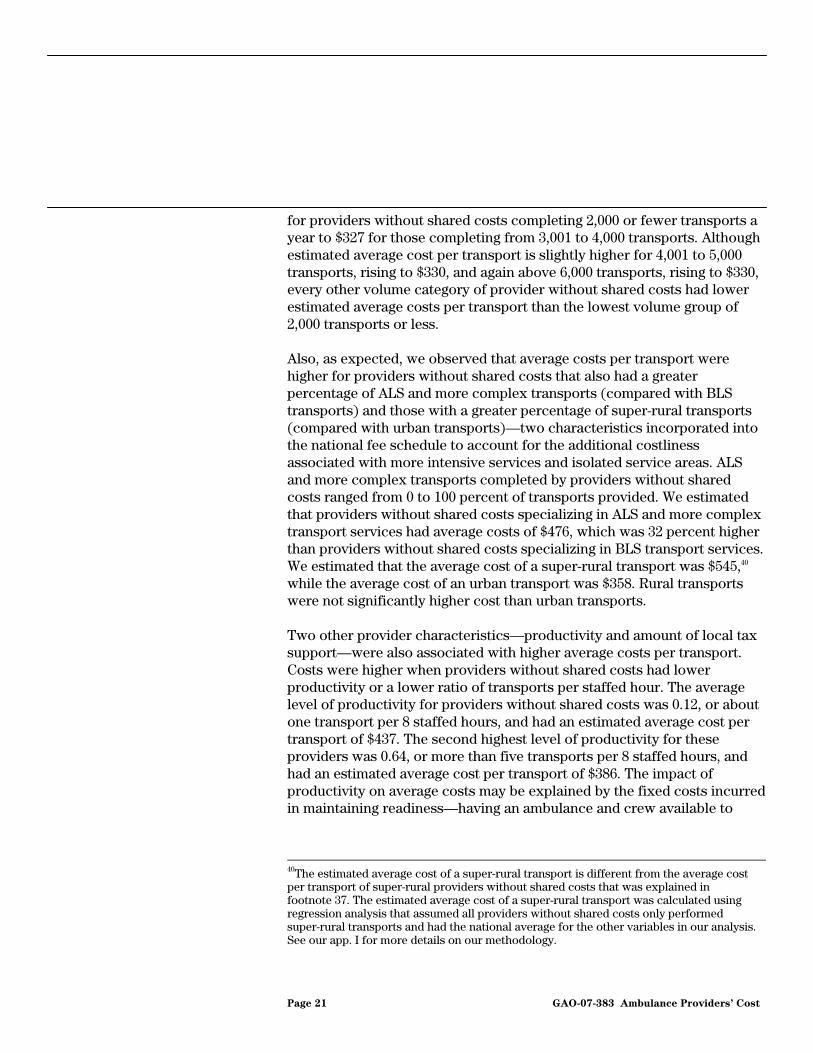
Also, as expected, we observed that average costs per transport were higher for providers without shared costs that also had a greater percentage of ALS and more complex transports (compared with BLS transports) and those with a greater percentage of super-rural transports (compared with urban transports)—two characteristics incorporated into the national fee schedule to account for the additional costliness associated with more intensive services and isolated service areas. ALS and more complex transports completed by providers without shared costs ranged from 0 to 100 percent of transports provided. We estimated that providers without shared costs specializing in ALS and more complex transport services had average costs of $476, which was 32 percent higher than providers without shared costs specializing in BLS transport services. We estimated that the average cost of a super-rural transport was $545,40 while the average cost of an urban transport was $358. Rural transports were not significantly higher cost than urban transports.
Two other provider characteristics—productivity and amount of local tax support—were also associated with higher average costs per transport. Costs were higher when providers without shared costs had lower productivity or a lower ratio of transports per staffed hour. The average level of productivity for providers without shared costs was 0.12, or about one transport per 8 staffed hours, and had an estimated average cost per transport of $437. The second highest level of productivity for these providers was 0.64, or more than five transports per 8 staffed hours, and had an estimated average cost per transport of $386. The impact of productivity on average costs may be explained by the fixed costs incurred in maintaining readiness—having an ambulance and crew available to
40The estimated average cost of a super-rural transport is different from the average cost per transport of super-rural providers without shared costs that was explained in footnote 37. The estimated average cost of a super-rural transport was calculated using regression analysis that assumed all providers without shared costs only performed super-rural transports and had the national average for the other variables in our analysis. See our app. I for more details on our methodology.
Page 21 GAO-07-383 Ambulance Providers’ Cost
respond to emergency calls. Although providers may have discretion about staffing and the ability to make backup arrangements to substitute for additional staff, not all providers can increase productivity by increasing the number of transports they provide or reducing the number of staffed ambulance hours. For example, providers that operate in small or isolated communities with one ambulance on call may serve only their own community’s needs and may not be able to expand their service area or increase their volume of ambulance transports.
Average costs were also higher for providers without shared costs that derived a larger percentage of their total revenues from local tax support. Among providers without shared costs, those with the largest percentage of revenues from local tax support (81 percent of revenues) had estimated average costs that were $240, or 61 percent, above those with no local tax support. Again, this effect was independent of volume and mix of transports, service area, cost of labor, use of volunteers, productivity, and other provider and local area characteristics. The relationship between greater local tax support and higher average costs may be explained as the income effect: if an organization has more money, it is able to and likely to spend more. Moreover, if costs increase without resulting in additional transports, the average cost per transport will increase.
Characteristics that did not significantly contribute to the variability of average costs per transport among providers without shared costs included type of provider; a provider’s region, as measured by the nine census divisions that defined the regional fee schedule; building rent; and the price of fuel.
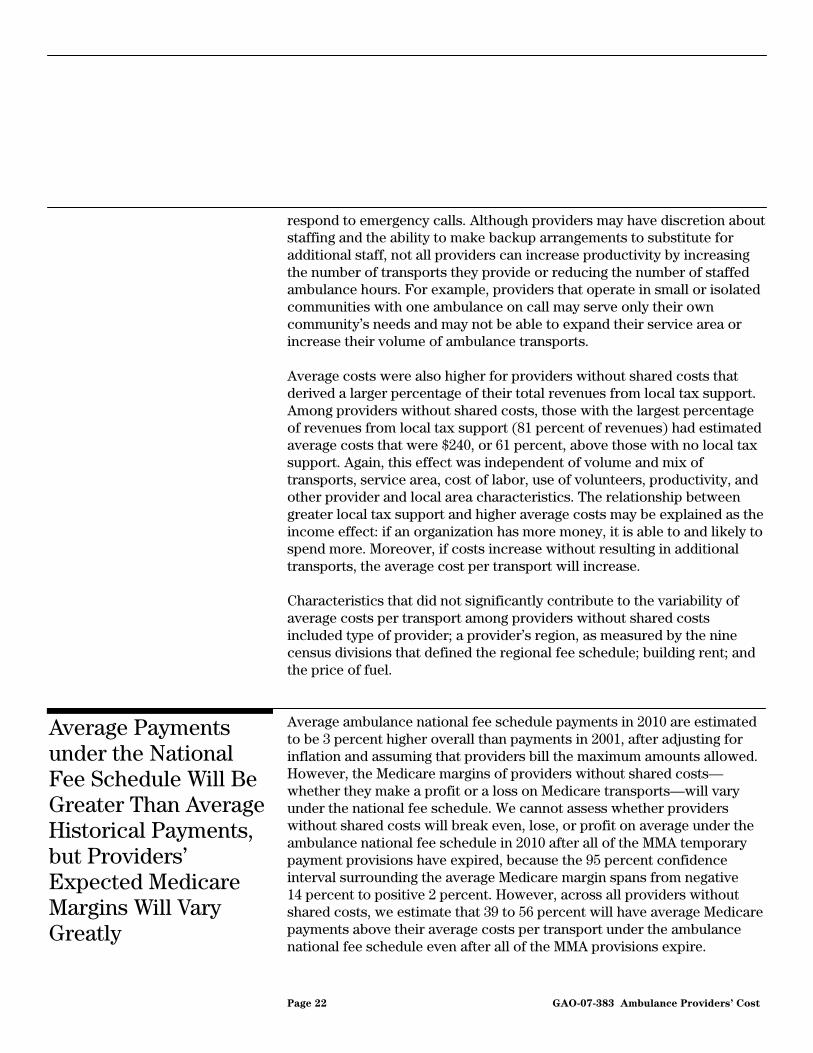
Average ambulance national fee schedule payments in 2010 are estimated to be 3 percent higher overall than payments in 2001, after adjusting for inflation and assuming that providers bill the maximum amounts allowed. However, the Medicare margins of providers without shared costs—whether they make a profit or a loss on Medicare transports—will vary under the national fee schedule. We cannot assess whether providers without shared costs will break even, lose, or profit on average under the ambulance national fee schedule in 2010 after all of the MMA temporary payment provisions have expired, because the 95 percent confidence interval surrounding the average Medicare margin spans from negative 14 percent to positive 2 percent. However, across all providers without shared costs, we estimate that 39 to 56 percent will have average Medicare payments above their average costs per transport under the ambulance national fee schedule even after all of the MMA provisions expire.
Average Payments under the National Fee Schedule Will Be Greater Than Average Historical Payments, but Providers’ Expected Medicare Margins Will Vary Greatly
Page 22 GAO-07-383 Ambulance Providers’ Cost
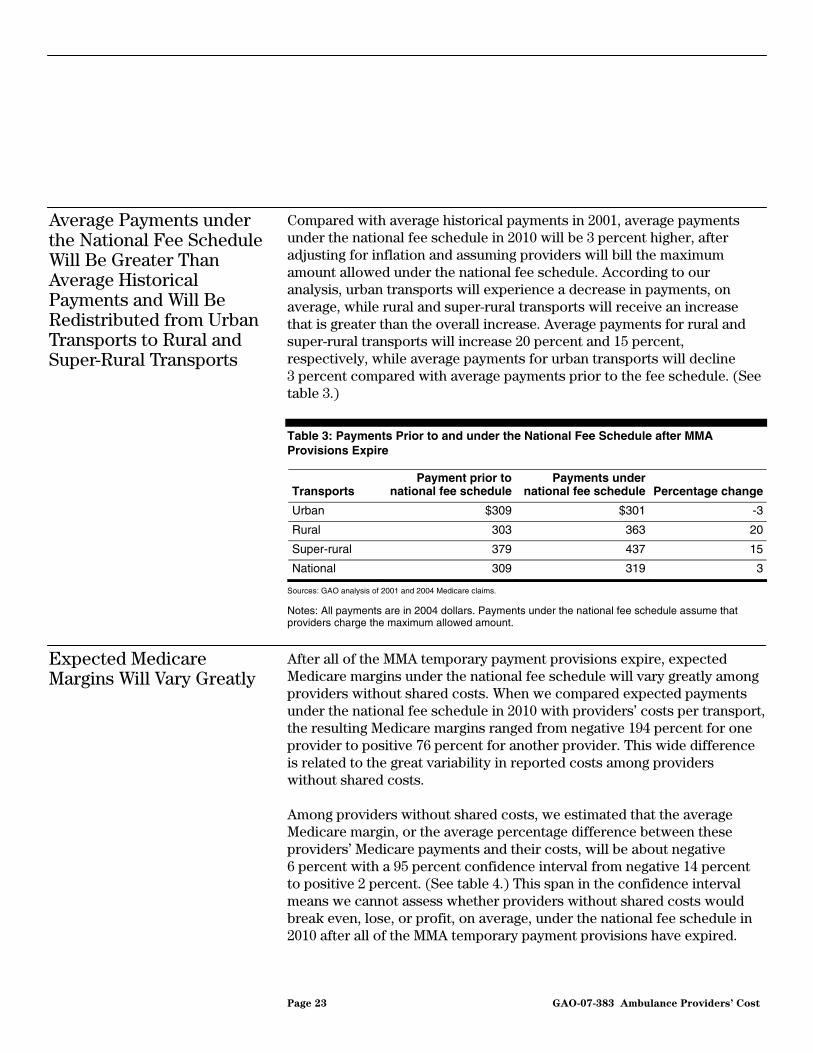
Compared with average historical payments in 2001, average payments under the national fee schedule in 2010 will be 3 percent higher, after adjusting for inflation and assuming providers will bill the maximum amount allowed under the national fee schedule. According to our analysis, urban transports will experience a decrease in payments, on average, while rural and super-rural transports will receive an increase that is greater than the overall increase. Average payments for rural and super-rural transports will increase 20 percent and 15 percent, respectively, while average payments for urban transports will decline 3 percent compared with average payments prior to the fee schedule. (See table 3.)
Table 3: Payments Prior to and under the National Fee Schedule after MMA Provisions Expire
Transports Payment prior to
national fee schedulePayments under
national fee schedule Percentage change
Urban $309 $301 -3
Rural 303 363 20
Super-rural 379 437 15
National 309 319 3
Sources: GAO analysis of 2001 and 2004 Medicare claims.
Notes: All payments are in 2004 dollars. Payments under the national fee schedule assume that providers charge the maximum allowed amount.
After all of the MMA temporary payment provisions expire, expected Medicare margins under the national fee schedule will vary greatly among providers without shared costs. When we compared expected payments under the national fee schedule in 2010 with providers’ costs per transport, the resulting Medicare margins ranged from negative 194 percent for one provider to positive 76 percent for another provider. This wide difference is related to the great variability in reported costs among providers without shared costs.
Average Payments under the National Fee Schedule Will Be Greater Than Average Historical Payments and Will Be Redistributed from Urban Transports to Rural and Super-Rural Transports
Expected Medicare Margins Will Vary Greatly
Among providers without shared costs, we estimated that the average Medicare margin, or the average percentage difference between these providers’ Medicare payments and their costs, will be about negative 6 percent with a 95 percent confidence interval from negative 14 percent to positive 2 percent. (See table 4.) This span in the confidence interval means we cannot assess whether providers without shared costs would break even, lose, or profit, on average, under the national fee schedule in 2010 after all of the MMA temporary payment provisions have expired.
Page 23 GAO-07-383 Ambulance Providers’ Cost
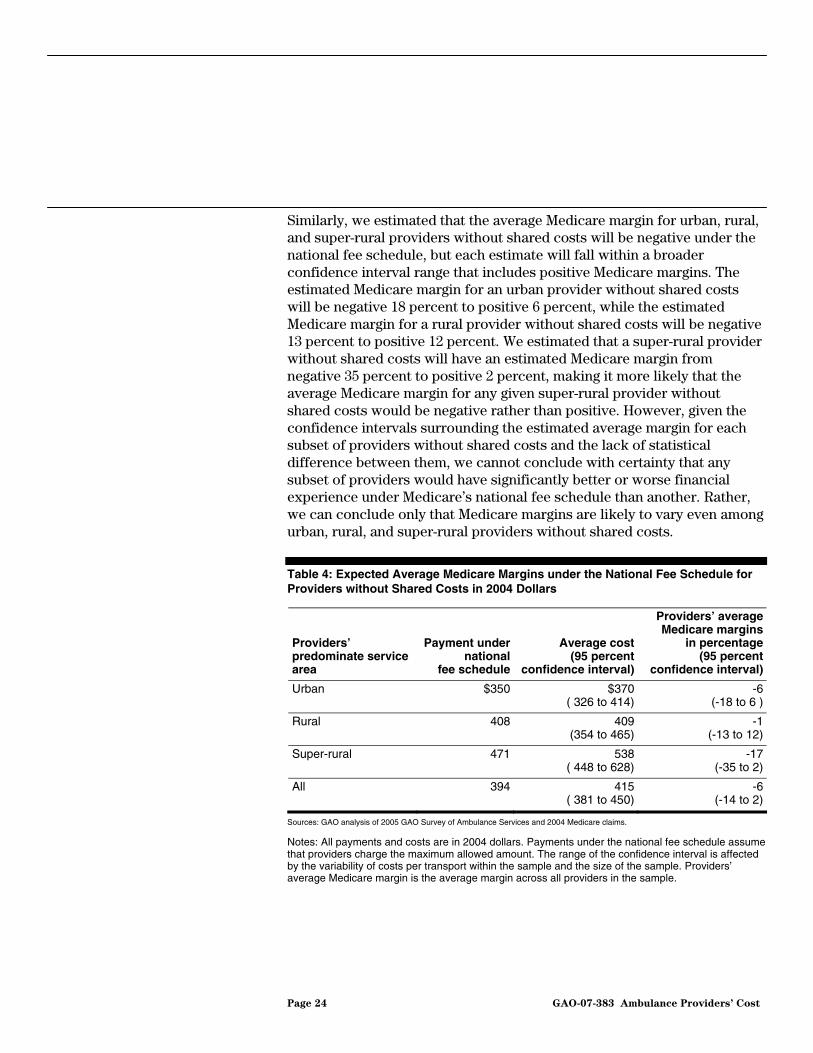
Similarly, we estimated that the average Medicare margin for urban, rural, and super-rural providers without shared costs will be negative under the national fee schedule, but each estimate will fall within a broader confidence interval range that includes positive Medicare margins. The estimated Medicare margin for an urban provider without shared costs will be negative 18 percent to positive 6 percent, while the estimated Medicare margin for a rural provider without shared costs will be negative 13 percent to positive 12 percent. We estimated that a super-rural provider without shared costs will have an estimated Medicare margin from negative 35 percent to positive 2 percent, making it more likely that the average Medicare margin for any given super-rural provider without shared costs would be negative rather than positive. However, given the confidence intervals surrounding the estimated average margin for each subset of providers without shared costs and the lack of statistical difference between them, we cannot conclude with certainty that any subset of providers would have significantly better or worse financial experience under Medicare’s national fee schedule than another. Rather, we can conclude only that Medicare margins are likely to vary even among urban, rural, and super-rural providers without shared costs.
Table 4: Expected Average Medicare Margins under the National Fee Schedule for Providers without Shared Costs in 2004 Dollars
Providers’ predominate service area
Payment under national
fee schedule
Average cost (95 percent
confidence interval)
Providers’ average Medicare margins
in percentage (95 percent
confidence interval)
Urban $350 $370 ( 326 to 414)
-6(-18 to 6 )
Rural 408 409 (354 to 465)
-1(-13 to 12)
Super-rural 471 538 ( 448 to 628)
-17(-35 to 2)
All 394 415 ( 381 to 450)
-6(-14 to 2)
Sources: GAO analysis of 2005 GAO Survey of Ambulance Services and 2004 Medicare claims.
Notes: All payments and costs are in 2004 dollars. Payments under the national fee schedule assume that providers charge the maximum allowed amount. The range of the confidence interval is affected by the variability of costs per transport within the sample and the size of the sample. Providers’ average Medicare margin is the average margin across all providers in the sample.
Page 24 GAO-07-383 Ambulance Providers’ Cost

When we assessed the likely experiences of all providers without shared costs under the national fee schedule after all of the MMA temporary payment provisions expire, we estimated that 39 to 56 percent of them will have positive Medicare margins. Among urban and rural providers, 39 to 65 percent and 34 to 64 percent, respectively, will have positive Medicare margins, according to our estimations. Among super-rural providers, however, we estimate that 18 to 51 percent will have positive Medicare margins, while 49 to 82 percent would have zero or negative Medicare margins. (See fig. 4.) The breadth of these confidence intervals reflects the variability of providers’ costs in 2004 and expected financial experience under the national fee schedule after MMA temporary payment provisions expire.
Page 25 GAO-07-383 Ambulance Providers’ Cost
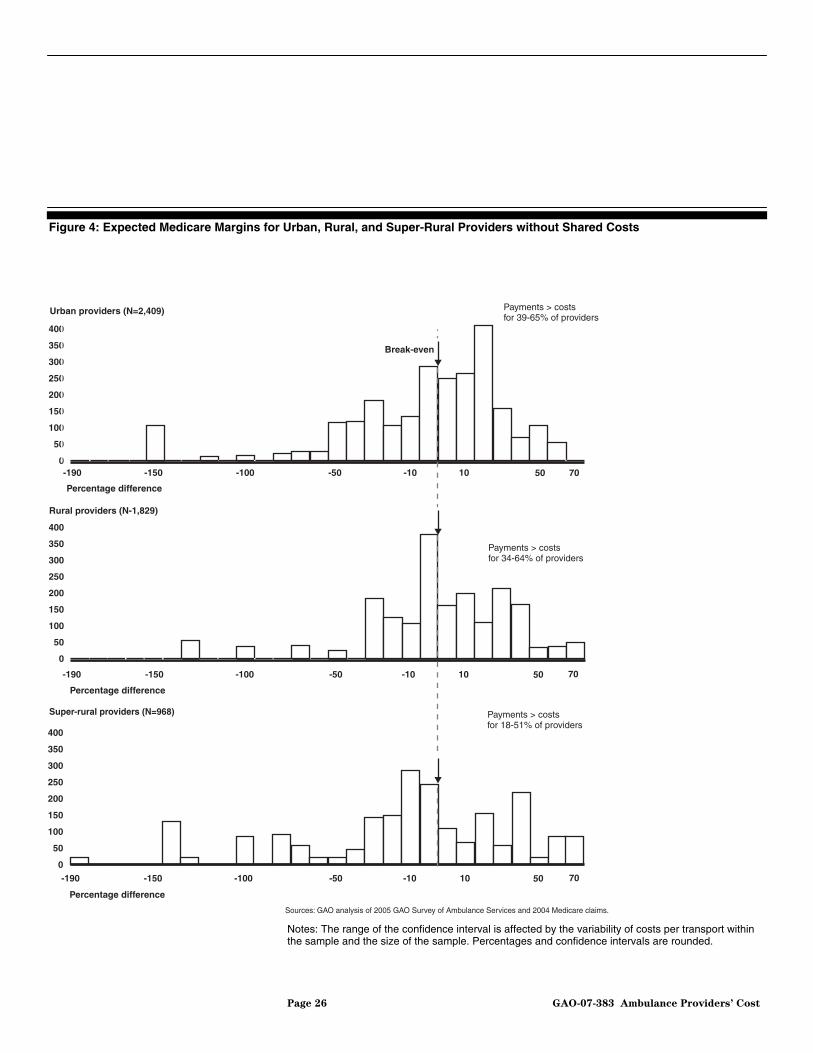
Figure 4: Expected Medicare Margins for Urban, Rural, and Super-Rural Providers without Shared Costs
Super-rural providers (N=968)
Sources: GAO analysis of 2005 GAO Survey of Ambulance Services and 2004 Medicare claims.
Percentage difference
0
50
100
150
200
250
300
350
400
Rural providers (N-1,829)
Percentage difference
Payments > costsfor 34-64% of providers
Urban providers (N=2,409)
Percentage difference
0
50
100
150
200
250
300
350
400
0
50
100
150
200
250
300
350
400
Payments > costsfor 39-65% of providers
705010-10-50-100-150-190
Payments > costsfor 18-51% of providers
Break-even
705010-10-50-100-150-190
705010-10-50-100-150-190
Notes: The range of the confidence interval is affected by the variability of costs per transport within the sample and the size of the sample. Percentages and confidence intervals are rounded.
Page 26 GAO-07-383 Ambulance Providers’ Cost
The MMA temporary payment provisions, which were implemented by CMS in the second half of 2004, resulted in raised ambulance average payments overall, particularly for super-rural transports, which we found typically more costly to provide. Payment adjustments under the MMA’s regional fee schedule were not justified on the basis of regional cost differences, as we did not find significant differences in average cost per transport across regions.
When we compared ambulance payments in the first half of 2004, prior to the implementation of the MMA provisions, with ambulance payments in the second half of 2004, after the temporary payment provisions were implemented and had their maximum effect, we found that payments, on average, increased by 5 percent overall. Super-rural transports received more substantial payment increases than urban or rural transports. (See table 5.) After MMA temporary payment provisions were implemented, average payments for urban and rural transports increased by 5 and 3 percent, respectively, while average payments for super-rural transports rose by 12 percent, compared with average payments before the MMA provisions were implemented. Increased payments for super-rural transports under the MMA were in keeping with our finding that super-rural transports were more costly than urban transports, independent of other characteristics that affected ambulance costs.
MMA Provisions Resulted in Greater Average Payments for Higher-Cost Super-Rural Transports and Adjusted Payments Regionally Where No Significant Cost Differences Were Observed
Payment Increases Were Targeted to Higher-Cost Super-Rural Transports
Page 27 GAO-07-383 Ambulance Providers’ Cost
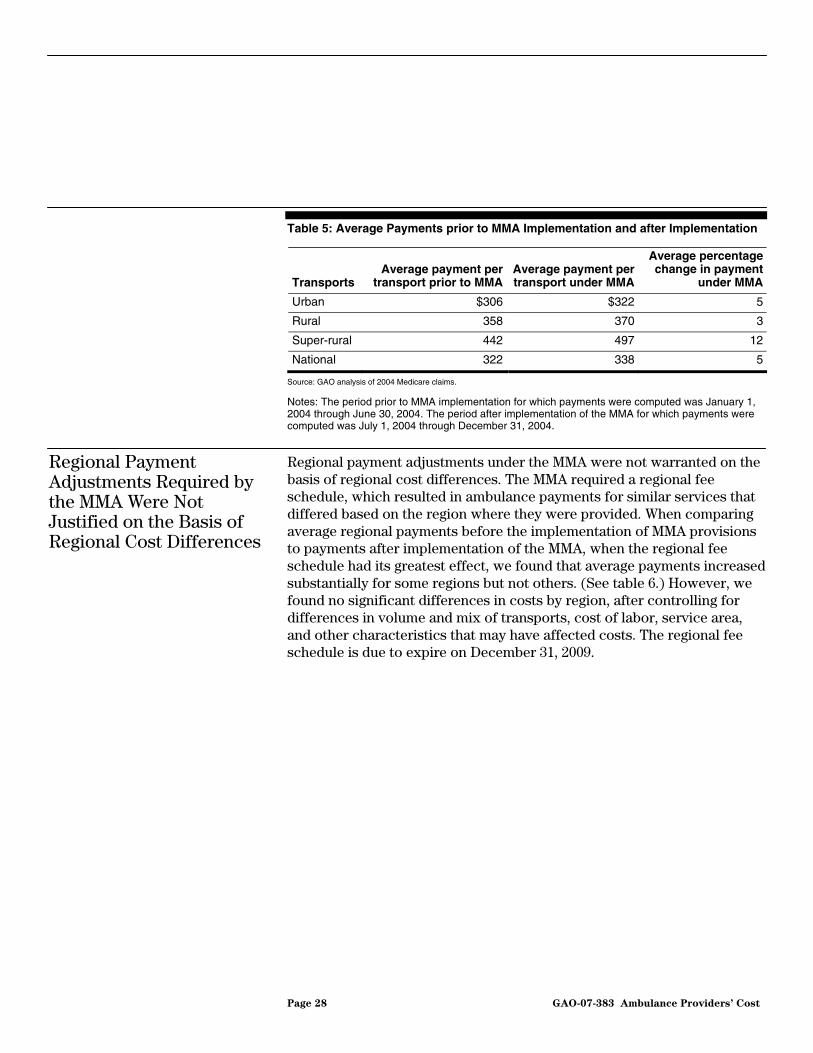
Table 5: Average Payments prior to MMA Implementation and after Implementation
Transports Average payment per
transport prior to MMAAverage payment per transport under MMA
Average percentage change in payment
under MMA
Urban $306 $322 5
Rural 358 370 3
Super-rural 442 497 12
National 322 338 5
Source: GAO analysis of 2004 Medicare claims.
Notes: The period prior to MMA implementation for which payments were computed was January 1, 2004 through June 30, 2004. The period after implementation of the MMA for which payments were computed was July 1, 2004 through December 31, 2004.
Regional Payment Adjustments Required by the MMA Were Not Justified on the Basis of Regional Cost Differences
Regional payment adjustments under the MMA were not warranted on the basis of regional cost differences. The MMA required a regional fee schedule, which resulted in ambulance payments for similar services that differed based on the region where they were provided. When comparing average regional payments before the implementation of MMA provisions to payments after implementation of the MMA, when the regional fee schedule had its greatest effect, we found that average payments increased substantially for some regions but not others. (See table 6.) However, we found no significant differences in costs by region, after controlling for differences in volume and mix of transports, cost of labor, service area, and other characteristics that may have affected costs. The regional fee schedule is due to expire on December 31, 2009.
Page 28 GAO-07-383 Ambulance Providers’ Cost

Table 6: Percentage Changes in Average Payments prior to MMA Implementation and after Implementation, by Region
Region Percentage change in average payments
Pacific 19
New England 12
Mountain 8
West South Central 7
West North Central 3
Middle Atlantic 3
South Atlantic 1
East North Central 1
East South Central 0
Source: GAO analysis of 2004 Medicare claims.
Notes: East South Central received a decrease in average payments of -0.04 percent, which rounds to 0 percent. The period prior to MMA implementation for which payments were computed was January 1, 2004 through June 30, 2004. The period after implementation of the MMA for which payments were computed was July 1, 2004 through December 31, 2004. See table 11 in app. I for a listing of the regions, or census divisions, and their corresponding states.
Nationally, the use of ambulance transports by Medicare beneficiaries increased by 16 percent, from 2001, the year before the transition to the national fee schedule began, to 2004, the year we studied. (See table 7.) Medicare beneficiaries’ use of ambulance transports in urban areas experienced the greatest growth, 19 percent, while rural areas experienced a modest increase of 6 percent. However, Medicare transports per 1,000 beneficiaries in super-rural areas decreased by 8 percent. The decrease in Medicare beneficiaries’ use of ambulance transports in super-rural areas was driven mostly by a decline in the volume of transports rather than any significant change in the number of beneficiaries or the demographic characteristics of beneficiaries residing in super-rural areas. For example, factors such as age, race, and gender remained stable in the super-rural Medicare population. Meanwhile, Medicare beneficiaries’ use of ambulance transports increased in all regions from 2001 to 2004, including one region that had a decrease in average payments under the MMA compared with before the implementation of MMA payment provisions.
Medicare Beneficiaries’ Use of Ambulance Transports Increased from 2001 to 2004, Except in Super-Rural Areas
Page 29 GAO-07-383 Ambulance Providers’ Cost

Table 7: Ambulance Transports per 1,000 Beneficiaries in Urban, Rural, and Super-Rural Areas
Area Transports, 2001 Transports, 2004 Percentage change,
2001-2004
Urban 371 443 19
Rural 372 396 6
Super-rural 264 244 -8
Total 364 420 16
Sources: GAO analysis of 2001 and 2004 Medicare claims and CMS enrollment data.
The diversity of the ambulance industry is reflected in its range of organizations, services offered, staffing, revenue sources, and costs per transport. We found that certain ambulance provider characteristics, such as volume, mix of transports, service area, productivity, and amount of local tax support, affected the cost per transport of providers without shared costs. For some providers and communities, these characteristics may be self-determined and may reflect those communities’ preferences for readiness, quality standards, and ambulance services offered. For example, some communities may prefer to fund the greater costs of operating at a higher level of readiness or being equipped with more sophisticated transport vehicles and more highly trained staff. Other providers and communities have little or no control over the characteristics that affect providers’ cost per transport. These communities, particularly more rural areas with low population density, may be constrained by local conditions, including their financial resources. Therefore, local conditions and community preferences may explain some of the predicted variability in the financial experience of providers without shared costs under the Medicare national fee schedule.
Conclusions
We are unable to discern whether providers without shared costs would be compensated appropriately under the national fee schedule for two reasons. First, when providers experience the national fee schedule payments in 2010 after all of the MMA temporary payment provisions expire, they may make changes to control or reduce their costs. The cost data we collected were from 2004 and may not reflect any changes providers may make to control or reduce their costs in response to the national fee schedule. Second, we did not assess if Medicare beneficiaries are receiving quality care that is delivered efficiently. There are no national performance standards to use as benchmarks for determining quality and efficiency of services or for assessing whether providers could increase productivity by increasing the number of transports they provide
Page 30 GAO-07-383 Ambulance Providers’ Cost

or by reducing the number of staffed ambulance hours. However, current efforts to develop a national data system and indicators for EMS systems may, in the future, yield useful tools for measuring efficiency and quality of ambulance services under the Medicare program.
Based on our survey of ambulance costs, we were able to estimate that some providers without shared costs would have positive Medicare margins under the national fee schedule after the MMA provisions expire, while others would have negative Medicare margins. Among super-rural providers, we estimated that 18 to 51 percent would have positive Medicare margins. However, 49 to 82 percent would have zero or negative Medicare margins. Ideally, Medicare payments should be adequate to ensure beneficiary access to services while using the program’s resources judiciously. The decline in use of super-rural ground ambulance transports from 2001 to 2004, a time when payments for super-rural transports were increased, suggests that Medicare payment levels may not be linked to the decreased utilization of transports in super-rural areas. However declining utilization coupled with potentially negative Medicare margins in super-rural areas, which could be exacerbated when the MMA provisions expire, raise questions as to whether Medicare payments will be adequate to support beneficiary access in super-rural areas.
In light of the variability in ambulance providers’ Medicare margins and the potential for negative margins to have an impact on beneficiary access, we recommend that the Administrator of CMS monitor utilization of ambulance transports to ensure that Medicare payments are adequate to provide for beneficiary access to ambulance services, particularly in super-rural areas.
We provided a draft of this report to CMS and to five associations that represent the ambulance industry: the American Ambulance Association, the National Association of State EMS Officials, the National Ambulance Coalition, the National Volunteer Fire Council, and the International Association of Fire Chiefs. CMS’s written comments are reprinted in appendix II.
Recommendation for Executive Action
Agency and External Comments and Our Evaluation
CMS stated that, for the most part, the report reinforces its findings. CMS also stated that it agreed with our recommendation that the agency monitor utilization of ambulance transports to ensure that Medicare payments are adequate to provide for beneficiary access to ambulance services, particularly in super-rural areas. CMS noted that it would
Page 31 GAO-07-383 Ambulance Providers’ Cost
continue to monitor ambulance rates and would make adjustments should the original assumptions made during the development of the ambulance fee schedule need to be changed. In addition, CMS also highlighted its implementation of a refinement in the definition of rural areas that should enable rural areas within urban areas to receive the benefit of higher rural payments under the ambulance fee schedule.
CMS noted that we should have discussed in our conclusions the implications of omitting “shared services” providers from our analysis, as these providers tend to have higher costs. As we discussed in the report, ambulance providers that could not separately report the costs of the ambulance portion of their business were excluded because their cost data were determined to be unreliable. Consequently, we have no basis or information to suggest that providers with shared services have higher or lower costs than other providers.
Ambulance industry associations generally agreed with our findings. However, the associations raised various concerns regarding our calculations and assumptions. Two associations questioned the inclusion in our analysis of ambulance providers that used unpaid staff and suggested that it might have been more appropriate to focus on providers who bear the full cost of providing ambulance services. As we note in the report, use of unpaid staff by ambulance providers is widespread with an estimated two-fifths of the industry relying substantially on volunteers in 2004. Thus, in order for our analysis to be representative of ambulance providers, we included those that used volunteer staff. We recognize that use of volunteer staff affects ambulance providers’ costs and included the percentage of volunteer hours as a control variable in our cost model.
Two associations were concerned that we did not allow for the effect of Medicare bad debt in our analysis and may have therefore overestimated payments. We acknowledge that bad debt will affect the percentage of costs recoverable for providing ambulance services. However, we explicitly state that our payment estimates assume providers are paid the full Medicare payment amounts. It was beyond the scope of our study to estimate the effect of Medicare bad debt on ambulance payments or to determine the extent to which payments should be adjusted to reflect bad debt.
Two associations expressed concern that our analysis showed a 3 percent increase in payments to ambulance providers with the transition from the historical payment system to the fully implemented national fee schedule and thought payments should have been relatively level. We note that our
Page 32 GAO-07-383 Ambulance Providers’ Cost

analysis incorporated increases in mileage rates over time that likely accounted for some of this increase. In addition, when simulating payments under the national fee schedule, we assumed that providers would bill Medicare for all services they were entitled to bill. However, as we noted in the report, nearly half of the industry indicated that a state or local government approves the fees they may charge, and some providers are required to bill Medicare less than the allowed amount and therefore do not receive the maximum Medicare payment allowed under the fee schedule. This discrepancy between the state or local allowed amount and the actual Medicare payment could also account for some of the 3 percent increase.
CMS and the associations also provided technical comments and clarifications, which we incorporated as appropriate.
We are sending copies of this report to other interested congressional
committees and the Administrator of CMS. We will also provide copies to others upon request. The report will also be available at no charge on the GAO Web site at http://www.gao.gov.
If you or your staff have any questions, please contact me at (202) 512-7119 or [email protected]. Contact points for our Offices of Congressional Relations and Public Affairs may be found on the last page of this report. GAO staff who made major contributions to this report are listed in appendix III.
Kathleen M. King Director, Health Care
Page 33 GAO-07-383 Ambulance Providers’ Cost
Appendix I: Dat
a and Methods
Page 34 GAO-07-383 Ambulance Providers’ Cost
Appendix I: Data and Methods
This appendix describes, in detail, the data and methods we used to respond to our research objectives and evaluate ambulance providers’ costs per transport and Medicare payments under the national ambulance fee schedule. We conducted a survey of ambulance costs to collect cost data. We relied on these survey data for much of our analyses of costs and supplemented our survey results with information from other sources, including Medicare claims data, as appropriate. We also analyzed Medicare claims data to determine the effect of the national fee schedule and the Medicare Prescription Drug, Improvement and Modernization Act of 2003 (MMA) temporary payment provisions on payments, as well as to describe changes in beneficiaries’ use of ambulance transports over time. We tested the internal consistency and reliability of the data from our survey and other non-Medicare data sources and determined that all data sources were adequate for our purposes. We conducted our work from July 2004 through April 2007 in accordance with generally accepted government auditing standards.
To collect data on ground ambulance providers’ costs, revenues, transports, and organizational characteristics for their most recently completed fiscal year, we mailed a survey to a nationally representative sample of 500 eligible ambulance service providers that billed Medicare in 2003.1 We used a two-stage sampling process to select a stratified,2 random sample of providers. In the first stage, we selected a preliminary sample of hospital and nonhospital-based providers for screening. In the second stage, we conducted telephone screening interviews to confirm eligibility for the study and, for nonhospital-based providers, to identify provider type. We obtained 321 completed surveys for a response rate of 64 percent. We excluded two cost outliers. We also excluded from our analysis providers that reported sharing ambulance costs with other institutions or other nonambulance services, including, but not limited to, all fire departments, after preliminary analysis revealed problems with the reliability of their reported costs. The resulting sample size was 215 providers. The results from our analysis are nationally representative of all Medicare ambulance providers that can distinguish their costs for providing ambulance services from the costs of other services they
National Survey of Ground Ambulance Providers’ Costs
1Our survey asked providers to report on their organizations’ costs of providing ground ambulance services.
2The sample was stratified by types of ambulance providers: hospital-based, volunteer, fire departments, government, and freestanding.

Appendix I: Data and Methods
provide.3 However, the small sample size and the variability of reported costs reduce the precision of our estimates.
To develop our survey instrument, we reviewed other survey instruments and analyses of ambulance cost data, consulted with experts in survey methods and the ambulance industry, and tested our survey instrument. We reviewed cost data collected in 1999 by Project HOPE Center for Health Affairs, which was a nonprofit health policy research organization, during a survey effort sponsored by the American Ambulance Association. We also reviewed other surveys of emergency medical services, as well as industry and association guidelines about emergency medical and ambulance services. In addition to surveying ambulance providers on their costs and revenues, we included questions to identify organizational and local area characteristics that might affect ambulance costs, such as the number of emergency transports and number of volunteer hours.
Industry experts and a survey specialist reviewed and commented on the draft survey instrument. We conducted a pilot test of the survey with 104 ambulance service providers as well. We redesigned and refined the instrument based on the experience of the pilot test. Then, to further refine the wording of our survey questions, we asked four types of ambulance service organizations and a former volunteer fire chief to pretest the instrument and point out any issues they noted. These pretests were conducted mostly by telephone—one pretest was in person.
We developed separate lists for all hospital-based and nonhospital-based providers from information maintained by the Centers for Medicare & Medicaid Services (CMS), the agency that oversees the Medicare program. Next, we used a two-stage sampling process to select a stratified, random sample of providers. In the first stage, we sorted each list by census division and predominant service area (urban, rural, or super-rural), began sampling the list at a random starting point, and chose providers at regular intervals from their respective lists. This method of sampling implicitly included representation across census divisions and service areas. In the second stage, telephone screening interviews were conducted with each
Survey Instrument Development
Sample Design
3Our cost analysis sample includes only those providers that could apportion the ground ambulance component of any cost shared between their ambulance services and other services. Thus, our results only reflect the experiences of providers that did not share costs or that could feasibly apportion them.
Page 35 GAO-07-383 Ambulance Providers’ Cost

Appendix I: Data and Methods
sampled provider to confirm eligibility for the study and, for nonhospital-based providers, to identify their type—volunteer, fire department, government, or freestanding. Once a provider’s type was established, providers were stratified by type and randomly selected to ensure somewhat equal representation among all provider types. We developed initial sample rates for each type of provider and adjusted the rates midway through the screening process. Each provider representative was told at the close of the telephone screening call whether the provider had been selected to participate in our survey. Finally, a survey instrument was mailed to the selected providers.
To identify nonhospital-based ambulance providers that billed Medicare, we contacted Medicare carriers4 for a list of ambulance providers and matched this list to 2003 carrier claims for ambulance services by provider identification numbers. Our nonhospital-based sample frame included 12,082 unique provider identification numbers.5 We later learned that a number of provider identification numbers in the nonhospital-based sample frame were duplicate entries for ambulance providers that had more than one Medicare provider identification number for the same location.6 We analyzed the extent of duplication in the sample frame and reduced the estimated population size to 7,968. Although our sample frame included a substantial number of duplicate entries, there were only 28 duplicates among our first-stage sample of 900 nonhospital-based providers. The sample weights were adjusted to account for the duplicate entries in the sample frame.
To identify the total number of hospital-based ambulance providers that billed Medicare, we matched Medicare’s Provider of Service file with Medicare Part A inpatient and outpatient claims for ambulance services. We excluded skilled nursing facilities for a total of 828 hospital-based ambulance service providers. We then selected a first-stage sample of 150 hospital-based ambulance providers.
4Carriers are private companies that have contracts with Medicare to administer payment of providers’ bills for covered Medicare Part B services.
5We excluded provider identification numbers that had been selected to participate in the pilot study.
6Duplicate entries for the same nonhospital provider were identified by name, address, and other information.
Page 36 GAO-07-383 Ambulance Providers’ Cost
Appendix I: Data and Methods
To make our survey sample representative of all Medicare ambulance providers, the population from which the sample was drawn, we computed a sample weight for each respondent provider. The computation of the sample weight took into account the type of provider, sample rate, and the response rate for the type of provider—hospital, volunteer, fire department, government, or freestanding.
Survey Administration We contracted with CODA Inc., an independent survey research firm, to
perform the telephone screening and administer the mailed survey instrument.7 The contractor screened the 900 nonhospital-based and 150 hospital-based providers we selected for our first-stage sample, and mailed the survey instrument to 500 eligible organizations, randomly sampled by provider type. In order to properly select our sample with even representation across all types of providers nationally, we designed our sampling strata using data collected from our pilot test.
CODA Inc., administered the mailed surveys and conducted all follow-up and data coding in coordination with us. Our survey period began in April 2005 and ran through September 2005. The survey instruments were mailed using Federal Express and 2-day Priority Mail. Telephone contact was initiated 3 business days after the instrument was mailed to ascertain when the respondent could return the completed instrument. Prompting and follow-up requests for data were conducted by phone and occurred whenever providers’ returned instruments were incomplete, vague, or included conflicting responses to key items. In some cases, follow-up requests involved multiple contacts, faxing survey instruments, and spending an hour or more on the phone with the respondent. On average, more than 4 phone calls were made for each respondent with as many as 20 calls made to one respondent.
All requests for data were conducted by CODA Inc. staff following strict protocols that we developed. Respondents were encouraged to contact CODA Inc. and GAO via toll-free numbers, so that any questions or problems could be resolved. All survey data were double-key entered into an electronic file, and computer programs were checked for keying
7CODA Inc. also administered the 1999 ambulance survey for Project HOPE and our pilot survey. During the course of the contract, CODA Inc. became Survey and Epidemiology Services Division of Social & Scientific Systems, Inc.
Page 37 GAO-07-383 Ambulance Providers’ Cost
Appendix I: Data and Methods
discrepancies and data inconsistencies. In all, we received 321 completed surveys; this represents a response rate of 64 percent.
Survey Data Validity and Reliability
In addition to the survey administration procedures described above, we took several measures to ensure that the data reported on the survey were valid and reliable.8 First, the survey instrument included items intended to validate the reported cost data. We also used strict protocols during follow-up to validate the reported cost data. For example, if respondents could not provide cost breakdowns by the categories listed in our survey instrument, a separate phone protocol was used to verify the reported cost data.
Second, we tested the data for internal consistency and excluded cases when necessary. Computer analyses were performed to identify and, where possible, correct any inconsistencies in responses or other errors. We also excluded 2 providers that appeared to be cost outliers. These providers had costs per transport that were at least three standard deviations above the mean of the standard statistical distribution (the lognormal), and no other variables explained their extraordinary costs. Through our analyses, we determined that the costs reported by providers that shared costs with other institutions or offered other services appeared to be unreliable. We found the costs reported by these “shared costs” providers to be highly variable, which may reflect inconsistent methods for separating staff time and other resources across different services. Therefore, we excluded these providers—including but not limited to all fire departments—from our analysis. The resulting sample size was 215 providers, representing a population of more than 5,200 providers without shared costs.9
8For a randomly selected subsample of 30 providers—6 of each type of ambulance provider—we requested providers’ financial records to match to their survey responses. We were only able to validate costs, revenues, and transport volumes for 2 providers in the subsample because providers either did not return supporting documentation or the categories—particularly those for costs—on providers’ supporting documentation were different from those on the survey. As a result, we concluded that this method for validating survey data was not viable because of differences in data reporting, particularly cost categories, on providers’ supporting documents.
9We could not determine a separate response rate for our subgroup of providers without shared costs because we could not identify which nonrespondents in our original sample were providers without shared costs. However, we have no reason to believe that the response rate for providers without shared costs would be different from the overall survey response rate.
Page 38 GAO-07-383 Ambulance Providers’ Cost
Appendix I: Data and Methods
Third, we compared information reported on the survey to information on Medicare claims submitted by respondents, such as the number of Medicare transports and percentage of emergency Medicare transports. All computer syntax was peer reviewed and verified by separate programmers to ensure that the syntax was written and executed correctly.
We used providers’ total costs and total transports reported on the survey to compute providers’ average costs per transport. This cost information and other information about revenues and provider characteristics were used to model ambulance costs per transport. Although these survey data were self-reported and had not been audited, based on efforts to validate the data, computer testing, and corrections and comparisons with Medicare data, we have concluded that they were sufficiently valid and reliable for our purposes.
Interpretation of Confidence Intervals and Analysis of Nonrespondents
All sample surveys are subject to sampling error—that is, the extent to which the survey results differ from what would have been obtained if we had collected responses from every ambulance provider in the country. Because we used a sample, it is only one of a large number of samples that we might have drawn. As each sample could have provided different estimates, we express our confidence in the precision of our particular sample’s results as a 95 percent confidence interval.10 This is the interval that would contain the actual value for all providers for 95 percent of the samples we could have drawn. As a result, we are 95 percent confident that the reported confidence intervals based on the mailed survey include the true values for all providers. For this reason, all costs per transport and provider margins are reported with their confidence intervals.
We also analyzed 2004 Medicare claims data for survey nonrespondents and compared this information with similar claims information for providers without shared costs in our sample. Nonrespondents served predominantly urban areas rather than rural or super-rural areas. On average, nonrespondents completed about half the number of Medicare transports in 2004 compared with providers without shared costs. Nonrespondents also had a higher percentage of basic life support (BLS) transports, as opposed to advanced life support (ALS) and more complex
10The range of the confidence interval is affected by the variability of the responses within the sample and the size of the sample.
Page 39 GAO-07-383 Ambulance Providers’ Cost

Appendix I: Data and Methods
transports, and about the same percentage of nonemergency transports compared with providers without shared costs.
It is unclear whether nonrespondents had higher or lower costs, on average, than providers without shared costs. In our regression analysis of the cost information for providers without shared costs, we found that those with fewer transports per year generally had higher costs per transport than those with more transports. Providers without shared costs that served predominately urban areas had lower costs compared with providers serving super-rural areas. We also found that providers with higher percentages of BLS transports had lower costs compared to providers with no BLS transports. Although nonrespondents’ characteristics differed from those of providers without shared costs, these differences were associated with both higher and lower costs among providers without shared costs. Therefore, we have no basis for concluding that nonresponse has biased our cost estimates in any particular direction.
We analyzed the relationship between providers’ average costs of ambulance transports and the provider and local area characteristics that may have affected their average costs. We used regression analysis to examine the effect of these characteristics on providers’ costs per transport. We then used the results from this regression analysis to predict the average costs per transport across all providers without shared costs, based on five key provider characteristics: (1) total transports per year, (2) percentage of BLS Medicare transports, (3) percentage of Medicare transports in rural and super-rural areas, (4) number of ambulance transports per staffed hour, and (5) amount of revenue derived from local tax support.
Modeling Ambulance Costs per Transport
To perform these analyses, we identified measures and data sources for each of the provider and local area characteristics that we identified as potentially contributing to differences in costs per transport. A summary of these characteristics, measures we used to assess their potential relationship to costs per transport, and data sources used is presented in table 8.
Page 40 GAO-07-383 Ambulance Providers’ Cost
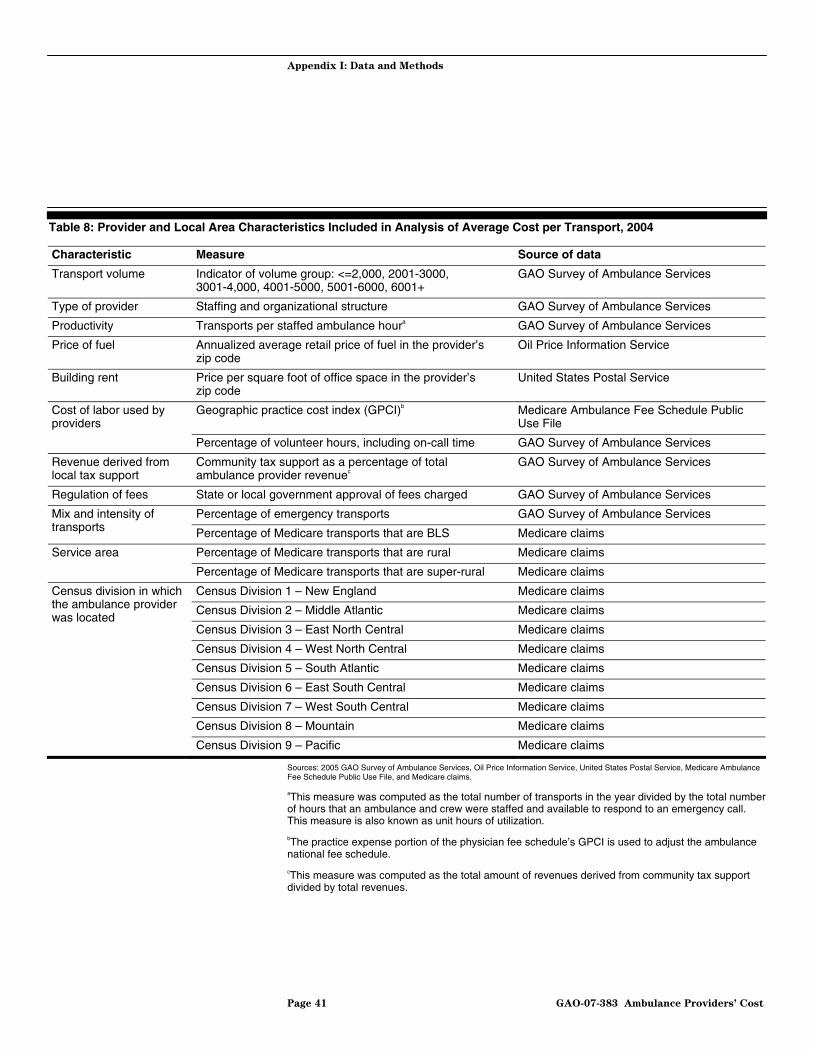
Appendix I: Data and Methods
Table 8: Provider and Local Area Characteristics Included in Analysis of Average Cost per Transport, 2004
Characteristic Measure Source of data
Transport volume Indicator of volume group: <=2,000, 2001-3000, 3001-4,000, 4001-5000, 5001-6000, 6001+
GAO Survey of Ambulance Services
Type of provider Staffing and organizational structure GAO Survey of Ambulance Services
Productivity Transports per staffed ambulance houra GAO Survey of Ambulance Services
Price of fuel Annualized average retail price of fuel in the provider’s zip code
Oil Price Information Service
Building rent Price per square foot of office space in the provider’s zip code
United States Postal Service
Geographic practice cost index (GPCI)b Medicare Ambulance Fee Schedule Public Use File
Cost of labor used by providers
Percentage of volunteer hours, including on-call time GAO Survey of Ambulance Services
Revenue derived from local tax support
Community tax support as a percentage of total ambulance provider revenuec
GAO Survey of Ambulance Services
Regulation of fees State or local government approval of fees charged GAO Survey of Ambulance Services
Percentage of emergency transports GAO Survey of Ambulance Services Mix and intensity of transports Percentage of Medicare transports that are BLS Medicare claims
Service area Percentage of Medicare transports that are rural Medicare claims
Percentage of Medicare transports that are super-rural Medicare claims
Census Division 1 – New England Medicare claims
Census Division 2 – Middle Atlantic Medicare claims
Census division in which the ambulance provider was located
Census Division 3 – East North Central Medicare claims
Census Division 4 – West North Central Medicare claims
Census Division 5 – South Atlantic Medicare claims
Census Division 6 – East South Central Medicare claims
Census Division 7 – West South Central Medicare claims
Census Division 8 – Mountain Medicare claims
Census Division 9 – Pacific Medicare claims
Sources: 2005 GAO Survey of Ambulance Services, Oil Price Information Service, United States Postal Service, Medicare Ambulance Fee Schedule Public Use File, and Medicare claims.
aThis measure was computed as the total number of transports in the year divided by the total number of hours that an ambulance and crew were staffed and available to respond to an emergency call. This measure is also known as unit hours of utilization.
bThe practice expense portion of the physician fee schedule’s GPCI is used to adjust the ambulance national fee schedule.
cThis measure was computed as the total amount of revenues derived from community tax support divided by total revenues.
Page 41 GAO-07-383 Ambulance Providers’ Cost

Appendix I: Data and Methods
Our regression analysis modeled the average cost of a transport at the provider level as a function of the provider and local area characteristics described above. We modeled the lognormal distribution of average cost per transport for a provider, which was calculated as the log of total costs divided by the total number of transports for that provider. We estimated the model using least squares11 and applied the appropriate sample weights. We used the statistical program SUDAAN® in SAS to estimate this model, which takes account of the sample stratification and weighting to obtain appropriate parameter estimates and standard errors. We tested for and found no specification problems in the model resulting from heteroscedasticity, misspecification, or evidence of a particular observation having undue influence.
Average Cost Regression Analysis—Methods and Results
Tables 9 and 10 show the regression results for estimating the determinants of cost per transport. We ran two sets of average cost regressions. The first regression results, in table 9, do not include two provider characteristics, (1) transports per staffed ambulance hour and (2) community tax support as a percentage of total ambulance provider revenue, because data on these variables were not available for a number of providers in our sample. Including these variables as explanatory independent variables reduces the number of observations in the regression from 205 to 157. Nevertheless, we wanted to measure the impact of these policy variables, in addition to maintaining a larger sample size, in order to have a more precise estimate of the impact of the other explanatory variables. Therefore, we ran the same regression model with and without these two explanatory variables.
11Least squares is a common method of regression analysis.
Page 42 GAO-07-383 Ambulance Providers’ Cost

Appendix I: Data and Methods
Table 9: Results for Average Cost of an Ambulance Transport Regression—Estimated Effects of Selected Provider and Local Area Characteristics on the Average Cost of Ambulance Transports for Providers, Not Including Impact of Productivity and Community Tax Support
Characteristic Variable used to measure characteristic Parameter
estimate t-value
Transport volumea 2,001-3,000 per year -0.18 -1.70*
3,001-4,000 per year -0.35 -2.98***
4,001-5,000 per year -0.34 -3.33***
5,001-6,000 per year -0.52 -2.71***
6,001+ per year -0.34 -2.86***
Cost of labor used by providers GPCI 1.34 2.27**
Percentage of volunteer hours, including on-call time -0.28 -2.73***
Regulation of fees State or local government approval of fees charged -0.08 -1.00
Mix and intensity of transports Percentage of emergency transports 0.17 0.99
Percentage of Medicare transports that are BLS -0.28 -2.39**
Service areab Percentage of Medicare transports that are rural 0.16 1.61
Percentage of Medicare transports that are super-rural 0.42 3.11***
Census Division 1 – New England -0.27 -1.66*
Census Division 2 – Middle Atlantic -0.24 -1.66*
Census division in which the ambulance provider was locatedc
Census Division 3 – East North Central 0.23 1.61
Census Division 5 – South Atlantic 0.07 0.41
Census Division 6 – East South Central -0.07 -0.43
Census Division 7 – West South Central -0.16 -0.85
Census Division 8 – Mountain 0.15 0.97
Census Division 9 – Pacific -0.27 -1.39
Intercept 4.83 8.73***
R-squared 0.33
Observations 205
Sources: GAO analysis of 2005 GAO Survey of Ambulance Services, Medicare Ambulance Fee Schedule Public Use File, and Medicare claims.
*** significant at the 1 percent level.
** significant at the 5 percent level.
* significant at the 10 percent level.
aTransports less than or equal to 2,000 per year is the excluded category. In order for the regression model’s parameters to be estimated, we needed to exclude one of the transport volume categories.
bThe percentage of Medicare transports that are urban was the excluded category. In order for the regression model’s parameters to be estimated, we needed to exclude one of the service area categories.
cThe West North Central census division was the excluded category. In order for the regression model’s parameters to be estimated, we needed to exclude one of the census divisions.
Page 43 GAO-07-383 Ambulance Providers’ Cost
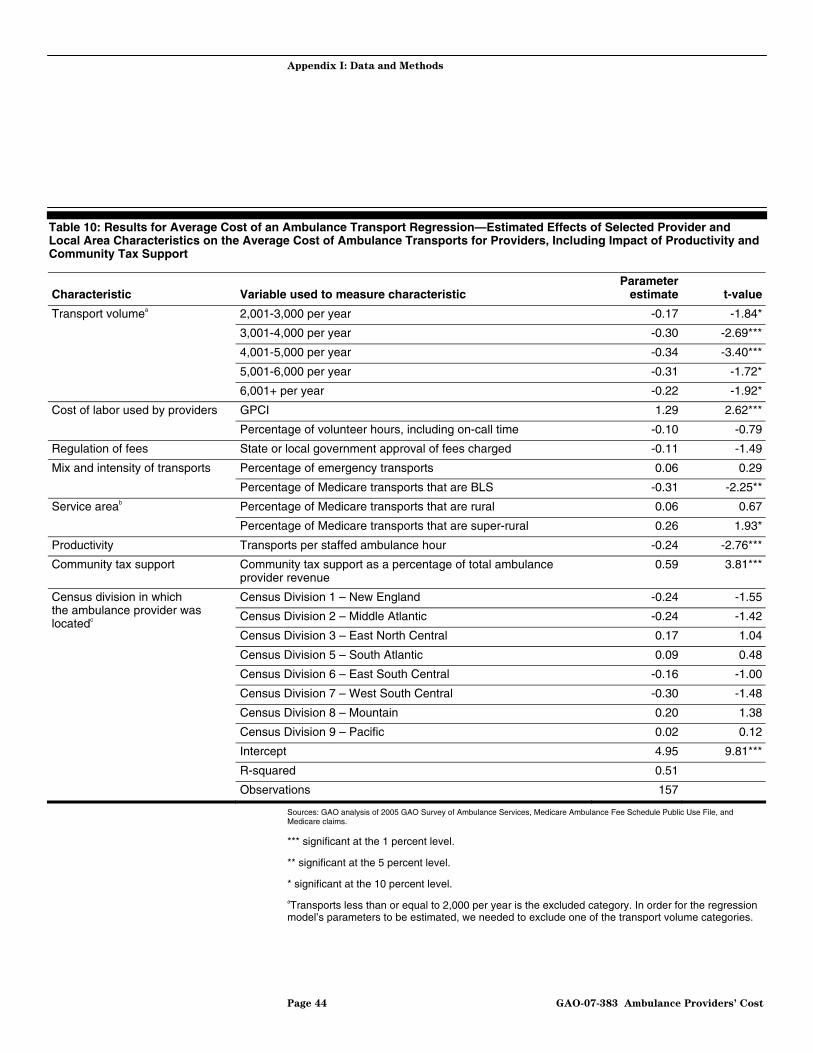
Appendix I: Data and Methods
Table 10: Results for Average Cost of an Ambulance Transport Regression—Estimated Effects of Selected Provider and Local Area Characteristics on the Average Cost of Ambulance Transports for Providers, Including Impact of Productivity and Community Tax Support
Characteristic Variable used to measure characteristic Parameter
estimate t-value
Transport volumea 2,001-3,000 per year -0.17 -1.84*
3,001-4,000 per year -0.30 -2.69***
4,001-5,000 per year -0.34 -3.40***
5,001-6,000 per year -0.31 -1.72*
6,001+ per year -0.22 -1.92*
Cost of labor used by providers GPCI 1.29 2.62***
Percentage of volunteer hours, including on-call time -0.10 -0.79
Regulation of fees State or local government approval of fees charged -0.11 -1.49
Mix and intensity of transports Percentage of emergency transports 0.06 0.29
Percentage of Medicare transports that are BLS -0.31 -2.25**
Service areab Percentage of Medicare transports that are rural 0.06 0.67
Percentage of Medicare transports that are super-rural 0.26 1.93*
Productivity Transports per staffed ambulance hour -0.24 -2.76***
Community tax support Community tax support as a percentage of total ambulance provider revenue
0.59 3.81***
Census Division 1 – New England -0.24 -1.55
Census Division 2 – Middle Atlantic -0.24 -1.42
Census division in which the ambulance provider was locatedc
Census Division 3 – East North Central 0.17 1.04
Census Division 5 – South Atlantic 0.09 0.48
Census Division 6 – East South Central -0.16 -1.00
Census Division 7 – West South Central -0.30 -1.48
Census Division 8 – Mountain 0.20 1.38
Census Division 9 – Pacific 0.02 0.12
Intercept 4.95 9.81***
R-squared 0.51
Observations 157
Sources: GAO analysis of 2005 GAO Survey of Ambulance Services, Medicare Ambulance Fee Schedule Public Use File, and Medicare claims.
*** significant at the 1 percent level.
** significant at the 5 percent level.
* significant at the 10 percent level.
aTransports less than or equal to 2,000 per year is the excluded category. In order for the regression model’s parameters to be estimated, we needed to exclude one of the transport volume categories.
Page 44 GAO-07-383 Ambulance Providers’ Cost

Appendix I: Data and Methods
bThe percentage of Medicare transports that are urban was the excluded category. In order for the regression model’s parameters to be estimated, we needed to exclude one of the service area categories.
cThe West North Central census division was the excluded category. In order for the regression model’s parameters to be estimated, we needed to exclude one of the census divisions.
We estimated the average cost per transport associated with a range of values for each of five provider characteristics by using our regression result parameter estimates and fixed values for five provider characteristics. For each of the five provider characteristics, we assumed that all providers in the sample had the same value for one provider characteristic and used the national average value for all other characteristics. The five provider characteristics of interest were (1) total transports per year, (2) percentage of BLS Medicare transports, (3) percentage of Medicare transports in rural and super-rural areas, (4) number of transports per staffed ambulance hour, and (5) amount of revenue derived from local tax support. We estimated the cost per transport associated with two or more values for each of five provider characteristics. Our estimates are presented in table 2 of this report.
In order to create the estimated costs per transport for one value of a provider characteristic, we performed the following steps. First, we modified the data set we used in the regression model by assigning one fixed value for one provider characteristic, such as the percentage of super-rural Medicare transports, for all observations in the data set. For this characteristic, we fixed the percentage of Medicare super-rural transports to 100 percent and the percentage of Medicare rural transports to 0 percent for all observations in the data set.12 Second, we used our regression result parameter estimates for all the other characteristics in the regression model and calculated an estimated average cost per transport for each provider. Third, we computed the mean of these estimated costs per transport. We report this hypothetical value as the estimated average cost per transport associated with the fixed value of the provider characteristic of interest. In the example above, we computed our estimated average cost per transport of a super-rural Medicare
12The percentage of super-rural and rural Medicare transports were two separate variables in our model and the percentage of urban Medicare transports was our reference category. To assume that 100 percent of a provider’s Medicare transports were rural, we set the percentage of rural Medicare transports to 100 percent and the percentage of super-rural Medicare transports to 0 percent. To assume that 100 percent of a provider’s Medicare transports were urban, we set the percentage of super-rural Medicare transports to 0 percent and the percentage of rural Medicare transports to 0 percent.
Page 45 GAO-07-383 Ambulance Providers’ Cost
Appendix I: Data and Methods
transport assuming that every provider in the sample provided only super-rural Medicare transports and their other characteristics—volume and mix of transports, productivity, and amount of local tax support—were the national average.
To assess the effect of the ambulance national fee schedule on Medicare payments, we used Medicare claims data to compute average payments in 2001, before the implementation of the fee schedule, and in 2004, 2 years after the phase-in of the national fee schedule had begun. For all analyses of Medicare payments, we expressed payments in 2004 dollars. We also used Medicare claims data and payment formulas as specified in federal regulations to simulate average payments under the national fee schedule in 2010, after all the MMA provisions are due to expire on December 31, 2009, but computed these payments in 2004 dollars, the year that best reflects the cost data collected in our survey. We used the simulated payments to compute providers’ Medicare margins, a comparison that assumes that providers’ cost structures under the fee schedule would be the same as they were in 2004.13 We also assessed the effect of the MMA temporary payment provisions on payments in 2004 using Medicare claims data by examining the change in payments from the first half of the year, before the MMA changes were implemented, with the second half of the year, when MMA payment provisions had their maximum effect.
Estimating Average Medicare Ambulance Payments and Use of Transports with Claims Data
To estimate average Medicare ambulance payments in 2001 and 2004, we used Medicare Part A and Part B claims data from Medicare’s National Claims History files. We constructed summary data sets with the number of ambulance transports, miles, and their Medicare payments, total14 and by level of service,15 at the zip code level for 2001 and 2004 to compare payments over time. These data sets were classified by three geographic levels: national; census divisions; and urban, rural, and super-rural areas.
13The Medicare margin reflects the percentage difference between the average Medicare payment and a provider’s cost per transport. It was computed as the difference between the average Medicare payment and the cost per transport, divided by the payment.
14Total ambulance payments in 2001 and 2004 included any payments made for supplies in addition to mileage payments and service-level payments.
15Under the Medicare program, there are seven levels of ambulance transports. BLS and ALS transports each constitute two levels, emergency and nonemergency. The remaining levels of service are ALS Level 2 and specialty care transport (both of which involve invasive or specialized care) and paramedic ALS intercept (when a paramedic provides ALS services but does not transport the patient).
Page 46 GAO-07-383 Ambulance Providers’ Cost
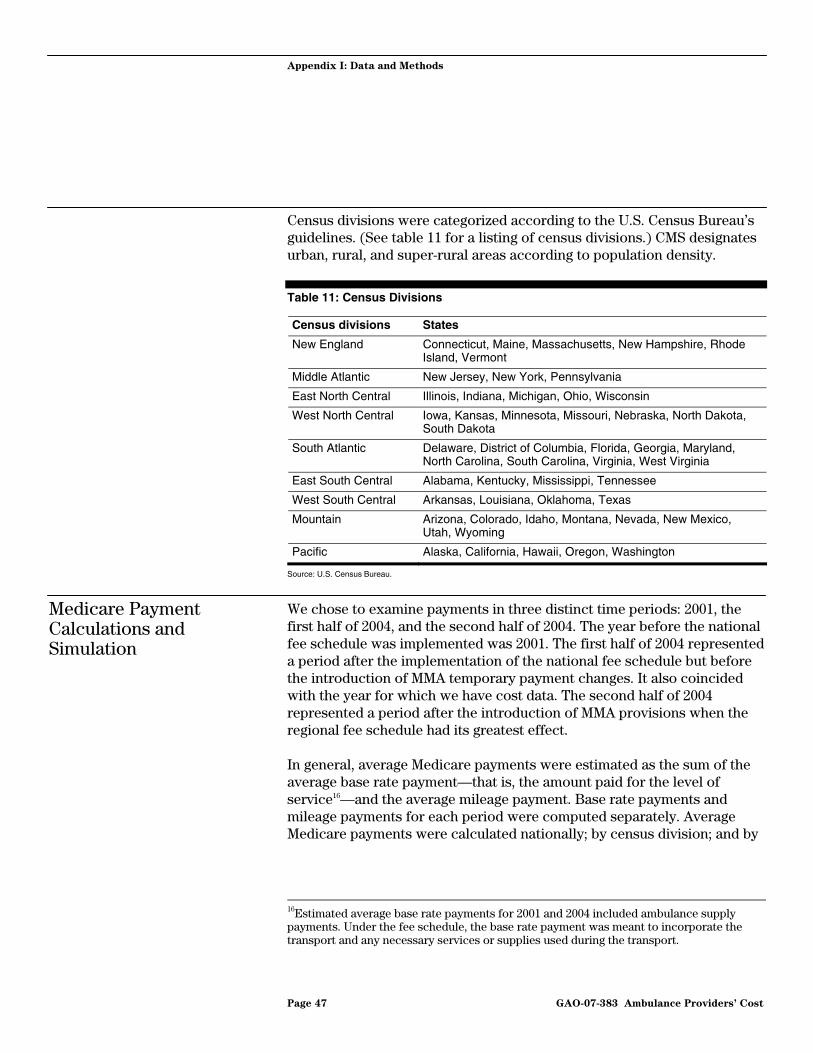
Appendix I: Data and Methods
Census divisions were categorized according to the U.S. Census Bureau’s guidelines. (See table 11 for a listing of census divisions.) CMS designates urban, rural, and super-rural areas according to population density.
Table 11: Census Divisions
Census divisions States
New England Connecticut, Maine, Massachusetts, New Hampshire, Rhode Island, Vermont
Middle Atlantic New Jersey, New York, Pennsylvania
East North Central Illinois, Indiana, Michigan, Ohio, Wisconsin
West North Central Iowa, Kansas, Minnesota, Missouri, Nebraska, North Dakota, South Dakota
South Atlantic Delaware, District of Columbia, Florida, Georgia, Maryland, North Carolina, South Carolina, Virginia, West Virginia
East South Central Alabama, Kentucky, Mississippi, Tennessee
West South Central Arkansas, Louisiana, Oklahoma, Texas
Mountain Arizona, Colorado, Idaho, Montana, Nevada, New Mexico, Utah, Wyoming
Pacific Alaska, California, Hawaii, Oregon, Washington
Source: U.S. Census Bureau.
Medicare Payment Calculations and Simulation
We chose to examine payments in three distinct time periods: 2001, the first half of 2004, and the second half of 2004. The year before the national fee schedule was implemented was 2001. The first half of 2004 represented a period after the implementation of the national fee schedule but before the introduction of MMA temporary payment changes. It also coincided with the year for which we have cost data. The second half of 2004 represented a period after the introduction of MMA provisions when the regional fee schedule had its greatest effect.
In general, average Medicare payments were estimated as the sum of the average base rate payment—that is, the amount paid for the level of service16—and the average mileage payment. Base rate payments and mileage payments for each period were computed separately. Average Medicare payments were calculated nationally; by census division; and by
16Estimated average base rate payments for 2001 and 2004 included ambulance supply payments. Under the fee schedule, the base rate payment was meant to incorporate the transport and any necessary services or supplies used during the transport.
Page 47 GAO-07-383 Ambulance Providers’ Cost

Appendix I: Data and Methods
urban, rural, and super-rural areas. All payments are expressed in 2004 dollars.
For the first half of 2004, the average base rate payment was calculated by dividing total base rate payments by the total number of transports provided in the first half of 2004. For 2001 and the second half of 2004, the average service-level base payment rate was calculated by dividing total base rate payments for each level of service by the total number of transports provided at each level of service. Then we computed a weighted average base rate payment for 2001 and for the second half of 2004 by applying the percentage of transports for each level of service (also known as the mix of services) for the first half of 2004 to the service-level base payment rates in 2001 and the second half of 2004, respectively. The 2001 payments were adjusted to 2004 dollars by multiplying weighted average base rate payment by the ratio of the 2004 Consumer Price Index for All Urban Consumers (CPI-U) over the 2001 CPI-U.
For simulated 2010 base rate payments, we multiplied the 2004 conversion factor (CF) and applicable relative value unit (RVU) for each level of service to compute the service level payments.17 Then, we computed a weighted average base rate payment by applying the service mix from the first half of 2004 to the 2004 service-level payments. The weighted average base-rate payment was adjusted for regional differences in the cost of providing ambulance services by the GPCI.18 In accordance with CMS’s payment methodology, only 70 percent of the average base rate payment was adjusted by the GPCI.
Average mileage payments were calculated by multiplying the average miles per transport in each geographic level from the first half of 2004 by mileage rates in the other periods. (See tables 12 and 13.) For example, when estimating average 2001 mileage payments for urban transports, the 2001 mileage rate applicable to urban areas was used,19 but the average mile per transport in urban areas for the first half of 2004 was applied. For
17Ambulance RVUs account for the relative resources needed to provide services during an ambulance transport. There is one RVU for each of the seven levels of service.
18In many cases, more than one GPCI would apply to our average base rate payment. For these cases we applied an average GPCI, which was weighted by the total number of transports in each geographic area of interest—national; census division; or urban, rural, or super-rural area.
19The 2001 mileage payments were eventually adjusted to 2004 dollars.
Page 48 GAO-07-383 Ambulance Providers’ Cost
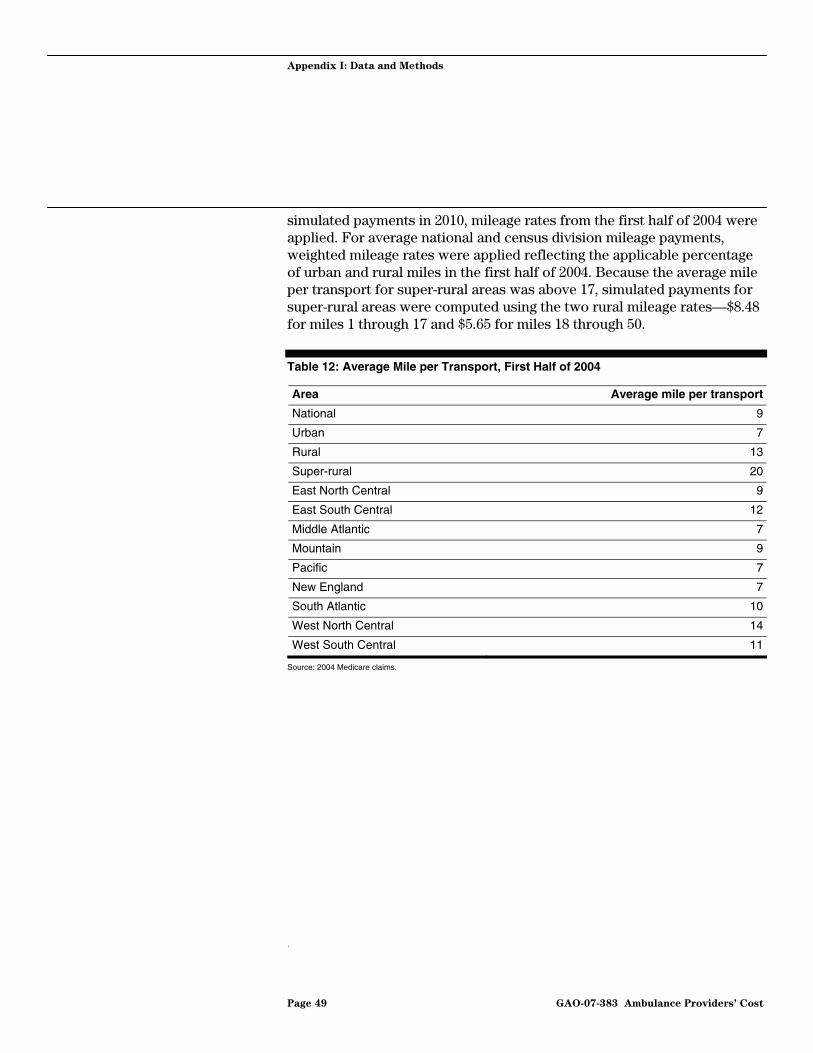
Appendix I: Data and Methods
simulated payments in 2010, mileage rates from the first half of 2004 were applied. For average national and census division mileage payments, weighted mileage rates were applied reflecting the applicable percentage of urban and rural miles in the first half of 2004. Because the average mile per transport for super-rural areas was above 17, simulated payments for super-rural areas were computed using the two rural mileage rates—$8.48 for miles 1 through 17 and $5.65 for miles 18 through 50.
Table 12: Average Mile per Transport, First Half of 2004
Area Average mile per transport
National 9
Urban 7
Rural 13
Super-rural 20
East North Central 9
East South Central 12
Middle Atlantic 7
Mountain 9
Pacific 7
New England 7
South Atlantic 10
West North Central 14
West South Central 11
Source: 2004 Medicare claims.
.
Page 49 GAO-07-383 Ambulance Providers’ Cost
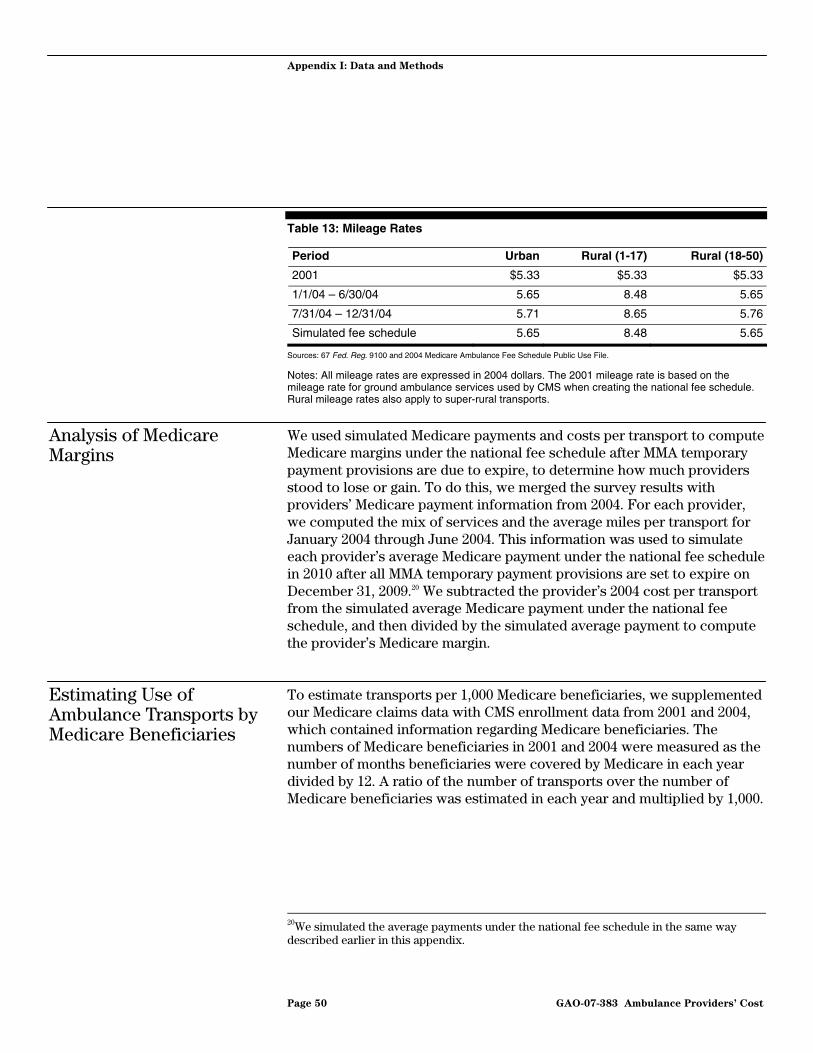
Appendix I: Data and Methods
Table 13: Mileage Rates
Period Urban Rural (1-17) Rural (18-50)
2001 $5.33 $5.33 $5.33
1/1/04 – 6/30/04 5.65 8.48 5.65
7/31/04 – 12/31/04 5.71 8.65 5.76
Simulated fee schedule 5.65 8.48 5.65
Sources: 67 Fed. Reg. 9100 and 2004 Medicare Ambulance Fee Schedule Public Use File.
Notes: All mileage rates are expressed in 2004 dollars. The 2001 mileage rate is based on the mileage rate for ground ambulance services used by CMS when creating the national fee schedule. Rural mileage rates also apply to super-rural transports.
We used simulated Medicare payments and costs per transport to compute Medicare margins under the national fee schedule after MMA temporary payment provisions are due to expire, to determine how much providers stood to lose or gain. To do this, we merged the survey results with providers’ Medicare payment information from 2004. For each provider, we computed the mix of services and the average miles per transport for January 2004 through June 2004. This information was used to simulate each provider’s average Medicare payment under the national fee schedule in 2010 after all MMA temporary payment provisions are set to expire on December 31, 2009.20 We subtracted the provider’s 2004 cost per transport from the simulated average Medicare payment under the national fee schedule, and then divided by the simulated average payment to compute the provider’s Medicare margin.
To estimate transports per 1,000 Medicare beneficiaries, we supplemented our Medicare claims data with CMS enrollment data from 2001 and 2004, which contained information regarding Medicare beneficiaries. The numbers of Medicare beneficiaries in 2001 and 2004 were measured as the number of months beneficiaries were covered by Medicare in each year divided by 12. A ratio of the number of transports over the number of Medicare beneficiaries was estimated in each year and multiplied by 1,000.
Analysis of Medicare Margins
Estimating Use of Ambulance Transports by Medicare Beneficiaries
20We simulated the average payments under the national fee schedule in the same way described earlier in this appendix.
Page 50 GAO-07-383 Ambulance Providers’ Cost

Appendix I: Data and Methods
Medicare claims data, which are used by the Medicare program as a record of payments made to health care providers, are closely monitored by both CMS and Medicare carriers—contractors that process, review, and pay claims for Medicare Part B-covered services, including ambulance services. The data are subject to various internal controls, including checks and edits performed by the carriers before claims are submitted to CMS for payment approval. Although we did not review these internal controls, we found the data to be sufficiently reliable for the purposes of this report. We also assessed the reliability of CMS’s enrollment data. We found these data to be sufficiently reliable for the purposes of this report.
Medicare Claims Data Reliability
Page 51 GAO-07-383 Ambulance Providers’ Cost
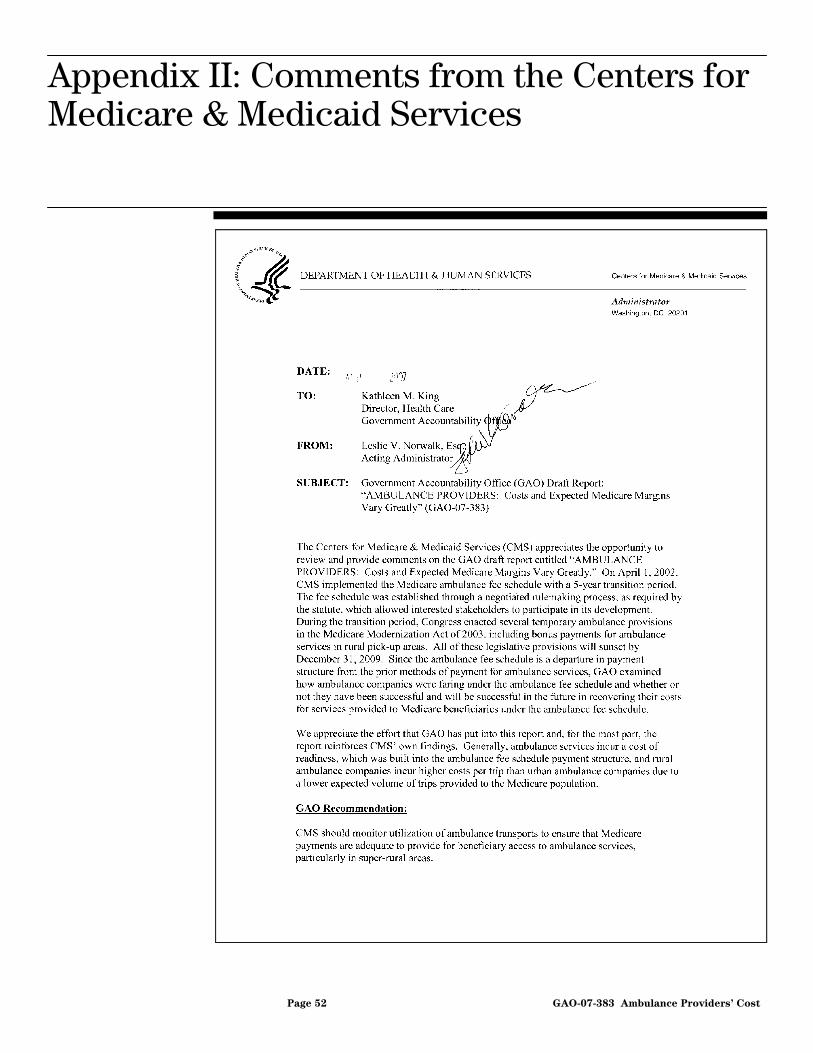
Appendix II: Comments from the Centers for
Medicare & Medicaid Services
Page 52 GAO-07-383 Ambulance Providers’ Cost
Appendix II: Comments from the Centers for Medicare & Medicaid Services

Appendix II: Comments from the Centers for
Medicare & Medicaid Services
Page 53 GAO-07-383 Ambulance Providers’ Cost
Appendix III: GAO
Contact and Staff Acknowledgments
Page 54 GAO-07-383 Ambulance Providers’ Cost
Appendix III: GAO Contact and Staff Acknowledgments
Kathleen M. King, (202) 512-7119 or [email protected]
In addition to the contact named above, Christine Brudevold, Assistant Director; Jennie F. Apter; Carl S. Barden; Stella Chiang; Kevin J. Dietz; James M. Fields; Leslie V. Gordon; Michael Kendix; and Jessica Cobert Smith made key contributions to this report.
GAO Contact
Acknowledgments
Related GA
O Products
Page 55 GAO-07-383 Ambulance Providers’ Cost
Related GAO Products
Ambulance Services: Medicare Payments Can Be Better Targeted to
Trips in Less Densely Populated Rural Areas. GAO-03-986. Washington, D.C.: September 19, 2003.
Ambulance Services: Changes Needed to Improve Medicare Payment
Policies and Coverage Decisions. GAO-02-244T. Washington, D.C.: November 15, 2001.
Emergency Medical Services: Reported Needs Are Wide-Ranging, With A
Growing Focus on Lack of Data. GAO-02-28. Washington, D.C.: October 12, 2001.
Rural Ambulances: Medicare Fee Schedule Payments Could Be Better
Targeted. GAO/HEHS-00-115. Washington, D.C.: July 17, 2000.
(290371)

GAO’s Mission The Government Accountability Office, the audit, evaluation and investigative arm of Congress, exists to support Congress in meeting its constitutional responsibilities and to help improve the performance and accountability of the federal government for the American people. GAO examines the use of public funds; evaluates federal programs and policies; and provides analyses, recommendations, and other assistance to help Congress make informed oversight, policy, and funding decisions. GAO’s commitment to good government is reflected in its core values of accountability, integrity, and reliability.
The fastest and easiest way to obtain copies of GAO documents at no cost is through GAO’s Web site (www.gao.gov). Each weekday, GAO posts newly released reports, testimony, and correspondence on its Web site. To have GAO e-mail you a list of newly posted products every afternoon, go to www.gao.gov and select “Subscribe to Updates.”
The first copy of each printed report is free. Additional copies are $2 each. A check or money order should be made out to the Superintendent of Documents. GAO also accepts VISA and Mastercard. Orders for 100 or more copies mailed to a single address are discounted 25 percent. Orders should be sent to:
U.S. Government Accountability Office 441 G Street NW, Room LM Washington, D.C. 20548
To order by Phone: Voice: (202) 512-6000 TDD: (202) 512-2537 Fax: (202) 512-6061
Contact:
Web site: www.gao.gov/fraudnet/fraudnet.htm E-mail: [email protected] Automated answering system: (800) 424-5454 or (202) 512-7470
Gloria Jarmon, Managing Director, [email protected] (202) 512-4400 U.S. Government Accountability Office, 441 G Street NW, Room 7125 Washington, D.C. 20548
Paul Anderson, Managing Director, [email protected] (202) 512-4800 U.S. Government Accountability Office, 441 G Street NW, Room 7149 Washington, D.C. 20548
Obtaining Copies of GAO Reports and Testimony
Order by Mail or Phone
To Report Fraud, Waste, and Abuse in Federal Programs
Congressional Relations
Public Affairs
PRINTED ON RECYCLED PAPER