Gamma-Ray Imaging Spectrometry - Lawrence Livermore National
7
advances in position-sensitive detector technology, coupled with advances from gamma-ray astronomy, have allowed researchers to design and build a gamma-ray camera capable of taking gamma-ray “photographs” that quickly characterize radiating materials. When these images made with invisible radiation are combined with visible-light images, they clearly show the exact location of the gamma-ray emitting materials. Looking at Gamma Rays The gamma-ray imaging spectrometer (GRIS) we have assembled comprises four coaligned, independent imagers, each with its own detector and coded-aperture mask (Figure 1). Each detector “sees” incoming gamma rays only through its mask, which serves as the imaging optic for the gamma rays (see box, pp. 18- 19). This mask is mounted on a movable mask plate in front of the detector plane; moving the plate provides different levels of zoom for the gamma-ray images. At the back of the housing are the electronics that take the relatively weak signals from the detectors and amplify them before they are sent to the data-acquisition system, which can be located remotely. Our system currently consists of a commercial electronics module, whose data are read out by a notebook computer (Figure 1). Coaligned with the gamma- ray imagers is a video camera. Images from this provide both a visual aim point and visible light images that can be overlaid with the gamma-ray images to pinpoint the location of the radioactive material. Applications and Results Although the spectrometer was developed to control the special nuclear material (SNM) associated with nuclear weapons, there are a myriad of applications in other areas, including environmental cleanup, astronomy, medicine, the nuclear power industry, and any other enterprise where radioactive sources are used. Arms Inspection GRIS was initially designed for use in arms inspections called for by the Strategic Arms Reduction Treaty (START)—specifically, to count the number of warheads on board a missile without requiring either close access to the missile or its disassembly. Inspections would be conducted remotely, based on the premise that the gamma-ray signature from the on-board warheads, although weak, is strong enough to be detected through the top of the missile. GRIS was constructed with four detectors to decrease the time it takes to obtain a good image approximately 10 m from the source. Figure 2 shows GRIS being used to inspect a Peacekeeper missile in its silo; the missile’s ten warheads in the GRIS image are easily seen in Figure 3. Confidence through Transparency As the U.S. and Russia strive to reduce their respective nuclear stockpiles, each must have the ability to identify and verify the location of the other’s weapons components throughout the demolition process. Each 15 Science & Technology Review October 1995 Gamma-Ray Imaging Spectrometry NE of the challenges facing today’s world is to keep track of the nuclear material generated during the Cold War. Some of the materials are radioactive isotopes that fuel nuclear weapons; others are used in the nuclear power industry. At Lawrence Livermore National Laboratory, we have developed an instrument that can help locate and identify these materials. One of the characteristics of many nuclear materials, including those used in weapons, is that they emit gamma radiation. Each isotope emits a unique spectrum of gamma rays that can penetrate substantial amounts of ordinary matter without being scattered or absorbed like visible light. This radiation is imagable and can be used to indicate the presence and specific type of nuclear material. Although nonimaging, nondirectional gamma-ray radiation detectors have long been used to monitor the presence and general location of nuclear materials, gamma rays have been poorly exploited to provide information about the precise location of the nuclear material. Recent 14 Science & Technology Review October 1995 Gamma-Ray Imaging Spectrometry Gamma-Ray Imaging Spectrometry O Figure 1. A Gamma-ray imaging spectrometer (GRIS) configured for work in gaseous diffusion plants. On the left, the GRIS imager head has four independent gamma-ray imagers. On the right is its data-acquisition system. Laboratory scientists have developed an imaging instrument for locating and identifying nuclear materials by taking “photographs” of the gamma rays emitted by these materials. This instrument, the gamma-ray imaging spectrometer, has many potential applications as wide ranging as treaty verification, environmental cleanup investigations, gamma-ray astronomy, and nuclear medicine.
Transcript of Gamma-Ray Imaging Spectrometry - Lawrence Livermore National

advances in position-sensitive detectortechnology, coupled with advances fromgamma-ray astronomy, have allowedresearchers to design and build agamma-ray camera capable of takinggamma-ray “photographs” that quicklycharacterize radiating materials. Whenthese images made with invisibleradiation are combined with visible-lightimages, they clearly show the exactlocation of the gamma-ray emittingmaterials.
Looking at Gamma Rays
The gamma-ray imagingspectrometer (GRIS) we haveassembled comprises four coaligned,independent imagers, each with its owndetector and coded-aperture mask(Figure 1). Each detector “sees”incoming gamma rays only through itsmask, which serves as the imaging opticfor the gamma rays (see box, pp. 18-19). This mask is mounted on amovable mask plate in front of thedetector plane; moving the plateprovides different levels of zoom for thegamma-ray images.
At the back of the housing are theelectronics that take the relativelyweak signals from the detectors andamplify them before they are sent tothe data-acquisition system, which canbe located remotely. Our systemcurrently consists of a commercialelectronics module, whose data areread out by a notebook computer(Figure 1). Coaligned with the gamma-ray imagers is a video camera. Imagesfrom this provide both a visual aimpoint and visible light images that canbe overlaid with the gamma-rayimages to pinpoint the location of theradioactive material.
Applications and Results
Although the spectrometer wasdeveloped to control the specialnuclear material (SNM) associatedwith nuclear weapons, there are amyriad of applications in other areas,including environmental cleanup,astronomy, medicine, the nuclearpower industry, and any otherenterprise where radioactive sourcesare used.
Arms InspectionGRIS was initially designed for use
in arms inspections called for by theStrategic Arms Reduction Treaty(START)—specifically, to count thenumber of warheads on board a missilewithout requiring either close access tothe missile or its disassembly.Inspections would be conductedremotely, based on the premise that thegamma-ray signature from the on-boardwarheads, although weak, is strongenough to be detected through the top of the missile. GRIS was constructedwith four detectors to decrease the timeit takes to obtain a good imageapproximately 10 m from the source.Figure 2 shows GRIS being used toinspect a Peacekeeper missile in its silo;the missile’s ten warheads in the GRISimage are easily seen in Figure 3.
Confidence through TransparencyAs the U.S. and Russia strive to
reduce their respective nuclearstockpiles, each must have the ability toidentify and verify the location of theother’s weapons componentsthroughout the demolition process. Each
15
Science & Technology Review October 1995
Gamma-Ray Imaging Spectrometry
NE of the challenges facingtoday’s world is to keep track of
the nuclear material generated duringthe Cold War. Some of the materialsare radioactive isotopes that fuelnuclear weapons; others are used inthe nuclear power industry. AtLawrence Livermore NationalLaboratory, we have developed aninstrument that can help locate andidentify these materials.
One of the characteristics of manynuclear materials, including those usedin weapons, is that they emit gammaradiation. Each isotope emits a uniquespectrum of gamma rays that canpenetrate substantial amounts ofordinary matter without being scatteredor absorbed like visible light. Thisradiation is imagable and can be used toindicate the presence and specific typeof nuclear material.
Although nonimaging, nondirectionalgamma-ray radiation detectors have longbeen used to monitor the presence andgeneral location of nuclear materials,gamma rays have been poorly exploitedto provide information about the preciselocation of the nuclear material. Recent
14
Science & Technology Review October 1995
Gamma-Ray Imaging Spectrometry
Gamma-Ray ImagingSpectrometry
O
Figure 1. A Gamma-ray imaging spectrometer (GRIS) configured for work ingaseous diffusion plants. On the left, the GRIS imager head has four independentgamma-ray imagers. On the right is its data-acquisition system.
Laboratory scientists have developed an imaging instrument for locating andidentifying nuclear materials by taking “photographs” of the gamma rays emittedby these materials. This instrument, the gamma-ray imaging spectrometer, hasmany potential applications as wide ranging as treaty verification, environmentalcleanup investigations, gamma-ray astronomy, and nuclear medicine.

rods inside a storage drum. To simulateshielding, we placed a depleted uraniumplate about 3 mm thick outside thedrum. The uranium serves as shielding,as a source of confusing radiation, andas a different radioactive isotope.
Figure 5 indicates both the energyresolution of the system and howimages using data from differentspectral regions can show the locationsof different materials. The imageobtained using only the data in theregion of the spectrum shaded blue is onthe left. This image represents emissionfrom uranium and shows only the largeuranium plate. On the right is the imageobtained using data in the region of thespectrum shaded pink. These data arecharacteristic of plutonium and revealthe rectangular figure behind theuranium inside the container.
Safeguarding WeaponsWhen nuclear arms and their
components are secured and stored, theprimary concern is to verify that nomaterial is removed from a storage area. In addition to armed guards, aninventory control system that constantly
17
Science & Technology Review October 1995
Gamma-Ray Imaging Spectrometry
must have confidence that the SNM inthe other’s storage vessels is associatedwith nuclear weapons components butmust be able to develop that confidencewithout performing an inspection thatis sufficiently detailed to raiseclassification issues. This ability, orconfidence, is called transparency.
In a recent joint U.S.–Russiandemonstration at LLNL, we obtaineddata with a conventional, nonimaginggamma-ray detector and with GRIS. Thedata were collected from a radioactivesource hidden inside a typical weaponscomponent storage container. Bothdetectors possessed similar energyresolutions and could identify the typeof material present. However, in a singlemeasurement, the non-imaging detectorcould not verify the quantity of SNMpresent or the likelihood that thematerial was a weapons component.Such information could only be obtainedfrom the nonimaging detector byscanning it across the storage vessel insmall steps. Although this generated acrude image of the object that allowedidentification, it also required most of amorning to complete. By comparison,the inspection with GRIS took half anhour—a time which could be easilyreduced to a few minutes. The GRISimages taken from two directions 90 degrees apart (Figure 4) clearly show that a disk of plutonium and not a weapons component is in thestorage container.
Related applications that takeadvantage of GRIS’s ability to “see”behind shielding occur in nuclear wastedisposal and in the characterization ofnuclear weapons. Figure 5 illustratessuch an application. Here, we placed arectangular shape made from plutonium
16
Science & Technology Review October 1995
Gamma-Ray Imaging Spectrometry
Figure 2. Rendering of the configuration used forgamma-ray imaging of a Peacekeeper missile. TheGRIS imaging module is suspended above the open silodoor and generates an image from the radiation given offby the warheads at the top of the missile.
Figure 3. This enhancedgamma-ray image is froman emplaced Peacekeepermissile. The warheads areshown in a ring of nine,with the tenth inside thering at the 10 o’clockposition. The colorsrepresent radiationintensity contours.
Figure 4. Overlaid on a video picture, a color gamma-ray imageshows the difference between a face-on (left) and an edge-on(right) image of a plutonium disk. The images were obtained ata distance of 1.8 m and a position resolution at the source of3.8 cm. Black represents the highest radiation intensity.
Figure 5. Demonstration of gamma-rayimaging and energy discrimination inapplications for arms control transparency,contaminated waste identification, andweapons forensics. That the plutoniumsource is distributed inside a storage drumcan be clearly seen, even through 3 mm ofdepleted uranium. The image at left isgenerated from 100-keV gamma radiationof the depleted uranium; the image on theright is generated from the plutoniumenergy band at about 400 keV. With theappropriate energy selection, the plutoniumcan be seen through the uranium.
6000
4000
2000
00 100 200 300
Energy, keV400 500 600
Cou
nts
Depleted uranium source Plutonium source
19
Science & Technology Review October 1995
Gamma-Ray Imaging Spectrometry18
Science & Technology Review October 1995
Gamma-Ray Imaging Spectrometry
Astronomers have worked on the problem of imaginggamma rays for about 30 years. Although cosmic sources ofgamma rays are extremely bright, they are also exceedingly faraway, so the problem is how to image dim sources in arelatively large background. In principle, a pinhole cameracould be used, but only a small fraction of the availableradiation would reach the film or detector. In the late 1960s, itwas recognized that one could improve the pinhole camera bypunching more holes in the blocking sheet. Each hole projectsits own image on the detector, and the different images overlap.If the hole pattern is known, one can mathematically recreate afaithful reproduction of the scene.
Although initial attempts showed that the technique worked,they also showed that the pattern had to be selected carefully, orfalse sources would appear in the image. The research on patterneffects was largely completed in the 1970s when a class of patternscalled uniformly redundant arrays was created. These patternspossess a unique property: the information present in the shadow
pattern from any one source in the image is not affected by thepresence of gamma-ray sources in other parts of the image.
In the schematic of the imager (see the illustration below), weassume that radiation is coming from a very distant source. Thelight rays from this source are parallel, so a shadow of the maskis projected on the detector much the way it would be projectedby the sun. Each pixel (the smallest picture element) in the imageis represented by parallel gamma rays incident from onedirection that project a detector-sized portion of the mask patternonto the detector. The pattern is selected such that eachprojection is unique and independent of all other projections.
The image is recreated by a cross-correlation technique: thecomplete detector pattern is summed against each unique maskposition by adding counts to the sum if the mask is open at thisposition and subtracting them if it is closed. Physically, countsare added if they could have come from that direction andsubtracted if they could not. If no source is present, any detector-sized portion of the mask pattern has the same fraction of open
and closed area relative to all other portions of the mask of thatsame size, so the sum is zero (except for statistical fluctuations).If a source exists at the particular location being summed, thenevery time there is an opening there will be counts, and the sumwill recreate the true flux (amount of signal per unit time) fromthe source.
The advantage of this technique is that half the detector areais exposed to each of the sources in the field of view. The rest isbehind closed mask elements. Compare this with a pinholecamera, in which the open area is only one pixel’s worth. For apoint source, the signal-to-noise ratio increases as the square rootof N, where N is the number of open holes. For our system, N isapproximately 200, meaning a 14-times-greater signal strengthand significantly reduced data-acquisition time.
Unfortunately, because all the counts in the detector are usedat each image location, the more sources there are in the field ofview, the less one gains from this technique. It reverts to onewith the same sensitivity as a pinhole camera if the whole fieldof view glows at the same intensity.
The resolution of a coded-aperture camera is just what itwould be for a pinhole camera. For each pixel, the angularoffset in incoming radiation is the basic hole size divided bythe focal length (detector-to-mask spacing). To obtain theresolution at the source, one must multiply this angle by thedistance to the source.
Position-Sensitive DetectorConverting the signal to a visual image requires
a position-sensitive detector. Moreover, the positionresolution must be comparable to the mask holesize; otherwise the pattern washes out. Becausetypical position-sensitive detectors (known as Anger cameras) for gamma rays of energies from 20 kiloelectron volts to greater than 1 megaelectronvolt have position resolutions of the order of 1 cm,an imager must be quite large to have a reasonablenumber of pixels across the detector. An imagermade with such a detector must also have a longfocal length to achieve even modest positionresolutions at the source
Our development of a gamma-ray detector with aposition resolution of about 1 mm allowed the fullexploitation of the coded-aperture technique in a
compact system. In the schematic of the detector at the left, aposition-sensitive photomultiplier tube is combined with athin cesium–iodide crystal. When a gamma ray hits thecrystal, it causes a brief flash of light, which is converted toan electronic signal by the photomultiplier tube. The tube isunique in that it allows the position of the light flash to bedetermined from its four output signals. The amount of lightis proportional to the energy of the gamma ray and is alsomeasured by the photomultiplier tube. The 4- ¥ 5-cm activearea of the detector yields about 40 pixels across its face,allowing for a mask pattern about 20 ¥ 20 pixels (ideally, oneoversamples by a factor of two.)
How the Gamma-Ray Imaging Detector Works
Detector
Mask
Incoming gammaradiation
Mask
Incoming gammaradiation
Detector
Uniformly redundant-array coded apertures produce an image by having each source pixel cast a unique mask shadow patternon the detector. The mask is four times the area of the detector. On the left is the system response for a source in the center ofthe field of view. On the right, is a response for a source near the left edge of the field of view.
This schematic of the GRIS detector shows how itlocates gamma radiation. A sodium-dopedcesium–iodide crystal emits a flash of light when struckby a gamma ray. This light is converted to electrons andamplified by the photomultiplier tube on which the crystalis mounted. The tube uses a unique mesh dynodestructure and a crossed-wire anode to determine thelocation of each event over the face of the tube.
Input window
Photocathode
Dynodeamplifiers
Crossed-wiredanode Resistor
divider network
Photomultipliertube
Cesium–iodide crystal
Gamma ray

gas at elevated temperatures. Separationtakes advantage of the fact that the gas,composed of the lighter uranium-235isotope, diffuses at a slightly higher ratethan the gas containing heavieruranium-238. The UF6 is enriched inheated equipment and piping containedwithin insulated housings.
Occasionally, because of leakage ofwet air or environmental changes in thehousing, solid UF6 deposits develop.Such deposits routinely occur in anoperational plant and must be locatedand identified. This task is not trivial.Many different pipes share the sameheat shielding in the miles of pipegalleries. To enter these enclosures,workers must don protective gear toavoid radioactive contamination frompossible residual leaks from more than30 years of operation. In addition, somefacilities—including those goingthrough decontamination anddecommissioning—contain highlyenriched uranium, which could cause acriticality accident if a deposit ofuranium-235 becomes too large.
Current characterization of theuranium deposits in these plants isperformed primarily using sodium-iodide-based radiation detectors. Theseare carried through the plant, andreadings are taken at fixed intervals tomap the radiation fields. If a “hot”region is found, workers must eitherenter the heat-shield-enclosed area ortake many measurements with acollimated version of the detectors totry to locate the deposit. Both are time-consuming, expensive, and potentiallyhazardous tasks. GRIS avoids theseproblems by generating images fromoutside the heat shielding thatdefinitively locate the hot material.
Our first use of GRIS in thisenvironment was at the idled K-25 plant.GRIS was mounted on a cart to look up
some 4 m at the pipe galleries overheadthat range in width from a few meters tomore than 12 m across. Each gallery,enclosed in heat shielding, containspipes ranging in size from a fewcentimeters to more than a meter indiameter. The building had been entirelyscanned by K-25 personnel walkingunder and on top of the galleries usingan uncollimated radiation detector; theresults from this survey were used toselect sites of interest for application ofthe GRIS imager. The first image was apipe used to exhaust the building’s manyvacuum pumps. We selected this pipebecause the lack of heat shieldingallowed us to verify that the gamma-rayand video images identified the hot pipe(Figure 6).
A second exposure was taken of amore representative location where anisolated deposit of material was known
to exist. After an initial wide-fieldimage was taken to see the completedeposit, we moved the imager under thehot spot and zoomed in on this region.Figure 7 shows a deposit in a 1.2-m-diameter pipe, where an expansion jointexists. The deposit is probably uraniumoxide, formed when a leak developed inthe expansion joint.
The images from the next location,although they are nearly featureless,clearly demonstrate the power of thetechnique. We took GRIS to a locationwhere we expected to find a series ofradioactive pipes running the length ofthe area covered in the image. Twoexposures were needed to cover the fullwidth of the 12-m-wide pipe gallery.The resulting images (Figure 8)revealed only a few hot spots, not thecontamination expected from thestandard analysis.
21
Science & Technology Review October 1995
Gamma-Ray Imaging Spectrometry
monitors the radiation from eachradioactive component is desirable.However, such a level of security is notalways possible. Particularly inestablishing an interim storage area, thecosts and time required to makeindividual security monitors for eachlocation can be prohibitive. However,the need for such facilities will beparticularly important as U.S. and statesof the former Soviet Union dismantlenuclear warheads. In this case, a GRIS-type imager can be a relativelyinexpensive and very rapid way toestablish inventory control.
Although we have not fielded suchan application, the implementation isstraightforward. The gamma-ray imageris installed so that it can “see” allsources, and a baseline image is taken.Then, the imager is set on a timer totake that image over and over again. A mathematical comparison of eachsuccessive image to the original can be used to sound an alarm shouldsomething be moved; we developed
suitable algorithms to do this in thecourse of analyzing the Peacekeeperdata. The advantages of using an imagerin this case are that it can be set up veryquickly, personnel need not leave theroom, and visible light is not required.
Locating SNM in Process PlantsGRIS has been demonstrated at two
U.S. gaseous diffusion, uranium-enrichment plants—K-25 at Oak Ridge,Tennessee, and the Portsmouth plantnear Portsmouth, Ohio. The images weobtained from these plants demonstratethe utility of gamma-ray imaging in anumber of complex situations.
Gaseous diffusion is used to separatethe useful uranium-235 isotope from thepredominant uranium-238 isotopepresent in natural uranium. Uranium-235 is the fissionable material used both as nuclear fuel in reactors and asweapons components. In the gaseousdiffusion process, uranium metal iscombined with fluorine to makeuranium hexafluoride (UF6), which is a
20
Science & Technology Review October 1995
Gamma-Ray Imaging Spectrometry
Figure 6. Video (right) andcomposite gamma-ray/videooverlay (left) of a contaminatedpipe at the K-25 gaseousdiffusion plant at Oak Ridge.The gamma-ray image clearlyshows which of the pipesoverhead is contaminated.
Figure 7. Overlay of gamma-ray intensity as a function of position for wide-field(left) and zoom views (right). The gamma-ray image on the right, which is overlaidon a video image, was taken after the imager was moved under the hot spot initiallyidentified from the image on the left. The radiation is emitted by a uranium depositinside a 1.2-m-diameter steel pipe hidden behind heat shielding.
Video imageGamma ray image
5.2- ¥ 4.6-m field of view
1.9- ¥ 1.7-m field of view
areas of particularly intense radiation.In a similar application, GRIS could
be used to find “lost” radioactivesources. Intense radioactive sources are sometimes used for materialscharacterization in construction andmaintenance. If these sources are lostfrom their holders, they present asignificant radiation hazard.
Finally, nuclear medicine couldpotentially benefit from application of agamma-ray imager with capabilitiessimilar to those of GRIS. The gammaemissions of several well-knownradionuclides used in medicine fall withinthe range of energies GRIS exploits.
Spectrometry and the Stars
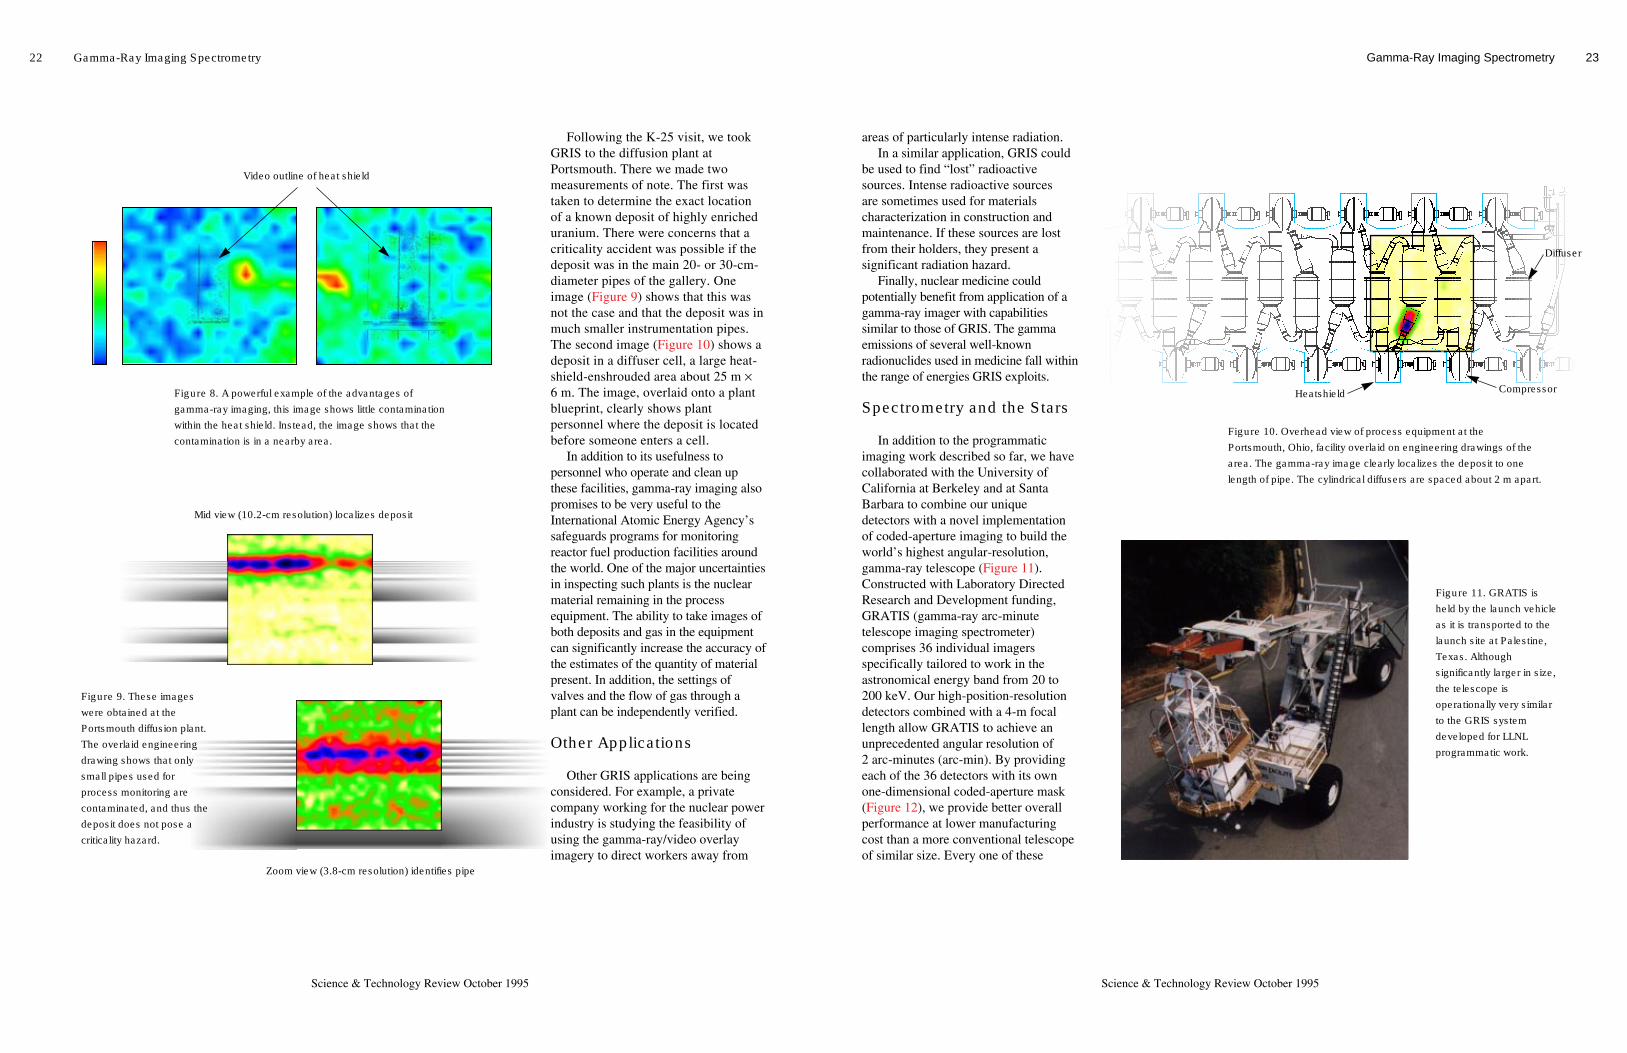
In addition to the programmaticimaging work described so far, we havecollaborated with the University ofCalifornia at Berkeley and at SantaBarbara to combine our uniquedetectors with a novel implementationof coded-aperture imaging to build theworld’s highest angular-resolution,gamma-ray telescope (Figure 11).Constructed with Laboratory DirectedResearch and Development funding,GRATIS (gamma-ray arc-minutetelescope imaging spectrometer)comprises 36 individual imagersspecifically tailored to work in theastronomical energy band from 20 to200 keV. Our high-position-resolutiondetectors combined with a 4-m focallength allow GRATIS to achieve anunprecedented angular resolution of 2 arc-minutes (arc-min). By providingeach of the 36 detectors with its ownone-dimensional coded-aperture mask(Figure 12), we provide better overallperformance at lower manufacturingcost than a more conventional telescopeof similar size. Every one of these
23
Science & Technology Review October 1995
Gamma-Ray Imaging Spectrometry
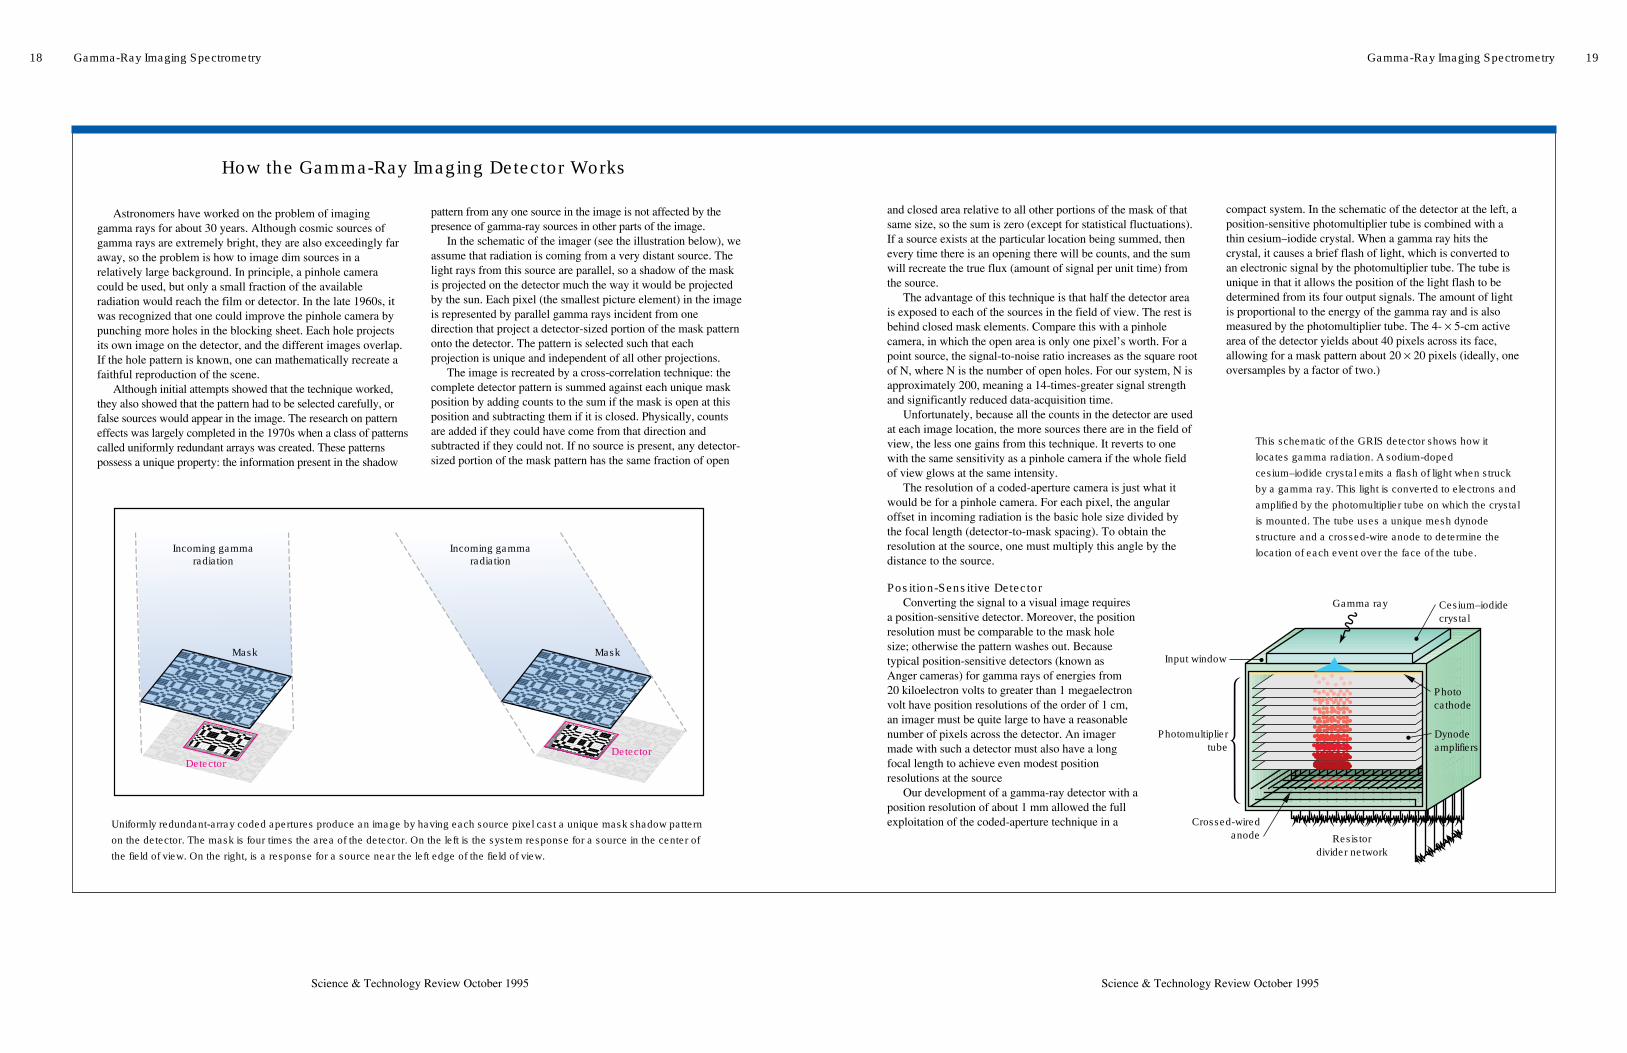
Following the K-25 visit, we tookGRIS to the diffusion plant atPortsmouth. There we made twomeasurements of note. The first wastaken to determine the exact locationof a known deposit of highly enricheduranium. There were concerns that acriticality accident was possible if thedeposit was in the main 20- or 30-cm-diameter pipes of the gallery. Oneimage (Figure 9) shows that this wasnot the case and that the deposit was inmuch smaller instrumentation pipes.The second image (Figure 10) shows adeposit in a diffuser cell, a large heat-shield-enshrouded area about 25 m ¥ 6 m. The image, overlaid onto a plantblueprint, clearly shows plantpersonnel where the deposit is locatedbefore someone enters a cell.
In addition to its usefulness topersonnel who operate and clean upthese facilities, gamma-ray imaging alsopromises to be very useful to theInternational Atomic Energy Agency’ssafeguards programs for monitoringreactor fuel production facilities aroundthe world. One of the major uncertaintiesin inspecting such plants is the nuclearmaterial remaining in the processequipment. The ability to take images ofboth deposits and gas in the equipmentcan significantly increase the accuracy ofthe estimates of the quantity of materialpresent. In addition, the settings ofvalves and the flow of gas through aplant can be independently verified.
Other Applications
Other GRIS applications are beingconsidered. For example, a privatecompany working for the nuclear powerindustry is studying the feasibility ofusing the gamma-ray/video overlayimagery to direct workers away from
22
Science & Technology Review October 1995
Gamma-Ray Imaging Spectrometry
Figure 8. A powerful example of the advantages ofgamma-ray imaging, this image shows little contaminationwithin the heat shield. Instead, the image shows that thecontamination is in a nearby area.
Figure 9. These imageswere obtained at thePortsmouth diffusion plant.The overlaid engineeringdrawing shows that onlysmall pipes used forprocess monitoring arecontaminated, and thus thedeposit does not pose acriticality hazard.
Figure 10. Overhead view of process equipment at thePortsmouth, Ohio, facility overlaid on engineering drawings of thearea. The gamma-ray image clearly localizes the deposit to onelength of pipe. The cylindrical diffusers are spaced about 2 m apart.
Figure 11. GRATIS isheld by the launch vehicleas it is transported to thelaunch site at Palestine,Texas. Althoughsignificantly larger in size,the telescope isoperationally very similarto the GRIS systemdeveloped for LLNLprogrammatic work.
Zoom view (3.8-cm resolution) identifies pipe
Mid view (10.2-cm resolution) localizes deposit
Video outline of heat shield
Heatshield Compressor
Diffuser
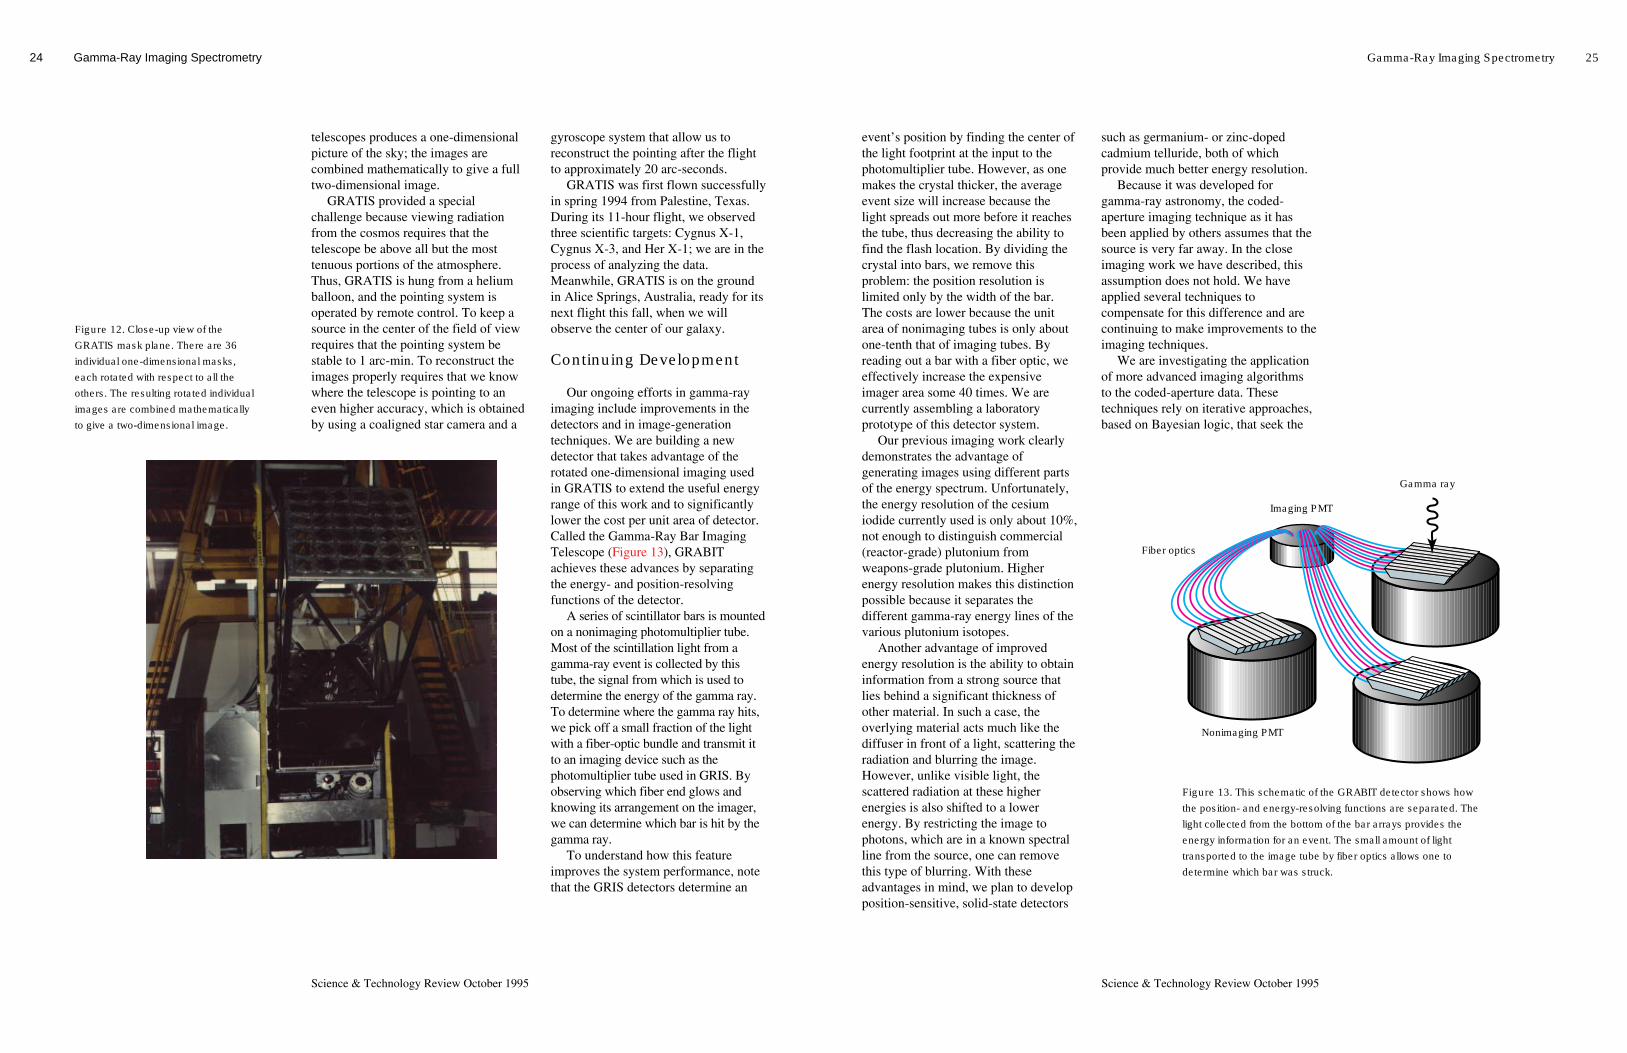
telescopes produces a one-dimensionalpicture of the sky; the images arecombined mathematically to give a fulltwo-dimensional image.
GRATIS provided a specialchallenge because viewing radiationfrom the cosmos requires that thetelescope be above all but the mosttenuous portions of the atmosphere.Thus, GRATIS is hung from a heliumballoon, and the pointing system isoperated by remote control. To keep asource in the center of the field of viewrequires that the pointing system bestable to 1 arc-min. To reconstruct theimages properly requires that we knowwhere the telescope is pointing to aneven higher accuracy, which is obtainedby using a coaligned star camera and a
gyroscope system that allow us toreconstruct the pointing after the flightto approximately 20 arc-seconds.
GRATIS was first flown successfullyin spring 1994 from Palestine, Texas.During its 11-hour flight, we observedthree scientific targets: Cygnus X-1,Cygnus X-3, and Her X-1; we are in theprocess of analyzing the data.Meanwhile, GRATIS is on the groundin Alice Springs, Australia, ready for itsnext flight this fall, when we willobserve the center of our galaxy.
Continuing Development
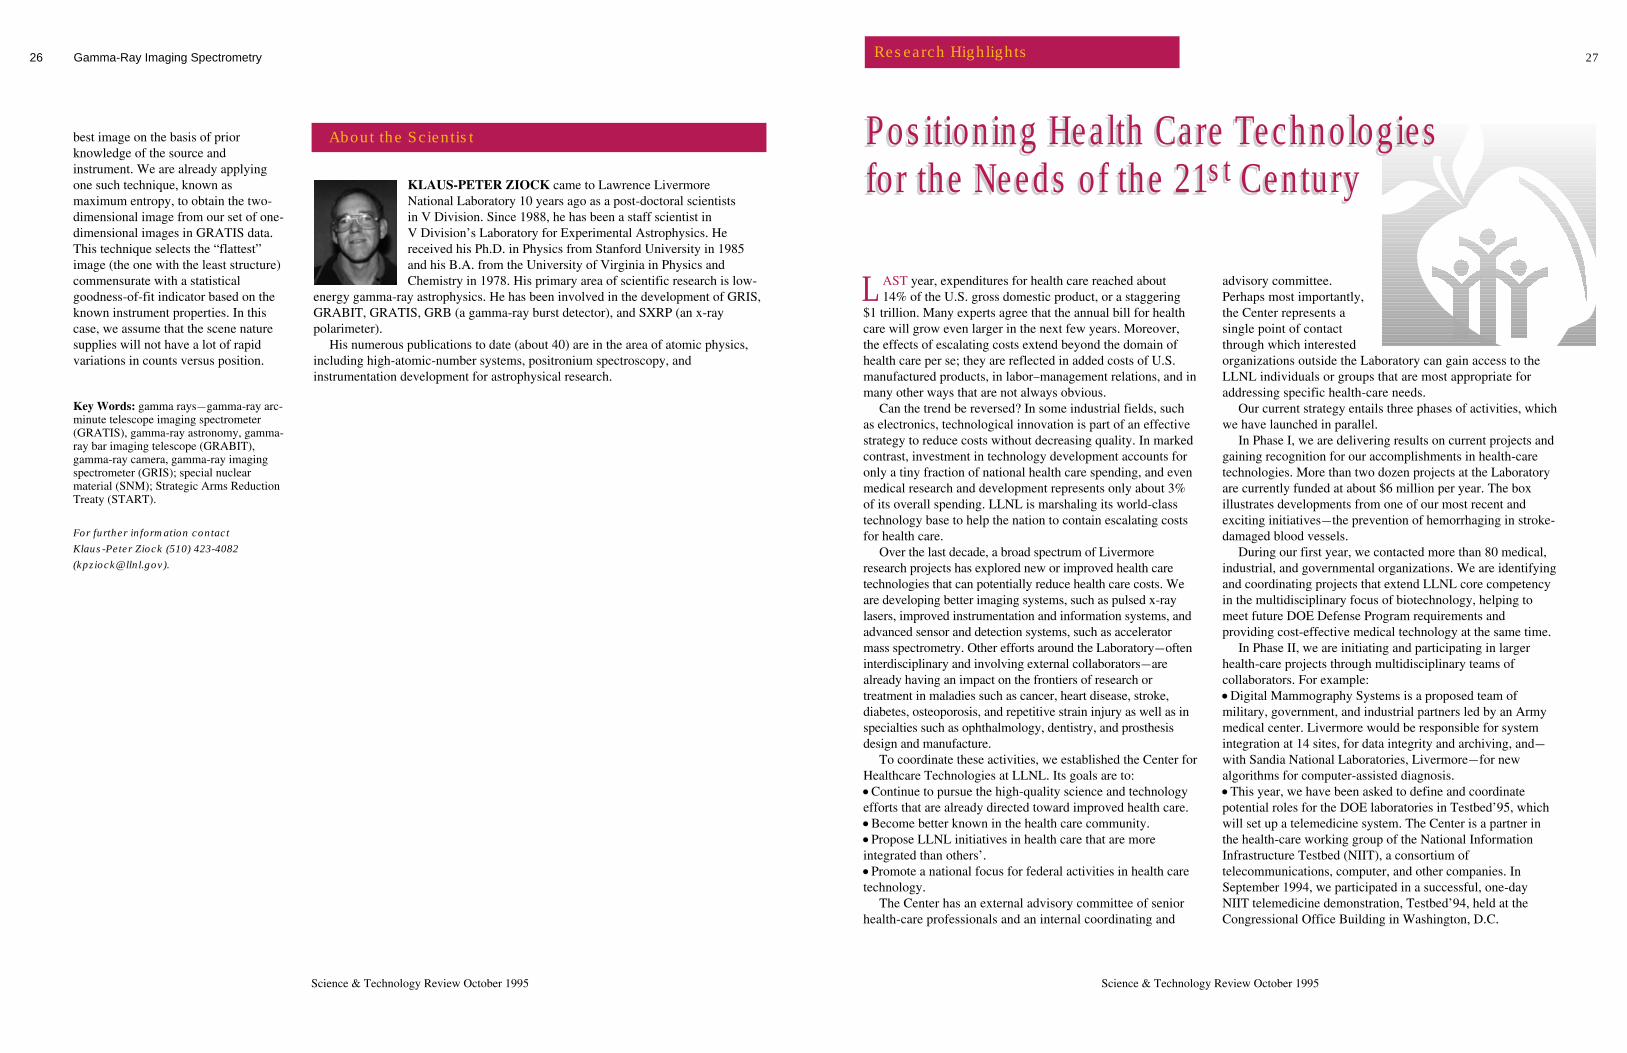
Our ongoing efforts in gamma-rayimaging include improvements in thedetectors and in image-generationtechniques. We are building a newdetector that takes advantage of therotated one-dimensional imaging usedin GRATIS to extend the useful energyrange of this work and to significantlylower the cost per unit area of detector.Called the Gamma-Ray Bar ImagingTelescope (Figure 13), GRABITachieves these advances by separatingthe energy- and position-resolvingfunctions of the detector.
A series of scintillator bars is mountedon a nonimaging photomultiplier tube.Most of the scintillation light from agamma-ray event is collected by thistube, the signal from which is used todetermine the energy of the gamma ray.To determine where the gamma ray hits,we pick off a small fraction of the lightwith a fiber-optic bundle and transmit itto an imaging device such as thephotomultiplier tube used in GRIS. Byobserving which fiber end glows andknowing its arrangement on the imager,we can determine which bar is hit by thegamma ray.
To understand how this featureimproves the system performance, notethat the GRIS detectors determine an
24
Science & Technology Review October 1995
Gamma-Ray Imaging Spectrometry
event’s position by finding the center ofthe light footprint at the input to thephotomultiplier tube. However, as onemakes the crystal thicker, the averageevent size will increase because thelight spreads out more before it reachesthe tube, thus decreasing the ability tofind the flash location. By dividing thecrystal into bars, we remove thisproblem: the position resolution islimited only by the width of the bar.The costs are lower because the unitarea of nonimaging tubes is only aboutone-tenth that of imaging tubes. Byreading out a bar with a fiber optic, weeffectively increase the expensiveimager area some 40 times. We arecurrently assembling a laboratoryprototype of this detector system.
Our previous imaging work clearlydemonstrates the advantage ofgenerating images using different partsof the energy spectrum. Unfortunately,the energy resolution of the cesiumiodide currently used is only about 10%,not enough to distinguish commercial(reactor-grade) plutonium fromweapons-grade plutonium. Higherenergy resolution makes this distinctionpossible because it separates thedifferent gamma-ray energy lines of thevarious plutonium isotopes.
Another advantage of improvedenergy resolution is the ability to obtaininformation from a strong source thatlies behind a significant thickness ofother material. In such a case, theoverlying material acts much like thediffuser in front of a light, scattering theradiation and blurring the image.However, unlike visible light, thescattered radiation at these higherenergies is also shifted to a lowerenergy. By restricting the image tophotons, which are in a known spectralline from the source, one can removethis type of blurring. With theseadvantages in mind, we plan to developposition-sensitive, solid-state detectors
such as germanium- or zinc-dopedcadmium telluride, both of whichprovide much better energy resolution.
Because it was developed forgamma-ray astronomy, the coded-aperture imaging technique as it hasbeen applied by others assumes that thesource is very far away. In the closeimaging work we have described, thisassumption does not hold. We haveapplied several techniques tocompensate for this difference and arecontinuing to make improvements to theimaging techniques.
We are investigating the applicationof more advanced imaging algorithmsto the coded-aperture data. Thesetechniques rely on iterative approaches,based on Bayesian logic, that seek the
25
Science & Technology Review October 1995
Gamma-Ray Imaging Spectrometry
Figure 12. Close-up view of theGRATIS mask plane. There are 36individual one-dimensional masks,each rotated with respect to all theothers. The resulting rotated individualimages are combined mathematicallyto give a two-dimensional image.
Gamma ray
Imaging PMT
Nonimaging PMT
Figure 13. This schematic of the GRABIT detector shows howthe position- and energy-resolving functions are separated. Thelight collected from the bottom of the bar arrays provides theenergy information for an event. The small amount of lighttransported to the image tube by fiber optics allows one todetermine which bar was struck.
Fiber optics
27
Science & Technology Review October 1995
AST year, expenditures for health care reached about 14% of the U.S. gross domestic product, or a staggering
$1 trillion. Many experts agree that the annual bill for healthcare will grow even larger in the next few years. Moreover,the effects of escalating costs extend beyond the domain ofhealth care per se; they are reflected in added costs of U.S.manufactured products, in labor–management relations, and inmany other ways that are not always obvious.
Can the trend be reversed? In some industrial fields, suchas electronics, technological innovation is part of an effectivestrategy to reduce costs without decreasing quality. In markedcontrast, investment in technology development accounts foronly a tiny fraction of national health care spending, and evenmedical research and development represents only about 3%of its overall spending. LLNL is marshaling its world-classtechnology base to help the nation to contain escalating costsfor health care.
Over the last decade, a broad spectrum of Livermoreresearch projects has explored new or improved health caretechnologies that can potentially reduce health care costs. Weare developing better imaging systems, such as pulsed x-raylasers, improved instrumentation and information systems, andadvanced sensor and detection systems, such as acceleratormass spectrometry. Other efforts around the Laboratory—ofteninterdisciplinary and involving external collaborators—arealready having an impact on the frontiers of research ortreatment in maladies such as cancer, heart disease, stroke,diabetes, osteoporosis, and repetitive strain injury as well as inspecialties such as ophthalmology, dentistry, and prosthesisdesign and manufacture.
To coordinate these activities, we established the Center forHealthcare Technologies at LLNL. Its goals are to:• Continue to pursue the high-quality science and technologyefforts that are already directed toward improved health care.• Become better known in the health care community.• Propose LLNL initiatives in health care that are moreintegrated than others’.• Promote a national focus for federal activities in health caretechnology.
The Center has an external advisory committee of seniorhealth-care professionals and an internal coordinating and
advisory committee.Perhaps most importantly,the Center represents asingle point of contactthrough which interestedorganizations outside the Laboratory can gain access to theLLNL individuals or groups that are most appropriate foraddressing specific health-care needs.
Our current strategy entails three phases of activities, whichwe have launched in parallel.
In Phase I, we are delivering results on current projects andgaining recognition for our accomplishments in health-caretechnologies. More than two dozen projects at the Laboratoryare currently funded at about $6 million per year. The boxillustrates developments from one of our most recent andexciting initiatives—the prevention of hemorrhaging in stroke-damaged blood vessels.
During our first year, we contacted more than 80 medical,industrial, and governmental organizations. We are identifyingand coordinating projects that extend LLNL core competencyin the multidisciplinary focus of biotechnology, helping tomeet future DOE Defense Program requirements andproviding cost-effective medical technology at the same time.
In Phase II, we are initiating and participating in largerhealth-care projects through multidisciplinary teams ofcollaborators. For example:• Digital Mammography Systems is a proposed team ofmilitary, government, and industrial partners led by an Armymedical center. Livermore would be responsible for systemintegration at 14 sites, for data integrity and archiving, and—with Sandia National Laboratories, Livermore—for newalgorithms for computer-assisted diagnosis.• This year, we have been asked to define and coordinatepotential roles for the DOE laboratories in Testbed’95, whichwill set up a telemedicine system. The Center is a partner inthe health-care working group of the National InformationInfrastructure Testbed (NIIT), a consortium oftelecommunications, computer, and other companies. InSeptember 1994, we participated in a successful, one-dayNIIT telemedicine demonstration, Testbed’94, held at theCongressional Office Building in Washington, D.C.
Research Highlights
L
Positioning Health Care Technologies for the Needs of the 21st CenturyPositioning Health Care Technologies for the Needs of the 21st Century
26
Science & Technology Review October 1995
Gamma-Ray Imaging Spectrometry
KLAUS-PETER ZIOCK came to Lawrence Livermore National Laboratory 10 years ago as a post-doctoral scientists in V Division. Since 1988, he has been a staff scientist in V Division’s Laboratory for Experimental Astrophysics. Hereceived his Ph.D. in Physics from Stanford University in 1985and his B.A. from the University of Virginia in Physics andChemistry in 1978. His primary area of scientific research is low-
energy gamma-ray astrophysics. He has been involved in the development of GRIS,GRABIT, GRATIS, GRB (a gamma-ray burst detector), and SXRP (an x-raypolarimeter).
His numerous publications to date (about 40) are in the area of atomic physics,including high-atomic-number systems, positronium spectroscopy, andinstrumentation development for astrophysical research.
About the Scientistbest image on the basis of priorknowledge of the source andinstrument. We are already applyingone such technique, known asmaximum entropy, to obtain the two-dimensional image from our set of one-dimensional images in GRATIS data.This technique selects the “flattest”image (the one with the least structure)commensurate with a statisticalgoodness-of-fit indicator based on theknown instrument properties. In thiscase, we assume that the scene naturesupplies will not have a lot of rapidvariations in counts versus position.
Key Words: gamma rays—gamma-ray arc-minute telescope imaging spectrometer(GRATIS), gamma-ray astronomy, gamma-ray bar imaging telescope (GRABIT),gamma-ray camera, gamma-ray imagingspectrometer (GRIS); special nuclearmaterial (SNM); Strategic Arms ReductionTreaty (START).
For further information contact Klaus-Peter Ziock (510) 423-4082([email protected]).