![FEM 4100 BRAIN AND HUMAN BEHAVIOR[1]tanpa memerlukan kesedaran , seperti menyelaras sistem deria (contoh. sensory gating dan pengabungan pelbagai deria), berjalan, dan fungsi badan](https://static.fdocuments.net/doc/165x107/5f30521ffbda2a385e38d478/fem-4100-brain-and-human-behavior1-tanpa-memerlukan-kesedaran-seperti-menyelaras.jpg)
Gamma oscillatory activity: a mechanism for sensory gating
69
Gamma Oscillatory Activity: A Mechanism for Sensory Gating A Thesis Submitted to the Faculty of Drexel University by David LaBarca in partial fulfillment of the requirements for the degree of Master of Science in Biomedical Engineering August 2010
Transcript of Gamma oscillatory activity: a mechanism for sensory gating
Gamma Oscillatory Activity:
A Mechanism for Sensory Gating
A Thesis
Submitted to the Faculty
of
Drexel University
by
David LaBarca
in partial fulfillment of the
requirements for the degree
of
Master of Science in Biomedical Engineering
August 2010

© Copyright 2010 David LaBarca. All Rights Reserved.
ii
Acknowledgements
First, I would like to express gratitude for the brilliant guidance by Karen Moxon,
PhD. Throughout my time at Drexel University she offered heartfelt congratulations in
my achievements and provided strength and direction in times of difficulty. As an
exceptional mentor, she has instilled in me the characteristics and vision essential for
independent research in the field of neuroengineering.
Special thanks to Banu Onaral, PhD, who in addition to serving on my committee,
has always taken time from her schedule as the Director of the Drexel School of
Biomedical Engineering to offer me advice and support in my academic, extracurricular,
and professional endeavors. Thanks also to Joshua Jacobs, PhD and Kenneth Barbee,
PhD for their time and effort in helping me satisfy the necessary requirements for this
publication.
Special thanks to Dr. Alessandro Scaglione who patiently taught me the
fundamental concepts of neural modeling. Also, thanks to Bahrad Sokhansanj, PhD for
astute observations in mathematical modeling. I would like to show appreciation for Kate
Allen, PhD and doctoral candidates Erik Knudson and Dane Grasse who gave me
invaluable tips for scripting, as I learned to utilize Matlab. I would also like to thank
Kevin Freedman for insightful discussions regarding the theory of wavelet
transformations.
Thank you to the staff at the Drexel School of Biomedical Engineering for
advisement and attention regarding academic and professional matters. Thanks also to the
Drexel College of Medicine for the summer research fellowship and the insight I gained
from the faculty’s feedback during the presentation of my results.

iii
Table of Contents
LIST OF TABLES .............................................................................................................. v
LIST OF FIGURES ........................................................................................................... vi
ABSTRACT ...................................................................................................................... vii
1. INTRODUCTION ........................................................................................................ 1
1.1 Specific Aims ......................................................................................................... 3
2. BACKGROUND .......................................................................................................... 4
2.1 The Sensory Gating Paradigm ............................................................................... 4
2.2 Sensory Gating Deficit and Schizophrenia ............................................................ 7
2.3 Oscillatory Activity and Sensory Gating ............................................................. 10
2.4 Modeling Sensory Gating .................................................................................... 12
2.5 Gamma Band Activity as a Mechanism for Normal Sensory Gating .................. 14
3. METHODS ................................................................................................................. 15
3.1 Review of Jansen’s Model ................................................................................... 15
3.2 Model Equations .................................................................................................. 21
3.4 Wavelet Transforms for Signal Processing ......................................................... 24
3.5 Determining the Values of 𝜌 to Simulate EEG with Specific Frequencies ......... 26
3.6 Procedure for Applying an External Stimulus ..................................................... 28
3.7 Assessing the Change in Power Due to an External Stimulus ............................. 28
4. RESULTS ................................................................................................................... 30
4.1 Model Reproduces Results of Jansen’s Work ..................................................... 30
4.2 Model Design for Control Over Power of On-Going Oscillation ....................... 32

iv
4.3 Reproduction of Jansen’s Model with External Stimulus ................................... 37
4.4 Applied Stimulus across Frequency Bands ......................................................... 39
4.5 Assessment of Signal Response to External Stimulus ......................................... 41
5. DISCUSSION ............................................................................................................. 43
5.1 Design Considerations ......................................................................................... 43
5.2 Limitations ........................................................................................................... 46
5.3 Future Research ................................................................................................... 48
5.4 Conclusion ........................................................................................................... 49
REFERENCES ................................................................................................................. 50

v
List of Tables
1. Values of Model Constants. .................................................................................. 20
2. Guideline Values for Specific Frequency Control. ............................................... 35
3. ERP Waveform Characteristics by Frequency Band. ........................................... 42
vi
List of Figures
1. System Schematic of Two Column Model. .......................................................... 16
2. Neurophysiological Diagram with Systems Level Detail. .................................... 20
3. Original Publication of Model Output I. ............................................................... 31
4. Simulated Model Reproduction I. ......................................................................... 31
5. EEG Frequency Characteristics: Theta. ................................................................ 33
6. EEG Frequency Characteristics: Alpha. ............................................................... 33
7. EEG frequency Characteristics: Beta2. ................................................................. 34
8. EEG frequency Characteristics: Gamma. ............................................................. 34
9. Simulated Oscillations at Specific Frequencies. ................................................... 36
10. Original Publication of Model Output II. ............................................................. 38
11. Simulated Model Reproduction II. ....................................................................... 38
12. Simulated Evoked Response Potentials. ............................................................... 40
13. Mean ERP Latency. .............................................................................................. 42
14. Mean ERP Amplitude. .......................................................................................... 42

vii
ABSTRACT Gamma Oscillatory Activity: A Mechanism for Sensory Gating
David LaBarca Karen Anne Moxon, Ph.D.
Sensory gating, or the suppression of neural response to repetitive stimuli, has
been proposed as a protective mechanism to prevent irrelevant information from
potentially overwhelming the cortical system. We are particularly interested in auditory
sensory gating paradigms which compare the amplitudes of evoked response potentials
(ERPs) to auditory stimuli presented 0.5 seconds apart (S1 and S2). The expected
suppression ratio from “normal” subjects is low, indicating that the response to S2 was
suppressed compared to the S1 response. These trials have considerable clinical
relevance; several psychiatric populations, including schizophrenia, suffer from sensory
gating deficits at this 0.5 second interstimulus interval. Abnormal neural mechanisms are
thought to be responsible for their inability to suppress the response to the second
stimulus. The mechanism for ERP suppression in gating paradigms is currently unknown.
We hypothesized that on-going oscillatory activity may contribute to the
suppression of the second response. To test this, we first reproduced a neural mass model
that was known to generate oscillatory activity in the alpha band (8 Hz – 12 Hz). We
expanded on the model in order to design a controllable EEG output with specific
frequencies. Simulations of EEG ranging from alpha to high gamma band activities (8 Hz
- 70 Hz) were run with an external stimulus applied (introduced to the system by an
impulse function that represented an auditory tone) in order to test the effect that pre-
stimulus oscillations at specific frequencies have on the amplitude of the ERP.

viii
Our results corroborate previous findings that as the EPSP and IPSP amplitudes
are increased at the same proportion that the time constants are decreased, the EEG
frequencies increase. We found that pre-stimulus gamma band activity effectively
lowered the amplitude of the ERP. This was due to the two parameters that impact the
on-going oscillations in the model are the resting membrane potential and decreased
synaptic delay. The net result is that the time of arrival of EPSPs and IPSPs become more
coincident. As the EPSPs and IPSPs became more co-incident (gamma range EEG), the
amplitude of the ERP was significantly reduced. We therefore hypothesized that the
presence of gamma oscillations before the second stimulus may be responsible for the
suppression of the test response. This conclusion is consistent with current literature that
showed a correlation between gating and gamma activity before the second stimulus.
Therefore, this aspect of the model suggests a dynamic mechanism describing how
increases in gamma could result in reduced S2 amplitude.
This work provides a computational model that can be used to further assess the
mechanisms of gating. The relationship between gamma activity and suppression of the
test response, along with corroborating data in current literature, suggests gamma activity
is a plausible mechanism that modulates gating. Therefore, a lack of gamma activity
before S2 could be responsible for the failure of schizophrenic patients to gate. There is
evidence which suggests that oscillatory activity and synchrony are abnormal in
schizophrenia. Further studies are needed to determine if the lack of gamma before S2,
seen in our work, contributes to a lack of gating in schizophrenia.


1
CHAPTER 1: INTRODUCTION
Sensory gating is a broad term that describes the ability of the brain to suppress
responses to repeated sensory stimuli. The overall effect is to protect cortical centers
from irrelevant or overwhelming stimuli (Boutros and Belger, 1999). A deficiency in
sensory gating is believed to be the underlying cause, or accessory condition, to a number
of neurological disorders. An important quality of sensory gating is that it can be
measured quantitatively. In the case of schizophrenia, auditory sensory gating paradigms
use electroencephalogram (EEG) data to compare the amplitudes of two sensory event
related potentials (ERPs) to auditory stimuli which are presented 0.5 seconds apart (S1
and S2). The expected suppression ratio (S2 to S1 response amplitudes) from “normal”
subjects is low, indicating that the S2 response amplitude was less than the S1 response
amplitude. Conversely, a high suppression ratio is an indication of deficient gating and
occurs in a majority of subjects with schizophrenia and many of their first degree
relatives. Therefore, an incidence of sensory gating deficiency is clinically diagnosable.
Furthermore, there have been numerous studies which correlate a large number of
disorders with gating deficit (Ghisolfi et al., 2004; 2006; Ludewig and Vollenweider,
2002; Ludewig et al., 2005; Franks, Adler, Waldo, Alpert, and Freedman, 1983; Maier,
Zobel, and Wagner, 2006; Hall et al., 2008; Sanchez-Morla et al., 2008; Arciniegas et al.,
2000; Knight, Staines, Swick, and Chao, 1999; Ambrosini and Schoenen, 2001).
Unfortunately, the underlying neuronal dynamics that facilitate normal sensory gating are
not well understood which has left gating deficiency diagnosable, but largely untreated.
2
Clinical research in this area is especially important for patients that suffer from
schizophrenia. There is a high incidence of sensory gating deficit within the
schizophrenic population (Adler et al., 1982; Clementz, Geyer, and Braff, 1998; Thoma
et al., 2006). Schizophrenics with concurrent gating deficiency experience compounded
symptoms. For example, a person who gates “normally” can talk with someone in a
crowded room without much effort; the surrounding conversations simply become
background noise. Alternatively, a person with a gating deficiency is bombarded by all of
the conversations occurring around them. For some sufferers this may only result in an
inability to remain engaged in their current conversation. But for those concurrently
afflicted with schizophrenia the chaos introduced may easily overwhelm their neural state
and cause a psychotic episode (Nagamoto, Adler, Waldo, Griffith and Freedman, 1991).
In this regard, gating deficiencies are particularly disruptive and sometimes entirely
debilitating to schizophrenics. Once the neural dynamics that facilitate normal sensory
gating are better understood, a mechanism for abnormal gating may be hypothesized.
The overall objective of this study is to identify a possible mechanism that effects
modulation of the S2 response amplitude in sensory gating paradigms using a
computational model of cortical circuits. An established neurophysiological model was
reproduced and then redesigned to generate EEG with specific frequencies. An external
stimulus was applied to these on-going oscillations and the contributions of underlying
neuronal components leading to the generation and attenuation of ERPs was investigated.
As the thesis of this study, we hypothesized that gamma oscillatory activity is a key
mechanism for sensory gating.

3
1.1 - Specific Aims
Aim 1: Design a computational model able to simulate EEG with the physiological
frequencies of interest (alpha, beta 1, beta 2, and gamma).
Approach: Using a previously developed model that simulates the activity of a cortical
column, (Lopes da Silva et al., 1974, 1976; Jansen, Zouridakis, and Brandt, 1993; Jansen
and Rit, 1995; David and Friston, 2003) perform a sensitivity analysis to identify the
parameters that generate oscillations at specific frequencies.
Aim 2: Use the model, developed in Aim 1, to identify the effect that oscillations in
specific frequency bands have on the evoked response to a sensory stimulus.
Approach: Vary the power of on-going oscillations in specific frequency bands (alpha,
8-12 Hz; beta 1, 12-22 Hz; beta 2, 22-40 Hz; gamma, 40-70 Hz) and assess the change in
amplitude of the evoked potential in response to a simulated sensory stimulus. Then use
the model to identify potential mechanisms responsible for reduction of evoked response,
as found in human sensory gating experiments, which could be used to guide future in-
vivo experiments (human or animal).
4
CHAPTER 2: BACKGROUND
2.1 - The Sensory Gating Paradigm
The ability of the brain to inhibit or suppress responses to incoming redundant
sensory input is a protective neuronal mechanism that prevents overwhelming higher
cortical centers with irrelevant information (Venables, 1964) through a filtering
mechanism (Clementz, Blumenfeld and Cobb, 1997; Freedman et al., 1996). An
important aspect of the sensory gating paradigm is that the degree of gating can be
quantitatively measured by comparing the amplitude of sensory evoked response
potentials (ERPs). The electroencephalograph (EEG) has traditionally been used to
acquire brain signals and is used to quantify sensory gating (Adler et al., 1982; Boutros,
Korzyukov, Jansen, Feingold and Bell, 2004; Hong, Summerfelt, McMahon, Thaker and
Buchanan, 2004). The double-click paradigm was developed to test for auditory gating,
where a subject is recorded by EEG as two tones are presented while they lay still with
their eyes closed in an otherwise quiet room. The first tone is the control stimulus which
we will further denote as S1; the second click is the test stimulus which will further be
denoted S2. S1 is presented at least 8 seconds from any previous S1 to allow the neural
system to recover towards its steady state (Boutros and Belger, 1999), while S2 is
presented 0.5 seconds after S1. The 500 millisecond S1 to S2 interval has been shown to
best discriminate between healthy and clinical populations (i.e. schizophrenics). The
transient effects from these stimuli produce a change in the ongoing brain activity that
cannot be readily observed in the unfiltered EEG signal. It was discovered that by
averaging each single trial, over many trials, the post-stimulus components of the signal

5
that contain similar properties are additive while the background components are reduced
in amplitude. The waves brought about by this technique are known as evoked response
potentials (ERPs) or simply evoked potentials (EPs). It is comparison of post-S1 to post-
S2 transient signals that the strength or amount of sensory gating is most commonly
described using a ratio of amplitudes. Utilizing a paired click paradigm, gating is
operationally defined as the ratio of the amplitude of the response to the S2 stimulus to
the amplitude of the responses to the S1 stimulus, multiplied by 100 (Boutros and Belger,
1999). A lower number reflects stronger attenuation of irrelevant input and thus clinically
indicates a better gating capability. Despite the repeated demonstration of abnormal
gating in psychiatric disorders, the neural networks that mediate this complex function
and the nature of the interactions among the different anatomical components that
facilitate gating are not well-defined (Korzyukov et al., 2007).
Evoked potentials recorded at the scalp following auditory stimulation contain a
temporal sequence of three major components: positive (P50), negative (N100), and
positive (P200) deflections, occurring at ~50 ms, ~100, and ~160 ms, respectively
(Buchsbaum 1977). ERPs contain components that are both phase and time-locked to the
stimulus. By definition, the second positive deflection that occurs between 35
milliseconds and 75 milliseconds post-stimulus is termed the P50. The P50 is usually
considered a pre-attentive component of ERPs because it occurs before the sound is
acknowledged in conscious thought. The first negative deflection after the P50, occurring
between 85 milliseconds and 135 milliseconds post-stimulus, is the N100. The next
positive deflection after the N100, occurring between 150 milliseconds and 250
milliseconds post-stimulus, is termed the P200. The P50, N100 and P200 are grouped as

6
mid-latency auditory evoked potentials (MLAEPs), adopting the terminology introduced
by Roth and Horvath (1980). The MLAEPs have been extensively used to study
information processing. Each MLAEP is suppressed in gating experiments with normal
subjects by stimulus repetition. The phase-locked component of an ERP is what creates
the increase in wave amplitude. To establish an ERP the single trial responses are
averaged. At time-locked points (i.e. ~50 ms, ~100 ms, and ~200 ms) the similarity in
phase creates an increase in wave amplitude at specific latencies while all other signal
characteristics are averaged out.
Sensory gating when the inter-stimulus interval is 0.5 seconds has been most
widely studied due to its clinical relevance. For example, the gating deficit in
schizophrenia patients is manifested by a reduced suppression in the P50 (Franks et al.,
1983; Adler et al., 1982; Boutros et al., 2004; Hong et al., 2004) and N100 components
(Freedman et al., 1983; Young et al., 2001; Boutros et al., 2004; Brockhous-Dumke et al.,
2008) of the auditory evoked potentials compared to healthy populations (Bramon, Rabe-
Hesketh, Sham, Murray and Frangou, 2004; Heinrichs, 2004). Deficits in sensory gating
have been demonstrated in a number of psychiatric disorders including post-traumatic
stress disorder (Ghisolfi et al., 2004), panic disorder (Ghisolfi et al., 2006; Ludewig et al.,
2002, 2005), bipolar disorder (Franks et al., 1983; Maier et al., 2006; Hall et al., 2008;
Sanchez-Morla et al., 2008), traumatic brain injury (Arciniegas et al., 2000; Knight et al.,
1999) and migraine (Ambrosini et al., 2001). Sensory gating deficits in patients with
psychiatric disorders represent a debilitating aspect of their disorder.

7
2.2 - Sensory Gating Deficit and Schizophrenia
While this study does not directly address sensory gating abnormalities in a
psychiatric population, the development of psychotic symptomatology is important to
appreciate the significance of understanding the neural substrates of gating (Grunwald et
al., 2003). As mentioned above, gating abnormalities have been demonstrated in a
number of psychiatric disorders, but it has been most extensively examined in
schizophrenia and related disorders (Franks et al., 1983). Evidence for a sensory gating
deficit in schizophrenia patients has been accumulating for almost three decades (Adler et
al., 1982; Boutros et al., 2004; Thoma et al., 2006). In recent meta-analyses, gating of the
P50 response was found to be strongly associated with schizophrenia (Bramon et al.,
2004; Heinrichs, 2004) and the magnitude of the deficit is similar to the most robust
findings reported in neuroimaging and neuropsychology studies of schizophrenia.
Moreover, P50 gating deficits have been shown in non-affected first-degree relatives of
schizophrenia patients (Siegel, Waldo, Mizner, Adler, and Freedman, 1984), in individuals
who are at risk for developing the disorder (Cadenhead, Light, Shafer and Braff, 2005),
and in schizophrenia spectrum disorders like in schizotypal personality disorder
(Cadenhead, Light, Geyer and Braff, 2000). Finally, significant heritability of P50
(Young, Waldo, Rutledge and Freedman 1996), and N100 (Anokhin, Vedeniapin, Heatha,
Korzyukovb and Boutros 2007) gating in monozygotic twins have also been demonstrated.
It is possible that deficient gating of the auditory P50 evoked potential is a possible
endophenotype for psychosis or psychosis vulnerability (Boutros et al., 2002; 2006).

8
In gating experiments, the N100 amplitude deficit tended to be limited to patients
and not to their relatives (Waldo, Adler, and Freedman 1988). Relatives with abnormal
P50 gating had N100 amplitudes that were larger than normal, suggesting a
compensatory process that is effective in relatives but fails in patients. The investigation
of N100 gating represents a new, promising avenue in schizophrenia research. Clementz
and Blumenfeld (2001) and Boutros et al. (2004) found the N100 amplitude and gating to
be abnormal in schizophrenia patients. Hanlon et al. (2005) using MEG, found distinct
M50 and M100 (neuromagnetic equivalents of P50 and N100) abnormalities in
schizophrenia patients. Such an increase in the N100 amplitude has also been reported in
healthy subjects who are at an increased risk for developing Alzheimer’s Disease
(Boutros, Torello, Burns, Wu and Nasrallah, 1995). Kisley, Davalos, Engleman, Guinther,
and Davis (2005) provided evidence of decline in the N100 gating with aging. They
proposed that this decline may be mediated via age-related decline in function of the pre-
frontal cortex.
Deficient P200 gating may also be age-related; however, gating of the P200
remains largely unexamined. The P200 component has not been extensively examined in
psycho-pathological populations. The P200 is dissociable experimentally (Ford,
Mathalon, Kalba, Marsh and Pfefferbaum 1999), developmentally (Oades, Dittmann-Balcar
and Zerbin, 1997) and topographically (Roth, Ford, Lewis and Kopell 1976) from the
N100 component. A review of available evidence suggests that the P200 component is an
independent component with different determinant than the preceding, and much more
extensively examined, N100 or subsequent endogenous components like the P300. In
terms of gating, a P200 gating deficiency as the sole gating problem in a group of healthy
9
elderly individuals has been reported (Boutros et al., 2000). Also, more recently reported
was a similar finding in a group of treatment resistant epileptic patients (Boutros et al.,
2006). It should be noted that both groups; the elderly and epilepsy patients, are believed
to have an increased susceptibility to developing psychotic symptomatology (Ford et al.,
2001; Holroyd and Laurie, 1999). This paper will examine the mechanisms of gating
through neural synchronization and may relate to all three components of the MLAEP
(P50, N100 and P200).
Finally, the relative contribution of changes in the S1 and S2 amplitude to gating
deficits (Clementz et al., 1997; Clementz and Blumenfeld, 2001; Jansen, Agarwal, Hegde
and Boutros 2003) must also be considered. For example, Olincy and Martin (2005)
report a particularly illustrative report where bipolar patients with and without lifetime
history of psychosis were compared to schizophrenia patients and healthy controls. In this
report, bipolar patients without history of psychosis had an attenuated S1 but without a
gating deficit while bipolar patients with history of psychosis had normal S1 amplitudes
and deficient gating. Schizophrenia patients exhibited both abnormalities. This report
clearly demonstrates the independence of the two abnormalities. Comparing the
frequency of gating deficit between studies where S1 amplitudes were lower in the
patient groups and those studies where this was not the case S1 amplitude, while
significantly contributing to the gating indices, does not completely account for the
resulting gating values (Fuerst, Gallinat and Boutros 2007). Therefore, it is likely that the
interrelationship between the amplitudes of the responses to S1 and S2 stimuli and the
gating indices may be more complex in psychiatric populations where it is possible that
two independent physiological abnormalities are interacting: a deficit in sensory response

10
reflected in lower amplitudes to responses to sensory stimulation (i.e., response to S1)
and gating of the response when the stimulus is repeated (i.e., the further decrease of the
amplitude in response to S2 stimulus) (Adler and Adler, 1989; Moxon, Gerhardt and
Adler, 2003).
2.3 - Oscillatory Activity and Sensory Gating
The contribution of on-going oscillatory activity to the sensory response is now
well established (Jansen et al., 2003; Jansen, Hegde and Boutros, 2004; Makeig et al.,
2002; Makeig, Debener, Onton and Delorme, 2004). Therefore, it is reasonable to model
sensory gating and investigate the role of oscillations in sensory gating. If the phase of
the on-going oscillation is reset by the stimulus, then this phase reset oscillatory activity
can make a significant contribution when the single trials are averaged into an evoked
potential, hence this phase locked activity is usually referred to as evoked activity. For
example, it had been suggested that activity in the 24-48 Hz band, a mixture of high-beta
and gamma band activity, and P50 represent the same phenomenon (Basar Rosen, Basar-
Eroglu and Greitschus, 1987; Clementz et al., 1997). However, recent data from
intracranial microelectrodes suggest the relationship may be more complex (Trautner et
al., 2006).
Changes in gamma and beta activity in response to sensory stimuli are well
studied, in part, due to initial studies by Traub and colleagues in hippocampal slice
models (Traub, Whittington, Buhl, Jefferys and Faulkner, 1999; Whittington, Traub,
Faulkner, Stanford and Jefferys, 1997). They showed a gamma to beta shift in oscillatory

11
activity after tetanic stimuli. Due to the preparation, they were able to determine that the
mechanism for the shift was due to an increase in the after-hyperpolarization and an
increase in the amplitude of excitatory post-synaptic potential amplitude. This gamma to
beta shift has also been demonstrated in-vivo in humans (Haenschel, Baldeweg, Croft,
Whittington and Gruzelier, 2000). Therefore, these oscillations may be related to
fundamental brain processes such as sensory encoding which is necessary for learning,
memory, feature binding and feature extraction (Tallon-Baudry, Bertrand, Delpuech and
Pernier, 1996; Engel and Singer, 1991). Physiological data have indicated that the
inability to gate irrelevant inputs, coupled with difficulty in novelty detection, impairs the
coding at the beginning and ending of discrete events (Knight, Grabowecky and Scabini,
1995).
In addition to these sources of evoked oscillatory activity, oscillatory activity that
is not phase reset does not directly contribute to ERPs because the phase varies from trial
to trial. This type of activity has been termed induced activity. For example, event-related
synchronizations and de-synchronizations (ERS/ERD) can be identified by either band-
pass filtering the signal, squaring the amplitude, and averaging over the trials or by
computing the inter-trial variance by subtracting the mean value of the filtered signal (the
evoked potential) from each trial before computing the mean squared differences. In the
second approach, the ERP is removed and the result is generally referred to as the
induced activity. By definition, the induced activity is a change in the on-going signal
that is time-locked to the signal but not phase locked.
Induced activity in the gamma band was reported by intracranial recordings in
humans (Crone, Boatman, Gordon and Hao, 2001) and monkeys (Brosch, Budinger and

12
Scheich, 2002) but has so far not been observed in scalp recordings. Crone et al. (2001)
found that the induced gamma comprised activity up to 120 Hz (60-120 Hz). Induced
gamma activity is known to start at about the same time as the invasively recorded N100,
but clearly outlasted this component (Trautner et al., 2006). Single trial analysis has
revealed that induced GBA occurred in relatively short bursts (mostly <<100 ms),
indicating that the duration of the induced GBA in the averages originates from
summation effects. These bursts are the reverberation of memory traces and, therefore,
induced gamma might be related to the amplitude of the S2 P50 evoked response (Crone
et al., 2001). Simulations with our system level model of sensory gating will demonstrate
that on-going gamma oscillations suppress the amplitude of the evoked potential.
2.4 - Modeling Sensory Gating
Mathematical models have been designed to study the effects of sensory gating.
Computational models may be used to identify the functional significance of the
contribution of different brain regions to gating (David, Cosmelli and Friston, 2004).
Furthermore, these models also provide a theoretical framework in which competing
hypotheses can be tested in order to guide experimentation. There exist several systems
level models of cortical regions acting as multi-modal oscillators that can mutually
influence the on-going oscillations within each oscillator (Lopes da Silva, Hoeks, Smits
and Zetterberg, 1974; Lopes da Silva, Van Rotterdam, Barts, Van Heusden and Burr, 1976;
Lopes da Silva, Pijn, Velis and Nijssen, 1997; van Rotterdam, Lopes da Silva, Van Den,
Viergever and Hermans, 1982; Hoppensteadt and Izhikevich, 1996; Izhikevich, 1999;
13
Suffczynski, Kalitzin, Pfurtscheller and Lopes da Silva, 2001). Some of these models have
been incorporated into models that investigate evoked potentials (Jansen, Zouridakis and
Brandt, 1993; Jansen and Rit, 1995; Jansen et al., 2003; David, Harrison and Friston,
2005; David et al., 2006; Kiebel, David and Friston, 2006) and lay the foundation for the
systems level modeling utilized in the current project.
The mathematical model developed by Jansen and Rit (1995) is a
neurophysiologically-based model that simulates spontaneous EEG patterns produced by
electrical brain activity. This design built upon a previous lumped parameter model
introduced by Jansen et al. (1993), where it was shown that a transient input can simulate
an ERP. Their original model represented a single cortical column of the cerebral cortex
and was based on still earlier models (Lopes da Silva et al., 1974, 1976; van Rotterdam et
al., 1982) that explored the effect of sensory input on the system. The concept of cortical
columns was first introduced by Mountcastle (1957). He showed that 84 percent of neural
communication occurs between layers of the cortex in a vertical manner, therefore small
regions of the cortex may be considered representative of that region (Mountcastle, 1957,
1997). The strength of the synaptic connections leading to the summation of EPSPs and
IPSPs were the determining factor in the frequency of the output in the single column
model (Jansen et al., 1993). The two-column model was introduced, where inter-column
connectivity constants were included to represent the attenuated synaptic connections
between columns, which had a further effect on frequency output (Jansen and Rit, 1995).
David and Friston (2003) went on to show that the inverse relation of the membrane time
constant to the EPSPs and IPSPs created a very reliable method to alter the model to
simulate a range of frequencies.

14
2.5 - Gamma Band Activity as a Mechanism for Normal Sensory Gating
Development of the two column model (Jansen and Rit, 1995) has provided the
base model used in many projects that explored the dynamic interaction between spatially
distinct brain regions during application of a simulated external stimulus to the system’s
on-going oscillatory state (David and Friston, 2003; David et al., 2005; Suffczynski et al.,
2001; Wendling, Bellanger, Bartolomei and Chauvel, 2000). This property proved
important for the current study of the sensory gating circuit. This gating circuit is
postulated to consist of a hippocampal-temporal-prefrontal configuration (Rosburg et al.,
2009). In our model we assumed one column was located in the superior temporal lobe
and the second column located in the prefrontal cortex. The hippocampal component was
represented as part of the summed, efferent input from other sub-cortical structures to our
cortical columns. We will show that the interaction between cortical columns, when an
induced gamma frequency is present, lowers the amplitude of the evoked potential. This
pre-stimulus gamma activity is a mechanism we propose is an essential component to the
normal function of sensory gating.

15
CHAPTER 3: METHODS
Aim 1: Design a computational model able to simulate EEG with the physiological
frequencies of interest (alpha, beta 1, beta 2, and gamma).
Overview of Methods for Aim 1
In order to design a computational model capable of simulating oscillations at
specific frequencies, reproducibility of Jansen’s two column model was tested before
modification. Then, a sensitivity analysis was performed to identify the values of the
frequency controlling variable (we designate it as ρ) capable of producing EEG with the
desired frequency content (e.g. alpha, beta, and gamma). Time-frequency analysis was
performed on the EEG signal using wavelet transformations to extract frequency content,
and the values of ρ associated with the change were evaluated.
3.1 - Review of Jansen’s Model
Prior lumped parameter mathematical models have been implemented to study the
effects of sensory input in cortical dynamics (Lopes da Silva et al., 1974, 1976; van
Rotterdam et al., 1982). The two-column model developed by Jansen and Rit (1995) was
first tested for reproducibility. The systems level schematic (see figure 1) depicts the
informational flow from the inputs (p(t) and p’(t)) to outputs (y1 minus y2, and y7 minus
y8) for columns 1 & 2, respectively. Communication between columns 1 & 2 (y12 and

16
y13
) connects the two structures. All primes (‘) used throughout this paper indicate
variables and constants consistent with column 2.
Figure 1: System Schematic of Two Column Model. This schematic describes the flow of information throughout Jansen’s two column model, from system input (p(t) and p’(t)) to system output (y1-y2 and y7-y8) and between columns (y12 and y13
). The primes indicate properties of column 2.
The function p(t) represents background neural activity and is introduced as random
white noise, which is mathematically formulated as a uniform distribution of pulses
between 120 and 320 pulses per second (Jansen et al., 1993).
Sigm
hi(t)
Sigm
Sigm
he(t)
he(t)p(t)
C1
C3
C2
C4
Sigm
h’i(t)
Sigm
Sigm
h’e(t)
h’e(t)p’(t)
C’1
C’3
C’2
C’4
y0
y1
y2
y8
y7
y6
hd(t)
K1
y12
h’d(t)
K2
y13

17
Each neural population is modeled by two system blocks. The first block receives
an afferent pulse density of action potentials, then expresses them as an averaged
membrane potential. Hence, the output from these components is the neuronal generation
of post synaptic potentials (PSPs). This process is modeled as an impulse response; its
linear transformation is described by the following equations (reproduced from: van
Rotterdam et al., 1982; Jansen and Rit, 1995):
( ) ⋅
=−
0
at
eeAat
th 00
<≥
tt
for the excitatory population and
( ) ⋅
=−
0
at
ieBbt
th 00
<≥
tt
for the inhibitory population. The constants A (excitatory) and B (inhibitory) limit the
maximum amplitudes of the PSPs. The passive membrane time constant, and all other
spatially distributed delays in the dendritic network, are summed into one lumped
parameter. The reciprocal of the excitatory and inhibitory values of these lumped
representations are denoted by a and b, respectively.
The second system block in the neural population adds non-linearity to the
equations. The function transforms the average membrane potential (from the first block)
into an averaged pulse density of action potentials. This voltage dependent sigmoid
function is mathematically modeled (reproduced from Jansen and Rit, 1995) as follows:

18
( )( )[ ]vvreevSigm −+⋅
=01
2)( 0
The maximum firing rate (e0) limits the pulse density (action potential) output from the
neuronal population. The constants r and v0
To better represent the flow of communication between neural populations
(pyramidal cells and interneurons) within the same cortical columns, the constants C
are the steepness of the sigmoidal
transformation and the PSP for which a 50% firing rate is achieved, respectively.
1
through C4 figure 2 have been incorporated into each column (see for communication
pathways). These connectivity constants indicate the number of synapses from the
interneurons onto the axons and dendrites within the cortical column. In particular, C1 is
the number of synapses made by the feedforward neurons to the dendrites of the
excitatory feedback loop, C2 is relative to the synaptic count of the excitatory feedback
loop onto the dendrites of the feedforward neurons, C3 represents the synaptic count of
the feedforward neurons onto the dendrites of the inhibitory feedback loop, and C4
table 1
accounts for synaptic count of the inhibitory feedback loop onto the dendrites of the
feedforward neurons (Jansen and Rit, 1995). The parameter values for the synaptic
constants were based partially upon histological data obtained from animal studies of
cortico-cortical and cortico-thalamic connections, while experimental simulations
resulted in the parameter values and proportions ( ) that output an EEG-like alpha
signal (Jansen and Rit, 1995).
19
Delayed processing was then accounted for following the assumption that there
exist at least three neural populations involved in stimulus processing between two
cortical columns and the afferent projections which carry information to them (Jansen
and Rit, 1995). The delays were modeled as linear transformations similar to those in the
excitatory case he
(t), but the latency of signal propagation is three times as long. Because
the parameter a is the reciprocal of the time constant, the inverse proportion of a by a
factor of three is sufficient to create the desired latency. This was modeled by the
equations (reproduced from Jansen and Rit, 1995):
( ) ⋅
=−
0
tad
d
detAath 0
0<≥
tt
where,
3aad ≈
The connectivity constants K1 and K2
table 1
attenuate the synaptic delays between columns.
The values for K ( ) are held constant throughout this paper with K1 one order of
magnitude larger than K2
. In this configuration, the system coincides with
neurophysiologic data that suggests an anatomically stronger feedforward connection
from it to the prefrontal cortex than the feedforward connection leading to the sensory
cortex from the prefrontal cortex (Jansen and Rit, 1995).

20
Table 1: Values of model constants. (Reproduced from Jansen and Rit, 1995).
Constant Value Constant Value A 3.25 mV e 2.5 s0
-1
B 22 mV r 0.56 mV-1 a 100 mV -1 v 6 mV0
-1
b 50 mV -1 n 7 a 33 mVd -1 q 0.5 C 135 1 w 0.005 t-1
C 0.8*C2 1 K 120 1 C 0.25*C3 1 K 10 2 C 0.25*C4 1
Neurophysiological Diagram with Systems Level Detail
Figure 2: Neurophysiological Diagram with Systems Level Detail. This cartoon is a quantitative (left) vs. qualitative (right) depiction of column 1 (yellow) & column 2 (blue), respectively. Each column’s three neural populations are situated in their approximate location within the columnar layers. The system inputs are represented in light blue bubbles outside of the columns. The external input is shown entering layer 4. Feedforward neural connections are indicated by green arrows, while feedback connections are red and the delayed inter-column connections are pink. The qualitative grouping of neuronal populations are estimated as consisting of interneurons (square) and/or pyramidal neurons (triangle) which are further estimated as excitatory (E) or inhibitory (IN).

21
3.2 - Model Equations
Each PSP population introduces two non-linear, second-order differential
equations of the form:
( ) ( ) ( ) ( )tyatyatxaAty ⋅−⋅⋅−⋅⋅= 22
which can be rewritten as two first-order differential equations:
( ) ( )tzty =
( ) ( ) ( ) ( )tyatzatxaAtz ⋅−⋅⋅−⋅⋅= 22
where x(t) and y(t) are input and output signals, respectively. The above three equations,
along with the following set of derivations, are reproduced from Jansen and Rit (1995).
These eight sets of differential equations that coincide with the eight neuronal
populations described in the model are as follows:

22
( ) ( )tyty 30 = ( ) ( ) ( ) ( ) ( )tyatyatytySigmaAty 0
23213 2][ ⋅−⋅⋅−−⋅⋅=
( ) ( )tyty 41 = ( ) ( ) ( )[ ]{ ( )} ( ) ( )tyatyatyKtyCSigmCtpaAty 1
241320124 2 ⋅−⋅⋅−⋅+⋅⋅+⋅⋅=
( ) ( )tyty 52 = ( ) ( )[ ]{ } ( ) ( )tybtybtyCSigmCbBty 2
250345 2 ⋅−⋅⋅−⋅⋅⋅⋅=
( ) ( )tyty 96 = [ ] 6
29879 2' yayayySigmaAy ⋅−⋅⋅−−⋅⋅=
( ) ( )tyty 107 = ( ) ( ) ( )[ ] ( ){ } ( ) ( )tyatyatyKtyCSigmCtpaAty 7
21012161210 2'''' ⋅−⋅⋅−⋅+⋅+⋅⋅=
( ) ( )tyty 118 = [ ]{ } 8
21163411 2''' ybybyCSigmCbBy ⋅−⋅⋅−⋅⋅⋅⋅=
( ) ( )tyty 1412 = ( ) ( ) ( )[ ] ( ) ( )tyatyatytySigmaAty ddd 12
2142114 2' ⋅−⋅⋅−−⋅⋅=
( ) ( )tyty 1513 =
( ) ( ) ( )[ ] ( ) ( )tyatyatytySigmaAty ddd 132
158715 2' ⋅−⋅⋅−−⋅⋅=
where y0, y1, y2, y6, y7, y8, y12, and y13
Simulations were run to validate our reproduction of Jansen’s model. To detail a
range of waveforms, we chose to reproduce a
are the eight PSP block outputs. These equations
were encoded into Matlab and solved by numerical integration. Specifically, the Runge-
Kutta-Fehlberg Method derived by Alexander Stanoyevitch (2005) was used to solve the
equations in 1 millisecond time steps.
figure (3) Jansen and Rit published in 1995
which depicted the experimental results for variation of the number of intra-column
synaptic connections. The values for the synaptic connectivity constants were (C1 = 68,
128, 135, 270, 675, and 1350). For this particular experiment they configured the cortico-
cortical dynamics to represent two adjacent columns by setting the intra-column neuronal

23
blocks equal to the inter-column populations, resulting in zero delay. This configuration
was mathematically altered by:
ad
= a
For the first part of Aim 1, it was our intention, by duplicating this published figure, to
validate consistency with the established Jansen model.
3.3 - Procedure for Design of New Model to Simulate Specific Frequencies
For the second part of Aim 1, in order to investigate neuronal response to sensory
stimulus in varying brain states, a redesign of the Jansen model was required. The
objective was the design of a model capable of producing power bands outside of the
alpha frequency range that Jansen’s model was designed to produce. David and Friston
(2003) introduced a modification to the Jansen model that made it capable of broadband
frequency behavior. The procedure entailed an inverse variation of the PSPs and
membrane time constants proportionately. With this in mind, we introduced a single
controlling variable (ρ) to simulate oscillations at specific frequencies. In our model the
constants a and b are the inverse of the membrane time constants, so they were simply
multiplied by the same factor ρ as the PSP controlling parameters A and B. These
alterations were facilitated as follows:

24
𝐴 ∙ 𝜌;
𝐵 ∙ 𝜌;
𝑎 ∙ 𝜌;
𝑏 ∙ 𝜌;
𝑎𝑑 ∙ 𝜌
where,
𝜌 = 𝑓𝑎𝑐𝑡𝑜𝑟 𝑜𝑓 𝑓𝑟𝑒𝑞𝑢𝑒𝑛𝑐𝑦 𝑐𝑜𝑛𝑡𝑟𝑜𝑙
The modified model was then analyzed to acquire the appropriate values of ρ that
resulted in oscillations at specific frequencies that are often associated with human EEG
recordings.
3.4 - Wavelet Transforms for Signal Processing
Wavelet transformations were used to extract EEG frequency content from each
variable trial of 𝜌. The oscillations were also checked for waxing and waning in order to
remain consistent with the original model (Jansen and Rit, 1995). The continuous wavelet
transform (CWT) is defined in Matlab (function name “cwt”) as a function capable of
one-dimensional wavelet analysis, following the equation (reproduced from Daubechies,
1992):

25
𝐶𝑜𝑒𝑓(𝑠,𝑑) = |𝑠|−12 �𝑑𝑡 𝑓(𝑡)𝜓�
𝑡 − 𝑑𝑠
�
where
𝜓(𝑡) = 𝑤𝑎𝑣𝑒𝑙𝑒𝑡 𝑡𝑟𝑎𝑛𝑠𝑓𝑜𝑟𝑚
𝑓(𝑡) = 𝑑𝑖𝑠𝑐𝑟𝑒𝑡𝑒 𝑡𝑖𝑚𝑒 𝑠𝑖𝑔𝑛𝑎𝑙
𝑑 = 𝑝𝑜𝑠𝑖𝑡𝑖𝑜𝑛 𝑖𝑛 𝑡𝑖𝑚𝑒
𝑠 = 𝑠𝑐𝑎𝑙𝑒
The output Coef is the coefficient matrix that contains the energy density from the
transformation (s along time points d). In particular, the complex-Morlet mother wavelet
was employed. The mathematical equation for the complex-Morlet wavelet (reproduced
from Teolis, 1998) as encoded in the Matlab (call name “cmor”) is:
𝜓(𝑡) = (𝜋𝑓𝐵𝑊)−12 �𝑒−2𝑖𝜋𝑓𝑐𝑡𝑒−
𝑡2𝑓𝐵𝑊�
where,
𝑓𝐵𝑊 = 𝑓𝑟𝑒𝑞𝑢𝑒𝑛𝑐𝑦 𝑏𝑎𝑛𝑑𝑤𝑖𝑑𝑡ℎ
𝑓𝑐 = 𝑐𝑒𝑛𝑡𝑒𝑟 𝑓𝑟𝑒𝑞𝑢𝑒𝑛𝑐𝑦
The value used for frequency bandwidth (fBW = 2) was adapted from Farge (1992) and
the value for the center frequency (𝑓𝑐 = 0.8493) was chosen to meet requirements that
maintain mathematical stability during wavelet transformation (Daubechies, 1992). The
Morlet wavelet is a specific waveform (an oscillation modulated by a Gaussian envelope)
with characteristics that have similarity to the EEG signal f(t) (Morup, Hansen and
Arnfred, 2007). The wavelet is stretched and compressed (along predetermined scales) to
measure energy density of oscillations at the specified frequencies. The actual scale –

26
frequency relation was determined in Matlab (call name scal2freq) following the equation
(reproduced from Stark, 2005):
𝑓𝑎 = 𝑓𝑐𝑠 ∙ 𝑓𝑠
where,
𝑓𝑎 = 𝑓𝑟𝑒𝑞𝑢𝑒𝑛𝑐𝑦 𝑎𝑡 𝑠𝑐𝑎𝑙𝑒 𝑎
𝑓𝑠 = 𝑆𝑎𝑚𝑝𝑙𝑖𝑛𝑔 𝑓𝑟𝑒𝑞𝑢𝑒𝑛𝑐𝑦
Evaluation of each of the 102 logarithmically spaced scales (adapted from Rosburg et al.,
2009) generated coefficients that described the energy density extracted from the
oscillation. Higher coefficients depict greater energy density in the corresponding
frequency (Torrence and Compo, 1998). The resulting matrix of coefficients was
depicted on a color-board plot using Matlab (call name “pcolor”), where energy density
was conveyed in a color scheme of relative intensities as a function of time.
3.5 - Determining the Values of 𝝆 to Simulate EEG with Specific Frequencies
Values of ρ were related to corresponding oscillations at specific frequencies.
First we ran 70 trials, sequentially increasing the value of ρ from 0.1 to 7.0 in increments
of 0.1. Each resulting signal was then analyzed by CWT for frequency and intensity
characteristics. For each value of ρ the simulated EEG signal was categorized by its
appropriate frequency band and grouped as follows:

27
Delta (δ) = 2 Hz – 4 Hz
Theta (θ) = 4 Hz – 8 Hz
Alpha (α) = 8 Hz – 12 Hz
Beta 1 (β1) = 12 Hz – 22 Hz
Beta 2 (β2) = 22 Hz – 40 Hz
Gamma (γ) = 40 Hz – 80 Hz
Aim 2: Use the model to identify the impact of changes in the power of on-going
oscillations for different frequency bands on the evoked response to a sensory stimulus.
Overview of Methods for Aim 2
In order to identify the impact of on-going oscillations on the evoked response to
a sensory stimulus, we had to first establish the validity of our model with an external
stimulus applied. We then ran simulations with each particular background frequency,
applied an external stimulus, and then measured the signal response. The simulated ERP
data in specific frequency bands was assessed for possible effects pre-stimulus
oscillations may have on ERP characteristics.

28
3.6 - Procedure for Applying an External Stimulus
The model was first set to reproduce results published by Jansen and Rit (1995).
To represent two cortical columns in the same brain region, the simulation was run with
zero delay between columns (as was performed during the first model reproduction). Six
seconds of spontaneous model activity was simulated before stimulus presentation, to
avoid transient effects on the ERP (Jansen and Rit, 1995). While both columns in the two
column model receive ongoing “background” activity in the form of white noise (p(t)),
the transient input which models the auditory stimulus is applied only to column 1. The
external stimulus was mathematically applied as an impulse function in the following
form (reproduced from Jansen et al., 1993):
wtn
ewtqtP
−⋅
=)(
The resulting waveforms were graphically recorded and compared with the published
finding.
3.7 - Assessing the Change in Power Due to an External Stimulus
Trials were run with oscillations at specific frequencies to assess the difference in
ERP signal characteristics. Low frequency trials were not performed due to a lack of
established literature regarding low frequency contribution to sensory gating. Therefore,
the frequency bands included in this portion of the analysis are alpha, beta 1, beta 2, and
gamma. In order to sufficiently represent an anatomically correct temporal-prefrontal

29
processing scheme, the parameters remained equal to those in table 1 (delay between
columns). While increasing values of ρ (from 0.1 to 7.0 in increments of 0.1) an external
stimulus was applied to each trial. The amplitude and latency of the resulting ERP was
then calculated for each trial.
First, each maximum ERP waveform was isolated. We then measured the latency
from the onset of stimulus presentation to the time of peak ERP amplitude (in
milliseconds):
𝜏𝑀𝑎𝑥 𝐴𝑚𝑝 − 𝜏𝑆𝑡𝑖𝑚
The amplitude was then calculated by subtracting the averaged pre-stimulus EEG signal
(baseline) from the peak ERP value (in millivolts):
𝐸𝑅𝑃𝑀𝑎𝑥 𝐴𝑚𝑝 − 𝐵𝑎𝑠𝑒𝑙𝑖𝑛𝑒 𝐸𝐸𝐺𝑃𝑟𝑒−𝑆𝑡𝑖𝑚
Once these calculations were performed for each trial, the information was grouped into
the aforementioned frequency bands. The mean latency and amplitude for each frequency
band was calculated by summing the individual trial results for each group, then dividing
that value by the number of trials summed. The information was gathered to draw a
conclusion about how the pre-stimulus frequencies relate to the resulting ERP
amplitudes.

30
CHAPTER 4: RESULTS
Aim 1: Design a computational model able to simulate EEG with the physiological
frequencies of interest (alpha, beta 1, beta 2, and gamma).
Overview of Aim 1 Results
In order to design a computational model capable of simulating EEG with specific
frequency content, Jansen’s two column model was first reproduced. Next, since the
variable ρ had the greatest impact on frequency content of the simulated EEG (David and
Friston, 2003), a sensitivity analysis was performed to identify the values ρ capable of
producing EEG with the desired frequency content (e.g. alpha, beta, gamma). Time-
frequency analysis was used to measure the frequency content of the EEG signal. The
values of ρ that produced EEG oscillation at the desired frequencies are reported.
4.1 - Model Reproduces Results of Jansen’s Work
Using the same parameters Jansen and Rit used for their two column model, we
reproduced their experimental simulations (see figures 3 & 4). To reproduce the different
EEG patterns reported by Jansen and Rit, the constant C, representing the number of
synaptic connections within the neural column, was varied and the resulting waveforms
recorded. For each of the six values of C tested by Jansen and Rit (1995), our model
reproduced an EEG signal consistent with the previously published results. For example,
in the case of C1=68 and C1=128, the waveforms were both hyperactive noise. When the

31
constant was set to C1=270 and C1=675 the resulting EEG output was periodic and low
in frequency. The signal became hypoactive at C1=1350. The value that produced a
desired waxing and waning signal in the alpha frequency range was C1
=135.
Original Publication of Model Output I
Simulated Model Reproduction I
Figure 3: Original Publication of Model Output I. As published by Jansen and Rit (1995). This graphical representation of on-going oscillations was used to experimentally determine the number and proportion of inter-columnar axonal and dendritic synapses that result in spontaneous alpha band activity.
Figure 4: Simulated Model Reproduction I. Simulated model reproduction of published result (figure 3). From top to bottom, C=68, C=128, C=135, C=270, C=675, and C=1350. Jansen and Rit (1995) deduced that (C=135) best represented human-like alpha band EEG activity (signal waxes and wanes while oscillating at 10-12 Hz).
32
4.2 - Model Design for Control over Power of On-Going Oscillation
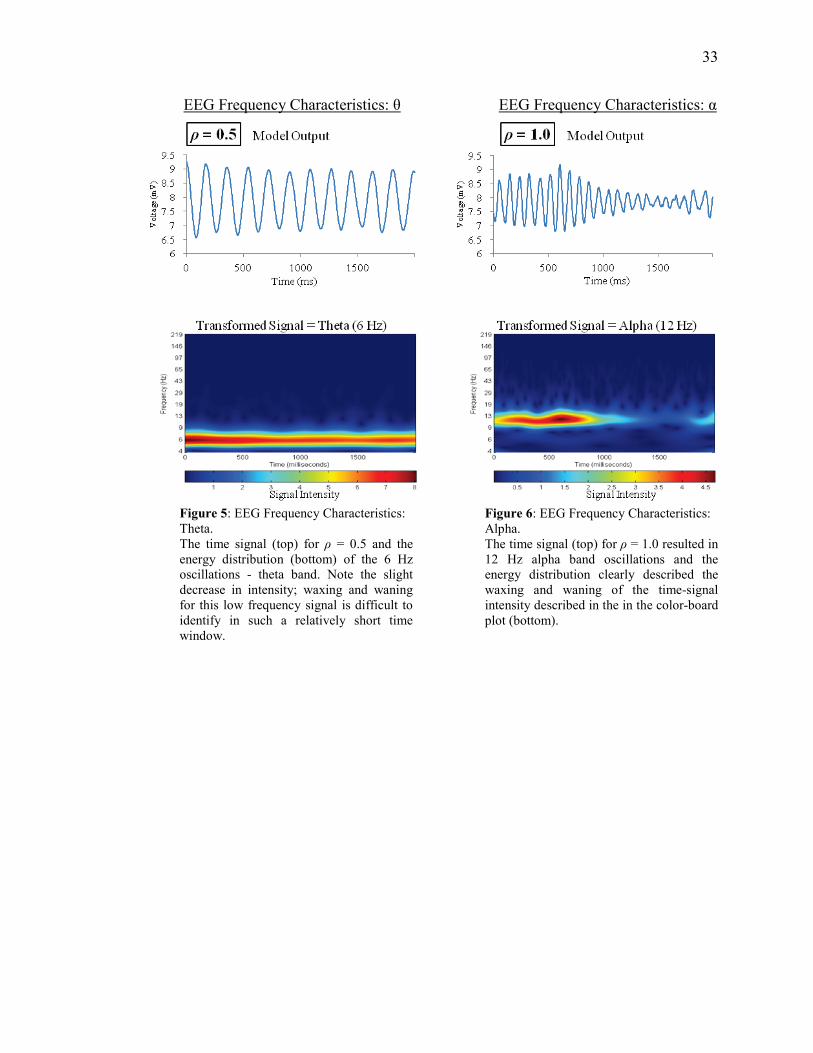
Once we confirmed the reproducibility of the established model, the next
objective was to design a model able to simulate a broad range of EEG frequencies.
David and Friston (2003) described a method of expanding the EEG frequency range of
Jansen’s model by changing neural population kinetics. However, they used a different
set of model parameters than Jansen, which were set to mimic larger (>2) columnar
models. We followed their reasoning by altering the membrane time constant inversely
with the PSPs by a variable ρ, but used the exact same parameters (see table 1) as used by
Jansen and Rit (1995), thereby retaining the properties consistent with Jansen’s two-
column model. When this variable was set to ρ=1, the model was unaltered (alpha band)
and retained all qualities of Jansen’s model. When the factor was reduced below ρ=0.7,
the model’s simulated EEG signal fell to bands below the alpha band, in particular the
delta and theta bands. When the factor was raised above ρ=1, the system’s signal rose to
frequency bands above alpha, particularly into beta and gamma bands. In order to
establish the values of ρ that would provide a user definable model, we transformed the
output signals to the frequency domain for each value of ρ (see figures 5, 6, 7, & 8) and
created table 2 to guide future model simulation. The following four figures were chosen
to represent one of many possible resulting frequencies for each band:
33
EEG Frequency Characteristics: θ
EEG Frequency Characteristics: α
Figure 5: EEG Frequency Characteristics: Theta. The time signal (top) for ρ = 0.5 and the energy distribution (bottom) of the 6 Hz oscillations - theta band. Note the slight decrease in intensity; waxing and waning for this low frequency signal is difficult to identify in such a relatively short time window.
Figure 6: EEG Frequency Characteristics: Alpha. The time signal (top) for ρ = 1.0 resulted in 12 Hz alpha band oscillations and the energy distribution clearly described the waxing and waning of the time-signal intensity described in the in the color-board plot (bottom).

34
EEG frequency Characteristics: β2 EEG frequency Characteristics: γ
Figure 7: EEG frequency Characteristics: Beta2. This result for ρ = 2.5 modifies the oscillations (top) to 27 Hz (beta-2 band). The plot of energy distributions (bottom) depicts waxing and waning of the time-signal intensity.
Figure 8: EEG frequency Characteristics: Gamma. ρ = 4.5 creates 51 Hz gamma band oscillations (top). The plot of energy distributions (bottom) depicts waxing and waning of the time-signal intensity. Note the intensity spikes that are similar to density plots for induced gamma activity (Trautner et al., 2006).
35
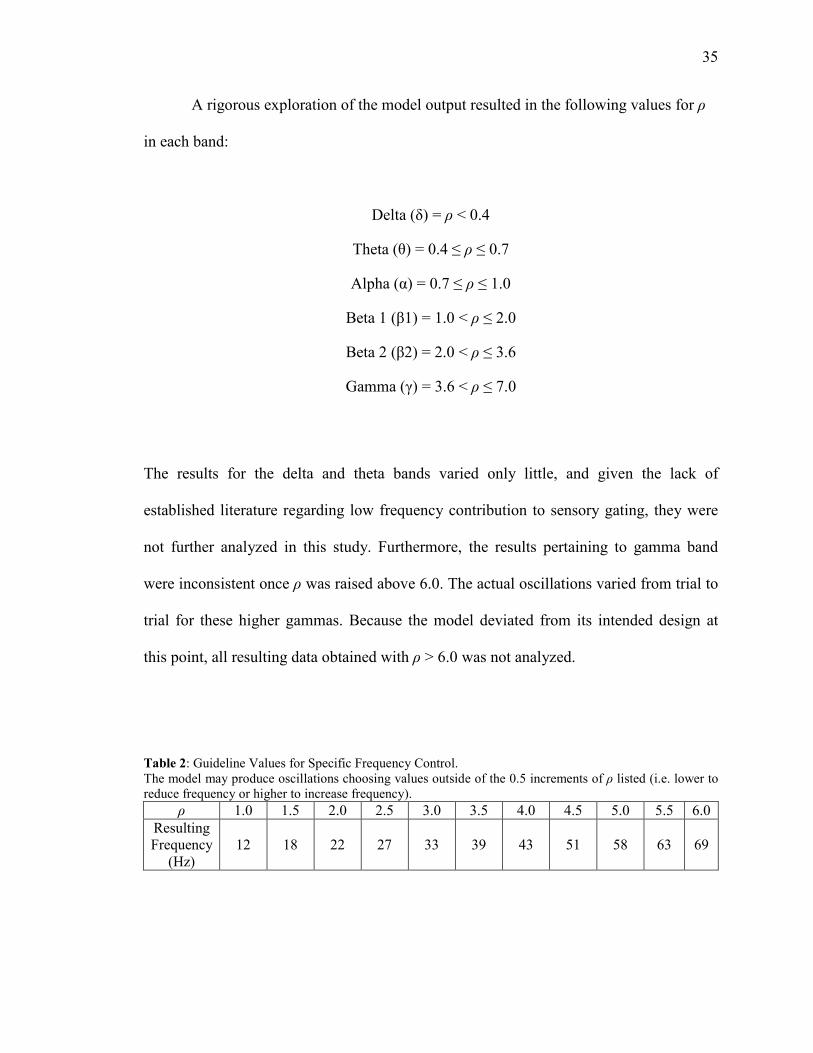
A rigorous exploration of the model output resulted in the following values for ρ
in each band:
Delta (δ) = ρ < 0.4
Theta (θ) = 0.4 ≤ ρ ≤ 0.7
Alpha (α) = 0.7 ≤ ρ ≤ 1.0
Beta 1 (β1) = 1.0 < ρ ≤ 2.0
Beta 2 (β2) = 2.0 < ρ ≤ 3.6
Gamma (γ) = 3.6 < ρ ≤ 7.0
The results for the delta and theta bands varied only little, and given the lack of
established literature regarding low frequency contribution to sensory gating, they were
not further analyzed in this study. Furthermore, the results pertaining to gamma band
were inconsistent once ρ was raised above 6.0. The actual oscillations varied from trial to
trial for these higher gammas. Because the model deviated from its intended design at
this point, all resulting data obtained with ρ > 6.0 was not analyzed.
Table 2: Guideline Values for Specific Frequency Control. The model may produce oscillations choosing values outside of the 0.5 increments of ρ listed (i.e. lower to reduce frequency or higher to increase frequency).
ρ 1.0 1.5 2.0 2.5 3.0 3.5 4.0 4.5 5.0 5.5 6.0 Resulting Frequency
(Hz) 12 18 22 27 33 39 43 51 58 63 69

36
Once an accurate standard for producing desired frequency output was developed,
we produced table 2 to aid the reproduction of our results. Using the table as a guide, we
were able to simulate desired signal oscillations by simply varying ρ accordingly. An
example of simulated oscillations using table 2 values for ρ are graphically represented
below in figure 9.
Figure 9: Simulated Oscillations at Specific Frequencies. This is an example of simulated EEG alpha through gamma band activity using a few chosen values of ρ from table 2.
6
6.5
7
7.5
8
8.5
9
0 50 100 150 200
Am
plitu
de (m
V)
Time (ms)
Simulated Oscillations at Specific Frequencies
12 Hz
18 Hz
22 Hz
27 Hz
33 Hz
43 Hz
51 Hz
58 Hz
37
Aim 2: Apply the modified model to identify the effect that oscillations in specific
frequency bands have on the evoked response to a sensory stimulus.
Overview of Results for Aim 2
In order to identify the impact that changes in the power of on-going oscillations
have on the evoked response to a sensory stimulus we first verified the model reproduced
similar results as Jansen’s model when a stimulus was applied to on-going alpha
oscillation. Then simulations were run with different on-going oscillation with specific
frequency content and an external stimulus was introduced. Finally, we measured the
impact of changing the frequency content of the on-going oscillations on the amplitude of
the resulting simulated evoked response potential (ERP).
4.3 - Reproduction of Jansen’s Model with External Stimulus
Jansen’s simulations of an evoked response were successfully reproduced (see
figures 10 & 11). His purpose for the figure required two columns in close proximity, so
we set the delay between columns to zero and obtained a similar graphical representation
of the simulations (Jansen and Rit, 1995). As shown in the figure below, both columns
elicit a response to the external stimulus applied to column 1. The input from column 1
into column 2 with their interconnectivity constants set to K1 one order of magnitude
larger than K2 was sufficient to provide enough information to column 2 to produce an
evoked potential, yet feedback to column 1 did not saturate the system.

38
Original Publication of Model Output II
Simulated Model Reproduction II
Figure 10: Original Publication of Model Output II. Published result from Jansen and Rit, 1995. These simulations were run, with identical column parameters, for 6 seconds before applying an external stimulus to column 1 only (stimulus occurred at 500 ms). The intra-column neural populations are configured with zero delay (ad
=a) to represent close columnar proximity.
Figure11: Simulated Model Reproduction II. For validation, our model was set to replicate the published results (figure 10). As compared to figure, note the nearly identical signal waveform patterns and oscillating voltage values.
39
4.4 - Applied Stimulus across Frequency Bands
Once the model was verified as consistent with published results, simulations
were conducted (see figure 12) to explore the effects of an external stimulus applied to
various frequency bands as produced in Aim 1. All constants remained set to the values
in table 1. In this configuration the model was then assumed to represent two columns in
separate brain regions (i.e. temporal and pre-frontal) and thus better emulated the sensory
gating circuit. The figure (12) below graphically depicts eleven different outcomes,
labeled by their corresponding frequencies. The EPSP and IPSP outputs were included
with the EEG responses to better describe the underlying contributions of the neural
system to the overall response found in EEG recordings.

40
Simulated Evoked Response Potentials
Figure 12: Simulated Evoked Response Potentials. An external stimulus was applied at time zero to the neural system while oscillating at specific frequencies (legend above each graph). The EPSP (top) and IPSP (middle) oscillations indicate underlying dynamics contributed by the excitatory and inhibitory neuronal populations, respectively. The maximum amplitude and latency occurring in the post-stimulus EEG waveform (bottom) were recorded for each specific frequency.
15
20
25
30
35
40
0 50 100 150 200
Am
plitu
de (m
V) EPSP
12 Hz 18 Hz 22 Hz 27 Hz 33 Hz 43 Hz 51 Hz 58 Hz
5
10
15
20
25
30
0 50 100 150 200
Am
plitu
de (m
V) IPSP
12 Hz 18 Hz 22 Hz 27 Hz 33 Hz 43 Hz 51 Hz 58 Hz
2468
10121416
0 50 100 150 200
Am
plitu
de (m
V)
Time (milliseconds)
ERP12 Hz 18 Hz 22 Hz 27 Hz 33 Hz 43 Hz 51 Hz 58 Hz

41
4.5 - Assessment of Signal Response to External Stimulus
A stimulus was applied to the ongoing EEG signal for each frequency band. The latency
from the time of stimulus to the peak of the first positive wave decreased as the frequency
of the pre-stimulus EEG signal increased (figure 12, bottom). Both the EPSP and IPSP
peak response time also varied inversely to increased frequency. However, the crest of
the IPSP response to each stimulus was spread across a larger time period than was the
crest of the EPSP response, so there was no immediate overlapping of the PSP peaks. The
frequency dependent difference in peak EPSP and IPSP waveform characteristics was
apparent (figures 13 & 14). As the pre-stimulus frequency increased there was an
increase in concurrent peak EPSP and IPSP occurrence. The complete co-incidence of
these two responses occurred solely within the gamma band (figure 12, top & middle),
resulting in a decreased evoked response amplitude (figure 12, bottom). Hence, as the
pre-stimulus EEG was increased to gamma band oscillations, the ERP amplitude (values
listed in table 3) decreased significantly.

42
Figure 13: Mean ERP Latency. The mean latency from the moment of stimulus to the peak ERP amplitudes revealed a steady decrease in latency as the frequency increased.
Figure 14: Mean ERP Amplitude. The mean ERP amplitudes from baseline to maximum waveform, shown across frequency bands. Note the dramatic decrease in the ERP amplitude due to pre-stimulus gamma band oscillations.
Table 3: ERP Waveform Characteristics by Frequency Band. The data from each trial was averaged within each frequency band.
Frequency Band Mean Latency (ms) Mean Amplitude (mV)
Alpha 50 6.6 Beta 1 45 7 Beta 2 39 7
Gamma 34 4
5045
3934
0
10
20
30
40
50
60
Alpha Beta 1 Beta 2 Gamma
Late
ncy
(ms)
Mean Frequency Band
Mean ERP Latency
6.6 7 7
4
0.01.02.03.04.05.06.07.08.0
Alpha Beta 1 Beta 2 Gamma
Am
plitu
de (m
V)
Mean Frequency Band
Mean ERP Amplitude

43
CHAPTER 5: DISCUSSION Overview
Specific aims were developed in order to investigate our hypothesis that on-going
oscillations may contribute to the second ERP in sensory gating paradigms. In developing
our approach, careful consideration was given to the methods chosen to test our
hypothesis. The limitations and assumptions of our methods were accounted for and
future research proposed.
5.1 - Design Considerations
To test our hypothesis, we needed to investigate the neural dynamics in the
sensory gating circuit. The gating circuit is thought to consist of three distinct brain
regions: the hippocampus, the pre-frontal cortex, and the superior temporal gyrus
(Rosburg et al., 2009). Models are often employed to investigate underlying neural
interactions and consideration was given to which type would best support the assessment
of our hypothesis. In particular, many studies have introduced models specifically
designed to investigate sensory gating. Categorically, three model types seemed most
applicable for our purpose.
Animal models have been used to describe inhibitory auditory gating within the
temporal-hippocampal complex (Moxon and Chapin, 1999). Animal studies provide
valuable insight since the system tested is a true representative of neural interactions. For
our purpose the animal model was ruled out because of the inability to manipulate

44
neuronal populations. For example, we increased the amplitude of PSPs and decreased
the membrane time constants in our model. This type of manipulation may be
accomplished in animal studies with pharmacology, but side effects must then be
accounted for and dealt with accordingly (Moxon and Chapin, 1999). The objective of
our model design included the ability to specifically control oscillation frequencies, so
the animal model was not considered further. We then looked to computer models.
Integrate-and-fire neuron models are well established and have been developed
specifically to simulate auditory evoked response potentials (Moxon et al., 2003; Flach
[Moxon] et al., 1996). These previous computational models simulated gating dynamics
of cell populations in the CA3 region of the hippocampus. These single-cell models can
be expanded to replicate large populations and are sometimes configured to represent
Hebbian cell assemblies (Moxon et al., 2003). Integrate-and-fire modeling is well suited
to investigate underlying neural mechanisms that modulate evoked responses during
sensory gating. Unfortunately, the output from integrate-and-fire models consists of a
neural firing rate rather than PSPs. Since controllable EEG with specific frequencies was
the main design goal for our model, we explored another type of computational model.
Computational models that mimic non-linear cortico-cortical dynamics have been
firmly established in literature. These neural mass models have been used in studies of
sensory processing for almost four decades, beginning with the single cortical column
model. (Lopes da Silva et al., 1974; van Rotterdam et al., 1982; Jansen and Rit, 1995;
Wendling et al., 2000). This type of model reduces computational complexity by
assuming that populations of neurons, which perform similar tasks in similar areas of the
cortex, may be grouped together and accounted for as if they were only one functional
45
component. This is referred to as a lumped parameter model. Three neural populations
account for cortical processing within each column. One population represents
feedforward excitatory pyramidal cells that receive and transmit information from
internal and external neural states. The other two populations are representative of
interneurons (pyramidal, basket, and stellate cells). One population is excitatory and one
is inhibitory, and these two represent columnar feedback and informational processing
(Suffczynski et al., 2001). In this lumped parameter model, large groups of neurons may
be accounted for. The single cortical column model was adapted several times since its
introduction. One study modified it to output EEG-like alpha band signals and to study
effects of ERPs (Jansen et al., 1993). Two years later, the single column model was
expanded to two columns where neural dynamics in separate brain regions could be
explored (Jansen and Rit, 1995). Further expansion of the model resulted in increased
cortical columns and indicated a procedure that produced oscillations in a broad range of
frequencies (David and Friston, 2003; David et al., 2005). This model fit our criteria for
model design. The neural dynamics of The Jansen model was anatomically representative
of the sensory-prefrontal cortical system. We were confident in reproducibility of the
Jansen model, so chose it as a base for our design. A signal processing technique was
then considered for the sensitivity analysis.
Both continuous and discrete wavelet transforms (CWT & DWT) were considered
for the analysis. The DWT is excellent for fast computation and its ease of interpretation
(Rosso, Martin and Plastino, 2002; Samar, Bopardikar, Rao and Swartz, 1999). On the
other hand, conservation of energy associated with CWT ensures that all information in a
signal is retained and, for that reason, is the preferred for signal analysis when applicable
46
(Farge, 1992; Stark, 2005). CWT and the complex-Morlet mother wavelet are often
employed in current studies of the neuro-electric waveform (Spencer, Niznikiewicz,
Shenton and McCarley, 2008; Morup et al., 2007) and more specifically for signal analysis
in sensory gating paradigms (Rosburg et al., 2009; Trautner et al., 2006). Furthermore,
the Morlet wavelet’s complex nature retains both energy density and oscillatory phase
information, and contains pertinent information capable of indicating instantaneous
frequencies (Farge, 1992). Some drawbacks of the CWT are that it is much more
computationally intensive and time-consuming than the DWT, but for our limited data set
these constraints were not a valid concern. The transforms were used to extract the
frequency content of the simulated EEG and the information was interpreted by plotting
the resulting energy distributions.
5.2 - Limitations
Assumptions were made to simplify the model as much as possible without losing
pertinent dynamic behavior that characterized the neural state. The “lumping” of state
variables in the neural mass model is based on the assumption that individual cell
contributions within the same physiological location act globally to perform tasks. The
neural mass model acts upon the premise that because individual cellular processes are
extremely complex and can be represented as a functional group, it is unnecessary to
model the individual cellular dynamics in a cortical column. This represents a limitation
of the model. For example, if a change in the characteristics of a particular type of neural
cell were required for a study, lumped parameter modeling would be insufficient to
describe how that individual cell’s contribution may affect the population’s functional

47
behavior. For our objective, the lumping of parameters to study how population dynamics
contribute to the generation of PSPs was a valid assumption. However, further
assumptions were required to validate our experimentation.
In order to investigate dynamic neural contributions to S2 ERP suppression, we
assumed that the simulated EEG at specific frequencies was the component left over from
the S1 response. As a representative oscillation, each pre-stimulus frequency was
considered to be a particular post-S1 induced activity. In this manner we were able to
study the effect that on-going, post-S1 oscillatory activity had on the system response to
an external stimulus. The underlying dynamics of pre-S2 oscillatory activity left over
from the post-S1 response may one day be established and reasonably modeled. In
addition to the simulation limitations our model has structural constraints.
Our model was assumed to represent the sensory gating circuit, mainly
represented by two columns in two separate brain areas which were representative of the
pre-frontal and temporal regions of the cortex. To support this claim, we adapted the
configuration directly from an existing study to remain consistent with established
literature. Since the hippocampus is known to significantly contribute to informational
processing during sensory gating, its inclusion in our model was accounted for. However,
the hippocampal component was grouped with afferent input from all sub-cortical brain
structures and simply mixed in as background noise. Therefore, the component provided
no operational duties in processing information. This limited our model of the sensory
gating circuit to two functional structures. To provide validation, we assumed that the
underlying dynamics in our model sufficiently describe the effect that on-going system
behavior has on the generation of PSPs.

48
5.3 - Future Research
This work provides a computational model that may be used to further assess the
mechanisms of sensory gating. It is proposed that the model may be expanded to include
interaction with an integrate-and-fire model. In our current model, each population of
neurons consists of two components. The first receives input in the form of an averaged
pulse density of action potentials and the second takes that input and transforms the
information into an average membrane potential. An integrate-and-fire hippocampus
model could theoretically be coupled to our cortical model, sending and receiving action
potentials thereby resulting in feedforward and feedback parallel processing. This
configuration may provide a better representation of the temporal-prefrontal-hippocampal
gating circuit and therefore a deeper insight to the neural evolution of sensory gating. A
more robust model may lead to better understanding of underlying neuronal mechanisms
that modulate sensory gating. In addition to computational modeling, in-vivo (i.e. human
or animal) experiments could then be used to describe physiological structures which lead
to post-S1 gamma band activity. A better understanding of the neuronal mechanism that
is responsible for post-S1 gamma band could provide a platform to deduce possible
neural abnormalities responsible for sensory gating deficit. These areas or structures
could then be targeted for therapeutic research (e.g. by pharmacological or electro-
physiological methods).

49
5.4 - Conclusion
The overall objective of this study was to investigate our hypothesis that on-going
oscillations may contribute to the suppression of the second ERP in sensory gating
paradigms. Specific aims were created to guide our investigation. Various modeling and
signal processing techniques were applied throughout this study in order to achieve these
specific aims. Specifically, an established neurophysiological model was reproduced and
then adapted to generate oscillatory activity at specific frequencies. The increase in
oscillation frequency was achieved by effectively increasing the amplitudes of the
excitatory and inhibitory populations while proportionately decreasing the membrane
time constant and dendritic delays. Hence, the neural populations depolarized more often,
thus increasing observed system frequency. An external stimulus was applied to
simulated EEG for each specific frequency. The contributions of underlying neuronal
components that led to the attenuation of ERP amplitude were then investigated. A study
of these dynamics revealed that decreased time delays associated with increased
frequency led to EPSPs and IPSPs becoming co-incidents as the EEG reached the gamma
band range. The coincident EPSP and IPSP effectively lowered the amplitude of the ERP.
These results provide insight into the neural dynamics that lead to attenuation of ERPs.
This supported our original hypothesis and led to the thesis of this study; pre-stimulus
gamma oscillatory activity may be a mechanism that facilitates the suppression of an
evoked response during normal sensory gating. The findings presented in this report,
along with future research, will be useful for the development of a treatment for sensory
gating deficit.

50
REFERENCES Adler, G. & Adler, J. (1989). Influence of Stimulus-Intensity on AEP Components in
the 80-Millisecond to 200-Millisecond Latency Range. Audiology, 28(6), 316- 324.
Adler, L. E., Pachtman, E., Franks, R. D., Pecevich, M., Waldo, M. C., & Freedman, R.
(1982). Neurophysiological evidence for a defect in neuronal mechanisms involved in sensory gating in schizophrenia. Biological Psychiatry, 17, 639-654.
Ambrosini, A. & Schoenen, J. (2001). Neurophysiologic findings and genetics of
migraine: possible links. Confinia Cephalalgica, 10(1-2), 57-60. Anokhin, A. P., Vedeniapin, A. B., Heatha, A. C., Korzyukovb, O., & Boutros, N. N.
(2007). Genetic and environmental influences on sensory gating of mid-latency auditory evoked responses: A twin study. Schizophrenia Research, 89(1-3), 312- 319.
Arciniegas, D. B., Topkoff, J. L., Rojas, D. C., Sheeder, J., Teale, P., Young, D. A., …
Adler, L. E.
(2001). Reduced hippocampal volume in association with P50 nonsuppression following traumatic brain injury. Journal of Neuropsychiatry & Clinical Neuroscience, 13, 213-221.
Basar, E., Rosen, B., Basar-Eroglu, C., & Greitschus, F. (1987). The associations between 40 Hz-EEG and the middle latency response of the auditory evoked potential. International Journal of Neuroscience, 33, 103-117.
Boutros, N. N., & Belger, A. (1999). Midlatency evoked potentials attenuation and
augmentation reflect different aspects of sensory gating. Biological Psychiatry, 45(7), 917-922.
Boutros, N. N., Gelernter, J., Gooding, D. C., Cubells, J., Young, A., Krystal, J. H., & Kosten, T. (2002). Sensory Gating and psychosis vulnerability in cocaine- dependent individuals: Preliminary data. Biological Psychiatry, 51(8), 683-686.
Boutros, N. N., Korzyukov, O., Jansen, B. H., Feingold, A., & Bell, M. (2004). Sensory
gating deficits during the mid-latency phase of information processing in medicated schizophrenia patients. Psychiatry Research, 126, 203-215.
Boutros, N. N., Reid, C., Campbell, D., Petrakis, I., Campbell, D., Torello, M., & Krystal,
J. (2000). Similarities between information processing abnormalities in alcoholics and aging healthy individuals. International Psychogeriatrics, 12(4), 513-525.
51
Boutros, N., Torello, M., Burns, E., Wu, S., & Nasrallah, H. (1995). Evoked potentials in subjects at risk for Alzheimer’s Disease. Psychiatry Research 57, 57-63.
Boutros, N. N., Trautner, P., Korzyukov, O., Grunwald, T., Burroughs, S., Elger, C. E.,
… Rosburg, T. (2006). Mid-latency auditory evoked responses and sensory gating in focal epilepsy. Journal of Neuropsychiatry and Clinical Neurosciences, 18(3), 409-416.
Bramon, E., Rabe-Hesketh, S., Sham, P., Murray, R. M., & Frangou, S. (2004). Meta-
analysis of the P300 and P50 waveforms in schizophrenia. Schizophrenia Research, 70, 315-329.
Brockhaus-Dumke, A., Schultze-Lutter, F., Mueller, R., Tendolkar, I., Bechdolf, A.,
Pukrop, R., Klosterkoetter, J., & Ruhrmann, S. (2008). Sensory gating in schizophrenia: P50 and N100 gating in antipsychotic-free subjects at risk, first-episode, and chronic patients. Biological Psychiatry, 64(5), 376-384.
Brosch, M., Budinger, E., & Scheich, H. (2002). Stimulus-related gamma oscillations in
primate auditory cortex. Journal of Neurophysiology, 87, 2715-2725. Buchsbaum, M. S. (1977). The middle evoked response components and schizophrenia.
Schizophrenia Bulletin, 3, 93-104. Cadenhead, K. S., Light, G. A., Geyer, M. A., & Braff, D. L. (2000). Sensory gating
deficits assessed by the P50 event-related potential in subjects with schizotypal personality disorder. American Journal of Psychiatry, 157(1), 55-59.
Cadenhead, K. S., Light, G. A., Shafer, K. M, & Braff, D. L. (2005). P50 suppression in
individuals at risk for schizophrenia: The convergence of clinical, familial, and vulnerability marker risk assessment. Biological Psychiatry, 57(12), 1504-1509.
Clementz, B. A., & Blumenfeld, L. D. (2001). Multichannel electroencephalographic
assessment of auditory evoked response suppression in schizophrenia. Experimental Brain Research, 139, 377-390.
Clementz, B. A., Blumenfeld, L. D., & Cobb, S. (1997). The gamma band response may
account for poor P50 suppression in schizophrenia. Neuroreport, 8, 3889-3893. Clementz, B. A., Geyer, M. A., & Braff, D. L. (1998). Poor P50 suppression among
schizophrenia patients and their first-degree biological relatives. American Journal of Psychiatry, 155(12), 1691-1694.
Crone, N. E., Boatman, D., Gordon, B., & Hao, L. (2001). Induced electrocorticographic
gamma activity during auditory perception. Brazier Award-winning article, 2001. Clinical Neurophysiology, 112, 565-582.

52
Daubechies, I. (1992). Ten Lectures on Wavelets. Montpelier, Vermont: Capital City Press, 2nd
Printing.
David, O., Cosmelli, D., & Friston, K. J. (2004). Evaluation of different measures of functional connectivity using a neural mass model. Neuroimage, 21(2), 659-673.
David, O., & Friston, K. J. (2003). A neural mass model for MEG/EEG: coupling and
neuronal dynamics. Neuroimage, 20(3), 1743-1755. David, O., Harrison, L., & Friston, K. J. (2005). Modelling event-related responses in the
brain. Neuroimage, 25(3), 756-770. David, O., Kiebel, S. J., Harrison, L. M., Mattout, J., Kilner, J. M., & Friston, K. J.
(2006). Dynamic causal modeling of evoked responses in EEG and MEG. Neuroimage, 30(4), 1255-1272.
Engel, A. K., & Singer, W. (2001). Temporal binding and the neural correlates of
sensory awareness. Trends Cognitive Science, 5(1), 16-25. Farge, M. (1992). Wavelet Transforms and their Applications to Turbulance. Annual
Review in Fluid Mechanics, 24, 395-457. Flach [Moxon], K. A., Adler, L. E., Miller, C., Bickford, P., Gerhardt, G., & MacGregor,
R. (1996). Sensory Gating in a Computer Model of the CA3 Neural network of the Hippocampus. Biological Psychiatry, 40, 1230-1245.
Ford, J. M., Mathalon, D. H., Kalba, S., Marsh, L., & Pfefferbaum, A. (2001). N100 and
P300 abnormalities in patients with schizophrenia, epilepsy and epilepsy with schizophrenia like features. Biological Psychiatry, 49, 848-860.
Franks, R., Adler, L., Waldo, M., Alpert, J., & Freedman, R. (1983). Neurophysiological
studies of sensory gating in mania: comparison with schizophrenia. Biological Psychiatry 18, 989-1005.
Freedman, R., Adler, L. E., Myles-Worsley, M., Nagamoto, H. T., Miller, C., Kisley, M.,
… Waldo, M. C. (1996). Inhibitory gating of an evoked response to repeated auditory stimuli in schizophrenic and normal subjects. Human recordings, computer simulation, and an animal model. Archives of General Psychiatry, 53, 1114-1121.
Freedman, R., Adler, L. E., Waldo, M. C., & Franks, R. D. (1983). Neurophysiological
evidence for a deficit in the inhibitory pathways of schizophrenics: Comparison of medicated and drug-free patients. Biological Psychiatry 18, 537-551.
Fuerst, D. R., Gallinat, J., & Boutros, N. N. (2007). Range of sensory gating values and
test-retest reliability in normal subjects. Psychophysiology, 44(4), 620-626.

53
Friston, K. J., Penny, W., & David, O. (2005). Modeling brain responses. International Review of Neurobiology, 66, 89-124.
Ghisolfi, E. S., Heldt, E., Zanardo, A. P., Strimitzer, I. M., Prokopiuk, A. S., Becker, J.,
… Lara, D. R. (2006). P50 sensory gating in panic disorder. Journal of Psychiatric Research, 40(6), 535-540.
Ghisolfi, E. S., Margis, R., Becker, J., Zanardo, A. P., Strimitzer, I. M., & Lara, D. R.
(2004). Impaired P50 sensory gating in post-traumatic stress disorder secondary to urban violence. Clinical Neurophysiology, 115(10), 2231-2235.
Grunwald, T., Boutros, N. N., Pezer, N., von Oertzen, J., Fernandez, G., Schaller, C., &
Elger, C. E. (2003). Neuronal substrates of sensory gating within the human brain. Biological Psychiatry, 53(6), 511-519.
Haenschel, C., Baldeweg, T., Croft, R. J., Whittington, M., & Gruzelier, J. (2000).
Gamma and beta frequency oscillations in response to novel auditory stimuli: A comparison of human electroencephalogram (EEG) data with in vitro models. Proceedings of the National Academy of Sciences of the United States of America, 97(13), 7645-7650.
Hall, M. H., Schulze, K., Sham, P., Kalidindi, S., McDonald, C., Bramon, E., … Rijsdijk,
F. (2008). Further evidence for shared genetic effects between psychotic bipolar disorder and p50 suppression: A combined twin and family study. American Journal of Medical Genetics Part B-Neuropsychiatric Genetics, 147B(5), 619- 627.
Hanlon, F. M., Miller, G. A., Thoma, R. J, Irwin, J., Jones, A., Moses, S. N., … Canive,
J. M. (2005). Distinct M50 and M100 auditory gating deficits in schizophrenia. Psychophysiology, 42(4), 417-27.
Heinrichs, R.W. (2004). Meta-analysis and the science of schizophrenia: variant evidence
or evidence of variants?
Neuroscience & Biobehavioral Reviews, 28(4), 379-94.
Holroyd S., & Laurie, S. (1999). Correlates of psychotic symptoms among elderly outpatients. International Journal of Geriatric Psychiatry, 14, 379-384.
Hong, E. L., Summerfelt, A., McMahon, R. P., Thaker, G. K., & Buchanan, R. W.
(2004). Gamma/beta oscillation and sensory gating deficit in schizophrenia. Clinical Neuroscience and Neuropathology, 15(1), 155-159.
Hoppensteadt, F. C. & Izhikevich, E. M. (1996). Synaptic organizations and dynamical
properties of weakly connected neural oscillators. I. Analysis of a canonical model. Biological Cybernetics, 75(2), 117-27.

54
Izhikevich, E. M. (1999). Weakly pulse-coupled oscillators, FM interactions, synchronization, and oscillatory associative memory. IEEE Transactions of Neural Networks, 10(3), 508-526.
Jansen, B. H., & Rit, V. G. (1995). Electroencephalogram and visual evoked potential
generation in a mathematical model of coupled cortical columns. Biological Cybernetics, 73(4), 357-366.
Jansen, B. H., Hegde, A., & Boutros, N. N. (2004). Contribution of different EEG
frequencies to auditory evoked potential abnormalities in schizophrenia. Clinical Neurophysiology 115(3), 523-533.
Jansen, B. H., Zouridakis, G., & Brandt, M. E. (1993). A neurophysiologically-based
mathematical model of flash visual evoked potentials. Biological Cybernetics, 68(3), 275-283.
Jansen, B. H., Agarwal, G., Hegde, A., & Boutros, N. N. (2003). Phase synchronization
of the ongoing EEG and auditory EP generation. Clinical Neurophysiology, 114(1), 79-85.
Kiebel, S. J., David, O., & Friston, K. J. (2006). Dynamic causal modelling of evoked
responses in EEG/MEG with lead field parameterization. Neuroimage, 30(4), 1273-1284.
Kisley, M. A., & Cornwell, Z. M. (2006). Gamma and beta neural activity evoked during
a sensory gating paradigm: effects of auditory, somatosensory and cross-modal stimulation. Clinical Neurophysiology, 117(11), 2549-2563.
Kisley, M. A., Davalos, D. B., Engleman, L. L., Guinther, P. M., & Davis, H. P. (2005).
Age-related change in neural processing of time-dependent stimulus features. Cognitive Brain Research 25, 913-925.
Knight, R. T., Grabowecky, M. F., & Scabini, D. (1995). Role of human prefrontal cortex
in attention control. In H. H. Jasper, S. Riggio, & P. S. Goldman-Rakic (Eds) Epilepsy and the Functional Anatomy of the Frontal Lobe (pp 21-36). New York: Raven Press.
Knight, R. T., Staines, W. R., Swick, D., & Chao, L. L. (1999). Prefrontal cortex
regulates inhibition and excitation in distributed neural networks. Acta Psychologica, 101, 159-178.
Korzyukov, O., Pflieger, M. E., Wagner, M., Bowyer, S. M., Rosburg, T., Sundaresan,
K., … Boutros, N. N. (2007). Generators of the intrcranial P50 response in auditory sensory gating. NeuroImage, 35, 814-826.

55
Lopes da Silva, F. H., Hoeks, A., Smits, H., & Zetterberg, L. H. (1974). Model of brain rhythmic activity. The alpha-rhythm of the thalamus. Kybernetik, 15(1), 27-37.
Lopes da Silva, F. H., Van Rotterdam, A., Barts, P., Van Heusden, E., & Burr, W. (1976).
Models of neuronal populations: the basic mechanisms of rhythmicity. Progress in Brain Research, 45, 281-308.
Lopes da Silva, F. H., Pijn, J. P., Velis, D., & Nijssen, P. C. G. (1997). Alpha rhythms:
noise, dynamics and models. International Journal of Psychophysiology, 26, 237-249.
Ludewig, S., Geyer, M. A., Ramseier, M., Vollenweider, F. X., Rechsteiner, E., &
Cattapan-Ludewig, K. (2005). Information-processing deficits and cognitive dysfunction in panic disorder. Journal of Psychiatry Neuroscience, 30(1), 37-43.
Ludewig, K., & Vollenweider, F. X. (2002). Impaired sensorimotor gating in
schizophrenia with deficit and with nondeficit syndrome. Swiss Medicine Weekly, 132(13-14), 159-65.
Maier, W., Zobel, A., & Wagner, M. (2006). Schizophrenia and bipolar disorder:
differences and overlaps. Current Opinion in Psychiatry, 19(2), 165-170. Makeig, S., Debener, S., Onton J., & Delorme, A. (2004). Mining event-related brain
dynamics.
Trends in Cognitive Sciences, 8(5), 204-210.
Makeig, S., Westerfield, M., Jung T. P., Enghoff, S., Townsend, J., Courchesne, E., & Sejnowski, T. J. (2002). Dynamic brain sources of visual evoked responses.
Science, 295(5555), 690-694.
Mountcastle, V. B. (1957). Modality and topographic properties of single neurons of cat's somatic sensory cortex. J Neurophysiol, 20(4), 408-434.
Mountcastle, V. B. (1997). The columnar organization of the neocortex. Brain, 120 (4),
701-722. Morup, M., Hansen, L. K., & Arnfred, S. M. (2007). A toolbox for multi-channel
analysis of time-frequency transformed event related potentials. Journal of Neuroscience Methods, 161, 361-368.
Moxon, K. A., & Chapin, J. K. (1999). Cortico-thalamic interactions in response to whisker stimulation in a computer model of the rat barrel system. Neurocomputing, 26/27, 809-822.

56
Moxon, K. A., Gerhardt,
G. A., & Adler, L. E. (2003). Dopaminergic modulation of the P50 auditory evoked potential in a computer model of the CA3 region of the hippocampus: its relationship to sensory gating in schizophrenia. Biological Cybernetics, 88(4), 265-275.
Nagamoto, H. T., Adler, L. E., Waldo, M. C., Griffith, J., & Freedman, R. (1991). Gating of auditory response in schizophrenics and normal controls: Effects of recording site and stimulation interval on the P50 wave. Schizophrenia Research, 4, 31-40.
Oades, R., Dittmann-Balcar, A., & Zerbin, D. (1997). Development and topography of
auditory event-related potentials (ERPs): mismatch and processing negativity in individuals 8-22 years of age. Psychophysiology, 34, 677-693.
Olincy, A. & Martin, L. (2005). Diminished suppression of the P50 auditory evoked
potential in bipolar disorder subjects with a history of psychosis. American Journal of Psychiatry, 162(1), 43-49.
Rosburg, T., Trautner, P., Fell, J., Moxon, K. A., Elger, C. E., & Boutros, N. N. (2009).
Sensory gating in intracranial recordings--the role of phase locking. Neuroimage, 44(3), 1041-1049.
Rosso, O. A., Martin, M. T., & Plastino, A. (2002). Brian electrical activity analysis
using wavelet-based informational tools. Physica A, 313, 587-608. Roth, W. T., Ford, J. M., Lewis, S. J., & Kopell, B. S. (1976). Effects of stimulus
probability and task-relevance on event-related potentials. Psychophysiology, 13, 311-317.
Roth, W., & Horvath, T. (1980). Event-related potentials in schizophrenia. Electroenceph
Clinical Neurophysiology, 48, 127-139. Samar, V. J., Bopardikar, A., Rao, R., & Swartz, K. (1999). Wavelet Analysis of
Neuroelectric Waveforms: A Conceptual Tutorial. Brain and Language, 66, 7-60. Sanchez-Morla, E. M., Garcia-Jimenez, M. A., Barabash, A., Martinez-Vizcaino, V.,
Mena, J., Cabranes-Diaz, J. A., … Santos, J. L. (2008). P50 sensory gating deficit is a common marker of vulnerability to bipolar disorder and schizophrenia. Acta Psychiatrica Scandinavica, 117(4), 313-318.
Siegel, C., Waldo, M., Mizner, G., Adler, L. E., & Freedman, R. (1984). Deficits in
sensory gating in schizophrenic patients and their relatives. Evidence obtained with auditory evoked responses. Archives of General Psychiatry, 41(6), 607-612.
Spencer, K. M., Niznikiewicz, M. A., Shenton, M. E., & McCarley, R. W. (2008).
Sensory-Evoked Gamma Oscillations in Chronic Schizophrenia. Biological Psychiatry, 63, 744-747.
57
Suffczynski, P., Kalitzin, S., Pfurtscheller, G., & Lopes da Silva, F. H. (2001). Computational model of thalamo-cortical networks: dynamical control of alpha rhythms in relation to focal attention. International Journal of Psychophysiology, 43(1), 25-40.
Stanoyevitch, A. (2005). Introduction to Numerical Ordinary and Partial
Differential Equations Using MATLAB (p.327). John Wiley and Sons. Stark, H. G. (2005). Wavelets and Signal Processing. New York: Springer Berlin
Heidelberg. Tallon-Baudry, C., Bertrand, O., Delpuech, C., & Pernier, J. (1996). Stimulus Specificity
of Phase-Locked and Non-Phase-Locked 40 Hz Visual Responses in Human. The Journal of Neuroscience, 16(13), 4240–4249.
Teolis, A. (1998). Computational Signal Processing with Wavelets. Boston: Birkhauser. Thoma, R. J., Hanlon, F. M., Moses, S. N., Edgar, J. C., Huang, M., Weisend, M. P., …
Canive, J. M. (2003). Lateralization of auditory sensory gating and neuropsychological dysfunction in schizophrenia. American Journal of Psychiatry, 160, 1595-1605.
Torrence, C., & Compo, G. P. (1998). A Practical Guide to Wavelet Analysis.
Bulletin of the American Meteorogical Society, 79, 61-78. Traub, R. D., Whittington, M. A., Buhl, E. H., Jefferys, J. G. R., & Faulkner, H. J.
(1999). On the mechanism of the gamma → beta frequency shift in neuronal oscillations induced in rat hippocampal slices by tetanic stimulation. Journal of Neuroscience, 19(3), 1088-1105.
Trautner, P., Rosburg, T., Dietl, T., Fell, J., Korzyukov, O. A., Kurthen, M., … Boutros,
N. N. (2006). Sensory gating of auditory evoked and induced gamma band activity in intracranial recordings. NeuroImage, 32, 790-798.
van Rotterdam, A., Lopes da Silva, F. H., van den, E. J., Viergever, M. A., & Hermans,
A. J. (1982). A model of the spatial-temporal characteristics of the alpha rhythm. Bulletin of Mathematical Biology, 44(2), 283-305.
Venables, P. (1964). Input dysfunction in schizophrenia. Progress in Experimental
Personality and Psychopathology Research, 1, 1-47. Waldo, M., Adler, L. E., & Freedman, R. (1988). Defects in auditory sensory gating and
their apparent compensation in relatives of schizophrenics. Schizophrenia Research, 1, 19-24.

58
Wendling, F., Bellanger, J. J., Bartolomei, F., & Chauvel, P. (2000). Relevance of nonlinear lumped-parameter models in the analysis of depth-EEG epileptic signals. Biological Cybernetics, 83(4), 367-378.
Whittington, M. A., Traub, R. D., Faulkner, H. J., Stanford, I. M., & Jefferys, J. G. R.
(1997). Recurrent excitatory postsynaptic potentials induced by synchronized fast cortical oscillations. Proceedings of the National Academy of Sciences of the United States of America,94(22), 12198-12203.
Young, D. A., Smith, M., Rawls, T., Elliott, D., Russell, I. S., & Hicks, P. B. (2001).
N100 evoked potential latency variation and startle in schizophrenia. Neuroreport, 12(4), 767-773.
Young, D. A., Waldo, M., Rutledge, J. H., & Freedman, R. (1996). Heritability of
inhibitory gating of the P50 auditory-evoked potential in monozygotic and dizygotic twins. Neuropsychobiology, 33(3), 113-117.