Gambia Monthly Economic Bulletin March 2010
45
The Gambia Monthly Economic Bulletin- March 2010 THE GAMBIA MONTHLY ECONOMIC BULLETIN 1 March 2010 Institutional Support Project for Economic and Financial Governance (ISPEFG) Ministry of Finance (MOF) The Republic of Gambia The Quadrangle, Banjul, the Gambia 1 The Gambia Monthly Economic Bulletin provides an update on the recent economic developments and policies in the Republic of the Gambia. This Bulletin has been prepared, under the overall guidance of the Honorable Permanent Secretary Mr. Serign Cham, by a research team comprising Tarun Das, Macroeconomic Adviser (ISPEFG), Momodou Taal, Principal Economist; and Ms. Ceesay Chiel, Economist in the Statistics and Special Studies Unit, Ministry of Finance; with key inputs from the Ministry of Finance (MOF), the Central Bank of Gambia (CBG), the Gambian Bureau of Statistics (GBOS), and the Gambian Revenue Authority (GRA). It is needless to point out that the views expressed in this Bulletin solely indicate the views of the Research Team, which need not necessarily imply the views of the MOF, the other budgetary agencies or the organizations they are associated with. Any questions and feedback can be addressed to: Tarun Das ( [email protected]) 1
-
Upload
professor-tarun-das -
Category
Documents
-
view
220 -
download
0
Transcript of Gambia Monthly Economic Bulletin March 2010
8/6/2019 Gambia Monthly Economic Bulletin March 2010
http://slidepdf.com/reader/full/gambia-monthly-economic-bulletin-march-2010 1/45
8/6/2019 Gambia Monthly Economic Bulletin March 2010
http://slidepdf.com/reader/full/gambia-monthly-economic-bulletin-march-2010 2/45
The Gambia Monthly Economic Bulletin- March 2010
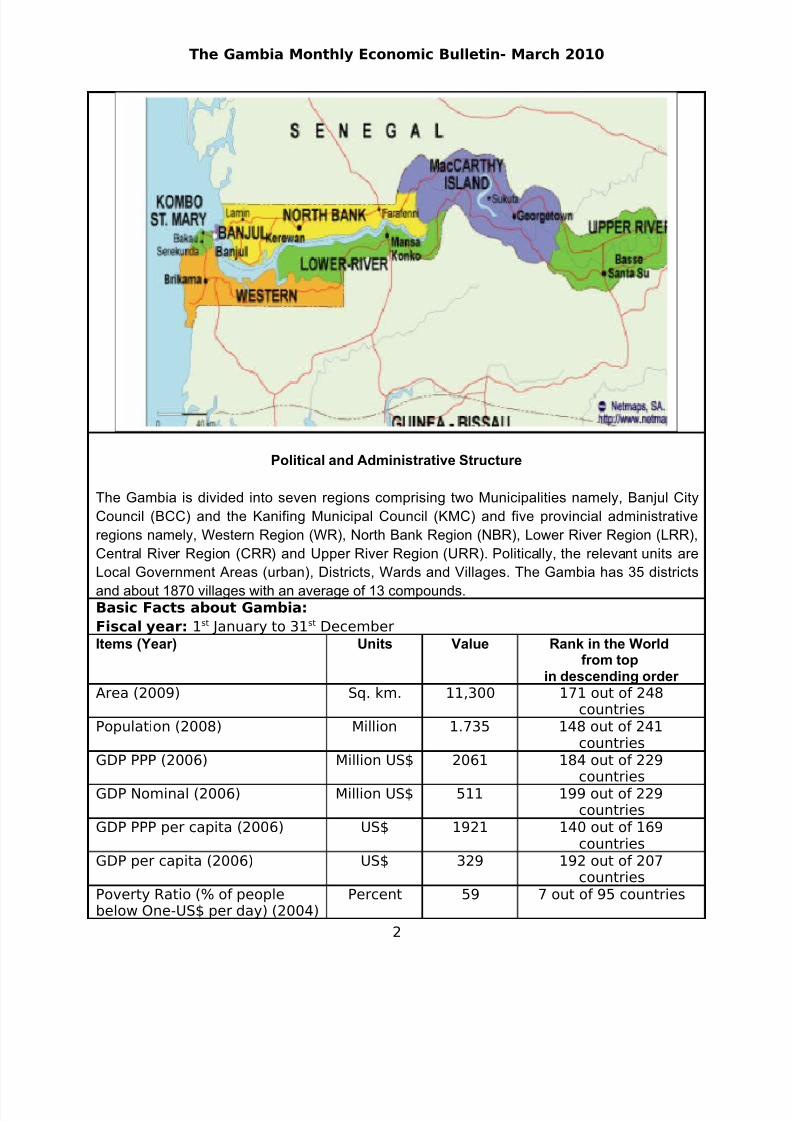
Political and Administrative Structure
The Gambia is divided into seven regions comprising two Municipalities namely, Banjul City
Council (BCC) and the Kanifing Municipal Council (KMC) and five provincial administrative
regions namely, Western Region (WR), North Bank Region (NBR), Lower River Region (LRR),
Central River Region (CRR) and Upper River Region (URR). Politically, the relevant units are
Local Government Areas (urban), Districts, Wards and Villages. The Gambia has 35 districts
and about 1870 villages with an average of 13 compounds.Basic Facts about Gambia:
Fiscal year: 1st January to 31st December
Items (Year) Units Value Rank in the Worldfrom top
in descending order Area (2009) Sq. km. 11,300 171 out of 248
countriesPopulation (2008) Million 1.735 148 out of 241
countriesGDP PPP (2006) Million US$ 2061 184 out of 229
countriesGDP Nominal (2006) Million US$ 511 199 out of 229
countriesGDP PPP per capita (2006) US$ 1921 140 out of 169
countriesGDP per capita (2006) US$ 329 192 out of 207
countriesPoverty Ratio (% of peoplebelow One-US$ per day) (2004)
Percent 59 7 out of 95 countries
2

8/6/2019 Gambia Monthly Economic Bulletin March 2010
http://slidepdf.com/reader/full/gambia-monthly-economic-bulletin-march-2010 3/45
The Gambia Monthly Economic Bulletin- March 2010
Source: http://www.nationmaster.com
3
8/6/2019 Gambia Monthly Economic Bulletin March 2010
http://slidepdf.com/reader/full/gambia-monthly-economic-bulletin-march-2010 4/45
The Gambia Monthly Economic Bulletin- March 2010
4
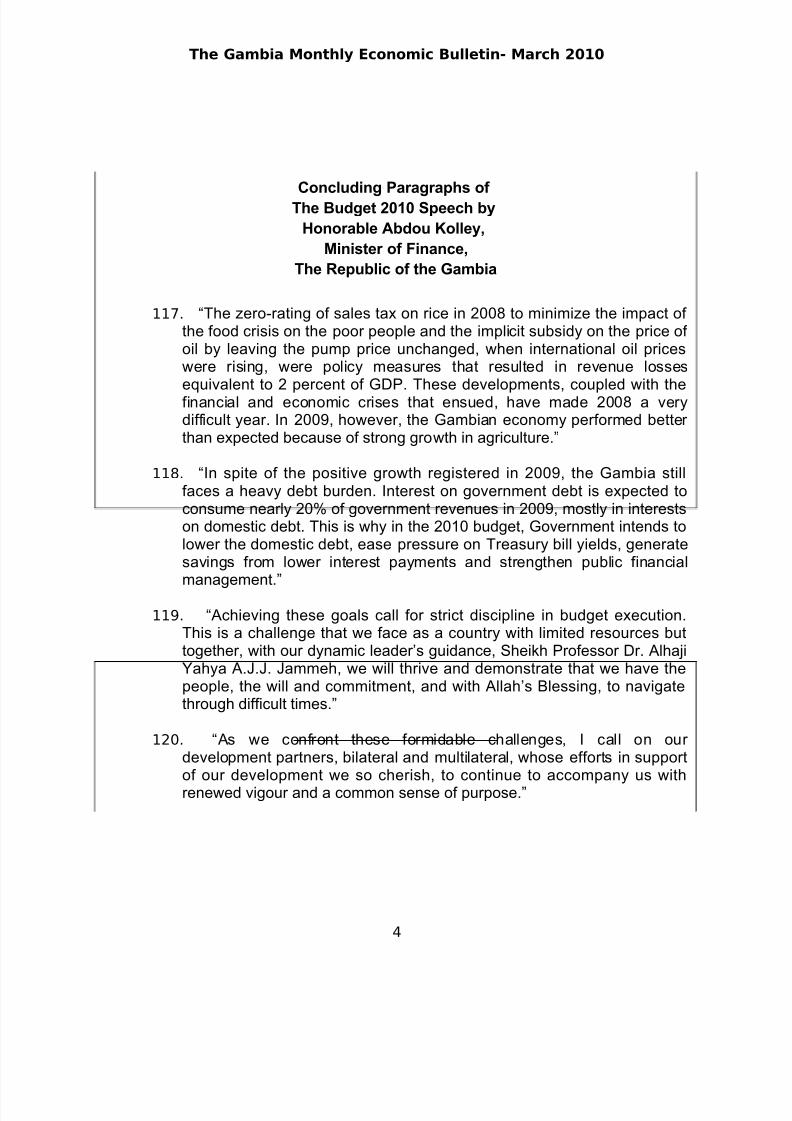
Concluding Paragraphs of
The Budget 2010 Speech by
Honorable Abdou Kolley,
Minister of Finance,
The Republic of the Gambia
117. “The zero-rating of sales tax on rice in 2008 to minimize the impact of the food crisis on the poor people and the implicit subsidy on the price of oil by leaving the pump price unchanged, when international oil priceswere rising, were policy measures that resulted in revenue lossesequivalent to 2 percent of GDP. These developments, coupled with thefinancial and economic crises that ensued, have made 2008 a verydifficult year. In 2009, however, the Gambian economy performed better than expected because of strong growth in agriculture.”
118. “In spite of the positive growth registered in 2009, the Gambia stillfaces a heavy debt burden. Interest on government debt is expected toconsume nearly 20% of government revenues in 2009, mostly in interestson domestic debt. This is why in the 2010 budget, Government intends tolower the domestic debt, ease pressure on Treasury bill yields, generatesavings from lower interest payments and strengthen public financialmanagement.”
119. “Achieving these goals call for strict discipline in budget execution.This is a challenge that we face as a country with limited resources buttogether, with our dynamic leader’s guidance, Sheikh Professor Dr. AlhajiYahya A.J.J. Jammeh, we will thrive and demonstrate that we have thepeople, the will and commitment, and with Allah’s Blessing, to navigatethrough difficult times.”
120. “As we confront these formidable challenges, I call on our development partners, bilateral and multilateral, whose efforts in supportof our development we so cherish, to continue to accompany us withrenewed vigour and a common sense of purpose.”
8/6/2019 Gambia Monthly Economic Bulletin March 2010
http://slidepdf.com/reader/full/gambia-monthly-economic-bulletin-march-2010 5/45
The Gambia Monthly Economic Bulletin- March 2010
Contents
Items Page
Basic Facts about the Gambia 2
Concluding paragraphs of the Budget 2010 Speech by Honorable Abdou
Kolley, Minister for Finance and Economic Affairs
3
Contents 4
ISPEFG Project/ Research Team and Document History 5
Highlights 6-7
At a Glance 8
1. Global Economic Outlook1.1 Global recovery is uneven, weak, slow and painful1.2 Global Commodity Prices and Inflation
9-159
14
2. Current State of the Gambian Economy
2.1 Overall and Sectoral GDP Growth Rates2.2 Consumer Price Index (CPI) and Inflation2.3 Projection of CPI inflation for the year 2010
16-36161820
2.4 Government Fiscal Performance in January 20102.5 Projections of Fiscal Outturn for 20102.6 Domestic Debt and Outstanding Treasury Bills2.7 Treasury Bills Yields2.8 Money Supply2.9 Performance of Commercial Banks2.10 Commercial Banks’ Assets2.11 Commercial Banks’ Liabilities2.12 Interest Rates and Central Bank’s Policy Rates2.13 BOP, Foreign Exchange Reserves and Exchange Rates2.14 Exchange Rates
212325
2627282930313236
3. Recent Policy Developments and Development Issues 3.1 Highlights of the 2010 Budget
3.2 Tax Measures announced in the 2010 Budget3.3 IMF Executive Board Completes Sixth Review of PRGF3.4 Assessment of Quantitative Targets agreed with IMF under PRGF
37-403738
3940
5
8/6/2019 Gambia Monthly Economic Bulletin March 2010
http://slidepdf.com/reader/full/gambia-monthly-economic-bulletin-march-2010 6/45
The Gambia Monthly Economic Bulletin- March 2010
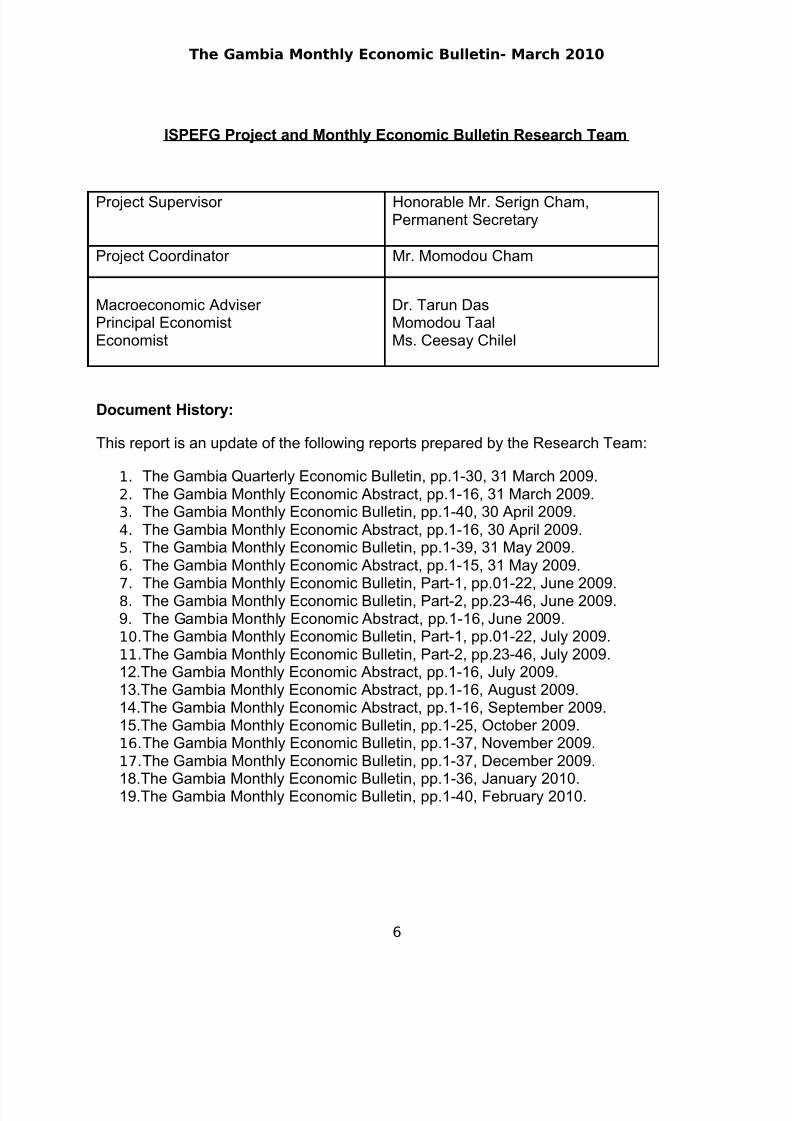
ISPEFG Project and Monthly Economic Bulletin Research Team
Project Supervisor Honorable Mr. Serign Cham,Permanent Secretary
Project Coordinator Mr. Momodou Cham
Macroeconomic Adviser Principal EconomistEconomist
Dr. Tarun DasMomodou TaalMs. Ceesay Chilel
Document History:
This report is an update of the following reports prepared by the Research Team:
1. The Gambia Quarterly Economic Bulletin, pp.1-30, 31 March 2009.2. The Gambia Monthly Economic Abstract, pp.1-16, 31 March 2009.3. The Gambia Monthly Economic Bulletin, pp.1-40, 30 April 2009.4. The Gambia Monthly Economic Abstract, pp.1-16, 30 April 2009.5. The Gambia Monthly Economic Bulletin, pp.1-39, 31 May 2009.6. The Gambia Monthly Economic Abstract, pp.1-15, 31 May 2009.
7. The Gambia Monthly Economic Bulletin, Part-1, pp.01-22, June 2009.8. The Gambia Monthly Economic Bulletin, Part-2, pp.23-46, June 2009.9. The Gambia Monthly Economic Abstract, pp.1-16, June 2009.10.The Gambia Monthly Economic Bulletin, Part-1, pp.01-22, July 2009.11.The Gambia Monthly Economic Bulletin, Part-2, pp.23-46, July 2009.12.The Gambia Monthly Economic Abstract, pp.1-16, July 2009.13.The Gambia Monthly Economic Abstract, pp.1-16, August 2009.14.The Gambia Monthly Economic Abstract, pp.1-16, September 2009.15.The Gambia Monthly Economic Bulletin, pp.1-25, October 2009.16.The Gambia Monthly Economic Bulletin, pp.1-37, November 2009.17.The Gambia Monthly Economic Bulletin, pp.1-37, December 2009.
18.The Gambia Monthly Economic Bulletin, pp.1-36, January 2010.19.The Gambia Monthly Economic Bulletin, pp.1-40, February 2010.
6
8/6/2019 Gambia Monthly Economic Bulletin March 2010
http://slidepdf.com/reader/full/gambia-monthly-economic-bulletin-march-2010 7/45
The Gambia Monthly Economic Bulletin- March 2010
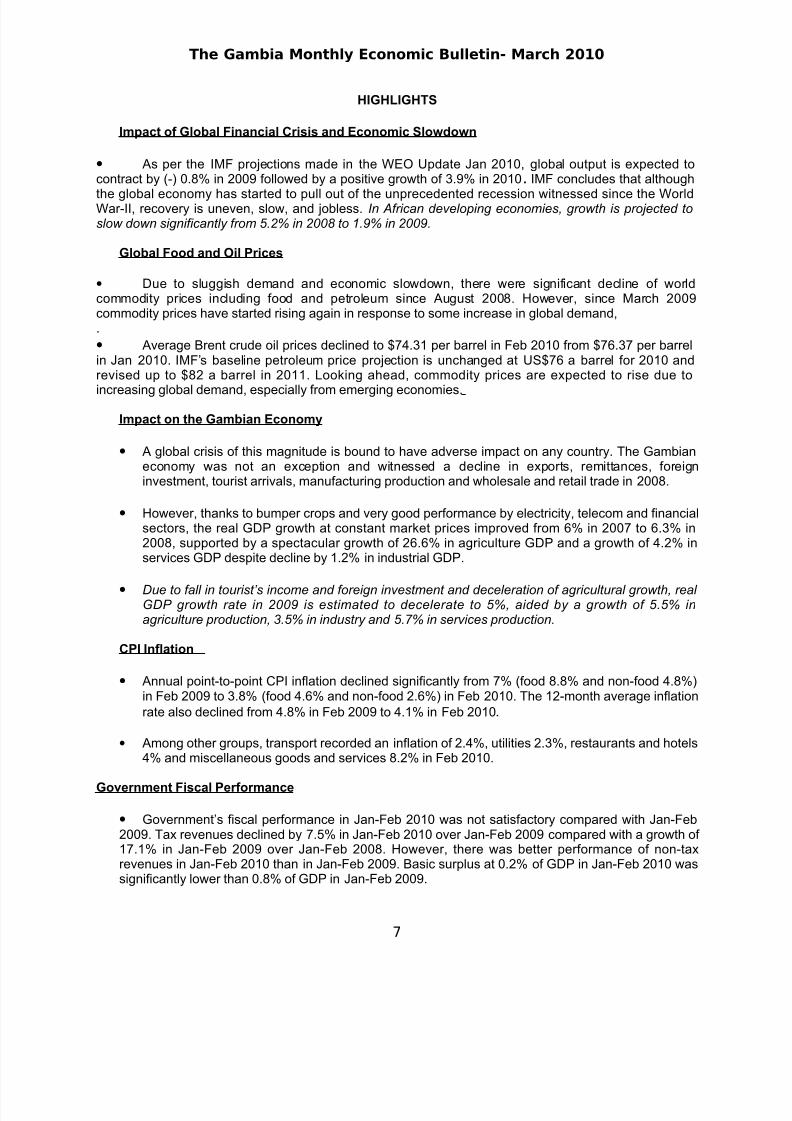
HIGHLIGHTS
Impact of Global Financial Crisis and Economic Slowdown
• As per the IMF projections made in the WEO Update Jan 2010, global output is expected tocontract by (-) 0.8% in 2009 followed by a positive growth of 3.9% in 2010 . IMF concludes that although
the global economy has started to pull out of the unprecedented recession witnessed since the WorldWar-II, recovery is uneven, slow, and jobless. In African developing economies, growth is projected toslow down significantly from 5.2% in 2008 to 1.9% in 2009.
Global Food and Oil Prices
• Due to sluggish demand and economic slowdown, there were significant decline of worldcommodity prices including food and petroleum since August 2008. However, since March 2009commodity prices have started rising again in response to some increase in global demand,.
• Average Brent crude oil prices declined to $74.31 per barrel in Feb 2010 from $76.37 per barrelin Jan 2010. IMF’s baseline petroleum price projection is unchanged at US$76 a barrel for 2010 andrevised up to $82 a barrel in 2011. Looking ahead, commodity prices are expected to rise due to
increasing global demand, especially from emerging economies.
Impact on the Gambian Economy
• A global crisis of this magnitude is bound to have adverse impact on any country. The Gambianeconomy was not an exception and witnessed a decline in exports, remittances, foreigninvestment, tourist arrivals, manufacturing production and wholesale and retail trade in 2008.
• However, thanks to bumper crops and very good performance by electricity, telecom and financialsectors, the real GDP growth at constant market prices improved from 6% in 2007 to 6.3% in2008, supported by a spectacular growth of 26.6% in agriculture GDP and a growth of 4.2% inservices GDP despite decline by 1.2% in industrial GDP.
• Due to fall in tourist’s income and foreign investment and deceleration of agricultural growth, real GDP growth rate in 2009 is estimated to decelerate to 5%, aided by a growth of 5.5% inagriculture production, 3.5% in industry and 5.7% in services production.
CPI Inflation
• Annual point-to-point CPI inflation declined significantly from 7% (food 8.8% and non-food 4.8%)in Feb 2009 to 3.8% (food 4.6% and non-food 2.6%) in Feb 2010. The 12-month average inflationrate also declined from 4.8% in Feb 2009 to 4.1% in Feb 2010.
• Among other groups, transport recorded an inflation of 2.4%, utilities 2.3%, restaurants and hotels4% and miscellaneous goods and services 8.2% in Feb 2010.
Government Fiscal Performance
• Government’s fiscal performance in Jan-Feb 2010 was not satisfactory compared with Jan-Feb2009. Tax revenues declined by 7.5% in Jan-Feb 2010 over Jan-Feb 2009 compared with a growth of 17.1% in Jan-Feb 2009 over Jan-Feb 2008. However, there was better performance of non-taxrevenues in Jan-Feb 2010 than in Jan-Feb 2009. Basic surplus at 0.2% of GDP in Jan-Feb 2010 wassignificantly lower than 0.8% of GDP in Jan-Feb 2009.
7
8/6/2019 Gambia Monthly Economic Bulletin March 2010
http://slidepdf.com/reader/full/gambia-monthly-economic-bulletin-march-2010 8/45
The Gambia Monthly Economic Bulletin- March 2010
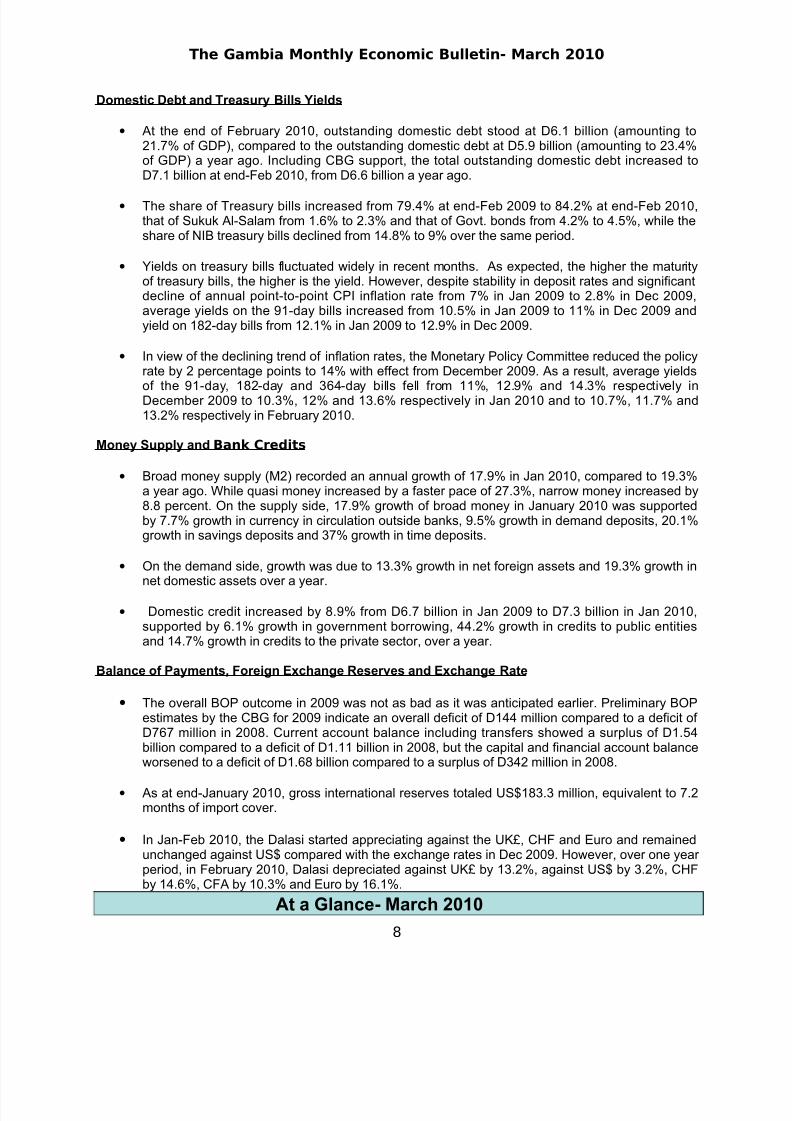
Domestic Debt and Treasury Bills Yields
• At the end of February 2010, outstanding domestic debt stood at D6.1 billion (amounting to21.7% of GDP), compared to the outstanding domestic debt at D5.9 billion (amounting to 23.4%of GDP) a year ago. Including CBG support, the total outstanding domestic debt increased toD7.1 billion at end-Feb 2010, from D6.6 billion a year ago.
• The share of Treasury bills increased from 79.4% at end-Feb 2009 to 84.2% at end-Feb 2010,that of Sukuk Al-Salam from 1.6% to 2.3% and that of Govt. bonds from 4.2% to 4.5%, while theshare of NIB treasury bills declined from 14.8% to 9% over the same period.
• Yields on treasury bills fluctuated widely in recent months. As expected, the higher the maturityof treasury bills, the higher is the yield. However, despite stability in deposit rates and significantdecline of annual point-to-point CPI inflation rate from 7% in Jan 2009 to 2.8% in Dec 2009,average yields on the 91-day bills increased from 10.5% in Jan 2009 to 11% in Dec 2009 andyield on 182-day bills from 12.1% in Jan 2009 to 12.9% in Dec 2009.
• In view of the declining trend of inflation rates, the Monetary Policy Committee reduced the policyrate by 2 percentage points to 14% with effect from December 2009. As a result, average yieldsof the 91-day, 182-day and 364-day bills fell from 11%, 12.9% and 14.3% respectively inDecember 2009 to 10.3%, 12% and 13.6% respectively in Jan 2010 and to 10.7%, 11.7% and13.2% respectively in February 2010.
Money Supply and Bank Credits
• Broad money supply (M2) recorded an annual growth of 17.9% in Jan 2010, compared to 19.3%a year ago. While quasi money increased by a faster pace of 27.3%, narrow money increased by8.8 percent. On the supply side, 17.9% growth of broad money in January 2010 was supportedby 7.7% growth in currency in circulation outside banks, 9.5% growth in demand deposits, 20.1%growth in savings deposits and 37% growth in time deposits.
• On the demand side, growth was due to 13.3% growth in net foreign assets and 19.3% growth innet domestic assets over a year.
• Domestic credit increased by 8.9% from D6.7 billion in Jan 2009 to D7.3 billion in Jan 2010,supported by 6.1% growth in government borrowing, 44.2% growth in credits to public entitiesand 14.7% growth in credits to the private sector, over a year.
Balance of Payments, Foreign Exchange Reserves and Exchange Rate
• The overall BOP outcome in 2009 was not as bad as it was anticipated earlier. Preliminary BOPestimates by the CBG for 2009 indicate an overall deficit of D144 million compared to a deficit of D767 million in 2008. Current account balance including transfers showed a surplus of D1.54billion compared to a deficit of D1.11 billion in 2008, but the capital and financial account balanceworsened to a deficit of D1.68 billion compared to a surplus of D342 million in 2008.
• As at end-January 2010, gross international reserves totaled US$183.3 million, equivalent to 7.2months of import cover.
• In Jan-Feb 2010, the Dalasi started appreciating against the UK£, CHF and Euro and remainedunchanged against US$ compared with the exchange rates in Dec 2009. However, over one year period, in February 2010, Dalasi depreciated against UK£ by 13.2%, against US$ by 3.2%, CHFby 14.6%, CFA by 10.3% and Euro by 16.1%.
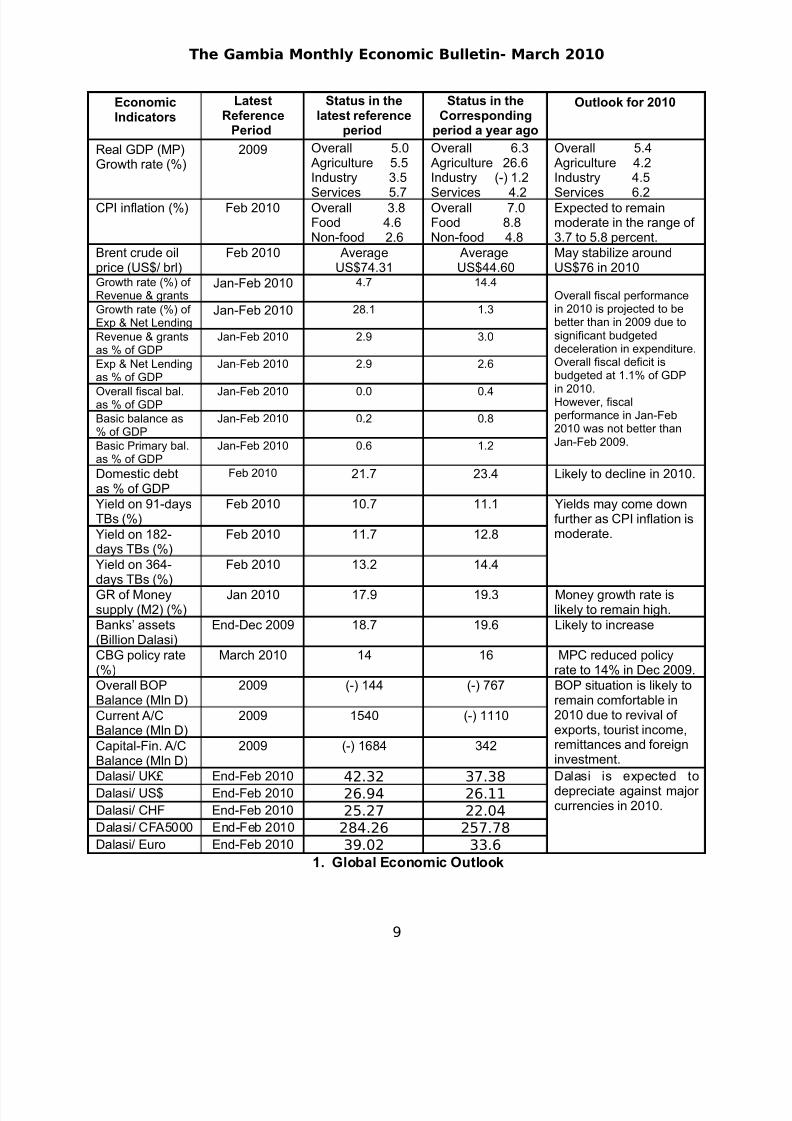
At a Glance- March 2010
8
8/6/2019 Gambia Monthly Economic Bulletin March 2010
http://slidepdf.com/reader/full/gambia-monthly-economic-bulletin-march-2010 9/45
The Gambia Monthly Economic Bulletin- March 2010
EconomicIndicators
LatestReference
Period
Status in thelatest reference
period
Status in theCorresponding
period a year ago
Outlook for 2010
Real GDP (MP)Growth rate (%)
2009 Overall 5.0Agriculture 5.5Industry 3.5
Services 5.7
Overall 6.3Agriculture 26.6Industry (-) 1.2
Services 4.2
Overall 5.4Agriculture 4.2Industry 4.5
Services 6.2CPI inflation (%) Feb 2010 Overall 3.8Food 4.6Non-food 2.6
Overall 7.0Food 8.8Non-food 4.8
Expected to remainmoderate in the range of 3.7 to 5.8 percent.
Brent crude oilprice (US$/ brl)
Feb 2010 AverageUS$74.31
AverageUS$44.60
May stabilize aroundUS$76 in 2010
Growth rate (%) of Revenue & grants
Jan-Feb 2010 4.7 14.4Overall fiscal performancein 2010 is projected to bebetter than in 2009 due tosignificant budgeteddeceleration in expenditure.Overall fiscal deficit isbudgeted at 1.1% of GDP
in 2010.However, fiscalperformance in Jan-Feb2010 was not better thanJan-Feb 2009.
Growth rate (%) of Exp & Net Lending
Jan-Feb 2010 28.1 1.3
Revenue & grantsas % of GDP
Jan-Feb 2010 2.9 3.0
Exp & Net Lendingas % of GDP
Jan-Feb 2010 2.9 2.6
Overall fiscal bal.as % of GDP
Jan-Feb 2010 0.0 0.4
Basic balance as% of GDP
Jan-Feb 2010 0.2 0.8
Basic Primary bal.as % of GDP
Jan-Feb 2010 0.6 1.2
Domestic debtas % of GDP
Feb 2010 21.7 23.4 Likely to decline in 2010.
Yield on 91-daysTBs (%)
Feb 2010 10.7 11.1 Yields may come downfurther as CPI inflation ismoderate.Yield on 182-
days TBs (%)Feb 2010 11.7 12.8
Yield on 364-days TBs (%)
Feb 2010 13.2 14.4
GR of Moneysupply (M2) (%)
Jan 2010 17.9 19.3 Money growth rate islikely to remain high.
Banks’ assets(Billion Dalasi)
End-Dec 2009 18.7 19.6 Likely to increase
CBG policy rate(%)
March 2010 14 16 MPC reduced policyrate to 14% in Dec 2009.
Overall BOPBalance (Mln D)
2009 (-) 144 (-) 767 BOP situation is likely toremain comfortable in2010 due to revival of exports, tourist income,remittances and foreigninvestment.
Current A/CBalance (Mln D)
2009 1540 (-) 1110
Capital-Fin. A/CBalance (Mln D)
2009 (-) 1684 342
Dalasi/ UK£ End-Feb 2010 42.32 37.38 Dalasi is expected todepreciate against major currencies in 2010.
Dalasi/ US$ End-Feb 2010 26.94 26.11Dalasi/ CHF End-Feb 2010 25.27 22.04Dalasi/ CFA5000 End-Feb 2010 284.26 257.78Dalasi/ Euro End-Feb 2010 39.02 33.6
1. Global Economic Outlook
9
8/6/2019 Gambia Monthly Economic Bulletin March 2010
http://slidepdf.com/reader/full/gambia-monthly-economic-bulletin-march-2010 10/45
The Gambia Monthly Economic Bulletin- March 2010
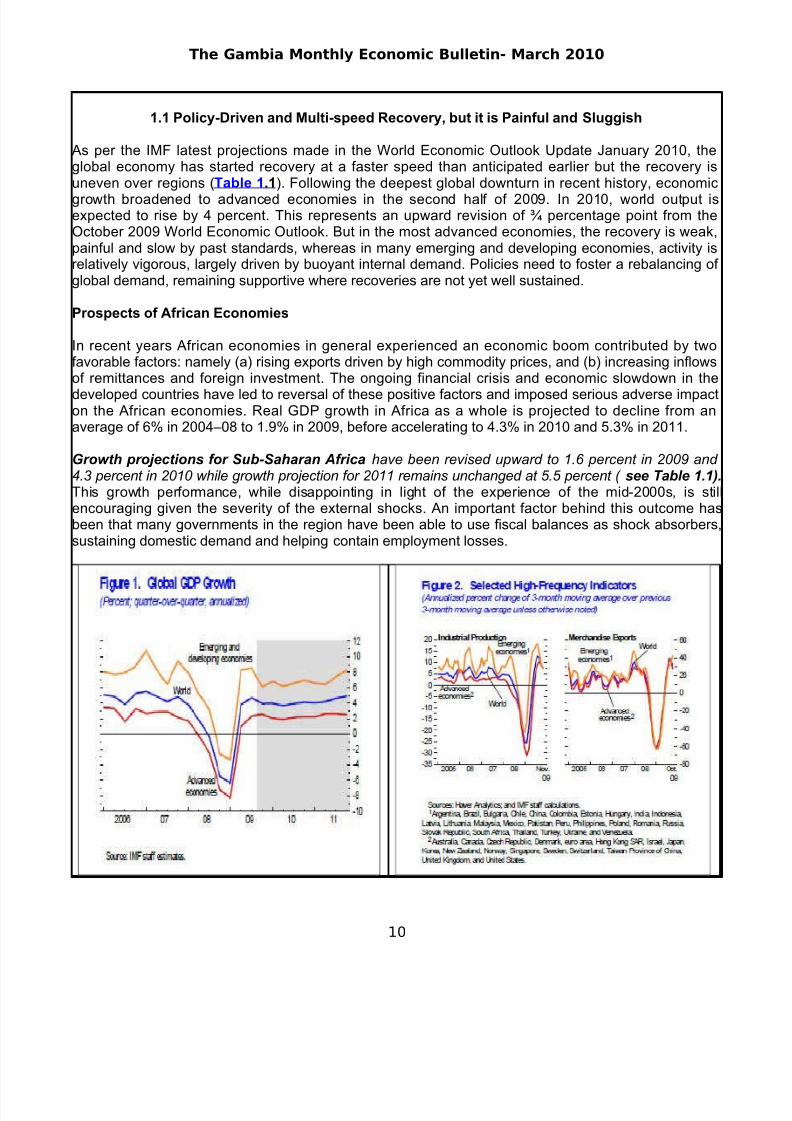
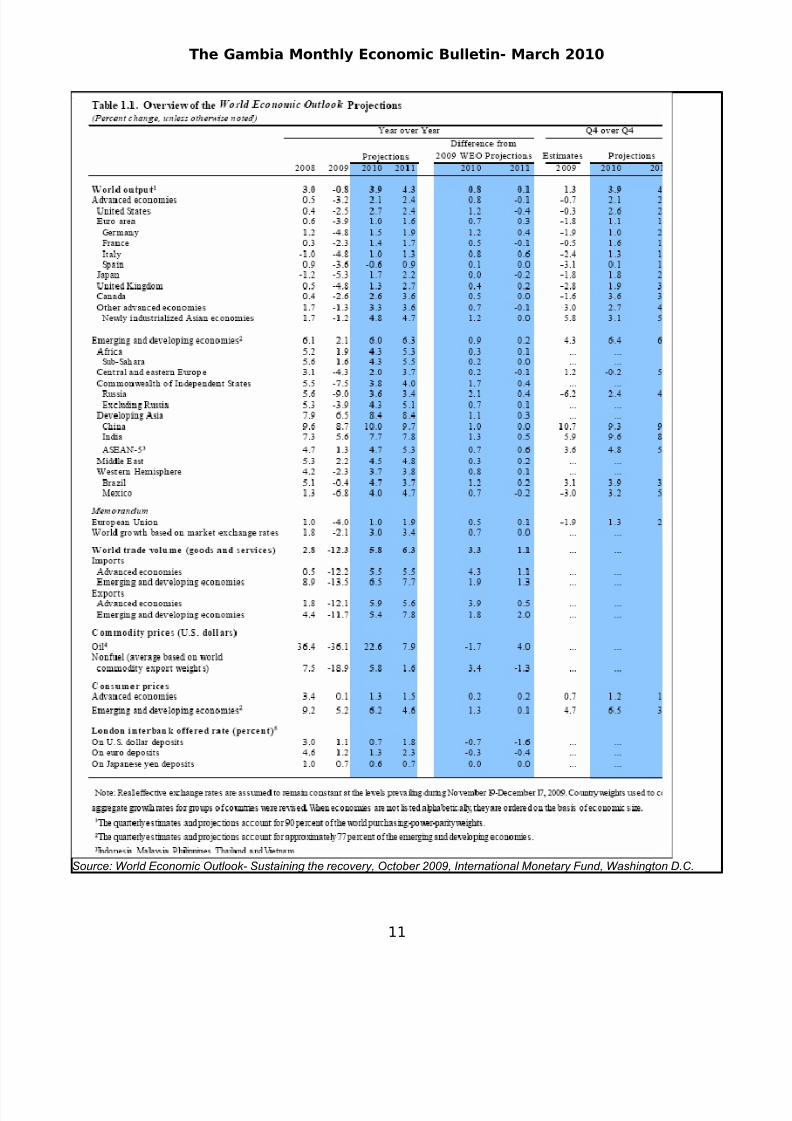
1.1 Policy-Driven and Multi-speed Recovery, but it is Painful and Sluggish As per the IMF latest projections made in the World Economic Outlook Update January 2010, theglobal economy has started recovery at a faster speed than anticipated earlier but the recovery isuneven over regions (Table 1.1 ). Following the deepest global downturn in recent history, economic
growth broadened to advanced economies in the second half of 2009. In 2010, world output isexpected to rise by 4 percent. This represents an upward revision of ¾ percentage point from theOctober 2009 World Economic Outlook. But in the most advanced economies, the recovery is weak,painful and slow by past standards, whereas in many emerging and developing economies, activity isrelatively vigorous, largely driven by buoyant internal demand. Policies need to foster a rebalancing of global demand, remaining supportive where recoveries are not yet well sustained.
Prospects of African Economies
In recent years African economies in general experienced an economic boom contributed by twofavorable factors: namely (a) rising exports driven by high commodity prices, and (b) increasing inflowsof remittances and foreign investment. The ongoing financial crisis and economic slowdown in the
developed countries have led to reversal of these positive factors and imposed serious adverse impacton the African economies. Real GDP growth in Africa as a whole is projected to decline from anaverage of 6% in 2004–08 to 1.9% in 2009, before accelerating to 4.3% in 2010 and 5.3% in 2011.
Growth projections for Sub-Saharan Africa have been revised upward to 1.6 percent in 2009 and 4.3 percent in 2010 while growth projection for 2011 remains unchanged at 5.5 percent ( see Table 1.1).This growth performance, while disappointing in light of the experience of the mid-2000s, is stillencouraging given the severity of the external shocks. An important factor behind this outcome hasbeen that many governments in the region have been able to use fiscal balances as shock absorbers,sustaining domestic demand and helping contain employment losses.
10
8/6/2019 Gambia Monthly Economic Bulletin March 2010
http://slidepdf.com/reader/full/gambia-monthly-economic-bulletin-march-2010 11/45
The Gambia Monthly Economic Bulletin- March 2010
Source: World Economic Outlook- Sustaining the recovery, October 2009, International Monetary Fund, Washington D.C.
11
8/6/2019 Gambia Monthly Economic Bulletin March 2010
http://slidepdf.com/reader/full/gambia-monthly-economic-bulletin-march-2010 12/45
The Gambia Monthly Economic Bulletin- March 2010
12
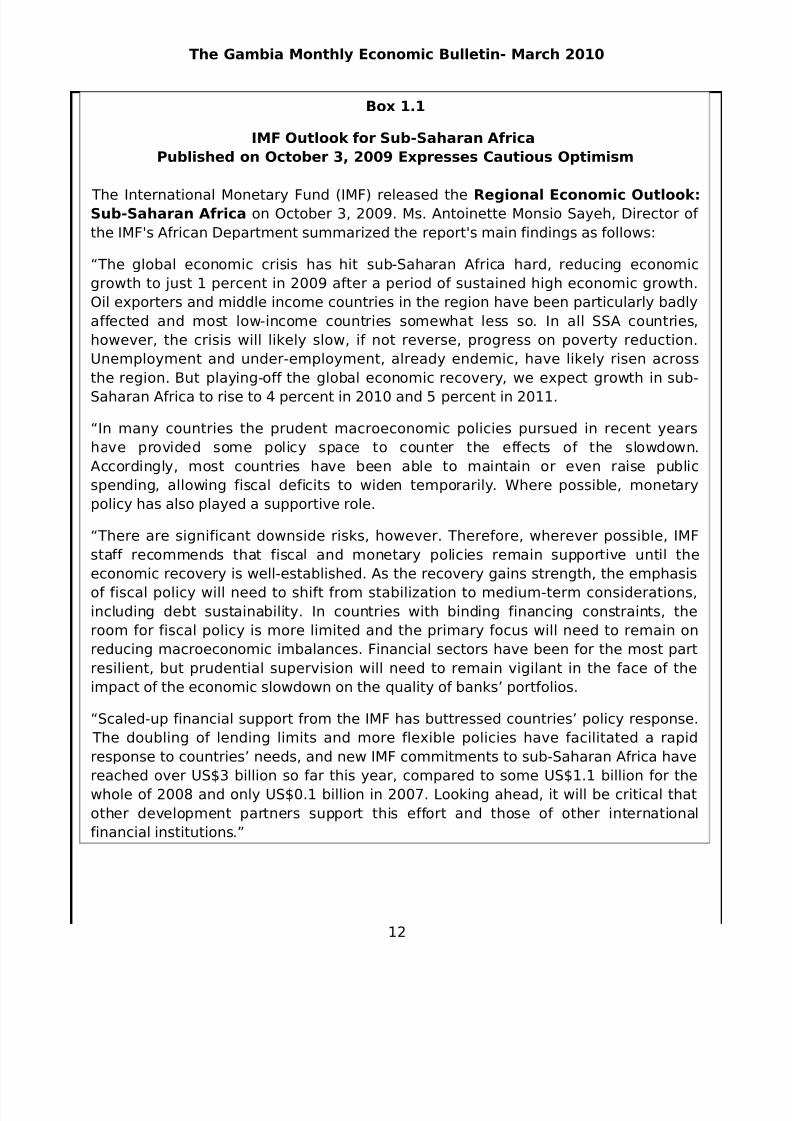
Box 1.1
IMF Outlook for Sub-Saharan Africa
Published on October 3, 2009 Expresses Cautious Optimism
The International Monetary Fund (IMF) released the Regional Economic Outlook:Sub-Saharan Africa on October 3, 2009. Ms. Antoinette Monsio Sayeh, Director of
the IMF's African Department summarized the report's main findings as follows:
“The global economic crisis has hit sub-Saharan Africa hard, reducing economic
growth to just 1 percent in 2009 after a period of sustained high economic growth.
Oil exporters and middle income countries in the region have been particularly badly
affected and most low-income countries somewhat less so. In all SSA countries,
however, the crisis will likely slow, if not reverse, progress on poverty reduction.
Unemployment and under-employment, already endemic, have likely risen across
the region. But playing-off the global economic recovery, we expect growth in sub-
Saharan Africa to rise to 4 percent in 2010 and 5 percent in 2011.
“In many countries the prudent macroeconomic policies pursued in recent years
have provided some policy space to counter the effects of the slowdown.
Accordingly, most countries have been able to maintain or even raise public
spending, allowing fiscal deficits to widen temporarily. Where possible, monetary
policy has also played a supportive role.
“There are significant downside risks, however. Therefore, wherever possible, IMF
staff recommends that fiscal and monetary policies remain supportive until the
economic recovery is well-established. As the recovery gains strength, the emphasis
of fiscal policy will need to shift from stabilization to medium-term considerations,including debt sustainability. In countries with binding financing constraints, the
room for fiscal policy is more limited and the primary focus will need to remain on
reducing macroeconomic imbalances. Financial sectors have been for the most part
resilient, but prudential supervision will need to remain vigilant in the face of the
impact of the economic slowdown on the quality of banks’ portfolios.
“Scaled-up financial support from the IMF has buttressed countries’ policy response.
The doubling of lending limits and more flexible policies have facilitated a rapid
response to countries’ needs, and new IMF commitments to sub-Saharan Africa have
reached over US$3 billion so far this year, compared to some US$1.1 billion for the
whole of 2008 and only US$0.1 billion in 2007. Looking ahead, it will be critical that
other development partners support this effort and those of other international
financial institutions.”

8/6/2019 Gambia Monthly Economic Bulletin March 2010
http://slidepdf.com/reader/full/gambia-monthly-economic-bulletin-march-2010 13/45
The Gambia Monthly Economic Bulletin- March 2010
13
8/6/2019 Gambia Monthly Economic Bulletin March 2010
http://slidepdf.com/reader/full/gambia-monthly-economic-bulletin-march-2010 14/45
The Gambia Monthly Economic Bulletin- March 2010
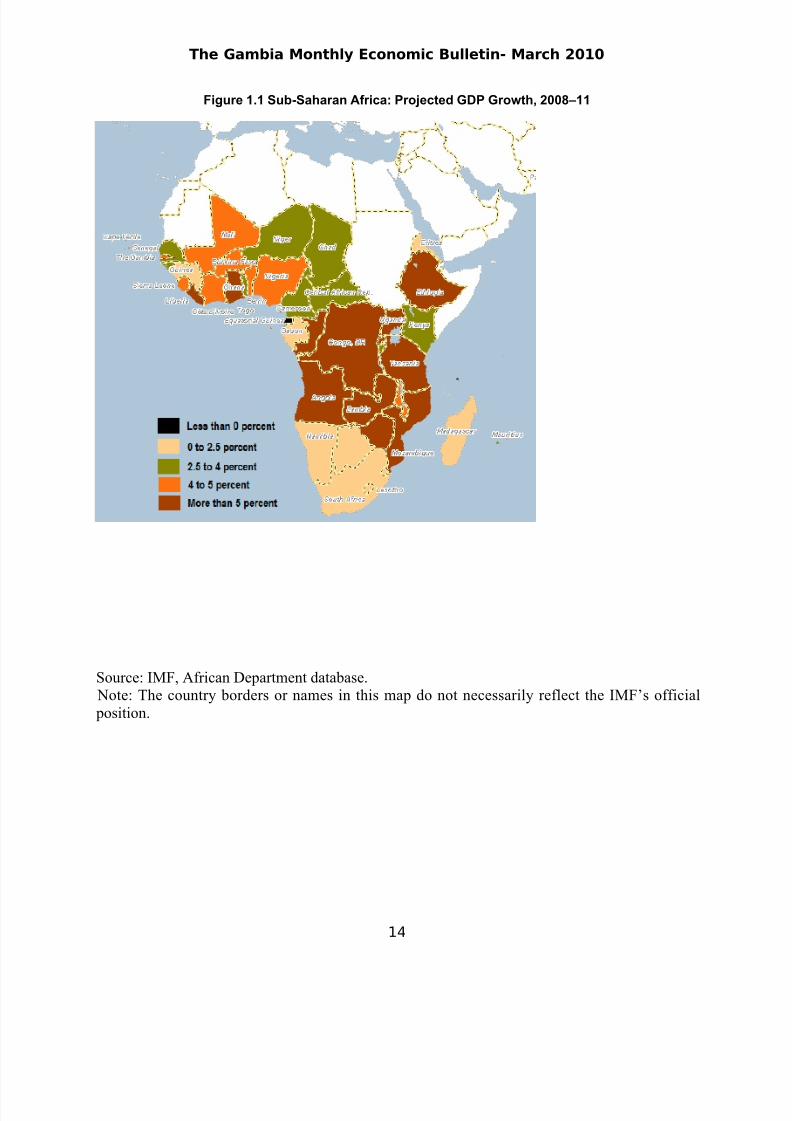
Figure 1.1 Sub-Saharan Africa: Projected GDP Growth, 2008–11
Source: IMF, African Department database. Note: The country borders or names in this map do not necessarily reflect the IMF’s official
position.
14

8/6/2019 Gambia Monthly Economic Bulletin March 2010
http://slidepdf.com/reader/full/gambia-monthly-economic-bulletin-march-2010 15/45
The Gambia Monthly Economic Bulletin- March 2010
15
Box 1.2 IMF-World Bank Debt Sustainability Analysis for African Economies
The objective of the IMF-World Bank debt sustainability framework, which was introduced in
2005, is to support low-income countries in their efforts to achieve their development goalswithout creating future debt problems (see The Debt Sustainability Framework for Low-Income
Countries, Occasional Paper 266, IMF (2008). A debt sustainability analysis using the DSF looks atfive debt burden indicators to evaluate the risk of external debt distress: the ratios of (i)
present value (PV) of debt-to-GDP; (ii) PV of debt-to-exports; (iii) PV of debt-to-revenues;(iv) debt service-to-revenues; and (v) debt service-to-exports. The risk of debt distress is
derived by reviewing the evolution of debt burden indicators compared to their indicative
policy-dependent debt-burden thresholds using a baseline scenario, alternative scenarios, andstress tests. The thresholds depend on the quality of a country’s policies and institutions as
measured by the three-year average of the World Bank’s Country Policy and Institutional
Assessment (CPIA) index.
8/6/2019 Gambia Monthly Economic Bulletin March 2010
http://slidepdf.com/reader/full/gambia-monthly-economic-bulletin-march-2010 16/45
The Gambia Monthly Economic Bulletin- March 2010
1.2 World Commodity Prices
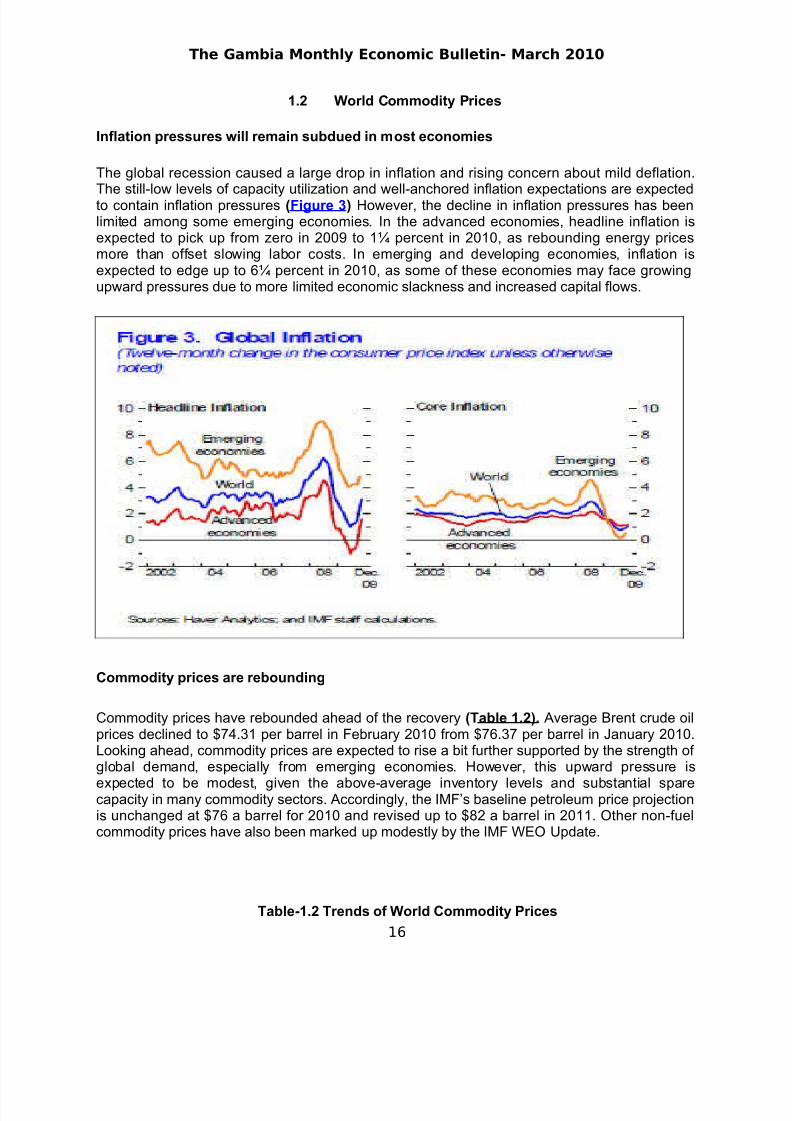
Inflation pressures will remain subdued in most economies
The global recession caused a large drop in inflation and rising concern about mild deflation.
The still-low levels of capacity utilization and well-anchored inflation expectations are expectedto contain inflation pressures (Figure 3) However, the decline in inflation pressures has beenlimited among some emerging economies. In the advanced economies, headline inflation isexpected to pick up from zero in 2009 to 1¼ percent in 2010, as rebounding energy pricesmore than offset slowing labor costs. In emerging and developing economies, inflation isexpected to edge up to 6¼ percent in 2010, as some of these economies may face growingupward pressures due to more limited economic slackness and increased capital flows.
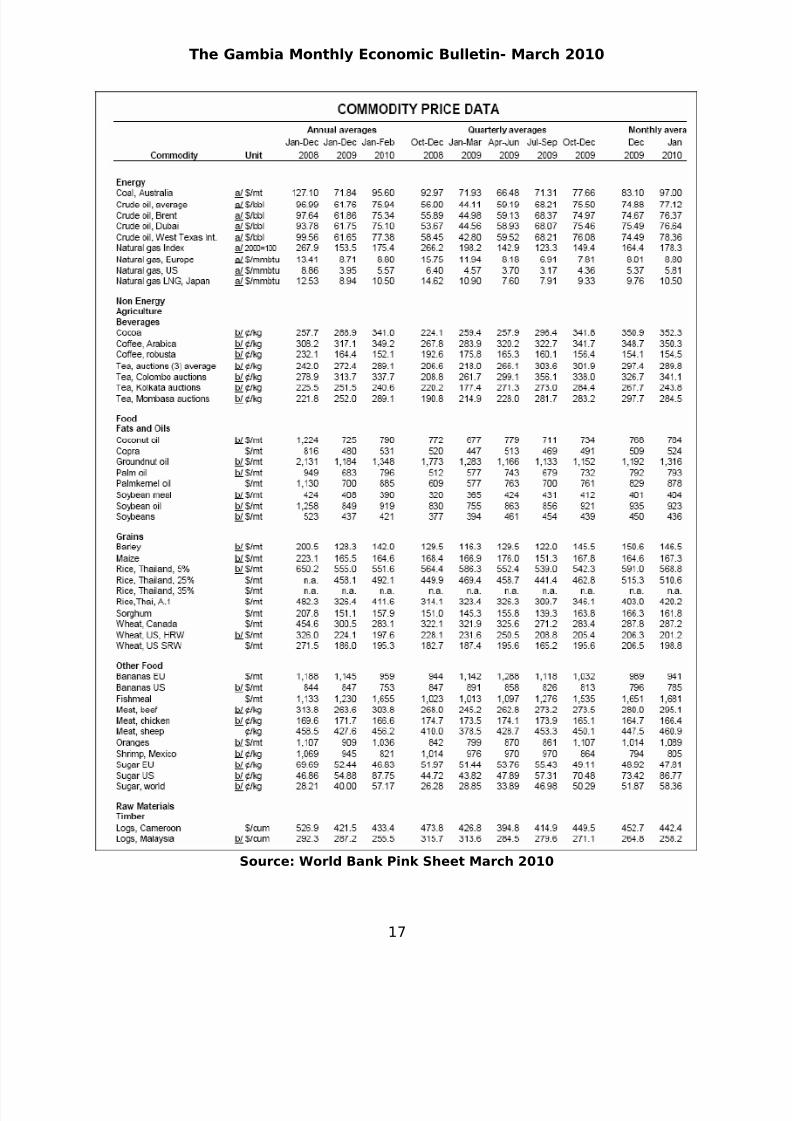
Commodity prices are rebounding
Commodity prices have rebounded ahead of the recovery (Table 1.2). Average Brent crude oilprices declined to $74.31 per barrel in February 2010 from $76.37 per barrel in January 2010.Looking ahead, commodity prices are expected to rise a bit further supported by the strength of global demand, especially from emerging economies. However, this upward pressure is
expected to be modest, given the above-average inventory levels and substantial sparecapacity in many commodity sectors. Accordingly, the IMF’s baseline petroleum price projectionis unchanged at $76 a barrel for 2010 and revised up to $82 a barrel in 2011. Other non-fuelcommodity prices have also been marked up modestly by the IMF WEO Update.
Table-1.2 Trends of World Commodity Prices
16
8/6/2019 Gambia Monthly Economic Bulletin March 2010
http://slidepdf.com/reader/full/gambia-monthly-economic-bulletin-march-2010 17/45
The Gambia Monthly Economic Bulletin- March 2010
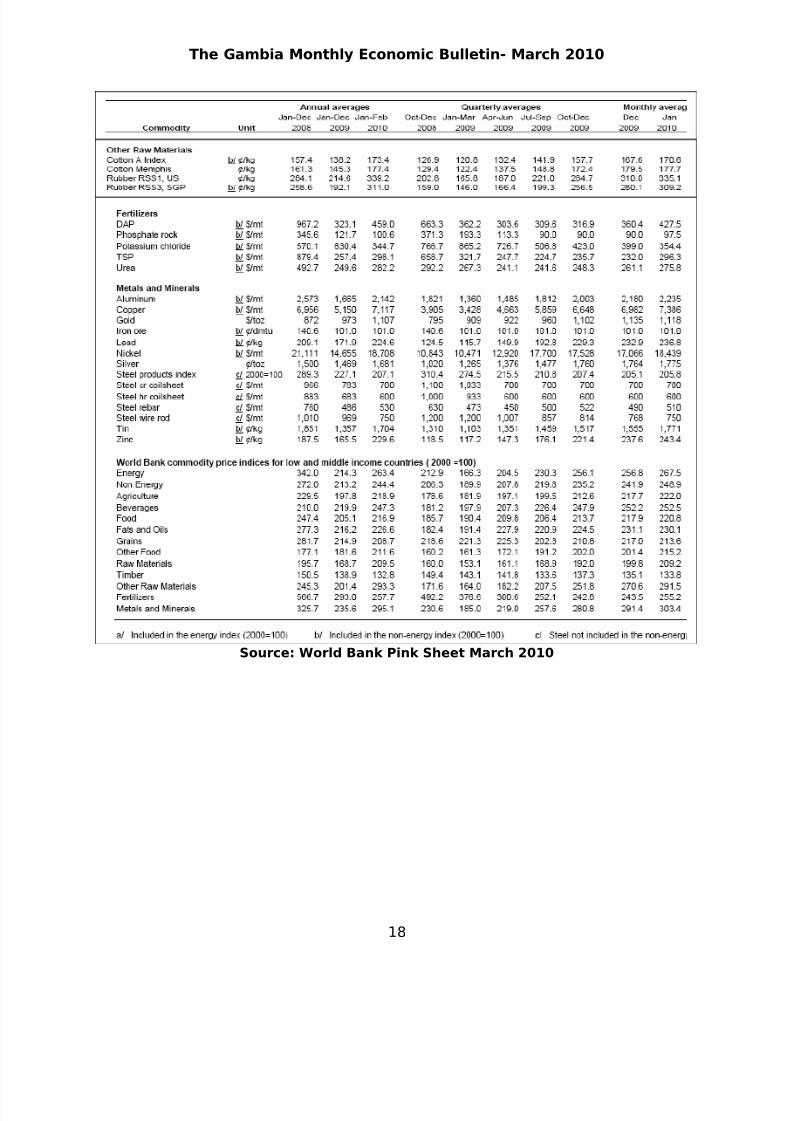
Source: World Bank Pink Sheet March 2010
17
8/6/2019 Gambia Monthly Economic Bulletin March 2010
http://slidepdf.com/reader/full/gambia-monthly-economic-bulletin-march-2010 18/45
The Gambia Monthly Economic Bulletin- March 2010
Source: World Bank Pink Sheet March 2010
18
8/6/2019 Gambia Monthly Economic Bulletin March 2010
http://slidepdf.com/reader/full/gambia-monthly-economic-bulletin-march-2010 19/45
The Gambia Monthly Economic Bulletin- March 2010
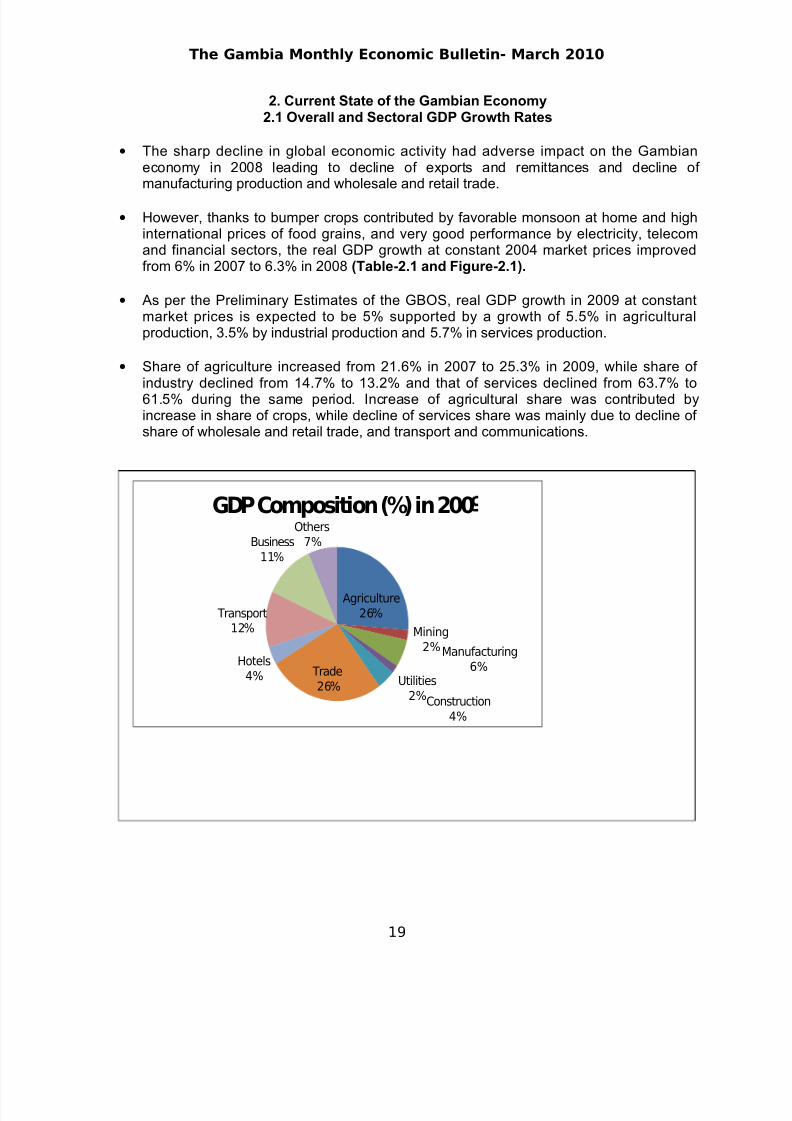
2. Current State of the Gambian Economy2.1 Overall and Sectoral GDP Growth Rates
• The sharp decline in global economic activity had adverse impact on the Gambianeconomy in 2008 leading to decline of exports and remittances and decline of manufacturing production and wholesale and retail trade.
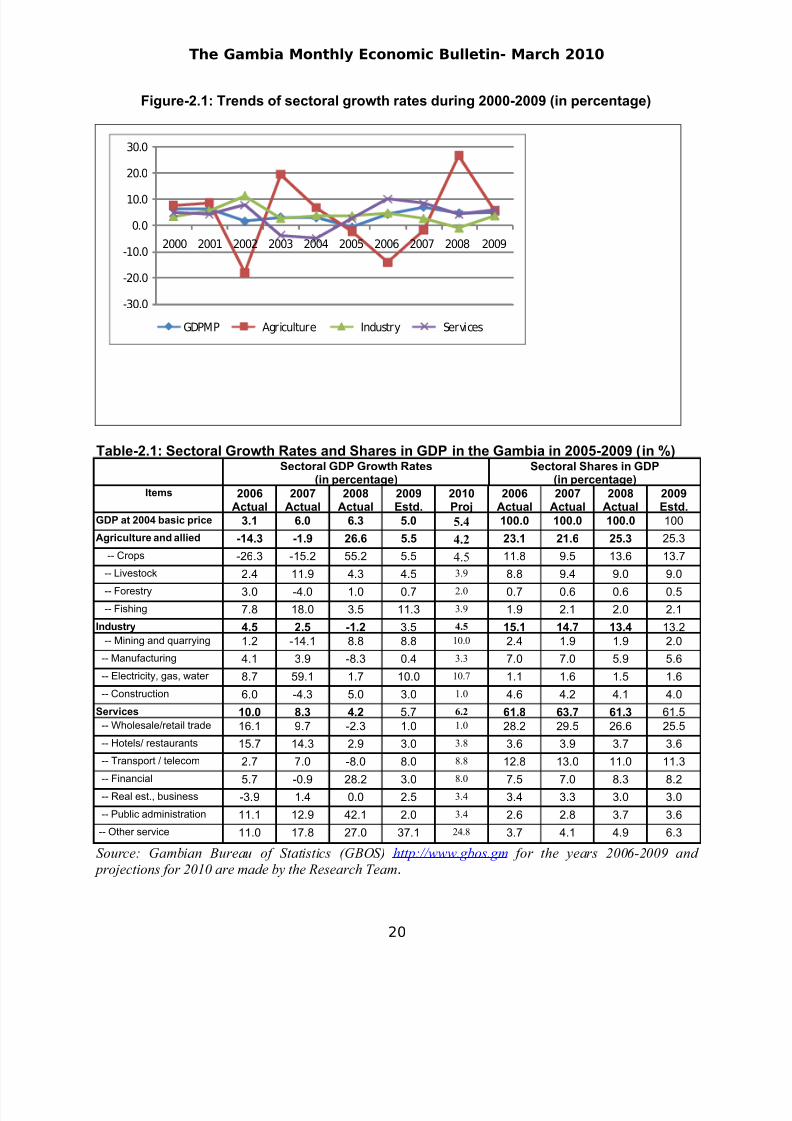
• However, thanks to bumper crops contributed by favorable monsoon at home and highinternational prices of food grains, and very good performance by electricity, telecomand financial sectors, the real GDP growth at constant 2004 market prices improvedfrom 6% in 2007 to 6.3% in 2008 (Table-2.1 and Figure-2.1).
• As per the Preliminary Estimates of the GBOS, real GDP growth in 2009 at constantmarket prices is expected to be 5% supported by a growth of 5.5% in agriculturalproduction, 3.5% by industrial production and 5.7% in services production.
• Share of agriculture increased from 21.6% in 2007 to 25.3% in 2009, while share of industry declined from 14.7% to 13.2% and that of services declined from 63.7% to61.5% during the same period. Increase of agricultural share was contributed byincrease in share of crops, while decline of services share was mainly due to decline of share of wholesale and retail trade, and transport and communications.
Agriculture
26%
Mining
2%Manufacturing
6%Utilities
2%Construction
4%
Trade
26%
Hotels
4%
Transport
12%
Business
11%
Others
7%
GDP Composition (%) in 200
19
8/6/2019 Gambia Monthly Economic Bulletin March 2010
http://slidepdf.com/reader/full/gambia-monthly-economic-bulletin-march-2010 20/45
The Gambia Monthly Economic Bulletin- March 2010
Figure-2.1: Trends of sectoral growth rates during 2000-2009 (in percentage)
-30.0
-20.0
-10.0
0.0
10.0
20.0
30.0
2000 2001 2002 2003 2004 2005 2006 2007 2008 2009
GDPMP Agriculture Industry Services
Table-2.1: Sectoral Growth Rates and Shares in GDP in the Gambia in 2005-2009 (in %)Sectoral GDP Growth Rates
(in percentage)Sectoral Shares in GDP
(in percentage)Items 2006
Actual2007
Actual2008
Actual2009Estd.
2010Proj
2006Actual
2007Actual
2008Actual
2009Estd.
GDP at 2004 basic price 3.1 6.0 6.3 5.0 5.4 100.0 100.0 100.0 100
Agriculture and allied -14.3 -1.9 26.6 5.5 4.2 23.1 21.6 25.3 25.3
-- Crops -26.3 -15.2 55.2 5.5 4.5 11.8 9.5 13.6 13.7
-- Livestock 2.4 11.9 4.3 4.5 3.9 8.8 9.4 9.0 9.0
-- Forestry 3.0 -4.0 1.0 0.7 2.0 0.7 0.6 0.6 0.5-- Fishing 7.8 18.0 3.5 11.3 3.9 1.9 2.1 2.0 2.1
Industry 4.5 2.5 -1.2 3.5 4.5 15.1 14.7 13.4 13.2-- Mining and quarrying 1.2 -14.1 8.8 8.8 10.0 2.4 1.9 1.9 2.0
-- Manufacturing 4.1 3.9 -8.3 0.4 3.3 7.0 7.0 5.9 5.6
-- Electricity, gas, water 8.7 59.1 1.7 10.0 10.7 1.1 1.6 1.5 1.6
-- Construction 6.0 -4.3 5.0 3.0 1.0 4.6 4.2 4.1 4.0
Services 10.0 8.3 4.2 5.7 6.2 61.8 63.7 61.3 61.5-- Wholesale/retail trade 16.1 9.7 -2.3 1.0 1.0 28.2 29.5 26.6 25.5
-- Hotels/ restaurants 15.7 14.3 2.9 3.0 3.8 3.6 3.9 3.7 3.6
-- Transport / telecom 2.7 7.0 -8.0 8.0 8.8 12.8 13.0 11.0 11.3
-- Financial 5.7 -0.9 28.2 3.0 8.0 7.5 7.0 8.3 8.2
-- Real est., business -3.9 1.4 0.0 2.5 3.4 3.4 3.3 3.0 3.0
-- Public administration 11.1 12.9 42.1 2.0 3.4 2.6 2.8 3.7 3.6
-- Other service 11.0 17.8 27.0 37.1 24.8 3.7 4.1 4.9 6.3
Source: Gambian Bureau of Statistics (GBOS) http://www.gbos.gm for the years 2006-2009 and projections for 2010 are made by the Research Team.
20
8/6/2019 Gambia Monthly Economic Bulletin March 2010
http://slidepdf.com/reader/full/gambia-monthly-economic-bulletin-march-2010 21/45
The Gambia Monthly Economic Bulletin- March 2010
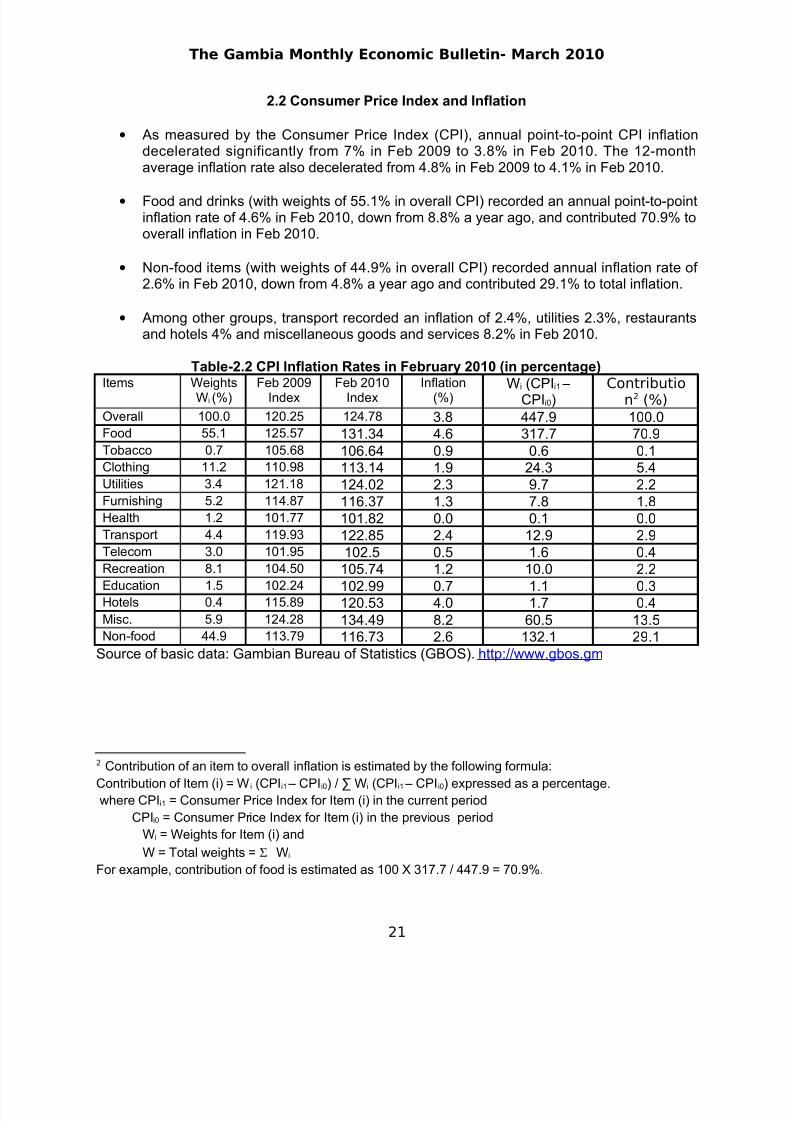
2.2 Consumer Price Index and Inflation
• As measured by the Consumer Price Index (CPI), annual point-to-point CPI inflationdecelerated significantly from 7% in Feb 2009 to 3.8% in Feb 2010. The 12-monthaverage inflation rate also decelerated from 4.8% in Feb 2009 to 4.1% in Feb 2010.
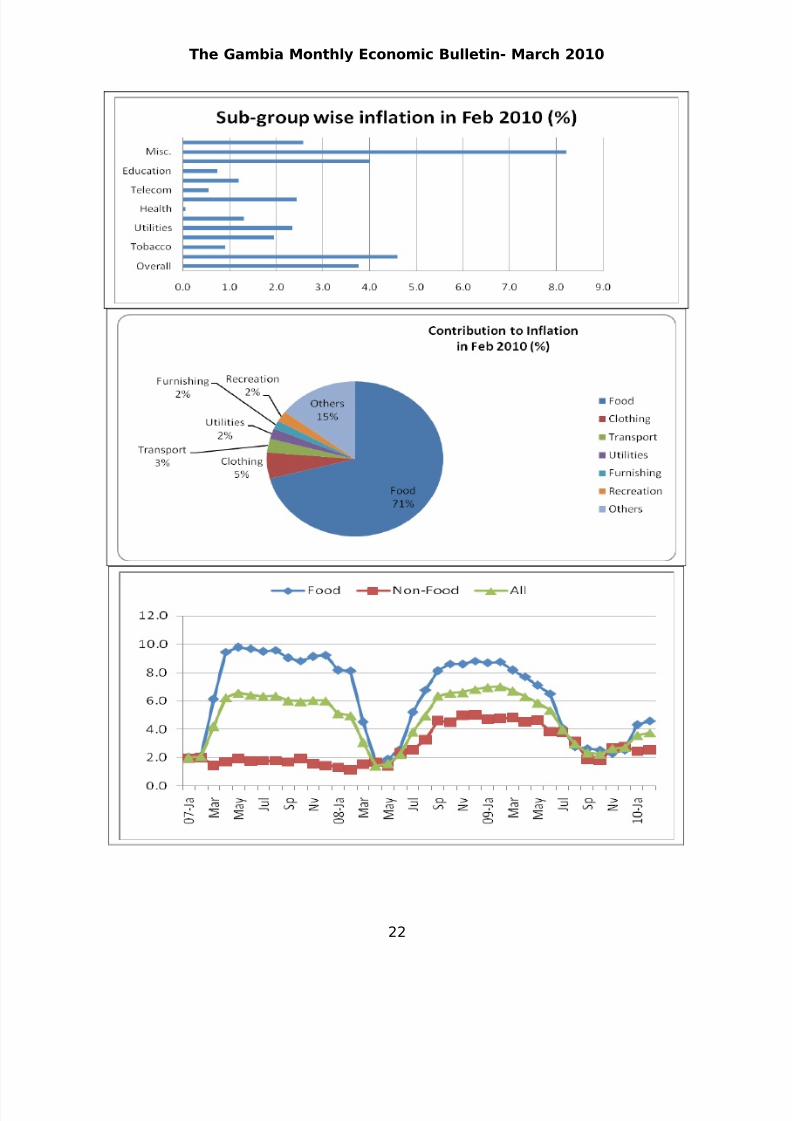
• Food and drinks (with weights of 55.1% in overall CPI) recorded an annual point-to-pointinflation rate of 4.6% in Feb 2010, down from 8.8% a year ago, and contributed 70.9% tooverall inflation in Feb 2010.
• Non-food items (with weights of 44.9% in overall CPI) recorded annual inflation rate of 2.6% in Feb 2010, down from 4.8% a year ago and contributed 29.1% to total inflation.
• Among other groups, transport recorded an inflation of 2.4%, utilities 2.3%, restaurantsand hotels 4% and miscellaneous goods and services 8.2% in Feb 2010.
Table-2.2 CPI Inflation Rates in February 2010 (in percentage)Items Weights
Wi (%)Feb 2009
IndexFeb 2010
IndexInflation
(%)Wi (CPIi1 –
CPIi0)Contributio
n2 (%)Overall 100.0 120.25 124.78 3.8 447.9 100.0Food 55.1 125.57 131.34 4.6 317.7 70.9Tobacco 0.7 105.68 106.64 0.9 0.6 0.1Clothing 11.2 110.98 113.14 1.9 24.3 5.4Utilities 3.4 121.18 124.02 2.3 9.7 2.2Furnishing 5.2 114.87 116.37 1.3 7.8 1.8Health 1.2 101.77 101.82 0.0 0.1 0.0Transport 4.4 119.93 122.85 2.4 12.9 2.9Telecom 3.0 101.95 102.5 0.5 1.6 0.4Recreation 8.1 104.50 105.74 1.2 10.0 2.2
Education 1.5 102.24 102.99 0.7 1.1 0.3Hotels 0.4 115.89 120.53 4.0 1.7 0.4Misc. 5.9 124.28 134.49 8.2 60.5 13.5Non-food 44.9 113.79 116.73 2.6 132.1 29.1
Source of basic data: Gambian Bureau of Statistics (GBOS). http://www.gbos.gm
2 Contribution of an item to overall inflation is estimated by the following formula:
Contribution of Item (i) = W i (CPIi1 – CPIi0) / ∑ Wi (CPIi1 – CPIi0) expressed as a percentage.where CPIi1 = Consumer Price Index for Item (i) in the current period
CPIi0 = Consumer Price Index for Item (i) in the previous period
Wi = Weights for Item (i) and
W = Total weights = Σ Wi
For example, contribution of food is estimated as 100 X 317.7 / 447.9 = 70.9%.
21
8/6/2019 Gambia Monthly Economic Bulletin March 2010
http://slidepdf.com/reader/full/gambia-monthly-economic-bulletin-march-2010 22/45
The Gambia Monthly Economic Bulletin- March 2010
22
8/6/2019 Gambia Monthly Economic Bulletin March 2010
http://slidepdf.com/reader/full/gambia-monthly-economic-bulletin-march-2010 23/45
The Gambia Monthly Economic Bulletin- March 2010
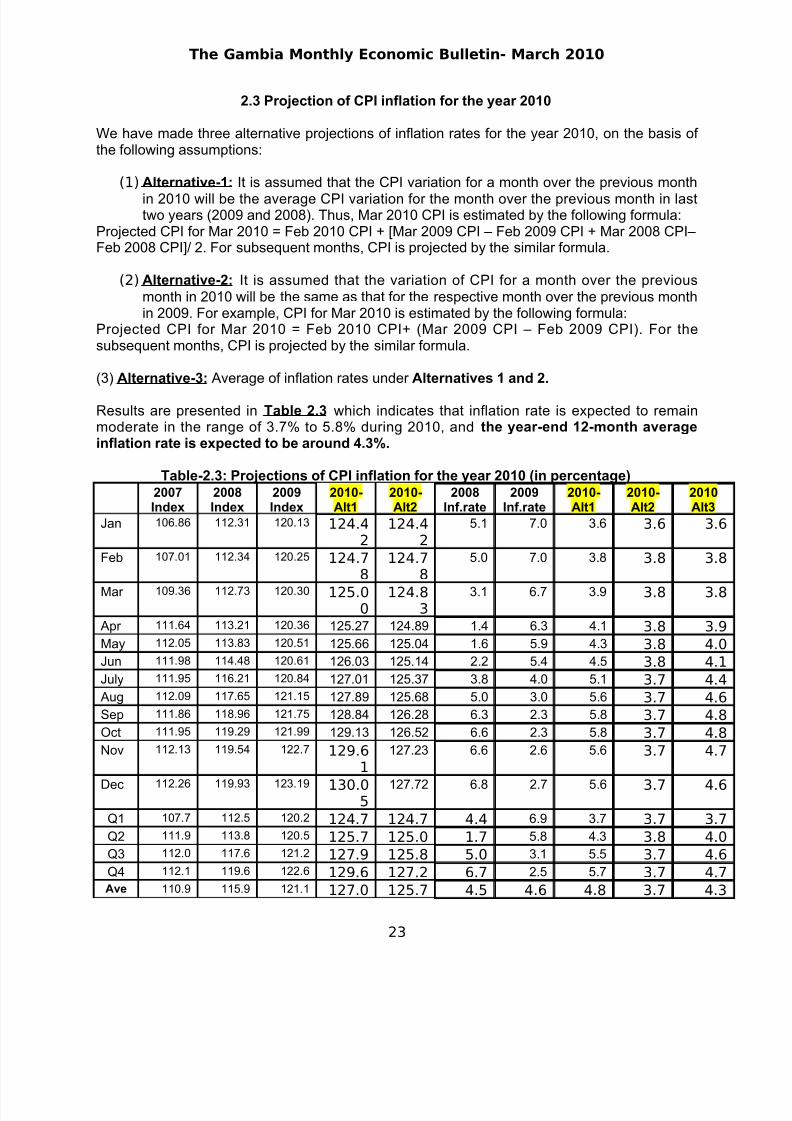
2.3 Projection of CPI inflation for the year 2010
We have made three alternative projections of inflation rates for the year 2010, on the basis of the following assumptions:
(1) Alternative-1: It is assumed that the CPI variation for a month over the previous month
in 2010 will be the average CPI variation for the month over the previous month in lasttwo years (2009 and 2008). Thus, Mar 2010 CPI is estimated by the following formula:
Projected CPI for Mar 2010 = Feb 2010 CPI + [Mar 2009 CPI – Feb 2009 CPI + Mar 2008 CPI–Feb 2008 CPI]/ 2. For subsequent months, CPI is projected by the similar formula.
(2) Alternative-2: It is assumed that the variation of CPI for a month over the previousmonth in 2010 will be the same as that for the respective month over the previous monthin 2009. For example, CPI for Mar 2010 is estimated by the following formula:
Projected CPI for Mar 2010 = Feb 2010 CPI+ (Mar 2009 CPI – Feb 2009 CPI). For thesubsequent months, CPI is projected by the similar formula.
(3) Alternative-3: Average of inflation rates under Alternatives 1 and 2.
Results are presented in Table 2.3 which indicates that inflation rate is expected to remainmoderate in the range of 3.7% to 5.8% during 2010, and the year-end 12-month averageinflation rate is expected to be around 4.3%.
Table-2.3: Projections of CPI inflation for the year 2010 (in percentage)2007Index
2008Index
2009Index
2010-Alt1
2010-Alt2
2008Inf.rate
2009Inf.rate
2010-Alt1
2010-Alt2
2010Alt3
Jan 106.86 112.31 120.13 124.42
124.42
5.1 7.0 3.6 3.6 3.6
Feb 107.01 112.34 120.25 124.78
124.78
5.0 7.0 3.8 3.8 3.8
Mar 109.36 112.73 120.30 125.00
124.83
3.1 6.7 3.9 3.8 3.8
Apr 111.64 113.21 120.36 125.27 124.89 1.4 6.3 4.1 3.8 3.9May 112.05 113.83 120.51 125.66 125.04 1.6 5.9 4.3 3.8 4.0Jun 111.98 114.48 120.61 126.03 125.14 2.2 5.4 4.5 3.8 4.1July 111.95 116.21 120.84 127.01 125.37 3.8 4.0 5.1 3.7 4.4Aug 112.09 117.65 121.15 127.89 125.68 5.0 3.0 5.6 3.7 4.6Sep 111.86 118.96 121.75 128.84 126.28 6.3 2.3 5.8 3.7 4.8Oct 111.95 119.29 121.99 129.13 126.52 6.6 2.3 5.8 3.7 4.8Nov 112.13 119.54 122.7 129.6
1
127.23 6.6 2.6 5.6 3.7 4.7
Dec 112.26 119.93 123.19 130.05
127.72 6.8 2.7 5.6 3.7 4.6
Q1 107.7 112.5 120.2 124.7 124.7 4.4 6.9 3.7 3.7 3.7Q2 111.9 113.8 120.5 125.7 125.0 1.7 5.8 4.3 3.8 4.0Q3 112.0 117.6 121.2 127.9 125.8 5.0 3.1 5.5 3.7 4.6Q4 112.1 119.6 122.6 129.6 127.2 6.7 2.5 5.7 3.7 4.7Ave 110.9 115.9 121.1 127.0 125.7 4.5 4.6 4.8 3.7 4.3
23

8/6/2019 Gambia Monthly Economic Bulletin March 2010
http://slidepdf.com/reader/full/gambia-monthly-economic-bulletin-march-2010 24/45
8/6/2019 Gambia Monthly Economic Bulletin March 2010
http://slidepdf.com/reader/full/gambia-monthly-economic-bulletin-march-2010 25/45
The Gambia Monthly Economic Bulletin- March 2010
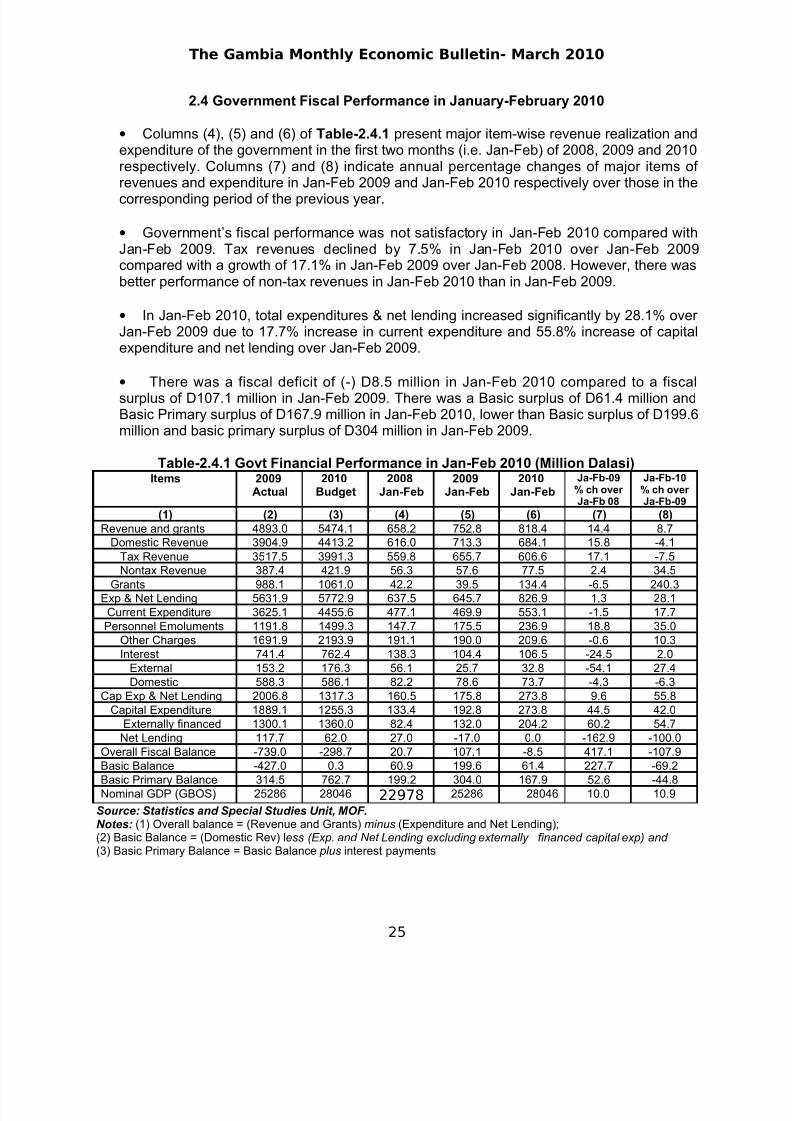
2.4 Government Fiscal Performance in January-February 2010
• Columns (4), (5) and (6) of Table-2.4.1 present major item-wise revenue realization andexpenditure of the government in the first two months (i.e. Jan-Feb) of 2008, 2009 and 2010respectively. Columns (7) and (8) indicate annual percentage changes of major items of revenues and expenditure in Jan-Feb 2009 and Jan-Feb 2010 respectively over those in the
corresponding period of the previous year.
• Government’s fiscal performance was not satisfactory in Jan-Feb 2010 compared withJan-Feb 2009. Tax revenues declined by 7.5% in Jan-Feb 2010 over Jan-Feb 2009compared with a growth of 17.1% in Jan-Feb 2009 over Jan-Feb 2008. However, there wasbetter performance of non-tax revenues in Jan-Feb 2010 than in Jan-Feb 2009.
• In Jan-Feb 2010, total expenditures & net lending increased significantly by 28.1% over Jan-Feb 2009 due to 17.7% increase in current expenditure and 55.8% increase of capitalexpenditure and net lending over Jan-Feb 2009.
• There was a fiscal deficit of (-) D8.5 million in Jan-Feb 2010 compared to a fiscalsurplus of D107.1 million in Jan-Feb 2009. There was a Basic surplus of D61.4 million andBasic Primary surplus of D167.9 million in Jan-Feb 2010, lower than Basic surplus of D199.6million and basic primary surplus of D304 million in Jan-Feb 2009.
Table-2.4.1 Govt Financial Performance in Jan-Feb 2010 (Million Dalasi)Items 2009
Actual2010
Budget2008
Jan-Feb2009
Jan-Feb2010
Jan-Feb
Ja-Fb-09% ch over Ja-Fb 08
Ja-Fb-10% ch over Ja-Fb-09
(1) (2) (3) (4) (5) (6) (7) (8)Revenue and grants 4893.0 5474.1 658.2 752.8 818.4 14.4 8.7
Domestic Revenue 3904.9 4413.2 616.0 713.3 684.1 15.8 -4.1Tax Revenue 3517.5 3991.3 559.8 655.7 606.6 17.1 -7.5Nontax Revenue 387.4 421.9 56.3 57.6 77.5 2.4 34.5
Grants 988.1 1061.0 42.2 39.5 134.4 -6.5 240.3Exp & Net Lending 5631.9 5772.9 637.5 645.7 826.9 1.3 28.1Current Expenditure 3625.1 4455.6 477.1 469.9 553.1 -1.5 17.7Personnel Emoluments 1191.8 1499.3 147.7 175.5 236.9 18.8 35.0
Other Charges 1691.9 2193.9 191.1 190.0 209.6 -0.6 10.3Interest 741.4 762.4 138.3 104.4 106.5 -24.5 2.0
External 153.2 176.3 56.1 25.7 32.8 -54.1 27.4Domestic 588.3 586.1 82.2 78.6 73.7 -4.3 -6.3
Cap Exp & Net Lending 2006.8 1317.3 160.5 175.8 273.8 9.6 55.8Capital Expenditure 1889.1 1255.3 133.4 192.8 273.8 44.5 42.0
Externally financed 1300.1 1360.0 82.4 132.0 204.2 60.2 54.7Net Lending 117.7 62.0 27.0 -17.0 0.0 -162.9 -100.0
Overall Fiscal Balance -739.0 -298.7 20.7 107.1 -8.5 417.1 -107.9Basic Balance -427.0 0.3 60.9 199.6 61.4 227.7 -69.2
Basic Primary Balance 314.5 762.7 199.2 304.0 167.9 52.6 -44.8Nominal GDP (GBOS) 25286 28046 22978 25286 28046 10.0 10.9
Source: Statistics and Special Studies Unit, MOF.Notes: (1) Overall balance = (Revenue and Grants) minus (Expenditure and Net Lending);(2) Basic Balance = (Domestic Rev) less (Exp. and Net Lending excluding externally financed capital exp) and (3) Basic Primary Balance = Basic Balance plus interest payments
25
8/6/2019 Gambia Monthly Economic Bulletin March 2010
http://slidepdf.com/reader/full/gambia-monthly-economic-bulletin-march-2010 26/45
The Gambia Monthly Economic Bulletin- March 2010
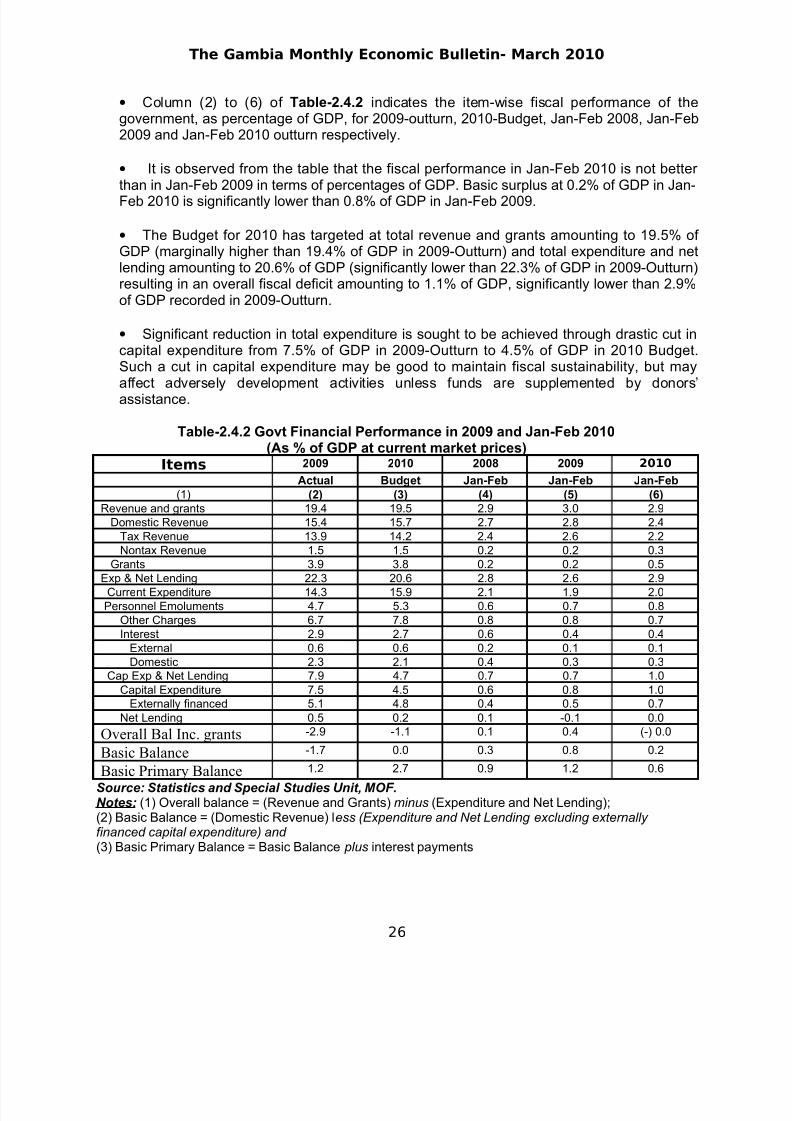
• Column (2) to (6) of Table-2.4.2 indicates the item-wise fiscal performance of thegovernment, as percentage of GDP, for 2009-outturn, 2010-Budget, Jan-Feb 2008, Jan-Feb2009 and Jan-Feb 2010 outturn respectively.
• It is observed from the table that the fiscal performance in Jan-Feb 2010 is not better than in Jan-Feb 2009 in terms of percentages of GDP. Basic surplus at 0.2% of GDP in Jan-Feb 2010 is significantly lower than 0.8% of GDP in Jan-Feb 2009.
• The Budget for 2010 has targeted at total revenue and grants amounting to 19.5% of GDP (marginally higher than 19.4% of GDP in 2009-Outturn) and total expenditure and netlending amounting to 20.6% of GDP (significantly lower than 22.3% of GDP in 2009-Outturn)resulting in an overall fiscal deficit amounting to 1.1% of GDP, significantly lower than 2.9%of GDP recorded in 2009-Outturn.
• Significant reduction in total expenditure is sought to be achieved through drastic cut incapital expenditure from 7.5% of GDP in 2009-Outturn to 4.5% of GDP in 2010 Budget.Such a cut in capital expenditure may be good to maintain fiscal sustainability, but mayaffect adversely development activities unless funds are supplemented by donors’assistance.
Table-2.4.2 Govt Financial Performance in 2009 and Jan-Feb 2010(As % of GDP at current market prices)
Items 2009 2010 2008 2009 2010
Actual Budget Jan-Feb Jan-Feb Jan-Feb(1) (2) (3) (4) (5) (6)
Revenue and grants 19.4 19.5 2.9 3.0 2.9Domestic Revenue 15.4 15.7 2.7 2.8 2.4
Tax Revenue 13.9 14.2 2.4 2.6 2.2Nontax Revenue 1.5 1.5 0.2 0.2 0.3
Grants 3.9 3.8 0.2 0.2 0.5Exp & Net Lending 22.3 20.6 2.8 2.6 2.9
Current Expenditure 14.3 15.9 2.1 1.9 2.0Personnel Emoluments 4.7 5.3 0.6 0.7 0.8
Other Charges 6.7 7.8 0.8 0.8 0.7Interest 2.9 2.7 0.6 0.4 0.4
External 0.6 0.6 0.2 0.1 0.1Domestic 2.3 2.1 0.4 0.3 0.3
Cap Exp & Net Lending 7.9 4.7 0.7 0.7 1.0Capital Expenditure 7.5 4.5 0.6 0.8 1.0
Externally financed 5.1 4.8 0.4 0.5 0.7Net Lending 0.5 0.2 0.1 -0.1 0.0
Overall Bal Inc. grants -2.9 -1.1 0.1 0.4 (-) 0.0
Basic Balance -1.7 0.0 0.3 0.8 0.2
Basic Primary Balance 1.2 2.7 0.9 1.2 0.6
Source: Statistics and Special Studies Unit, MOF.Notes: (1) Overall balance = (Revenue and Grants) minus (Expenditure and Net Lending);(2) Basic Balance = (Domestic Revenue) less (Expenditure and Net Lending excluding externally financed capital expenditure) and (3) Basic Primary Balance = Basic Balance plus interest payments
26
8/6/2019 Gambia Monthly Economic Bulletin March 2010
http://slidepdf.com/reader/full/gambia-monthly-economic-bulletin-march-2010 27/45
The Gambia Monthly Economic Bulletin- March 2010
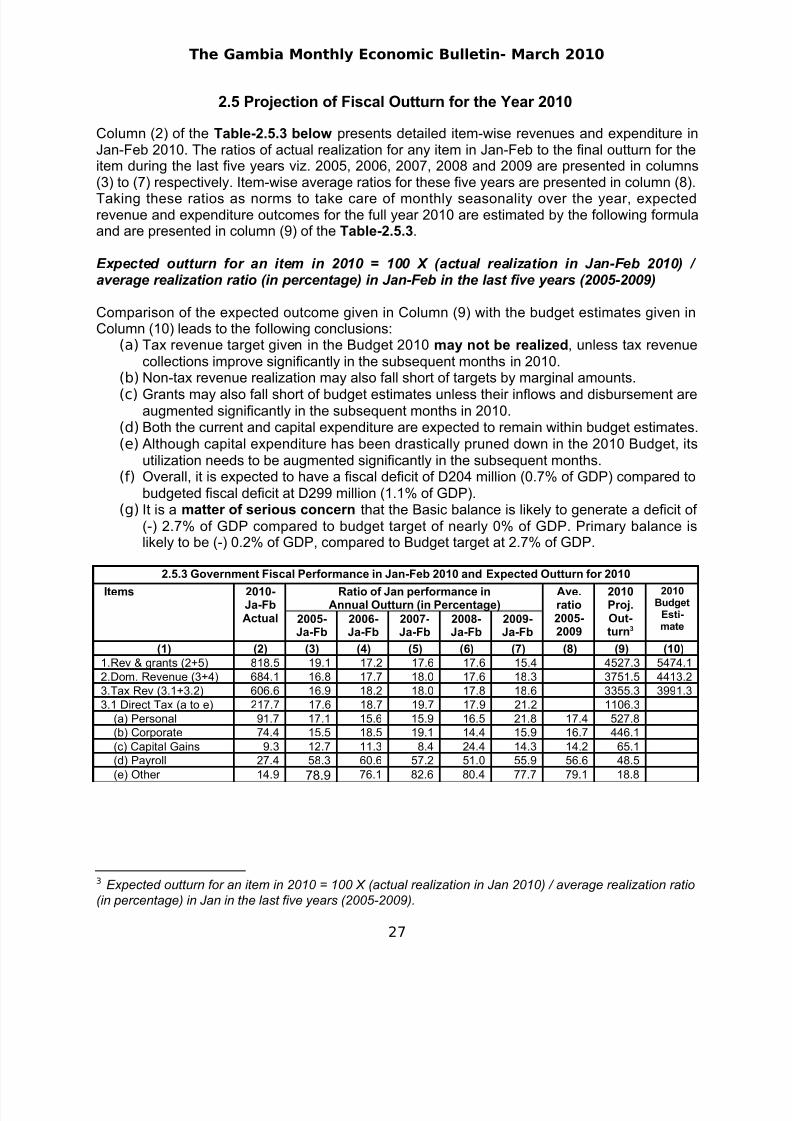
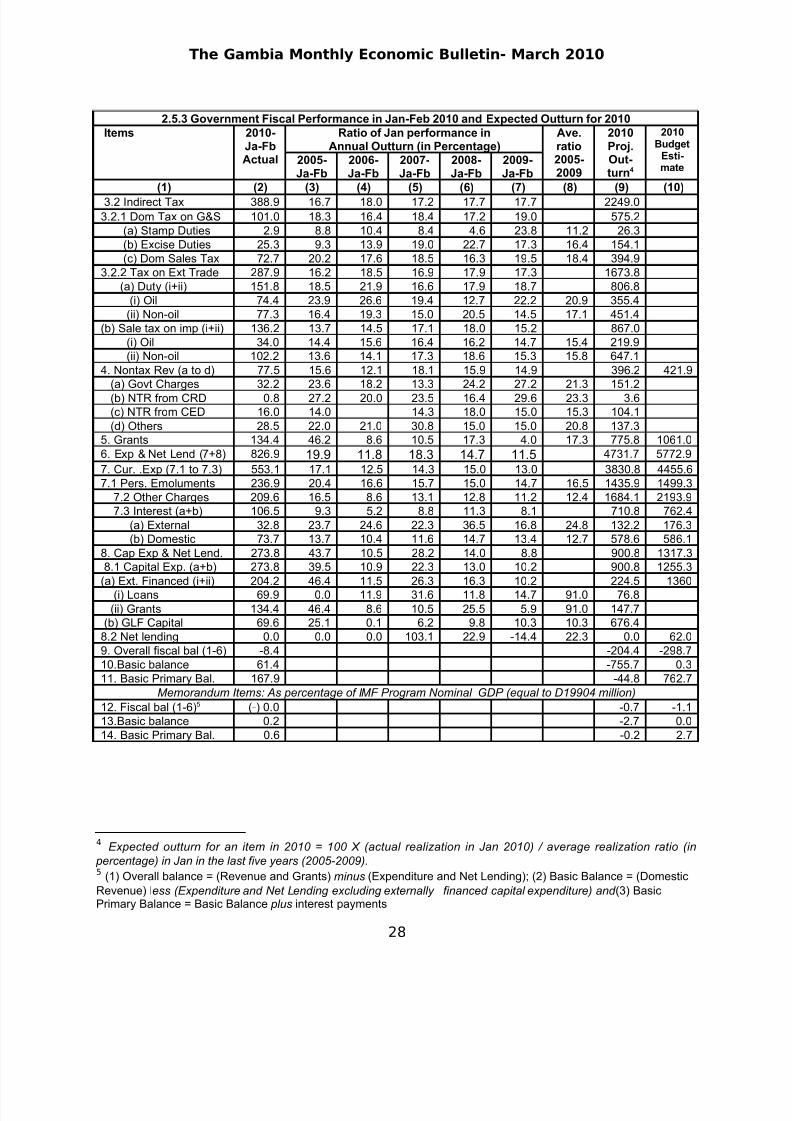
2.5 Projection of Fiscal Outturn for the Year 2010
Column (2) of the Table-2.5.3 below presents detailed item-wise revenues and expenditure inJan-Feb 2010. The ratios of actual realization for any item in Jan-Feb to the final outturn for theitem during the last five years viz. 2005, 2006, 2007, 2008 and 2009 are presented in columns(3) to (7) respectively. Item-wise average ratios for these five years are presented in column (8).
Taking these ratios as norms to take care of monthly seasonality over the year, expectedrevenue and expenditure outcomes for the full year 2010 are estimated by the following formulaand are presented in column (9) of the Table-2.5.3.
Expected outturn for an item in 2010 = 100 X (actual realization in Jan-Feb 2010) / average realization ratio (in percentage) in Jan-Feb in the last five years (2005-2009)
Comparison of the expected outcome given in Column (9) with the budget estimates given inColumn (10) leads to the following conclusions:
(a) Tax revenue target given in the Budget 2010 may not be realized, unless tax revenuecollections improve significantly in the subsequent months in 2010.
(b) Non-tax revenue realization may also fall short of targets by marginal amounts.
(c) Grants may also fall short of budget estimates unless their inflows and disbursement areaugmented significantly in the subsequent months in 2010.
(d) Both the current and capital expenditure are expected to remain within budget estimates.(e) Although capital expenditure has been drastically pruned down in the 2010 Budget, its
utilization needs to be augmented significantly in the subsequent months.(f) Overall, it is expected to have a fiscal deficit of D204 million (0.7% of GDP) compared to
budgeted fiscal deficit at D299 million (1.1% of GDP).(g) It is a matter of serious concern that the Basic balance is likely to generate a deficit of
(-) 2.7% of GDP compared to budget target of nearly 0% of GDP. Primary balance islikely to be (-) 0.2% of GDP, compared to Budget target at 2.7% of GDP.
2.5.3 Government Fiscal Performance in Jan-Feb 2010 and Expected Outturn for 2010
Items 2010-Ja-FbActual
Ratio of Jan performance inAnnual Outturn (in Percentage)
Ave.ratio2005-2009
2010Proj.Out-turn3
2010Budget
Esti-mate
2005-Ja-Fb
2006-Ja-Fb
2007-Ja-Fb
2008-Ja-Fb
2009-Ja-Fb
(1) (2) (3) (4) (5) (6) (7) (8) (9) (10)1.Rev & grants (2+5) 818.5 19.1 17.2 17.6 17.6 15.4 4527.3 5474.12.Dom. Revenue (3+4) 684.1 16.8 17.7 18.0 17.6 18.3 3751.5 4413.23.Tax Rev (3.1+3.2) 606.6 16.9 18.2 18.0 17.8 18.6 3355.3 3991.33.1 Direct Tax (a to e) 217.7 17.6 18.7 19.7 17.9 21.2 1106.3
(a) Personal 91.7 17.1 15.6 15.9 16.5 21.8 17.4 527.8(b) Corporate 74.4 15.5 18.5 19.1 14.4 15.9 16.7 446.1(c) Capital Gains 9.3 12.7 11.3 8.4 24.4 14.3 14.2 65.1(d) Payroll 27.4 58.3 60.6 57.2 51.0 55.9 56.6 48.5(e) Other 14.9 78.9 76.1 82.6 80.4 77.7 79.1 18.8
3 Expected outturn for an item in 2010 = 100 X (actual realization in Jan 2010) / average realization ratio
(in percentage) in Jan in the last five years (2005-2009).
27
8/6/2019 Gambia Monthly Economic Bulletin March 2010
http://slidepdf.com/reader/full/gambia-monthly-economic-bulletin-march-2010 28/45
8/6/2019 Gambia Monthly Economic Bulletin March 2010
http://slidepdf.com/reader/full/gambia-monthly-economic-bulletin-march-2010 29/45
The Gambia Monthly Economic Bulletin- February 2010
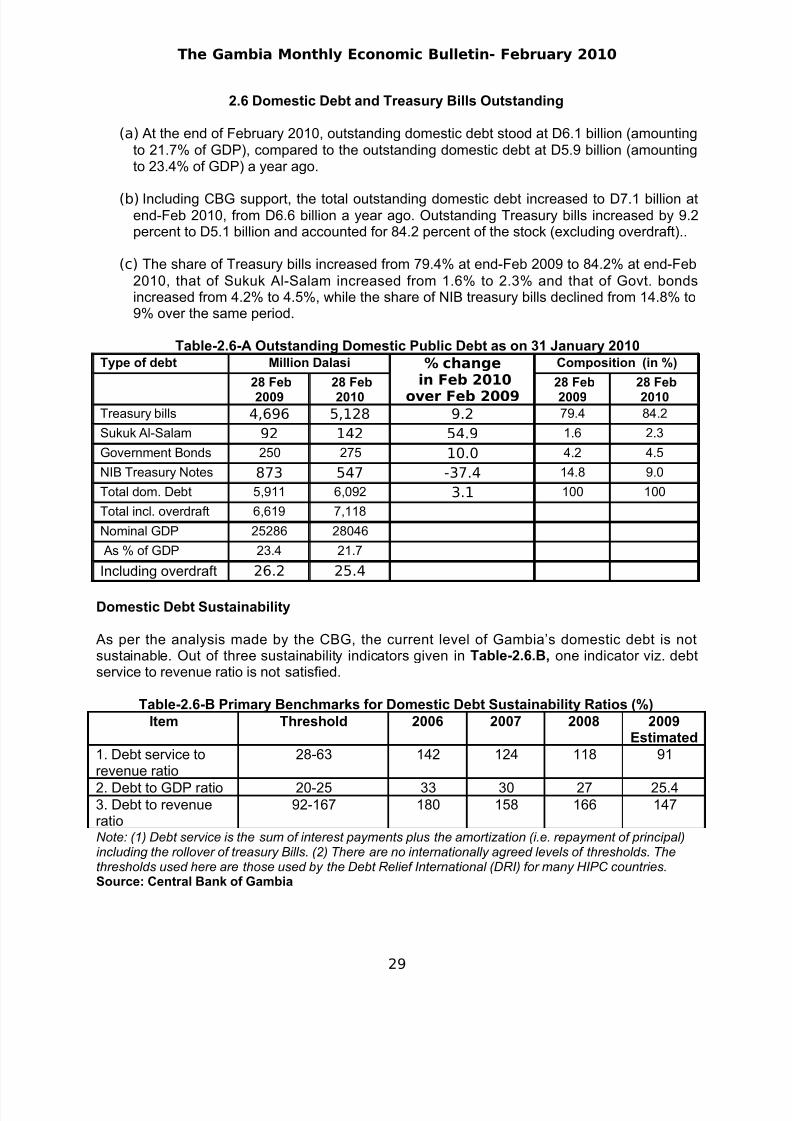
2.6 Domestic Debt and Treasury Bills Outstanding
(a) At the end of February 2010, outstanding domestic debt stood at D6.1 billion (amountingto 21.7% of GDP), compared to the outstanding domestic debt at D5.9 billion (amountingto 23.4% of GDP) a year ago.
(b) Including CBG support, the total outstanding domestic debt increased to D7.1 billion atend-Feb 2010, from D6.6 billion a year ago. Outstanding Treasury bills increased by 9.2percent to D5.1 billion and accounted for 84.2 percent of the stock (excluding overdraft)..
(c) The share of Treasury bills increased from 79.4% at end-Feb 2009 to 84.2% at end-Feb2010, that of Sukuk Al-Salam increased from 1.6% to 2.3% and that of Govt. bondsincreased from 4.2% to 4.5%, while the share of NIB treasury bills declined from 14.8% to9% over the same period.
Table-2.6-A Outstanding Domestic Public Debt as on 31 January 2010Type of debt Million Dalasi % change
in Feb 2010
over Feb 2009
Composition (in %)
28 Feb
2009
28 Feb
2010
28 Feb
2009
28 Feb
2010Treasury bills 4,696 5,128 9.2 79.4 84.2
Sukuk Al-Salam 92 142 54.9 1.6 2.3
Government Bonds 250 275 10.0 4.2 4.5
NIB Treasury Notes 873 547 -37.4 14.8 9.0
Total dom. Debt 5,911 6,092 3.1 100 100
Total incl. overdraft 6,619 7,118
Nominal GDP 25286 28046
As % of GDP 23.4 21.7
Including overdraft 26.2 25.4
Domestic Debt Sustainability
As per the analysis made by the CBG, the current level of Gambia’s domestic debt is notsustainable. Out of three sustainability indicators given in Table-2.6.B, one indicator viz. debtservice to revenue ratio is not satisfied.
Table-2.6-B Primary Benchmarks for Domestic Debt Sustainability Ratios (%)Item Threshold 2006 2007 2008 2009
Estimated1. Debt service torevenue ratio
28-63 142 124 118 91
2. Debt to GDP ratio 20-25 33 30 27 25.43. Debt to revenueratio
92-167 180 158 166 147
Note: (1) Debt service is the sum of interest payments plus the amortization (i.e. repayment of principal)including the rollover of treasury Bills. (2) There are no internationally agreed levels of thresholds. Thethresholds used here are those used by the Debt Relief International (DRI) for many HIPC countries.Source: Central Bank of Gambia
29
8/6/2019 Gambia Monthly Economic Bulletin March 2010
http://slidepdf.com/reader/full/gambia-monthly-economic-bulletin-march-2010 30/45
The Gambia Monthly Economic Bulletin- February 2010
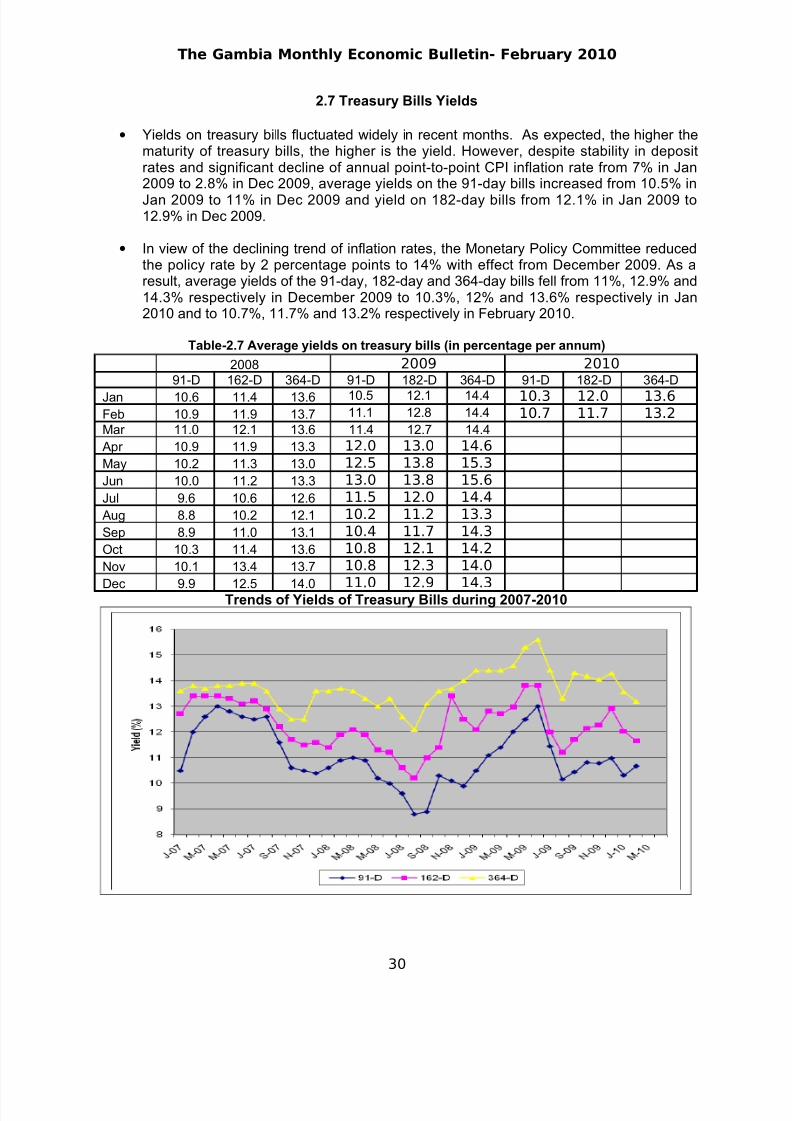
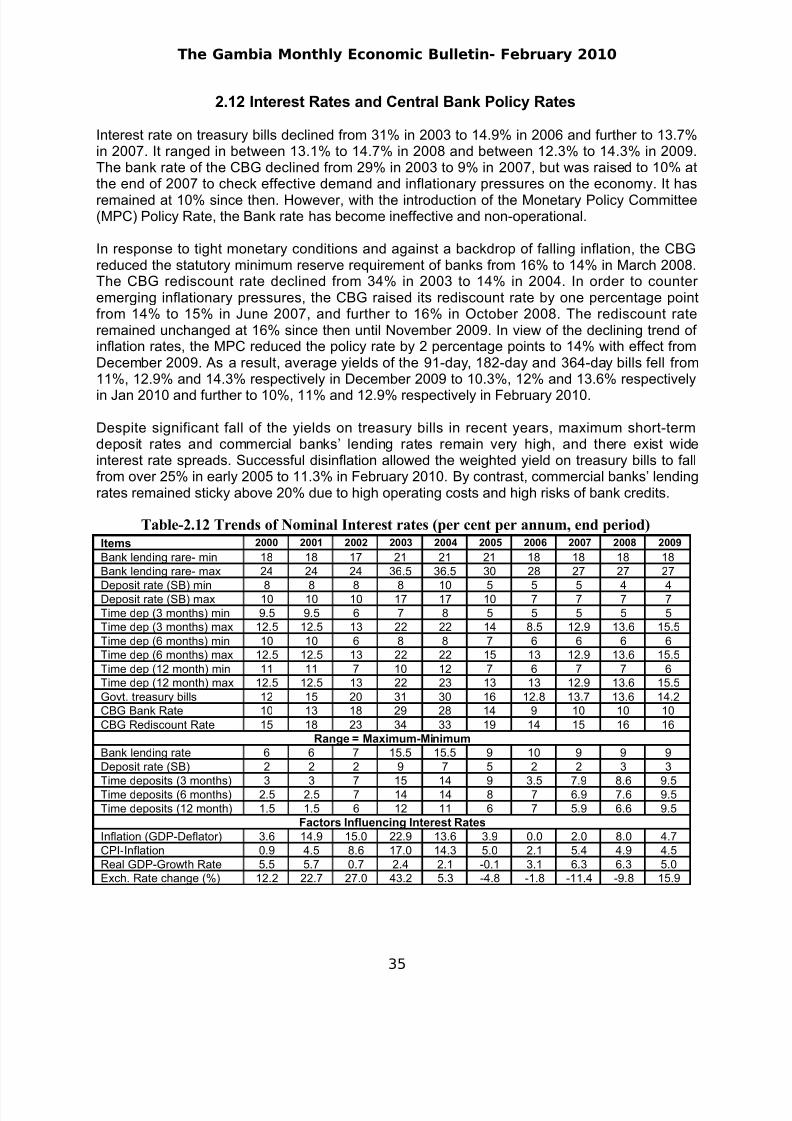
2.7 Treasury Bills Yields
• Yields on treasury bills fluctuated widely in recent months. As expected, the higher thematurity of treasury bills, the higher is the yield. However, despite stability in depositrates and significant decline of annual point-to-point CPI inflation rate from 7% in Jan2009 to 2.8% in Dec 2009, average yields on the 91-day bills increased from 10.5% in
Jan 2009 to 11% in Dec 2009 and yield on 182-day bills from 12.1% in Jan 2009 to12.9% in Dec 2009.
• In view of the declining trend of inflation rates, the Monetary Policy Committee reducedthe policy rate by 2 percentage points to 14% with effect from December 2009. As aresult, average yields of the 91-day, 182-day and 364-day bills fell from 11%, 12.9% and14.3% respectively in December 2009 to 10.3%, 12% and 13.6% respectively in Jan2010 and to 10.7%, 11.7% and 13.2% respectively in February 2010.
Table-2.7 Average yields on treasury bills (in percentage per annum)
2008 2009 201091-D 162-D 364-D 91-D 182-D 364-D 91-D 182-D 364-D
Jan 10.6 11.4 13.6 10.5 12.1 14.4 10.3 12.0 13.6Feb 10.9 11.9 13.7 11.1 12.8 14.4 10.7 11.7 13.2Mar 11.0 12.1 13.6 11.4 12.7 14.4
Apr 10.9 11.9 13.3 12.0 13.0 14.6
May 10.2 11.3 13.0 12.5 13.8 15.3
Jun 10.0 11.2 13.3 13.0 13.8 15.6
Jul 9.6 10.6 12.6 11.5 12.0 14.4
Aug 8.8 10.2 12.1 10.2 11.2 13.3
Sep 8.9 11.0 13.1 10.4 11.7 14.3
Oct 10.3 11.4 13.6 10.8 12.1 14.2
Nov 10.1 13.4 13.7 10.8 12.3 14.0
Dec 9.9 12.5 14.0 11.0 12.9 14.3Trends of Yields of Treasury Bills during 2007-2010
30
8/6/2019 Gambia Monthly Economic Bulletin March 2010
http://slidepdf.com/reader/full/gambia-monthly-economic-bulletin-march-2010 31/45
The Gambia Monthly Economic Bulletin- February 2010
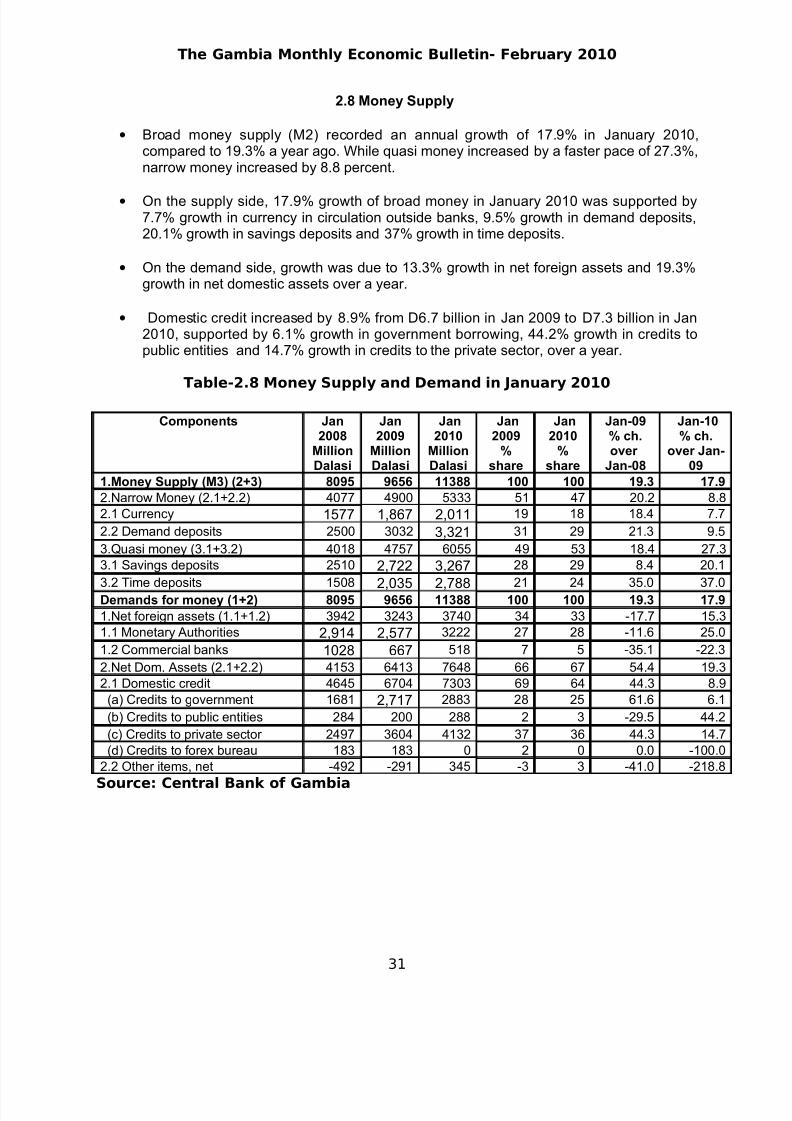
2.8 Money Supply
• Broad money supply (M2) recorded an annual growth of 17.9% in January 2010,compared to 19.3% a year ago. While quasi money increased by a faster pace of 27.3%,narrow money increased by 8.8 percent.
• On the supply side, 17.9% growth of broad money in January 2010 was supported by7.7% growth in currency in circulation outside banks, 9.5% growth in demand deposits,20.1% growth in savings deposits and 37% growth in time deposits.
• On the demand side, growth was due to 13.3% growth in net foreign assets and 19.3%growth in net domestic assets over a year.
• Domestic credit increased by 8.9% from D6.7 billion in Jan 2009 to D7.3 billion in Jan2010, supported by 6.1% growth in government borrowing, 44.2% growth in credits topublic entities and 14.7% growth in credits to the private sector, over a year.
Table-2.8 Money Supply and Demand in January 2010
Components Jan2008
MillionDalasi
Jan2009
MillionDalasi
Jan2010
MillionDalasi
Jan2009
%share
Jan2010
%share
Jan-09% ch.over
Jan-08
Jan-10% ch.
over Jan-09
1.Money Supply (M3) (2+3) 8095 9656 11388 100 100 19.3 17.9
2.Narrow Money (2.1+2.2) 4077 4900 5333 51 47 20.2 8.82.1 Currency 1577 1,867 2,011 19 18 18.4 7.7
2.2 Demand deposits 2500 3032 3,321 31 29 21.3 9.5
3.Quasi money (3.1+3.2) 4018 4757 6055 49 53 18.4 27.33.1 Savings deposits 2510 2,722 3,267 28 29 8.4 20.1
3.2 Time deposits 1508 2,035 2,788 21 24 35.0 37.0Demands for money (1+2) 8095 9656 11388 100 100 19.3 17.9
1.Net foreign assets (1.1+1.2) 3942 3243 3740 34 33 -17.7 15.31.1 Monetary Authorities 2,914 2,577 3222 27 28 -11.6 25.0
1.2 Commercial banks 1028 667 518 7 5 -35.1 -22.3
2.Net Dom. Assets (2.1+2.2) 4153 6413 7648 66 67 54.4 19.32.1 Domestic credit 4645 6704 7303 69 64 44.3 8.9
(a) Credits to government 1681 2,717 2883 28 25 61.6 6.1
(b) Credits to public entities 284 200 288 2 3 -29.5 44.2
(c) Credits to private sector 2497 3604 4132 37 36 44.3 14.7(d) Credits to forex bureau 183 183 0 2 0 0.0 -100.0
2.2 Other items, net -492 -291 345 -3 3 -41.0 -218.8
Source: Central Bank of Gambia
31
8/6/2019 Gambia Monthly Economic Bulletin March 2010
http://slidepdf.com/reader/full/gambia-monthly-economic-bulletin-march-2010 32/45
The Gambia Monthly Economic Bulletin- February 2010
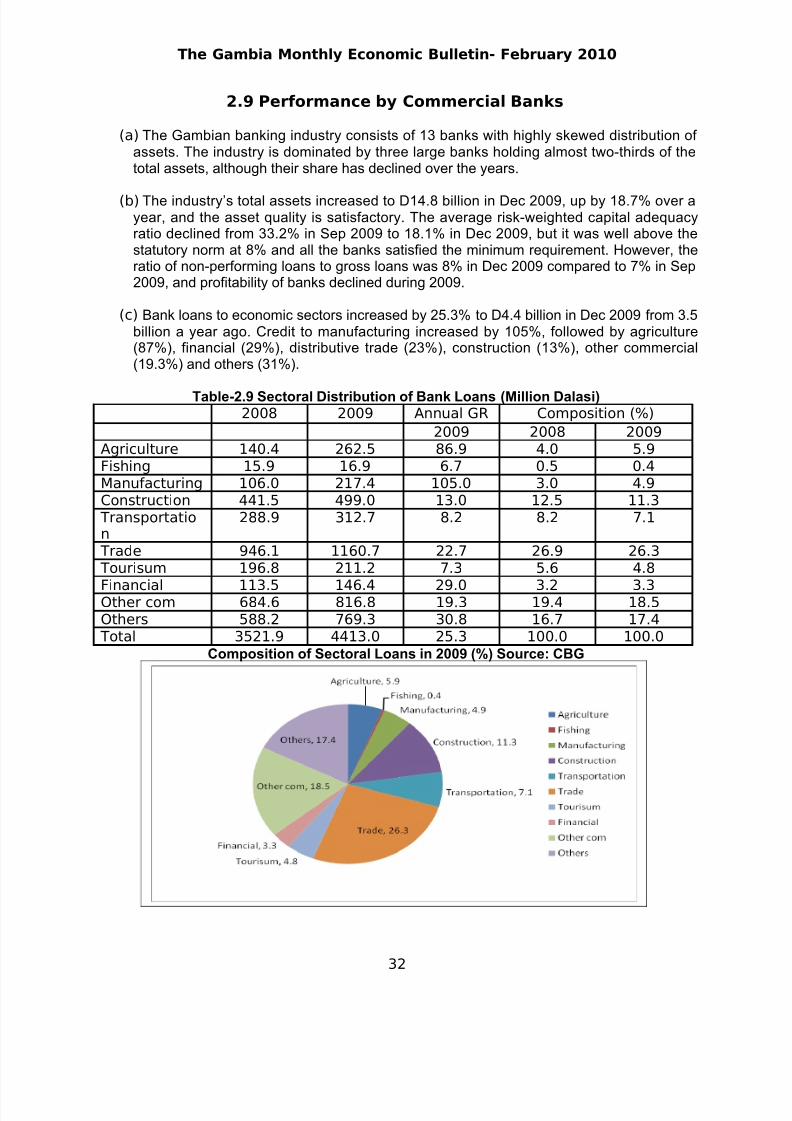
2.9 Performance by Commercial Banks
(a) The Gambian banking industry consists of 13 banks with highly skewed distribution of assets. The industry is dominated by three large banks holding almost two-thirds of thetotal assets, although their share has declined over the years.
(b) The industry’s total assets increased to D14.8 billion in Dec 2009, up by 18.7% over ayear, and the asset quality is satisfactory. The average risk-weighted capital adequacyratio declined from 33.2% in Sep 2009 to 18.1% in Dec 2009, but it was well above thestatutory norm at 8% and all the banks satisfied the minimum requirement. However, theratio of non-performing loans to gross loans was 8% in Dec 2009 compared to 7% in Sep2009, and profitability of banks declined during 2009.
(c) Bank loans to economic sectors increased by 25.3% to D4.4 billion in Dec 2009 from 3.5billion a year ago. Credit to manufacturing increased by 105%, followed by agriculture(87%), financial (29%), distributive trade (23%), construction (13%), other commercial(19.3%) and others (31%).
Table-2.9 Sectoral Distribution of Bank Loans (Million Dalasi)2008 2009 Annual GR Composition (%)
2009 2008 2009Agriculture 140.4 262.5 86.9 4.0 5.9Fishing 15.9 16.9 6.7 0.5 0.4Manufacturing 106.0 217.4 105.0 3.0 4.9Construction 441.5 499.0 13.0 12.5 11.3
Transportation
288.9 312.7 8.2 8.2 7.1
Trade 946.1 1160.7 22.7 26.9 26.3 Tourisum 196.8 211.2 7.3 5.6 4.8
Financial 113.5 146.4 29.0 3.2 3.3Other com 684.6 816.8 19.3 19.4 18.5Others 588.2 769.3 30.8 16.7 17.4
Total 3521.9 4413.0 25.3 100.0 100.0
Composition of Sectoral Loans in 2009 (%) Source: CBG
32
8/6/2019 Gambia Monthly Economic Bulletin March 2010
http://slidepdf.com/reader/full/gambia-monthly-economic-bulletin-march-2010 33/45
The Gambia Monthly Economic Bulletin- February 2010
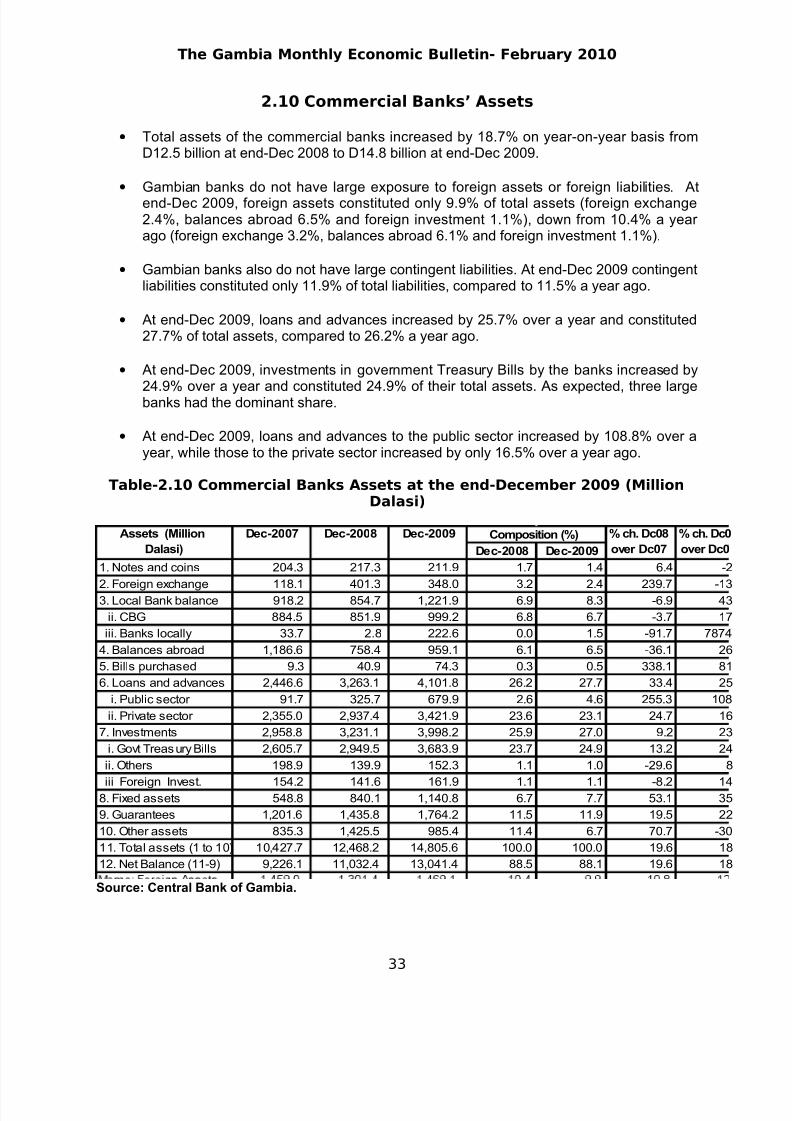
2.10 Commercial Banks’ Assets
• Total assets of the commercial banks increased by 18.7% on year-on-year basis fromD12.5 billion at end-Dec 2008 to D14.8 billion at end-Dec 2009.
• Gambian banks do not have large exposure to foreign assets or foreign liabilities. Atend-Dec 2009, foreign assets constituted only 9.9% of total assets (foreign exchange2.4%, balances abroad 6.5% and foreign investment 1.1%), down from 10.4% a year ago (foreign exchange 3.2%, balances abroad 6.1% and foreign investment 1.1%).
• Gambian banks also do not have large contingent liabilities. At end-Dec 2009 contingentliabilities constituted only 11.9% of total liabilities, compared to 11.5% a year ago.
• At end-Dec 2009, loans and advances increased by 25.7% over a year and constituted27.7% of total assets, compared to 26.2% a year ago.
• At end-Dec 2009, investments in government Treasury Bills by the banks increased by
24.9% over a year and constituted 24.9% of their total assets. As expected, three largebanks had the dominant share.
• At end-Dec 2009, loans and advances to the public sector increased by 108.8% over ayear, while those to the private sector increased by only 16.5% over a year ago.
Table-2.10 Commercial Banks Assets at the end-December 2009 (MillionDalasi)
Dec-2008 Dec-2009
1. Notes and coins 204.3 217.3 211.9 1.7 1.4 6.4 -2
2. Foreign exchange 118.1 401.3 348.0 3.2 2.4 239.7 -133. Local Bank balance 918.2 854.7 1,221.9 6.9 8.3 -6.9 43
ii. CBG 884.5 851.9 999.2 6.8 6.7 -3.7 17
iii. Banks locally 33.7 2.8 222.6 0.0 1.5 -91.7 7874
4. Balances abroad 1,186.6 758.4 959.1 6.1 6.5 -36.1 26
5. Bills purchased 9.3 40.9 74.3 0.3 0.5 338.1 81
6. Loans and advances 2,446.6 3,263.1 4,101.8 26.2 27.7 33.4 25
i. Public sector 91.7 325.7 679.9 2.6 4.6 255.3 108
ii. Private sector 2,355.0 2,937.4 3,421.9 23.6 23.1 24.7 16
7. Investments 2,958.8 3,231.1 3,998.2 25.9 27.0 9.2 23
i. Govt Treasury Bills 2,605.7 2,949.5 3,683.9 23.7 24.9 13.2 24
ii. Others 198.9 139.9 152.3 1.1 1.0 -29.6 8
iii Foreign Invest. 154.2 141.6 161.9 1.1 1.1 -8.2 148. Fixed assets 548.8 840.1 1,140.8 6.7 7.7 53.1 35
9. Guarantees 1,201.6 1,435.8 1,764.2 11.5 11.9 19.5 22
10. Other assets 835.3 1,425.5 985.4 11.4 6.7 70.7 -30
11. Total assets (1 to 10) 10,427.7 12,468.2 14,805.6 100.0 100.0 19.6 18
12. Net Balance (11-9) 9,226.1 11,032.4 13,041.4 88.5 88.1 19.6 18
% ch. Dc0
over Dc0
Assets (Million
Dalasi)
Dec-2007 Dec-2008 Dec-2009 Composition (%) % ch. Dc08
over Dc07
Source: Central Bank of Gambia.
33
8/6/2019 Gambia Monthly Economic Bulletin March 2010
http://slidepdf.com/reader/full/gambia-monthly-economic-bulletin-march-2010 34/45
The Gambia Monthly Economic Bulletin- February 2010
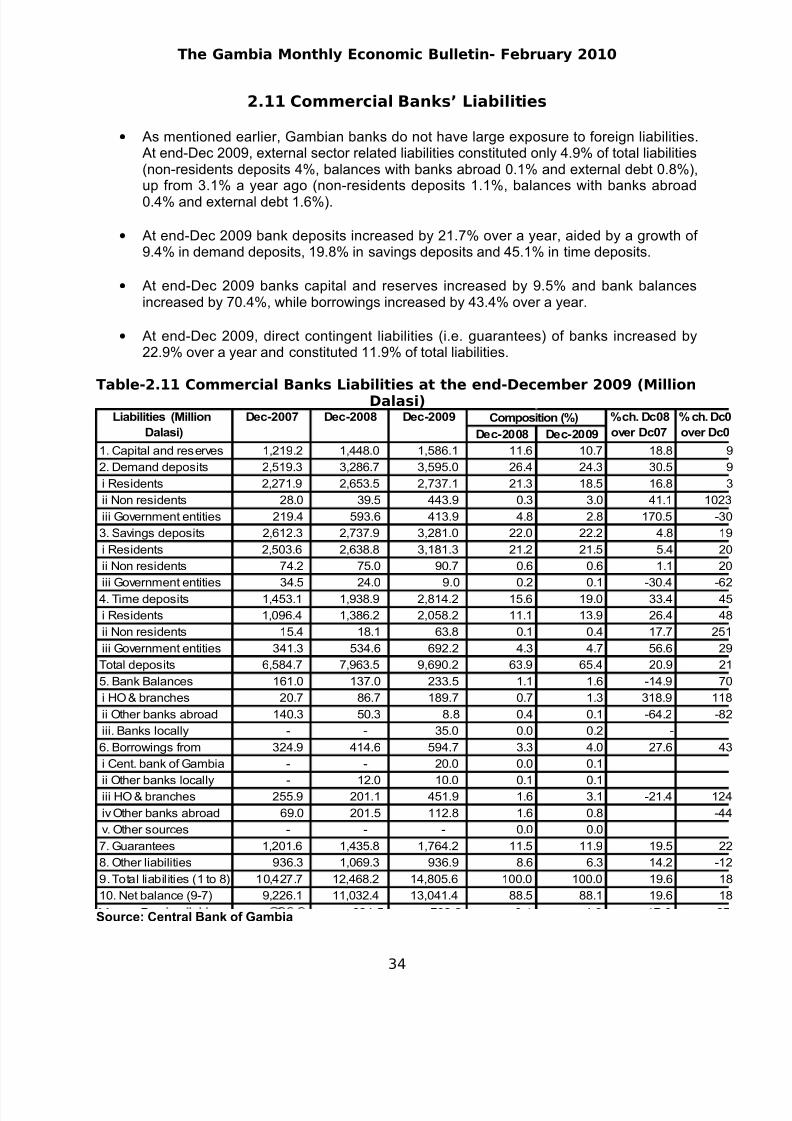
2.11 Commercial Banks’ Liabilities
• As mentioned earlier, Gambian banks do not have large exposure to foreign liabilities.At end-Dec 2009, external sector related liabilities constituted only 4.9% of total liabilities(non-residents deposits 4%, balances with banks abroad 0.1% and external debt 0.8%),up from 3.1% a year ago (non-residents deposits 1.1%, balances with banks abroad0.4% and external debt 1.6%).
• At end-Dec 2009 bank deposits increased by 21.7% over a year, aided by a growth of 9.4% in demand deposits, 19.8% in savings deposits and 45.1% in time deposits.
• At end-Dec 2009 banks capital and reserves increased by 9.5% and bank balancesincreased by 70.4%, while borrowings increased by 43.4% over a year.
• At end-Dec 2009, direct contingent liabilities (i.e. guarantees) of banks increased by22.9% over a year and constituted 11.9% of total liabilities.
Table-2.11 Commercial Banks Liabilities at the end-December 2009 (MillionDalasi)
Dec-2008 Dec-2009
1. Capital and reserves 1,219.2 1,448.0 1,586.1 11.6 10.7 18.8 9
2. Demand deposits 2,519.3 3,286.7 3,595.0 26.4 24.3 30.5 9
i Residents 2,271.9 2,653.5 2,737.1 21.3 18.5 16.8 3
ii Non residents 28.0 39.5 443.9 0.3 3.0 41.1 1023
iii Government entities 219.4 593.6 413.9 4.8 2.8 170.5 -30
3. Savings deposits 2,612.3 2,737.9 3,281.0 22.0 22.2 4.8 19
i Residents 2,503.6 2,638.8 3,181.3 21.2 21.5 5.4 20
ii Non residents 74.2 75.0 90.7 0.6 0.6 1.1 20
iii Government entities 34.5 24.0 9.0 0.2 0.1 -30.4 -62
4. Time deposits 1,453.1 1,938.9 2,814.2 15.6 19.0 33.4 45
i Residents 1,096.4 1,386.2 2,058.2 11.1 13.9 26.4 48
ii Non residents 15.4 18.1 63.8 0.1 0.4 17.7 251
iii Government entities 341.3 534.6 692.2 4.3 4.7 56.6 29
Total deposits 6,584.7 7,963.5 9,690.2 63.9 65.4 20.9 21
5. Bank Balances 161.0 137.0 233.5 1.1 1.6 -14.9 70
i HO & branches 20.7 86.7 189.7 0.7 1.3 318.9 118
ii Other banks abroad 140.3 50.3 8.8 0.4 0.1 -64.2 -82
iii. Banks locally - - 35.0 0.0 0.2 -
6. Borrowings from 324.9 414.6 594.7 3.3 4.0 27.6 43
i Cent. bank of Gambia - - 20.0 0.0 0.1
ii Other banks locally - 12.0 10.0 0.1 0.1iii HO & branches 255.9 201.1 451.9 1.6 3.1 -21.4 124
iv Other banks abroad 69.0 201.5 112.8 1.6 0.8 -44
v. Other sources - - - 0.0 0.0
7. Guarantees 1,201.6 1,435.8 1,764.2 11.5 11.9 19.5 22
8. Other liabilities 936.3 1,069.3 936.9 8.6 6.3 14.2 -12
9. Total liabilities (1 to 8) 10,427.7 12,468.2 14,805.6 100.0 100.0 19.6 18
10. Net balance (9-7) 9,226.1 11,032.4 13,041.4 88.5 88.1 19.6 18
Dec-2007 Dec-2008 Dec-2009 % ch. Dc08
over Dc07
% ch. Dc0
over Dc0
Composition (%)Liabilities (Million
Dalasi)
Source: Central Bank of Gambia
34
8/6/2019 Gambia Monthly Economic Bulletin March 2010
http://slidepdf.com/reader/full/gambia-monthly-economic-bulletin-march-2010 35/45
8/6/2019 Gambia Monthly Economic Bulletin March 2010
http://slidepdf.com/reader/full/gambia-monthly-economic-bulletin-march-2010 36/45
The Gambia Monthly Economic Bulletin- February 2010
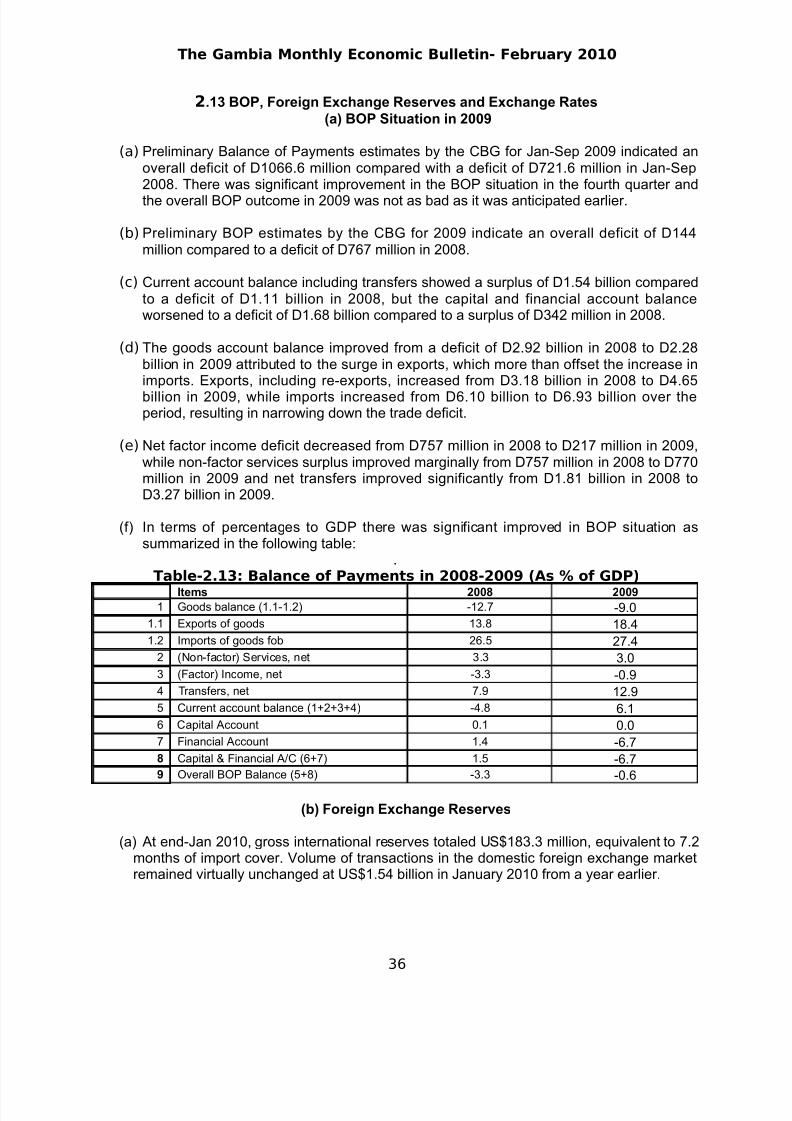
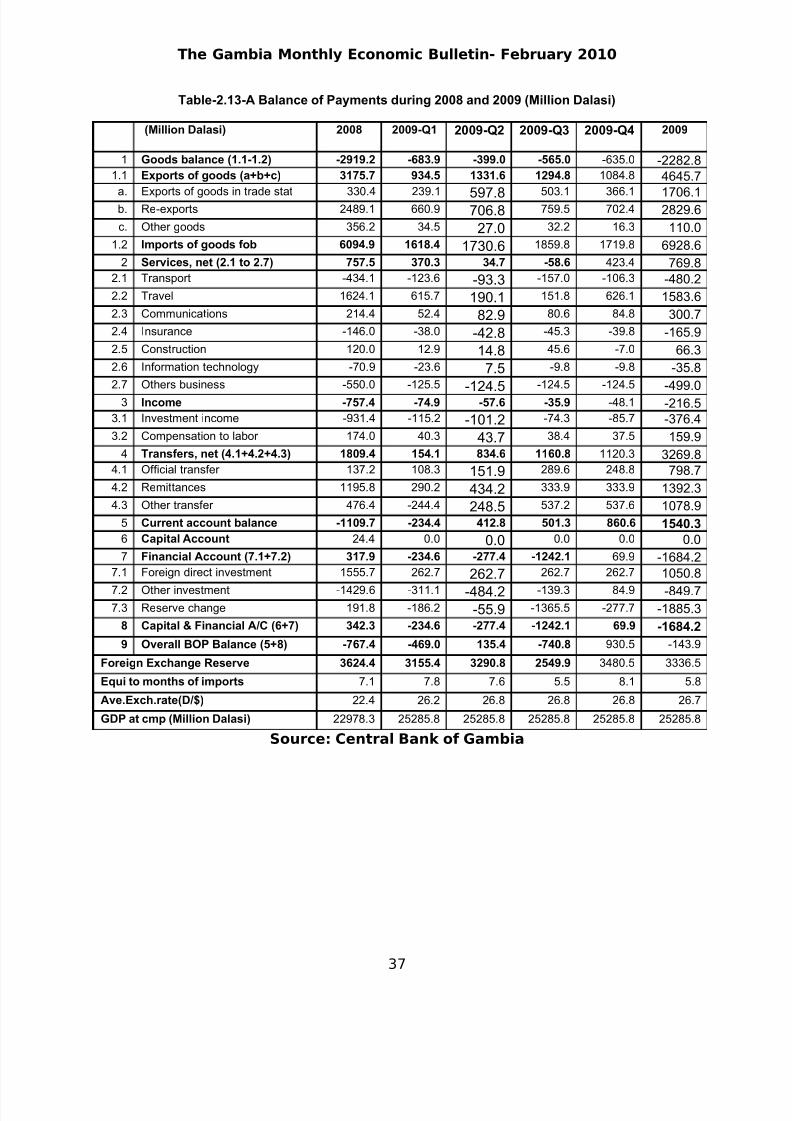
2.13 BOP, Foreign Exchange Reserves and Exchange Rates(a) BOP Situation in 2009
(a) Preliminary Balance of Payments estimates by the CBG for Jan-Sep 2009 indicated anoverall deficit of D1066.6 million compared with a deficit of D721.6 million in Jan-Sep2008. There was significant improvement in the BOP situation in the fourth quarter and
the overall BOP outcome in 2009 was not as bad as it was anticipated earlier.
(b) Preliminary BOP estimates by the CBG for 2009 indicate an overall deficit of D144million compared to a deficit of D767 million in 2008.
(c) Current account balance including transfers showed a surplus of D1.54 billion comparedto a deficit of D1.11 billion in 2008, but the capital and financial account balanceworsened to a deficit of D1.68 billion compared to a surplus of D342 million in 2008.
(d) The goods account balance improved from a deficit of D2.92 billion in 2008 to D2.28billion in 2009 attributed to the surge in exports, which more than offset the increase inimports. Exports, including re-exports, increased from D3.18 billion in 2008 to D4.65
billion in 2009, while imports increased from D6.10 billion to D6.93 billion over theperiod, resulting in narrowing down the trade deficit.
(e) Net factor income deficit decreased from D757 million in 2008 to D217 million in 2009,while non-factor services surplus improved marginally from D757 million in 2008 to D770million in 2009 and net transfers improved significantly from D1.81 billion in 2008 toD3.27 billion in 2009.
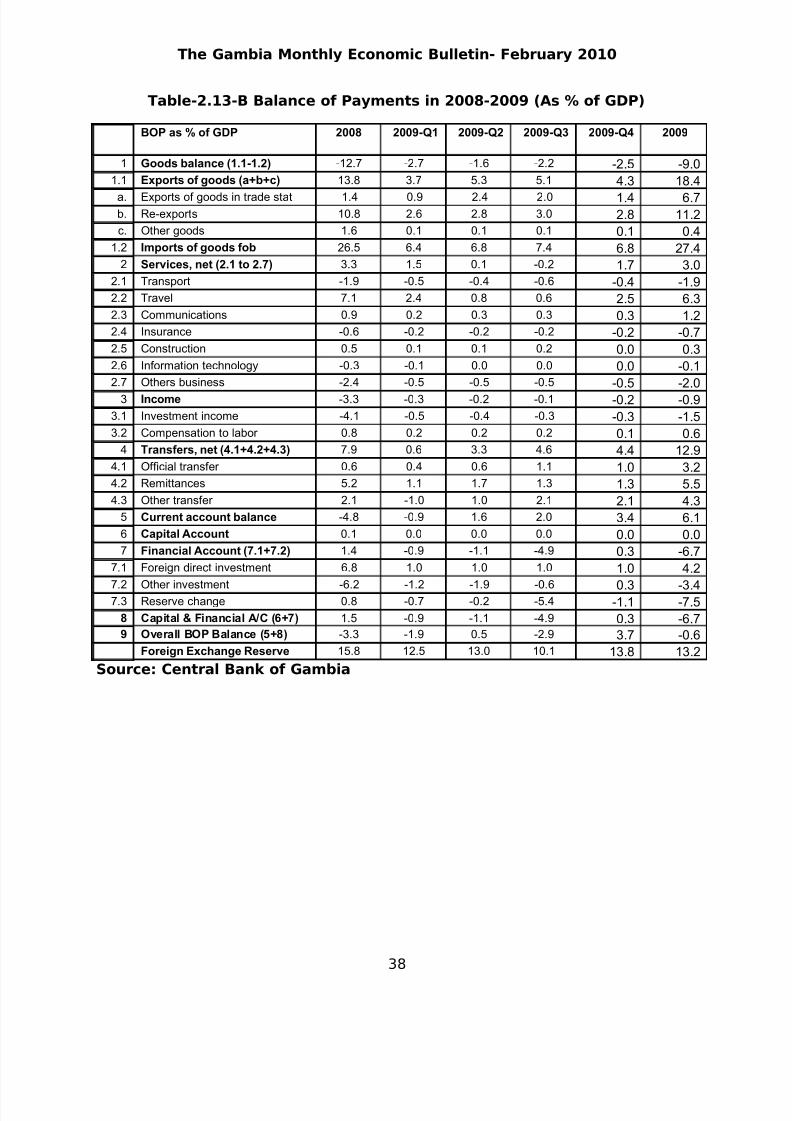
(f) In terms of percentages to GDP there was significant improved in BOP situation assummarized in the following table:
.Table-2.13: Balance of Payments in 2008-2009 (As % of GDP)
Items 2008 20091 Goods balance (1.1-1.2) -12.7 -9.0
1.1 Exports of goods 13.8 18.41.2 Imports of goods fob 26.5 27.4
2 (Non-factor) Services, net 3.3 3.03 (Factor) Income, net -3.3 -0.94 Transfers, net 7.9 12.95 Current account balance (1+2+3+4) -4.8 6.16 Capital Account 0.1 0.07 Financial Account 1.4 -6.78 Capital & Financial A/C (6+7) 1.5 -6.79 Overall BOP Balance (5+8) -3.3 -0.6
(b) Foreign Exchange Reserves
(a) At end-Jan 2010, gross international reserves totaled US$183.3 million, equivalent to 7.2months of import cover. Volume of transactions in the domestic foreign exchange marketremained virtually unchanged at US$1.54 billion in January 2010 from a year earlier.
36
8/6/2019 Gambia Monthly Economic Bulletin March 2010
http://slidepdf.com/reader/full/gambia-monthly-economic-bulletin-march-2010 37/45
The Gambia Monthly Economic Bulletin- February 2010
Table-2.13-A Balance of Payments during 2008 and 2009 (Million Dalasi)
(Million Dalasi) 2008 2009-Q1 2009-Q2 2009-Q3 2009-Q4 2009
1 Goods balance (1.1-1.2) -2919.2 -683.9 -399.0 -565.0 -635.0 -2282.81.1 Exports of goods (a+b+c) 3175.7 934.5 1331.6 1294.8 1084.8 4645.7
a. Exports of goods in trade stat 330.4 239.1 597.8 503.1 366.1 1706.1b. Re-exports 2489.1 660.9 706.8 759.5 702.4 2829.6
c. Other goods 356.2 34.5 27.0 32.2 16.3 110.0
1.2 Imports of goods fob 6094.9 1618.4 1730.6 1859.8 1719.8 6928.6
2 Services, net (2.1 to 2.7) 757.5 370.3 34.7 -58.6 423.4 769.82.1 Transport -434.1 -123.6 -93.3 -157.0 -106.3 -480.2
2.2 Travel 1624.1 615.7 190.1 151.8 626.1 1583.6
2.3 Communications 214.4 52.4 82.9 80.6 84.8 300.7
2.4 Insurance -146.0 -38.0 -42.8 -45.3 -39.8 -165.9
2.5 Construction 120.0 12.9 14.8 45.6 -7.0 66.3
2.6 Information technology -70.9 -23.6 7.5 -9.8 -9.8 -35.8
2.7 Others business -550.0 -125.5
-124.5-124.5 -124.5 -499.0
3 Income -757.4 -74.9 -57.6 -35.9 -48.1 -216.53.1 Investment income -931.4 -115.2 -101.2 -74.3 -85.7 -376.4
3.2 Compensation to labor 174.0 40.3 43.7 38.4 37.5 159.9
4 Transfers, net (4.1+4.2+4.3) 1809.4 154.1 834.6 1160.8 1120.3 3269.84.1 Official transfer 137.2 108.3 151.9 289.6 248.8 798.7
4.2 Remittances 1195.8 290.2 434.2 333.9 333.9 1392.3
4.3 Other transfer 476.4 -244.4 248.5 537.2 537.6 1078.9
5 Current account balance -1109.7 -234.4 412.8 501.3 860.6 1540.36 Capital Account 24.4 0.0 0.0 0.0 0.0 0.0
7 Financial Account (7.1+7.2) 317.9 -234.6 -277.4 -1242.1 69.9 -1684.27.1 Foreign direct investment 1555.7 262.7 262.7 262.7 262.7 1050.8
7.2 Other investment -1429.6 -311.1 -484.2 -139.3 84.9 -849.77.3 Reserve change 191.8 -186.2 -55.9 -1365.5 -277.7 -1885.3
8 Capital & Financial A/C (6+7) 342.3 -234.6 -277.4 -1242.1 69.9 -1684.2
9 Overall BOP Balance (5+8) -767.4 -469.0 135.4 -740.8 930.5 -143.9
Foreign Exchange Reserve 3624.4 3155.4 3290.8 2549.9 3480.5 3336.5
Equi to months of imports 7.1 7.8 7.6 5.5 8.1 5.8
Ave.Exch.rate(D/$) 22.4 26.2 26.8 26.8 26.8 26.7
GDP at cmp (Million Dalasi) 22978.3 25285.8 25285.8 25285.8 25285.8 25285.8
Source: Central Bank of Gambia
37
8/6/2019 Gambia Monthly Economic Bulletin March 2010
http://slidepdf.com/reader/full/gambia-monthly-economic-bulletin-march-2010 38/45
The Gambia Monthly Economic Bulletin- February 2010
Table-2.13-B Balance of Payments in 2008-2009 (As % of GDP)
BOP as % of GDP 2008 2009-Q1 2009-Q2 2009-Q3 2009-Q4 2009
1 Goods balance (1.1-1.2) -12.7 -2.7 -1.6 -2.2 -2.5 -9.01.1 Exports of goods (a+b+c) 13.8 3.7 5.3 5.1 4.3 18.4
a. Exports of goods in trade stat 1.4 0.9 2.4 2.0 1.4 6.7b. Re-exports 10.8 2.6 2.8 3.0 2.8 11.2c. Other goods 1.6 0.1 0.1 0.1 0.1 0.4
1.2 Imports of goods fob 26.5 6.4 6.8 7.4 6.8 27.42 Services, net (2.1 to 2.7) 3.3 1.5 0.1 -0.2 1.7 3.0
2.1 Transport -1.9 -0.5 -0.4 -0.6 -0.4 -1.92.2 Travel 7.1 2.4 0.8 0.6 2.5 6.32.3 Communications 0.9 0.2 0.3 0.3 0.3 1.22.4 Insurance -0.6 -0.2 -0.2 -0.2 -0.2 -0.72.5 Construction 0.5 0.1 0.1 0.2 0.0 0.32.6 Information technology -0.3 -0.1 0.0 0.0 0.0 -0.12.7 Others business -2.4 -0.5 -0.5 -0.5 -0.5 -2.0
3 Income -3.3 -0.3 -0.2 -0.1 -0.2 -0.93.1 Investment income -4.1 -0.5 -0.4 -0.3 -0.3 -1.53.2 Compensation to labor 0.8 0.2 0.2 0.2 0.1 0.6
4 Transfers, net (4.1+4.2+4.3) 7.9 0.6 3.3 4.6 4.4 12.94.1 Official transfer 0.6 0.4 0.6 1.1 1.0 3.24.2 Remittances 5.2 1.1 1.7 1.3 1.3 5.54.3 Other transfer 2.1 -1.0 1.0 2.1 2.1 4.3
5 Current account balance -4.8 -0.9 1.6 2.0 3.4 6.16 Capital Account 0.1 0.0 0.0 0.0 0.0 0.07 Financial Account (7.1+7.2) 1.4 -0.9 -1.1 -4.9 0.3 -6.7
7.1 Foreign direct investment 6.8 1.0 1.0 1.0 1.0 4.2
7.2 Other investment -6.2 -1.2 -1.9 -0.6 0.3 -3.47.3 Reserve change 0.8 -0.7 -0.2 -5.4 -1.1 -7.5
8 Capital & Financial A/C (6+7) 1.5 -0.9 -1.1 -4.9 0.3 -6.79 Overall BOP Balance (5+8) -3.3 -1.9 0.5 -2.9 3.7 -0.6
Foreign Exchange Reserve 15.8 12.5 13.0 10.1 13.8 13.2
Source: Central Bank of Gambia
38
8/6/2019 Gambia Monthly Economic Bulletin March 2010
http://slidepdf.com/reader/full/gambia-monthly-economic-bulletin-march-2010 39/45
The Gambia Monthly Economic Bulletin- February 2010
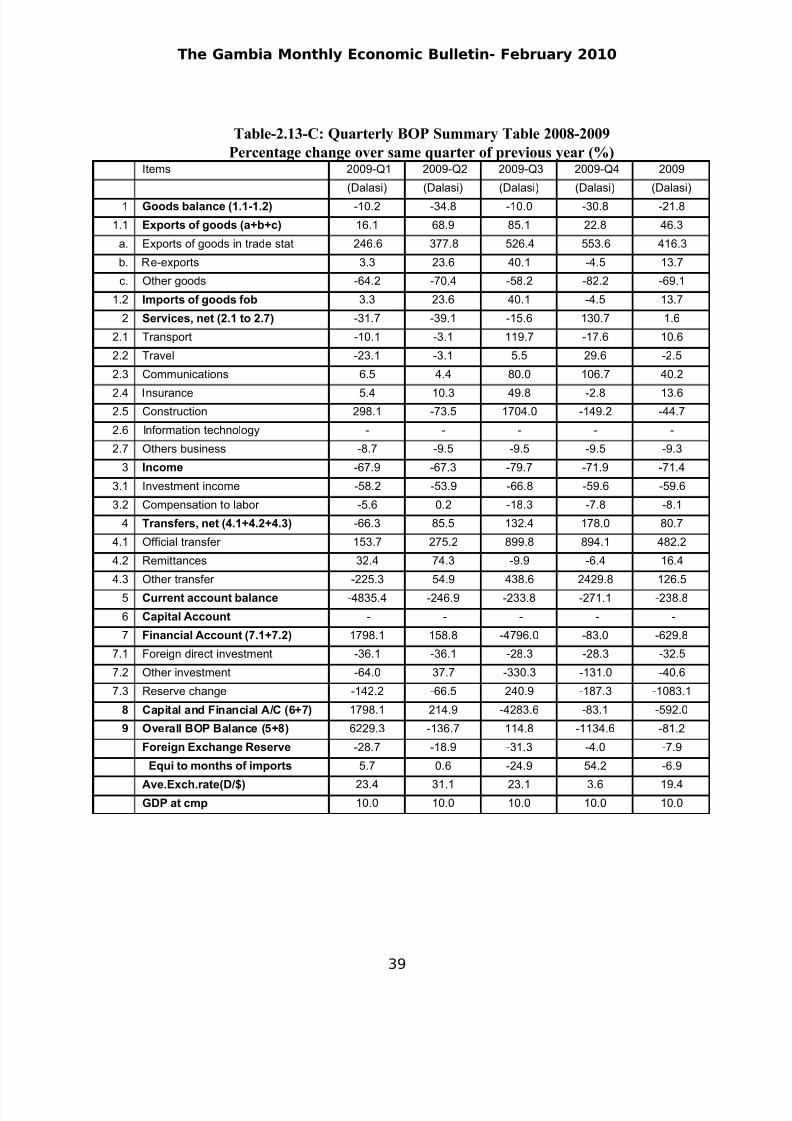
Table-2.13-C: Quarterly BOP Summary Table 2008-2009
Percentage change over same quarter of previous year (%)Items 2009-Q1 2009-Q2 2009-Q3 2009-Q4 2009
(Dalasi) (Dalasi) (Dalasi) (Dalasi) (Dalasi)
1 Goods balance (1.1-1.2) -10.2 -34.8 -10.0 -30.8 -21.8
1.1 Exports of goods (a+b+c) 16.1 68.9 85.1 22.8 46.3
a. Exports of goods in trade stat 246.6 377.8 526.4 553.6 416.3
b. Re-exports 3.3 23.6 40.1 -4.5 13.7
c. Other goods -64.2 -70.4 -58.2 -82.2 -69.1
1.2 Imports of goods fob 3.3 23.6 40.1 -4.5 13.7
2 Services, net (2.1 to 2.7) -31.7 -39.1 -15.6 130.7 1.6
2.1 Transport -10.1 -3.1 119.7 -17.6 10.6
2.2 Travel -23.1 -3.1 5.5 29.6 -2.5
2.3 Communications 6.5 4.4 80.0 106.7 40.2
2.4 Insurance 5.4 10.3 49.8 -2.8 13.62.5 Construction 298.1 -73.5 1704.0 -149.2 -44.7
2.6 Information technology - - - - -
2.7 Others business -8.7 -9.5 -9.5 -9.5 -9.3
3 Income -67.9 -67.3 -79.7 -71.9 -71.4
3.1 Investment income -58.2 -53.9 -66.8 -59.6 -59.6
3.2 Compensation to labor -5.6 0.2 -18.3 -7.8 -8.1
4 Transfers, net (4.1+4.2+4.3) -66.3 85.5 132.4 178.0 80.7
4.1 Official transfer 153.7 275.2 899.8 894.1 482.2
4.2 Remittances 32.4 74.3 -9.9 -6.4 16.4
4.3 Other transfer -225.3 54.9 438.6 2429.8 126.5
5 Current account balance -4835.4 -246.9 -233.8 -271.1 -238.8
6 Capital Account - - - - -
7 Financial Account (7.1+7.2) 1798.1 158.8 -4796.0 -83.0 -629.8
7.1 Foreign direct investment -36.1 -36.1 -28.3 -28.3 -32.5
7.2 Other investment -64.0 37.7 -330.3 -131.0 -40.6
7.3 Reserve change -142.2 -66.5 240.9 -187.3 -1083.1
8 Capital and Financial A/C (6+7) 1798.1 214.9 -4283.6 -83.1 -592.0
9 Overall BOP Balance (5+8) 6229.3 -136.7 114.8 -1134.6 -81.2
Foreign Exchange Reserve -28.7 -18.9 -31.3 -4.0 -7.9
Equi to months of imports 5.7 0.6 -24.9 54.2 -6.9
Ave.Exch.rate(D/$) 23.4 31.1 23.1 3.6 19.4GDP at cmp 10.0 10.0 10.0 10.0 10.0
39
8/6/2019 Gambia Monthly Economic Bulletin March 2010
http://slidepdf.com/reader/full/gambia-monthly-economic-bulletin-march-2010 40/45
The Gambia Monthly Economic Bulletin- February 2010
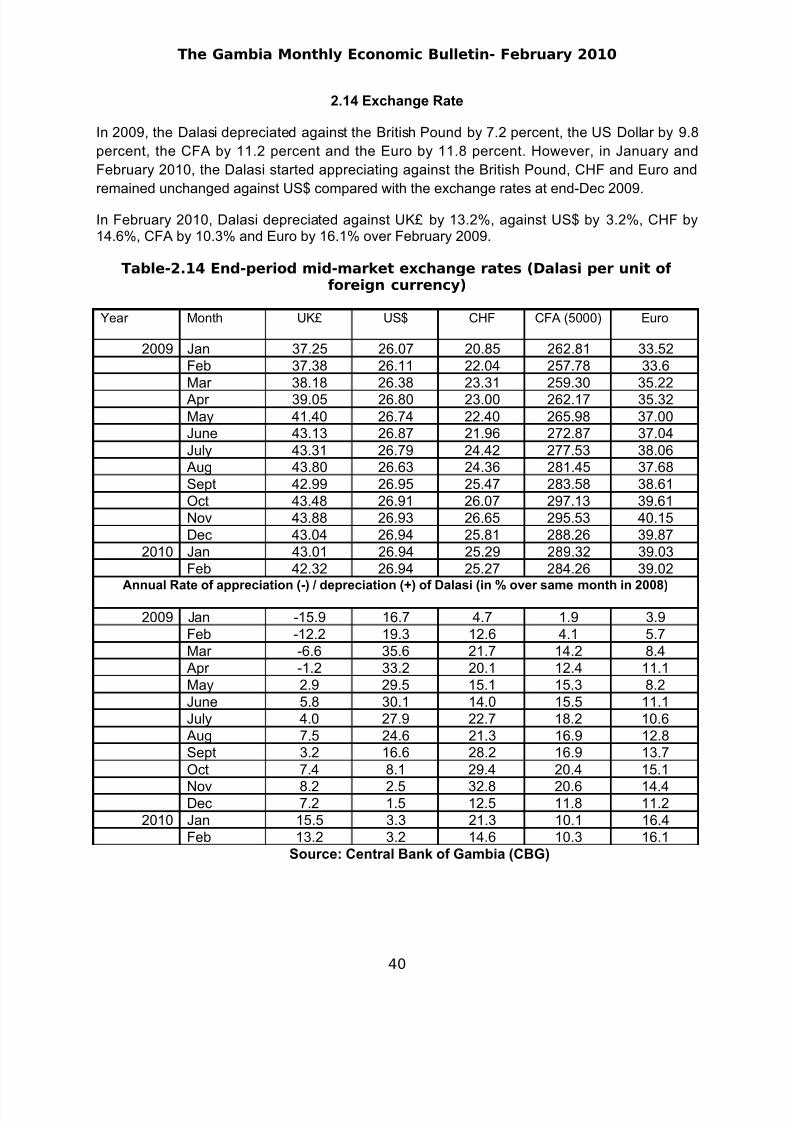
2.14 Exchange Rate
In 2009, the Dalasi depreciated against the British Pound by 7.2 percent, the US Dollar by 9.8
percent, the CFA by 11.2 percent and the Euro by 11.8 percent. However, in January and
February 2010, the Dalasi started appreciating against the British Pound, CHF and Euro and
remained unchanged against US$ compared with the exchange rates at end-Dec 2009.
In February 2010, Dalasi depreciated against UK£ by 13.2%, against US$ by 3.2%, CHF by14.6%, CFA by 10.3% and Euro by 16.1% over February 2009.
Table-2.14 End-period mid-market exchange rates (Dalasi per unit of foreign currency)
Year Month UK£ US$ CHF CFA (5000) Euro
2009 Jan 37.25 26.07 20.85 262.81 33.52Feb 37.38 26.11 22.04 257.78 33.6Mar 38.18 26.38 23.31 259.30 35.22Apr 39.05 26.80 23.00 262.17 35.32May 41.40 26.74 22.40 265.98 37.00June 43.13 26.87 21.96 272.87 37.04July 43.31 26.79 24.42 277.53 38.06Aug 43.80 26.63 24.36 281.45 37.68Sept 42.99 26.95 25.47 283.58 38.61Oct 43.48 26.91 26.07 297.13 39.61Nov 43.88 26.93 26.65 295.53 40.15Dec 43.04 26.94 25.81 288.26 39.87
2010 Jan 43.01 26.94 25.29 289.32 39.03Feb 42.32 26.94 25.27 284.26 39.02
Annual Rate of appreciation (-) / depreciation (+) of Dalasi (in % over same month in 2008)
2009 Jan -15.9 16.7 4.7 1.9 3.9Feb -12.2 19.3 12.6 4.1 5.7Mar -6.6 35.6 21.7 14.2 8.4Apr -1.2 33.2 20.1 12.4 11.1May 2.9 29.5 15.1 15.3 8.2June 5.8 30.1 14.0 15.5 11.1July 4.0 27.9 22.7 18.2 10.6Aug 7.5 24.6 21.3 16.9 12.8Sept 3.2 16.6 28.2 16.9 13.7Oct 7.4 8.1 29.4 20.4 15.1
Nov 8.2 2.5 32.8 20.6 14.4Dec 7.2 1.5 12.5 11.8 11.2
2010 Jan 15.5 3.3 21.3 10.1 16.4Feb 13.2 3.2 14.6 10.3 16.1
Source: Central Bank of Gambia (CBG)
40
8/6/2019 Gambia Monthly Economic Bulletin March 2010
http://slidepdf.com/reader/full/gambia-monthly-economic-bulletin-march-2010 41/45
The Gambia Monthly Economic Bulletin- February 2010
3. Recent Policy Developments and Development Issues
3.1 Highlights of the Budget-2010
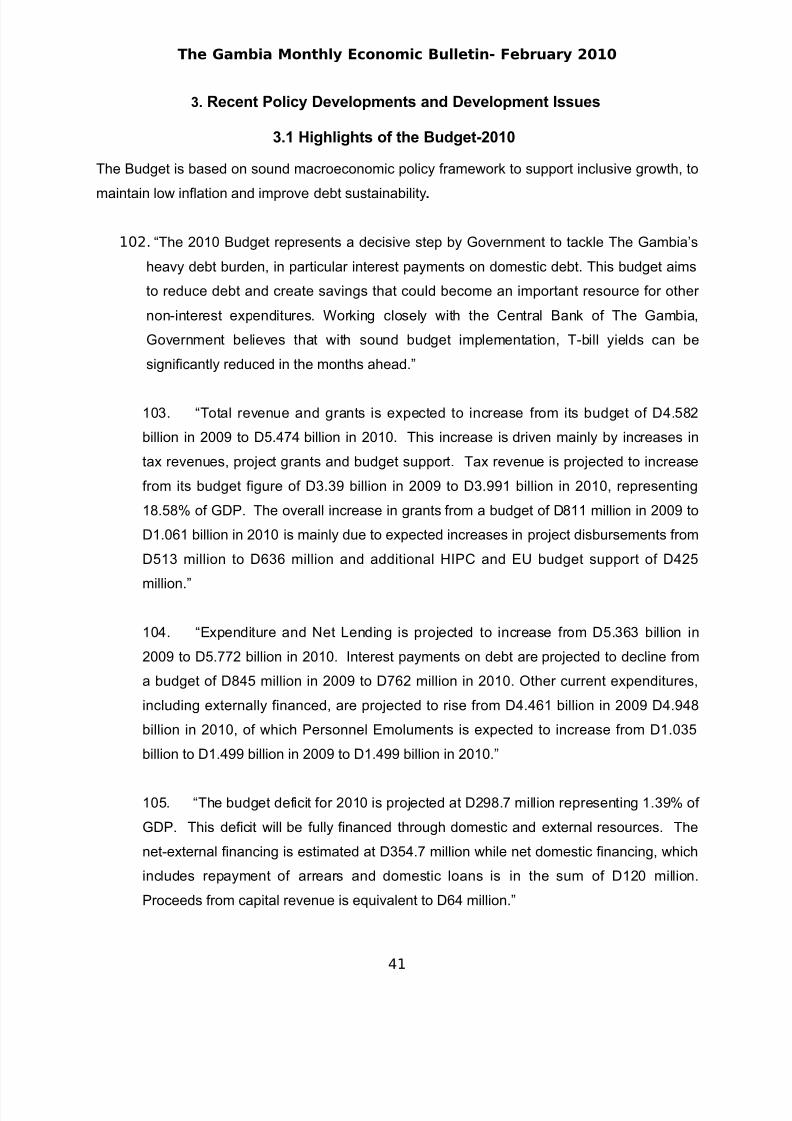
The Budget is based on sound macroeconomic policy framework to support inclusive growth, to
maintain low inflation and improve debt sustainability.
102. “The 2010 Budget represents a decisive step by Government to tackle The Gambia’s
heavy debt burden, in particular interest payments on domestic debt. This budget aims
to reduce debt and create savings that could become an important resource for other
non-interest expenditures. Working closely with the Central Bank of The Gambia,
Government believes that with sound budget implementation, T-bill yields can be
significantly reduced in the months ahead.”
103. “Total revenue and grants is expected to increase from its budget of D4.582
billion in 2009 to D5.474 billion in 2010. This increase is driven mainly by increases in
tax revenues, project grants and budget support. Tax revenue is projected to increase
from its budget figure of D3.39 billion in 2009 to D3.991 billion in 2010, representing
18.58% of GDP. The overall increase in grants from a budget of D811 million in 2009 to
D1.061 billion in 2010 is mainly due to expected increases in project disbursements from
D513 million to D636 million and additional HIPC and EU budget support of D425
million.”
104. “Expenditure and Net Lending is projected to increase from D5.363 billion in
2009 to D5.772 billion in 2010. Interest payments on debt are projected to decline from
a budget of D845 million in 2009 to D762 million in 2010. Other current expenditures,
including externally financed, are projected to rise from D4.461 billion in 2009 D4.948
billion in 2010, of which Personnel Emoluments is expected to increase from D1.035
billion to D1.499 billion in 2009 to D1.499 billion in 2010.”
105. “The budget deficit for 2010 is projected at D298.7 million representing 1.39% of
GDP. This deficit will be fully financed through domestic and external resources. The
net-external financing is estimated at D354.7 million while net domestic financing, which
includes repayment of arrears and domestic loans is in the sum of D120 million.
Proceeds from capital revenue is equivalent to D64 million.”
41

8/6/2019 Gambia Monthly Economic Bulletin March 2010
http://slidepdf.com/reader/full/gambia-monthly-economic-bulletin-march-2010 42/45
The Gambia Monthly Economic Bulletin- February 2010
42
8/6/2019 Gambia Monthly Economic Bulletin March 2010
http://slidepdf.com/reader/full/gambia-monthly-economic-bulletin-march-2010 43/45
The Gambia Monthly Economic Bulletin- February 2010
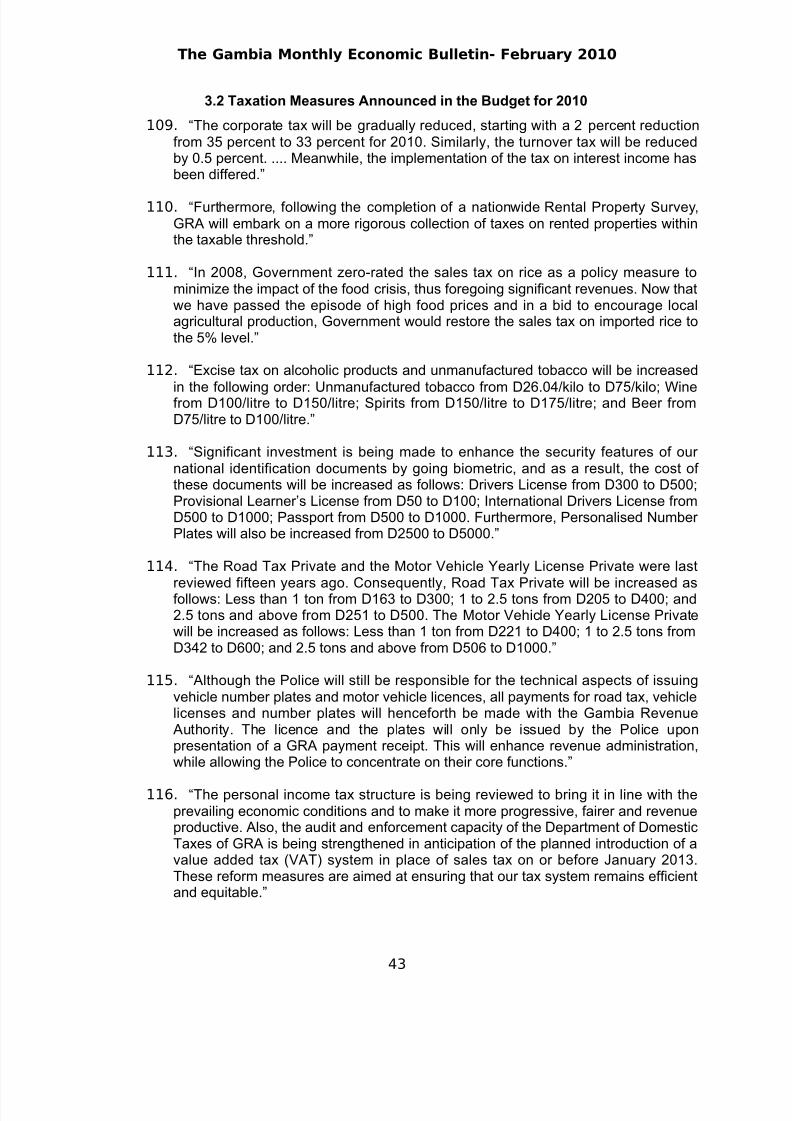
3.2 Taxation Measures Announced in the Budget for 2010
109. “The corporate tax will be gradually reduced, starting with a 2 percent reductionfrom 35 percent to 33 percent for 2010. Similarly, the turnover tax will be reducedby 0.5 percent. .... Meanwhile, the implementation of the tax on interest income hasbeen differed.”
110. “Furthermore, following the completion of a nationwide Rental Property Survey,GRA will embark on a more rigorous collection of taxes on rented properties withinthe taxable threshold.”
111. “In 2008, Government zero-rated the sales tax on rice as a policy measure tominimize the impact of the food crisis, thus foregoing significant revenues. Now thatwe have passed the episode of high food prices and in a bid to encourage localagricultural production, Government would restore the sales tax on imported rice tothe 5% level.”
112. “Excise tax on alcoholic products and unmanufactured tobacco will be increased
in the following order: Unmanufactured tobacco from D26.04/kilo to D75/kilo; Winefrom D100/litre to D150/litre; Spirits from D150/litre to D175/litre; and Beer fromD75/litre to D100/litre.”
113. “Significant investment is being made to enhance the security features of our national identification documents by going biometric, and as a result, the cost of these documents will be increased as follows: Drivers License from D300 to D500;Provisional Learner’s License from D50 to D100; International Drivers License fromD500 to D1000; Passport from D500 to D1000. Furthermore, Personalised Number Plates will also be increased from D2500 to D5000.”
114. “The Road Tax Private and the Motor Vehicle Yearly License Private were last
reviewed fifteen years ago. Consequently, Road Tax Private will be increased asfollows: Less than 1 ton from D163 to D300; 1 to 2.5 tons from D205 to D400; and2.5 tons and above from D251 to D500. The Motor Vehicle Yearly License Privatewill be increased as follows: Less than 1 ton from D221 to D400; 1 to 2.5 tons fromD342 to D600; and 2.5 tons and above from D506 to D1000.”
115. “Although the Police will still be responsible for the technical aspects of issuingvehicle number plates and motor vehicle licences, all payments for road tax, vehiclelicenses and number plates will henceforth be made with the Gambia RevenueAuthority. The licence and the plates will only be issued by the Police uponpresentation of a GRA payment receipt. This will enhance revenue administration,while allowing the Police to concentrate on their core functions.”
116. “The personal income tax structure is being reviewed to bring it in line with theprevailing economic conditions and to make it more progressive, fairer and revenueproductive. Also, the audit and enforcement capacity of the Department of DomesticTaxes of GRA is being strengthened in anticipation of the planned introduction of avalue added tax (VAT) system in place of sales tax on or before January 2013.These reform measures are aimed at ensuring that our tax system remains efficientand equitable.”
43
8/6/2019 Gambia Monthly Economic Bulletin March 2010
http://slidepdf.com/reader/full/gambia-monthly-economic-bulletin-march-2010 44/45
The Gambia Monthly Economic Bulletin- February 2010
3.3 IMF Executive Board Completes Sixth Review Under The Gambia’s ECF Arrangementand Approves a 12-Month Extension and US$ US$7.1 Million Augmentation
As per the Press Release No. 10/55 dated February 19, 2010, posted on the InternationalMonetary Fund (IMF) Website, the Executive Board of the IMF completed the sixth review of
The Gambia’s economic performance under a program supported by the Extended CreditFacility (ECF)6. The Board approved a waiver for the non-observance of the fiscal performancecriterion based on corrective actions, notably the government’s 2010 budget approved by theNational Assembly, which aims for a near-zero basic balance. The Board’s decision allows thegovernment to request a further disbursement amounting to SDR 2.0 million (about US$ 3.0million), bringing total disbursements under the ECF to The Gambia to SDR 20.2 million (aboutUS$30.8 million).
The Executive Board approved an extension for one year and an augmentation by SDR 4.67million (about US$ 7.1 million) of The Gambia's ECF arrangement, originally approved onFebruary 21, 2007 (vide Press Release No. 07/28).
The IMF Board complemented the Gambian authorities for pursuing satisfactory economicpolicies which contributed to robust economic growth and low inflation despite ongoing globaleconomic crisis. However, they observed that even after extensive debt relief, The Gambiaremains at high risk of debt distress. Besides the yields on Treasury Bills are ruling high mainlydue to fiscal slippages and the government’s recourse to domestic borrowing. The government’sefforts to strengthen its debt management strategy are, therefore, welcome. Until the debtburden is reduced, Government should continue to limit external borrowing to highlyconcessional loans.
The government’s budget for 2010 appropriately targets a near-zero basic balance that willreturn The Gambia to a path of declining domestic debt. Fiscal restraint will ease pressure on T-Bill yields and eventually generate fiscal savings for other spending priorities. However,
disciplined budget execution will be key to achieve these results, and the government’s newaction plan to improve public financial management is in the right direction to achieve such fiscaldiscipline.
The IMF appreciates the government’s commitment to maintain low inflation and to take steps toease pressures on interest rates. The reinforced banking supervisory framework, including thephased-in increase in the minimum capital requirement, will contribute to the development of thesound and efficient banking system.
6 The Extended Credit Facility (ECF) has replaced the Poverty Reduction and Growth Facility (PRGF) as the Fund’smain tool for medium-term financial support to low-income countries by providing a higher level of access tofinancing, more concessional terms, enhanced flexibility in program design features, and more focused streamlinedconditionality. Financing under the ECF currently carries a zero interest rate, with a grace period of 5½ years, and afinal maturity of 10 years. The Fund reviews the level of interest rates for all concessional facilities every two years.
44
8/6/2019 Gambia Monthly Economic Bulletin March 2010
http://slidepdf.com/reader/full/gambia-monthly-economic-bulletin-march-2010 45/45
The Gambia Monthly Economic Bulletin- February 2010
3.4 Assessment of Quantitative Targets agreed with IMF under PRGF
The Gambia’s three-year Poverty Reduction and Growth Facility (PRGF) arrangement wasapproved by the IMF’s Executive Board in February 2007. The third review was completed onSeptember 8, 2008 and the Fourth Review was done in February 2009. The updated Letter of Intent (LOI) and Memorandum of Economic and Financial Policies (MEFP), and Technical
Memorandum of Understanding (TMU) were signed jointly by the then honorable FinanceMinister Mr. Mousa Gibril Bala-Gaye and honorable Governor, Central Bank of Gambia, Mr.Momodou Bamba Saho, on February 3, 2009.
The MEFP reviewed progress in implementing the Government’s PRGF supported program in2008, and set out the policies that the Government will pursue in 2009. The Government of Gambia committed that the program, as usual, will continue to be monitored based on agreedquantitative targets and a set of structural performance criteria and benchmarks indicated in theMEFP as per program reviews.
The quantitative financial targets for end–March 2009 and end-September 2009 areperformance criteria; and those for end–December 2008, end–June 2009, and end-December
2009 are indicative targets.
Performance of Monitored Variables at the end of December 2009
With regard to the performance of the monitored variables under the PRGF vis-à-vis their end-December 2009 targets, the CBG through pro-active, consistent and prudent use of variousmonetary policy instruments, was able to meet comfortably all the quantitative targets. The Netuseable reserves (NUR) totaled US$148.9 million at end-December 2009 and were above theend-December target (floor) by US$0.13 million. Similarly, the Net Domestic Assets (NDA) of the Central Bank amounting to D1.4 billion was below target ceiling by D50.9 million.
The target for basic fiscal balance (floor) was fixed at D685.6 million for the end of December
2009. However, despite good revenue realization, Government failed to achieve this target dueto expenditure pressures. Government achieved a basic balance of (-) D426.9 million at the end
of December 2009, which was well below the target.
Government did not default on the payment of debt services on any external debt. As agreedunder the Program, the government did not contract or guarantee any new non-concessionalexternal loan having maturity exceeding one year. There is also no non-concessional externaldebt outstanding on government account having original maturity exceeding one year.