Gallbladder and Bile Duct Cancer Researchpathology.jhu.edu/gbbd/Binder_gbbd.pdf · rare compared to...
47
Creating a Named Fund Creating a Fellowship Program Creating an Endowed Chair Proposed Research Project – The Research Accelerator Reprints Gallbladder and Bile Duct Cancer Research http://pathology2.jhu.edu/gbbd The Johns Hopkins Medical Institutions
Transcript of Gallbladder and Bile Duct Cancer Researchpathology.jhu.edu/gbbd/Binder_gbbd.pdf · rare compared to...

Creating a Named Fund
Creating a Fellowship Program
Creating an Endowed Chair
Proposed Research Project – The Research Accelerator
Reprints
Gallbladder and Bile Duct Cancer Research
http://pathology2.jhu.edu/gbbd
The Johns Hopkins Medical Institutions
jennifer
click on a link below for more information
jennifer
Table of Contents
jennifer
If you would like to learn more about any of the giving opportunities to support gallbladder and bile duct cancer research, please contact: Ralph H. Hruban, M.D. Professor, Pathology & Oncology Johns Hopkins Hospital Weinberg 2242 401 North Broadway Baltimore, MD 21231 Phone: (410) 955-9132 Fax: (410) 955-0115 Email: [email protected]
June 27, 2001
Dear Friends: Gallbladder and bile duct cancers are a significant cause of cancer death among both men and women. Here at Hopkins, we have established a dedicated multiple disciplinary team to fight cancers that arise in the pancreas, bile ducts, and gallbladder. This team includes, surgeons, oncologists, pathologists, gastroenterologists, and many scientists. Remarkably, in a few short years, this team has made most of the major discoveries in the field of gallbladder and biliary tract cancer research. Most of these discoveries have been made in conjunction with ongoing research in pancreatic cancer. The accomplishments of the Hopkins team include the discovery of the pancreas cancer gene (DPC4) and a critical advance which led to the discovery of the second breast cancer gene (BRCA2). This last year was a particularly exciting year for the Hopkins team. Simply put, the cloning of the human genome has accelerated the pace of research and, importantly, it has provided new avenues for research exploration. We now have many, many more leads than we have resources with which to pursue these leads. We believe that the success and enthusiasm of the team at Hopkins represents an enormous opportunity for those wishing to have a direct impact on gallbladder and biliary tract cancers. A wide range of giving opportunities is outlined in the enclosed booklet. Importantly, each of these opportunities will not only have a significant impact on our research, they are also wonderful ways to honor loved ones. We hope you find this booklet useful and we encourage you to call if you have any questions at all. With warm regards,
Ralph H. Hruban, M.D. Professor, Pathology Professor, Oncology Director, Division of Gastrointestinal/Liver Pathology Director, National Familial Pancreas Tumor Registry Phone: 410-955-9132 / Fax: 410-955-0115

I
Named Fund for Bile Duct and Gallbladder Cancer Research
Research requires money, and although most of the support for medical research comes from the Federal Government via the National Institutes of Health (NIH), it is private philanthropy that can provide the margin of excellence to a research enterprise. Private funds are flexible and can be deployed quickly to take advantage of new ideas and new people. Private funds also can form a constant base for faculty support upon which grant support can be superimposed. Private funds are particularly needed to support research on bile duct and gallbladder carcinomas. This is because biliary cancers are relatively rare compared to more common cancers like colon cancer and hence biliary research is often given a lower priority by the NIH. There have been several examples of private giving having a significant impact on a cancer. For example, the Clayton Fund in Basic Colon Cancer Research has laid the foundation for the remarkable success of the colon cancer research team here at Hopkins. Thanks to the Clayton Fund, many of the most significant discoveries in cancer biology in the last decade were made by the colon cancer team at Johns Hopkins (Bert Vogelstein who leads this team is now the most cited scientist in all of science). Just as the Clayton Fund has had an impact on our understanding of colon cancer, so too would the establishment of a Fund for bile duct and gallbladder cancer research have a fundamental impact on the fight against bile duct and gallbladder cancer. (Endowments start at $20,000. If they reach the $100,000 level a plaque is placed in the research labs honoring the donor. If they reach the $10 Million level, then the endowment can be used to name a research center).
II
Fellowship Training Program
New Technologies in Bile Duct and Gallbladder Cancer Research
“The principal mark of genius is not perfection, but originality, the opening of new frontiers.” Arthur Koestler
Physicians and scientists must make critical decisions when they come to the end of their standard training. They must decide whether or not to pursue an academic career in research. Those who choose a career in research must then choose a sub-specialty area on which to focus their research efforts. These critical career choices are often made for rather trivial reasons. Countless physicians and scientists with enormous potential have chosen not pursue an academic research career because of a lack of a secure fellowship program. At the same time, young minds are the most creative minds. Human creativity peaks at a rather young age; as our fund of knowledge increases our creativity paradoxically decreases. Indeed, some of the major new ideas in cancer research in the last several years have come from young scientists in their training. For example, Victor Velculescu here at Johns Hopkins created the idea for the revolutionary technology of serial analysis of gene expression (SAGE). Victor did this while he was a post-doctoral student in the Johns Hopkins cancer research laboratories. We propose to create an endowed fellowship training program in bile duct and gallbladder cancer research at Hopkins. This program will provide secured funding to young scientists and physicians wishing to pursue a career in bile duct and gallbladder cancer research. The research fellowship program will not be a standard fellowship program. Instead it will take advantage of and most importantly encourage the creativity of the trainees. The fellow will not be a mere technician following detailed instructions from a mentor. Instead, the fellows will be given extensive free time and the fellowship will be focused on creating novel new technologies which can be applied to cancer research and on identifying new technologies, developed in other fields, which can be applied to bile duct and gallbladder cancer research. This approach will bring more minds to the battle against bile duct and gallbladder cancer. Furthermore, the focus on creative spark will mean that our understanding will advance not in safe yet small steps, but rather in daring leaps. BUDGET 1 Fellow (1 year X $50,000/year) $ 50,000 1 Fellow (2 years X $50,000/year) $100,000 (most Fellowships last 2 years) Permanent Endowed Fellowship $1,700,000

III
Endowed Chair for Bile Duct and Gallbladder Cancer Research
“Everything that is really great and inspiring is created by the individual who can labor in freedom”- A. Einstein
The last five years have brought remarkable advances to our understanding of the genetics of bile duct and gallbladder cancer. This growing understanding of the genetics of bile duct and gallbladder cancer will form the basis of new screening and diagnostic tests for the early detection of bile duct and gallbladder cancer; they will be used to identify patients at risk for familial forms of bile duct and gallbladder cancer; and they can be used to characterize even the most subtle pathologic changes, thereby advancing our understanding of early bile duct and gallbladder neoplasia. In addition, and most importantly, an understanding of the genetic changes associated with the development of bile duct and gallbladder cancer will form the foundation for developing novel, rational, gene-based therapies for bile duct and gallbladder cancer. The establishment of a named endowed chair for bile duct and gallbladder cancer research would allow us to pursue high-risk research work. We believe this work will advance our understanding of bile duct and gallbladder cancer, not by small steps, but instead by leaps and bounds. All to often, scientists focus their efforts on “evolutionary” work because it is safer, and more of a sure bet. Endowed chairs allow scientists such to pursue revolutionary work. In addition, because endowed chairs are permanent, these named chairs are a wonderful way of permanently honoring the donor. The cost for a named endowed chair is approximately $2.3 million.
IV-1
IV
Project Plan:
The Research Accelerator
“Art is I; Science is we” - C. Bernard
Bile duct and gallbladder cancers, because of their rarity, have been grossly understudied. Recent rapid advances in cancer genetics provide a unique opportunity to dramatically advance our fundamental understanding of bile duct and gallbladder cancer. With a significant donation, we could, in one fell swoop, bring bile duct and gallbladder cancer to the forefront of cancer research. Through this program, we propose to set up a shared resource that would facilitate gallbladder and bile duct cancer research nationally. For example, this shared resource would generate, provide, and then share xenografted gallbladder and bile duct cancers. These xenografted gallbladder and bile duct cancers would provide a unique source of pure cancer cells for genetic analysis. Second, this resource would be used to fund fundamental studies of gallbladder and bile duct cancers at the genetic level and at the level of gene expression. These studies would be performed using technologies already established at Hopkins for other cancer types and the results of these analyses would be placed on the Web. Such shared data has proven invaluable in the discovery of new markers and other cancer types and we believe it will greatly facilitate the discovery of new markers in gallbladder and biliary cancers. Finally, this project will establish the infrastructure to maintain a significant long-standing program in gallbladder and biliary cancer research.
In order to push ahead in the battle against bile duct and gallbladder cancer, we have identified five “Impact Areas.” In each area, Johns Hopkins has been the recognized leader. Although bile duct and gallbladder cancer is a significant cause of cancer death, among the media and the general scientific community, bile duct and gallbladder cancer research has not in the past enjoyed the investment that is needed. Therefore, for each Impact Area, we need to increase our commitment and engender greater enthusiasm for fighting this disease. Impact Areas:
1. The first step in studying the fundamental genetic alterations in a cancer is obtaining pure cancer cells, free from normal cells. We propose to harvest surgically resected biliary and gallbladder cancers and implant a small portion of these cancers into nude mice (a process called "xenografting"). Nude mice lack an immune system and, as a result, the tumor cells that have been implanted grow freely. Although the tumor cells grow freely, normal human cells die out and are replaced with small numbers of normal mouse cells. The resulting tumors are wonderful sources of pure cancer cells. The establishment of a source of pure cancer cells is a critical first step in studying a cancer. We propose to do this with large
IV-2
numbers of gallbladder and biliary cancers resected at Johns Hopkins. Once established, these xenografted tumors can be harvested for genetic analysis or they can be re-implanted in other nude mice providing a renewable resource for study. As a part of this Research Accelerator, we would share this resource with other investigators throughout the country.
2. Define the Genetic Mutations in bile duct and gallbladder cancer. Based upon the initial
investment starting in 1990 at Johns Hopkins, the past four years have witnessed a literal explosion in the understanding of the gene mutations that cause bile duct and gallbladder cancer. The vast majority of this work has been generated as an offshoot of our ongoing pancreas cancer research. As a part of our pancreas research, we have discovered several cancer causing genes (DPC4 and BRCA2) and we have identified most of the genes targeted in pancreas and gallbladder/biliary cancers. Just as we have done with pancreatic cancer, we want to discover the fundamental genetic changes that underlie the development of bile duct and gallbladder cancer. Indeed, we have recently shown that Dpc4 is frequently inactivated in bile duct cancers, particularly those of the distal bile duct. In addition, we have shown that p16, a tumor suppressor gene that is inactivated in 100% of pancreas carcinoma, is inactivated in over 70% of gallbladder cancers. Such a fundamental understanding of bile duct and gallbladder cancer is the first step in developing rational treatments.
3. Define the patterns of Gene Expression in bile duct and gallbladder cancer. Before a
gene can act upon a cell, its code of information must be “expressed”, first as a temporary message (called RNA) and then as a protein. The proteins are what determine the structure and behavior of a cell. There are normally only two copies of each gene, but there are vast differences in the amount of message and protein each gene can produce. For example, a red blood cell produces a single protein, hemoglobin, in levels that exceed all other proteins in the red cell combined. On the other hand, most other cells produce tens of thousands of proteins, in varying amounts, involving a complexity that with conventional technology could not be understood. A revolutionary technique developed by Hopkins researchers has solved this problem in a remarkable way. The technology is called SAGE, for Serial Analysis of Gene Expression. In the past, gene expression was studied one gene at a time, involving months of work due to the inefficiency of these conventional techniques. With SAGE, through the use of sophisticated nucleic acid sequencing and data analysis tools, the expression of tens of thousands of gene messages can be measured simultaneously. This has, for the first time, opened up gene expression patterns for highly efficient study. For example, we have recently published the development of a new marker of pancreas cancer called "PSCA." This was identified as one of the 50,000+ different genes found by SAGE analysis of pancreas cancer, but one that was noted not to be expressed in normal tissues. We have also shown that the protein coded by another gene identified by SAGE, mesothelin, is overexpressed in pancreatic cancers and also gallbladder cancers (this data has been submitted for publication). Without the incredible ability of SAGE to allow us to study thousands of genes simultaneously, such a discovery would probably have taken many decades of work. Just
IV-3
as we have successfully done for pancreas cancer, we want to define gene expression in bile duct and gallbladder cancer using SAGE, and just as we have done with pancreas cancer, we want to make this data available to all investigators on the Web. The analysis of gene expression by SAGE offers promise of rapid identification of new markers for the early detection of bile duct and gallbladder cancer and the sharing of this data will attract additional investigators into this field.
4. We want to communicate our findings to other scientists and to patients and their families.
The Bile Duct and Gallbladder cancer Web Site at Johns Hopkins serves many roles. Patients and families have access to information regarding the disease, lists of publications that are available, and a discussion section (or “chat room”) where personal experiences can be shared and questions posted. A physician monitors this chat room, while a social worker monitors an additional "chat room" on this site. Both are available to advise patients on how to deal with their cancer. For medical researchers in other institutions, basic science information regarding bile duct and gallbladder cancer can be made widely available. This includes detailed descriptions of genetic alterations found by Hopkins investigators in the cancers. Because these cancers can be widely shared, this becomes key information that can be used to spur bile duct and gallbladder cancer research in other laboratories. Data from SAGE analysis can also be made available on the Web. We need support to expand our bile duct and gallbladder cancer Web initiative so that we can share information with physicians, other scientists, patients, and their families.
5. Long-term infrastructure . We need to establish the infrastructure to maintain this effort in
the long-term. This is best accomplished through the creation of a named endowed Fellowship training program (see #2) and the creation of a named endowed chair. Fellowships prepare promising young scientists for a future in bile duct and gallbladder cancer. We need to train new investigators and raise their interest in bile duct and gallbladder cancer at an early point in their career. The goals of research training, and the above Impact Areas as well, are well served by the types of research now underway at Hopkins. A number of our key discoveries, such as the association of the breast cancer (BRCA2) gene with pancreas cancers and development of SAGE, have been made by persons in advanced stages of training whose continued participation has only been made possible by special funding awards. These funding opportunities are transient, and a reliable source of support for such advanced research positions would facilitate the translation of basic science to the bedside. As discussed earlier (see #3), named endowed chairs provide the long-term stability needed for established scientists to pursue high impact cutting edge research. Both, because they are named, are wonderful ways to honor a loved one.
The proposal is to assemble the above five impact areas around a joint project that serves as a Research Accelerator. This will take advantage of the strengths of the Johns Hopkins bile duct and gallbladder cancer effort and really could only be done at Hopkins. In brief, we will generate pure populations of cancer cells for research, we will use SAGE technology and a sequencing machine to

IV-4
define the genetic changes and the genes expressed in these cancers. We will then make this data available to all gallbladder and bile duct cancer researchers over the Internet. Because this huge database will be shared, the Research Accelerator will provide all bile duct and gallbladder cancer researchers a huge “head start” in their research. The project envisions the participation of a principal investigator who leads a team of technicians and persons in advanced medical training, working in collaboration with informatics specialists having internet-related programming skills. Resources for molecular biology supplies, computer access and Internet access will be provided to the team. Because the technology already exists at Hopkins, startup can be readily accomplished and progress can be proportional to the resources available.
Budget Costs to harvest & xenograft cancers $100,000/year x 5 years Sequencing machine- $170,000 (one time) Two technicians $70,000/year x 5 years Supplies $85,000/year x 5 years Programming/computer $35,000/year x 5 years Named Endowed Fellowship $1,700,000 Named Endowed Chair $2,300,000 Named Endowed Fund $1,700,000 (generates ~$85,000/year) (to support continued research (supplies) after 5 years) Total $6,160,000
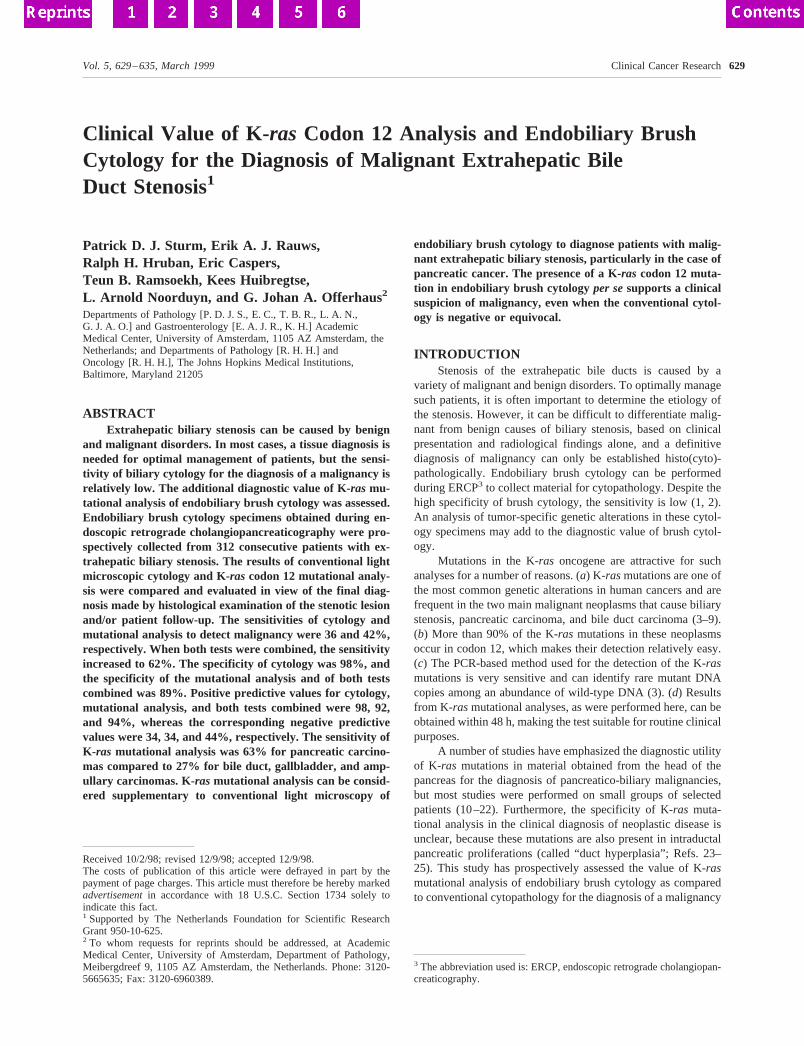
Clinical Value of K- ras Codon 12 Analysis and Endobiliary BrushCytology for the Diagnosis of Malignant Extrahepatic BileDuct Stenosis1
Patrick D. J. Sturm, Erik A. J. Rauws,Ralph H. Hruban, Eric Caspers,Teun B. Ramsoekh, Kees Huibregtse,L. Arnold Noorduyn, and G. Johan A. Offerhaus2
Departments of Pathology [P. D. J. S., E. C., T. B. R., L. A. N.,G. J. A. O.] and Gastroenterology [E. A. J. R., K. H.] AcademicMedical Center, University of Amsterdam, 1105 AZ Amsterdam, theNetherlands; and Departments of Pathology [R. H. H.] andOncology [R. H. H.], The Johns Hopkins Medical Institutions,Baltimore, Maryland 21205
ABSTRACTExtrahepatic biliary stenosis can be caused by benign
and malignant disorders. In most cases, a tissue diagnosis isneeded for optimal management of patients, but the sensi-tivity of biliary cytology for the diagnosis of a malignancy isrelatively low. The additional diagnostic value of K-ras mu-tational analysis of endobiliary brush cytology was assessed.Endobiliary brush cytology specimens obtained during en-doscopic retrograde cholangiopancreaticography were pro-spectively collected from 312 consecutive patients with ex-trahepatic biliary stenosis. The results of conventional lightmicroscopic cytology and K-ras codon 12 mutational analy-sis were compared and evaluated in view of the final diag-nosis made by histological examination of the stenotic lesionand/or patient follow-up. The sensitivities of cytology andmutational analysis to detect malignancy were 36 and 42%,respectively. When both tests were combined, the sensitivityincreased to 62%. The specificity of cytology was 98%, andthe specificity of the mutational analysis and of both testscombined was 89%. Positive predictive values for cytology,mutational analysis, and both tests combined were 98, 92,and 94%, whereas the corresponding negative predictivevalues were 34, 34, and 44%, respectively. The sensitivity ofK- ras mutational analysis was 63% for pancreatic carcino-mas compared to 27% for bile duct, gallbladder, and amp-ullary carcinomas. K-ras mutational analysis can be consid-ered supplementary to conventional light microscopy of
endobiliary brush cytology to diagnose patients with malig-nant extrahepatic biliary stenosis, particularly in the case ofpancreatic cancer. The presence of a K-ras codon 12 muta-tion in endobiliary brush cytology per sesupports a clinicalsuspicion of malignancy, even when the conventional cytol-ogy is negative or equivocal.
INTRODUCTIONStenosis of the extrahepatic bile ducts is caused by a
variety of malignant and benign disorders. To optimally managesuch patients, it is often important to determine the etiology ofthe stenosis. However, it can be difficult to differentiate malig-nant from benign causes of biliary stenosis, based on clinicalpresentation and radiological findings alone, and a definitivediagnosis of malignancy can only be established histo(cyto)-pathologically. Endobiliary brush cytology can be performedduring ERCP3 to collect material for cytopathology. Despite thehigh specificity of brush cytology, the sensitivity is low (1, 2).An analysis of tumor-specific genetic alterations in these cytol-ogy specimens may add to the diagnostic value of brush cytol-ogy.
Mutations in the K-ras oncogene are attractive for suchanalyses for a number of reasons. (a) K-rasmutations are one ofthe most common genetic alterations in human cancers and arefrequent in the two main malignant neoplasms that cause biliarystenosis, pancreatic carcinoma, and bile duct carcinoma (3–9).(b) More than 90% of the K-ras mutations in these neoplasmsoccur in codon 12, which makes their detection relatively easy.(c) The PCR-based method used for the detection of the K-rasmutations is very sensitive and can identify rare mutant DNAcopies among an abundance of wild-type DNA (3). (d) Resultsfrom K-rasmutational analyses, as were performed here, can beobtained within 48 h, making the test suitable for routine clinicalpurposes.
A number of studies have emphasized the diagnostic utilityof K-ras mutations in material obtained from the head of thepancreas for the diagnosis of pancreatico-biliary malignancies,but most studies were performed on small groups of selectedpatients (10–22). Furthermore, the specificity of K-ras muta-tional analysis in the clinical diagnosis of neoplastic disease isunclear, because these mutations are also present in intraductalpancreatic proliferations (called “duct hyperplasia”; Refs. 23–25). This study has prospectively assessed the value of K-rasmutational analysis of endobiliary brush cytology as comparedto conventional cytopathology for the diagnosis of a malignancy
Received 10/2/98; revised 12/9/98; accepted 12/9/98.The costs of publication of this article were defrayed in part by thepayment of page charges. This article must therefore be hereby markedadvertisementin accordance with 18 U.S.C. Section 1734 solely toindicate this fact.1 Supported by The Netherlands Foundation for Scientific ResearchGrant 950-10-625.2 To whom requests for reprints should be addressed, at AcademicMedical Center, University of Amsterdam, Department of Pathology,Meibergdreef 9, 1105 AZ Amsterdam, the Netherlands. Phone: 3120-5665635; Fax: 3120-6960389.
3 The abbreviation used is: ERCP, endoscopic retrograde cholangiopan-creaticography.
629Vol. 5, 629–635, March 1999 Clinical Cancer Research
in patients with bile duct stenosis in a large series of consecutivepatients with a complete follow-up.
MATERIALS AND METHODSPatients
The study population consisted of a series of consecutivepatients who underwent ERCP with endobiliary brush cytologyfor the evaluation of an extrahepatic biliary stenosis at theAcademic Medical Center in Amsterdam in the period fromJanuary 1, 1993, to February 1, 1996. The Medical EthicalReview Committee of the Academic Medical Center approvedthe study. If a patient underwent ERCP with brush cytologyrepeatedly during this period, only the first examination wasincluded. This resulted in 312 patients with a mean age of 63years; 172 patients were male.
A final diagnosis of the nature of biliary stenosis was basedon histological and/or clinical findings (Table 1). In the absenceof a tissue diagnosis, a clinical diagnosis was established basedon clinical symptomatology, the results of imaging studies priorto the ERCP procedure, and, particularly, the course of thedisease. Information concerning the clinical follow-up was ob-tained from the patient’s physician. All patients were followedfor at least 12 months. The 104 patients with a clinical diagnosisof malignant extrahepatic bile duct stenosis had rapidly progres-sive disease with symptoms such as jaundice, pain, cachexia,and metastases. Importantly, all these patients died of diseasewithin a mean survival of 5.7 months (range, 0–42 months)after the ERCP procedure, which corresponds to survival ratesof patients with cancer of the pancreas and extrahepatic biliarytract in general. The mean survival for all of the 220 patientswith a malignant etiology of their stenosis was 9 months (range,0–50 months). Eight of these 220 patients were still alive at theend of follow-up, and their survival ranged from 22 to 50months: of these, 6 had a surgical resection of the carcinoma and2 were biopsied only; thus, they were all tissue proven. Incontrast, 71 of the 74 patients with benign disease (including the10 patients with a tissue diagnosis of benign disease) were allalive after a mean follow-up period of 32 months (range, 15–54months) and had stable disease or regression of their symptoms.
Three patients with benign disease died due to unrelated causes:2 died from heart disease 10 months and 27 months after ERCP,and 1 died following a hip fracture 18 months after ERCP, allwithout symptoms of obstructive biliary disease.
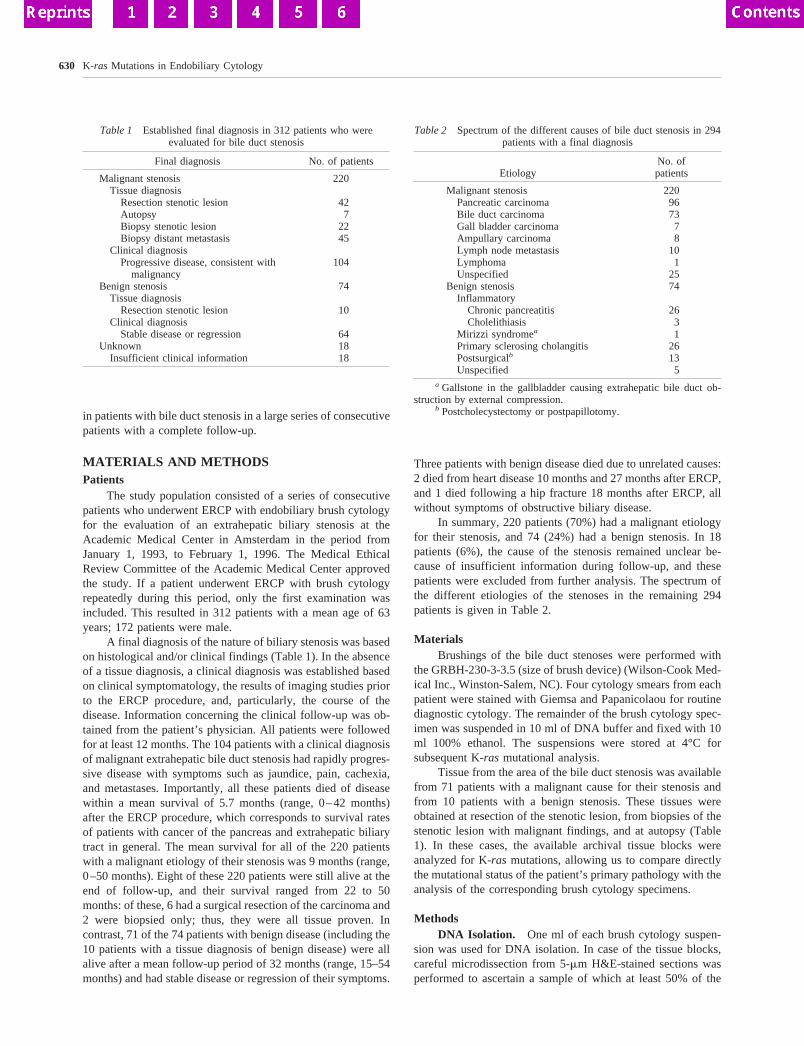
In summary, 220 patients (70%) had a malignant etiologyfor their stenosis, and 74 (24%) had a benign stenosis. In 18patients (6%), the cause of the stenosis remained unclear be-cause of insufficient information during follow-up, and thesepatients were excluded from further analysis. The spectrum ofthe different etiologies of the stenoses in the remaining 294patients is given in Table 2.
MaterialsBrushings of the bile duct stenoses were performed with
the GRBH-230-3-3.5 (size of brush device) (Wilson-Cook Med-ical Inc., Winston-Salem, NC). Four cytology smears from eachpatient were stained with Giemsa and Papanicolaou for routinediagnostic cytology. The remainder of the brush cytology spec-imen was suspended in 10 ml of DNA buffer and fixed with 10ml 100% ethanol. The suspensions were stored at 4°C forsubsequent K-ras mutational analysis.
Tissue from the area of the bile duct stenosis was availablefrom 71 patients with a malignant cause for their stenosis andfrom 10 patients with a benign stenosis. These tissues wereobtained at resection of the stenotic lesion, from biopsies of thestenotic lesion with malignant findings, and at autopsy (Table1). In these cases, the available archival tissue blocks wereanalyzed for K-ras mutations, allowing us to compare directlythe mutational status of the patient’s primary pathology with theanalysis of the corresponding brush cytology specimens.
MethodsDNA Isolation. One ml of each brush cytology suspen-
sion was used for DNA isolation. In case of the tissue blocks,careful microdissection from 5-mm H&E-stained sections wasperformed to ascertain a sample of which at least 50% of the
Table 1 Established final diagnosis in 312 patients who wereevaluated for bile duct stenosis
Final diagnosis No. of patients
Malignant stenosis 220Tissue diagnosis
Resection stenotic lesion 42Autopsy 7Biopsy stenotic lesion 22Biopsy distant metastasis 45
Clinical diagnosisProgressive disease, consistent with
malignancy104
Benign stenosis 74Tissue diagnosis
Resection stenotic lesion 10Clinical diagnosis
Stable disease or regression 64Unknown 18
Insufficient clinical information 18
Table 2 Spectrum of the different causes of bile duct stenosis in 294patients with a final diagnosis
EtiologyNo. ofpatients
Malignant stenosis 220Pancreatic carcinoma 96Bile duct carcinoma 73Gall bladder carcinoma 7Ampullary carcinoma 8Lymph node metastasis 10Lymphoma 1Unspecified 25
Benign stenosis 74Inflammatory
Chronic pancreatitis 26Cholelithiasis 3
Mirizzi syndromea 1Primary sclerosing cholangitis 26Postsurgicalb 13Unspecified 5
a Gallstone in the gallbladder causing extrahepatic bile duct ob-struction by external compression.
b Postcholecystectomy or postpapillotomy.
630 K-ras Mutations in Endobiliary Cytology
cells comprised the tissue of interest. DNA was extracted asdescribed previously (26).
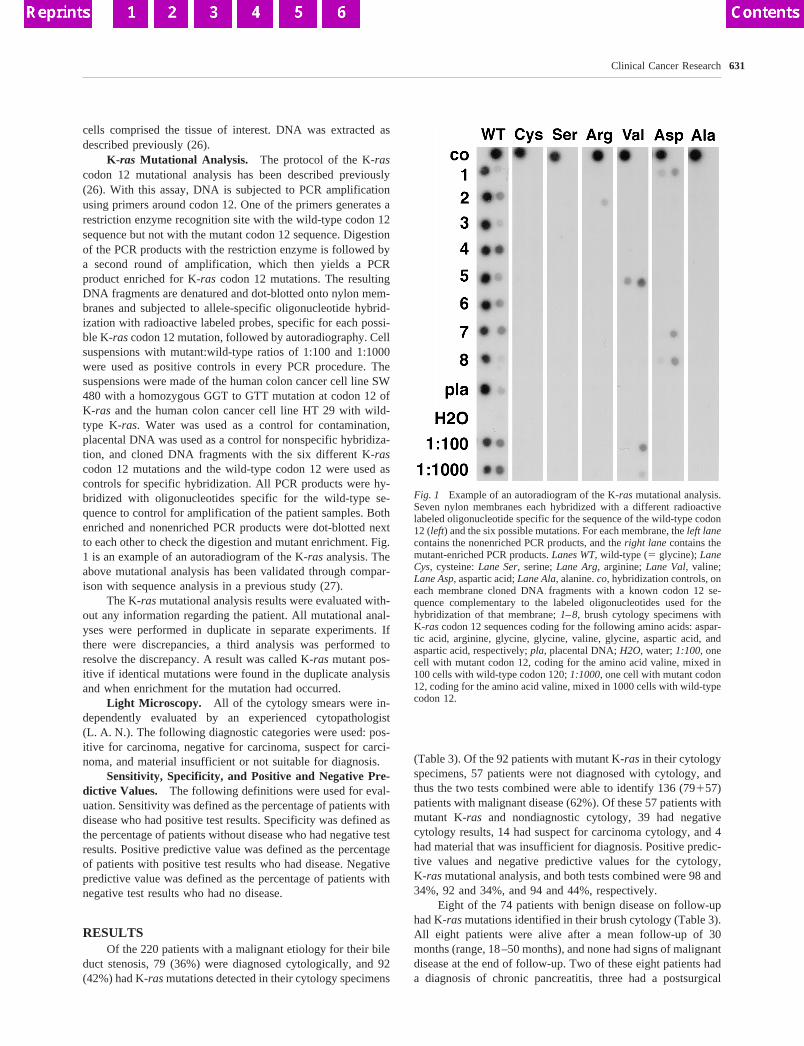
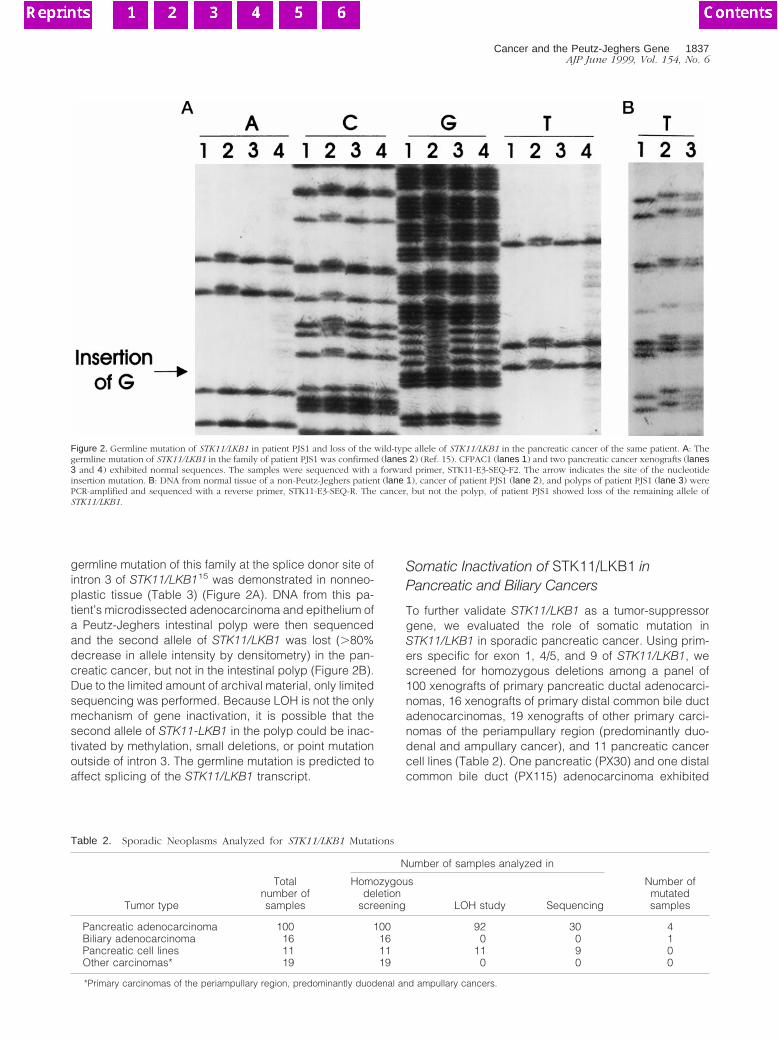
K- ras Mutational Analysis. The protocol of the K-rascodon 12 mutational analysis has been described previously(26). With this assay, DNA is subjected to PCR amplificationusing primers around codon 12. One of the primers generates arestriction enzyme recognition site with the wild-type codon 12sequence but not with the mutant codon 12 sequence. Digestionof the PCR products with the restriction enzyme is followed bya second round of amplification, which then yields a PCRproduct enriched for K-ras codon 12 mutations. The resultingDNA fragments are denatured and dot-blotted onto nylon mem-branes and subjected to allele-specific oligonucleotide hybrid-ization with radioactive labeled probes, specific for each possi-ble K-rascodon 12 mutation, followed by autoradiography. Cellsuspensions with mutant:wild-type ratios of 1:100 and 1:1000were used as positive controls in every PCR procedure. Thesuspensions were made of the human colon cancer cell line SW480 with a homozygous GGT to GTT mutation at codon 12 ofK-ras and the human colon cancer cell line HT 29 with wild-type K-ras. Water was used as a control for contamination,placental DNA was used as a control for nonspecific hybridiza-tion, and cloned DNA fragments with the six different K-rascodon 12 mutations and the wild-type codon 12 were used ascontrols for specific hybridization. All PCR products were hy-bridized with oligonucleotides specific for the wild-type se-quence to control for amplification of the patient samples. Bothenriched and nonenriched PCR products were dot-blotted nextto each other to check the digestion and mutant enrichment. Fig.1 is an example of an autoradiogram of the K-ras analysis. Theabove mutational analysis has been validated through compar-ison with sequence analysis in a previous study (27).
The K-ras mutational analysis results were evaluated with-out any information regarding the patient. All mutational anal-yses were performed in duplicate in separate experiments. Ifthere were discrepancies, a third analysis was performed toresolve the discrepancy. A result was called K-ras mutant pos-itive if identical mutations were found in the duplicate analysisand when enrichment for the mutation had occurred.
Light Microscopy. All of the cytology smears were in-dependently evaluated by an experienced cytopathologist(L. A. N.). The following diagnostic categories were used: pos-itive for carcinoma, negative for carcinoma, suspect for carci-noma, and material insufficient or not suitable for diagnosis.
Sensitivity, Specificity, and Positive and Negative Pre-dictive Values. The following definitions were used for eval-uation. Sensitivity was defined as the percentage of patients withdisease who had positive test results. Specificity was defined asthe percentage of patients without disease who had negative testresults. Positive predictive value was defined as the percentageof patients with positive test results who had disease. Negativepredictive value was defined as the percentage of patients withnegative test results who had no disease.
RESULTSOf the 220 patients with a malignant etiology for their bile
duct stenosis, 79 (36%) were diagnosed cytologically, and 92(42%) had K-rasmutations detected in their cytology specimens
(Table 3). Of the 92 patients with mutant K-ras in their cytologyspecimens, 57 patients were not diagnosed with cytology, andthus the two tests combined were able to identify 136 (79157)patients with malignant disease (62%). Of these 57 patients withmutant K-ras and nondiagnostic cytology, 39 had negativecytology results, 14 had suspect for carcinoma cytology, and 4had material that was insufficient for diagnosis. Positive predic-tive values and negative predictive values for the cytology,K-ras mutational analysis, and both tests combined were 98 and34%, 92 and 34%, and 94 and 44%, respectively.
Eight of the 74 patients with benign disease on follow-uphad K-rasmutations identified in their brush cytology (Table 3).All eight patients were alive after a mean follow-up of 30months (range, 18–50 months), and none had signs of malignantdisease at the end of follow-up. Two of these eight patients hada diagnosis of chronic pancreatitis, three had a postsurgical
Fig. 1 Example of an autoradiogram of the K-ras mutational analysis.Seven nylon membranes each hybridized with a different radioactivelabeled oligonucleotide specific for the sequence of the wild-type codon12 (left) and the six possible mutations. For each membrane, theleft lanecontains the nonenriched PCR products, and theright lanecontains themutant-enriched PCR products.Lanes WT, wild-type (5 glycine);LaneCys, cysteine:Lane Ser, serine;Lane Arg, arginine;Lane Val, valine;Lane Asp, aspartic acid;Lane Ala, alanine.co, hybridization controls, oneach membrane cloned DNA fragments with a known codon 12 se-quence complementary to the labeled oligonucleotides used for thehybridization of that membrane;1–8, brush cytology specimens withK-ras codon 12 sequences coding for the following amino acids: aspar-tic acid, arginine, glycine, glycine, valine, glycine, aspartic acid, andaspartic acid, respectively;pla, placental DNA;H2O, water;1:100, onecell with mutant codon 12, coding for the amino acid valine, mixed in100 cells with wild-type codon 120;1:1000, one cell with mutant codon12, coding for the amino acid valine, mixed in 1000 cells with wild-typecodon 12.
631Clinical Cancer Research
stenosis, and three patients had primary sclerosing cholangitis.Tissue from the stenotic lesion of one of the patients withprimary sclerosing cholangitis was available for K-ras muta-tional analysis. The patient had undergone a hilar resectionbecause of the suspicion of a cholangiocarcinoma. Histopatho-logical findings were cholecystitis with inflammation and fibro-sis of the common hepatic duct. The K-rasmutation found in thebrush cytology specimen was not confirmed in the reactive bileduct epithelium in this case.
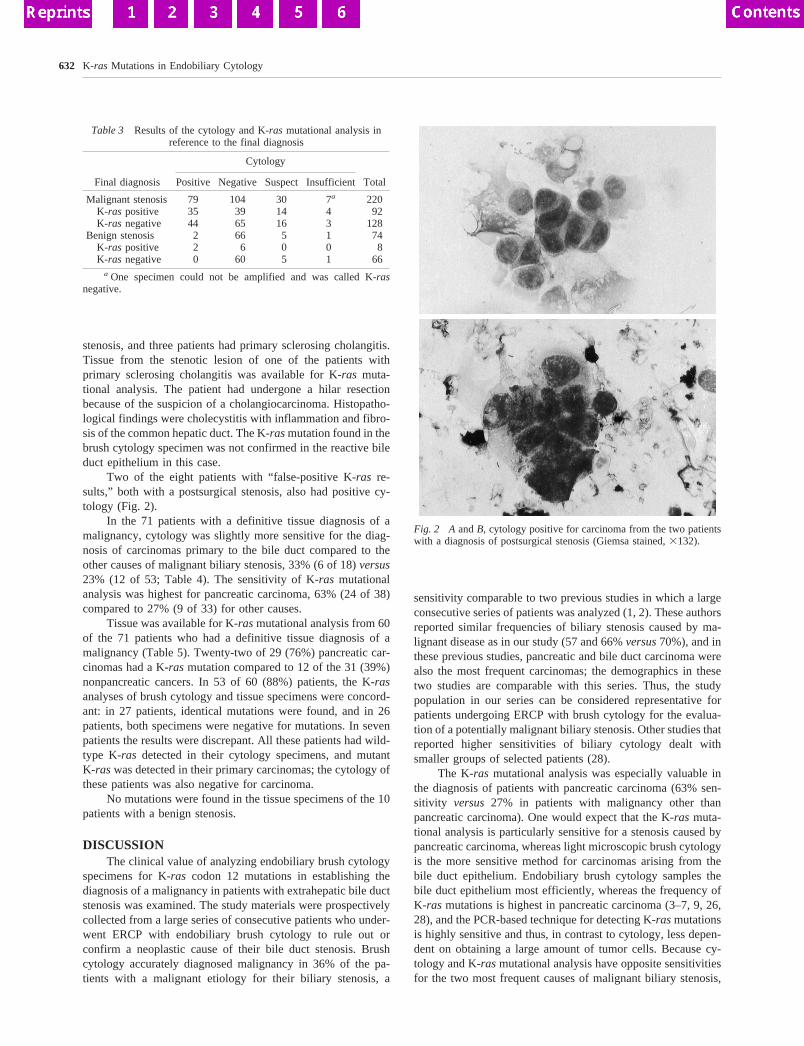
Two of the eight patients with “false-positive K-ras re-sults,” both with a postsurgical stenosis, also had positive cy-tology (Fig. 2).
In the 71 patients with a definitive tissue diagnosis of amalignancy, cytology was slightly more sensitive for the diag-nosis of carcinomas primary to the bile duct compared to theother causes of malignant biliary stenosis, 33% (6 of 18)versus23% (12 of 53; Table 4). The sensitivity of K-ras mutationalanalysis was highest for pancreatic carcinoma, 63% (24 of 38)compared to 27% (9 of 33) for other causes.
Tissue was available for K-rasmutational analysis from 60of the 71 patients who had a definitive tissue diagnosis of amalignancy (Table 5). Twenty-two of 29 (76%) pancreatic car-cinomas had a K-ras mutation compared to 12 of the 31 (39%)nonpancreatic cancers. In 53 of 60 (88%) patients, the K-rasanalyses of brush cytology and tissue specimens were concord-ant: in 27 patients, identical mutations were found, and in 26patients, both specimens were negative for mutations. In sevenpatients the results were discrepant. All these patients had wild-type K-ras detected in their cytology specimens, and mutantK-ras was detected in their primary carcinomas; the cytology ofthese patients was also negative for carcinoma.
No mutations were found in the tissue specimens of the 10patients with a benign stenosis.
DISCUSSIONThe clinical value of analyzing endobiliary brush cytology
specimens for K-ras codon 12 mutations in establishing thediagnosis of a malignancy in patients with extrahepatic bile ductstenosis was examined. The study materials were prospectivelycollected from a large series of consecutive patients who under-went ERCP with endobiliary brush cytology to rule out orconfirm a neoplastic cause of their bile duct stenosis. Brushcytology accurately diagnosed malignancy in 36% of the pa-tients with a malignant etiology for their biliary stenosis, a
sensitivity comparable to two previous studies in which a largeconsecutive series of patients was analyzed (1, 2). These authorsreported similar frequencies of biliary stenosis caused by ma-lignant disease as in our study (57 and 66%versus70%), and inthese previous studies, pancreatic and bile duct carcinoma werealso the most frequent carcinomas; the demographics in thesetwo studies are comparable with this series. Thus, the studypopulation in our series can be considered representative forpatients undergoing ERCP with brush cytology for the evalua-tion of a potentially malignant biliary stenosis. Other studies thatreported higher sensitivities of biliary cytology dealt withsmaller groups of selected patients (28).
The K-ras mutational analysis was especially valuable inthe diagnosis of patients with pancreatic carcinoma (63% sen-sitivity versus 27% in patients with malignancy other thanpancreatic carcinoma). One would expect that the K-ras muta-tional analysis is particularly sensitive for a stenosis caused bypancreatic carcinoma, whereas light microscopic brush cytologyis the more sensitive method for carcinomas arising from thebile duct epithelium. Endobiliary brush cytology samples thebile duct epithelium most efficiently, whereas the frequency ofK-ras mutations is highest in pancreatic carcinoma (3–7, 9, 26,28), and the PCR-based technique for detecting K-rasmutationsis highly sensitive and thus, in contrast to cytology, less depen-dent on obtaining a large amount of tumor cells. Because cy-tology and K-ras mutational analysis have opposite sensitivitiesfor the two most frequent causes of malignant biliary stenosis,
Fig. 2 A andB, cytology positive for carcinoma from the two patientswith a diagnosis of postsurgical stenosis (Giemsa stained,3132).
Table 3 Results of the cytology and K-ras mutational analysis inreference to the final diagnosis
Final diagnosis
Cytology
TotalPositive Negative Suspect Insufficient
Malignant stenosis 79 104 30 7a 220K-ras positive 35 39 14 4 92K-ras negative 44 65 16 3 128
Benign stenosis 2 66 5 1 74K-ras positive 2 6 0 0 8K-ras negative 0 60 5 1 66
a One specimen could not be amplified and was called K-rasnegative.
632 K-ras Mutations in Endobiliary Cytology
the methods nicely supplement each other. Indeed, the sensitiv-ities of cytology (36%) and K-rasmutational analysis (42%) forthe diagnosis of malignant stenosis were similar but, when theirsensitivities were combined, increased to 62%.
K-ras mutations were detected in the brush cytology spec-imens of 8 of the 74 patients (11%) with benign disease.Performing all PCR analyses in duplicate independently mini-mized the chance of technical errors as a cause for false-positiveresults. Positive results of the K-ras mutational analysis in theabsence of malignancy may be caused by the presence ofnoninvasive “hyperplastic duct lesions” containing K-ras muta-tions (23, 24, 29, 30). Hyperplastic duct lesions are frequentlyfound together with cancer in the pancreas, and indeed, there isevidence that these duct hyperplasias can progress to infiltratingcarcinoma with K-rasmutation as an early event (30–32). K-rasmutations are also found in hyperplasias in patients with chronicpancreatitis, a condition thought to be a risk factor for develop-ing pancreatic cancer (23, 33). However, it is clear that not allduct hyperplasias progress to invasive carcinoma during the lifespan of an average patient (24). A longer follow-up would,therefore, be needed to better understand the meaning of theobservations in the eight patients in our study without obviousneoplastic disease who harbored K-ras mutations in their brushcytology. A recent study found no cancer in 20 patients withpancreatitis and K-ras mutation in their pancreatic juice after amean follow-up of 78 months (34). On the other hand, Bratet al.(35) reported three patients with hyperplastic duct lesions whodeveloped pancreatic cancer after 17 months to 10 years, andBerthelemyet al. (13) reported two patients without evidence ofcancer at the time of ERCP but with mutated K-ras in theirpancreatic juice who developed clinically detectable pancreaticcancers after 18 and 40 months. Nonetheless, it seems best, atpresent, to consider the eight patients in our study false-positivesuntil it is proven otherwise. Only two of these patients hadchronic pancreatitis. Tissue for K-ras analysis was availablefrom one of these patients with primary sclerosing cholangitis in
which the resected biliary stenosis did not harbor a K-rasmutation.
As in our study, the specificity of cytology reported in theliterature is often 100% or approaching 100% (1, 2). Interest-ingly, the two patients with false-positive cytologies also hadK-ras mutations detected in their cytology specimens. Onepatient was a 62-year-old white male. During ERCP, a regularsmooth stenosis of the distal common bile duct was seen. He hadundergone a cholecystectomy for cholelithiasis in the past;hence, the stenosis was diagnosed as postsurgical. The stenosiswas stented, and since then, he has not been jaundiced and hadany other complaints. There was no evidence of bile ductobstruction 18 months after brush cytology. The other patientwas a 71-year-old white female, also with a postsurgical steno-sis. The mid-common bile duct stenosis was treated with a stent.Eighteen months after brush cytology, she had no complaints ofextrahepatic bile duct obstruction. These two patients clearly didnot meet our criteria for a clinical diagnosis of a malignant bileduct stenosis. Nonetheless, even in retrospect, the cytologies ofthese two patients were considered positive for carcinoma (Fig.2, A andB, respectively). One could speculate that these cellscame from pancreatic duct lesions with high-grade dysplasia orfrom an in situ carcinoma, which would also explain the K-rasmutations detected in these patients. Long-term follow-up maythen provide a clue to their final diagnosis.
In 60 cases, we were able to directly compare the K-rasmutations identified in brush cytology specimens to those pres-ent in the corresponding surgical specimens. We found that theresults were identical in 88% (53 of 60) of the cases withmalignancy. The main cause for false-negative results was theabsence of K-ras mutations in the tumor (26 of 33), mostlycancers other than pancreatic cancer. The discrepant resultsfrom the seven patients in which wild-type K-ras was found inthe brush cytology but mutant K-ras was detected in the pa-tients’ carcinoma could be due to sampling error because theconventional cytology in these cases was also negative forcarcinoma.
More direct sampling of the stenotic lesion could poten-tially improve the sensitivity of cytology but would diminishspecificity of the K-ras mutational analysis. Van Laethemet
Table 4 Results of the cytology and K-ras mutational analysis in 71patients with a precise etiology of the malignant bile duct stenosis
based on histology of the stenotic lesion
Final diagnosis
Cytology
TotalPositive Negative Suspect Insufficient
Pancreatic carcinoma 8 21 6 3a 38K-ras positive 7 11 4 2 24K-ras negative 1 10 2 1 14
Bile duct carcinoma 6 8 4 18K-ras positive 3 1 1 5K-ras negative 3 7 3 13
Gall bladder carcinoma 1 4 5K-ras positive 0 1 1K-ras negative 1 3 4
Ampullary carcinoma 2 4 2 8K-ras positive 1 1 1 3K-ras negative 1 3 1 5
Lymph node metastasis 1 1 2K-ras positive 0 0 0K-ras negative 1 1 2
a One specimen could not be amplified and was called K-rasnegative.
Table 5 K-ras mutational spectrum in brush cytology specimens andcorresponding carcinomas of 60 of the 71 patients with a precise
etiology of the malignant stenosis based on histology of thestenotic lesion
Mutations incarcinomasa
Mutations in brush cytologya
TotalCys Ser Arg Val Asp Ala Glyb
Cys 1 1 2SerArg 2 1 3Val 8 3 11Asp 15 2 17Ala 1 1Glyb 26 26Total 1 2 8 15 1 33 60a The six possible mutations code for cysteine, serine, arginine,
valine, aspartic acid, and alanine.b Wild-type codon 12 (GGT) codes for glycine.
633Clinical Cancer Research
al. (22) examined the diagnostic value of K-ras in pancreaticduct brushings and bile duct brushings. Sensitivity of con-ventional light microscopy of endobiliary brush cytology wassimilar in their study. They also showed the additional diag-nostic value of K-ras mutational analysis in these cytologyspecimens, especially in the diagnosis of patients with pan-creatic cancer, and the high specificity. In contrast, theyfound that the sensitivity of conventional cytology of pan-creatic duct brushings is higher (51%), but the diagnosticvalue of K-ras was impaired by a high percentage (25%) ofpatients with chronic pancreatitis who harbored K-ras muta-tions in their cytology. This lower specificity of K-ras mu-tational analysis of pancreatic duct brushings may well beattributed to the more direct sampling of the hyperplastic ductlesions that are frequent in the pancreas with chronic inflam-mation. It is likely that, in brush cytology specimens from thebile duct, the yield of cells from these hyperplastic ductlesions is lower compared to cells derived from carcinomasbecause the cells in carcinomas grow less coherently and areeasily shed. Following this reasoning, colorectal neoplasmscan be diagnosed specifically with the detection of K-rasmutations in the stool despite the frequent occurrence ofK-ras mutations present in aberrant crypt foci and hyperplas-tic polyps, two nonneoplastic lesions that are prevalent in thecolorectum without neoplastic disease (36, 37).
In conclusion, PCR-based tests for the detection of K-rascodon 12 mutations can be a valuable diagnostic adjunct toconventional light microscopy of endobiliary brush cytologyspecimens obtained from patients who have a suspicious steno-sis of the extrahepatic bile duct, especially in patients withpancreatic carcinoma. The presence of a mutation favors malig-nancy, even when the cytology reading is negative or equivocal.
REFERENCES1. Ponchon, T., Gagnon, P., Berger, F., Labadie, M., Liaras, A.,Chavaillon, A., and Bory, R. Value of endobiliary brush cytology andbiopsies for the diagnosis of malignant bile duct stenosis: results of aprospective study. Gastrointest. Endosc.,42: 565–572, 1995.
2. Lee, J. G., Leung, J. W., Baillie, J., Layfield, L. J., and Cotton, P. B.Benign, dysplastic, or malignant—making sense of endoscopic bile ductbrush cytology: results in 149 consecutive patients. Am. J. Gastroen-terol., 90: 722–726, 1995.
3. Levi, S., Urbano-Ispizua, A., Gill, R., Thomas, D. M., Gilbertson, J.,Foster, C., and Marshall, C. J. Multiple K-ras codon 12 mutations incholangiocarcinomas demonstrated with a sensitive polymerase chainreaction technique. Cancer Res.,51: 3497–3502, 1991.
4. Tada, M., Omata, M., and Ohto, M. High incidence ofras genemutation in intrahepatic cholangiocarcinoma. Cancer (Phila.),69: 1115–1118, 1992.
5. Tada, M., Yokosuka, O., Omata, M., Ohto, M., and Isono, K.Analysis of ras gene mutations in biliary and pancreatic tumors bypolymerase chain reaction and direct sequencing. Cancer (Phila.),66:930–935, 1990.
6. Motojima, K., Tsunoda, T., Kanematsu, T., Nagata, Y., Urano, T.,and Shiku, H. Distinguishing pancreatic carcinoma from other periam-pullary carcinomas by analysis of mutations in the Kirsten-ras onco-gene. Ann. Surg.,214: 657–662, 1991.
7. Watanabe, M., Asaka, M., Tanaka, J., Kurosawa, M., Kasai, M., andMiyazaki, T. Point mutation of K-ras gene codon 12 in biliary tracttumors. Gastroenterology,107: 1147–1153, 1994.
8. Almoguera, C., Shibata, D., Forrester, K., Martin, J., Arnheim, N.,and Perucho, M. Most human carcinomas of the exocrine pancreascontain mutant c-K-ras genes. Cell,53: 549–554, 1988.
9. Hruban, R. H., van Mansfeld, A. D. M., Offerhaus, G. J. A., VanWeering, D. H. J., Allison, D. C., Goodman, S. N., Kensler, T. W., Bose,K. K., Cameron, J. L., and Bos, J. L. K-ras oncogene activation inadenocarcinoma of the human pancreas. A study of 82 carcinomas usinga combination of mutant-enriched polymerase chain reaction analysisand allele-specific oligonucleotide hybridization. Am. J. Pathol.,143:545–554, 1993.
10. Van Laethem, J. L., Vertongen, P., Deviere, J., Van Rampelbergh,J., Rickaert, F., Cremer, M., and Robberecht, P. Detection of c-Ki-rasgene codon 12 mutations from pancreatic duct brushings in the diagno-sis of pancreatic tumours. Gut,36: 781–787, 1994.
11. Apple, S. A., Hecht, J. R., Novak, J. M., Nieberg, R. K., Rosenthal,D. L., and Grody, W. W. Polymerase chain reaction-based K-ras mu-tation detection of pancreatic adenocarcinoma in routine cytologysmears. Am. J. Clin. Pathol.,105: 321–326, 1996.
12. Villanueva, A., Reyes, G., Cuatrecasas, M., Martinez, A., Erill, N.,Lerma, E., Farre, A., Lluis, F., and Capella, G. Diagnostic utility ofK-ras mutations in fine-needle aspirates of pancreatic masses. Gastro-enterology,110: 1587–1594, 1996.13. Berthelemy, P., Bouisson, M., Escourrou, J., Vaysse, N., Rumeau,J. L., and Pradayrol, L. Identification of K-ras mutations in pancreaticjuice in the early diagnosis of pancreatic cancer. Ann. Intern. Med.,123:188–191, 1995.14. Iguchi, H., Sugano, K., Fukayama, N., Ohkura, H., Sadamoto, K.,Seo, Y., Tomoda, H., Funakoshi, A., and Wakasugi, H. Analysis ofKi- ras codon 12 mutations in the duodenal juice of patients withpancreatic cancer. Gastroenterology,110: 221–226, 1996.15. Caldas, C., Hahn, S. A., Hruban, R. H., Redston, M. S., Yeo, C. J.,and Kern, S. E. Detection of K-rasmutations in the stool of patients withpancreatic adenocarcinoma and pancreatic ductal hyperplasia. CancerRes.,54: 3568–3573, 1994.16. van Es, J. M., Polak, M. M., van den Berg, F. M., Ramsoekh, T. B.,Craanen, M. E., Hruban, R. H., and Offerhaus, G. J. A. Molecularmarkers for diagnostic cytology of neoplasms in the head of the pan-creas: mutation of K-ras and overexpression of thep53 gene product.J. Clin. Pathol.,48: 218–222, 1995.17. Trumper, L. H., Burger, B., Von Bonin, F., Hintze, A., Von Blohn,G., Pfreunschuh, M., and Daus, H. Diagnosis of pancreatic adenocarci-noma by polymerase chain reaction from pancreatic secretions. Br. J.Cancer,70: 278–284, 1994.18. Tada, M., Omata, M., and Ohto, M. Clinical application ofrasgenemutation for diagnosis of pancreatic adenocarcinoma. Gastroenterology,100: 233–238, 1991.19. Tada, M., Omata, M., Kawai, S., Saisho, H., Ohto, M., Saiki, R. K.,and Sninsky, J. J. Detection ofras gene mutations in pancreatic juiceand peripheral blood of patients with pancreatic adenocarcinoma. Can-cer Res.,53: 2472–2474, 1993.20. Watanabe, H., Sawabu, N., Songu¨r, Y., Yamaguchi, Y., Yamakawa,O., Satomura, Y., Ohta, H., Okai, T., and Wakabayashi, T. Detection ofK-ras point mutations at codon 12 in pure pancreatic juice for thediagnosis of pancreatic cancer by PCR-RFLP analysis. Pancreas,12:18–24, 1996.21. Ihalainen, J., Taavitsainen, M., Salmivaara, T., and Palotie, A.Diagnosis of pancreatic lesions using fine needle aspiration cytology:detection of K-ras point mutations using solid phase minisequencing.J. Clin. Pathol.,47: 1082–1084, 1994.22. Van Laethem, J-L., Bourgeois, V., Parma, J., Delhaye, M.,Cochaux, P., Velu, T., Deviere, J., and Cremer, M. Relative contributionof Ki- ras gene analysis and brush cytology during ERCP for thediagnosis of biliary and pancreatic diseases. Gastrointest. Endosc.,47:479–485, 1998.23. Yanagisawa, A., Ohtake, K., Ohashi, K., Hori, M., Kitagawa, T.,Sugano, H., and Kato, Y. Frequent c-Ki-ras oncogene activation inmucous cell hyperplasias of pancreas suffering from chronic inflamma-tion. Cancer Res.,53: 953–956, 1993.
634 K-ras Mutations in Endobiliary Cytology
24. Tada, M., Ohashi, M., Shiratori, Y., Okudaira, T., Komatsu, Y.,Kawabe, T., Yoshida, H., Machnami, R., Kishi, K., and Omata, M.Analysis of K-ras gene mutation in hyperplastic duct cells of thepancreas without pancreatic disease. Gastroenterology,110: 227–231,1996.25. DiGiuseppe, J. A., Hruban, R. H., Offerhaus, G. J. A., Clement,M. J., Van den Berg, F., Cameron, J. L., and Van Mansfeld, A. D. M.Detection of K-ras mutations in mucinous pancreatic duct hyperplasiafrom a patient with a family history of pancreatic carcinoma. Am. J.Pathol.,144: 889–895, 1994.26. Chung, C. H., Wilentz, R. E., Polak, M. M., Ramsoekh, T.,Noorduyn, L. A., Gouma, D. J., Huibregtse, K., Offerhaus, G. J. A.,and Slebos, R. J. C. Clinical significance of K-ras oncogene activationin ampullary neoplasms. J. Clin. Pathol.,49: 460–464, 1996.27. Hruban, R. H., Sturm, P. D. J., Slebos, R. J. C., Wilentz, R. E.,Musler, A. R., Yeo, C. J., Sohn, T. A., Van Velthuysen, M-L. F., andOfferhaus, G. J. A. Can K-rascodon 12 mutations be used to distinguishbenign bile duct proliferations from metastases in the liver? Am. J.Pathol.,151: 943–949, 1997.28. Kurzawinsky, T., Deery, A., and Davidson, B. R. Diagnostic valueof cytology for biliary stricture. Br. J. Surg.,80: 414–421, 1993.29. Lemoine, N. R., Jain, S., Hughes, C. M., Staddon, S. L., Maillet, B.,Hall, P. A., and Kloppel, G. K-ras oncogene activation in preinvasivepancreatic cancer. Gastroenterology,102: 230–236, 1992.30. Tabata, T., Fujimori, T., Maeda, S., Yamamoto, M., and Saitoh, Y.The role ofras mutation in pancreatic cancer, precancerous lesions, andchronic pancreatitis. Int. J. Pancreatol.,14: 237–244, 1993.
31. Cerny, W. L., Mangold, K. A., and Scarpelli, D. G. K-ras mutationis an early event in pancreatic duct carcinogenesis in the Syrian goldenhamster. Cancer Res.,52: 4507–4513, 1992.
32. Kozuka, S., Sassa, R., Taki, T., Masamoto, K., Nagasawa, S., Saga,S., Hasegawa, K., and Takeuchi, M. Relation of pancreatic duct hyper-plasia to carcinoma. Cancer (Phila.),43: 1418–1428, 1979.
33. Lowenfels, A. B., Maisonneuve, P., Cavallini, G., Ammann, R. W.,Lankisch, P. G., Andersen, J. R., Dimagno, E. P., Andren-Sandberg, A.,and Domellof, L. Pancreatitis and the risk of pancreatic cancer. N. Engl.J. Med.,328: 1433–1437, 1993.
34. Furuya, N., Kawa, S., Akamatsu, T., and Furihata, K. Long termfollow up of patients with chronic pancreatitis and K-ras genemutation detected in pancreatic juice. Gastroenterology,113: 593–598, 1997.
35. Brat, D. J., Lillemoe, K. D., Yeo, C. J., Warfield, P. B., and Hruban,R. H. Progression of pancreatic intraductal neoplasias to infiltrating adeno-carcinoma of the pancreas. Am. J. Surg. Pathol.,22: 163–169, 1998.
36. Villa, E., Dugani, A., Rebecchi, A. M., Vignoli, A., Grottola, A.,Buttafoco, P., Perini, M., Trande, P., Merighi, A., Lerose, R., andManenti, F. Identification of subjects at risk for colorectal carcinomathrough a test based on K-ras determination in the stool. Gastroenter-ology, 110: 1346–1353, 1996.
37. Yamashita N., Minamoto T., Ochiai A., Onda M., and Esumi H.Frequent and characteristic K-ras activation and absence of p53 proteinaccumulation in aberrant crypt foci of the colon. Gastroenterology,108:434–440, 1995.
635Clinical Cancer Research
Germline and Somatic Mutations of the STK11/LKB1Peutz-Jeghers Gene in Pancreatic andBiliary Cancers
Gloria H. Su,* Ralph H. Hruban,* Ravi K. Bansal,*G. Steven Bova,*† David J. Tang,*Manu C. Shekher,* Anne Marie Westerman,\
Mark M. Entius,¶ Michael Goggins,*Charles J. Yeo,‡ and Scott E. Kern*§
From the Departments of Pathology,* Urology,† and Surgery ‡ and
the Oncology Center,§ The Johns Hopkins University School of
Medicine, Baltimore, Maryland; the Department of Pathology,¶
The Academic Medical Center, Amsterdam, The Netherlands; and
the Department of Internal Medicine,i The Academic Hospital,
Erasmus University, Rotterdam, The Netherlands
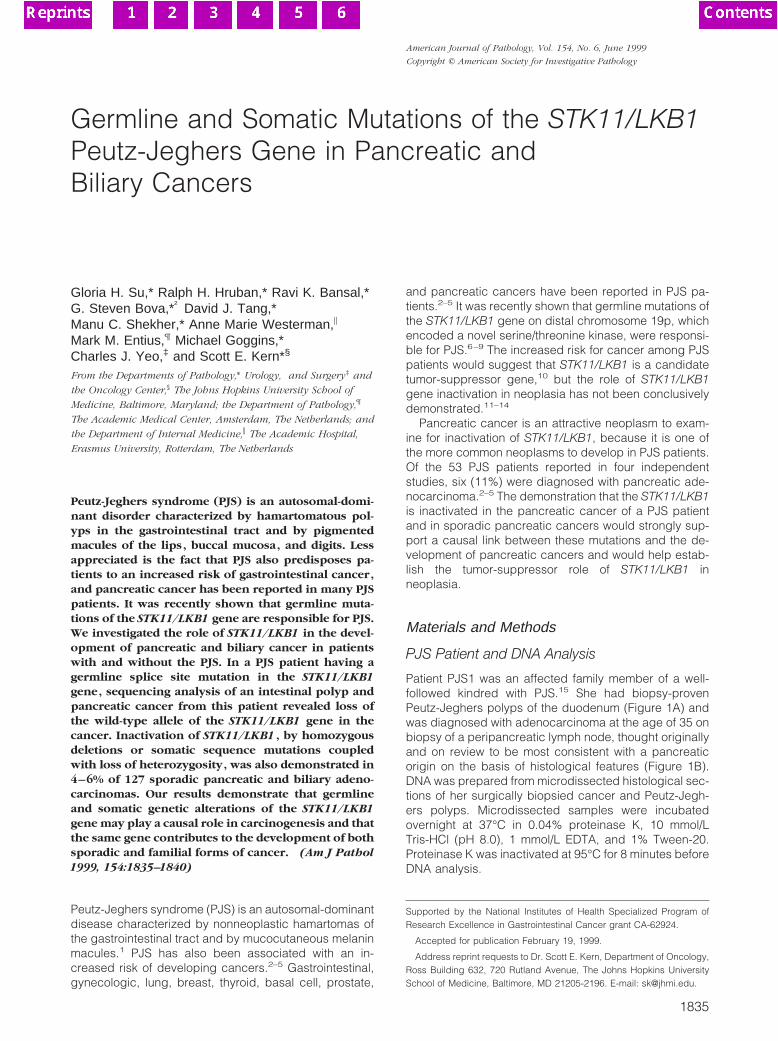
Peutz-Jeghers syndrome (PJS) is an autosomal-domi-nant disorder characterized by hamartomatous pol-yps in the gastrointestinal tract and by pigmentedmacules of the lips, buccal mucosa, and digits. Lessappreciated is the fact that PJS also predisposes pa-tients to an increased risk of gastrointestinal cancer,and pancreatic cancer has been reported in many PJSpatients. It was recently shown that germline muta-tions of the STK11/LKB1 gene are responsible for PJS.We investigated the role of STK11/LKB1 in the devel-opment of pancreatic and biliary cancer in patientswith and without the PJS. In a PJS patient having agermline splice site mutation in the STK11/LKB1gene, sequencing analysis of an intestinal polyp andpancreatic cancer from this patient revealed loss ofthe wild-type allele of the STK11/LKB1 gene in thecancer. Inactivation of STK11/LKB1 , by homozygousdeletions or somatic sequence mutations coupledwith loss of heterozygosity, was also demonstrated in4–6% of 127 sporadic pancreatic and biliary adeno-carcinomas. Our results demonstrate that germlineand somatic genetic alterations of the STK11/LKB1gene may play a causal role in carcinogenesis and thatthe same gene contributes to the development of bothsporadic and familial forms of cancer. (Am J Pathol1999, 154:1835–1840)
Peutz-Jeghers syndrome (PJS) is an autosomal-dominantdisease characterized by nonneoplastic hamartomas ofthe gastrointestinal tract and by mucocutaneous melaninmacules.1 PJS has also been associated with an in-creased risk of developing cancers.2–5 Gastrointestinal,gynecologic, lung, breast, thyroid, basal cell, prostate,
and pancreatic cancers have been reported in PJS pa-tients.2–5 It was recently shown that germline mutations ofthe STK11/LKB1 gene on distal chromosome 19p, whichencoded a novel serine/threonine kinase, were responsi-ble for PJS.6–9 The increased risk for cancer among PJSpatients would suggest that STK11/LKB1 is a candidatetumor-suppressor gene,10 but the role of STK11/LKB1gene inactivation in neoplasia has not been conclusivelydemonstrated.11–14
Pancreatic cancer is an attractive neoplasm to exam-ine for inactivation of STK11/LKB1, because it is one ofthe more common neoplasms to develop in PJS patients.Of the 53 PJS patients reported in four independentstudies, six (11%) were diagnosed with pancreatic ade-nocarcinoma.2–5 The demonstration that the STK11/LKB1is inactivated in the pancreatic cancer of a PJS patientand in sporadic pancreatic cancers would strongly sup-port a causal link between these mutations and the de-velopment of pancreatic cancers and would help estab-lish the tumor-suppressor role of STK11/LKB1 inneoplasia.
Materials and Methods
PJS Patient and DNA Analysis
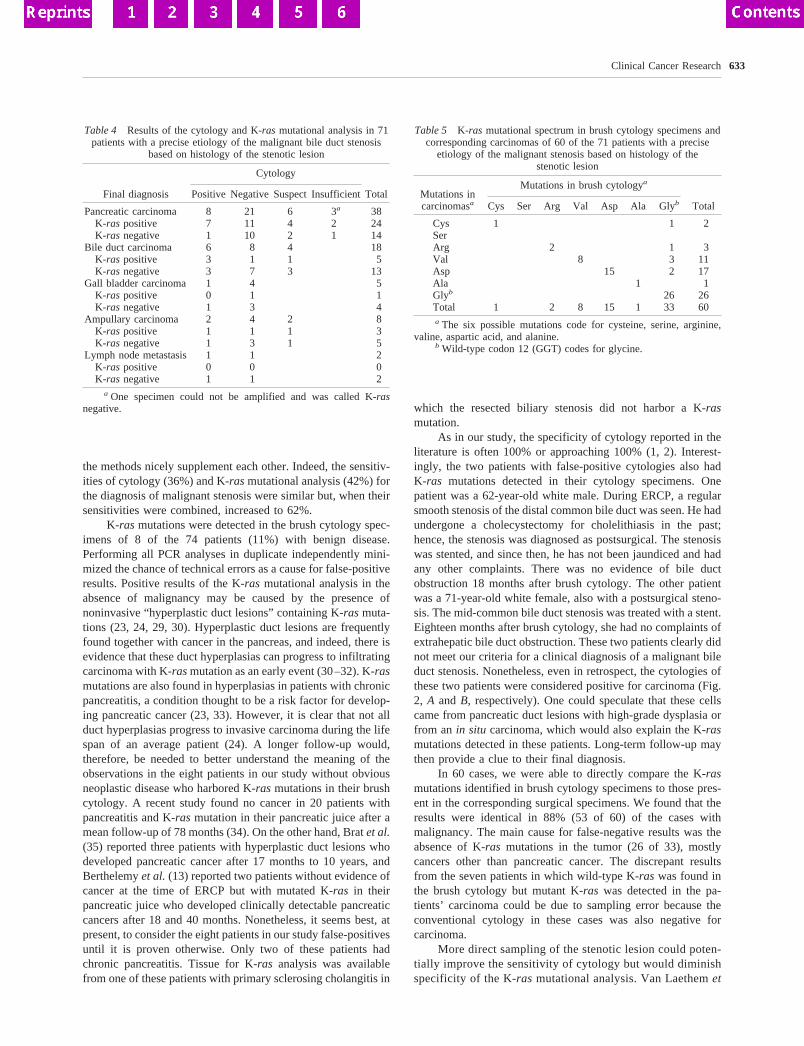
Patient PJS1 was an affected family member of a well-followed kindred with PJS.15 She had biopsy-provenPeutz-Jeghers polyps of the duodenum (Figure 1A) andwas diagnosed with adenocarcinoma at the age of 35 onbiopsy of a peripancreatic lymph node, thought originallyand on review to be most consistent with a pancreaticorigin on the basis of histological features (Figure 1B).DNA was prepared from microdissected histological sec-tions of her surgically biopsied cancer and Peutz-Jegh-ers polyps. Microdissected samples were incubatedovernight at 37°C in 0.04% proteinase K, 10 mmol/LTris-HCl (pH 8.0), 1 mmol/L EDTA, and 1% Tween-20.Proteinase K was inactivated at 95°C for 8 minutes beforeDNA analysis.
Supported by the National Institutes of Health Specialized Program ofResearch Excellence in Gastrointestinal Cancer grant CA-62924.
Accepted for publication February 19, 1999.
Address reprint requests to Dr. Scott E. Kern, Department of Oncology,Ross Building 632, 720 Rutland Avenue, The Johns Hopkins UniversitySchool of Medicine, Baltimore, MD 21205-2196. E-mail: [email protected].
American Journal of Pathology, Vol. 154, No. 6, June 1999
Copyright © American Society for Investigative Pathology
1835
Tissue Samples and Cell Lines
Cancers of the pancreas and distal common bile ductresected at The Johns Hopkins Hospital between 1992and 1997 were xenografted as described.16 In addition,at the time of the surgery, resected normal duodenalmucosa was frozen and stored at 280°C. The pancreaticcell lines Su86.86, CFPAC1, AsPC1, Capan1, Capan2,Panc1, MiaPaCa2, BxPc3, and Hs766T were purchasedfrom American Type Culture Collection (Manassas, VA)and COLO357 from European Collection of Animal CellCultures (Salisbury, Wiltshire, UK). Pancreatic cell linePL45 was established in our laboratory.16
Homozygous Deletion Analysis
Genomic DNA samples (40 ng per sample) werescreened for homozygous deletions using PCR analysisas previously described.16,17 The primers used to amplifyexon 1, 4/5, and 9 of STK11/LKB1 were as reportedpreviously.8 Duplex PCR analyses were performed withpairs of internal control primers and STK11/LKB1-specificprimers. Amplification of integrin-b24 or MKK4 was used
as a positive internal control. Primers are as listed inTable 1.
Loss of Heterozygosity and Sequence Analyses
Loss of heterozygosity (LOH) was determined using threepolymorphic markers, D19S886, D19S565, and D19S216(Research Genetics, Huntsville, AL). LOH was consid-ered to be conclusive only when analysis of the neoplas-tic DNA showed the complete loss of one of the twoalleles present in the patient’s corresponding normalDNA. When a normal DNA sample was unavailable, LOHstatus was presumptively shown by the unambiguouspresence of only a single allele size at all three polymor-phic markers evaluated. All samples which displayedconclusive or presumptive LOH were subject to sequenc-ing. Each exon was amplified by PCR from genomicDNA, treated with exonuclease I and shrimp alkalinephosphatase (USB, Cleveland, OH), and subjected tocycle-sequencing (ThermoSequenase, Amersham, Ar-lington Heights, IL). The majority of the PCR primers havebeen reported previously.8 Additional primers are listedin Table 1.
Results
Germline Mutation of STK11/LKB1 andTumorigenesis
To determine the genetic basis for the increased risk ofcancer among PJS patients, we examined the status ofthe STK11/LKB1 gene in cancer tissues obtained from apatient diagnosed with PJS. In patient PJS1, the known
Figure 1. Histological findings of patient PJS1. A: The Peutz-Jeghers polyp ofthe duodenum (original magnification, 350). B: Poorly differentiated ade-nocarcinoma of the pancreas (original magnification, 3250). Hematoxylin &eosin staining.
Table 1. Sequences of Primers Used for Amplification andSequencing of STK11/LKB1
Primer Sequence
STK11-E1-F2 59-gaa ggg ttt ttc cct tcc-39STK11-E1-R2 59-cct tca cct tgc cgt aag ag-39STK11-E3-F1 59-tcc aga gcc cct ttt ctg-39STK11-E3-R1 59-aat gaa tat cag gac aag cag-39STK11-E3-F3 59-gta tat ggt gat gga gta ctgSTK11-E3-SEQ-F2 59-ccg tgc tcc ctg ggc ctg tga gtg-39STK11-E3-SEQ-F3 59-cgt gtg tgg cat gca gga aat gct g-39STK11-E3-SEQ-R 59-tgt ggc ctc acg gaa agg agc ctg-39STK11-E9-F2 59-tcc cag aag agg agg cca g-39STK11-E9-R2 59-cgg tca cca tga ctg act ag-39STK11-E1-SEQ-F 59-gga agt cgg aac aca agg aag gac-39STK11-E1-SEQ-F2 59-cag ccg cgc cgc aag cgg gcc aag-39STK11-E2-SEQ-R 59-gcc tcg agg cag gcg gac cca ggg-39STK11-E3-SEQ-F2 59-ccg tgc tcc ctg ggc ctg tga gtg-39STK11-E3-SEQ-R 59-tgt ggc ctc acg gaa agg agc ctg-39STK11-E4/5-SEQ-F2 59-agc tgc aaa ggg gac ccc tgt gag-39STK11-E5-SEQ-F 59-tag gca cgt gct agg ggg ggc cct g-39STK11-E6-SEQ-R 59-ctg aca ccc cca acc cta cat ttc-39STK11-E7-SEQ-F2 59-cgg gga cgg ttg gtg ggg tct cag-39STK11-E8-SEQ-F2 59-ccg ccc tgg tgc cag cct gac agg-39STK11-E9-SEQ-F2 59-ggg gcc agc cag gtc cct gtg gct-39INTB4-A-F 59-gtg tcc gtg tgg ata agg ac-39INTB4-A-R 59-tcc atg acc acg atg ctc tc-39MKK4-E-F 59-tgg gga aaa ttg gct tta act ac-39MKK4-E-R 59-cga gac cat tat gac cta ttg tg-39
1836 Su et alAJP June 1999, Vol. 154, No. 6
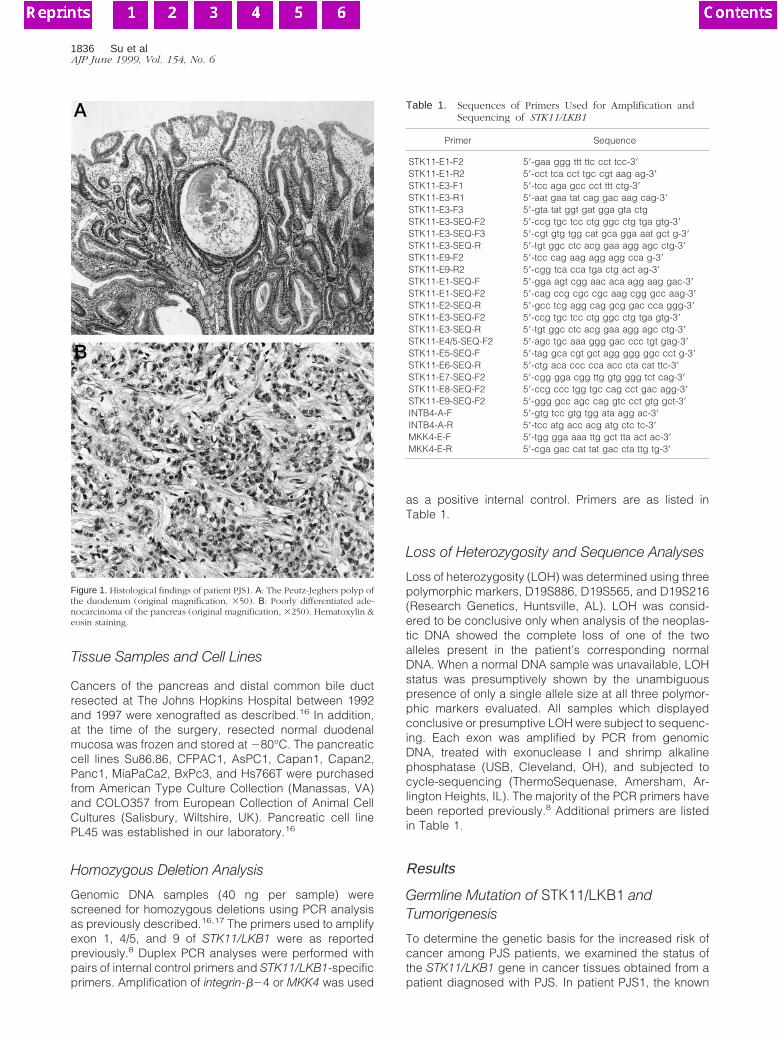
germline mutation of this family at the splice donor site ofintron 3 of STK11/LKB115 was demonstrated in nonneo-plastic tissue (Table 3) (Figure 2A). DNA from this pa-tient’s microdissected adenocarcinoma and epithelium ofa Peutz-Jeghers intestinal polyp were then sequencedand the second allele of STK11/LKB1 was lost (.80%decrease in allele intensity by densitometry) in the pan-creatic cancer, but not in the intestinal polyp (Figure 2B).Due to the limited amount of archival material, only limitedsequencing was performed. Because LOH is not the onlymechanism of gene inactivation, it is possible that thesecond allele of STK11-LKB1 in the polyp could be inac-tivated by methylation, small deletions, or point mutationoutside of intron 3. The germline mutation is predicted toaffect splicing of the STK11/LKB1 transcript.
Somatic Inactivation of STK11/LKB1 inPancreatic and Biliary Cancers
To further validate STK11/LKB1 as a tumor-suppressorgene, we evaluated the role of somatic mutation inSTK11/LKB1 in sporadic pancreatic cancer. Using prim-ers specific for exon 1, 4/5, and 9 of STK11/LKB1, wescreened for homozygous deletions among a panel of100 xenografts of primary pancreatic ductal adenocarci-nomas, 16 xenografts of primary distal common bile ductadenocarcinomas, 19 xenografts of other primary carci-nomas of the periampullary region (predominantly duo-denal and ampullary cancer), and 11 pancreatic cancercell lines (Table 2). One pancreatic (PX30) and one distalcommon bile duct (PX115) adenocarcinoma exhibited
Table 2. Sporadic Neoplasms Analyzed for STK11/LKB1 Mutations
Tumor type
Totalnumber ofsamples
Number of samples analyzed in
Number ofmutatedsamples
Homozygousdeletion
screening LOH study Sequencing
Pancreatic adenocarcinoma 100 100 92 30 4Biliary adenocarcinoma 16 16 0 0 1Pancreatic cell lines 11 11 11 9 0Other carcinomas* 19 19 0 0 0
*Primary carcinomas of the periampullary region, predominantly duodenal and ampullary cancers.
Figure 2. Germline mutation of STK11/LKB1 in patient PJS1 and loss of the wild-type allele of STK11/LKB1 in the pancreatic cancer of the same patient. A: Thegermline mutation of STK11/LKB1 in the family of patient PJS1 was confirmed (lanes 2) (Ref. 15). CFPAC1 (lanes 1) and two pancreatic cancer xenografts (lanes3 and 4) exhibited normal sequences. The samples were sequenced with a forward primer, STK11-E3-SEQ-F2. The arrow indicates the site of the nucleotideinsertion mutation. B: DNA from normal tissue of a non-Peutz-Jeghers patient (lane 1), cancer of patient PJS1 (lane 2), and polyps of patient PJS1 (lane 3) werePCR-amplified and sequenced with a reverse primer, STK11-E3-SEQ-R. The cancer, but not the polyp, of patient PJS1 showed loss of the remaining allele ofSTK11/LKB1.
Cancer and the Peutz-Jeghers Gene 1837AJP June 1999, Vol. 154, No. 6
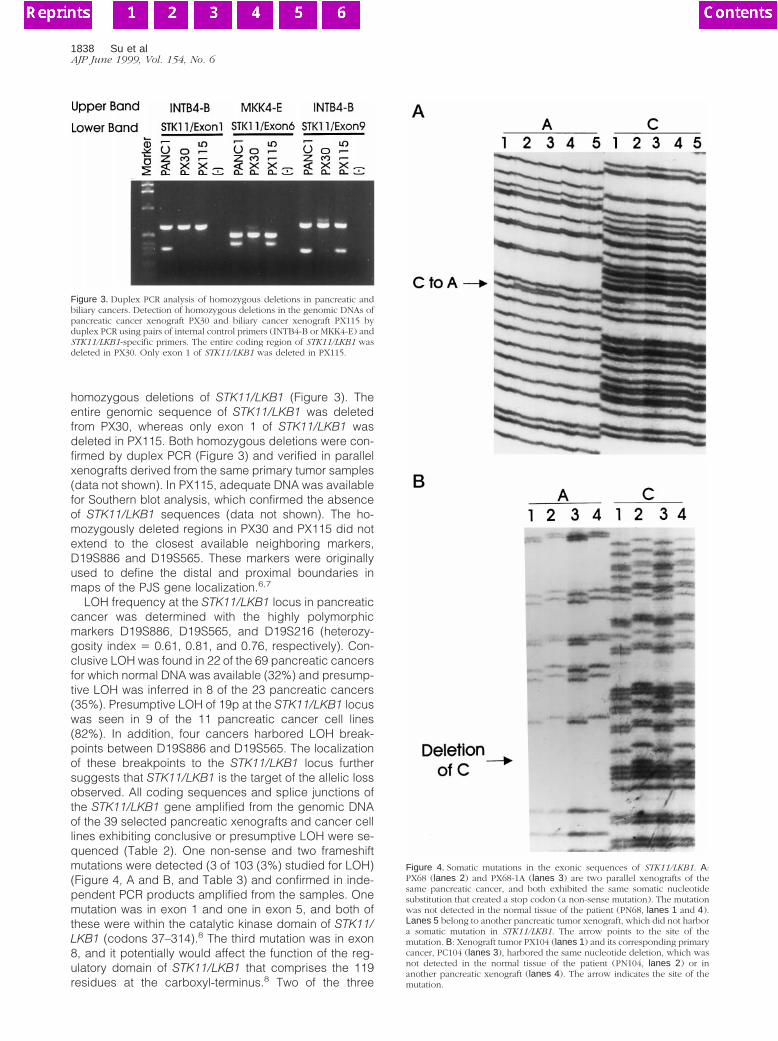
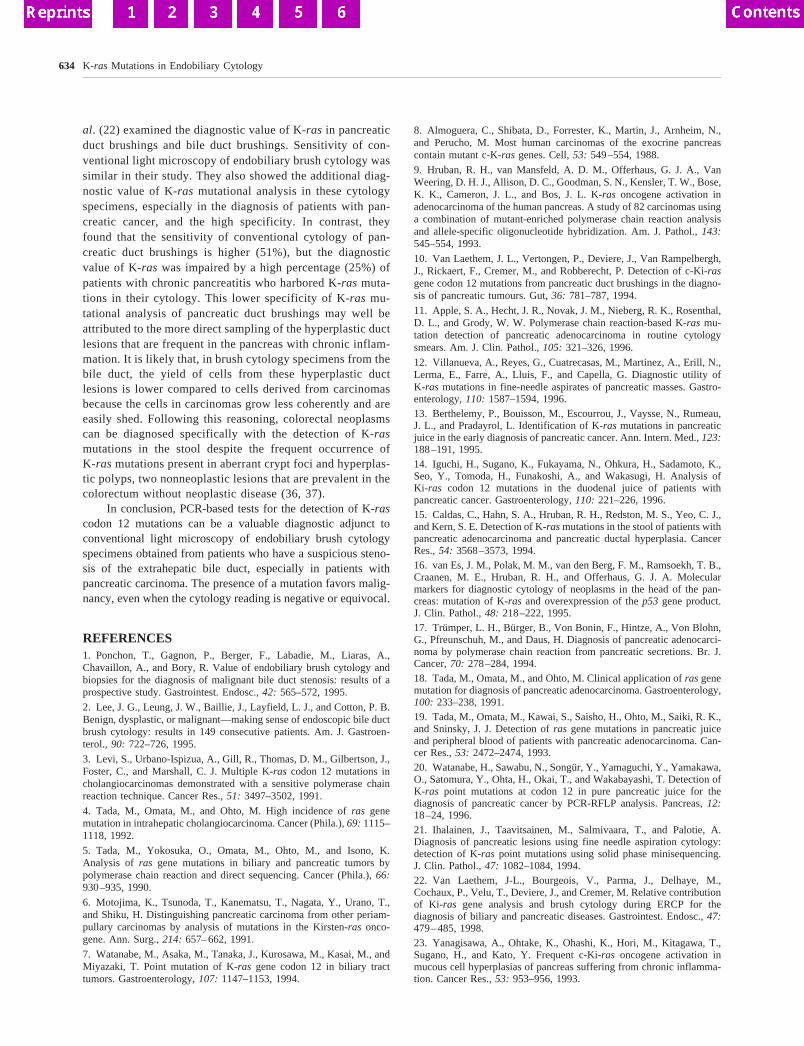
homozygous deletions of STK11/LKB1 (Figure 3). Theentire genomic sequence of STK11/LKB1 was deletedfrom PX30, whereas only exon 1 of STK11/LKB1 wasdeleted in PX115. Both homozygous deletions were con-firmed by duplex PCR (Figure 3) and verified in parallelxenografts derived from the same primary tumor samples(data not shown). In PX115, adequate DNA was availablefor Southern blot analysis, which confirmed the absenceof STK11/LKB1 sequences (data not shown). The ho-mozygously deleted regions in PX30 and PX115 did notextend to the closest available neighboring markers,D19S886 and D19S565. These markers were originallyused to define the distal and proximal boundaries inmaps of the PJS gene localization.6,7
LOH frequency at the STK11/LKB1 locus in pancreaticcancer was determined with the highly polymorphicmarkers D19S886, D19S565, and D19S216 (heterozy-gosity index 5 0.61, 0.81, and 0.76, respectively). Con-clusive LOH was found in 22 of the 69 pancreatic cancersfor which normal DNA was available (32%) and presump-tive LOH was inferred in 8 of the 23 pancreatic cancers(35%). Presumptive LOH of 19p at the STK11/LKB1 locuswas seen in 9 of the 11 pancreatic cancer cell lines(82%). In addition, four cancers harbored LOH break-points between D19S886 and D19S565. The localizationof these breakpoints to the STK11/LKB1 locus furthersuggests that STK11/LKB1 is the target of the allelic lossobserved. All coding sequences and splice junctions ofthe STK11/LKB1 gene amplified from the genomic DNAof the 39 selected pancreatic xenografts and cancer celllines exhibiting conclusive or presumptive LOH were se-quenced (Table 2). One non-sense and two frameshiftmutations were detected (3 of 103 (3%) studied for LOH)(Figure 4, A and B, and Table 3) and confirmed in inde-pendent PCR products amplified from the samples. Onemutation was in exon 1 and one in exon 5, and both ofthese were within the catalytic kinase domain of STK11/LKB1 (codons 37–314).8 The third mutation was in exon8, and it potentially would affect the function of the reg-ulatory domain of STK11/LKB1 that comprises the 119residues at the carboxyl-terminus.8 Two of the three
Figure 3. Duplex PCR analysis of homozygous deletions in pancreatic andbiliary cancers. Detection of homozygous deletions in the genomic DNAs ofpancreatic cancer xenograft PX30 and biliary cancer xenograft PX115 byduplex PCR using pairs of internal control primers (INTB4-B or MKK4-E) andSTK11/LKB1-specific primers. The entire coding region of STK11/LKB1 wasdeleted in PX30. Only exon 1 of STK11/LKB1 was deleted in PX115.
Figure 4. Somatic mutations in the exonic sequences of STK11/LKB1. A:PX68 (lanes 2) and PX68-1A (lanes 3) are two parallel xenografts of thesame pancreatic cancer, and both exhibited the same somatic nucleotidesubstitution that created a stop codon (a non-sense mutation). The mutationwas not detected in the normal tissue of the patient (PN68, lanes 1 and 4).Lanes 5 belong to another pancreatic tumor xenograft, which did not harbora somatic mutation in STK11/LKB1. The arrow points to the site of themutation. B: Xenograft tumor PX104 (lanes 1) and its corresponding primarycancer, PC104 (lanes 3), harbored the same nucleotide deletion, which wasnot detected in the normal tissue of the patient (PN104, lanes 2) or inanother pancreatic xenograft (lanes 4). The arrow indicates the site of themutation.
1838 Su et alAJP June 1999, Vol. 154, No. 6
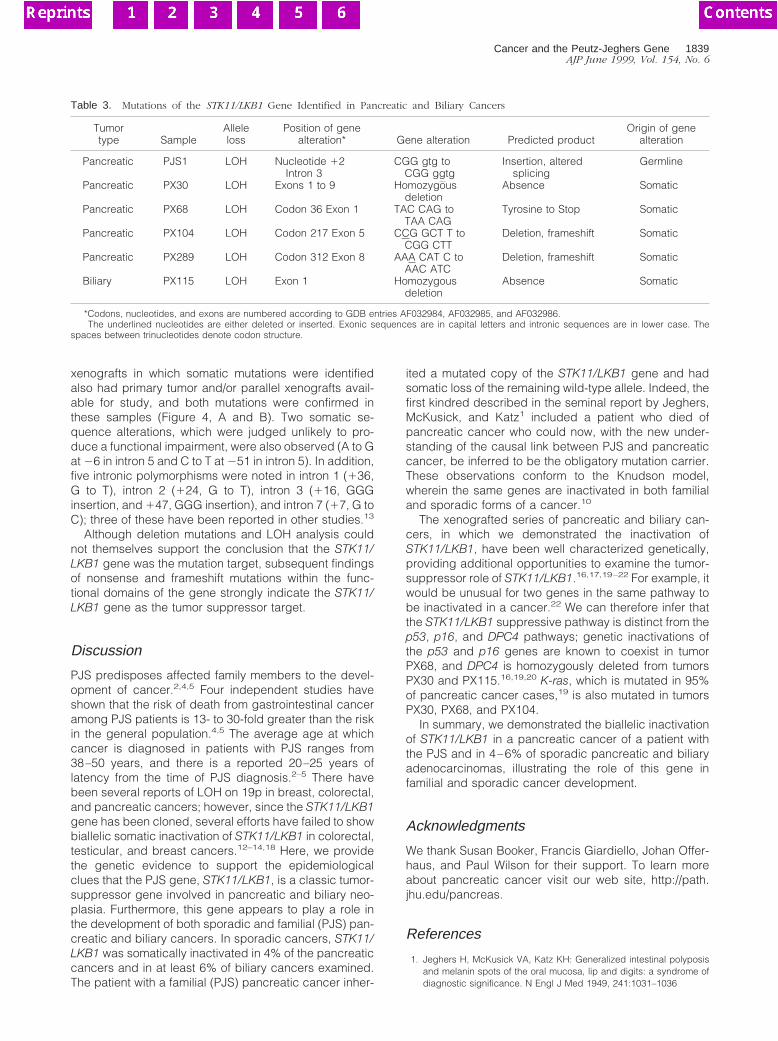
xenografts in which somatic mutations were identifiedalso had primary tumor and/or parallel xenografts avail-able for study, and both mutations were confirmed inthese samples (Figure 4, A and B). Two somatic se-quence alterations, which were judged unlikely to pro-duce a functional impairment, were also observed (A to Gat 26 in intron 5 and C to T at 251 in intron 5). In addition,five intronic polymorphisms were noted in intron 1 (136,G to T), intron 2 (124, G to T), intron 3 (116, GGGinsertion, and 147, GGG insertion), and intron 7 (17, G toC); three of these have been reported in other studies.13
Although deletion mutations and LOH analysis couldnot themselves support the conclusion that the STK11/LKB1 gene was the mutation target, subsequent findingsof nonsense and frameshift mutations within the func-tional domains of the gene strongly indicate the STK11/LKB1 gene as the tumor suppressor target.
Discussion
PJS predisposes affected family members to the devel-opment of cancer.2,4,5 Four independent studies haveshown that the risk of death from gastrointestinal canceramong PJS patients is 13- to 30-fold greater than the riskin the general population.4,5 The average age at whichcancer is diagnosed in patients with PJS ranges from38–50 years, and there is a reported 20–25 years oflatency from the time of PJS diagnosis.2–5 There havebeen several reports of LOH on 19p in breast, colorectal,and pancreatic cancers; however, since the STK11/LKB1gene has been cloned, several efforts have failed to showbiallelic somatic inactivation of STK11/LKB1 in colorectal,testicular, and breast cancers.12–14,18 Here, we providethe genetic evidence to support the epidemiologicalclues that the PJS gene, STK11/LKB1, is a classic tumor-suppressor gene involved in pancreatic and biliary neo-plasia. Furthermore, this gene appears to play a role inthe development of both sporadic and familial (PJS) pan-creatic and biliary cancers. In sporadic cancers, STK11/LKB1 was somatically inactivated in 4% of the pancreaticcancers and in at least 6% of biliary cancers examined.The patient with a familial (PJS) pancreatic cancer inher-
ited a mutated copy of the STK11/LKB1 gene and hadsomatic loss of the remaining wild-type allele. Indeed, thefirst kindred described in the seminal report by Jeghers,McKusick, and Katz1 included a patient who died ofpancreatic cancer who could now, with the new under-standing of the causal link between PJS and pancreaticcancer, be inferred to be the obligatory mutation carrier.These observations conform to the Knudson model,wherein the same genes are inactivated in both familialand sporadic forms of a cancer.10
The xenografted series of pancreatic and biliary can-cers, in which we demonstrated the inactivation ofSTK11/LKB1, have been well characterized genetically,providing additional opportunities to examine the tumor-suppressor role of STK11/LKB1.16,17,19–22 For example, itwould be unusual for two genes in the same pathway tobe inactivated in a cancer.22 We can therefore infer thatthe STK11/LKB1 suppressive pathway is distinct from thep53, p16, and DPC4 pathways; genetic inactivations ofthe p53 and p16 genes are known to coexist in tumorPX68, and DPC4 is homozygously deleted from tumorsPX30 and PX115.16,19,20 K-ras, which is mutated in 95%of pancreatic cancer cases,19 is also mutated in tumorsPX30, PX68, and PX104.
In summary, we demonstrated the biallelic inactivationof STK11/LKB1 in a pancreatic cancer of a patient withthe PJS and in 4–6% of sporadic pancreatic and biliaryadenocarcinomas, illustrating the role of this gene infamilial and sporadic cancer development.
Acknowledgments
We thank Susan Booker, Francis Giardiello, Johan Offer-haus, and Paul Wilson for their support. To learn moreabout pancreatic cancer visit our web site, http://path.jhu.edu/pancreas.
References
1. Jeghers H, McKusick VA, Katz KH: Generalized intestinal polyposisand melanin spots of the oral mucosa, lip and digits: a syndrome ofdiagnostic significance. N Engl J Med 1949, 241:1031–1036
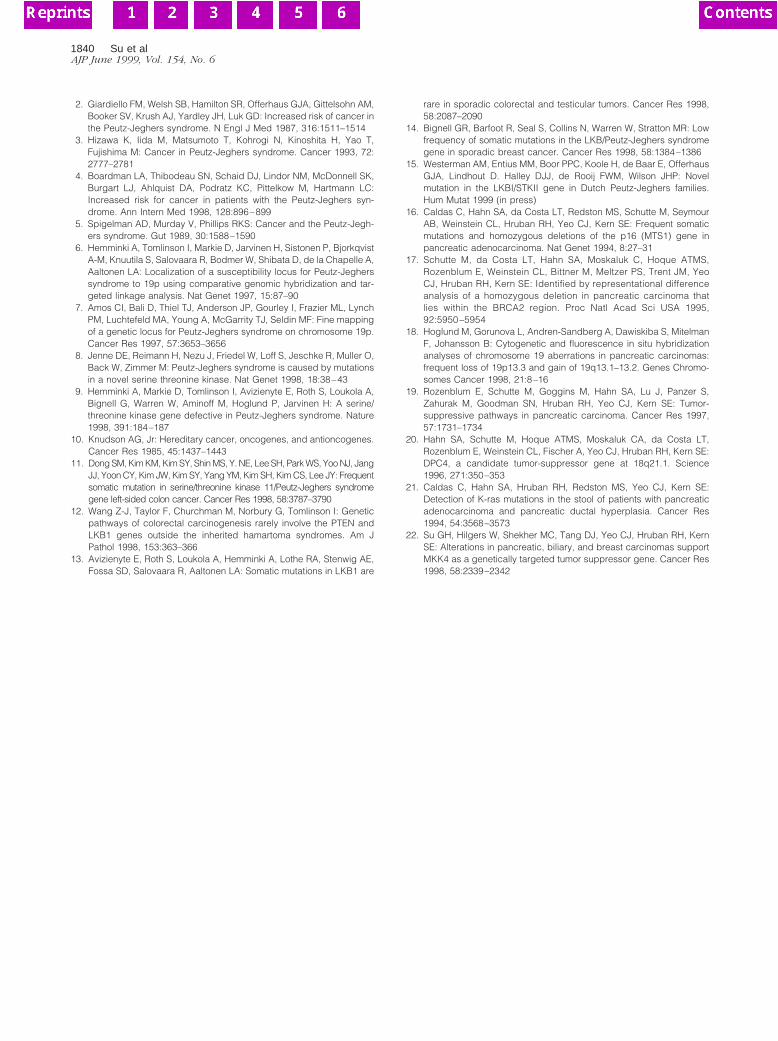
Table 3. Mutations of the STK11/LKB1 Gene Identified in Pancreatic and Biliary Cancers
Tumortype Sample
Alleleloss
Position of genealteration* Gene alteration† Predicted product
Origin of genealteration
Pancreatic PJS1 LOH Nucleotide 12Intron 3
CGG gtg toCGG ggtg
Insertion, alteredsplicing
Germline
Pancreatic PX30 LOH Exons 1 to 9 Homozygousdeletion
Absence Somatic
Pancreatic PX68 LOH Codon 36 Exon 1 TAC CAG toTAA CAG
Tyrosine to Stop Somatic
Pancreatic PX104 LOH Codon 217 Exon 5 CCG GCT T toCGG CTT
Deletion, frameshift Somatic
Pancreatic PX289 LOH Codon 312 Exon 8 AAA CAT C toAAC ATC
Deletion, frameshift Somatic
Biliary PX115 LOH Exon 1 Homozygousdeletion
Absence Somatic
*Codons, nucleotides, and exons are numbered according to GDB entries AF032984, AF032985, and AF032986.†The underlined nucleotides are either deleted or inserted. Exonic sequences are in capital letters and intronic sequences are in lower case. The
spaces between trinucleotides denote codon structure.
Cancer and the Peutz-Jeghers Gene 1839AJP June 1999, Vol. 154, No. 6
2. Giardiello FM, Welsh SB, Hamilton SR, Offerhaus GJA, Gittelsohn AM,Booker SV, Krush AJ, Yardley JH, Luk GD: Increased risk of cancer inthe Peutz-Jeghers syndrome. N Engl J Med 1987, 316:1511–1514
3. Hizawa K, Iida M, Matsumoto T, Kohrogi N, Kinoshita H, Yao T,Fujishima M: Cancer in Peutz-Jeghers syndrome. Cancer 1993, 72:2777–2781
4. Boardman LA, Thibodeau SN, Schaid DJ, Lindor NM, McDonnell SK,Burgart LJ, Ahlquist DA, Podratz KC, Pittelkow M, Hartmann LC:Increased risk for cancer in patients with the Peutz-Jeghers syn-drome. Ann Intern Med 1998, 128:896–899
5. Spigelman AD, Murday V, Phillips RKS: Cancer and the Peutz-Jegh-ers syndrome. Gut 1989, 30:1588–1590
6. Hemminki A, Tomlinson I, Markie D, Jarvinen H, Sistonen P, BjorkqvistA-M, Knuutila S, Salovaara R, Bodmer W, Shibata D, de la Chapelle A,Aaltonen LA: Localization of a susceptibility locus for Peutz-Jegherssyndrome to 19p using comparative genomic hybridization and tar-geted linkage analysis. Nat Genet 1997, 15:87–90
7. Amos CI, Bali D, Thiel TJ, Anderson JP, Gourley I, Frazier ML, LynchPM, Luchtefeld MA, Young A, McGarrity TJ, Seldin MF: Fine mappingof a genetic locus for Peutz-Jeghers syndrome on chromosome 19p.Cancer Res 1997, 57:3653–3656
8. Jenne DE, Reimann H, Nezu J, Friedel W, Loff S, Jeschke R, Muller O,Back W, Zimmer M: Peutz-Jeghers syndrome is caused by mutationsin a novel serine threonine kinase. Nat Genet 1998, 18:38–43
9. Hemminki A, Markie D, Tomlinson I, Avizienyte E, Roth S, Loukola A,Bignell G, Warren W, Aminoff M, Hoglund P, Jarvinen H: A serine/threonine kinase gene defective in Peutz-Jeghers syndrome. Nature1998, 391:184–187
10. Knudson AG, Jr: Hereditary cancer, oncogenes, and antioncogenes.Cancer Res 1985, 45:1437–1443
11. Dong SM, Kim KM, Kim SY, Shin MS, Y. NE, Lee SH, Park WS, Yoo NJ, JangJJ, Yoon CY, Kim JW, Kim SY, Yang YM, Kim SH, Kim CS, Lee JY: Frequentsomatic mutation in serine/threonine kinase 11/Peutz-Jeghers syndromegene left-sided colon cancer. Cancer Res 1998, 58:3787–3790
12. Wang Z-J, Taylor F, Churchman M, Norbury G, Tomlinson I: Geneticpathways of colorectal carcinogenesis rarely involve the PTEN andLKB1 genes outside the inherited hamartoma syndromes. Am JPathol 1998, 153:363–366
13. Avizienyte E, Roth S, Loukola A, Hemminki A, Lothe RA, Stenwig AE,Fossa SD, Salovaara R, Aaltonen LA: Somatic mutations in LKB1 are
rare in sporadic colorectal and testicular tumors. Cancer Res 1998,58:2087–2090
14. Bignell GR, Barfoot R, Seal S, Collins N, Warren W, Stratton MR: Lowfrequency of somatic mutations in the LKB/Peutz-Jeghers syndromegene in sporadic breast cancer. Cancer Res 1998, 58:1384–1386
15. Westerman AM, Entius MM, Boor PPC, Koole H, de Baar E, OfferhausGJA, Lindhout D. Halley DJJ, de Rooij FWM, Wilson JHP: Novelmutation in the LKBI/STKII gene in Dutch Peutz-Jeghers families.Hum Mutat 1999 (in press)
16. Caldas C, Hahn SA, da Costa LT, Redston MS, Schutte M, SeymourAB, Weinstein CL, Hruban RH, Yeo CJ, Kern SE: Frequent somaticmutations and homozygous deletions of the p16 (MTS1) gene inpancreatic adenocarcinoma. Nat Genet 1994, 8:27–31
17. Schutte M, da Costa LT, Hahn SA, Moskaluk C, Hoque ATMS,Rozenblum E, Weinstein CL, Bittner M, Meltzer PS, Trent JM, YeoCJ, Hruban RH, Kern SE: Identified by representational differenceanalysis of a homozygous deletion in pancreatic carcinoma thatlies within the BRCA2 region. Proc Natl Acad Sci USA 1995,92:5950 –5954
18. Hoglund M, Gorunova L, Andren-Sandberg A, Dawiskiba S, MitelmanF, Johansson B: Cytogenetic and fluorescence in situ hybridizationanalyses of chromosome 19 aberrations in pancreatic carcinomas:frequent loss of 19p13.3 and gain of 19q13.1–13.2. Genes Chromo-somes Cancer 1998, 21:8–16
19. Rozenblum E, Schutte M, Goggins M, Hahn SA, Lu J, Panzer S,Zahurak M, Goodman SN, Hruban RH, Yeo CJ, Kern SE: Tumor-suppressive pathways in pancreatic carcinoma. Cancer Res 1997,57:1731–1734
20. Hahn SA, Schutte M, Hoque ATMS, Moskaluk CA, da Costa LT,Rozenblum E, Weinstein CL, Fischer A, Yeo CJ, Hruban RH, Kern SE:DPC4, a candidate tumor-suppressor gene at 18q21.1. Science1996, 271:350–353
21. Caldas C, Hahn SA, Hruban RH, Redston MS, Yeo CJ, Kern SE:Detection of K-ras mutations in the stool of patients with pancreaticadenocarcinoma and pancreatic ductal hyperplasia. Cancer Res1994, 54:3568–3573
22. Su GH, Hilgers W, Shekher MC, Tang DJ, Yeo CJ, Hruban RH, KernSE: Alterations in pancreatic, biliary, and breast carcinomas supportMKK4 as a genetically targeted tumor suppressor gene. Cancer Res1998, 58:2339–2342
1840 Su et alAJP June 1999, Vol. 154, No. 6
[CANCER RESEARCH 61, 4320–4324, June 1, 2001]
Advances in Brief
Discovery of New Markers of Cancer through Serial Analysis of Gene Expression:Prostate Stem Cell Antigen Is Overexpressed in Pancreatic Adenocarcinoma1
Pedram Argani,2 Christophe Rosty, Robert E. Reiter, Robb E. Wilentz, Selva R. Murugesan, Steven D. Leach,Byungwoo Ryu, Halcyon G. Skinner, Michael Goggins, Elizabeth M. Jaffee, Charles J. Yeo, John L. Cameron,Scott E. Kern, and Ralph H. HrubanDepartments of Pathology [P. A., C. R., R. E. W., S. R. M., H. G. S., M. G., S. E. K., R. H. H.], Surgery [S. D. L., C. J. Y., J. L. C.], Oncology [S. D. L., B. R., M.G., E. M. J.,C. J. Y., S. E. K., R. H. H.], and Medicine [M. G.], The Johns Hopkins Medical Institutions, Baltimore, Maryland 21287; Department of Epidemiology, TheJohns Hopkins Schoolof Public Health, Baltimore, Maryland 21287 [H. G. S.]; and Department of Urology, University of California, Los Angeles, California 90095 [R. E. R.]
Abstract
Serial analysis of gene expression (SAGE) can be used to quantify geneexpression in human tissues. Comparison of gene expression levels inneoplastic tissues with those seen in nonneoplastic tissues can, in turn,identify novel tumor markers. Such markers are urgently needed forhighly lethal cancers like pancreatic adenocarcinoma, which typicallypresents at an incurable, advanced stage. The results of SAGE analyses ofa large number of neoplastic and nonneoplastic tissues are now availableonline, facilitating the rapid identification of novel tumor markers. Wesearched an online SAGE database to identify genes preferentially ex-pressed in pancreatic cancers as compared with normal tissues. SAGElibraries derived from pancreatic adenocarcinomas were compared withSAGE libraries derived from nonneoplastic tissues. Three promising tagswere identified. Two of these tags corresponded to genes (lipocalin andtrefoil factor 2) previously shown to be overexpressed in pancreatic car-cinoma, whereas the third tag corresponded to prostate stem cell antigen(PSCA), a recently discovered gene thought to be largely restricted toprostatic basal cells and prostatic adenocarcinomas. PSCA was expressedin four of the six pancreatic cancer SAGE libraries, but not in the librariesderived from normal pancreatic ductal cells. We confirmed the overex-pression of the PSCA mRNA transcript in 14 of 19 pancreatic cancer celllines by reverse transcription-PCR, and using immunohistochemistry, wedemonstrated PSCA protein overexpression in 36 of 60 (60%) primarypancreatic adenocarcinomas. In 59 of 60 cases, the adjacent nonneoplasticpancreas did not label for PSCA. PSCA is a novel tumor marker forpancreatic carcinoma that has potential diagnostic and therapeutic impli-cations. These results establish the validity of analyses of SAGE databasesto identify novel tumor markers.
Introduction
SAGE3 is a recently described technique that allows one to obtaina quantitative and comprehensive profile of cellular gene expression(1, 2). Briefly, in this procedure, cellular mRNA transcripts areconverted to cDNA and then cleaved at specific sites by restrictionenzymes into small (10–14 bp) fragments, also known as tags. Thesetags are ligated together into difragments, amplified by PCR, and thenconcatenated and sequenced as one long fragment of DNA. Each10–14-bp fragment (tag) should uniquely identify a specific gene
transcript because it corresponds to a defined sequence near thetranscript’s 39 terminus, as dictated by the tagging restriction enzymeused (1). The abundance of each tag provides a quantitative measureof the transcript level present within the mRNA sample analyzed,which therefore allows expression levels of specific transcripts to becompared between two samples (2). This ability to quantitate geneexpression represents a major advantage of SAGE over other methodsof screening cDNA libraries for differentially expressed genes.
In the initial demonstration of the SAGE technique, a gene expres-sion profile of the normal pancreas was constructed and validated byNorthern blotting (1). Subsequently, Zhanget al. (2) used SAGE todemonstrate differences in expression patterns between colonic andpancreatic adenocarcinomas and normal colonic epithelium. Suchapplications of SAGE hold tremendous promise for the identificationof diagnostic and/or prognostic markers of malignancy. Indeed, theabove-referenced analyses identified several promising serum mark-ers for pancreatic carcinoma, such as tissue inhibitor of metallopro-teinase 1 (3).
Three recent advances have made analyses of SAGE libraries fordifferentially expressed genes more feasible. First, rapid progress inthe Human Genome Project has facilitated the mapping of specificgenes to individual tags specified by SAGE (4). Fewer tags nowcorrespond to ESTs of unknown origin, and more can be assigned toknown genes. Second, a large number of normal and neoplastic tissueshave now been analyzed by SAGE, creating extremely large databasesfor study. Third, much of this database is now online and available tothe general public (5, 6).4 As of February 1, 2001, this online databaseincluded 88 SAGE libraries, and 3,632,974 tags.
Armed with these tools, we searched an online SAGE database toidentify novel markers of pancreatic adenocarcinoma.
Materials and Methods
Based on the identification of differentially expressed genes in our ongoingSAGE investigation of pancreatic cancer,5 the xProfiler program availableonline4 was used to compare gene expression patterns in pancreatic cancer withthose in nonneoplastic tissues. In this program, one can select SAGE librariesfor analysis and then compare the tags in one group of online SAGE librarieswith the tags in another group. We used two queries to determine differentiallyexpressed genes. In the first strategy, we chose a pancreatic adenocarcinomagroup composed of the SAGE libraries of four pancreatic cancer cell lines thatyielded 96,494 total tags (CAPAN1, 37,926 tags; CAPAN2, 23,222 tags;HS766T, 10,467 tags; and Panc1, 24,879 tags). The nonneoplastic comparisongroup in this analysis was composed of the SAGE libraries of two short-termcultures of normal pancreatic duct epithelial cells that yielded 64,577 tags (HX,32,157 tags; and H126, 32,420 tags). In the second query, we expanded both
Received 2/22/01; accepted 4/12/01.The costs of publication of this article were defrayed in part by the payment of page
charges. This article must therefore be hereby markedadvertisementin accordance with18 U.S.C. Section 1734 solely to indicate this fact.
1 Supported by the Specialized Program of Research Excellence (SPORE) in Gastro-intestinal Cancer p50-CA62924, The National Pancreas Foundation, and The MichaelRolfe Fund for pancreatic cancer research.
2 To whom requests for reprints should be addressed, at The Johns Hopkins Hospital-Surgical Pathology, The Harry and Jeanette Weinberg Building, 401 North Broadway,Room 2242, Baltimore, MD 21231-2410. Phone: (410) 614-2428; Fax: (410) 955-0115;E-mail: [email protected].
3 The abbreviations used are: SAGE, serial analysis of gene expression; PanIN,pancreatic intraepithelial neoplasia; PSCA, prostate stem cell antigen; TFF2, trefoil factor2; RT-PCR, reverse transcription-PCR; EST, expressed sequence tag.
4 http://www.ncbi.nlm.nih.gov/SAGE.5 B. Ryu, J. Jones, M. A. Hollingsworth, R. H. Hruban, and S. E. Kern. Identification
of differentially expressed genes by serial analysis of gene expression profiling inpancreatic cancer, manuscript in preparation.
4320
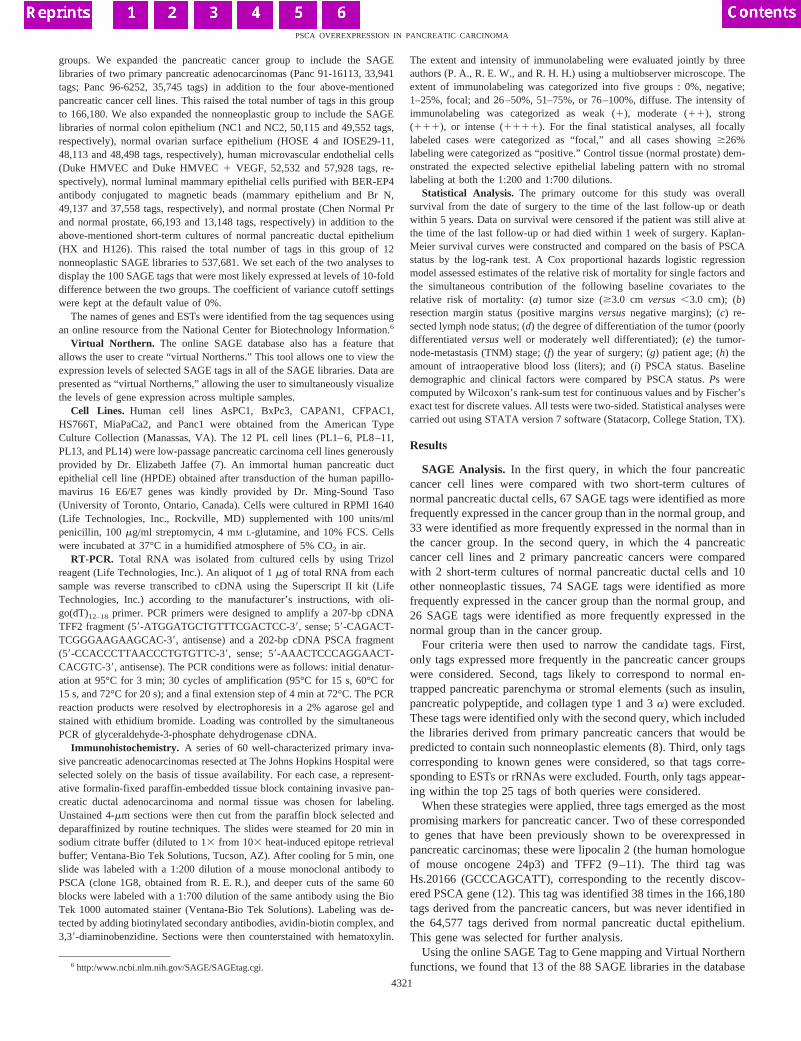
groups. We expanded the pancreatic cancer group to include the SAGElibraries of two primary pancreatic adenocarcinomas (Panc 91-16113, 33,941tags; Panc 96-6252, 35,745 tags) in addition to the four above-mentionedpancreatic cancer cell lines. This raised the total number of tags in this groupto 166,180. We also expanded the nonneoplastic group to include the SAGElibraries of normal colon epithelium (NC1 and NC2, 50,115 and 49,552 tags,respectively), normal ovarian surface epithelium (HOSE 4 and IOSE29-11,48,113 and 48,498 tags, respectively), human microvascular endothelial cells(Duke HMVEC and Duke HMVEC1 VEGF, 52,532 and 57,928 tags, re-spectively), normal luminal mammary epithelial cells purified with BER-EP4antibody conjugated to magnetic beads (mammary epithelium and Br N,49,137 and 37,558 tags, respectively), and normal prostate (Chen Normal Prand normal prostate, 66,193 and 13,148 tags, respectively) in addition to theabove-mentioned short-term cultures of normal pancreatic ductal epithelium(HX and H126). This raised the total number of tags in this group of 12nonneoplastic SAGE libraries to 537,681. We set each of the two analyses todisplay the 100 SAGE tags that were most likely expressed at levels of 10-folddifference between the two groups. The coefficient of variance cutoff settingswere kept at the default value of 0%.
The names of genes and ESTs were identified from the tag sequences usingan online resource from the National Center for Biotechnology Information.6
Virtual Northern. The online SAGE database also has a feature thatallows the user to create “virtual Northerns.” This tool allows one to view theexpression levels of selected SAGE tags in all of the SAGE libraries. Data arepresented as “virtual Northerns,” allowing the user to simultaneously visualizethe levels of gene expression across multiple samples.
Cell Lines. Human cell lines AsPC1, BxPc3, CAPAN1, CFPAC1,HS766T, MiaPaCa2, and Panc1 were obtained from the American TypeCulture Collection (Manassas, VA). The 12 PL cell lines (PL1–6, PL8–11,PL13, and PL14) were low-passage pancreatic carcinoma cell lines generouslyprovided by Dr. Elizabeth Jaffee (7). An immortal human pancreatic ductepithelial cell line (HPDE) obtained after transduction of the human papillo-mavirus 16 E6/E7 genes was kindly provided by Dr. Ming-Sound Taso(University of Toronto, Ontario, Canada). Cells were cultured in RPMI 1640(Life Technologies, Inc., Rockville, MD) supplemented with 100 units/mlpenicillin, 100mg/ml streptomycin, 4 mM L-glutamine, and 10% FCS. Cellswere incubated at 37°C in a humidified atmosphere of 5% CO2 in air.
RT-PCR. Total RNA was isolated from cultured cells by using Trizolreagent (Life Technologies, Inc.). An aliquot of 1mg of total RNA from eachsample was reverse transcribed to cDNA using the Superscript II kit (LifeTechnologies, Inc.) according to the manufacturer’s instructions, with oli-go(dT)12–18 primer. PCR primers were designed to amplify a 207-bp cDNATFF2 fragment (59-ATGGATGCTGTTTCGACTCC-39, sense; 59-CAGACT-TCGGGAAGAAGCAC-39, antisense) and a 202-bp cDNA PSCA fragment(59-CCACCCTTAACCCTGTGTTC-39, sense; 59-AAACTCCCAGGAACT-CACGTC-39, antisense). The PCR conditions were as follows: initial denatur-ation at 95°C for 3 min; 30 cycles of amplification (95°C for 15 s, 60°C for15 s, and 72°C for 20 s); and a final extension step of 4 min at 72°C. The PCRreaction products were resolved by electrophoresis in a 2% agarose gel andstained with ethidium bromide. Loading was controlled by the simultaneousPCR of glyceraldehyde-3-phosphate dehydrogenase cDNA.
Immunohistochemistry. A series of 60 well-characterized primary inva-sive pancreatic adenocarcinomas resected at The Johns Hopkins Hospital wereselected solely on the basis of tissue availability. For each case, a represent-ative formalin-fixed paraffin-embedded tissue block containing invasive pan-creatic ductal adenocarcinoma and normal tissue was chosen for labeling.Unstained 4-mm sections were then cut from the paraffin block selected anddeparaffinized by routine techniques. The slides were steamed for 20 min insodium citrate buffer (diluted to 13 from 103 heat-induced epitope retrievalbuffer; Ventana-Bio Tek Solutions, Tucson, AZ). After cooling for 5 min, oneslide was labeled with a 1:200 dilution of a mouse monoclonal antibody toPSCA (clone 1G8, obtained from R. E. R.), and deeper cuts of the same 60blocks were labeled with a 1:700 dilution of the same antibody using the BioTek 1000 automated stainer (Ventana-Bio Tek Solutions). Labeling was de-tected by adding biotinylated secondary antibodies, avidin-biotin complex, and3,39-diaminobenzidine. Sections were then counterstained with hematoxylin.
The extent and intensity of immunolabeling were evaluated jointly by threeauthors (P. A., R. E. W., and R. H. H.) using a multiobserver microscope. Theextent of immunolabeling was categorized into five groups : 0%, negative;1–25%, focal; and 26–50%, 51–75%, or 76–100%, diffuse. The intensity ofimmunolabeling was categorized as weak (1), moderate (11), strong(111), or intense (1111). For the final statistical analyses, all focallylabeled cases were categorized as “focal,” and all cases showing$26%labeling were categorized as “positive.” Control tissue (normal prostate) dem-onstrated the expected selective epithelial labeling pattern with no stromallabeling at both the 1:200 and 1:700 dilutions.
Statistical Analysis. The primary outcome for this study was overallsurvival from the date of surgery to the time of the last follow-up or deathwithin 5 years. Data on survival were censored if the patient was still alive atthe time of the last follow-up or had died within 1 week of surgery. Kaplan-Meier survival curves were constructed and compared on the basis of PSCAstatus by the log-rank test. A Cox proportional hazards logistic regressionmodel assessed estimates of the relative risk of mortality for single factors andthe simultaneous contribution of the following baseline covariates to therelative risk of mortality: (a) tumor size ($3.0 cm versus,3.0 cm); (b)resection margin status (positive marginsversusnegative margins); (c) re-sected lymph node status; (d) the degree of differentiation of the tumor (poorlydifferentiatedversuswell or moderately well differentiated); (e) the tumor-node-metastasis (TNM) stage; (f) the year of surgery; (g) patient age; (h) theamount of intraoperative blood loss (liters); and (i) PSCA status. Baselinedemographic and clinical factors were compared by PSCA status.Ps werecomputed by Wilcoxon’s rank-sum test for continuous values and by Fischer’sexact test for discrete values. All tests were two-sided. Statistical analyses werecarried out using STATA version 7 software (Statacorp, College Station, TX).
Results
SAGE Analysis. In the first query, in which the four pancreaticcancer cell lines were compared with two short-term cultures ofnormal pancreatic ductal cells, 67 SAGE tags were identified as morefrequently expressed in the cancer group than in the normal group, and33 were identified as more frequently expressed in the normal than inthe cancer group. In the second query, in which the 4 pancreaticcancer cell lines and 2 primary pancreatic cancers were comparedwith 2 short-term cultures of normal pancreatic ductal cells and 10other nonneoplastic tissues, 74 SAGE tags were identified as morefrequently expressed in the cancer group than the normal group, and26 SAGE tags were identified as more frequently expressed in thenormal group than in the cancer group.
Four criteria were then used to narrow the candidate tags. First,only tags expressed more frequently in the pancreatic cancer groupswere considered. Second, tags likely to correspond to normal en-trapped pancreatic parenchyma or stromal elements (such as insulin,pancreatic polypeptide, and collagen type 1 and 3a) were excluded.These tags were identified only with the second query, which includedthe libraries derived from primary pancreatic cancers that would bepredicted to contain such nonneoplastic elements (8). Third, only tagscorresponding to known genes were considered, so that tags corre-sponding to ESTs or rRNAs were excluded. Fourth, only tags appear-ing within the top 25 tags of both queries were considered.
When these strategies were applied, three tags emerged as the mostpromising markers for pancreatic cancer. Two of these correspondedto genes that have been previously shown to be overexpressed inpancreatic carcinomas; these were lipocalin 2 (the human homologueof mouse oncogene 24p3) and TFF2 (9–11). The third tag wasHs.20166 (GCCCAGCATT), corresponding to the recently discov-ered PSCA gene (12). This tag was identified 38 times in the 166,180tags derived from the pancreatic cancers, but was never identified inthe 64,577 tags derived from normal pancreatic ductal epithelium.This gene was selected for further analysis.
Using the online SAGE Tag to Gene mapping and Virtual Northernfunctions, we found that 13 of the 88 SAGE libraries in the database6 http:/www.ncbi.nlm.nih.gov/SAGE/SAGEtag.cgi.
4321
PSCA OVEREXPRESSION IN PANCREATIC CARCINOMA
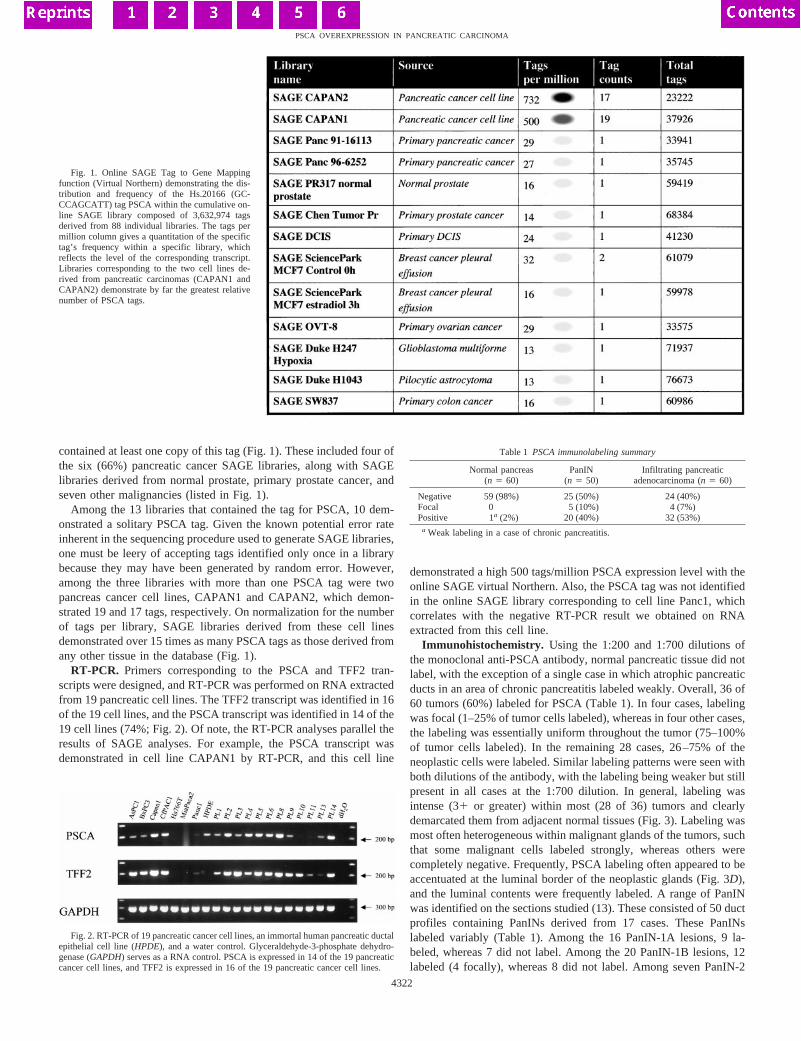
contained at least one copy of this tag (Fig. 1). These included four ofthe six (66%) pancreatic cancer SAGE libraries, along with SAGElibraries derived from normal prostate, primary prostate cancer, andseven other malignancies (listed in Fig. 1).
Among the 13 libraries that contained the tag for PSCA, 10 dem-onstrated a solitary PSCA tag. Given the known potential error rateinherent in the sequencing procedure used to generate SAGE libraries,one must be leery of accepting tags identified only once in a librarybecause they may have been generated by random error. However,among the three libraries with more than one PSCA tag were twopancreas cancer cell lines, CAPAN1 and CAPAN2, which demon-strated 19 and 17 tags, respectively. On normalization for the numberof tags per library, SAGE libraries derived from these cell linesdemonstrated over 15 times as many PSCA tags as those derived fromany other tissue in the database (Fig. 1).
RT-PCR. Primers corresponding to the PSCA and TFF2 tran-scripts were designed, and RT-PCR was performed on RNA extractedfrom 19 pancreatic cell lines. The TFF2 transcript was identified in 16of the 19 cell lines, and the PSCA transcript was identified in 14 of the19 cell lines (74%; Fig. 2). Of note, the RT-PCR analyses parallel theresults of SAGE analyses. For example, the PSCA transcript wasdemonstrated in cell line CAPAN1 by RT-PCR, and this cell line
demonstrated a high 500 tags/million PSCA expression level with theonline SAGE virtual Northern. Also, the PSCA tag was not identifiedin the online SAGE library corresponding to cell line Panc1, whichcorrelates with the negative RT-PCR result we obtained on RNAextracted from this cell line.
Immunohistochemistry. Using the 1:200 and 1:700 dilutions ofthe monoclonal anti-PSCA antibody, normal pancreatic tissue did notlabel, with the exception of a single case in which atrophic pancreaticducts in an area of chronic pancreatitis labeled weakly. Overall, 36 of60 tumors (60%) labeled for PSCA (Table 1). In four cases, labelingwas focal (1–25% of tumor cells labeled), whereas in four other cases,the labeling was essentially uniform throughout the tumor (75–100%of tumor cells labeled). In the remaining 28 cases, 26–75% of theneoplastic cells were labeled. Similar labeling patterns were seen withboth dilutions of the antibody, with the labeling being weaker but stillpresent in all cases at the 1:700 dilution. In general, labeling wasintense (31 or greater) within most (28 of 36) tumors and clearlydemarcated them from adjacent normal tissues (Fig. 3). Labeling wasmost often heterogeneous within malignant glands of the tumors, suchthat some malignant cells labeled strongly, whereas others werecompletely negative. Frequently, PSCA labeling often appeared to beaccentuated at the luminal border of the neoplastic glands (Fig. 3D),and the luminal contents were frequently labeled. A range of PanINwas identified on the sections studied (13). These consisted of 50 ductprofiles containing PanINs derived from 17 cases. These PanINslabeled variably (Table 1). Among the 16 PanIN-1A lesions, 9 la-beled, whereas 7 did not label. Among the 20 PanIN-1B lesions, 12labeled (4 focally), whereas 8 did not label. Among seven PanIN-2
Table 1 PSCA immunolabeling summary
Normal pancreas(n 5 60)
PanIN(n 5 50)
Infiltrating pancreaticadenocarcinoma (n 5 60)
Negative 59 (98%) 25 (50%) 24 (40%)Focal 0 5 (10%) 4 (7%)Positive 1a (2%) 20 (40%) 32 (53%)
a Weak labeling in a case of chronic pancreatitis.
Fig. 1. Online SAGE Tag to Gene Mappingfunction (Virtual Northern) demonstrating the dis-tribution and frequency of the Hs.20166 (GC-CCAGCATT) tag PSCA within the cumulative on-line SAGE library composed of 3,632,974 tagsderived from 88 individual libraries. The tags permillion column gives a quantitation of the specifictag’s frequency within a specific library, whichreflects the level of the corresponding transcript.Libraries corresponding to the two cell lines de-rived from pancreatic carcinomas (CAPAN1 andCAPAN2) demonstrate by far the greatest relativenumber of PSCA tags.
Fig. 2. RT-PCR of 19 pancreatic cancer cell lines, an immortal human pancreatic ductalepithelial cell line (HPDE), and a water control. Glyceraldehyde-3-phosphate dehydro-genase (GAPDH) serves as a RNA control. PSCA is expressed in 14 of the 19 pancreaticcancer cell lines, and TFF2 is expressed in 16 of the 19 pancreatic cancer cell lines.
4322
PSCA OVEREXPRESSION IN PANCREATIC CARCINOMA
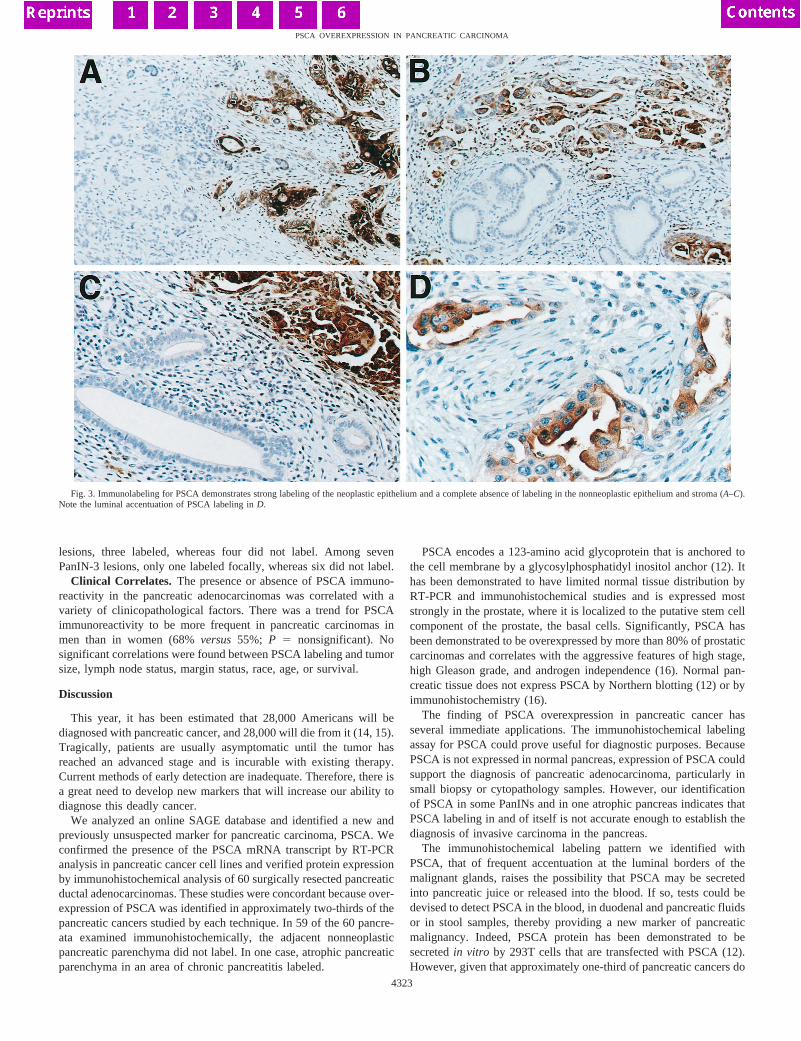
lesions, three labeled, whereas four did not label. Among sevenPanIN-3 lesions, only one labeled focally, whereas six did not label.
Clinical Correlates. The presence or absence of PSCA immuno-reactivity in the pancreatic adenocarcinomas was correlated with avariety of clinicopathological factors. There was a trend for PSCAimmunoreactivity to be more frequent in pancreatic carcinomas inmen than in women (68%versus55%; P 5 nonsignificant). Nosignificant correlations were found between PSCA labeling and tumorsize, lymph node status, margin status, race, age, or survival.
Discussion
This year, it has been estimated that 28,000 Americans will bediagnosed with pancreatic cancer, and 28,000 will die from it (14, 15).Tragically, patients are usually asymptomatic until the tumor hasreached an advanced stage and is incurable with existing therapy.Current methods of early detection are inadequate. Therefore, there isa great need to develop new markers that will increase our ability todiagnose this deadly cancer.
We analyzed an online SAGE database and identified a new andpreviously unsuspected marker for pancreatic carcinoma, PSCA. Weconfirmed the presence of the PSCA mRNA transcript by RT-PCRanalysis in pancreatic cancer cell lines and verified protein expressionby immunohistochemical analysis of 60 surgically resected pancreaticductal adenocarcinomas. These studies were concordant because over-expression of PSCA was identified in approximately two-thirds of thepancreatic cancers studied by each technique. In 59 of the 60 pancre-ata examined immunohistochemically, the adjacent nonneoplasticpancreatic parenchyma did not label. In one case, atrophic pancreaticparenchyma in an area of chronic pancreatitis labeled.
PSCA encodes a 123-amino acid glycoprotein that is anchored tothe cell membrane by a glycosylphosphatidyl inositol anchor (12). Ithas been demonstrated to have limited normal tissue distribution byRT-PCR and immunohistochemical studies and is expressed moststrongly in the prostate, where it is localized to the putative stem cellcomponent of the prostate, the basal cells. Significantly, PSCA hasbeen demonstrated to be overexpressed by more than 80% of prostaticcarcinomas and correlates with the aggressive features of high stage,high Gleason grade, and androgen independence (16). Normal pan-creatic tissue does not express PSCA by Northern blotting (12) or byimmunohistochemistry (16).
The finding of PSCA overexpression in pancreatic cancer hasseveral immediate applications. The immunohistochemical labelingassay for PSCA could prove useful for diagnostic purposes. BecausePSCA is not expressed in normal pancreas, expression of PSCA couldsupport the diagnosis of pancreatic adenocarcinoma, particularly insmall biopsy or cytopathology samples. However, our identificationof PSCA in some PanINs and in one atrophic pancreas indicates thatPSCA labeling in and of itself is not accurate enough to establish thediagnosis of invasive carcinoma in the pancreas.
The immunohistochemical labeling pattern we identified withPSCA, that of frequent accentuation at the luminal borders of themalignant glands, raises the possibility that PSCA may be secretedinto pancreatic juice or released into the blood. If so, tests could bedevised to detect PSCA in the blood, in duodenal and pancreatic fluidsor in stool samples, thereby providing a new marker of pancreaticmalignancy. Indeed, PSCA protein has been demonstrated to besecretedin vitro by 293T cells that are transfected with PSCA (12).However, given that approximately one-third of pancreatic cancers do
Fig. 3. Immunolabeling for PSCA demonstrates strong labeling of the neoplastic epithelium and a complete absence of labeling in the nonneoplastic epithelium and stroma (A–C).Note the luminal accentuation of PSCA labeling inD.
4323
PSCA OVEREXPRESSION IN PANCREATIC CARCINOMA
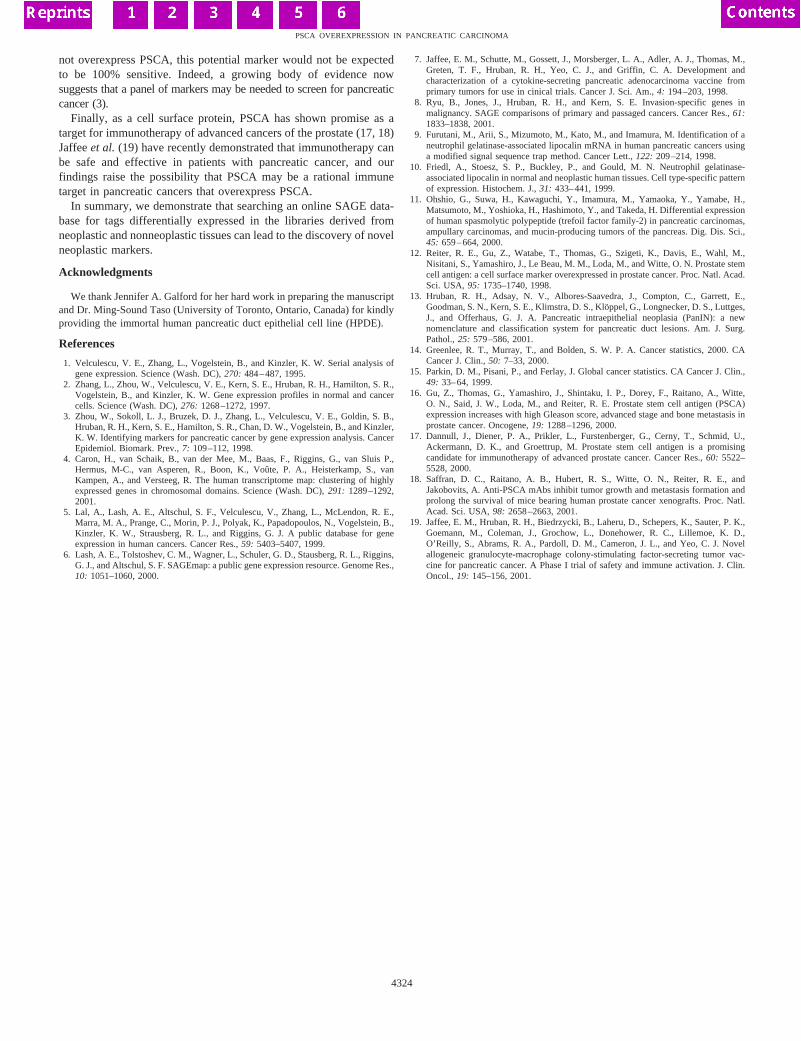
not overexpress PSCA, this potential marker would not be expectedto be 100% sensitive. Indeed, a growing body of evidence nowsuggests that a panel of markers may be needed to screen for pancreaticcancer (3).
Finally, as a cell surface protein, PSCA has shown promise as atarget for immunotherapy of advanced cancers of the prostate (17, 18)Jaffeeet al. (19) have recently demonstrated that immunotherapy canbe safe and effective in patients with pancreatic cancer, and ourfindings raise the possibility that PSCA may be a rational immunetarget in pancreatic cancers that overexpress PSCA.
In summary, we demonstrate that searching an online SAGE data-base for tags differentially expressed in the libraries derived fromneoplastic and nonneoplastic tissues can lead to the discovery of novelneoplastic markers.
Acknowledgments
We thank Jennifer A. Galford for her hard work in preparing the manuscriptand Dr. Ming-Sound Taso (University of Toronto, Ontario, Canada) for kindlyproviding the immortal human pancreatic duct epithelial cell line (HPDE).
References
1. Velculescu, V. E., Zhang, L., Vogelstein, B., and Kinzler, K. W. Serial analysis ofgene expression. Science (Wash. DC),270: 484–487, 1995.
2. Zhang, L., Zhou, W., Velculescu, V. E., Kern, S. E., Hruban, R. H., Hamilton, S. R.,Vogelstein, B., and Kinzler, K. W. Gene expression profiles in normal and cancercells. Science (Wash. DC),276: 1268–1272, 1997.
3. Zhou, W., Sokoll, L. J., Bruzek, D. J., Zhang, L., Velculescu, V. E., Goldin, S. B.,Hruban, R. H., Kern, S. E., Hamilton, S. R., Chan, D. W., Vogelstein, B., and Kinzler,K. W. Identifying markers for pancreatic cancer by gene expression analysis. CancerEpidemiol. Biomark. Prev.,7: 109–112, 1998.
4. Caron, H., van Schaik, B., van der Mee, M., Baas, F., Riggins, G., van Sluis P.,Hermus, M-C., van Asperen, R., Boon, K., Vouˆte, P. A., Heisterkamp, S., vanKampen, A., and Versteeg, R. The human transcriptome map: clustering of highlyexpressed genes in chromosomal domains. Science (Wash. DC),291: 1289–1292,2001.
5. Lal, A., Lash, A. E., Altschul, S. F., Velculescu, V., Zhang, L., McLendon, R. E.,Marra, M. A., Prange, C., Morin, P. J., Polyak, K., Papadopoulos, N., Vogelstein, B.,Kinzler, K. W., Strausberg, R. L., and Riggins, G. J. A public database for geneexpression in human cancers. Cancer Res.,59: 5403–5407, 1999.
6. Lash, A. E., Tolstoshev, C. M., Wagner, L., Schuler, G. D., Stausberg, R. L., Riggins,G. J., and Altschul, S. F. SAGEmap: a public gene expression resource. Genome Res.,10: 1051–1060, 2000.
7. Jaffee, E. M., Schutte, M., Gossett, J., Morsberger, L. A., Adler, A. J., Thomas, M.,Greten, T. F., Hruban, R. H., Yeo, C. J., and Griffin, C. A. Development andcharacterization of a cytokine-secreting pancreatic adenocarcinoma vaccine fromprimary tumors for use in cinical trials. Cancer J. Sci. Am.,4: 194–203, 1998.
8. Ryu, B., Jones, J., Hruban, R. H., and Kern, S. E. Invasion-specific genes inmalignancy. SAGE comparisons of primary and passaged cancers. Cancer Res.,61:1833–1838, 2001.
9. Furutani, M., Arii, S., Mizumoto, M., Kato, M., and Imamura, M. Identification of aneutrophil gelatinase-associated lipocalin mRNA in human pancreatic cancers usinga modified signal sequence trap method. Cancer Lett.,122: 209–214, 1998.
10. Friedl, A., Stoesz, S. P., Buckley, P., and Gould, M. N. Neutrophil gelatinase-associated lipocalin in normal and neoplastic human tissues. Cell type-specific patternof expression. Histochem. J.,31: 433–441, 1999.
11. Ohshio, G., Suwa, H., Kawaguchi, Y., Imamura, M., Yamaoka, Y., Yamabe, H.,Matsumoto, M., Yoshioka, H., Hashimoto, Y., and Takeda, H. Differential expressionof human spasmolytic polypeptide (trefoil factor family-2) in pancreatic carcinomas,ampullary carcinomas, and mucin-producing tumors of the pancreas. Dig. Dis. Sci.,45: 659–664, 2000.
12. Reiter, R. E., Gu, Z., Watabe, T., Thomas, G., Szigeti, K., Davis, E., Wahl, M.,Nisitani, S., Yamashiro, J., Le Beau, M. M., Loda, M., and Witte, O. N. Prostate stemcell antigen: a cell surface marker overexpressed in prostate cancer. Proc. Natl. Acad.Sci. USA,95: 1735–1740, 1998.
13. Hruban, R. H., Adsay, N. V., Albores-Saavedra, J., Compton, C., Garrett, E.,Goodman, S. N., Kern, S. E., Klimstra, D. S., Klo¨ppel, G., Longnecker, D. S., Luttges,J., and Offerhaus, G. J. A. Pancreatic intraepithelial neoplasia (PanIN): a newnomenclature and classification system for pancreatic duct lesions. Am. J. Surg.Pathol.,25: 579–586, 2001.
14. Greenlee, R. T., Murray, T., and Bolden, S. W. P. A. Cancer statistics, 2000. CACancer J. Clin.,50: 7–33, 2000.
15. Parkin, D. M., Pisani, P., and Ferlay, J. Global cancer statistics. CA Cancer J. Clin.,49: 33–64, 1999.
16. Gu, Z., Thomas, G., Yamashiro, J., Shintaku, I. P., Dorey, F., Raitano, A., Witte,O. N., Said, J. W., Loda, M., and Reiter, R. E. Prostate stem cell antigen (PSCA)expression increases with high Gleason score, advanced stage and bone metastasis inprostate cancer. Oncogene,19: 1288–1296, 2000.
17. Dannull, J., Diener, P. A., Prikler, L., Furstenberger, G., Cerny, T., Schmid, U.,Ackermann, D. K., and Groettrup, M. Prostate stem cell antigen is a promisingcandidate for immunotherapy of advanced prostate cancer. Cancer Res.,60: 5522–5528, 2000.
18. Saffran, D. C., Raitano, A. B., Hubert, R. S., Witte, O. N., Reiter, R. E., andJakobovits, A. Anti-PSCA mAbs inhibit tumor growth and metastasis formation andprolong the survival of mice bearing human prostate cancer xenografts. Proc. Natl.Acad. Sci. USA,98: 2658–2663, 2001.
19. Jaffee, E. M., Hruban, R. H., Biedrzycki, B., Laheru, D., Schepers, K., Sauter, P. K.,Goemann, M., Coleman, J., Grochow, L., Donehower, R. C., Lillemoe, K. D.,O’Reilly, S., Abrams, R. A., Pardoll, D. M., Cameron, J. L., and Yeo, C. J. Novelallogeneic granulocyte-macrophage colony-stimulating factor-secreting tumor vac-cine for pancreatic cancer. A Phase I trial of safety and immune activation. J. Clin.Oncol.,19: 145–156, 2001.
4324
PSCA OVEREXPRESSION IN PANCREATIC CARCINOMA
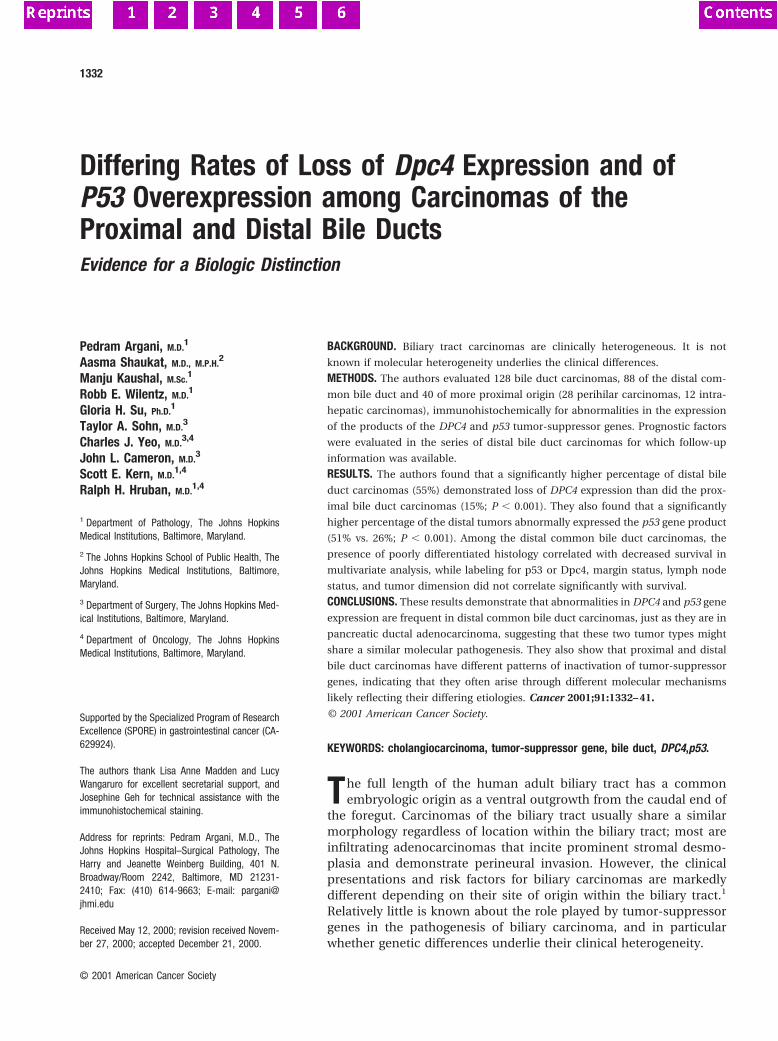
Differing Rates of Loss of Dpc4 Expression and ofP53 Overexpression among Carcinomas of theProximal and Distal Bile DuctsEvidence for a Biologic Distinction
Pedram Argani, M.D.1
Aasma Shaukat, M.D., M.P.H.2
Manju Kaushal, M.Sc.1
Robb E. Wilentz, M.D.1
Gloria H. Su, Ph.D.1
Taylor A. Sohn, M.D.3
Charles J. Yeo, M.D.3,4
John L. Cameron, M.D.3
Scott E. Kern, M.D.1,4
Ralph H. Hruban, M.D.1,4
1 Department of Pathology, The Johns HopkinsMedical Institutions, Baltimore, Maryland.
2 The Johns Hopkins School of Public Health, TheJohns Hopkins Medical Institutions, Baltimore,Maryland.
3 Department of Surgery, The Johns Hopkins Med-ical Institutions, Baltimore, Maryland.
4 Department of Oncology, The Johns HopkinsMedical Institutions, Baltimore, Maryland.
Supported by the Specialized Program of ResearchExcellence (SPORE) in gastrointestinal cancer (CA-629924).
The authors thank Lisa Anne Madden and LucyWangaruro for excellent secretarial support, andJosephine Geh for technical assistance with theimmunohistochemical staining.
Address for reprints: Pedram Argani, M.D., TheJohns Hopkins Hospital–Surgical Pathology, TheHarry and Jeanette Weinberg Building, 401 N.Broadway/Room 2242, Baltimore, MD 21231-2410; Fax: (410) 614-9663; E-mail: [email protected]
Received May 12, 2000; revision received Novem-ber 27, 2000; accepted December 21, 2000.
BACKGROUND. Biliary tract carcinomas are clinically heterogeneous. It is not
known if molecular heterogeneity underlies the clinical differences.
METHODS. The authors evaluated 128 bile duct carcinomas, 88 of the distal com-
mon bile duct and 40 of more proximal origin (28 perihilar carcinomas, 12 intra-
hepatic carcinomas), immunohistochemically for abnormalities in the expression
of the products of the DPC4 and p53 tumor-suppressor genes. Prognostic factors
were evaluated in the series of distal bile duct carcinomas for which follow-up
information was available.
RESULTS. The authors found that a significantly higher percentage of distal bile
duct carcinomas (55%) demonstrated loss of DPC4 expression than did the prox-
imal bile duct carcinomas (15%; P , 0.001). They also found that a significantly
higher percentage of the distal tumors abnormally expressed the p53 gene product
(51% vs. 26%; P , 0.001). Among the distal common bile duct carcinomas, the
presence of poorly differentiated histology correlated with decreased survival in
multivariate analysis, while labeling for p53 or Dpc4, margin status, lymph node
status, and tumor dimension did not correlate significantly with survival.
CONCLUSIONS. These results demonstrate that abnormalities in DPC4 and p53 gene
expression are frequent in distal common bile duct carcinomas, just as they are in
pancreatic ductal adenocarcinoma, suggesting that these two tumor types might
share a similar molecular pathogenesis. They also show that proximal and distal
bile duct carcinomas have different patterns of inactivation of tumor-suppressor
genes, indicating that they often arise through different molecular mechanisms
likely reflecting their differing etiologies. Cancer 2001;91:1332– 41.
© 2001 American Cancer Society.
KEYWORDS: cholangiocarcinoma, tumor-suppressor gene, bile duct, DPC4,p53.
The full length of the human adult biliary tract has a commonembryologic origin as a ventral outgrowth from the caudal end of
the foregut. Carcinomas of the biliary tract usually share a similarmorphology regardless of location within the biliary tract; most areinfiltrating adenocarcinomas that incite prominent stromal desmo-plasia and demonstrate perineural invasion. However, the clinicalpresentations and risk factors for biliary carcinomas are markedlydifferent depending on their site of origin within the biliary tract.1
Relatively little is known about the role played by tumor-suppressorgenes in the pathogenesis of biliary carcinoma, and in particularwhether genetic differences underlie their clinical heterogeneity.
1332
© 2001 American Cancer Society
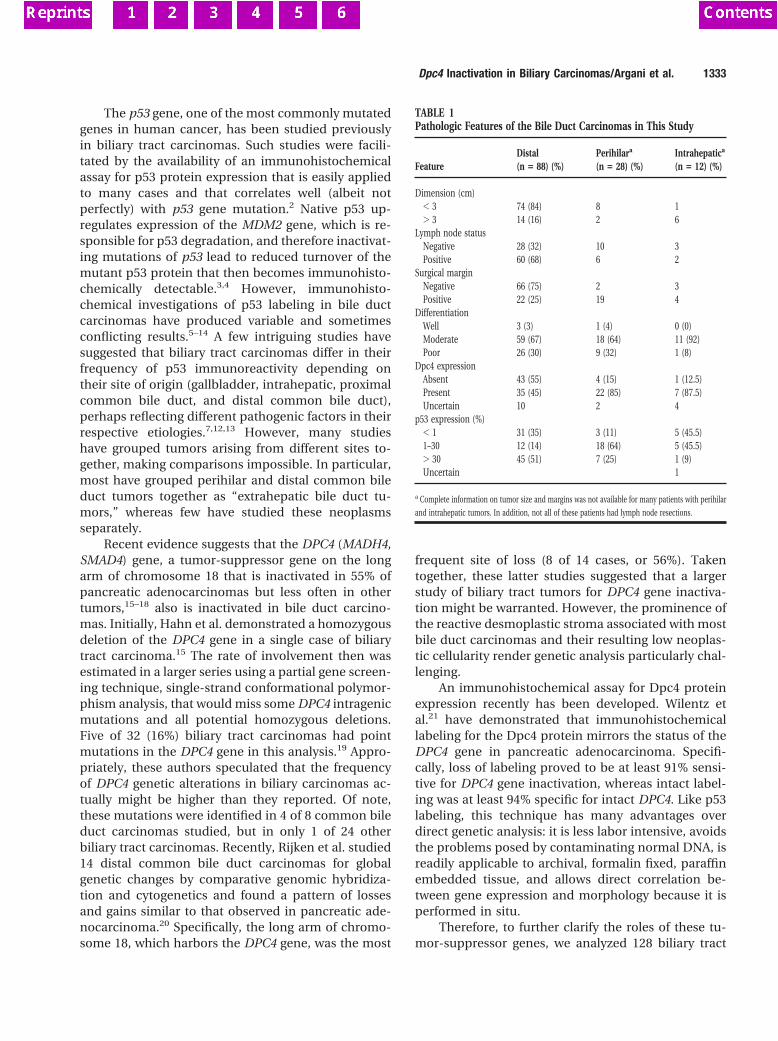
The p53 gene, one of the most commonly mutatedgenes in human cancer, has been studied previouslyin biliary tract carcinomas. Such studies were facili-tated by the availability of an immunohistochemicalassay for p53 protein expression that is easily appliedto many cases and that correlates well (albeit notperfectly) with p53 gene mutation.2 Native p53 up-regulates expression of the MDM2 gene, which is re-sponsible for p53 degradation, and therefore inactivat-ing mutations of p53 lead to reduced turnover of themutant p53 protein that then becomes immunohisto-chemically detectable.3,4 However, immunohisto-chemical investigations of p53 labeling in bile ductcarcinomas have produced variable and sometimesconflicting results.5–14 A few intriguing studies havesuggested that biliary tract carcinomas differ in theirfrequency of p53 immunoreactivity depending ontheir site of origin (gallbladder, intrahepatic, proximalcommon bile duct, and distal common bile duct),perhaps reflecting different pathogenic factors in theirrespective etiologies.7,12,13 However, many studieshave grouped tumors arising from different sites to-gether, making comparisons impossible. In particular,most have grouped perihilar and distal common bileduct tumors together as “extrahepatic bile duct tu-mors,” whereas few have studied these neoplasmsseparately.
Recent evidence suggests that the DPC4 (MADH4,SMAD4) gene, a tumor-suppressor gene on the longarm of chromosome 18 that is inactivated in 55% ofpancreatic adenocarcinomas but less often in othertumors,15–18 also is inactivated in bile duct carcino-mas. Initially, Hahn et al. demonstrated a homozygousdeletion of the DPC4 gene in a single case of biliarytract carcinoma.15 The rate of involvement then wasestimated in a larger series using a partial gene screen-ing technique, single-strand conformational polymor-phism analysis, that would miss some DPC4 intragenicmutations and all potential homozygous deletions.Five of 32 (16%) biliary tract carcinomas had pointmutations in the DPC4 gene in this analysis.19 Appro-priately, these authors speculated that the frequencyof DPC4 genetic alterations in biliary carcinomas ac-tually might be higher than they reported. Of note,these mutations were identified in 4 of 8 common bileduct carcinomas studied, but in only 1 of 24 otherbiliary tract carcinomas. Recently, Rijken et al. studied14 distal common bile duct carcinomas for globalgenetic changes by comparative genomic hybridiza-tion and cytogenetics and found a pattern of lossesand gains similar to that observed in pancreatic ade-nocarcinoma.20 Specifically, the long arm of chromo-some 18, which harbors the DPC4 gene, was the most
frequent site of loss (8 of 14 cases, or 56%). Takentogether, these latter studies suggested that a largerstudy of biliary tract tumors for DPC4 gene inactiva-tion might be warranted. However, the prominence ofthe reactive desmoplastic stroma associated with mostbile duct carcinomas and their resulting low neoplas-tic cellularity render genetic analysis particularly chal-lenging.
An immunohistochemical assay for Dpc4 proteinexpression recently has been developed. Wilentz etal.21 have demonstrated that immunohistochemicallabeling for the Dpc4 protein mirrors the status of theDPC4 gene in pancreatic adenocarcinoma. Specifi-cally, loss of labeling proved to be at least 91% sensi-tive for DPC4 gene inactivation, whereas intact label-ing was at least 94% specific for intact DPC4. Like p53labeling, this technique has many advantages overdirect genetic analysis: it is less labor intensive, avoidsthe problems posed by contaminating normal DNA, isreadily applicable to archival, formalin fixed, paraffinembedded tissue, and allows direct correlation be-tween gene expression and morphology because it isperformed in situ.
Therefore, to further clarify the roles of these tu-mor-suppressor genes, we analyzed 128 biliary tract
TABLE 1Pathologic Features of the Bile Duct Carcinomas in This Study
FeatureDistal(n 5 88) (%)
Perihilara
(n 5 28) (%)Intrahepatica
(n 5 12) (%)
Dimension (cm), 3 74 (84) 8 1. 3 14 (16) 2 6
Lymph node statusNegative 28 (32) 10 3Positive 60 (68) 6 2
Surgical marginNegative 66 (75) 2 3Positive 22 (25) 19 4
DifferentiationWell 3 (3) 1 (4) 0 (0)Moderate 59 (67) 18 (64) 11 (92)Poor 26 (30) 9 (32) 1 (8)
Dpc4 expressionAbsent 43 (55) 4 (15) 1 (12.5)Present 35 (45) 22 (85) 7 (87.5)Uncertain 10 2 4
p53 expression (%), 1 31 (35) 3 (11) 5 (45.5)1–30 12 (14) 18 (64) 5 (45.5). 30 45 (51) 7 (25) 1 (9)Uncertain 1
a Complete information on tumor size and margins was not available for many patients with perihilar
and intrahepatic tumors. In addition, not all of these patients had lymph node resections.
Dpc4 Inactivation in Biliary Carcinomas/Argani et al. 1333
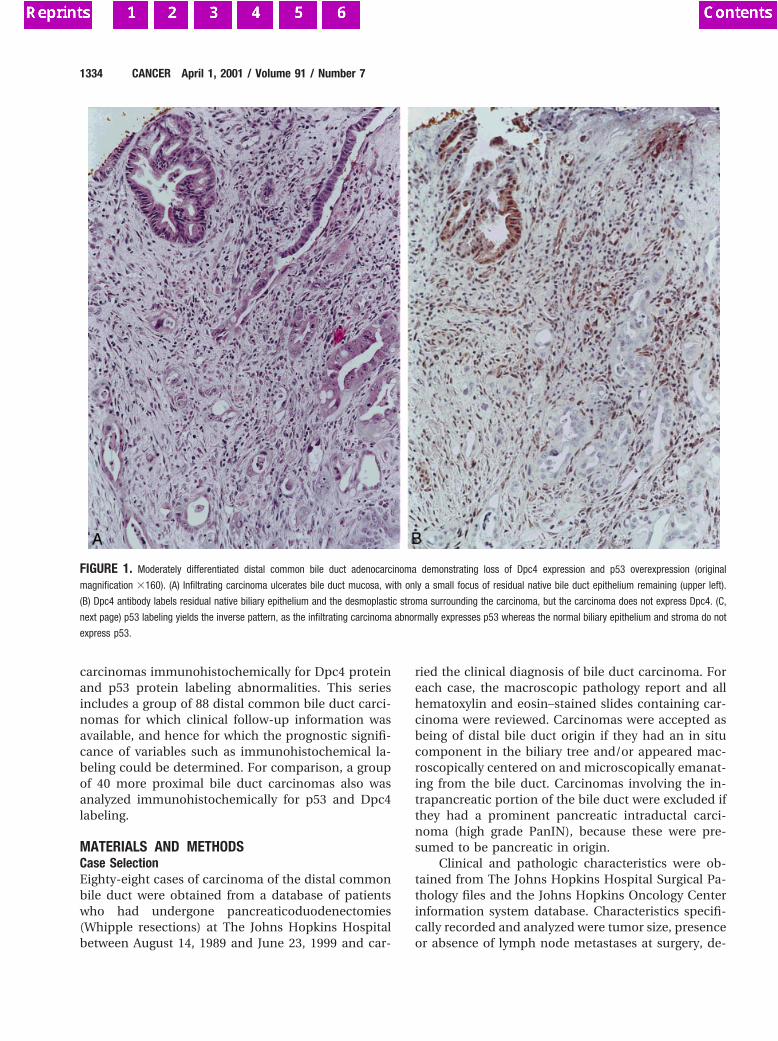
carcinomas immunohistochemically for Dpc4 proteinand p53 protein labeling abnormalities. This seriesincludes a group of 88 distal common bile duct carci-nomas for which clinical follow-up information wasavailable, and hence for which the prognostic signifi-cance of variables such as immunohistochemical la-beling could be determined. For comparison, a groupof 40 more proximal bile duct carcinomas also wasanalyzed immunohistochemically for p53 and Dpc4labeling.
MATERIALS AND METHODSCase SelectionEighty-eight cases of carcinoma of the distal commonbile duct were obtained from a database of patientswho had undergone pancreaticoduodenectomies(Whipple resections) at The Johns Hopkins Hospitalbetween August 14, 1989 and June 23, 1999 and car-
ried the clinical diagnosis of bile duct carcinoma. Foreach case, the macroscopic pathology report and allhematoxylin and eosin–stained slides containing car-cinoma were reviewed. Carcinomas were accepted asbeing of distal bile duct origin if they had an in situcomponent in the biliary tree and/or appeared mac-roscopically centered on and microscopically emanat-ing from the bile duct. Carcinomas involving the in-trapancreatic portion of the bile duct were excluded ifthey had a prominent pancreatic intraductal carci-noma (high grade PanIN), because these were pre-sumed to be pancreatic in origin.
Clinical and pathologic characteristics were ob-tained from The Johns Hopkins Hospital Surgical Pa-thology files and the Johns Hopkins Oncology Centerinformation system database. Characteristics specifi-cally recorded and analyzed were tumor size, presenceor absence of lymph node metastases at surgery, de-
FIGURE 1. Moderately differentiated distal common bile duct adenocarcinoma demonstrating loss of Dpc4 expression and p53 overexpression (original
magnification 3160). (A) Infiltrating carcinoma ulcerates bile duct mucosa, with only a small focus of residual native bile duct epithelium remaining (upper left).
(B) Dpc4 antibody labels residual native biliary epithelium and the desmoplastic stroma surrounding the carcinoma, but the carcinoma does not express Dpc4. (C,
next page) p53 labeling yields the inverse pattern, as the infiltrating carcinoma abnormally expresses p53 whereas the normal biliary epithelium and stroma do not
express p53.
1334 CANCER April 1, 2001 / Volume 91 / Number 7
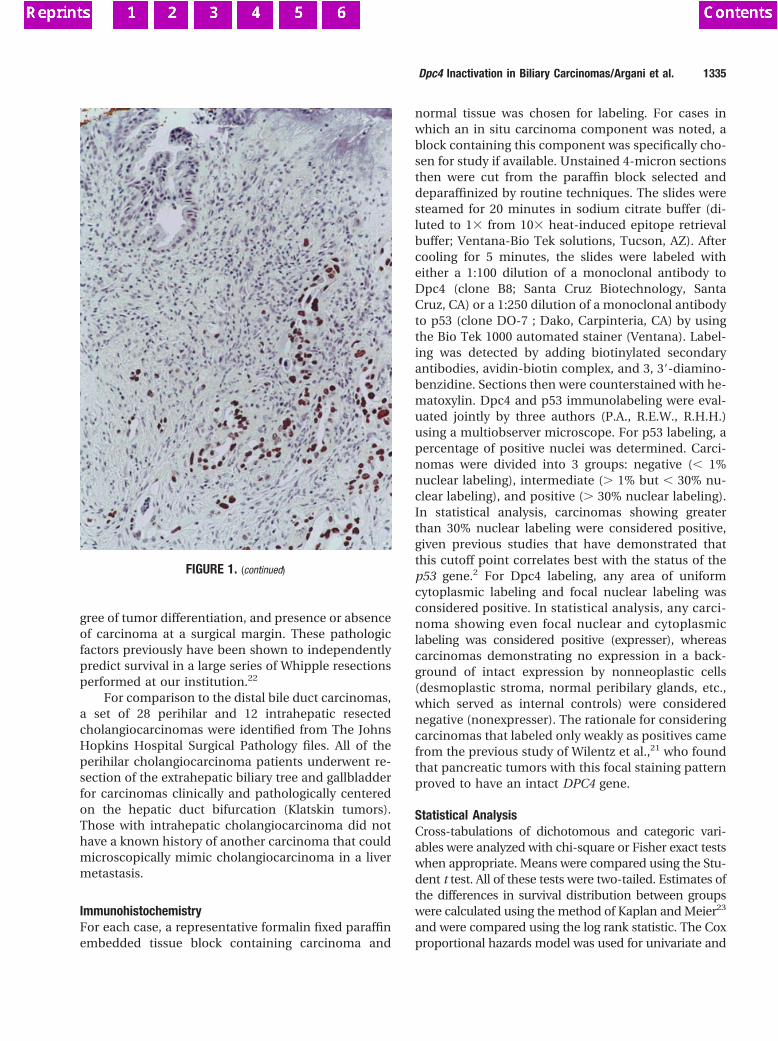
gree of tumor differentiation, and presence or absenceof carcinoma at a surgical margin. These pathologicfactors previously have been shown to independentlypredict survival in a large series of Whipple resectionsperformed at our institution.22
For comparison to the distal bile duct carcinomas,a set of 28 perihilar and 12 intrahepatic resectedcholangiocarcinomas were identified from The JohnsHopkins Hospital Surgical Pathology files. All of theperihilar cholangiocarcinoma patients underwent re-section of the extrahepatic biliary tree and gallbladderfor carcinomas clinically and pathologically centeredon the hepatic duct bifurcation (Klatskin tumors).Those with intrahepatic cholangiocarcinoma did nothave a known history of another carcinoma that couldmicroscopically mimic cholangiocarcinoma in a livermetastasis.
ImmunohistochemistryFor each case, a representative formalin fixed paraffinembedded tissue block containing carcinoma and
normal tissue was chosen for labeling. For cases inwhich an in situ carcinoma component was noted, ablock containing this component was specifically cho-sen for study if available. Unstained 4-micron sectionsthen were cut from the paraffin block selected anddeparaffinized by routine techniques. The slides weresteamed for 20 minutes in sodium citrate buffer (di-luted to 13 from 103 heat-induced epitope retrievalbuffer; Ventana-Bio Tek solutions, Tucson, AZ). Aftercooling for 5 minutes, the slides were labeled witheither a 1:100 dilution of a monoclonal antibody toDpc4 (clone B8; Santa Cruz Biotechnology, SantaCruz, CA) or a 1:250 dilution of a monoclonal antibodyto p53 (clone DO-7 ; Dako, Carpinteria, CA) by usingthe Bio Tek 1000 automated stainer (Ventana). Label-ing was detected by adding biotinylated secondaryantibodies, avidin-biotin complex, and 3, 39-diamino-benzidine. Sections then were counterstained with he-matoxylin. Dpc4 and p53 immunolabeling were eval-uated jointly by three authors (P.A., R.E.W., R.H.H.)using a multiobserver microscope. For p53 labeling, apercentage of positive nuclei was determined. Carci-nomas were divided into 3 groups: negative (, 1%nuclear labeling), intermediate (. 1% but , 30% nu-clear labeling), and positive (. 30% nuclear labeling).In statistical analysis, carcinomas showing greaterthan 30% nuclear labeling were considered positive,given previous studies that have demonstrated thatthis cutoff point correlates best with the status of thep53 gene.2 For Dpc4 labeling, any area of uniformcytoplasmic labeling and focal nuclear labeling wasconsidered positive. In statistical analysis, any carci-noma showing even focal nuclear and cytoplasmiclabeling was considered positive (expresser), whereascarcinomas demonstrating no expression in a back-ground of intact expression by nonneoplastic cells(desmoplastic stroma, normal peribilary glands, etc.,which served as internal controls) were considerednegative (nonexpresser). The rationale for consideringcarcinomas that labeled only weakly as positives camefrom the previous study of Wilentz et al.,21 who foundthat pancreatic tumors with this focal staining patternproved to have an intact DPC4 gene.
Statistical AnalysisCross-tabulations of dichotomous and categoric vari-ables were analyzed with chi-square or Fisher exact testswhen appropriate. Means were compared using the Stu-dent t test. All of these tests were two-tailed. Estimates ofthe differences in survival distribution between groupswere calculated using the method of Kaplan and Meier23
and were compared using the log rank statistic. The Coxproportional hazards model was used for univariate and
FIGURE 1. (continued)
Dpc4 Inactivation in Biliary Carcinomas/Argani et al. 1335
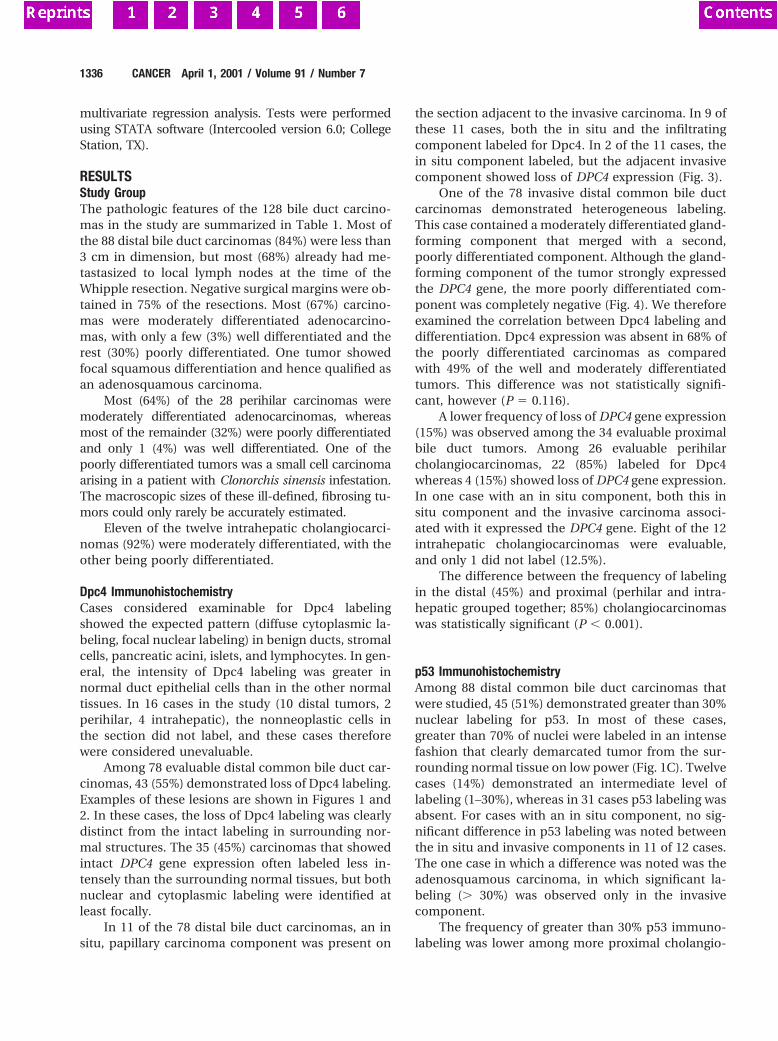
multivariate regression analysis. Tests were performedusing STATA software (Intercooled version 6.0; CollegeStation, TX).
RESULTSStudy GroupThe pathologic features of the 128 bile duct carcino-mas in the study are summarized in Table 1. Most ofthe 88 distal bile duct carcinomas (84%) were less than3 cm in dimension, but most (68%) already had me-tastasized to local lymph nodes at the time of theWhipple resection. Negative surgical margins were ob-tained in 75% of the resections. Most (67%) carcino-mas were moderately differentiated adenocarcino-mas, with only a few (3%) well differentiated and therest (30%) poorly differentiated. One tumor showedfocal squamous differentiation and hence qualified asan adenosquamous carcinoma.
Most (64%) of the 28 perihilar carcinomas weremoderately differentiated adenocarcinomas, whereasmost of the remainder (32%) were poorly differentiatedand only 1 (4%) was well differentiated. One of thepoorly differentiated tumors was a small cell carcinomaarising in a patient with Clonorchis sinensis infestation.The macroscopic sizes of these ill-defined, fibrosing tu-mors could only rarely be accurately estimated.
Eleven of the twelve intrahepatic cholangiocarci-nomas (92%) were moderately differentiated, with theother being poorly differentiated.
Dpc4 ImmunohistochemistryCases considered examinable for Dpc4 labelingshowed the expected pattern (diffuse cytoplasmic la-beling, focal nuclear labeling) in benign ducts, stromalcells, pancreatic acini, islets, and lymphocytes. In gen-eral, the intensity of Dpc4 labeling was greater innormal duct epithelial cells than in the other normaltissues. In 16 cases in the study (10 distal tumors, 2perihilar, 4 intrahepatic), the nonneoplastic cells inthe section did not label, and these cases thereforewere considered unevaluable.
Among 78 evaluable distal common bile duct car-cinomas, 43 (55%) demonstrated loss of Dpc4 labeling.Examples of these lesions are shown in Figures 1 and2. In these cases, the loss of Dpc4 labeling was clearlydistinct from the intact labeling in surrounding nor-mal structures. The 35 (45%) carcinomas that showedintact DPC4 gene expression often labeled less in-tensely than the surrounding normal tissues, but bothnuclear and cytoplasmic labeling were identified atleast focally.
In 11 of the 78 distal bile duct carcinomas, an insitu, papillary carcinoma component was present on
the section adjacent to the invasive carcinoma. In 9 ofthese 11 cases, both the in situ and the infiltratingcomponent labeled for Dpc4. In 2 of the 11 cases, thein situ component labeled, but the adjacent invasivecomponent showed loss of DPC4 expression (Fig. 3).
One of the 78 invasive distal common bile ductcarcinomas demonstrated heterogeneous labeling.This case contained a moderately differentiated gland-forming component that merged with a second,poorly differentiated component. Although the gland-forming component of the tumor strongly expressedthe DPC4 gene, the more poorly differentiated com-ponent was completely negative (Fig. 4). We thereforeexamined the correlation between Dpc4 labeling anddifferentiation. Dpc4 expression was absent in 68% ofthe poorly differentiated carcinomas as comparedwith 49% of the well and moderately differentiatedtumors. This difference was not statistically signifi-cant, however (P 5 0.116).
A lower frequency of loss of DPC4 gene expression(15%) was observed among the 34 evaluable proximalbile duct tumors. Among 26 evaluable perihilarcholangiocarcinomas, 22 (85%) labeled for Dpc4whereas 4 (15%) showed loss of DPC4 gene expression.In one case with an in situ component, both this insitu component and the invasive carcinoma associ-ated with it expressed the DPC4 gene. Eight of the 12intrahepatic cholangiocarcinomas were evaluable,and only 1 did not label (12.5%).
The difference between the frequency of labelingin the distal (45%) and proximal (perhilar and intra-hepatic grouped together; 85%) cholangiocarcinomaswas statistically significant (P , 0.001).
p53 ImmunohistochemistryAmong 88 distal common bile duct carcinomas thatwere studied, 45 (51%) demonstrated greater than 30%nuclear labeling for p53. In most of these cases,greater than 70% of nuclei were labeled in an intensefashion that clearly demarcated tumor from the sur-rounding normal tissue on low power (Fig. 1C). Twelvecases (14%) demonstrated an intermediate level oflabeling (1–30%), whereas in 31 cases p53 labeling wasabsent. For cases with an in situ component, no sig-nificant difference in p53 labeling was noted betweenthe in situ and invasive components in 11 of 12 cases.The one case in which a difference was noted was theadenosquamous carcinoma, in which significant la-beling (. 30%) was observed only in the invasivecomponent.
The frequency of greater than 30% p53 immuno-labeling was lower among more proximal cholangio-
1336 CANCER April 1, 2001 / Volume 91 / Number 7
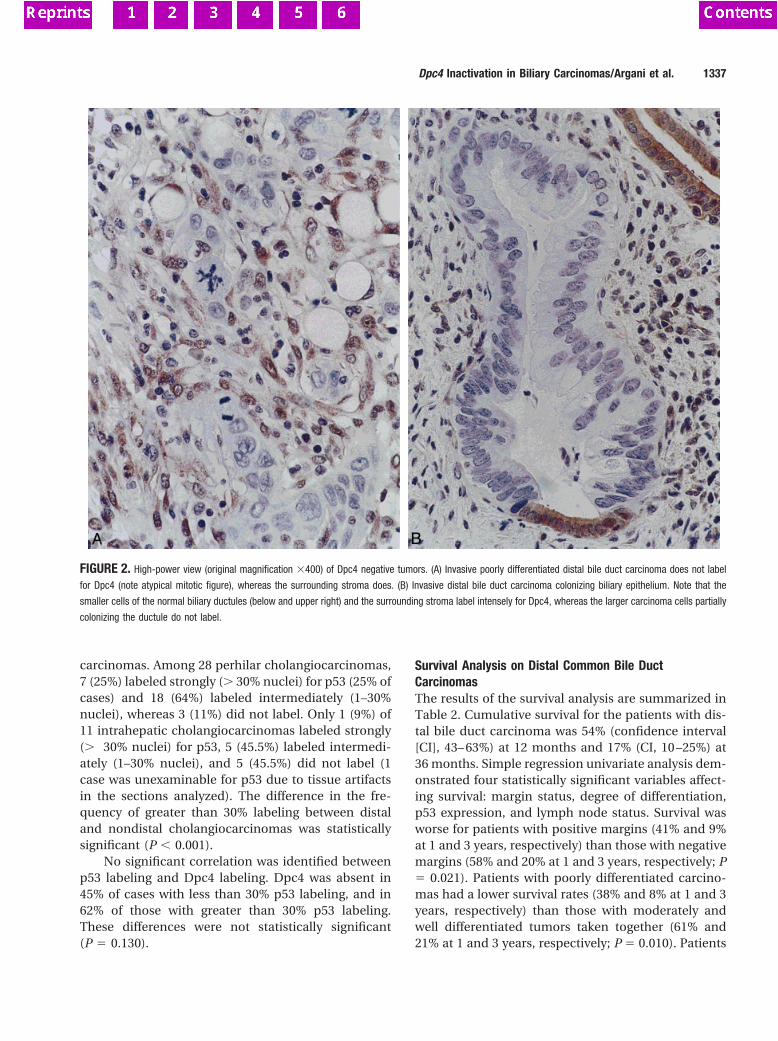
carcinomas. Among 28 perhilar cholangiocarcinomas,7 (25%) labeled strongly (. 30% nuclei) for p53 (25% ofcases) and 18 (64%) labeled intermediately (1–30%nuclei), whereas 3 (11%) did not label. Only 1 (9%) of11 intrahepatic cholangiocarcinomas labeled strongly(. 30% nuclei) for p53, 5 (45.5%) labeled intermedi-ately (1–30% nuclei), and 5 (45.5%) did not label (1case was unexaminable for p53 due to tissue artifactsin the sections analyzed). The difference in the fre-quency of greater than 30% labeling between distaland nondistal cholangiocarcinomas was statisticallysignificant (P , 0.001).
No significant correlation was identified betweenp53 labeling and Dpc4 labeling. Dpc4 was absent in45% of cases with less than 30% p53 labeling, and in62% of those with greater than 30% p53 labeling.These differences were not statistically significant(P 5 0.130).
Survival Analysis on Distal Common Bile DuctCarcinomasThe results of the survival analysis are summarized inTable 2. Cumulative survival for the patients with dis-tal bile duct carcinoma was 54% (confidence interval[CI], 43– 63%) at 12 months and 17% (CI, 10 –25%) at36 months. Simple regression univariate analysis dem-onstrated four statistically significant variables affect-ing survival: margin status, degree of differentiation,p53 expression, and lymph node status. Survival wasworse for patients with positive margins (41% and 9%at 1 and 3 years, respectively) than those with negativemargins (58% and 20% at 1 and 3 years, respectively; P5 0.021). Patients with poorly differentiated carcino-mas had a lower survival rates (38% and 8% at 1 and 3years, respectively) than those with moderately andwell differentiated tumors taken together (61% and21% at 1 and 3 years, respectively; P 5 0.010). Patients
FIGURE 2. High-power view (original magnification 3400) of Dpc4 negative tumors. (A) Invasive poorly differentiated distal bile duct carcinoma does not label
for Dpc4 (note atypical mitotic figure), whereas the surrounding stroma does. (B) Invasive distal bile duct carcinoma colonizing biliary epithelium. Note that the
smaller cells of the normal biliary ductules (below and upper right) and the surrounding stroma label intensely for Dpc4, whereas the larger carcinoma cells partially
colonizing the ductule do not label.
Dpc4 Inactivation in Biliary Carcinomas/Argani et al. 1337
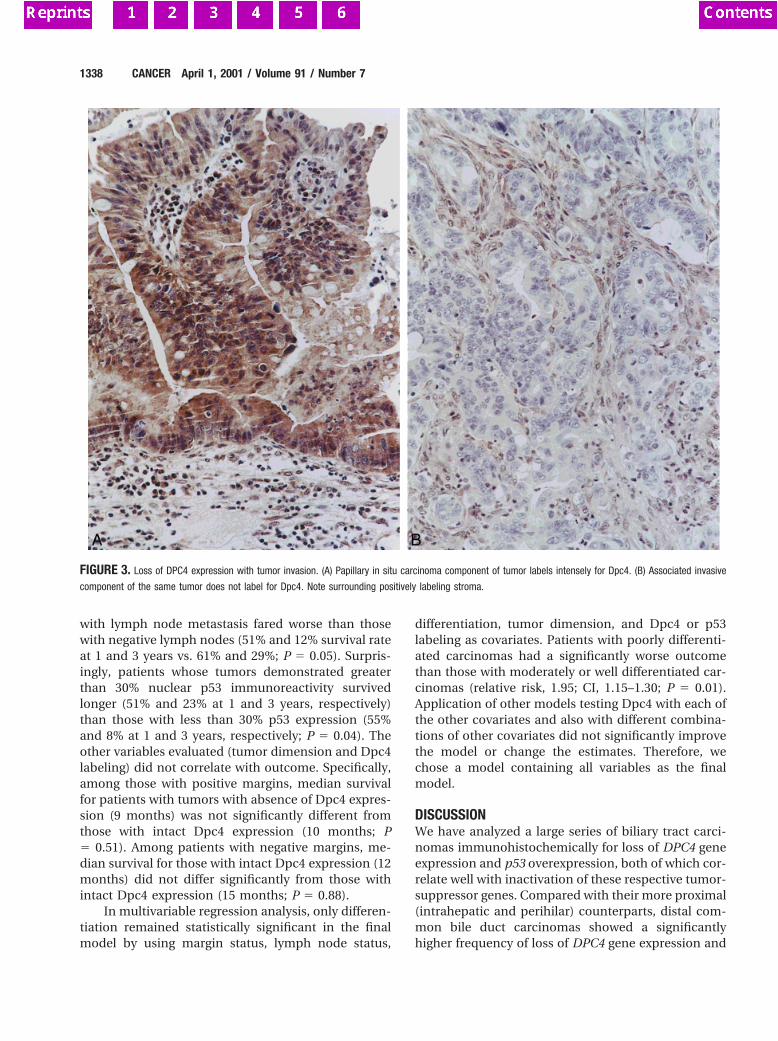
with lymph node metastasis fared worse than thosewith negative lymph nodes (51% and 12% survival rateat 1 and 3 years vs. 61% and 29%; P 5 0.05). Surpris-ingly, patients whose tumors demonstrated greaterthan 30% nuclear p53 immunoreactivity survivedlonger (51% and 23% at 1 and 3 years, respectively)than those with less than 30% p53 expression (55%and 8% at 1 and 3 years, respectively; P 5 0.04). Theother variables evaluated (tumor dimension and Dpc4labeling) did not correlate with outcome. Specifically,among those with positive margins, median survivalfor patients with tumors with absence of Dpc4 expres-sion (9 months) was not significantly different fromthose with intact Dpc4 expression (10 months; P5 0.51). Among patients with negative margins, me-dian survival for those with intact Dpc4 expression (12months) did not differ significantly from those withintact Dpc4 expression (15 months; P 5 0.88).
In multivariable regression analysis, only differen-tiation remained statistically significant in the finalmodel by using margin status, lymph node status,
differentiation, tumor dimension, and Dpc4 or p53labeling as covariates. Patients with poorly differenti-ated carcinomas had a significantly worse outcomethan those with moderately or well differentiated car-cinomas (relative risk, 1.95; CI, 1.15–1.30; P 5 0.01).Application of other models testing Dpc4 with each ofthe other covariates and also with different combina-tions of other covariates did not significantly improvethe model or change the estimates. Therefore, wechose a model containing all variables as the finalmodel.
DISCUSSIONWe have analyzed a large series of biliary tract carci-nomas immunohistochemically for loss of DPC4 geneexpression and p53 overexpression, both of which cor-relate well with inactivation of these respective tumor-suppressor genes. Compared with their more proximal(intrahepatic and perihilar) counterparts, distal com-mon bile duct carcinomas showed a significantlyhigher frequency of loss of DPC4 gene expression and
FIGURE 3. Loss of DPC4 expression with tumor invasion. (A) Papillary in situ carcinoma component of tumor labels intensely for Dpc4. (B) Associated invasive
component of the same tumor does not label for Dpc4. Note surrounding positively labeling stroma.
1338 CANCER April 1, 2001 / Volume 91 / Number 7
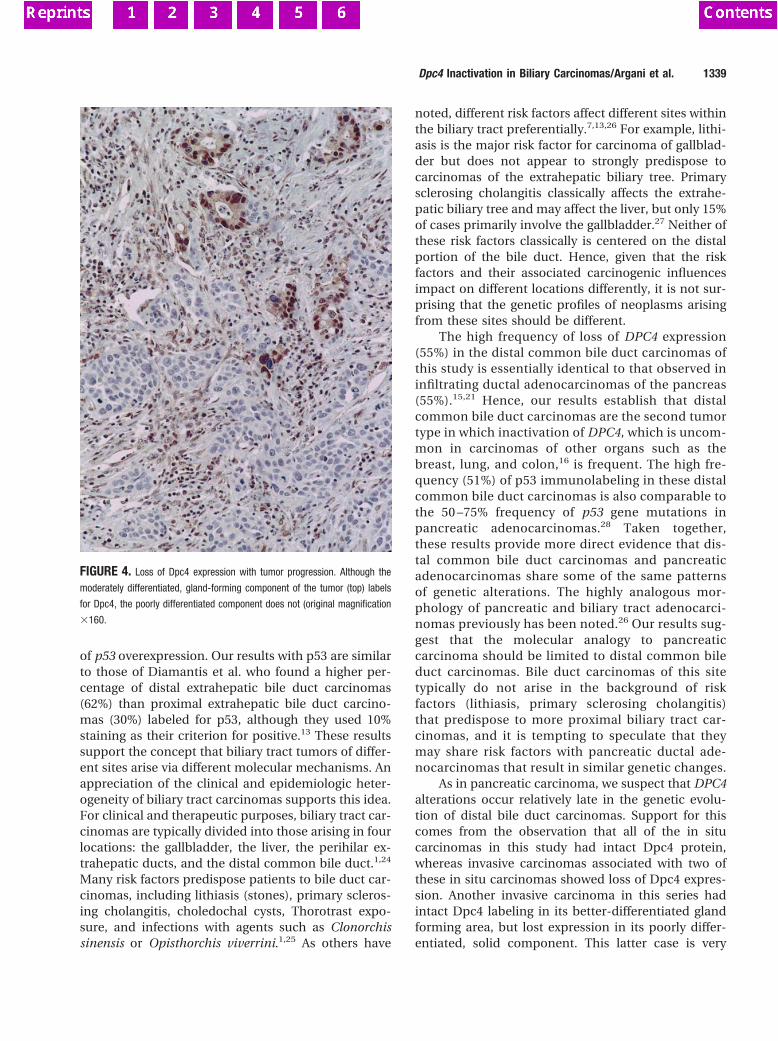
of p53 overexpression. Our results with p53 are similarto those of Diamantis et al. who found a higher per-centage of distal extrahepatic bile duct carcinomas(62%) than proximal extrahepatic bile duct carcino-mas (30%) labeled for p53, although they used 10%staining as their criterion for positive.13 These resultssupport the concept that biliary tract tumors of differ-ent sites arise via different molecular mechanisms. Anappreciation of the clinical and epidemiologic heter-ogeneity of biliary tract carcinomas supports this idea.For clinical and therapeutic purposes, biliary tract car-cinomas are typically divided into those arising in fourlocations: the gallbladder, the liver, the perihilar ex-trahepatic ducts, and the distal common bile duct.1,24
Many risk factors predispose patients to bile duct car-cinomas, including lithiasis (stones), primary scleros-ing cholangitis, choledochal cysts, Thorotrast expo-sure, and infections with agents such as Clonorchissinensis or Opisthorchis viverrini.1,25 As others have
noted, different risk factors affect different sites withinthe biliary tract preferentially.7,13,26 For example, lithi-asis is the major risk factor for carcinoma of gallblad-der but does not appear to strongly predispose tocarcinomas of the extrahepatic biliary tree. Primarysclerosing cholangitis classically affects the extrahe-patic biliary tree and may affect the liver, but only 15%of cases primarily involve the gallbladder.27 Neither ofthese risk factors classically is centered on the distalportion of the bile duct. Hence, given that the riskfactors and their associated carcinogenic influencesimpact on different locations differently, it is not sur-prising that the genetic profiles of neoplasms arisingfrom these sites should be different.
The high frequency of loss of DPC4 expression(55%) in the distal common bile duct carcinomas ofthis study is essentially identical to that observed ininfiltrating ductal adenocarcinomas of the pancreas(55%).15,21 Hence, our results establish that distalcommon bile duct carcinomas are the second tumortype in which inactivation of DPC4, which is uncom-mon in carcinomas of other organs such as thebreast, lung, and colon,16 is frequent. The high fre-quency (51%) of p53 immunolabeling in these distalcommon bile duct carcinomas is also comparable tothe 50 –75% frequency of p53 gene mutations inpancreatic adenocarcinomas.28 Taken together,these results provide more direct evidence that dis-tal common bile duct carcinomas and pancreaticadenocarcinomas share some of the same patternsof genetic alterations. The highly analogous mor-phology of pancreatic and biliary tract adenocarci-nomas previously has been noted.26 Our results sug-gest that the molecular analogy to pancreaticcarcinoma should be limited to distal common bileduct carcinomas. Bile duct carcinomas of this sitetypically do not arise in the background of riskfactors (lithiasis, primary sclerosing cholangitis)that predispose to more proximal biliary tract car-cinomas, and it is tempting to speculate that theymay share risk factors with pancreatic ductal ade-nocarcinomas that result in similar genetic changes.
As in pancreatic carcinoma, we suspect that DPC4alterations occur relatively late in the genetic evolu-tion of distal bile duct carcinomas. Support for thiscomes from the observation that all of the in situcarcinomas in this study had intact Dpc4 protein,whereas invasive carcinomas associated with two ofthese in situ carcinomas showed loss of Dpc4 expres-sion. Another invasive carcinoma in this series hadintact Dpc4 labeling in its better-differentiated glandforming area, but lost expression in its poorly differ-entiated, solid component. This latter case is very
FIGURE 4. Loss of Dpc4 expression with tumor progression. Although the
moderately differentiated, gland-forming component of the tumor (top) labels
for Dpc4, the poorly differentiated component does not (original magnification
3160.
Dpc4 Inactivation in Biliary Carcinomas/Argani et al. 1339
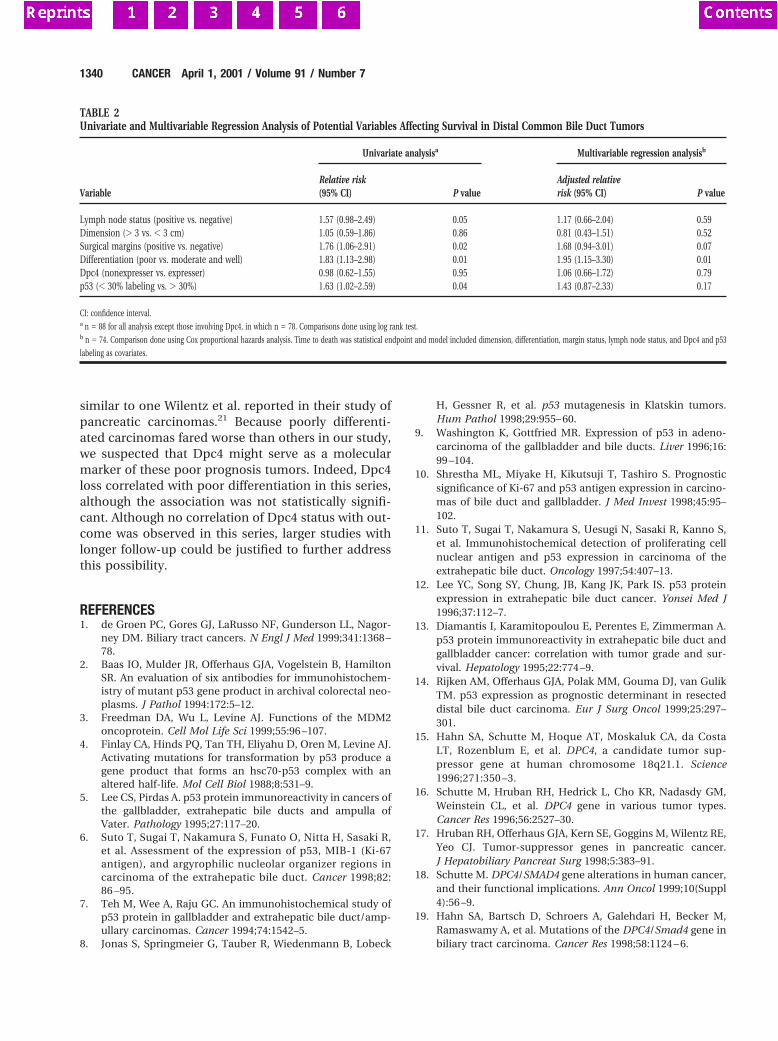
similar to one Wilentz et al. reported in their study ofpancreatic carcinomas.21 Because poorly differenti-ated carcinomas fared worse than others in our study,we suspected that Dpc4 might serve as a molecularmarker of these poor prognosis tumors. Indeed, Dpc4loss correlated with poor differentiation in this series,although the association was not statistically signifi-cant. Although no correlation of Dpc4 status with out-come was observed in this series, larger studies withlonger follow-up could be justified to further addressthis possibility.
REFERENCES1. de Groen PC, Gores GJ, LaRusso NF, Gunderson LL, Nagor-
ney DM. Biliary tract cancers. N Engl J Med 1999;341:1368 –78.
2. Baas IO, Mulder JR, Offerhaus GJA, Vogelstein B, HamiltonSR. An evaluation of six antibodies for immunohistochem-istry of mutant p53 gene product in archival colorectal neo-plasms. J Pathol 1994:172:5–12.
3. Freedman DA, Wu L, Levine AJ. Functions of the MDM2oncoprotein. Cell Mol Life Sci 1999;55:96 –107.
4. Finlay CA, Hinds PQ, Tan TH, Eliyahu D, Oren M, Levine AJ.Activating mutations for transformation by p53 produce agene product that forms an hsc70-p53 complex with analtered half-life. Mol Cell Biol 1988;8:531–9.
5. Lee CS, Pirdas A. p53 protein immunoreactivity in cancers ofthe gallbladder, extrahepatic bile ducts and ampulla ofVater. Pathology 1995;27:117–20.
6. Suto T, Sugai T, Nakamura S, Funato O, Nitta H, Sasaki R,et al. Assessment of the expression of p53, MIB-1 (Ki-67antigen), and argyrophilic nucleolar organizer regions incarcinoma of the extrahepatic bile duct. Cancer 1998;82:86 –95.
7. Teh M, Wee A, Raju GC. An immunohistochemical study ofp53 protein in gallbladder and extrahepatic bile duct/amp-ullary carcinomas. Cancer 1994;74:1542–5.
8. Jonas S, Springmeier G, Tauber R, Wiedenmann B, Lobeck
H, Gessner R, et al. p53 mutagenesis in Klatskin tumors.Hum Pathol 1998;29:955– 60.
9. Washington K, Gottfried MR. Expression of p53 in adeno-carcinoma of the gallbladder and bile ducts. Liver 1996;16:99 –104.
10. Shrestha ML, Miyake H, Kikutsuji T, Tashiro S. Prognosticsignificance of Ki-67 and p53 antigen expression in carcino-mas of bile duct and gallbladder. J Med Invest 1998;45:95–102.
11. Suto T, Sugai T, Nakamura S, Uesugi N, Sasaki R, Kanno S,et al. Immunohistochemical detection of proliferating cellnuclear antigen and p53 expression in carcinoma of theextrahepatic bile duct. Oncology 1997;54:407–13.
12. Lee YC, Song SY, Chung, JB, Kang JK, Park IS. p53 proteinexpression in extrahepatic bile duct cancer. Yonsei Med J1996;37:112–7.
13. Diamantis I, Karamitopoulou E, Perentes E, Zimmerman A.p53 protein immunoreactivity in extrahepatic bile duct andgallbladder cancer: correlation with tumor grade and sur-vival. Hepatology 1995;22:774 –9.
14. Rijken AM, Offerhaus GJA, Polak MM, Gouma DJ, van GulikTM. p53 expression as prognostic determinant in resecteddistal bile duct carcinoma. Eur J Surg Oncol 1999;25:297–301.
15. Hahn SA, Schutte M, Hoque AT, Moskaluk CA, da CostaLT, Rozenblum E, et al. DPC4, a candidate tumor sup-pressor gene at human chromosome 18q21.1. Science1996;271:350 –3.
16. Schutte M, Hruban RH, Hedrick L, Cho KR, Nadasdy GM,Weinstein CL, et al. DPC4 gene in various tumor types.Cancer Res 1996;56:2527–30.
17. Hruban RH, Offerhaus GJA, Kern SE, Goggins M, Wilentz RE,Yeo CJ. Tumor-suppressor genes in pancreatic cancer.J Hepatobiliary Pancreat Surg 1998;5:383–91.
18. Schutte M. DPC4/SMAD4 gene alterations in human cancer,and their functional implications. Ann Oncol 1999;10(Suppl4):56 –9.
19. Hahn SA, Bartsch D, Schroers A, Galehdari H, Becker M,Ramaswamy A, et al. Mutations of the DPC4/Smad4 gene inbiliary tract carcinoma. Cancer Res 1998;58:1124 – 6.
TABLE 2Univariate and Multivariable Regression Analysis of Potential Variables Affecting Survival in Distal Common Bile Duct Tumors
Variable
Univariate analysisa Multivariable regression analysisb
Relative risk(95% CI) P value
Adjusted relativerisk (95% CI) P value
Lymph node status (positive vs. negative) 1.57 (0.98–2.49) 0.05 1.17 (0.66–2.04) 0.59Dimension (. 3 vs. , 3 cm) 1.05 (0.59–1.86) 0.86 0.81 (0.43–1.51) 0.52Surgical margins (positive vs. negative) 1.76 (1.06–2.91) 0.02 1.68 (0.94–3.01) 0.07Differentiation (poor vs. moderate and well) 1.83 (1.13–2.98) 0.01 1.95 (1.15–3.30) 0.01Dpc4 (nonexpresser vs. expresser) 0.98 (0.62–1.55) 0.95 1.06 (0.66–1.72) 0.79p53 (, 30% labeling vs. . 30%) 1.63 (1.02–2.59) 0.04 1.43 (0.87–2.33) 0.17
CI: confidence interval.a n 5 88 for all analysis except those involving Dpc4, in which n 5 78. Comparisons done using log rank test.b n 5 74. Comparison done using Cox proportional hazards analysis. Time to death was statistical endpoint and model included dimension, differentiation, margin status, lymph node status, and Dpc4 and p53
labeling as covariates.
1340 CANCER April 1, 2001 / Volume 91 / Number 7
20. Rijken AM, Hu J, Perlman E, Morsberger LA, Long P, KernSE, et al. Genomic alterations in distal bile duct carcinomaby comparative genomic hybridization and karyotype anal-ysis. Genes Chromosomes Cancer 1999;26:185–91.
21. Wilentz RE, Su GH, Dai JL, Sparks AB, Argani P, Sohn TA, etal. Immunohistochemical labeling for Dpc4 mirrors geneticstatus in pancreatic adenocarcinomas: a new marker ofDPC4 inactivation. Am J Pathol 2000;156:37– 43.
22. Yeo CJ, Cameron JL, Sohn TA, Lillemoe KD, Pitt HA, Ta-lamini MA, et al. Six hundred fifty consecutive pancreati-coduodenectomies in the 1990s: pathology, complications,and outcomes. Ann Surg 1997;226:248 –57.
23. Kaplan EL, Meier P. Nonparametric estimation from incom-plete observations. J Am Stat Assoc 1958;53:457– 80.
24. Nakeeb A, Pitt HA, Sohn TA, Coleman J, Abrams RA, Pianta-dosi S, et al. Cholangiocarcinoma. A spectrum of intrahe-
patic, perihilar, and distal tumors. Ann Surg 1996;224:463–73.
25. Holzinger F, Z’graggen K, Buchler MW. Mechanisms of bil-iary carcinogenesis: a pathogenetic multi-stage cascade to-wards cholangiocarcinoma. Ann Oncol 1999;10(Suppl4):122– 6.
26. Longnecker DS, Terhune PG. The case for parallel classifi-cation of biliary tract and pancreatic neoplasms. Mod Pathol1996;9:828 –37.
27. Brandt, DJ, MacCarty RL, Charboneau JW LaRusso NF, WiesnerRH, Ludwig J. Gallbladder disease in patients with primary scle-rosing cholangitis. AJR Am J Roentenol 1988;150:571–4.
28. Redston MS, Caldas C, Seymour AB, Hruban RH, da Costa L,Yeo CJ, et al. p53 mutations in pancreatic carcinoma andevidence of common involvement of homocopolymer tractsin DNA microdeletions. Cancer Res 1994;54:3025–33.
Dpc4 Inactivation in Biliary Carcinomas/Argani et al. 1341
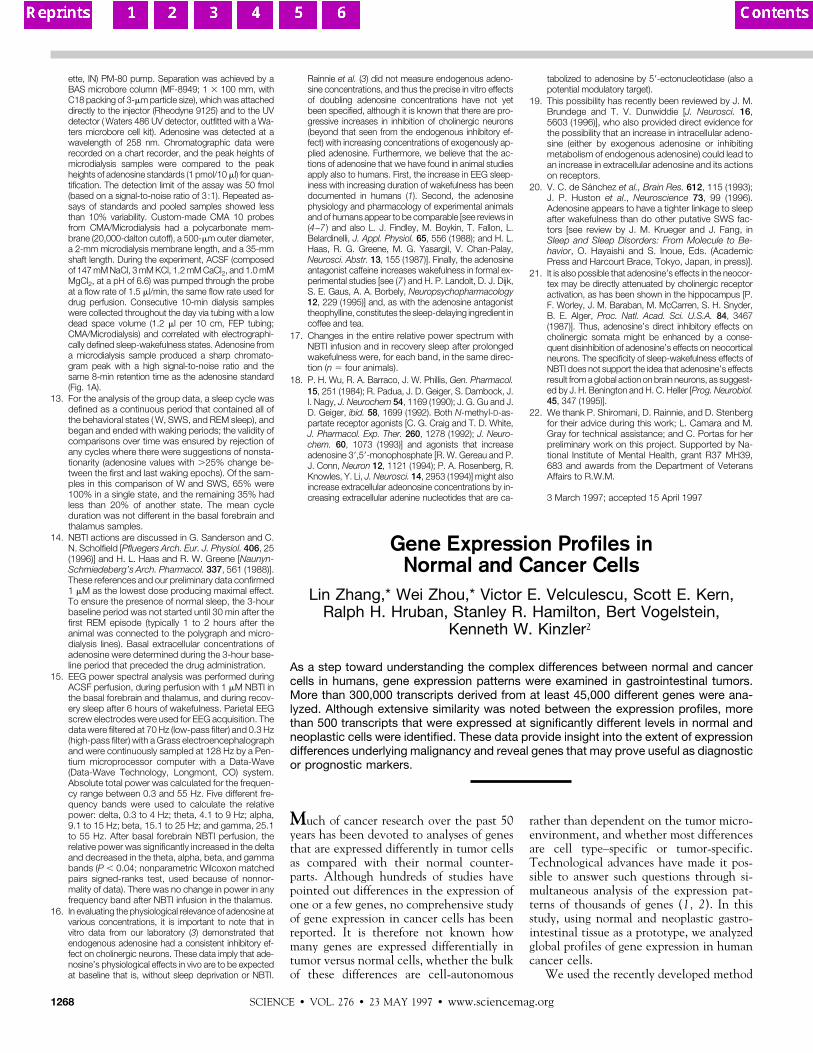
ette, IN) PM-80 pump. Separation was achieved by aBAS microbore column (MF-8949; 1 3 100 mm, withC18 packing of 3-mm particle size), which was attacheddirectly to the injector (Rheodyne 9125) and to the UVdetector ( Waters 486 UV detector, outfitted with a Wa-ters microbore cell kit). Adenosine was detected at awavelength of 258 nm. Chromatographic data wererecorded on a chart recorder, and the peak heights ofmicrodialysis samples were compared to the peakheights of adenosine standards (1 pmol/10 ml) for quan-tification. The detection limit of the assay was 50 fmol(based on a signal-to-noise ratio of 3:1). Repeated as-says of standards and pooled samples showed lessthan 10% variability. Custom-made CMA 10 probesfrom CMA/Microdialysis had a polycarbonate mem-brane (20,000-dalton cutoff), a 500-mm outer diameter,a 2-mm microdialysis membrane length, and a 35-mmshaft length. During the experiment, ACSF (composedof 147 mM NaCl, 3 mM KCl, 1.2 mM CaCl2, and 1.0 mMMgCl2, at a pH of 6.6) was pumped through the probeat a flow rate of 1.5 ml/min, the same flow rate used fordrug perfusion. Consecutive 10-min dialysis sampleswere collected throughout the day via tubing with a lowdead space volume (1.2 ml per 10 cm, FEP tubing;CMA/Microdialysis) and correlated with electrographi-cally defined sleep-wakefulness states. Adenosine froma microdialysis sample produced a sharp chromato-gram peak with a high signal-to-noise ratio and thesame 8-min retention time as the adenosine standard(Fig. 1A).
13. For the analysis of the group data, a sleep cycle wasdefined as a continuous period that contained all ofthe behavioral states ( W, SWS, and REM sleep), andbegan and ended with waking periods; the validity ofcomparisons over time was ensured by rejection ofany cycles where there were suggestions of nonsta-tionarity (adenosine values with .25% change be-tween the first and last waking epochs). Of the sam-ples in this comparison of W and SWS, 65% were100% in a single state, and the remaining 35% hadless than 20% of another state. The mean cycleduration was not different in the basal forebrain andthalamus samples.
14. NBTI actions are discussed in G. Sanderson and C.N. Scholfield [Pfluegers Arch. Eur. J. Physiol. 406, 25(1996)] and H. L. Haas and R. W. Greene [Naunyn-Schmiedeberg’s Arch. Pharmacol. 337, 561 (1988)].These references and our preliminary data confirmed1 mM as the lowest dose producing maximal effect.To ensure the presence of normal sleep, the 3-hourbaseline period was not started until 30 min after thefirst REM episode (typically 1 to 2 hours after theanimal was connected to the polygraph and micro-dialysis lines). Basal extracellular concentrations ofadenosine were determined during the 3-hour base-line period that preceded the drug administration.
15. EEG power spectral analysis was performed duringACSF perfusion, during perfusion with 1 mM NBTI inthe basal forebrain and thalamus, and during recov-ery sleep after 6 hours of wakefulness. Parietal EEGscrew electrodes were used for EEG acquisition. Thedata were filtered at 70 Hz (low-pass filter) and 0.3 Hz(high-pass filter) with a Grass electroencephalographand were continuously sampled at 128 Hz by a Pen-tium microprocessor computer with a Data-Wave(Data-Wave Technology, Longmont, CO) system.Absolute total power was calculated for the frequen-cy range between 0.3 and 55 Hz. Five different fre-quency bands were used to calculate the relativepower: delta, 0.3 to 4 Hz; theta, 4.1 to 9 Hz; alpha,9.1 to 15 Hz; beta, 15.1 to 25 Hz; and gamma, 25.1to 55 Hz. After basal forebrain NBTI perfusion, therelative power was significantly increased in the deltaand decreased in the theta, alpha, beta, and gammabands (P , 0.04; nonparametric Wilcoxon matchedpairs signed-ranks test, used because of nonnor-mality of data). There was no change in power in anyfrequency band after NBTI infusion in the thalamus.
16. In evaluating the physiological relevance of adenosine atvarious concentrations, it is important to note that invitro data from our laboratory (3) demonstrated thatendogenous adenosine had a consistent inhibitory ef-fect on cholinergic neurons. These data imply that ade-nosine’s physiological effects in vivo are to be expectedat baseline that is, without sleep deprivation or NBTI.
Rainnie et al. (3) did not measure endogenous adeno-sine concentrations, and thus the precise in vitro effectsof doubling adenosine concentrations have not yetbeen specified, although it is known that there are pro-gressive increases in inhibition of cholinergic neurons(beyond that seen from the endogenous inhibitory ef-fect) with increasing concentrations of exogenously ap-plied adenosine. Furthermore, we believe that the ac-tions of adenosine that we have found in animal studiesapply also to humans. First, the increase in EEG sleep-iness with increasing duration of wakefulness has beendocumented in humans (1). Second, the adenosinephysiology and pharmacology of experimental animalsand of humans appear to be comparable [see reviews in(4–7 ) and also L. J. Findley, M. Boykin, T. Fallon, L.Belardinelli, J. Appl. Physiol. 65, 556 (1988); and H. L.Haas, R. G. Greene, M. G. Yasargil, V. Chan-Palay,Neurosci. Abstr. 13, 155 (1987)]. Finally, the adenosineantagonist caffeine increases wakefulness in formal ex-perimental studies [see (7 ) and H. P. Landolt, D. J. Dijk,S. E. Gaus, A. A. Borbely, Neuropsychopharmacology12, 229 (1995)] and, as with the adenosine antagonisttheophylline, constitutes the sleep-delaying ingredient incoffee and tea.
17. Changes in the entire relative power spectrum withNBTI infusion and in recovery sleep after prolongedwakefulness were, for each band, in the same direc-tion (n 5 four animals).
18. P. H. Wu, R. A. Barraco, J. W. Phillis, Gen. Pharmacol.15, 251 (1984); R. Padua, J. D. Geiger, S. Dambock, J.I. Nagy, J. Neurochem 54, 1169 (1990); J. G. Gu and J.D. Geiger, ibid. 58, 1699 (1992). Both N-methyl-D-as-partate receptor agonists [C. G. Craig and T. D. White,J. Pharmacol. Exp. Ther. 260, 1278 (1992); J. Neuro-chem. 60, 1073 (1993)] and agonists that increaseadenosine 39,59-monophosphate [R. W. Gereau and P.J. Conn, Neuron 12, 1121 (1994); P. A. Rosenberg, R.Knowles, Y. Li, J. Neurosci. 14, 2953 (1994)] might alsoincrease extracellular adeonosine concentrations by in-creasing extracellular adenine nucleotides that are ca-
tabolized to adenosine by 59-ectonucleotidase (also apotential modulatory target).
19. This possibility has recently been reviewed by J. M.Brundege and T. V. Dunwiddie [J. Neurosci. 16,5603 (1996)], who also provided direct evidence forthe possibility that an increase in intracellular adeno-sine (either by exogenous adenosine or inhibitingmetabolism of endogenous adenosine) could lead toan increase in extracellular adenosine and its actionson receptors.
20. V. C. de Sanchez et al., Brain Res. 612, 115 (1993);J. P. Huston et al., Neuroscience 73, 99 (1996).Adenosine appears to have a tighter linkage to sleepafter wakefulness than do other putative SWS fac-tors [see review by J. M. Krueger and J. Fang, inSleep and Sleep Disorders: From Molecule to Be-havior, O. Hayaishi and S. Inoue, Eds. (AcademicPress and Harcourt Brace, Tokyo, Japan, in press)].
21. It is also possible that adenosine’s effects in the neocor-tex may be directly attenuated by cholinergic receptoractivation, as has been shown in the hippocampus [P.F. Worley, J. M. Baraban, M. McCarren, S. H. Snyder,B. E. Alger, Proc. Natl. Acad. Sci. U.S.A. 84, 3467(1987)]. Thus, adenosine’s direct inhibitory effects oncholinergic somata might be enhanced by a conse-quent disinhibition of adenosine’s effects on neocorticalneurons. The specificity of sleep-wakefulness effects ofNBTI does not support the idea that adenosine’s effectsresult from a global action on brain neurons, as suggest-ed by J. H. Benington and H. C. Heller [Prog. Neurobiol.45, 347 (1995)].
22. We thank P. Shiromani, D. Rainnie, and D. Stenbergfor their advice during this work; L. Camara and M.Gray for technical assistance; and C. Portas for herpreliminary work on this project. Supported by Na-tional Institute of Mental Health, grant R37 MH39,683 and awards from the Department of VeteransAffairs to R.W.M.
3 March 1997; accepted 15 April 1997
Gene Expression Profiles inNormal and Cancer Cells
Lin Zhang,* Wei Zhou,* Victor E. Velculescu, Scott E. Kern,Ralph H. Hruban, Stanley R. Hamilton, Bert Vogelstein,
Kenneth W. Kinzler†
As a step toward understanding the complex differences between normal and cancercells in humans, gene expression patterns were examined in gastrointestinal tumors.More than 300,000 transcripts derived from at least 45,000 different genes were ana-lyzed. Although extensive similarity was noted between the expression profiles, morethan 500 transcripts that were expressed at significantly different levels in normal andneoplastic cells were identified. These data provide insight into the extent of expressiondifferences underlying malignancy and reveal genes that may prove useful as diagnosticor prognostic markers.
Much of cancer research over the past 50years has been devoted to analyses of genesthat are expressed differently in tumor cellsas compared with their normal counter-parts. Although hundreds of studies havepointed out differences in the expression ofone or a few genes, no comprehensive studyof gene expression in cancer cells has beenreported. It is therefore not known howmany genes are expressed differentially intumor versus normal cells, whether the bulkof these differences are cell-autonomous
rather than dependent on the tumor micro-environment, and whether most differencesare cell type–specific or tumor-specific.Technological advances have made it pos-sible to answer such questions through si-multaneous analysis of the expression pat-terns of thousands of genes (1, 2). In thisstudy, using normal and neoplastic gastro-intestinal tissue as a prototype, we analyzedglobal profiles of gene expression in humancancer cells.
We used the recently developed method
SCIENCE z VOL. 276 z 23 MAY 1997 z www.sciencemag.org1268
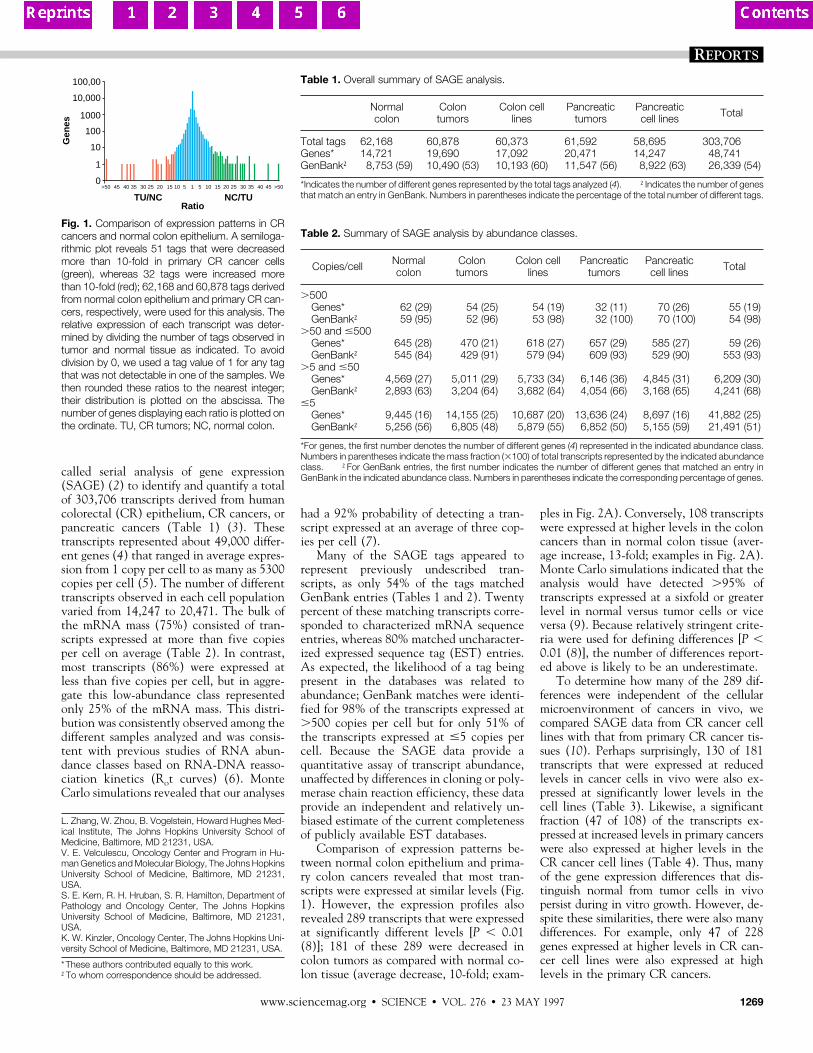
called serial analysis of gene expression(SAGE) (2) to identify and quantify a totalof 303,706 transcripts derived from humancolorectal (CR) epithelium, CR cancers, orpancreatic cancers (Table 1) (3). Thesetranscripts represented about 49,000 differ-ent genes (4) that ranged in average expres-sion from 1 copy per cell to as many as 5300copies per cell (5). The number of differenttranscripts observed in each cell populationvaried from 14,247 to 20,471. The bulk ofthe mRNA mass (75%) consisted of tran-scripts expressed at more than five copiesper cell on average (Table 2). In contrast,most transcripts (86%) were expressed atless than five copies per cell, but in aggre-gate this low-abundance class representedonly 25% of the mRNA mass. This distri-bution was consistently observed among thedifferent samples analyzed and was consis-tent with previous studies of RNA abun-dance classes based on RNA-DNA reasso-ciation kinetics (Rot curves) (6). MonteCarlo simulations revealed that our analyses
had a 92% probability of detecting a tran-script expressed at an average of three cop-ies per cell (7).
Many of the SAGE tags appeared torepresent previously undescribed tran-scripts, as only 54% of the tags matchedGenBank entries (Tables 1 and 2). Twentypercent of these matching transcripts corre-sponded to characterized mRNA sequenceentries, whereas 80% matched uncharacter-ized expressed sequence tag (EST) entries.As expected, the likelihood of a tag beingpresent in the databases was related toabundance; GenBank matches were identi-fied for 98% of the transcripts expressed at.500 copies per cell but for only 51% ofthe transcripts expressed at #5 copies percell. Because the SAGE data provide aquantitative assay of transcript abundance,unaffected by differences in cloning or poly-merase chain reaction efficiency, these dataprovide an independent and relatively un-biased estimate of the current completenessof publicly available EST databases.
Comparison of expression patterns be-tween normal colon epithelium and prima-ry colon cancers revealed that most tran-scripts were expressed at similar levels (Fig.1). However, the expression profiles alsorevealed 289 transcripts that were expressedat significantly different levels [P , 0.01(8)]; 181 of these 289 were decreased incolon tumors as compared with normal co-lon tissue (average decrease, 10-fold; exam-
ples in Fig. 2A). Conversely, 108 transcriptswere expressed at higher levels in the coloncancers than in normal colon tissue (aver-age increase, 13-fold; examples in Fig. 2A).Monte Carlo simulations indicated that theanalysis would have detected .95% oftranscripts expressed at a sixfold or greaterlevel in normal versus tumor cells or viceversa (9). Because relatively stringent crite-ria were used for defining differences [P ,0.01 (8)], the number of differences report-ed above is likely to be an underestimate.
To determine how many of the 289 dif-ferences were independent of the cellularmicroenvironment of cancers in vivo, wecompared SAGE data from CR cancer celllines with that from primary CR cancer tis-sues (10). Perhaps surprisingly, 130 of 181transcripts that were expressed at reducedlevels in cancer cells in vivo were also ex-pressed at significantly lower levels in thecell lines (Table 3). Likewise, a significantfraction (47 of 108) of the transcripts ex-pressed at increased levels in primary cancerswere also expressed at higher levels in theCR cancer cell lines (Table 4). Thus, manyof the gene expression differences that dis-tinguish normal from tumor cells in vivopersist during in vitro growth. However, de-spite these similarities, there were also manydifferences. For example, only 47 of 228genes expressed at higher levels in CR can-cer cell lines were also expressed at highlevels in the primary CR cancers.
L. Zhang, W. Zhou, B. Vogelstein, Howard Hughes Med-ical Institute, The Johns Hopkins University School ofMedicine, Baltimore, MD 21231, USA.V. E. Velculescu, Oncology Center and Program in Hu-man Genetics and Molecular Biology, The Johns HopkinsUniversity School of Medicine, Baltimore, MD 21231,USA.S. E. Kern, R. H. Hruban, S. R. Hamilton, Department ofPathology and Oncology Center, The Johns HopkinsUniversity School of Medicine, Baltimore, MD 21231,USA.K. W. Kinzler, Oncology Center, The Johns Hopkins Uni-versity School of Medicine, Baltimore, MD 21231, USA.
*These authors contributed equally to this work.†To whom correspondence should be addressed.
Table 1. Overall summary of SAGE analysis.
Normalcolon
Colontumors
Colon celllines
Pancreatictumors
Pancreaticcell lines Total
Total tags 62,168 60,878 60,373 61,592 58,695 303,706Genes* 14,721 19,690 17,092 20,471 14,247 48,741GenBank† 8,753 (59) 10,490 (53) 10,193 (60) 11,547 (56) 8,922 (63) 26,339 (54)
*Indicates the number of different genes represented by the total tags analyzed (4). †Indicates the number of genesthat match an entry in GenBank. Numbers in parentheses indicate the percentage of the total number of different tags.
100,00
Gen
es
TU/NC NC/TURatio
10,000
1000
100
10
1
0>50 45 40 35 30 25 20 15 10 5 1 5 10 15 20 25 30 35 40 45 >50
Fig. 1. Comparison of expression patterns in CRcancers and normal colon epithelium. A semiloga-rithmic plot reveals 51 tags that were decreasedmore than 10-fold in primary CR cancer cells(green), whereas 32 tags were increased morethan 10-fold (red); 62,168 and 60,878 tags derivedfrom normal colon epithelium and primary CR can-cers, respectively, were used for this analysis. Therelative expression of each transcript was deter-mined by dividing the number of tags observed intumor and normal tissue as indicated. To avoiddivision by 0, we used a tag value of 1 for any tagthat was not detectable in one of the samples. Wethen rounded these ratios to the nearest integer;their distribution is plotted on the abscissa. Thenumber of genes displaying each ratio is plotted onthe ordinate. TU, CR tumors; NC, normal colon.
Table 2. Summary of SAGE analysis by abundance classes.
Copies/cell Normalcolon
Colontumors
Colon celllines
Pancreatictumors
Pancreaticcell lines Total
.500Genes* 62 (29) 54 (25) 54 (19) 32 (11) 70 (26) 55 (19)GenBank† 59 (95) 52 (96) 53 (98) 32 (100) 70 (100) 54 (98)
.50 and #500Genes* 645 (28) 470 (21) 618 (27) 657 (29) 585 (27) 59 (26)GenBank† 545 (84) 429 (91) 579 (94) 609 (93) 529 (90) 553 (93)
.5 and #50Genes* 4,569 (27) 5,011 (29) 5,733 (34) 6,146 (36) 4,845 (31) 6,209 (30)GenBank† 2,893 (63) 3,204 (64) 3,682 (64) 4,054 (66) 3,168 (65) 4,241 (68)
#5Genes* 9,445 (16) 14,155 (25) 10,687 (20) 13,636 (24) 8,697 (16) 41,882 (25)GenBank† 5,256 (56) 6,805 (48) 5,879 (55) 6,852 (50) 5,155 (59) 21,491 (51)
*For genes, the first number denotes the number of different genes (4) represented in the indicated abundance class.Numbers in parentheses indicate the mass fraction (3100) of total transcripts represented by the indicated abundanceclass. †For GenBank entries, the first number indicates the number of different genes that matched an entry inGenBank in the indicated abundance class. Numbers in parentheses indicate the corresponding percentage of genes.
REPORTS
www.sciencemag.org z SCIENCE z VOL. 276 z 23 MAY 1997 1269
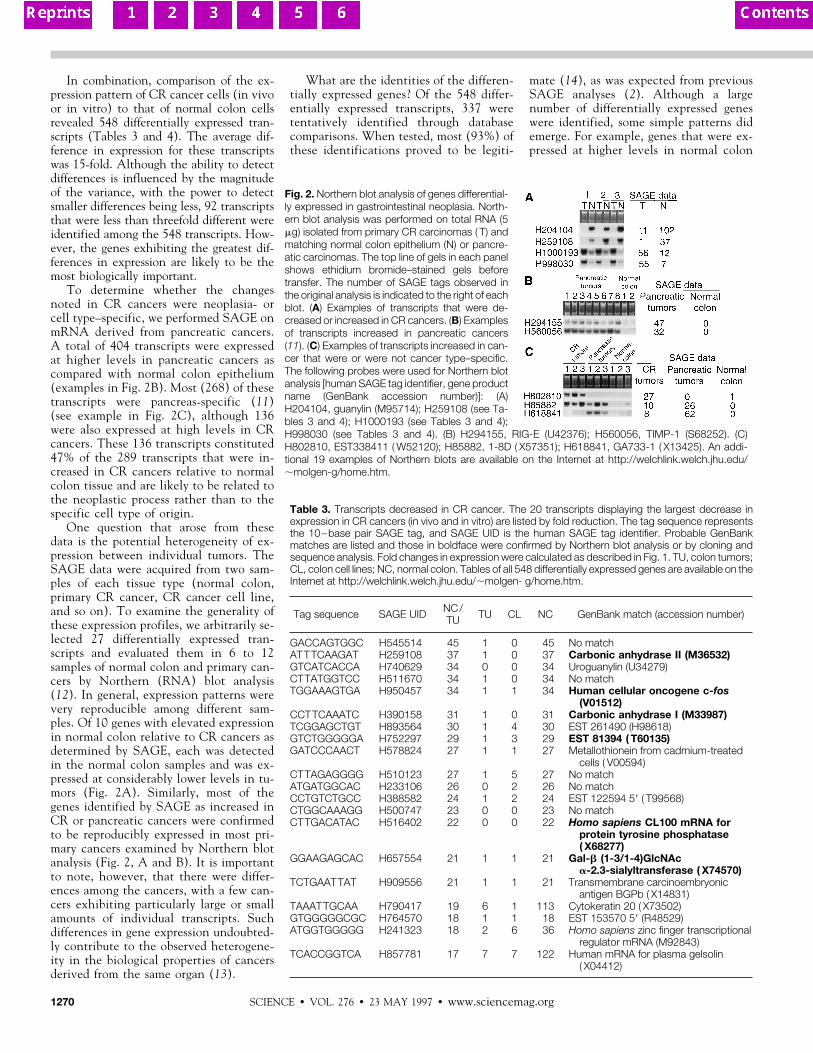
In combination, comparison of the ex-pression pattern of CR cancer cells (in vivoor in vitro) to that of normal colon cellsrevealed 548 differentially expressed tran-scripts (Tables 3 and 4). The average dif-ference in expression for these transcriptswas 15-fold. Although the ability to detectdifferences is influenced by the magnitudeof the variance, with the power to detectsmaller differences being less, 92 transcriptsthat were less than threefold different wereidentified among the 548 transcripts. How-ever, the genes exhibiting the greatest dif-ferences in expression are likely to be themost biologically important.
To determine whether the changesnoted in CR cancers were neoplasia- orcell type–specific, we performed SAGE onmRNA derived from pancreatic cancers.A total of 404 transcripts were expressedat higher levels in pancreatic cancers ascompared with normal colon epithelium(examples in Fig. 2B). Most (268) of thesetranscripts were pancreas-specific (11)(see example in Fig. 2C), although 136were also expressed at high levels in CRcancers. These 136 transcripts constituted47% of the 289 transcripts that were in-creased in CR cancers relative to normalcolon tissue and are likely to be related tothe neoplastic process rather than to thespecific cell type of origin.
One question that arose from thesedata is the potential heterogeneity of ex-pression between individual tumors. TheSAGE data were acquired from two sam-ples of each tissue type (normal colon,primary CR cancer, CR cancer cell line,and so on). To examine the generality ofthese expression profiles, we arbitrarily se-lected 27 differentially expressed tran-scripts and evaluated them in 6 to 12samples of normal colon and primary can-cers by Northern (RNA) blot analysis(12). In general, expression patterns werevery reproducible among different sam-ples. Of 10 genes with elevated expressionin normal colon relative to CR cancers asdetermined by SAGE, each was detectedin the normal colon samples and was ex-pressed at considerably lower levels in tu-mors (Fig. 2A). Similarly, most of thegenes identified by SAGE as increased inCR or pancreatic cancers were confirmedto be reproducibly expressed in most pri-mary cancers examined by Northern blotanalysis (Fig. 2, A and B). It is importantto note, however, that there were differ-ences among the cancers, with a few can-cers exhibiting particularly large or smallamounts of individual transcripts. Suchdifferences in gene expression undoubted-ly contribute to the observed heterogene-ity in the biological properties of cancersderived from the same organ (13).
What are the identities of the differen-tially expressed genes? Of the 548 differ-entially expressed transcripts, 337 weretentatively identified through databasecomparisons. When tested, most (93%) ofthese identifications proved to be legiti-
mate (14), as was expected from previousSAGE analyses (2). Although a largenumber of differentially expressed geneswere identified, some simple patterns didemerge. For example, genes that were ex-pressed at higher levels in normal colon
Fig. 2. Northern blot analysis of genes differential-ly expressed in gastrointestinal neoplasia. North-ern blot analysis was performed on total RNA (5mg) isolated from primary CR carcinomas ( T) andmatching normal colon epithelium (N) or pancre-atic carcinomas. The top line of gels in each panelshows ethidium bromide–stained gels beforetransfer. The number of SAGE tags observed inthe original analysis is indicated to the right of eachblot. (A) Examples of transcripts that were de-creased or increased in CR cancers. (B) Examplesof transcripts increased in pancreatic cancers(11). (C) Examples of transcripts increased in can-cer that were or were not cancer type–specific.The following probes were used for Northern blotanalysis [human SAGE tag identifier, gene productname (GenBank accession number)]: (A)H204104, guanylin (M95714); H259108 (see Ta-bles 3 and 4); H1000193 (see Tables 3 and 4);H998030 (see Tables 3 and 4). (B) H294155, RIG-E (U42376); H560056, TIMP-1 (S68252). (C)H802810, EST338411 ( W52120); H85882, 1-8D ( X57351); H618841, GA733-1 ( X13425). An addi-tional 19 examples of Northern blots are available on the Internet at http://welchlink.welch.jhu.edu/;molgen-g/home.htm.
Table 3. Transcripts decreased in CR cancer. The 20 transcripts displaying the largest decrease inexpression in CR cancers (in vivo and in vitro) are listed by fold reduction. The tag sequence representsthe 10–base pair SAGE tag, and SAGE UID is the human SAGE tag identifier. Probable GenBankmatches are listed and those in boldface were confirmed by Northern blot analysis or by cloning andsequence analysis. Fold changes in expression were calculated as described in Fig. 1. TU, colon tumors;CL, colon cell lines; NC, normal colon. Tables of all 548 differentially expressed genes are available on theInternet at http://welchlink.welch.jhu.edu/;molgen- g/home.htm.
Tag sequence SAGE UID NC/TU TU CL NC GenBank match (accession number)
GACCAGTGGC H545514 45 1 0 45 No matchATTTCAAGAT H259108 37 1 0 37 Carbonic anhydrase II (M36532)GTCATCACCA H740629 34 0 0 34 Uroguanylin (U34279)CTTATGGTCC H511670 34 1 0 34 No matchTGGAAAGTGA H950457 34 1 1 34 Human cellular oncogene c-fos
(V01512)CCTTCAAATC H390158 31 1 0 31 Carbonic anhydrase I (M33987)TCGGAGCTGT H893564 30 1 4 30 EST 261490 (H98618)GTCTGGGGGA H752297 29 1 3 29 EST 81394 ( T60135)GATCCCAACT H578824 27 1 1 27 Metallothionein from cadmium-treated
cells ( V00594)CTTAGAGGGG H510123 27 1 5 27 No matchATGATGGCAC H233106 26 0 2 26 No matchCCTGTCTGCC H388582 24 1 2 24 EST 122594 59 ( T99568)CTGGCAAAGG H500747 23 0 0 23 No matchCTTGACATAC H516402 22 0 0 22 Homo sapiens CL100 mRNA for
protein tyrosine phosphatase( X68277)
GGAAGAGCAC H657554 21 1 1 21 Gal-b (1-3/1-4)GlcNAca-2.3-sialyltransferase ( X74570)
TCTGAATTAT H909556 21 1 1 21 Transmembrane carcinoembryonicantigen BGPb ( X14831)
TAAATTGCAA H790417 19 6 1 113 Cytokeratin 20 ( X73502)GTGGGGGCGC H764570 18 1 1 18 EST 153570 59 (R48529)ATGGTGGGGG H241323 18 2 6 36 Homo sapiens zinc finger transcriptional
regulator mRNA (M92843)TCACCGGTCA H857781 17 7 7 122 Human mRNA for plasma gelsolin
( X04412)
SCIENCE z VOL. 276 z 23 MAY 1997 z www.sciencemag.org1270
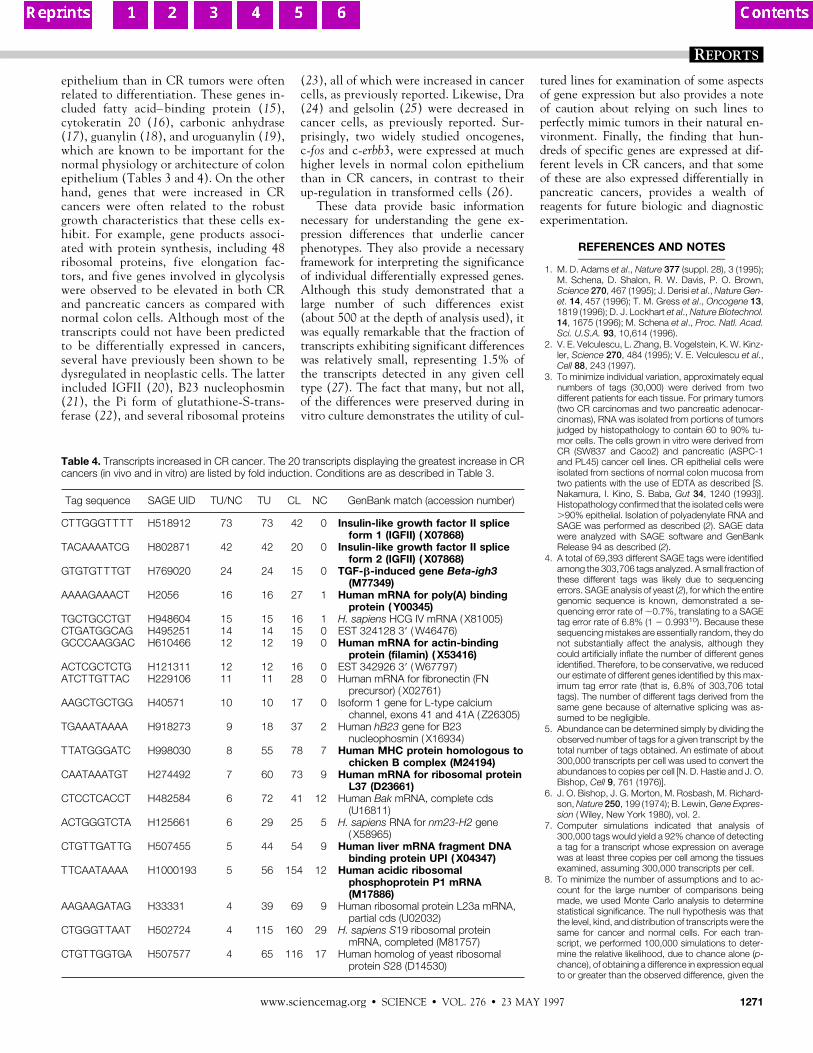
epithelium than in CR tumors were oftenrelated to differentiation. These genes in-cluded fatty acid– binding protein (15),cytokeratin 20 (16), carbonic anhydrase(17), guanylin (18), and uroguanylin (19),which are known to be important for thenormal physiology or architecture of colonepithelium (Tables 3 and 4). On the otherhand, genes that were increased in CRcancers were often related to the robustgrowth characteristics that these cells ex-hibit. For example, gene products associ-ated with protein synthesis, including 48ribosomal proteins, five elongation fac-tors, and five genes involved in glycolysiswere observed to be elevated in both CRand pancreatic cancers as compared withnormal colon cells. Although most of thetranscripts could not have been predictedto be differentially expressed in cancers,several have previously been shown to bedysregulated in neoplastic cells. The latterincluded IGFII (20), B23 nucleophosmin(21), the Pi form of glutathione-S-trans-ferase (22), and several ribosomal proteins
(23), all of which were increased in cancercells, as previously reported. Likewise, Dra(24) and gelsolin (25) were decreased incancer cells, as previously reported. Sur-prisingly, two widely studied oncogenes,c-fos and c-erbb3, were expressed at muchhigher levels in normal colon epitheliumthan in CR cancers, in contrast to theirup-regulation in transformed cells (26).
These data provide basic informationnecessary for understanding the gene ex-pression differences that underlie cancerphenotypes. They also provide a necessaryframework for interpreting the significanceof individual differentially expressed genes.Although this study demonstrated that alarge number of such differences exist(about 500 at the depth of analysis used), itwas equally remarkable that the fraction oftranscripts exhibiting significant differenceswas relatively small, representing 1.5% ofthe transcripts detected in any given celltype (27). The fact that many, but not all,of the differences were preserved during invitro culture demonstrates the utility of cul-
tured lines for examination of some aspectsof gene expression but also provides a noteof caution about relying on such lines toperfectly mimic tumors in their natural en-vironment. Finally, the finding that hun-dreds of specific genes are expressed at dif-ferent levels in CR cancers, and that someof these are also expressed differentially inpancreatic cancers, provides a wealth ofreagents for future biologic and diagnosticexperimentation.
REFERENCES AND NOTES___________________________
1. M. D. Adams et al., Nature 377 (suppl. 28), 3 (1995);M. Schena, D. Shalon, R. W. Davis, P. O. Brown,Science 270, 467 (1995); J. Derisi et al., Nature Gen-et. 14, 457 (1996); T. M. Gress et al., Oncogene 13,1819 (1996); D. J. Lockhart et al., Nature Biotechnol.14, 1675 (1996); M. Schena et al., Proc. Natl. Acad.Sci. U.S.A. 93, 10,614 (1996).
2. V. E. Velculescu, L. Zhang, B. Vogelstein, K. W. Kinz-ler, Science 270, 484 (1995); V. E. Velculescu et al.,Cell 88, 243 (1997).
3. To minimize individual variation, approximately equalnumbers of tags (30,000) were derived from twodifferent patients for each tissue. For primary tumors(two CR carcinomas and two pancreatic adenocar-cinomas), RNA was isolated from portions of tumorsjudged by histopathology to contain 60 to 90% tu-mor cells. The cells grown in vitro were derived fromCR (SW837 and Caco2) and pancreatic (ASPC-1and PL45) cancer cell lines. CR epithelial cells wereisolated from sections of normal colon mucosa fromtwo patients with the use of EDTA as described [S.Nakamura, I. Kino, S. Baba, Gut 34, 1240 (1993)].Histopathology confirmed that the isolated cells were.90% epithelial. Isolation of polyadenylate RNA andSAGE was performed as described (2). SAGE datawere analyzed with SAGE software and GenBankRelease 94 as described (2).
4. A total of 69,393 different SAGE tags were identifiedamong the 303,706 tags analyzed. A small fraction ofthese different tags was likely due to sequencingerrors. SAGE analysis of yeast (2), for which the entiregenomic sequence is known, demonstrated a se-quencing error rate of ;0.7%, translating to a SAGEtag error rate of 6.8% (1 2 0.99310). Because thesesequencing mistakes are essentially random, they donot substantially affect the analysis, although theycould artificially inflate the number of different genesidentified. Therefore, to be conservative, we reducedour estimate of different genes identified by this max-imum tag error rate (that is, 6.8% of 303,706 totaltags). The number of different tags derived from thesame gene because of alternative splicing was as-sumed to be negligible.
5. Abundance can be determined simply by dividing theobserved number of tags for a given transcript by thetotal number of tags obtained. An estimate of about300,000 transcripts per cell was used to convert theabundances to copies per cell [N. D. Hastie and J. O.Bishop, Cell 9, 761 (1976)].
6. J. O. Bishop, J. G. Morton, M. Rosbash, M. Richard-son, Nature 250, 199 (1974); B. Lewin, Gene Expres-sion ( Wiley, New York 1980), vol. 2.
7. Computer simulations indicated that analysis of300,000 tags would yield a 92% chance of detectinga tag for a transcript whose expression on averagewas at least three copies per cell among the tissuesexamined, assuming 300,000 transcripts per cell.
8. To minimize the number of assumptions and to ac-count for the large number of comparisons beingmade, we used Monte Carlo analysis to determinestatistical significance. The null hypothesis was thatthe level, kind, and distribution of transcripts were thesame for cancer and normal cells. For each tran-script, we performed 100,000 simulations to deter-mine the relative likelihood, due to chance alone (p-chance), of obtaining a difference in expression equalto or greater than the observed difference, given the
Table 4. Transcripts increased in CR cancer. The 20 transcripts displaying the greatest increase in CRcancers (in vivo and in vitro) are listed by fold induction. Conditions are as described in Table 3.
Tag sequence SAGE UID TU/NC TU CL NC GenBank match (accession number)
CTTGGGTTTT H518912 73 73 42 0 Insulin-like growth factor II spliceform 1 (IGFII) ( X07868)
TACAAAATCG H802871 42 42 20 0 Insulin-like growth factor II spliceform 2 (IGFII) ( X07868)
GTGTGTTTGT H769020 24 24 15 0 TGF-b-induced gene Beta-igh3(M77349)
AAAAGAAACT H2056 16 16 27 1 Human mRNA for poly(A) bindingprotein ( Y00345)
TGCTGCCTGT H948604 15 15 16 1 H. sapiens HCG IV mRNA ( X81005)CTGATGGCAG H495251 14 14 15 0 EST 324128 39 ( W46476)GCCCAAGGAC H610466 12 12 19 0 Human mRNA for actin-binding
protein (filamin) ( X53416)ACTCGCTCTG H121311 12 12 16 0 EST 342926 39 ( W67797)ATCTTGTTAC H229106 11 11 28 0 Human mRNA for fibronectin (FN
precursor) ( X02761)AAGCTGCTGG H40571 10 10 17 0 Isoform 1 gene for L-type calcium
channel, exons 41 and 41A ( Z26305)TGAAATAAAA H918273 9 18 37 2 Human hB23 gene for B23
nucleophosmin ( X16934)TTATGGGATC H998030 8 55 78 7 Human MHC protein homologous to
chicken B complex (M24194)CAATAAATGT H274492 7 60 73 9 Human mRNA for ribosomal protein
L37 (D23661)CTCCTCACCT H482584 6 72 41 12 Human Bak mRNA, complete cds
(U16811)ACTGGGTCTA H125661 6 29 25 5 H. sapiens RNA for nm23-H2 gene
( X58965)CTGTTGATTG H507455 5 44 54 9 Human liver mRNA fragment DNA
binding protein UPI ( X04347)TTCAATAAAA H1000193 5 56 154 12 Human acidic ribosomal
phosphoprotein P1 mRNA(M17886)
AAGAAGATAG H33331 4 39 69 9 Human ribosomal protein L23a mRNA,partial cds (U02032)
CTGGGTTAAT H502724 4 115 160 29 H. sapiens S19 ribosomal proteinmRNA, completed (M81757)
CTGTTGGTGA H507577 4 65 116 17 Human homolog of yeast ribosomalprotein S28 (D14530)
REPORTS
www.sciencemag.org z SCIENCE z VOL. 276 z 23 MAY 1997 1271
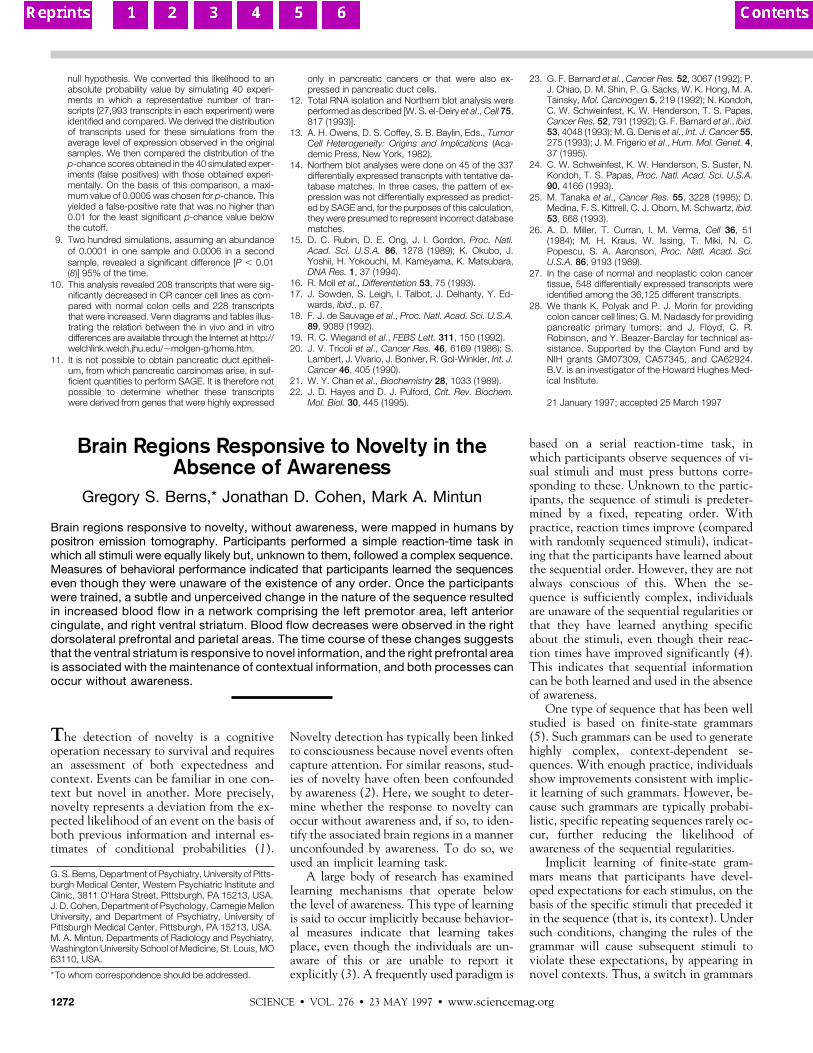
null hypothesis. We converted this likelihood to anabsolute probability value by simulating 40 experi-ments in which a representative number of tran-scripts (27,993 transcripts in each experiment) wereidentified and compared. We derived the distributionof transcripts used for these simulations from theaverage level of expression observed in the originalsamples. We then compared the distribution of thep-chance scores obtained in the 40 simulated exper-iments (false positives) with those obtained experi-mentally. On the basis of this comparison, a maxi-mum value of 0.0005 was chosen for p-chance. Thisyielded a false-positive rate that was no higher than0.01 for the least significant p-chance value belowthe cutoff.
9. Two hundred simulations, assuming an abundanceof 0.0001 in one sample and 0.0006 in a secondsample, revealed a significant difference [P , 0.01(8)] 95% of the time.
10. This analysis revealed 208 transcripts that were sig-nificantly decreased in CR cancer cell lines as com-pared with normal colon cells and 228 transcriptsthat were increased. Venn diagrams and tables illus-trating the relation between the in vivo and in vitrodifferences are available through the Internet at http://welchlink.welch.jhu.edu/;molgen-g/home.htm.
11. It is not possible to obtain pancreatic duct epitheli-um, from which pancreatic carcinomas arise, in suf-ficient quantities to perform SAGE. It is therefore notpossible to determine whether these transcriptswere derived from genes that were highly expressed
only in pancreatic cancers or that were also ex-pressed in pancreatic duct cells.
12. Total RNA isolation and Northern blot analysis wereperformed as described [W. S. el-Deiry et al., Cell 75,817 (1993)].
13. A. H. Owens, D. S. Coffey, S. B. Baylin, Eds., TumorCell Heterogeneity: Origins and Implications (Aca-demic Press, New York, 1982).
14. Northern blot analyses were done on 45 of the 337differentially expressed transcripts with tentative da-tabase matches. In three cases, the pattern of ex-pression was not differentially expressed as predict-ed by SAGE and, for the purposes of this calculation,they were presumed to represent incorrect databasematches.
15. D. C. Rubin, D. E. Ong, J. I. Gordon, Proc. Natl.Acad. Sci. U.S.A. 86, 1278 (1989); K. Okubo, J.Yoshii, H. Yokouchi, M. Kameyama, K. Matsubara,DNA Res. 1, 37 (1994).
16. R. Moll et al., Differentiation 53, 75 (1993).17. J. Sowden, S. Leigh, I. Talbot, J. Delhanty, Y. Ed-
wards, ibid., p. 67.18. F. J. de Sauvage et al., Proc. Natl. Acad. Sci. U.S.A.
89, 9089 (1992).19. R. C. Wiegand et al., FEBS Lett. 311, 150 (1992).20. J. V. Tricoli et al., Cancer Res. 46, 6169 (1986); S.
Lambert, J. Vivario, J. Boniver, R. Gol-Winkler, Int. J.Cancer 46, 405 (1990).
21. W. Y. Chan et al., Biochemistry 28, 1033 (1989).22. J. D. Hayes and D. J. Pulford, Crit. Rev. Biochem.
Mol. Biol. 30, 445 (1995).
23. G. F. Barnard et al., Cancer Res. 52, 3067 (1992); P.J. Chiao, D. M. Shin, P. G. Sacks, W. K. Hong, M. A.Tainsky, Mol. Carcinogen 5, 219 (1992); N. Kondoh,C. W. Schweinfest, K. W. Henderson, T. S. Papas,Cancer Res. 52, 791 (1992); G. F. Barnard et al., ibid.53, 4048 (1993); M. G. Denis et al., Int. J. Cancer 55,275 (1993); J. M. Frigerio et al., Hum. Mol. Genet. 4,37 (1995).
24. C. W. Schweinfest, K. W. Henderson, S. Suster, N.Kondoh, T. S. Papas, Proc. Natl. Acad. Sci. U.S.A.90, 4166 (1993).
25. M. Tanaka et al., Cancer Res. 55, 3228 (1995); D.Medina, F. S. Kittrell, C. J. Oborn, M. Schwartz, ibid.53, 668 (1993).
26. A. D. Miller, T. Curran, I. M. Verma, Cell 36, 51(1984); M. H. Kraus, W. Issing, T. Miki, N. C.Popescu, S. A. Aaronson, Proc. Natl. Acad. Sci.U.S.A. 86, 9193 (1989).
27. In the case of normal and neoplastic colon cancertissue, 548 differentially expressed transcripts wereidentified among the 36,125 different transcripts.
28. We thank K. Polyak and P. J. Morin for providingcolon cancer cell lines; G. M. Nadasdy for providingpancreatic primary tumors; and J. Floyd, C. R.Robinson, and Y. Beazer-Barclay for technical as-sistance. Supported by the Clayton Fund and byNIH grants GM07309, CA57345, and CA62924.B.V. is an investigator of the Howard Hughes Med-ical Institute.
21 January 1997; accepted 25 March 1997
Brain Regions Responsive to Novelty in theAbsence of Awareness
Gregory S. Berns,* Jonathan D. Cohen, Mark A. Mintun
Brain regions responsive to novelty, without awareness, were mapped in humans bypositron emission tomography. Participants performed a simple reaction-time task inwhich all stimuli were equally likely but, unknown to them, followed a complex sequence.Measures of behavioral performance indicated that participants learned the sequenceseven though they were unaware of the existence of any order. Once the participantswere trained, a subtle and unperceived change in the nature of the sequence resultedin increased blood flow in a network comprising the left premotor area, left anteriorcingulate, and right ventral striatum. Blood flow decreases were observed in the rightdorsolateral prefrontal and parietal areas. The time course of these changes suggeststhat the ventral striatum is responsive to novel information, and the right prefrontal areais associated with the maintenance of contextual information, and both processes canoccur without awareness.
The detection of novelty is a cognitiveoperation necessary to survival and requiresan assessment of both expectedness andcontext. Events can be familiar in one con-text but novel in another. More precisely,novelty represents a deviation from the ex-pected likelihood of an event on the basis ofboth previous information and internal es-timates of conditional probabilities (1).
Novelty detection has typically been linkedto consciousness because novel events oftencapture attention. For similar reasons, stud-ies of novelty have often been confoundedby awareness (2). Here, we sought to deter-mine whether the response to novelty canoccur without awareness and, if so, to iden-tify the associated brain regions in a mannerunconfounded by awareness. To do so, weused an implicit learning task.
A large body of research has examinedlearning mechanisms that operate belowthe level of awareness. This type of learningis said to occur implicitly because behavior-al measures indicate that learning takesplace, even though the individuals are un-aware of this or are unable to report itexplicitly (3). A frequently used paradigm is
based on a serial reaction-time task, inwhich participants observe sequences of vi-sual stimuli and must press buttons corre-sponding to these. Unknown to the partic-ipants, the sequence of stimuli is predeter-mined by a fixed, repeating order. Withpractice, reaction times improve (comparedwith randomly sequenced stimuli), indicat-ing that the participants have learned aboutthe sequential order. However, they are notalways conscious of this. When the se-quence is sufficiently complex, individualsare unaware of the sequential regularities orthat they have learned anything specificabout the stimuli, even though their reac-tion times have improved significantly (4).This indicates that sequential informationcan be both learned and used in the absenceof awareness.
One type of sequence that has been wellstudied is based on finite-state grammars(5). Such grammars can be used to generatehighly complex, context-dependent se-quences. With enough practice, individualsshow improvements consistent with implic-it learning of such grammars. However, be-cause such grammars are typically probabi-listic, specific repeating sequences rarely oc-cur, further reducing the likelihood ofawareness of the sequential regularities.
Implicit learning of finite-state gram-mars means that participants have devel-oped expectations for each stimulus, on thebasis of the specific stimuli that preceded itin the sequence (that is, its context). Undersuch conditions, changing the rules of thegrammar will cause subsequent stimuli toviolate these expectations, by appearing innovel contexts. Thus, a switch in grammars
G. S. Berns, Department of Psychiatry, University of Pitts-burgh Medical Center, Western Psychiatric Institute andClinic, 3811 O’Hara Street, Pittsburgh, PA 15213, USA.J. D. Cohen, Department of Psychology, Carnegie MellonUniversity, and Department of Psychiatry, University ofPittsburgh Medical Center, Pittsburgh, PA 15213, USA.M. A. Mintun, Departments of Radiology and Psychiatry,Washington University School of Medicine, St. Louis, MO63110, USA.
*To whom correspondence should be addressed.
SCIENCE z VOL. 276 z 23 MAY 1997 z www.sciencemag.org1272