Gainful Utilization of Limestone (Kota stone) Waste as ...
178
Gainful Utilization of Limestone (Kota stone) Waste as Pavement Material. Ph.D. Thesis Pradeep Kumar Gautam 2014RCE9037 DEPARTMENT OF CIVIL ENGINEERING MALAVIYA NATIONAL INSTITUTE OF TECHNOLOGY JAIPUR January 2019
Transcript of Gainful Utilization of Limestone (Kota stone) Waste as ...

Gainful Utilization of Limestone (Kota stone) Waste as
Pavement Material.
Ph.D. Thesis
Pradeep Kumar Gautam
2014RCE9037
DEPARTMENT OF CIVIL ENGINEERING
MALAVIYA NATIONAL INSTITUTE OF TECHNOLOGY JAIPUR
January 2019

Gainful Utilization of Limestone (Kota stone) Waste as
Pavement Material.
Submitted in
fulfillment of the requirements for the degree of
Doctor of Philosophy
by
Pradeep Kumar Gautam
ID: 2014RCE9037
Under Supervision of
Dr. Pawan Kalla
Dr. Ajay Singh Jethoo
DEPARTMENT OF CIVIL ENGINEERING
MALAVIYA NATIONAL INSTITUTE OF TECHNOLOGY JAIPUR
January 2019

© Malaviya National Institute of Technology Jaipur - 2019.
All rights reserved.

i
DECLARATION
I, Pradeep Kumar Gautam, declare that this thesis titled, “Gainful Utilization of
Limestone (Kota stone) waste as pavement material.” and the work presented in it, are
my own. I confirm that:
This work was done wholly or mainly while in candidature for a research
degree at this university.
Where any part of this thesis has previously been submitted for a degree or
any other qualification at this university or any other institution, this has been
clearly stated.
Where I have consulted the published work of others, this is always clearly
attributed.
Where I have quoted from the work of others, the source is always given.
With the exception of such quotations, this thesis is entirely my own work.
I have acknowledged all main sources of help.
Where the thesis is based on work done by myself, jointly with others, I have
made clear exactly what was done by others and what I have contributed
myself.
Date: 8-Jan-2019
Pradeep Kumar Gautam
Student ID: 2014RCE9037

ii
CERTIFICATE
This is to certify that the thesis report entitled “Gainful Utilization of Limestone
(Kota Stone) Waste as Pavement Material” which is being submitted by Pradeep
Kumar Gautam, ID: 2014RCE9037, for partial fulfillment of the degree of Doctor
of Philosophy in Civil Engineering to the Malaviya National Institute of Technology
Jaipur, has been carried out by him under my supervision and guidance. I consider it
worthy of consideration for the award of the degree of Doctor of Philosophy of the
institute.
Dr Pawan Kalla
(Supervisor)
Dr Ajay Singh Jethoo
(Supervisor)

iii
ACKNOWLEDGEMENT
I would like to express my deepest sincere and heartfelt gratitude to my
supervisors and mentor, Dr. Pawan Kalla, Associate Professor, Department of Civil
Engineering, Malaviya National Institute of Technology, Jaipur and Dr. Ajay Singh
Jethoo, Professor, Department of Civil Engineering, Malaviya National Institute of
Technology, Jaipur for their guidance, advice, criticism, encouragement and insight
throughout the course of research work. From their busy schedule, they always spared
time for assessing and critically evaluating the progress of my work. Their wide
knowledge helped me in writing this thesis. I am indebted for the kind help and
support which made it possible for me to stand up to the challenge offered by the task
and come out successfully. I would also like to thank DPGC and DREC committee
member, Prof. Urmila Bhrigu ,Prof. B.L. Swami, Prof. A.K. Vyas and Prof. S.K.
Tiwari for their insightful comments, criticism and guidance during course of the
study.
I am also thankful to Prof. Ravindra Nagar, Prof. Gunwant Sharma, Prof. Y.P. Mathur,
Prof. A.B. Gupta, Prof. Sudhir Kumar, Prof. Rohit Goyal, Prof. Mahesh Jat, , Dr.
Sandeep Shrivastava, Dr. Vinay Agrawal, Dr. Arun Gaur, Dr. J.K. Jain, Prof. Rajesh
Gupta, Dr. M.K. Shrimali, Dr. S.D. Bharti (Department of Civil Engineering, MNIT
Jaipur) for their valuable guidance, help and unfailing encouragement during the
course of the work. I am extremely grateful to Prof. Satish Chandra, Director, CRRI
Delhi, Dr. K. Sitaramanjaneyuly, Scientist, CRRI Delhi and Mr. Sampath Kumar
Pasupunuri, Scientist, CRRI Delhi for their help, support and guidance during the
experimental investigation at their institute.
My earnest thanks to all staff and administration at the institute for their help,
support and co-operation throughout the course of the study. I would like to thanks
Mr. Rajesh Saxena, Office in Charge, Civil Engineering Department, MNIT Jaipur
whose generous help in academic related activities has been instrumental. I would like
to thanks Mr.Ramjilal ji, Mr. Pukhraj, Anil Sharma and Mr. Nitesh and Mr. Sapan
Gaur for their help, guidance and providing research environment and providing me
space to carry out my research work.

iv
I am particularly in debt to my seniors, friends and batch mates especially
Sudeep Chatterji, Prashant Singh, Sushindra Kumar Gupta, Dr. Aditya Rana, Dr.
Sarabjit Singh, Harshwardhan Singh Chauhan, Lalit Kumar Gupta, Sayed Ahmed
Kabir, Chethana Ramachandra, Sumit Choudhary, Mayank Misra, Abhishek Kumar,
Rahul Shukla, Moiz Usmani, Aman Jain, Ankur Baruah, Navdeep Dhiryan, Yashu
Sharma, Vishant, Ankit Uniyal, Yogendra Mahvar, Rahul Agrawal, Sanjay Alaria,
Gaurav Singhal, Pravesh Saini, Pawan Patidar for inevitable help, support and
motivation to complete this research work successfully.
From bottom of my heart I would like to thanks my mother Mrs. Shakuntla
Devi, for always believing in me and heartening me, my father Mr. Narendra Pal for
motivating at every step and providing every necessary comfort, and my brother
Naveen Kumar Gautam and my sister Leena Gautam who too encouraged me to move
forward with positive attitude throughout the duration of project.
Lastly, I would like to thank almighty God for enriching my life with so
wonderful person without their support and guidance I would not be able to complete
this project work successfully.
Sincerely,
Pradeep Kumar Gautam.

v
ABSTRACT
Sustainability in pavement construction has become an emerging topic around
the globe. This is because construction of roads requiresvast quantity of quality
aggregates which are obtained via mining. This is a highly unsustainable process as
extraction of these aggregates include activities like drilling, blasting, crushing and
transportation, which causes air, water, and noise pollution. Also, unplanned disposal
of mining waste leads to natural imbalance most prominent among which are
migration of species, destruction of natural habitat of birds and animals, loss of land
fertility, genesis of various respiratory diseases. Scientific interest in finding potential
methods by which construction of roads and highways can be made environment-
friendly whilst maintaining their structural integrity and reducing construction cost
have increased in last decade. Studies have been conducted where use of locally
produced quarry waste has been used successfully as construction and building
material. These studies establish the fact that the majority of quarry waste generated
has potential to be used as pavement material.
In the recent past, Kota Stone mining Waste has emerged as a severe threat to
the biodiversity of Kota and Jhalawar district of Rajasthan. The genesis of this waste
is in the form of boulders, stone chips and slurry, produced during activities like in
situ mining, cutting and polishing. Piles of Kota stone waste stretching kilometres is
a common site in the area of its origin. This has created a nuisance for residents, mine
owners, workers, and nearby flora and fauna. Respiratory diseases like silicosis are
common among residents mining sites. The unmanaged, unplanned dumping of slurry
waste has polluted the localecosystem by intermixing with nearby soil and degrading
the fertility of the agricultural land. To control the situation, government agencies
have imposed tight environmental control policies over opening of new quarries and
imposed fines on mine owners; thishave little to no effect on the situationas no
solution has been suggested for already accumulatedmassivewaste in the area. The
scarcity and restriction of dumping land have resulted in increasing hauling distance,
adding to transportation cost and exacerbate pollution. This situation demands
concrete steps to utilize the accumulated waste.
Previous studies available suggest mining and processing waste of stones such
as marble, granitehavepotential to be used as construction and maintenance material.

vi
In the present study, an attempt has been made to utilize the waste generated in various
stageslike mining, cutting, and polishing in different layer of flexible pavement. For
the present study, Kota stone slurry (KSS) and Kota stone aggregate (KSA) were
evaluated on physical and chemical properties. Ten soil samples were evaluated
prepared by replacing black cotton soil (BCS) with KSS between 2.5- 20%. KSA was
evaluated as granular sub-base and bituminous course material. Six Granular Sub-
base (GSB) mixes and fifteen hot mixes were examined. Kota stone aggregate were
evaluated as non-bituminous (GSB) and bituminous material (Dense bituminous
macadam, Bituminous concrete and Open-graded friction course) on the basis of
mechanical and durability properties of mixes such as Marshall quotient, indirect
tensile strength test, tensile strength ratio, resilient modulus , dynamic creep,
Cantabro, aged Cantabro, permeability and drain down test. Kota stone slurry was
found suitable as soil stabilizer when replaced in black cotton soil between 17.5-19%.
Study also finds suitability of KSA (up to 25-50%) in hot mix asphalt.

vii
CONTENTS
Declaration ................................................................................................................... i
Certificate .................................................................................................................... ii
Acknowledgement ................................................................................................. iii-iv
Abstract ................................................................................................................... v-vi
Contents ................................................................................................................ vii-ix
List of Tables ............................................................................................................. xi
List of Figures ..................................................................................................... xii-xiv
Abbreviations ...................................................................................................... xv-xvi
CHAPTER-1: INTRODUCTION ............................................................................ 1
1.1. Geographical Setting of the Study Area .......................................................... 1
1.2. Kota Stone: Occurrence ................................................................................... 2
1.3. Problem Genesis: Quarrying, Cutting and Polishing of Kota Stone ................ 5
1.4. Waste Production and Characterization ........................................................... 8
1.5. Environmental Concern ................................................................................... 8
1.6. Measure adopted by Government and Agencies. ............................................ 9
1.7. Research Gaps ................................................................................................ 14
1.8 Aim of the study............................................................................................. 14
1.9 Thesis Organization ............................... …....................................................15
CHAPTER-2: LITERATURE REVIEW .............................................................. 16
2.1 Significance.................................................................................................... 16
2.2 Methodology .................................................................................................. 16
I) Flexible pavement layer and possible use of waste ........................... 16
a) Use of Waste in the Stabilization of Soil Subgrade ............... 16
b) Use of Limestone Waste with Other Waste ........................... 39
c) In base and Surface Course (Bituminous) ............................. 45
II) Use of Kota Stone as Construction Material...................................... 52
a) In Manufacturing of High Strength Binder ............................ 52
b) In Manufacturing of High Strength Bricks ............................ 52
c) In Cement Concrete ............................................................... 52
d) As Stabilizing Material for Black Cotton Soil. ...................... 53
e) As Aggregates in Flexible Pavement. .................................... 54
viii
f) As Binding Material in Mortar Mixes ................................... 54
g) As Carbonate Source in Production of Ternary Cement ....... 55
2.3 Summary of Literature Review. ..................................................................... 55
CHAPTER-3: EXPERIMENTAL PROGRAMME ............................................. 59
3.1 Soil Subgrade : Experimental Investigation and Sample Preparation ........... 59
a) Chemical Analysis ............................................................................. 59
b) Sieve Analysis .................................................................................... 59
c) Atterberg limit .................................................................................... 60
d) Optimum Moisture Content and Maximum Dry Density. ................. 60
e) California Bearing Ratio (CBR) Test ................................................ 61
f) Resilient Modulus .............................................................................. 62
g) Unconfined Compressive Strength Test ............................................ 62
h) Free Swell Index ................................................................................ 63
i) Sample preparation and Nomenclature .............................................. 64
3.2 Granular Sub-base: Experimental Investigation and Sample Preparation ..... 64
a) Physical Property Test for Aggregates ...................................................... 64
1. Los Angeles Test............................................................................ 65
2. Impact Test..................................................................................... 65
3. Water Absorption and Specific Gravity Test ................................. 65
4. Shape Test ...................................................................................... 66
5. Stripping Test ................................................................................. 66
3.3 Base Course/ Surface Course: Experimental Investigation and
Sample Preparation ........................................................................................ 67
I) Bituminous Concrete and Dense Bituminous Macadam ................... 67
II) Open-Graded Friction Course ............................................................ 67
a) Marshall design mix and Properties Test ........................................... 69
b) Indirect Tensile Strength Test ............................................................ 70
c) Tensile Strength Ratio........................................................................ 72
d) Scanning Electron Microscopic Analysis (SEM). ............................. 73
e) Dynamic Creep Test .......................................................................... 74
f) Resilient Modulus Test ...................................................................... 77
g) Cantabro Test ..................................................................................... 78
h) Falling Head Permeability Test. ........................................................ 79

ix
i) Draindown Test .................................................................................. 80
3.4 Binder ............................................................................................................ 81
a) Penetration Test ................................................................................. 81
b) Softening Point Test ........................................................................... 81
c) Flash and Fire Point Test ................................................................... 81
d) Specific Gravity ................................................................................. 82
CHAPTER-4: RESULT AND DISCUSSION ....................................................... 83
4.1 Kota Stone Slurry and Aggregates as Pavement Material ............................. 83
4.2 Soil and Slurry Properties .............................................................................. 83
a) Gradation............................................................................................ 84
4.2.1 Black Cotton Soil- Kota Stone Slurry Mixes ......................... 85
a) Index Properties ......................................................... 85
b) Optimum Moisture Content and Maximum Dry
Density. ...................................................................... 86
c) California Bearing Ratio ............................................ 87
d) Resilient Modulus ...................................................... 88
e) Unconfined Compressive Strength Test .................... 89
f) Free Swell Index ........................................................ 92
g) Scanning Electron Microscope Analysis ................... 92
4.3 As Aggregate Material in Granular Sub-Base Course. .................................. 94
a) Optimum Moisture Content and Maximum Dry Density .................. 96
b) California Bearing Ratio .................................................................... 96
4.4 As Aggregates in Base Course/Wearing Course ........................................... 97
I. Bituminous Concrete ......................................................................... 98
a) Gradation and Marshall Test Results ..................................... 98
b) Indirect Tensile Strength and Tensile Strength Ratio .......... 100
c) Dynamic Creep Test ............................................................ 104
d) Resilient Modulus Test ........................................................ 105
II. Dense Bituminous Macadam ........................................................... 106
a) Gradation and Marshall Test Results ................................... 106
b) Indirect Tensile Strength and Tensile Strength Ratio .......... 107
c) Dynamic Creep Test ............................................................ 111
d) Resilient Modulus ................................................................ 112

x
III. Open Graded Friction Course .......................................................... 113
a) Gradation and Marshall Test Parameters ............................. 113
b) Indirect Tensile Strength and Tensile Strength Ratio .......... 114
c) Cantabro Test ....................................................................... 115
d) Falling Head Permeability Test ........................................... 116
e) Draindown Test .................................................................... 117
f) Dynamic Creep Test ............................................................ 120
g) Resilient Modulus Test. ....................................................... 121
CHAPTER-5: CONCLUSION AND RECOMMENDATIONS ........................ 122
REFERENCES ....................................................................................................... 124
LIST OF PUBLICATION FROM THESIS ........................................................ 139
APPENDIX ............................................................................................................. 144
CURRICULUM VITAE OF AUTHOR .............................................................. 159

xi
LIST OF TABLES
Table 1.1: Area wise Kota Stone Reserve ................................................................. 3
Table 2.1: Mineral Composition of Various Material. ............................................ 31
Table 2.2: Summary of Research on Subgrade Stabilization by Stone Waste... ..... 32
Table 2.3: Summary of Research on Use of Waste as Sub-Base and Base
(Non-Bituminous) Material. ................................................................... 44
Table 2.4 Summary of Research on Use of Stone Waste in HMA. ....................... 50
Table 2.5: Property Analysis for Soil Subgrade. ..................................................... 57
Table 2.6: Physical Properties Test for Aggregates. ............................................... 57
Table 2.7: Test and Codes Followed to Evaluate HMA Mixes. .............................. 58
Table 3.1: Nomenclature Adopted ........................................................................... 68
Table 3.2: Parameters Used for Dynamic Creep Test. ............................................ 75
Table 3.3: Resilient Modulus Test Parameters. ....................................................... 78
Table 4.1: Properties of Black Cotton Soil and Kota Stone Slurry. ........................ 83
Table 4.2: Chemical Composition of Black Cotton Soil and Kota Stone. .............. 84
Table 4.3: Aggregate Property Test Results. ........................................................... 99
Table 4.4: KSA Gradation with Recommended Limits .......................................... 95
Table 4.5: Binder Properties of VG-30 and CRMB-60 Bitumen. ........................... 98
Table 4.6: Marshall Parameters at Respective OBC ............................................. 100
Table 4.7: Percentage Actuator Strain Value for BC Mixes ................................. 104
Table 4.8: Marshall Test Results of DBM Mixes .................................................. 107
Table 4.9: Percentage Actuator Strain Value for DBM mixes. ............................. 111
Table 4.10: Marshall Test Results for OGFC Samples. .......................................... 113
Table 4.11: Drain down Test Result. ....................................................................... 117
Table 4.12: Percentage actuator strain value for OGFC mixes. .............................. 120

xii
LIST OF FIGURES
Figure 1.1: Location of Kota, Rajasthan, India ......................................................... 4
Figure 1.2: Use of Kota stone in Stairs for Decorative Purpose
(Source: Civillane.com) .......................................................................... 4
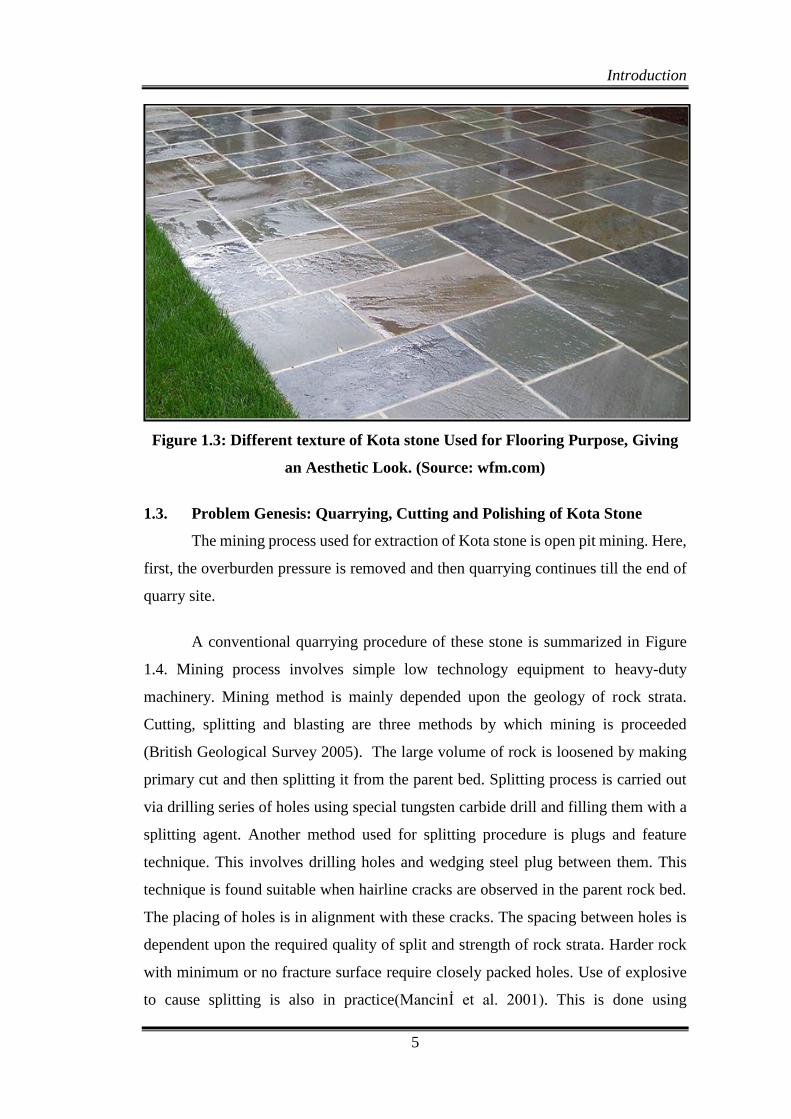
Figure 1.3: Different texture of Kota stone Used for Flooring Purpose, Giving
An Aesthetic Look. (Source: wfm.com) ................................................. 5
Figure 1.4: Flow Diagram for Quarry Operation. ..................................................... 7
Figure 1.5: Flow diagram for Cutting and Polishing Procedure. .............................. 7
Figure 1.6: Exhaustive Kota Stone Mining and in the Background, Piles of
Waste Generated During the Mining Process. ...................................... 11
Figure 1.7: Ariel View Showing the Extent of Cutting and Slurry Waste and
Contamination of Water Source............................................................ 11
Figure 1.8: (a) and (b): Accumulated Waste Generated During Quarrying and
Polishing Activities. .............................................................................. 12
Figure 1.9: (a) and (b): Disposal Problem Due to Cutting and Polishing Waste of
Kota Stone ............................................................................................. 13
Figure 3.1: Liquid Limit and Plastic Limit Testing ................................................. 60
Figure 3.2: CBR Sample Before and After Testing ................................................ 61
Figure 3.3: UCS Testing Setup ................................................................................ 63
Figure 3.4: Free Swell Index Test ........................................................................... 64
Figure 3.5: Load Action on ITS Test. (Zaniewski & Srinivasan 2004). ................. 71
Figure 3.6: Laboratory Test Setup for the Indirect Tensile Strength Test............... 71
Figure 3.7: Wax Coated OGFC Samples. ............................................................... 72
Figure 3.8: SEM Equipment and Thin Film Coating Machine. .............................. 73
Figure 3.9: Typical strain vs. load cycle graph obtained in dynamic creep test.
(Baghaee Moghaddam et al. 2014) ....................................................... 75
Figure 3.10: Dynamic Creep Testing Assembly. ...................................................... 76
Figure 3.11: Loading Assembly in Dynamic Creep Test. ......................................... 76
Figure 3.12: Resilient Modulus Test Assembly. ....................................................... 78
Figure 3.13: Falling Head Permeability Test Setup for OGFC. ................................ 80
Figure 4.1: Gradation of Soil and Slurry Particles. ................................................. 84
Figure 4.2: Particle Size Distribution (finer than 75 micron) of Black

xiii
Cotton Soil. ........................................................................................... 85
Figure 4.3: Particle Size Distribution (finer than 75 micron) of Kota
Stone Slurry. ......................................................................................... 85
Figure 4.4: BCS-KSS Atterberg Limits................................................................... 86
Figure 4.5: BCS-KSS OMC and MDD ................................................................... 87
Figure 4.6: BCS-KSS CBR ..................................................................................... 88
Figure 4.7: BCS-KSS Resilient Modulus. ............................................................... 89
Figure 4.8: Dry and Wet UCS of BCS-KSS............................................................ 90
Figure 4.9: Stress-Strain of BCS-KSS in Dry-UCS. ............................................... 90
Figure 4.10: Stress-Strain of BCS-KSS in Wet-UCS ................................................ 91
Figure 4.11: BCS-KSS Free Swell Index. ................................................................. 92
Figure 4.12: (a-e) SEM images of BCS-KSS Samples ............................................. 93
Figure 4.13: Texture Difference of Kota Stone Aggregates (left) as Compared to
Conventional Aggregate (right) ............................................................ 94
Figure 4.14: OMC and MDD of GSB mixes ............................................................. 96
Figure 4.15: Soaked CBR of GSB mixes................................................................... 97
Figure 4.16: Gradation Curve for BC Mix ................................................................. 99
Figure 4.17: ITS of BC Mixes ................................................................................. 101
Figure 4.18: Tensile Strength Ratio Values for BC Mixes. ..................................... 101
Figure 4.19: SEM images of C-bc, 25K-bc, 50K-bc, 75K-bc, 100K-bc ................. 103
Figure 4.20: Dynamic Creep Test Result for BC Mixes ......................................... 104
Figure 4.21: Flow Number Results for BC Mixes. ................................................. 105
Figure 4.22: Resilient Modulus Results of BC Mixes. ............................................ 105
Figure 4.23: Gradation Curve for DBM Mixes ....................................................... 106
Figure 4.24: Dry and Wet ITS Values for DBM Mixes. ......................................... 107
Figure 4.25: Tensile Strength Ratio Values for DBM Mixes. ................................. 108
Figure 4.26: SEM Image Showing Cracks on KSA Aggregates. ............................ 109
Figure 4.27: SEM Images of C-dbm, 25K-dbm, 50K-dbm, 75K-dbm,100K-dbm . 110
Figure 4.28: Dynamic Creep Result for DBM Mixes. ............................................ 111
Figure 4.29: Flow Number Results for DBM Mixes. .............................................. 112
Figure 4.30: Resilient Modulus Results of DBM Mixes. ........................................ 112
Figure 4.31: Gradation Curve for OGFC Mixes. ..................................................... 113
Figure 4.32: Dry and Wet ITS values for OGFC Mixes. ........................................ 114

xiv
Figure 4.33: Tensile Strength Ratio of OGFC Mixes.............................................. 115
Figure 4.34: Aged and Unaged Cantabro Loss Test Results. .................................. 116
Figure 4.35: Falling Head Permeability Test Results for OGFC Samples. ............. 116
Figure 4.36: SEM Image of C-ogfc, 25K-ogfc, 50K-ogfc, 75K-ogfc,100K-ogfc... 118
Figure 4.37: (a-c): SEM Images of OGFC Samples ................................................ 119
Figure 4.38: Dynamic Creep Test Results for OGFC Mixes. ................................. 120
Figure 4.39: Flow Number Results of OGFC Mixes. ............................................. 121
Figure 4.40: Resilient Modulus Results of OGFC Mixes. ...................................... 121
xv
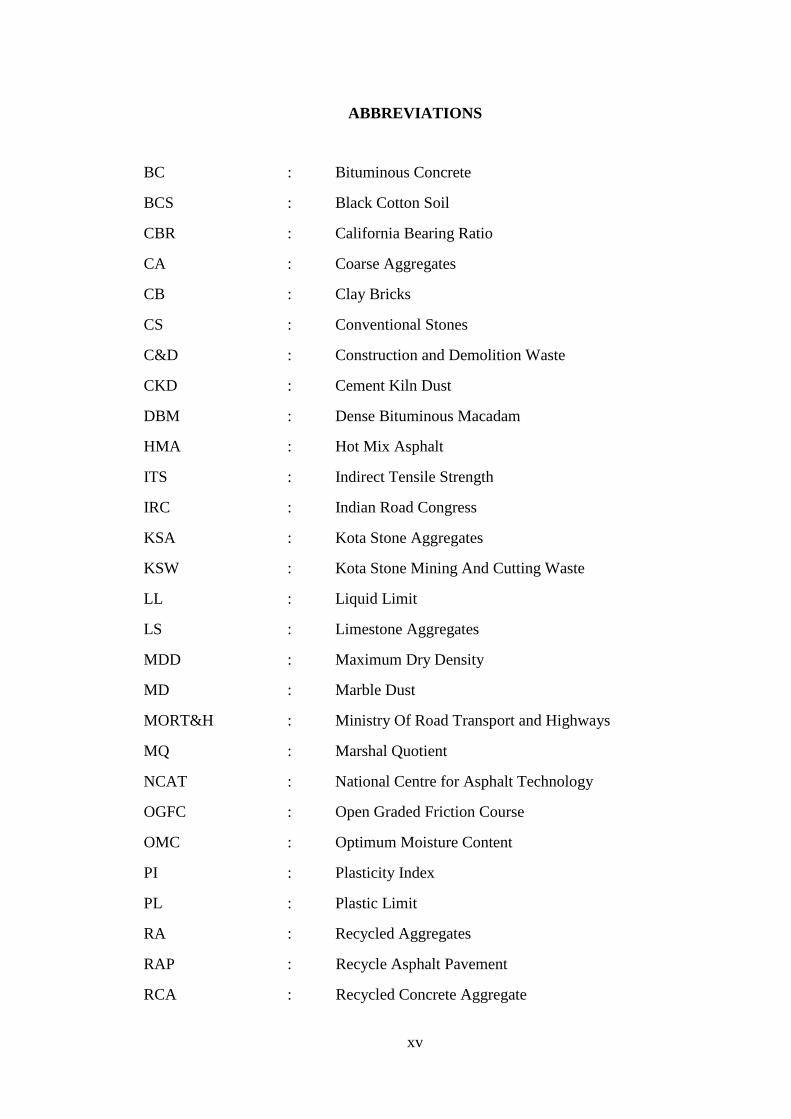
ABBREVIATIONS
BC : Bituminous Concrete
BCS : Black Cotton Soil
CBR : California Bearing Ratio
CA : Coarse Aggregates
CB : Clay Bricks
CS : Conventional Stones
C&D : Construction and Demolition Waste
CKD : Cement Kiln Dust
DBM : Dense Bituminous Macadam
HMA : Hot Mix Asphalt
ITS : Indirect Tensile Strength
IRC : Indian Road Congress
KSA : Kota Stone Aggregates
KSW : Kota Stone Mining And Cutting Waste
LL : Liquid Limit
LS : Limestone Aggregates
MDD : Maximum Dry Density
MD : Marble Dust
MORT&H : Ministry Of Road Transport and Highways
MQ : Marshal Quotient
NCAT : National Centre for Asphalt Technology
OGFC : Open Graded Friction Course
OMC : Optimum Moisture Content
PI : Plasticity Index
PL : Plastic Limit
RA : Recycled Aggregates
RAP : Recycle Asphalt Pavement
RCA : Recycled Concrete Aggregate

xvi
RHA : Rice husk ash
SEM : Scanning Electron Microscopy
UCS : Unconfined compressive strength
TSR : Tensile strength ratio
TI : Toughness index
VFB : Void filled with bitumen
VMA : Voids in mineral aggregates

1
CHAPTER-1
INTRODUCTION
India is one of the fastest growing economies in the world and has one of the
largest road networks in the world (PRS India legislative research 2018). About 6604
km of national highways were constructed in the year 2016-17 alone, and as part of
its infrastructure reforms, Government of India is aiming to construct around a total
of 84,000 km of national highways around the country(Government of India 2018).
Since natural aggregate contributes to more than 90% by weight of pavement, it is
evident that excavation and consumption of natural stone like basalt, andesite, and
limestone will increase exponentially. The present rate of mining and processing of
these stone is already having a negative impact on environment, and the consistent
rise in the demand of these natural aggregates make this situation more unsustainable.
On one side, extraction of these natural resources is leading towards their rapid
depletion, and on another side, an enormous quantity of these extracted materials are
discarded as waste. Despite all these impacts, construction of highways can’t be
restricted as they play a significant role in the development of a nation. Therefore, it
is vital to search for an alternative which can provide a sustainable aspect by reducing
consumption of natural resources, easing landfill pressure whilst maintaining the
structural integrity of pavement structure.
1.1. Geographical Setting of the Study Area
India has a vast reserve of dimensional limestone like granite, marble,
quartzite, slate, limestone, etc. It ranks 3rd in world stone export, sharing about 12%
of the global share market. Production wise, it ranks 1st in the production of raw
siliceous product like granite and sandstone and 5th in raw calcareous product, i.e.
marble and flaggy limestone. Globally it has emerged 9th largest exporter of finished
stone products. Needless to say, that dimensional stones have become a significant
economic commodity for India. It is estimated that India has about 27% of world’s
stone reserve (Trade Articles - Indian Stone Industry), out of which majority is found
in the Rajasthan state of India.

Introduction
2
Rajasthan is located in northwestern part of India, covering an area of about
3,42,249 square kilometers, thus making it area wise largest state of the country. The
land is bounded between 23°03'-30°12' N and Longitude 69°29'-78°17'E,
encompassing 33 districts. Geologically speaking, its rocks range from one of the
oldest (more than 3500 million years) to recent, displaying diversity in mineral deposit
(Mineral Report, Government of Rajasthan 2015). Every part of this state is enriched
with a variety of metallic and non-metallic minerals. The state is immediately
identified with inexhaustible reserves of various building and ornamental stones. It
holds a monopoly on the production of wallosnite, emerald, jasper, semi-precious
garnet and is a leading producer of various highly popular building materials like
marble, granite, sandstone, Kotastone etc.(Report, Geological Survey of India 2011).
Some of the significant sources of excellent quality limestone are mined from areas
of Makrana, Rajnagar, Rikhabdev, Ajmer, Andhi, and Bhaislana areas. Morwar, in
Rajmand district of Rajasthan,holds a Guinness world record for largest extraction of
block slabs of white marble (300,000 metric tons per year). Makrana Marble which
has been used in world-famous structures like Taj Mehal in Agra and Victoria
Memorial in Kolkata has its origin in this state only. Granite, another excellent quality
dimensional limestone stone, identified by its hard and durable surface accompanied
by enthralling colours and texture, is used commercially in tiles, slabs and in
monumental structures around the world. In Rajasthan, it is found in Ajmer, Alwar,
Banswara, Barmer, Bhilwara, Chittaurgarh, Dungarpur, Jaipur, Jaisalmer, Jalor,
Jhunjhunun, Jodhpur, Nagaur, Pali, Rajsamand, Sawai Madhopur, Sikar, Sirohi, Tonk
and Udaipur districts. Because of its unique geology, Rajasthan is also the home to
some exclusive building materials among which most famous is Kota Stone.
1.2. Kota Stone: Occurrence
Kota stone is dimensional limestone found in the upper Vindhya region of
Kota and Jhalawar district of Rajasthan, India. Deposit of this stone is located in
between latitudes N 24°32’ and N 24°48’ and longitudes E 75°50’ and E 76°05’,
covering an area of about 150 square kilometres, with a cumulative reserve of
approximately 100 million tons . It is quarried in Ramjang Mandi, Chechat, Suket,
Manpura, Morak, Mur-ka-Khere in Kota district and near Aroutiya, Paroliya and
Kishanpura in Jhalawar district of Rajasthan, India as shown in Figure 1.1. The
quantitative distribution is summarized in Table 1.1. The viable limestone beds

Introduction
3
manageable to splitting are located at a depth range from 15.0 meters to 25.0 meters
from the ground surface and form part of anticlinal- synclinal type of sedimentary
laminated structures. This limestone reserve occurs in sacks which are separated from
each other by clay partings. The thickness of laminations in each sacks increases with
depth.
It is hard, durable, tough limestone with crushing strength of about 17.8
kg/mm2 and compressive strength of 21.89 kg/cm2 (Indian Mineral Yearbook Report,
2013). It is a fine-grained variety of dimensional stone having natural split, non-slip
surface, and amorphous texture, because of which many a time known as splittable or
flaggy limestone (Kumar & Lakhani 2017). It is available in shades of yellow, green
and blue. These properties make it fit for commercial purposes, and has been used for
decorative purposes in public and domestic buildings for tiling and flooring purposes
(Sharma et al. 2007).With time, the popularity of this stone has increased around the
world and has been preferred over other famous and expansive dimensional stone like
granite and marble. Last few decades have seen a surge in mining and processing of
this stone. The production has increased at an exponential rate from 10MT in the year
1996-1997 to 55MT in the year 2011-2012. Export of this stone increased from
100,000 units in January 2014 to 400,000 unit with United Kingdom, France, United
State, Canada and Italy being top five importers sharing 31.8%, 10.8%, 8.6%, 8% and
5.8% of total export respectively (Export analysis and trends of Kota stone | Zauba).
Table 1.1: Area Wise Kota Stone Reserve
S.
No.
Area Mineable
reserve
(million tons)
1. Atraliya Deposit 5
2. Chechat 30
3. Suket (Atraliya, located on Shravada Kukra Belt 4
4. Suket (Dingsi, located on Pampakheri, Atraliya Dhabadeh, Belt 10
5. Dhabadeh- Teliya Kheri Sahravada, Kukada, Belt 10.00
6. Manpura- Dhani Extending Jhalawar district 4.00
7. Jagankheri – Kumbhkot Laxmipura- Satalkheri, Pipakheri, Belt 30.00
8. Julmi- Belt 5.0
9. Pipa Kheri- Nayagaon Belt 2

Introduction
4
Figure 1.1: Location of Kota, Rajasthan, India
Figure 1.2: Use of Kota stone in Stairs for Decorative Purpose
(Source: Civillane.com)
Introduction
5
Figure 1.3: Different texture of Kota stone Used for Flooring Purpose, Giving
an Aesthetic Look. (Source: wfm.com)
1.3. Problem Genesis: Quarrying, Cutting and Polishing of Kota Stone
The mining process used for extraction of Kota stone is open pit mining. Here,
first, the overburden pressure is removed and then quarrying continues till the end of
quarry site.
A conventional quarrying procedure of these stone is summarized in Figure
1.4. Mining process involves simple low technology equipment to heavy-duty
machinery. Mining method is mainly depended upon the geology of rock strata.
Cutting, splitting and blasting are three methods by which mining is proceeded
(British Geological Survey 2005). The large volume of rock is loosened by making
primary cut and then splitting it from the parent bed. Splitting process is carried out
via drilling series of holes using special tungsten carbide drill and filling them with a
splitting agent. Another method used for splitting procedure is plugs and feature
technique. This involves drilling holes and wedging steel plug between them. This
technique is found suitable when hairline cracks are observed in the parent rock bed.
The placing of holes is in alignment with these cracks. The spacing between holes is
dependent upon the required quality of split and strength of rock strata. Harder rock
with minimum or no fracture surface require closely packed holes. Use of explosive
to cause splitting is also in practice(Mancinİ et al. 2001). This is done using

Introduction
6
gunpowder to achieve a soft split. Gunpowder is basically a deflagrating material
which operates by confining the gases produced during the process. Once fracture line
widens, the block of Kota stone is separated from parent rock via cutting technique.
This is primarily done using diamond wire sawing machine(Mccarthy 2011). This
involves drilling two-hole of diameter 25 meters and height of 6-12 meters
perpendicular to each other, to the depth till they intersect each other (Ashmole &
Motloung 2008). One end of the diamond wire is passed in one hole and received from
another. This wire is then joined, forming a closed loop and mounted oversaw
flywheel. The heavy-duty saw flywheel is mounted over the rails. As the cutting
process starts, the assembly moves over the rails in the opposite direction maintaining
tension on the wire and cutting rock strata in blocks.
Once this limestone is separated from the parent bed, the blocks are recovered
using cranes and earth moving equipment and temporarily stored for transportation to
the polishing site. From there, these blocks are transferred to shaping and polishing
units. Here, the blocks are cut into slabs of desired shape and size; after which the
surface is polished to give desired shiny texture as per commercial use and demand.
The cutting and shaping process is long and laborious processes which usually take
minimum 12 to 16 working hour to complete. A slight misdirection or rush can lead
to the generation of fine cracks on the surface which make material unfit for
commercial use. Polishing section involves using abrasive material like sand/Emery
to give shiny texture to the limestone surface. Throughout the cutting, shaping and
polishing process, a continuous jet of water is sprayed to counter the heat generated
due to friction between the blade and limestone surface and clean the surface from
cutting particles.(Hargreaves 2010). Flowchart of the cutting and polishing operation
is shown in Figure 1.5.

Introduction
7
Figure 1.4: Flow Diagram for Quarry Operation.
Figure 1.5: Flow diagram for Cutting and Polishing Procedure.

Introduction
8
1.4. Waste Production and Characterization
Quarrying and processing stages of Kota stone generate a massive quantity
of waste. Nearly 1.2 million tons of Kota stone waste generated in slurry and dust
form is being disposed at random sites (Krishnan et al. 2018). Out of the total waste
production, 50-60% of waste is generated in blasting process, and 30-40% of the
total waste is generated in mechanized cutting, mining and polishing methods(Mehta
& Mehta 2015).
The waste produced during the whole process can be classified as:
a) Quarry waste
The waste generated during this process are solid waste in the form of
boulders, cobbles, gravels and pebbles. It is estimated that out of total mined material,
around 40-50 % of the material is unfit for commercial use, discarded immediately.
This waste is either filled back in the quarry site or disposed of in landfill sites (A.
Hussain, 2012). Small stone chips and dust, produced during cutting and splitting
process, are either left unattended or collected for disposal at landfill. The dust
particles being extremely fine, get carried away with blowing wind, polluting
resources and affecting health.
b) Polishing waste
Waste generated during shaping and finishing operation like processing,
sawing, polishing, cutting, and packaging are included in this category. the During the
polishing and cutting activity, a jet of water is continuously projected toward the
cutting area to counter heat generated due to friction between blade and stone surface.
After cutting rock strata this water jet, takes with it fine particles generated during the
activity. This wastewater sludge is diverted into storing pit or tank as per the facilities
available for further disposal.
1.5. Environmental Concern
With a consistent increase in commercial demand of Kota stone, many
quarry owners shifted their focus towards this dimensional limestone. Within a short
duration, the number of mining sites increased around the region.

Introduction
9
Competition among industrialist and lack of supervision from government
authorities, this mining process turned into a highly unsustainable practice. The
predetermined land filled sites reached saturation point within a short duration. To
save hauling time, fuel and money in waste disposal, the mining owners started buying
cultivable land from local farmers at a reasonable price and offering a job at the mining
site. Over the years, this practice resulted in heaps of Kota stone mining and cutting
waste (Figure 1.6), stretched over kilometres, as shown in Figure 1.7, Figure 1.8 and
Figure 1.9.
Presently, the waste has covered the local roads and cultivable lands, affecting
the local environment and ecosystem. Since the inception of quarrying operations,
areas which were earlier covered with open scrubs forest have now turned into barren
land. During rain, the dump consisting of dry slurry and stone chips get carried as
surface runoff; accumulate on adjacent fertile land, infiltrate in the ground and get
mixed with local water sources, thus disturbing local ecosystem. Cases of respiratory
diseases like silicosis are common among native people, labours living or working
near the mining area.
1.6. Measures adopted by Government and Agencies.
Acknowledging the detrimental impact of Kota stone waste, the state
government of Rajasthan restrained illegal mining activities by issuing various
notification and judgements; few important are mentioned below:
a. Aravali notification dated 7th May 1992, under environment pollution act,
prohibiting mining operation in specific areas except with prior environmental
clearance from the authority.
b. Mineral Conservation and Development rule 1988 of mine closure plan was
modified and rule 23A was included on 10thApril 2003 to support rehabilitation
and reclamation work of mines.
c. Order dated 16. 12. 2002 by Supreme court of India restricted mining in areas
under Aravali and part of Vindhya range.
National Green Tribunal, a special tribunal court for the conservation of
environment has fined and banned the mining of this limestone in the area. However,

Introduction
10
these steps had little to no effect as they only lead to restriction of the generation of
new waste and did not provide any solution for presently accumulated waste. The
situation asks for concrete steps to counter this issue efficiently.
Few measures taken by quarry owners to safeguard the health and safety of
workers were:
a) To counter blowing of stone-dust during transportation sprinkling of water is
done to counter blowing dust.
b) Disposal of waste without obstructing local drainage system.
c) Providing mask and ear plugs for workers.
However, these steps have done little effect to better the situation; no concrete
measure has been taken to provide a solution to already accumulated waste.

Introduction
11
Figure 1.6: Exhaustive Kota stone Mining site and in the Background, Piles of
Waste Generated During the Mining Process.
Figure 1.7: Ariel View Showing the Extent of Cutting and Slurry Waste and
Contamination of Water Source.

Introduction
12
Figure 1.8(a) and (b): Accumulated Waste Generated During Quarrying and
Polishing Activities.
1.8a) Kota stone mining and quarry waste
1.8 b) Kota stone slurry waste generated during polishing activity.

Introduction
13
Figure 1.9 (a) and (b): Disposal Problem Due to Cutting and Polishing Waste of
Kota Stone
1.9(a)
1.9(b) Kota stone slurry being dumped at
backyard of polishing industry
Accumulated slurry waste on road,
transported via blowing wind and
seasonal rain.

Introduction
14
1.7. Research Gaps
1. Previous studies reveal that materials such as cutting and polishing waste,
stone waste (marble and granite), fly ash, recycled asphalt pavement (RAP),
cement kiln dust has been successfully utilized as pavement material. Above
waste material have been used in the range of 30-60% Properties such as
plasticity characteristics, strength, workability, shear strength, free swell
index, resilient modulus and durability characteristics have been evaluated.
Studies on Kota stone slurry as soil stabilizer were found limited only to
plasticity characteristics and strength. Properties such as swelling, resilient
modulus, unconfined compressive strength have not been investigated in the
past.
2. Use of limestone quarry waste as non-bituminous granular subbase course has
not been evaluated earlier.
3. Preliminary investigations established the strength properties of Kota stone
waste aggregates as HMA material. No study pertaining to the use of KSA as
partial replacement of conventional aggregates and their strength and
durability study has been carried out so far.
4. No study has been carried out related to use of KSA in open-graded friction
course (OGFC).
1.8 Aim of the study
The present study is an attempt to evaluate the Kota stone quarry and
polishing waste as flexible pavement material. The primary objective was to study:
1. The physical properties and microstructure of slurry and aggregates mixes
derived from Kota stone quarry, polishing waste.
2. Effect of Kota stone slurry on workability, strength, resilient modulus,
swelling and morphology of black cotton soil.
3. Effect of Kota stone aggregates (KSA) on mechanical properties of Granular
Sub-base course (GSB).
4. Strength and durability properties of bituminous concrete (BC), dense
bituminous macadam (DBM) and open-graded friction course (OGFC) mixes
containing KSA.

Introduction
15
All experimental work (except chemical composition determination dynamic
creep test and resilient modulus Test) was conducted at Civil engineering department
and Material research Center, Malaviya National Institute of Technology Jaipur.
Chemical constitutes of material were determined at Centre for Development of
Stone, Jaipur. Dynamic creep test and resilient modulus test were conducted at Central
Road Research Institute, Delhi.
1.9 Thesis Organization
The thesis has been divided into 5 chapters. Chapter 1 titled “Introduction” is
intended to provide brief information about the study area, problem and prospects.
This chapter explains the quarrying and finishing techniques used for extraction of
limestone (Kota stone), stages, quantity and type of waste generated. This chapter also
explains the genesis of problem, significance of present work and aim of this study.
Chapter 2 titled “Literature review” where work done by various researchers are
compiled. Material and Methodology adopted for this study as explained in chapter 3
“Experimental Programme”. Details of code and testing procedure followed for this
laboratory investigation are explained in this chapter. The findings of experimental
investigations are compiled in chapter 4 “Result and Discussion” and the conclusion
of the study along with the further scope of work is presented in Chapter 5 titled
“Conclusion and Recommendations”.

16
CHAPTER-2
LITERATURE REVIEW
2.1 Significance
Literature review is an essential part of any research. It helps a researcher to
gain knowledge about the study area, the critical parameters on which research should
evaluate and also helps in identifying the gaps on which further scope of the study is
possible.
2.2 Methodology
The present study is focused on utilizing locally available limestone (called
Kota stone) quarry and polishing waste as flexible pavement material. The process of
review was started with works on limestone quarry waste as flexible pavement
material. Limited studies are available in this area with restricted preliminary findings.
Hence the review scope was broadened to the use of locally available waste as
pavement material. Reviewed bibliography included articles published in peer-review
journals; peer-reviewed thematic conferences and case studies. Available literature
pertaining to the use of Kota stone waste as building material was also reviewed in
this section. The review of the literature was classified on the basis of pavement layer,
i.e. subgrade, sub-base, base course and bituminous surface course.
I) Flexible Pavement Layer and Possible Use of Waste.
a) Subgrade Stabilization Using Stone Waste.
Strength and performance of flexible pavement are dependent not only on
good mix design but also on the load-bearing capacity of the subgrade. A quality
subgrade reduces pavement thickness and contributes toward an economical
construction. Soil stabilization is a technique used to modify the physical and
mechanical properties of soil. Conventionally, lime and cement are used as additives
to improve soil properties. Their addition leads to the formation of gelatinous and
amorphous material which helps in interparticle bonding. The reaction taking place
by addition of these compounds are shown below:

Literature Review
17
Chemical reaction upon the addition of cement as stabilizing material:
2C3S+ 6H C3S2H3+ 3Ca (OH)2 ………………(1)
2C2S+4H C3S2H3 + Ca(OH)2 ………………(2)
Where C is Cao, H is H2O and S is SiO2
As soon as calcium hydroxide is produced in the mixture, immediately, the
second stage of reaction takes place,
Ca(OH)2+ SiO2 CSH ………………(3)
Ca(OH)2+Al2O3 CAH ………………(4)
Chemical reaction upon the addition of lime is as follows:
CaO + H2O Ca(OH)2 ………………(5)
Ca(OH)2 Ca+2 + 2[OH] ………………(6)
Ca+2 + 2[OH]- + SiO2 CSH gel ………………(7)
Ca+2 + 2[OH]- + Al2O3 CAH gel ………………(8)
Commonly, lime is preferred in the treatment of soil which is rich in cohesive
fine aggregates and clay particles, and cement is found to be more efficient for low
cohesion soil particles. This is because, in cohesive soil, majority particles size is
smaller than anhydrous cement grains because of which it is difficult to ensure proper
coating and distribution of anhydrous stabilizer among cohesive soil (Hall et al. 2012).
Many a time it has been observed that locally generated waste has a mineral
composition similar to lime and cement and can be used as an additive to improve
properties of sub-base and base course.
Table 2.1 shows the mineral composition of such wastes that have been used
by researchers around the world to modify soil properties. This practice helps in
reducing the overall quantity of commercial additives, provides an efficient waste
management method and also reduces overall project cost (Sen & Mishra 2010).
Studies have been conducted in past where the use of locally generated stone waste
have been used to improve physical, mechanical and swelling properties of soil
subgrade and sub-base. Table 2.2 summarizes the prominent work of using waste in
soil stabilization.

Literature Review
18
(Okagbue & Onyeobi 1999) used marble dust as an additive to modify soil
properties of red tropical soil to be used for road construction. Three varieties of red
tropical soil were added with marble dust in varying proportion from 2% to 10% in
step of 2%. Mixes were evaluated for change in particle size distribution, specific
gravity, Atterberg limit, modification in standard compaction characteristics,
compressive strength and bearing capacity. The result showed a significant change in
engineering properties of soil on addition of marble dust. Plasticity index and
compaction strength were observed to improve by 33% and 46% respectively as
compared to neat soil sample. Bearing strength of sample measured by CBR also
showed improvement by 55%. Based on results, the author suggested marble waste as
an additive in base course material for roads subjected to light traffic, and as sub-base
material subjected to high traffic roads. Similarly, (Soosan et al. 2005) studied the
impact of adding quarry dust to three types of soil namely red soil, kaolinite soil and
Cochin marl soil. To each type of soil, waste was added at an increment of 20%, with
maximum replacement of 80% to dry weight of soil. Each sample was evaluated for
change in engineering properties, i.e. liquid limit, plastic limit, maximum dry density,
optimum moisture content and soaked and unsoaked CBR. Using quarry waste
improved workability and gave a higher value of MDD and lower value of OMC. The
effort to cast samples was reduced with increase of quarry dust in the mix. The bearing
capacity of each soil sample was found to improve in both normal and adverse
conditions as indicated by increased in respective CBR values. Improvement in angle
of shearing resistance of all soil samples with inclusion of quarry dust was also
observed. Best result in term of load bearing property was observed in kaolinite-
quarry dust mixture followed by marine clay-quarry dust mix and red soil-quarry dust
mix respectively.
(Jayawardena & Dissanayake 2006) performed petrographic examination on
quarry dust waste produced by crusher plant in the Northern and Central province of
Sri Lanka. Sixteen samples were tested for chemical composition and micro studies.
Test result indicated that though the composition of quarry dust depends upon the
composition of rocks, yet, Crushing and polishing techniques also have a significant
effect on the quality of quarry dust. The study concluded that quarry dust is mineralogical
diverse enough to be used as partial to full replacement of conventional fines in

Literature Review
19
construction and building materials. However, if used in concrete, care must be taken
that mica content should not be higher than 5%, as found in few test samples. Hence,
regular trials and strict quality control was recommended by the author before using
quarry dust as construction material.
Effect of quarry dust on compaction and shear properties of five varieties of
soil was studied by (Sridharan et al. 2006). The soil samples used in this study were
two variations of red soil having different particle size distribution obtained from two
different locations, a lateritic soil, a Kaolinite soil and marine clay soil. To each soil
sample, waste was added up to 80%, in step of 20% of dry weight of soil. Compaction
characteristics were found using standardProctor test. The test result showed a
consistent improvement in compaction properties of all type of soil with inclusion of
quarry dust in samples. An average increase of 21% MDD value and 38% decrease in
OMC value was observed in all soil samples on inclusion of 60% quarry dust. Shear
strength, especially of clayey soil sample showed improvement on addition of 60%
quarry dust indicating better cohesion. Use of quarry and polishing waste as additive
improves the engineering properties of soil subgrade which in turn improve the load-
bearing capacity of flexible pavement (Ken et al. 2006). This was also demonstrated
by (Ghausuddin & Koranne 2011); here, an experimental investigation was carried
out to evaluate the possibility of quarry dust as a stabilizing material. This study
evaluated three mixes,i.e.a neat soil sample, a mixture of soil and quarry waste in
equal proportion and a sample made of 100% quarry dust. Test result showed that
among samples neat soil sample gave maximum density of 15.8 KN/m3 followed by
mix containing 50% quarry waste and 50% soil and 100% quarry waste sample giving
values as 13.9 KN/m3 and 12.5 KN/m3 respectively. Soaked CBR followed similar trend,
with minimum CBR value obtained for the sample made of 100% quarry waste and
maximum value obtained for neat soil sample. To improve the compaction and load-
bearing performance of the mixes, each mix was then added with three variants of
polypropylene fibre of diameter 12mm, 24mm and 40mm in ratio of 0.5%, 1%, 1.5%
and 2% of total weight of the sample. Samples were then again tested for engineering
properties of soil, i.e. MDD, OMC and soaked CBR. This time, the sample made of
100% quarry dust gave best results. Sample made of 100% quarry waste using 2%
polypropylene fibres of size 24 mm, gave highest MDD of 13.9 KN/m3 and maximum

Literature Review
20
CBR value of 16.63 % among all mixes. The reason cited for this performance was
homogeneous mixing of fibre and quarry dust resulting in denser mix. Cost analysis
also supported use of polypropylene fibre induced quarry dust and in contrast to using
neat soil for subgrade construction, saving natural resource.
(Eze-Uzomaka et al. 2010) studied the possibility of modifying engineering
properties of laterite soil, to be used for non-bituminous base course, using cement
and quarry dust. For this study, cement was added in step of 2% by weight of soil up
to 10%; to each soil-cement mixture, quarry waste was added in step of 10% up to
50%. Each sample was tested for workability, maximum dry density, bearing capacity
and durability. Test result showed that with inclusion of quarry dust to cement
stabilized soil samples enhanced their geotechnical properties. Plasticity index of neat
soil sample, containing no additive was 22%, which on addition of cement reduced to
10%, which was further reduced to 5% on 50% addition of quarry dust by dry weight
of soil-cement sample mix. Similar observation was obtained for maximum dry
density which was found using standard Proctor test. Combination of 10% cement and
50% quarry dust improved the maximum dry density to 2.12gm/cc from 1.82gm/cc.
Formation of much denser mix was attributed to this behaviour. Inclusion of quarry
dust improved bearing property of soil, found using CBR test, where it was observed
that using 2% cement and 10% quarry dust improved CBR value by 96% of that
obtained for control sample containing no additive. The value further increased by
296% on addition of 10% cement and 50% quarry dust. In durability test, measured
using dry and wet UCS test, it was observed that sample 10% cement and 50% quarry
dust gave best results in both the cases. The study was followed by cost analysis of
each mix, where it was observed that though sample containing 10% cement and 50%
quarry dust gave best result, using this infield would lead to a spike in overall project
cost, hence, based on economic analysis and considering results which satisfied code
recommendation, 6% cement and 30% quarry waster was suggested as the most
suitable proportion.
(Ogbonnaya & Illobachie 2011) studied the effect of granite dust produced
during mining of granite rocks, on geotechnical properties of clayey soil, found in the
region of Southeastern Nigeria. Waste was added as dry weight replacement of soil in
proportion of 10%, 15% and 20%. Study results were in correlation with other similar

Literature Review
21
studies where it was found that inclusion of dimensional stone waste improved PL,
MDD and CBR value of soil. Based on results, author suggested that granite dust
stabilized local soil can be used in construction of sub-base course of flexible
pavement and as general filling material for embankments. Another study by (Al-
Joulani 2012) used stone waste, obtained during cutting and shaping of dimensional
stones, to improve compaction and load-bearing properties of local clayey soil. The
results were compared with control soil sample and lime stabilized soil sample,
containing lime as additive in similar ratio as that of stone waste, i.e. 10%, 20% and
30%. Test result indicated that soil properties were improved with addition of stone
waste. Use of 30% stone dust improved the CBR value from 5.2% obtained for neat
soil sample to 16%; this CBR value was less yet comparable to that obtained upon
addition of 30% lime to soil, having a CBR value of 18%. The study recommended
use of stone waste as stabilizing material.
In another study by (Satyanarayana, Pradeep, et al. 2013), the feasibility of
using waste quarry dust, produced at local stone crushing plant, as a geotechnical
material was assessed. In this experimental investigation, geotechnical properties of
stone dust were evaluated and compared with conventionally used material, i.e. sand
and red soil. Each material was tested for gradation, plasticity index, OMC, MDD,
CBR and angle of shearing resistance. Test result showed that crusher dust had almost
similar particles size distribution to that obtained for sand and red soil. Crusher dust
showed highest water requirement to achieve maximum compaction, however, the
MDD achieved was similar to that of red soil, i.e. 1.9gm/cc which was greater than
that obtained for sand, i.e. 1.75gm/cc; same was observations for CBR value where
red soil and crusher dust gave same CBR value of 10% against 8% obtained for sand.
Another study on gainful utilization of quarry waste was carried by (Amit & Singh
2013) to study impact of marble slurry as stabilizing material. In this study, marble
waste was added to soil at replacement proportions of, 40%, 50%, 60%, and 70%. The
untreated sample was used as a control sample, and results were evaluated based on
the change in the mechanical properties. A consistent increase in MDD value,
decrement in OMC value and improved workability were observed with increase in
marble waste in soil, indicating improved compaction property. At 50% replacement,
maximum CBR of 5.16% was obtained, which was almost four times the CBR value

Literature Review
22
of neat soil sample, after which further increase in proportion gave decrement results.
Overall the study suggested that marble dust can be used up to 50% to improve its
mechanical properties of black cotton soil
(Gupta & Sharma 2013) used marble dust, fly ash and Beas sand to study
subgrade characteristics of expansive soil. Sand was added to soil sample in step of
10% replacement of dry weight of soil. Each sample was then tested for MDD and
CBR values, where it was observed that MDD was improved till 50% replacement of
soil sample by Beas sand. Addition of fly ash was done to soil-sand mixtures in step
of 5% till 15%. It was observed that fly ash reduced MDD and increased OMC of
mixture. Marble was added in similar fashion to soil sand and fly ash mixture in two
proportions, i.e. 8%, 12% replacement of dry weight of mixture. Test result revealed
that inclusion of marble dust by 12% replacement of mix improved the MDD of soil
and results were comparable to mix containing 50% soil and sand. Similar observation
were made for CBR test results, where inclusion of marble dust gave almost double
CBR value compared to that obtained with soil sand combination. Based on the
experimental investigation, 52.36%-22.44%-13.20%-12% was considered as most
optimum soil-sand-fly ash-marble dust proportion.
(Mishra et al. 2014) used granite slurry waste generated during polishing
process to modify engineering properties of lime stabilized black cotton soil. Black
cotton soil containing 5% lime by weight of soil was taken as control sample and
granite waste was added in ratio of 10%, 20% and 30% by weight of control sample.
Test result showed that addition of waste reduced plasticity index from 37.2% to 3.7%
on addition of 30% granite waste. A similar observation was made for free swell index
test, where it was observed that addition of 30% granite waste reduced swelling from
56.0% to just 4.1%. Another study by (Nayak et al. 2015) enhanced the performance
of red lateritic soil using 20% granite and 9% lime content. This study advocated
positive impact of granite waste on durability of soil and suggested its use along with
lime as additive. Similar study was conducted by (Khader et al. 2017)where the
engineering properties of black cotton soil were evaluated by adding different quantity
of lime and granite quarry dust. Neat soil sample was added with lime as percentage
weight replacement of dry weight of soil sample in four proportions, i.e. 3%, 4%, 5%
Literature Review
23
and 6%. To each mix, granite dust was added in three proportions, i.e. 10%, 20% and
30% of dry weight of soil-lime mixture. MDD and OMC of each mix were found
using standardProctor test. Effect of bearing properties was evaluated using CBR test
and the effect of lime and granite dust on swelling properties of soil was assessed by
free swell index test. Test result showed that as the percentage of lime and granite dust
increased in the mix, PL, MDD, CBR increased and swelling of soil samples
decreased. Overall study advocated use 5% to 6% lime along with 20% to 30% granite
waste as additive to stabilize black cotton soil. Study on similar ground was carried
out by (Zorluer & Gucek 2017). Here, granite slurry waste, obtained after drying
polishing sludge, and fly ash were used to study their effect on mechanical and
durability properties of granular soil to be used for road construction. Addition of
these waste to soil was done in three proportions, i.e. 5% granite waste with 10% fly
ash, 10% granite waste with 20% fly ash and 15% granite waste with 30% fly ash.
OMC and MDD were determined using standard Proctor test, where it was observed
that inclusion of waste improved MDD and reduced OMC. Improvement in bearing
capacity was observed in CBR test, where, average CBR increment of about110% on
inclusion of waste combination was observed. Sample containing 5% granite dust and
10% fly ash gave consistent best result of 128% increment in CBR value. To estimate
durability properties samples were cured for 1, 7, 28 and 56 days and then tested for
their UCS value. Test result showed that out of all samples, sample containing 5%
granite dust and 10% fly ash gave incremental strength whereas other showed reduced
strength on 28 and 56 days curing. Based on the test data, author suggested that 5%
granite dust and 10% flyash is suitable additive percentage for tested soil, and its field
implementation will not only reduce overall construction cost but will also create
environment-friendly roads. (Thirumalai & Naveennayak 2017) also used granite
quarry and slurry waste to stabilize black cotton soil. Waste was added in proportion
of 10%, 15% and 20% by dry weight of soil. Result from this laboratory investigation
suggested that granite quarry and slurry waste has potential to improve geotechnical
properties of black cotton soil as upon addition, reduction in liquid limit and
improvement in plastic limit, MDD and UCS value was observed.
(Sarvade & Nayak 2014) used quarry dust to improve geotechnical properties of
clayey soil found in the region of Karnataka, India. In this study, quarry dust was

Literature Review
24
added in five proportions, i.e. 10%, 20%, 30%, 40%, and 50% by weight of neat soil
sample. Each mix was judge on the basis of change in workability, compaction
characteristics and durability properties of soil samples. The test results were very
encouraging as inclusion of quarry waste reduced the plasticity index indicating an
improvement in workability condition of soil samples. The optimum water
requirement followed a decreasing trend and maximum dry density improved as
proportion of quarry dust increased in the soil samples, suggesting improvement in
compaction characteristics of soil whilst reducing overall water required to achieve
the same. Durability property evaluated using unconfined compressive strength test,
improved till 20% addition of quarry dust in the soil sample after which it decreased.
This experimental investigation was then followed by a finite element analysis where
it was established that using quarry dust in soil can decrease the settlement and
improve the load carrying capacity of footing.
Another study by (Kuamr & Biradar 2014) supported the use of quarry dust to
improve the subgrade properties of clayey soil to be used for highway construction. The
waste was added at an interval of 10%, beginning with 10% and going till 50%. The
results were in correlation with similar studies conducted by various authors, where
use of quarry dust as an additive improved geotechnical properties of soil. This study
concluded that using 40% of quarry dust by weight of soil sample improved
workability, compaction characteristics and bearing capacity of soil and its field
implication would provide a viable disposal option for accumulated quarry waste.
Similar study by (Chawda 2014) used granite crusher dust to improve engineering
properties of lime stabilized black cotton soil. Soil sample containing 5% lime by dry
weight of soil was added with granite dust in two proportions, i.e. 10% and 20% by
dry weight of sample. Each mix was tested for PI, OMC, and MDD. Test result
indicated that inclusion of granite dust improved workability as indicated by PI, which
reduced from 31.85% to 6.8%. MDD was observed to increase as proportion of granite
waste increased, with best value obtained on 20% addition of waste to the mixture.
Reduction in OMC requirement to achieve MDD density was also observed. Based
on this laboratory investigation, author concluded that addition of 5% lime and 20%
granite crusher dust by weight to black cotton soil will improve its geotechnical
properties and its use will help in sustainable construction.

Literature Review
25
(Keshavan et al. 2017) used combination of marble dust and granite dust to
improve workability of black cotton soil. In this study, additive mix was prepared by
combining the two waste materials in equal proportion and then adding to soil as
weight replacement by dry weight of soil in step of 25% till 75%. The test result
showed encouraging result, with a decreased liquid limit value from 36.88% of neat
soil sample to 17.33% on 75% addition of additive in soil sample. Improvement in
workability was observed by an overall reduction in plasticity index of soil from
13.63% to 3.13%. Addition of marble dust and granite also reduced the permeability
of soil, further supporting its suitability as construction material. Overall, authors
recommended used of marble waste and granite waste as construction material.
(Husain & Aggarwal 2015) studied effect of stone dust obtained as waste
product from stone crusher plant to study its effect on compaction and mechanical
properties of low-plastic silt sand found in Kurukshetra region of Haryana, India. In
this study, waste stone dust was added at replacement interval of 2%, up to 10%
replacement ratio. Modified Proctor test was used to find optimum moisture content
and maximum dry density of each mix. Test result indicated that as the percentage of
stone dust increased, MDD increased. Best result was obtained with 4% addition of
stone dust, where MDD obtained was 2.07gm/cc as compared to 1.19gm/cc obtained
for control sample. To assess effect of stone dust on load-bearing properties of soil
CBR test was performed for each replacement mix. Each mix was cast on respective
OMC. The CBR value increased from 3.50% of control sample to 15.32% for sample
containing 10% stone dust as additives, which indicated an improvement in bearing
property of soil. Similar study was conducted by (Agarwal 2015) in which waste stone
dust procured from commercial stone crusher site was used as additive to study its
impact on soil properties of clayey soil found in the region of Pantnagar Uttarakhand
India. The addition of waste was done at interval of 10% and continued till addition
of waste gave positive results. Standard Proctor test was used to find the OMC and
MDD of each mix and CBR was cast on basis respective OMC of each mix. The result
was in correlation with other studies conducted on similar ground as it was observed
that till 50% addition of stone dust, compaction energy improved and OMC decreased.
Addition of waste increased the CBR of soil from 1.95 % to 2.91% on 30% addition
of waste. Further addition gave reduced CBR values. Based on test results, 30%

Literature Review
26
addition of stone waste was suggested as suitable replacement value to improve soil
properties. Similar results were reported by (Mahent 2015). The study evaluated
optimum proportion of slurry waste to improve properties of gravel soil. Soil was
added in proportion of 10%, 15% 20% and 25% and 30%. Test results were evaluated
on the basis of improvement in workability, compaction energy and increased bearing
capacity. With addition of waste, liquid limit decreased and plastic limit increased,
which lead to an overall decrease in plasticity index of soil. Plasticity index reduced
from 7.66% of natural gravel soil to 3.86% on addition of 25% stone dust in soil
sample, indicating improved workability. To find OMC and MDD, modified Proctor
test was used, and result showed improvement in compaction properties of soil with
inclusion of stone waste. The MDD increased from 1.70gm/cc of neat soil to
2.07gm/cc on 30% addition of stone waste into the soil. Similar behaviour was
observed for bearing property of soil assessed by soaked and unsoaked CBR test.
Al-Khamka, a locally identified slurry waste by stone of same name was used
to improve the properties of locally available Jerash cohesive soil found in the area of
Jordan by (Masoud 2015). In his study, the slurry waste was added to soil at an interval
of 5% going up to 50% replacement ratio. Test result showed improvement in
compaction properties of soil until 15% addition of slurry to soil sample after which
a decrement trend was followed. The study recommended addition of 15% dry slurry
waste to cohesive soil to improve its compaction properties. A similar study was
carried by (Prasad & Prasada Raju 2015), here, feasibility of using quarry dust to
stabilize expansive soil was studied. The waste was added in three proportion, i.e. 5%,
10% and 15% to black cotton soil, and, each sample was tested for free swell test,
CBR test, direct shear test. Test result showed that free swell index of soil reduced to
72% from 100% on 15 % addition of quarry waste. Soaked CBR value was found to
be increasing till 10% addition of waste. Shear parameter decreased from 16KN /m2
to 4 KN/m2, and angle of internal friction went on increasing from 19° to 29° with
addition of 10% quarry dust to expansive soil.
Another study by (Venkateswarlu et al. 2015) studied behaviour of expansive
soil induced with quarry dust as stabilizing material. Neat soil samples were mixed
with quarry dust at an incremental weight percentage of 5%, going up to 15%. Study
evaluated index properties, compaction characteristics and bearing properties of each

Literature Review
27
mix. Test result showed that as the proportion of quarry dust increased, liquid limit
decreased and plastic limit increased in the mixes. Plasticity index decreased from
41.26%, obtained for control sample to 36% for sample containing 15% quarry waste
in mix. Inclusion of quarry waste up to 10% increased MDD and decreased OMC and
CBR increased from 3.2 to 8.24% with 10% quarry waste. Hence 10% was justified.
(Satyanarayana P et al. 2016) in his study used two locally generated waste,
i.e. rice husk ash and crusher dust as subgrade construction material. In this study,
mixes were prepared by replacing rice husk ash in a subsequent interval of 10% going
to 50% by weight replacement of RHA. Mix made of 100% rice husk ash was treated
as control sample and results were compared to control sample and code
specifications. Test result indicated that as the percentage of crusher dust increased,
optimum moisture content reduced and maximum dry density of mixture increased,
maximum MDD of 1.54 gm/cc was obtained for sample containing 50% RHA and
50% crusher dust. Similar results were obtained for shear test and CBR, where
increase in proportion of crusher dust improved shear resistance and gave higher CBR
value of 38.5° and 13% respectively. The study concluded with recommendation that the
use of mix prepared from 50% RHA and 50% crusher dust can be used for soil
subgrade preparation and its field use will be helpful in sustainable disposal of waste,
reduce overall construction cost and helps in creating sustainable construction.
(Kumar et al. 2006) performed an experimental investigation to find most
suitable sub-base material among coarse sand, stone dust, fly ash and riverbed containing
gravel and sand. Each sample was tested for strength parameters. Maximum dry density,
found using standard Proctor test was found maximum for river bed followed by
coarse sand, stone dust and fly ash samples respectively. However, bearing strength,
evaluated using soaked CBR test, was found maximum for stone dust and minimum
of fly ash. To assess long-term performance of material each sample were subjected
to cyclic loading where highest permanent strain was obtained by stone dust,
indicating higher susceptibility to rutting potential followed by fly ash, coarse sand
and riverbed material. Static modulus and resilient modulus values also found
maximum for riverbed material. Based on test results, river bed sample was deemed

Literature Review
28
best material for construction purpose; however, use of stone dust and fly ash in
construction of pavement subjected to low traffic volume was advocated.
(Roohbakhshan & Kalantari 2016) used polishing sludge waste obtained from
stone processing unit along with lime to stabilize the clayey soil. The waste was added
in ratio of 3%, 6% and 9% and each mix was then added with 3, 6, 9 and 11% of lime.
Mix proportions were assessed based on change in Plasticity index (PI), MDD, CBR
value and unconfined compressive strength value (UCS). Test result indicated decrease
in liquid limit and increase in plastic limit of soil sample indicating an improvement in
workability. Inclusion of waste improved the mechanical and durability properties of
soil indicated by CBR and UCS test results. The optimum result were obtained with
addition of 3% slurry waste and 6% lime giving CBR value of 160% and UCS value
of 1MPa. A similar result were reported by (Saini &Soni 2017). In their study marble
slurry waste was used to stabilize the naturally available clayey soil. Addition of waste
to soil sample was in ratio of 20%, 25% and 30%. Each mix was tested for
improvement in compaction and bearing capacity of soil analyzed by standard Proctor
test and CBR test respectively. Test result indicated that with addition of marble
polishing waste up to 25% in soil sample modified its compaction and bearing
properties. (Pradeep & Imanka 2016) investigated use of quarry dust and cement to
modify properties of laterite soil. In this study, quarry dust was added at weight
percentage proportion of 10, 20 and 30% by weight of soil samples. To each mix
proportion, 4% cement was added. Test result showed decrease in liquid limit and
increase in plasticity and maximum dry density of soil with increase in quarry dust
proportion. A settlement analysis was carried out for each proportion on 1.5x1.5m
footing using finite element modelling. Result showed that as the proportion of quarry
dust increased in the soil, settlement of footing, acted under constant load of 200KPa,
decreased. The study concluded that use of quarry waste as additive to modify laterite
soil properties is justifiable, and its use must be encouraged especially for low volume
pavement construction. (Sonthwal & Soni 2016) and (Ganie et al. 2017)in their
respective study used quarry waste as stabilizing additive. Where (Sonthwal et al.,
2016) used quarry dust to stabilize the clayey soil, (Ganie et al. 2017) used it on sandy

Literature Review
29
loam soil. The resulting pattern was in analogues with each other. Use of quarry dust
improved workability, compaction properties and bearing characteristics of soil.
Similarly, (Mishra et al. 2014) used granite dust, generated as waste product
during crushing and polishing of granite stone, as stabilizing material for black cotton
soil. Waste was added in replacement ratio of 10%, 20% and 30%. Test results were
in align with other studies pertaining to dimensional stone waste where addition of
granite waste up to 30% improved MDD and CBR value. Another comprehensive
study on evaluating role of stone waste in subgrade was carried by (Sivrikaya et al.
2014) in which five variety of stone waste were selected, and their effect on black
cotton soil was examined. bentonite, kaolinite, granite powder, calcite marble powder,
dolomitic marble powder were used in three variants of artificially made clayey soil
from high plastic bentonite and low plastic kaolinite. Waste was added in a proportion
of 5, 10, 20, 30, and 50% by weight. All sample showed improvement with increased
unit weight, reduced liquid limit, improved plastic limit. Among used waste, dolomite
gave the best performance, and up to 30% replacement by weight was deemed
suitable. Another study by (Minhas & Devi 2016) investigated the effect of marble
dust on alluvial soil. Here, replacement ratio was kept at 5, 10 and 15% respectively.
The result was in align with previous studies where improvement in mechanical
properties was observed. (Salam et al. 2018) used crushed limestone to study the
impact of gradation, quantity of fines, and impact of dust ratio on the strength of mixes
to be used for unbound base and sub-base layer of flexible pavement. Mixes were
prepared by using two gradation, three plasticity index and three dust ratio. Two
gradations with maximum aggregate size of 25mm and 50mm was used, in which
three quality of fines identified by their different plasticity index of 5%, 8% and 12 %
were added in the ratio of 5%, 9% and 13% respectively to each coarse aggregate, and
dust ratio was varied as 0.4, 0.6 and 1 at fine percentage variation. Standard Proctor
test was used to find OMC and MDD of each mix, and soaked CBR test was used to
find strength. Study found that though PI has little influence on OMC and MDD,
variation in quantity of fines had significant impact on MDD. As the quantity of fines
increased in the mix, maximum dry density increased and optimum moisture content
decreased. However, increased percentage of dust ratio lead to creation of voids which

Literature Review
30
resulted in inferior MDD values. In terms of strength, gradation with large particle
size and low fine resulted in lower CBR value.

Literature Review
31
Table 2.1: Mineral Composition of Various Material.
Calcium
Oxide(CaO)
Silica
(SiO2)
Alumina
(Al2O3)
Iron Oxide
(Fe2O3)
Magnesia
(MgO)
Potash
(K2O)
Other
mineral
LOI* Source
Cement 64.86 20.44 5.50 - - 1.59 1.52 (Basha et al. 2005)
Lime 53.4 8.56 4.4 1.12 - - - (Etim et al. 2017)
RHA 0.41 93.51 0.21 0.21 22.31 0.45 2.36 (Basha et al. 2005)
Pumice aggregate 1.75 65.5 17.5 4.5 2.25 4.25 4.5 (Saltan & Selcan Findik
2008)
Iron ore tilling 0.607 45.64 3.36 47.7 0.393 0.607 3 (Etim et al. 2017)
Flyash 3.6 44.5 22.4 7.5 1.5 2.5 4.5 (Mccarthy et al. 2014)
Ground Granulated
blast furnace slag
41.5 34.8 11.3 0.6 7.2 0.3 - (Mccarthy et al. 2014)
Lime dust 6 - - - 2 1 0.1 (Brooks et al. 2011)
Cement Klin Dust 49.3 17.1 4.24 2.89 15.8 2.18 15.8 (Siddique 2014)
Marble waste 5.17 36.44 2.07 6.73 20.15 - 16.44 (Abed & Eyada 2012)
Palm oil fuel Ash 8.4 43.6 11.4 4.7 4.8 4.5 18 (Borhan et al. 2010)
*LOI= Loss on Ignition

Literature Review
32
Table 2.2: Summary of Research on Subgrade Stabilization by Stone Waste.
Waste Secondary
additive
Used as Evaluated Parameters Optimum
percentage/Conclusion
Reference
Marble Dust - Stabilization of red tropical
soil
Workability, Strength,
Durability
Marble dust can be used as
stabilizing material.
Okagbue & Onyeobi 1999
Quarry Dust - Stabilization of red soil,
kaolinite soil and Cochin
marl soil
Engineering properties,
Bearing capacity.
Use of 40-60% quarry dust
as an optimum range to be
used in each soil sample.
Soosan et al. 2005
Quarry Dust - Stabilization of five soil
type
Compaction and Shear
characteristics of soil
Addition of waste
improved geotechnical
properties of soil. Use
possible.
Sridharan et al. 2006
Quarry Dust Polypropylene
fibre
Stabilization of black
cotton soil
Workability, Strength,
Durability
Quarry dusts with
polypropylene fibre
improve geotechnical
properties of soil.
Ghausuddin & Koranne
2011
Quarry Dust Cement Stabilization of laterite soil Engineering properties,
Bearing capacity.
10% cement with 50%
quarry dust enhanced
geotechnical properties.
Eze-Uzomaka et al. 2010
Granite Dust - Stabilization of clayey soil Engineering properties,
Bearing capacity.
Granite stabilized soil can
be used in subgrade and
embankments,
Ogbonnaya & Illobachie
2011
Stone cutting
and polishing
waste
- Stabilization of clayey soil Workability, Strength,
Durability
Addition of stone dust up
to 30% improve
geotechnical properties of
soil.
Al-Joulani 2012

Literature Review
33
Waste Secondary
additive
Used as Evaluated Parameters Optimum
percentage/Conclusion
Reference
Quarry Dust - Stabilization of red soil
results compared with lime
stabilized soil
Workability, Strength,
Durability
Quarry dust as additive
increased optimum water
requirement, improved
durability properties.
Satyanarayana, et al. 2013
Marble slurry - Stabilization of clayey soil Engineering properties,
Strength and Bearing
capacity.
Addition of marble powder
up to 50% improve bearing
strength of soil.
Amit & Singh 2013
Marble Dust fly ash and
Beas sand
Stabilization of clayey soil Strength and durability
properties
Inclusion of marble dust by
12% replacement of mix
improved the MDD of soil,
comparable to mix
containing 50% soil and
50% sand.
Gupta & Sharma 2013
Granite slurry
waste
Lime Stabilization of black
cotton soil
Strength, Durability and
free swell index
Addition of waste reduced
swelling and improved
workability.
Mishra et al. 2014
Granite slurry
waste
Lime Stabilization of red laterite
soil
Strength and durability
properties
Advocated positive impact
of granite waste on
durability of soil
Nayak et al. 2015
Granite
quarry dust
Lime Stabilization of black
cotton soil
Workability, Strength,
Durability
5% to 6% lime along with
20% to 30% granite waste
as additive to stabilize
black cotton soil.
Khader et al. 2017
Granite Dust Fly ash Stabilization of black
cotton soil
Workability, Strength,
Durability
5% granite dust and 10%
flyash is suitable additive
percentage for tested soil.
Zorluer& Gucek 2017

Literature Review
34
Waste Secondary
additive
Used as Evaluated Parameters Optimum
percentage/Conclusion
Reference
Granite Dust
and slurry
waste
- Stabilization of black
cotton soil
Workability, Strength,
Durability
Waste has potential to
improve geotechnical
properties of black cotton
soil.
Thirumalai &Naveennayak
2017
Quarry Dust - Stabilization of clayey soil Strength and durability and
settlement characteristics
Quarry dust in soil can
decrease the settlement and
improve the load carrying
capacity of footing.
Sarvade & Nayak 2014
Quarry Dust Stabilization of black
cotton soil
Workability, Strength,
Durability
Using 40% of quarry dust
by weight of soil sample
improved workability,
compaction characteristics
and bearing capacity of
soil.
Kumar& Biradar 2014
Granite Dust lime Stabilization of black
cotton soil
Workability, Strength,
Durability
Use of 5%lime and 20%,
granite crusher dust by
weight to black cotton soil
will improve its
geotechnical properties.
Chawda 2014
Marble Dust
and Granite
Dust
- Stabilization of black
cotton soil
Workability, Strength,
Durability, permeability
Addition of marble dust
and granite improve
engineering properties of
soil.
Keshavan et al. 2017
Stone Dust - Stabilization of low plastic
silt
Engineering property of
soil
Addition of stone dust
improved MDD.
Husain & Aggarwal 2015

Literature Review
35
Waste Secondary
additive
Used as Evaluated Parameters Optimum
percentage/Conclusion
Reference
Stone waste - Stabilization of Cohesive
Soil
Engineering property of
soil
Waste has potential to
improve geotechnical
properties.
Masoud 2015
Quarry Dust - Stabilization of expansive
soil
Workability, Strength,
Durability, Shear
properties
Addition of 10% quarry
dust to expansive soil is
feasible.
Prasad & Prasada Raju
2015
Quarry Dust Stabilization of expansive
soil
Workability, Strength,
Durability
Use of 10% quarry dust is
feasible.
Venkateswarlu et al. 2015
Crusher Dust Rice husk ash Improvement strength of
sub grade
Workability, Strength,
Durability
50% RHA and 50%
crusher dust can be used
for soil subgrade
preparation
Satyanarayana P et al.
2016
Coarse sand,
stone dust, fly
ash and
riverbed soil
- Best suitable sub grade
stabilizing material
Strength, resilient
modulus,
River bed soil gave
optimum results
Kumar et al. 2006
Polishing
sludge
Lime Stabilization of expansive
soil
Workability, Strength,
Durability
3% slurry waste and 6%
lime was considered as
optimum mix
Roohbakhshan & Kalantari
2016
Quarry Dust cement Stabilization of laterite soil Workability, Strength,
Durability, Settlement
analysis
quarry waste as additive to
modify laterite soil
properties is justifiable
Pradeep & Imanka 2016
Quarry Dust - Stabilization of sandy loam
soil
Workability, Strength,
Durability
30% quarry waste was
considered as optimum
Ganie et al. 2017

Literature Review
36
Waste Secondary
additive
Used as Evaluated Parameters Optimum
percentage/Conclusion
Reference
quantity to improve soil
property
Three
varieties of
Stone waste
:Calcite
marble,
Dolomite
marble, and
Granite
powder
- Three varieties of
artificially made clay
samples of different
plasticity.
Workability, Strength,
Durability,
Improved engineering
properties of each soil
sample with each waste
type.
Sivrikaya et al. 2014
Marble Dust sand Stabilization of clayey soil Workability, Strength,
Durability, Swelling
properties
Marble dust should be used
as an additivein low
volume roads
Oncu& Bilsel 2016
Crushed
limestone
- Stabilization of clayey soil Physical , mechanical and
durability properties
Improved gradation,
engineering properties,
workability and strength
Salam et al. 2018
Marble Dust Rice husk Ash Stabilization of black
cotton soil
Engineering properties,
strength and durability
properties
Marble dust had minor
effect on MDD and OMC.
However, significant effect
was observed in soaked
CBR and UCS values
Sabat & Nanda 2011
Marble Dust Rice husk Ash Stabilization of black
cotton soil
Workability, Strength,
Durability,
Marble dust is better than
rice husk ash to stabilize
black cotton soil.
Gandhi 2013

Literature Review
37
Waste Secondary
additive
Used as Evaluated Parameters Optimum
percentage/Conclusion
Reference
Marble Dust Fly ash Stabilization of black
cotton soil
Workability, Strength,
Durability.
Use of marble dust in a
combination of fly ash and
sand to improve black
cotton soil properties
Gupta & Sharma 2014
Marble Dust - Stabilization of clayey soil Durability studies Addition of 10% marble
dust by weight of soil gave
sufficient stiffness and
modified soil properties
Gurbuz 2015
Stone Dust Fly ash Stabilization of black
cotton soil
Strength and durability
parameters
25% fly ash and 30% stone
gave most optimum results Ramadas et al. 2011
Stone Dust Fly ash Stabilization of black
cotton soil
Swelling properties of
black cotton soil
Addition of 20 to 30% of
the mixture eliminated
swelling properties of soil
subgrade
Ali & Koranne 2011
Limestone
Dust
Coal fly ash Stabilization of local soil Strength and durability
parameters
Improved mechanical, and
durability properties and it
was concluded that soil
sub-base and base course
subjected to light traffic
loads can be stabilized
with limestone dust and
fly.
Brooks et al. 2011
Quarry waste Cement kiln
dust
Stabilization of black
cotton soil
Strength and durability
parameters
8-16% is optimum
proportion
Amadi 2014

Literature Review
38
Waste Secondary
additive
Used as Evaluated Parameters Optimum
percentage/Conclusion
Reference
Quarry waste RAP Used as fines in sub-base
layer of pavement layer
Strength, durability, long-
term performance
Use of RAP and quarry
fines as fines is possible in
sub-base and non-
bituminous layer
Puppala et al. 2012

Literature Review
39
b) Use of Recycled Aggregates in non-Bituminous Base and Sub-Base Layer
As road construction is one of the highest material consuming industry, many
researchers have attempted to analyze potential use of waste materials in pavements.
Waste like debris from mining sites, bricks, blocks, ceramic derived at different stages
of construction activities are reformed and recycled into desired aggregate sizes and
then used in flexible pavement. Recycled aggregates (RA) have found to improve the
characteristics of sub-base and base properties. Uses of Construction and demolition
waste (C&D) in unbound layer of flexible pavement have been prominent. These
categories of waste usually include all kind of waste generated during construction
and demolition activities, majorities of which is recycled concrete aggregates,
recycled asphalt pavement aggregates obtained by crushing the material which were
constructed using conventional limestone aggregates in first place Table 2.3
summarize in brief the prominent reviewed research for use of locally generated waste
in Subgrade, Sub-base and base (non-bituminous) layer.
(Poon & Chan 2006) performed a laboratory investigation in which study was
carried out on two mixes, one containing 75% recycled concrete aggregate (RCA) and
25%clay bricks (CB) and other 50% RCA and 50% CB, mix prepared from natural
aggregates was taken as control mix. The result of this study was evaluated on the
basis of maximum dry density, physical properties of materials and CBR value. It was
found that crushed clay bricks caused an increase in water absorption, leading to a
higher OMC value and a decreased MDD. CBR test result of both replacement mix
was within code limitations, indicating their suitability as partial replacement of RCA.
(Leite et al. 2011) carried out laboratory investigation on the use of locally
generated C&D waste at Sao Paulo, Brazil as aggregate in subbase course. The waste
was a mixture of ceramic, concrete block, mortar, steel, plastic, asbestos, cement and
wood. The materials were first separated using visual inspection, sorting and magnetic
separation technique, then sieved via 4.75 mm sieve size and retained material were
used in this study. Aggregates were divided into four groups, cementitious material,
highly porous ceramic material (bricks and roof), less porous material (ceramic tile)
and crushed rocks. The mixes were evaluated on the basis of grain size, CBR value,
and resilient modulus. Physical property analysis revealed that reformed aggregates
exhibit higher water absorption, lower specific gravity, and rough surface texture

Literature Review
40
compared to virgin aggregates. Use of standard and modified compaction method was
adopted in this study and change in grain size was reported during compaction due to
aggregate breakage. Modified Proctor test result showed higher OMC, lower MDD
for all mixes containing C&D waste. Results of CBR for specimen cast on the basis
of modified Proctor test result were showed comparable results to the high quality
well-graded crushed stone material. Not much difference was observed in resilient
modulus test though it was that use of higher compaction reduced the resilient
displacement of recycled C&D aggregate by 10 to 20%. Based on test results, use of
C&D waste was recommended in an unbound layer of flexible pavement. However
strict quality control was recommended.
(Satyanarayana, Teja, et al. 2013) utilized quarry waste as aggregate and fines
in granular sub-base course. For this study, waste was transformed into aggregates of
required size and waste stone dust was procured from crusher plant. Recycled waste
aggregate was first tested for physical properties where it was established that they had
required strength, hardness and durability as per MoRT&H to be used as aggregates in
GSB. After this, aggregate was cast for six granular subbase grading prescribed by
code and test for compaction and bearing properties. Experimental investigation
showed that all mix complied with minimum code values.
In a recent study (Arulrajah et al. 2017) used RAP and CB waste as control
mixes and evaluated three variant of plastic waste namely low density polyethylene
filled with Calcium carbonate, high density polyethylene and low density polyethylene
in replacement ratio of 3% and5% in control mix in subgrade and subbase layer of
flexible pavement. The study used modified proctor test to find OMC and MDD which
showed inclusion of plastic waste reduced MDD and increased OMC. For control mix,
RAP exhibit lower OMC than CB in this study. Laboratory investigation summarized
that inclusion of plastic waste also reduced specific gravity, CBR value and UCS
satisfied the minimum requirement as per standard codes. Reason for such behaviour
was attributed to low specific gravity and smooth texture of plastic waste, which was
also visible in Scanning microscopic analysis of mixes. Based on results it was
suggested that use of plastic waste with CB and RAP is possible and should be used
in practical works.

Literature Review
41
(Arulrajah et al. 2012) studied the usability of waste excavated rock (basalt)
in the sub-base layer of flexible pavement. Waste was first crushed into desired size
aggregates, subjected to physical properties test and then evaluated on the basis of
CBR and repeated triaxial test. Physical property test showed that waste could be used
in sub-base layer as mix prepared from the waste performed satisfactorily in CBR and
repeated triaxial test. Another study by (Arulrajah et al. 2013) separated C&D waste
into a different waste namely recycled concrete aggregate, crushed clay bricks, waste
rocks, recycled asphalt pavement and fine recycle glass to study their usability in sub-
base layer of pavement. The geotechnical assessment included particle size distribution,
particle density, water absorption, compaction, Los Angeles abrasion, post-compaction
sieve analysis, flakiness index, hydraulic conductivity, CBR tests and repeated triaxial
load. Test result indicated that RCA, WR and CB performed well and satisfied every
parameter. In terms of usage in pavement sub-bases, RCA and WR were found to have
geotechnical engineering properties equivalent and in some cases superior to that of
conventional quarry granular subbase materials. CB was also found to meet the
requirements of typical granular subbase materials. The potential use of unbound layer
derived from RCA was also assessed by (Ebrahim & Behiry 2012) where partial to
full replacement of conventionally used aggregates at 25%, 50%, 75% and 100%
replacement by weight was done. Mixes were subjected to California bearing ratio
test, unconfined bearing capacity test, tensile strength test, plate load test and resilient
modulus test. The test result showed each replacement mix gave higher UCS value
than control mix. Also, an increase in strength ratio up to 10% to 20% than control
mix was also observed. The overall study found that the use of recycled concrete
aggregates was feasible in subbase course.
A field study on the use of RCA in the unbound material was carried by (Pérez
et al. 2013). In this case study, RCA treated with cement were used in base and
subbase layers as a full replacement of natural coarse aggregates. Study road at
Malaga, Spain was used to casting one section of road with RCA and other with
natural aggregates at their respective OMC and MDD obtained during laboratory
investigation. Performance evaluation was done on the basis of strength, load-bearing
capacity. Structural integrity was evaluated using high-performance dynamic
monitoring equipment and suing impact deflectometer. The seven days compaction
strength of road section prepared using RCA was almost same as that of conventional
Literature Review
42
aggregates with values of 10.15 MPa and 10.95 MPa respectively. Similar performance
was also observed in the load-bearing capacity test. Overall, the performance of RCA
was found satisfactory. Cost analysis showed that using RCA in the field will be
economical to construction projects. Hence incorporation in the field was suggested.
(Saride et al. 2010) studied performance of RAP and cement stabilized quarry
fines as pavement base material for highway extension project in Arlington, USA.
Before field implication, engineering properties of waste were analyzed where it was
observed that the free swell index of soil subgrade was 14.6%, for cement stabilized
soil it was zero and RAP had 0.8%. Both wastes had low compaction strength
compared to soil subgrade. The UCS value of cement stabilized quarry dust was about
four times greater than that of RAP, reason attributed to it was cement particles in
fines, forming dense structure due to flocculation and agglomeration between
particles. Based on laboratory investigation, two separate test section was constructed,
with one containing RAP as base material and another cement stabilized quarry fine
as base material. Existing subgrade being expansive in nature was stabilized using
lime then overlaid by base material. Data collection was twice a month, and on days
following heavy rainfall. Horizontal inclinometer and pressure cell was used to
monitor long-term performance. Field investigation showed that in first eight-month
both performed satisfactorily, after which a displacement of 10mm was recorded. This
was attributed to above average continuous rainfall prior to reading day. Pressure
censor cell reading taken once a month recorded high pressure on surface which
reduced with depth, indicating that base course was successfully transferring load to
subgrade. Surface profile investigated after 2.5 years of construction found to be in
satisfactorily condition. Overall, based on investigation, author recommended use of
quarry dust and RAP as construction material for flexible pavement.
(Lynn et al. 2016) used municipal incinerated bottom fly ash in unbound
pavement layer. Waste was first assessed on the basis of physical, chemical and
engineering properties followed by mechanical and durability performance. Laboratory
investigation revealed improved compaction in comparison to sandy gravel soil
sample. Comparable results were also obtained in permeability, elastic modulus and
shear strength test. Abrasion strength was similar to lightweight aggregates and
bearing capacity was found sufficient enough to permit its use in lower strength
structures like embankments and subbase materials. The overall outcome of the study

Literature Review
43
was that this waste could be implemented in sub-base material with no significant
drawbacks.
A study by (Zaumanis et al. 2016) critically evaluated the possibility of using
100% RAP in the pavement. Referring to earlier work carried out by the same author,
and a comprehensive literature review, this study enlisted that with technology
advancement, it has become possible that RAP can be used as a full replacement of
conventional aggregates. In this study first most suitable rejuvenator was selected to
enhance RAP properties, then these rejuvenators were added to 100% RAP mix in a
dose of 12% by weight. Results were compared with the virgin mix and non-
rejuvenated RAP mix. Tested samples were evaluated on the basis of rutting, fatigue,
and resistance to moisture where it was observed that there was a reduction in low-
temperature cracking, better resistance to moisture conditions in all specimens except
samples added with oil plant rejuvenators. A field study was also followed based on
laboratory investigation where section of the road was laid. Sample cored out of road
section after a two year trial period demonstrate good working conditions. Cost
analysis and cradle to grave analysis also established that use of 100% RAP are
feasible, economical and environmentally friendly. Performance of RAP as
replacement of conventional aggregates in base and subbase was evaluated by
(Chandra & Mandal 2017). Addition of RAP at interval of 25% i.e. 0, 25%, 50%, 75%
and 100% was done. In each mix proportion, a variable quantity of cement was added
as filler material starting from 1% cement to 6% at an interval of 1%. The evaluation
was done on the basis of change in soaked and unsoaked CBR value. The test result
showed that inclusion of cement enhanced the soaked CBR value in each replacement
mix. Based on soaked CBR value it can be ascertained that RAP can be used in sub-
base with or without any additive, however, for base course, use of RAP as a partial
replacement is suggested along with cement as filler. (Mohammadinia et al. 2017)
used lime stabilized C&D waste in crushed clay bricks, Recycled concrete aggregate,
recycled aggregate in the unbounded layer. The quantity of hydrated lime was set 1%
and5%. UCS test results established that used C&D material has required properties
to be used in the unbound layer of flexible pavement, resilient modulus was enhanced
by lime stabilization, found suitable for road construction will lower carbon footprint.

Literature Review
44
Table 2.3: Summary of Research on Use of Waste as Sub-Base and Base
(Non-Bituminous) Material.
Waste Used as Tested Parameters Result Reference
C&D mixture (ceramic,
concrete block, mortar,
steel, plastic, asbestos,
cement and wood)
aggregate in subbase
course
Physical, mechanical and
durability studies
use of C&D waste was
recommended in an unbound
layer of flexible pavement.
Leite et al. 2011
Quarry Waste As coarse and fine
aggregates in granular sub-
base material
Physical, mechanical and
durability studies
All mix complied with
minimum code values.
Satyanarayana, Teja, et al.
2013
Quarry Waste As fine aggregates in sub-
base layer
Engineering properties,
swelling properties of mix
Recommended use of quarry
dust and RAP as construction
material for flexible
pavement.
Saride et al. 2010
C&D waste
(Building rubble) As aggregates Geotechnical properties,
Bearing capacity satisfied code specification Behiry, 2015
Basalt waste As aggregate in sub-base Physical properties, Strength
and durability
Mix satisfied code provision Arulrajah et al. 2012
C&D waste As aggregate in sub-base Physical properties, Strength
and durability
Result indicated that RCA,
WR and CB performed well
and satisfied every parameter
Arulrajah et al. 2013

Literature Review
45
c) In Base and Surface Course (Bituminous)
The load distribution in flexible pavement is via grain to grain transfer. The
wheel load acting on pavement is distributed in wider area and stress is reduced with
an increase in depth. Since this layer forms the top layer of the flexible pavement,
maximum stress occurs in this layer only(Jain et al. 2013). Hence, the good quality
material is an absolute necessity. About 95% of this layer is composed of aggregates,
which are extracted from large rock formation through an open excavation and then
reduced to required aggregate sizes via mechanical crushing. To provide a sustainable
solution, researchers have studied the use of quarry waste as partial to full replacement
of conventional aggregates and filler. Table 2.4 summarizes the prominent work,
where waste was recycled as pavement material in HMA.
(Rubio et al. 2010) used waste produced from decorative quartz solid surfacing
processes as aggregates in HMA. For this study, waste was procured from scrap site
and was reduced to particles of mean diameter 0-200mm using jaw crusher. Further
reduction of particle size of mean diameter range of 6-12mm and 0-3mm was done
using impact crusher. Aggregates were first subjected to physical property test where
it was found that these recycled aggregates have the required strength, hardness and
durability as required for conventional pavement material. Four different mixes were
prepare, one made of 100% coarse and fine recycled quartz aggregates, second mix
made of 100% recycled coarse aggregates and 100% conventional fines, mix three
contained 50% coarse recycled aggregates and 50% conventional coarse aggregates
with 100% fine conventional aggregates and mix four replacing 50% conventional
coarse and fine with recycled aggregates. To find optimum binder content Marshall
Test was used where all samples satisfied required code parameters. Long-term
performance was analyzed using immersion-compression test and wheel tracking test,
in which again samples performance was found satisfactory. The laboratory
investigation was then followed by field investigation, where four road sections were
laid with four different replacement gradations were used for testing. No specific
hurdle was encountered on laying and compacting of mixes. Sample of material
coming out from spreader was again evaluated for immersion compression test and
wheel tracking test where striking resemblance among field and laboratory results
were observed. A macro texture study of compacted field specimen also supported

Literature Review
46
admirable performance of mixes. Based on test result, use of recycled quarry waste
up to 50% replacement of coarse and fine aggregates was advocated.
(Akbulut & Gürer 2007) used marble quarry waste as aggregates in HMA. In
this study, marble quarry waste was reformed into aggregates and was compared with
two variants of conventionally used limestone aggregates and aggregates derived from
high-quality volcanic rock andesite. All aggregates were evaluated on the basis of
physical properties and Marshall test parameters. The test results showed that, among
all variety of aggregate used, marble aggregates had maximum abrasion loss, highest
impact value, and highest flakiness index. Marshall test result showed that binder
content was within the prescribed limit, stability value was higher than conventional
limestone aggregates, but less then andesite aggregates. The study suggested that use
of marble as aggregate is possible in medium to low traffic roads. Similarly, (Nejad
et al. 2013) also used recycled marble aggregates (RMA) as replacement of virgin
aggregate in HMA.60/70 penetration grade bitumen was used as adhesive in this study
and RMA was used as a replacement of virgin aggregates at 15, 25, 40, and 60% by
weight in the mix design. Each sample was tested for resilient modulus, indirect
tensile fatigue, dynamic creep, and indirect tensile strength ratio to evaluate the field
performance suitability of HMA. Resilient modulus of samples was assessed at three
different temperature of 5°C, 25°C and 45°C for better understanding the behaviour
of each mix. With and without RMA, resilient modulus was observed to be decreasing
which was attributed to the sensitivity of binder toward elevated temperature
conditions, with the inclusion of RMA, resilient modulus was observed to be reducing.
Same was observed for fatigue failure, where, increasing RMA proportion reduced
the cycle number. However it was observed that each RMA replacement sample
satisfied minimum criteria necessary for a material to be used for low volume roads,
and hence, the author suggested that up to 60% RMA can be used efficiently as a
partial replacement to virgin aggregates in low volume roads. Studies pertaining to
the potential use of marble waste in the flexible pavement was also done by(Karaşahin
& Terzi 2007),here, marble dust was used as filler to study behaviour in HMA, 75/100
grade penetration binder was used as adhesive in this study. Marble dust generated
during cutting and shaping process of marble blocks was collected, sieved and used
as 100% replacement of conventional limestone dust in the asphalt mixtures. The mix

Literature Review
47
was tested for Marshall stability and dynamic plastic deformation. In terms of stability,
similar performance was observed in control mix and replacement mix. However, higher
plastic deformation was observed in a mix containing marble dust as filler but was
overall performance was found suitable enough for low volume roads. Use of marble
dust as filler was also analyzed by (Abed & Eyada 2012), where the mix was prepared
using 100% marble dust and was tested for Marshall stability, ITS, TSR and dynamic
creep. Findings of this study also recommended the use as marble dust as filler.
Another study by (SevilKofteci & Niyaziugurkockal 2014) used marble waste as fines
in HMA, using 50/70 penetration grade bitumen as a binder. Replacement ratio was
kept 50%, 100% by weight of conventional fine aggregates. The test result showed
that mix containing RMA fines improved stability value, reduced binder content and
provided greater flexibility to mix and suggested the use of RMA as 100%
replacement of fines in the binder layer.
Like marble, granite is another type of dimensional stone that is used
exhaustively in the construction industry for flooring and other decorative purposes.
A Huge amount of granite waste is generated around the globe every year (Hamza et
al. 2011)(Lokeshwari & Jagadish 2016).Studies are available where researchers have
successfully used it in concrete as fines, filler, aggregates etc. (Medina et al. 2017)
(Aydin et al. 2017). However, its use in flexible pavement has been evaluated recently.
(Šernas et al. 2014) used granite waste as 100% replacement of conventionally used fines
in HMA. Results were evaluated on the basis of Marshall stability, ITS, and rut depth.
The performance of mix containing granite fines was found inferior to control mix,
and 100% replacement of conventional fines with granite fines was not recommended.
However, no comment was made on partial replacement of the mix. Another
preliminary laboratory investigation by (Kiran Kumar et al. 2014) used granite waste
as aggregate in open-graded friction course. Mix was prepared using granite waste
reformed into an aggregate of the required size and tested for durability, permeability
and drain down. The test result showed that mix satisfied required criteria set by
respective code and can be used in open graded friction courses. However further
performance studies test were advised before being used in the field.
Andesite, a variety of volcanic rock, rich in silica has been used in construction
and decorative purpose in Turkey for a long time. (Uzun & Terzi 2012) used andesite
waste procured from cutting and polishing as mineral filler in HMA. 75–100

Literature Review
48
penetration grade asphalt cement was used in this study, mixtures with limestone
aggregate and limestone mineral filler were prepared and used as control mix. The
replacement ratio was kept as 4, 5, 6, 7, and 8% by weight. Stability value was
observed to increase up to 6% replacement, which was found greater than that
obtained in control mix. Study suggested using andesite waste as filler instead of
conventional limestone filler in areas where this waste is easily accessible and using
it does not compromise overall cost of project.
Use of ballast, a dark, fine-grained volcanic rock was evaluated by (Ibrahim
et al. 2009) as replacement of conventionally used limestone aggregates. For this
study, quarry waste was first reformed into required aggregates sizes and then were
added as replacement of virgin aggregates. Three different replacement mixes were
made, one containing100% basalt coarse and fine aggregates, second having coarse
limestone aggregate being entirely replaced by coarse basalt aggregates, and the third
100% replacing LS fine with basalt fines. Results were evaluated on basis of Marshall
stability, indirect tensile strength, resilient modulus, rutting, fatigue and creep
behaviour of mixes. Study used 60/70 penetration grade bitumen. Mix containing
basalt as fine aggregates failed in water sensitivity test and were deemed unfit for
further testing. Dry-ITS value of remaining two mixes gave increased values,
however, decreased tensile strength ratio was observed, this was attributed to low
porosity of basalt which prevented absorption of asphalt and resulted in low bond
strength. To counter the problem, mineral filler was replaced by hydrated lime, after
which value was found in compliance with specifications. Dynamic creep test results
of mix containing coarse basalt aggregates and fine limestone aggregates showed
minimum deformation. Similar behaviour was observed in resilient modulus test
where, when tested at 25°C, mix containing coarse basalt aggregate showed a 219%
increase in resilient modulus value compares to control sample. At 40°C, the resilient
modulus value increased from 430MPa of control sample to 896MPa of sample
containing coarse basalt aggregates. Superior Marshall strength suggested proper
interlocking and hardness of basalt aggregates. Overall based on test results, that best
performance was obtained from samples having coarse basalt aggregates and fine
limestone aggregates, and use of same was suggested. Study on similar ground was

Literature Review
49
proceeded by (Karakus 2011) where basalt waste obtained from stone processing site
was used in SMA. The aggregate was tested for physical properties, chemical
compositions and then used in mix design as a full replacement of virgin aggregates,
using 50/70 grade bitumen modified by adding 5% polymer and .4% fibre. Marshall
test parameter was used to evaluate mix properties, and it was found that mix prepared
with basalt aggregates gave high stability values. Parameters like flow value, void
filled with bitumen (VFB) and void in mineral aggregates (VMA) were within code
standards.The study concluded that it is feasible to use basalt aggregate in SMA.
(Sung Do et al. 2008) replaced filler in HMA with waste lime produced as a
by-product of Soda ash manufacturing process. The replacement ratio for this study
was kept 25%, 50% 75% and 100%, and each sample was evaluated on Marshall
stability, ITS, resilient modulus, permanent deformation, moisture susceptibility and
fatigue resistance. PG 64-22 grade bitumen was used as binder for mix preparation.
Each mix satisfied minimum stability, flow value and Marshall Quotient. No
significant difference was observed in ITS test where all samples satisfied minimum
required values. When subjected to lower temperature, i.e., 20° C and 0°C, sample
containing waste lime gave better results, establishing that waste lime as miner filler
improved resistance to low resistance cracking. In repeated indirect load tensile test,
sample containing 50%, 75% and 100% lime waste as filler gave better results than
control sample. Rutting resistance, assessed using wheel tracking, showed
improvement with increase of lime waste in the mixes. Overall study advocated use
of dominant calcium compound waste as filler in HMA, as calcium is effective in
improving striping resistance of asphalt concrete.

Literature Review
50
Table 2.4: Summary of Research on Use of Stone Waste in HMA.
Waste Used as Test Parameters Conclusion Reference
Marble quarry waste Aggregate in base course Physical properties, Strength
and stability
Recycled marble
aggregates had sufficient
strength and stability
Akbulut & Gürer 2007
Marble waste Aggregate in base course Physical parameters, Strength,
Stability, long-term
performance
60% RMA can be used
efficiently as a partial
replacement to virgin
aggregates in low volume
roads
Nejad et al. 2013
Marble Dust Filler Strength, stability and
durability
Marble dust performed
similar to limestone dust
and can be used as filler
Karaşahin & Terzi 2007
Marble Dust Fines Strength, durability and
stability
Improved stability value,
can be used as 100%
replacement of
conventional fines
Abed & Eyada 2012
Ballast quarry waste Coarse and fine aggregates
in HMA in individual and
combined form
Strength, Stability, Durability,
moisture susceptibility, long-
term performance
Best performance was
obtained from mix
containing 100% basalt
coarse aggregates and
conventional fine
aggregates
Ibrahim et al. 2009
Ballast quarry waste Aggregate in stone matrix
asphalt Strength and Stability Mix containing recycled
waste gave better stability
values.
Karakus et al. 2011

Literature Review
51
Waste Used as Test Parameters Conclusion Reference
Decorative quartz cutting
waste
Aggregates in HMA Strength and Stability 50% replacement of coarse
and fine aggregates was
advocated
Rubio et al. 2010
Granite waste Aggregates in Open grade
friction courses
Durability, permeability and
drain down
Mix satisfied required
criteria set by respective
code and can be used in
open graded friction
courses
Kiran Kumar et al. 2014
Andesite Filler in HMA Strength Can be used as filler in
replacement of limestone
filler is feasible.
Uzun & Terzi 2012
Waste lime Filler in HMA Strength, Durability and long-
term performance
Satisfied minimum
strength value and
improved resistance to
cracking.
Sung Do et al. 2008
Asphaltite As filler in HMA Physical properties, Strength
and stability.
Improved resistance to
moisture damage and
fatigue life.
(Yilmaz et al. 2011

Literature Review
52
II) Use of Kota Stone as Construction Material.
Studies have been conducted in the past where use Kota stone quarry and
slurry waste as construction material has been evaluated.
a) In Manufacturing of High Strength Binder.
A project was undertaken by ASI (K) Ltd. in collaboration CBRI, Roorkee to
utilize Kota stone quarry waste in manufacturing of high strength binder. Based on
physicochemical test it was established that Kota stone quarry and slurry waste has
potential to manufacture a high strength binder. To achieve this, waste was first
broken in aggregates of small size and mixed with coal. Mixture was then calcined in
shaft kiln at temperature above 900 °C for four hours. During this calcination process
lime in Kota stone was mixed with coal ash, which itself inherits pozzolanic
properties. The output material was grounded and passed through IS 15 sieve size.
Preliminary investigation showed that obtained binder material satisfied soundness
and water retention limit as prescribed by IS: 2250-1967. 28-day compressive strength
of mixture containing manufactures binder prepared at 1:3 proportion was found to be
more than conventional hydraulic lime. To further evaluate its performance as mortar, a
wall was constructed and plastered using 1:3 ratio (manufacture lime: conventional
sand). No abnormality or deleterious behaviour was reported during one year test
period of this study.
b) In Manufacturing of High Strength Bricks.
ASI (K) Ltd. used Kota stone polishing waste and calcined quarry waste in
manufacturing of soda lime bricks. The study used two proportions for this, one
having slurry waste and polishing waste in proportion of 20% and 80% respectively
and other adding slurry waste, polish waste and river sand in proportion for 50%, 30%
and 20% respectively. Mixture was tested for compressive strength test where it was
observed that strength obtained was 150 to 180 kg/cm2 , which was much better than
that obtained for conventional bricks giving strength in range of 20-30 kg/cm2 .
c) In Cement Concrete.
A preliminary investigation carried at Civil Engineering Department of Kota
Engineering College, Kota, Rajasthan, used Kota stone slurry and fines as replacement
of conventional sandstone fine aggregates in proportion of 15%, 30%, 45%. Each
Literature Review
53
mix was evaluated for 28 and 60 days compressive strength. Test result showed that
15% replacement mix gave satisfactory performance while in other a considerable
decrease in strength was observed.
In a detailed laboratory investigation carried by (Rana et al. 2016), Kota stone
quarry waste and slurry waste was utilized as fine aggregates in cement concrete. The
study used three variants of waste, i.e. quarry waste crushed into sand designated as
crushed sand; Kota stone slurry obtained from dumping ground, and a manufactured
sand, obtained by combining slurry and crushed sand in a different proportions and
adopting trial percentage giving maximum bulk density (15% slurry and 85% crushed
sand). Mix was cast on two water-cement ratios i.e. 0.45 and 0.55. The replacement
was done in step of 20% by dry weight of fine aggregates. All 26 replacement samples
were tested for change in workability, compaction factor, slump, bleeding, effect of
waste on void ratio, strength and permeability. Test result showed that where
introduction of slurry reduced workability, increased bleeding, the use of manufacture
sand improved workability and reduced bleeding to zero. Use of crushed sand up to
20% was observed to give required workability and slump. In term of compressive
strength, 100% crushed sand reduced strength of mix by 21% of control mix, while
improvement in strength was observed till 10% inclusion of slurry at both water-
cement ratios. Inclusion of manufactured sand, however, improved strength of concrete
and continued incremental trend till 100% replacement. Similar observations were made
in permeability test, where, inclusion of manufacture sand reduced permeability value
and inclusion of crushed sand increased the values consistently. Using slurry till 20%
replacement level reduced the permeability after which an increasing trend was
followed. Based on the test results, author suggested that use of manufactured sand
can completely replace river sand in concrete.
d) As Stabilizing Material for Black Cotton Soil.
Soil stabilization of black cotton soil using fly ash and Kota stone slurry was
investigated by Kalla et al. 2009. The scope of study was limited to evaluation of
change in workability and strength properties upon addition of the two waste in
different proportions. The study was divided into four groups where, in group one, fly
ash was added in step of 3% till 21% by weight of soil sample. In group two, Kota stone
slurry was added in similar fashion. Group three contained fixed proportion of fly ash

Literature Review
54
(18%) and addition of KSS in variable proportion in step of 3% up to 21%; in group
four, percentage replacement of KSS was fixed 18% and fly ash was added in variable
proportions, starting from 3% and going up to 21% in step of 3%. Study concluded
improvement in workability in all mixes, with mix containing 21% fly ash and 18%
Kota stone giving least plasticity index value among all test groups. The best soaked
CBR value was obtained for mix containing 3% fly ash and 18% KSS. The study
supported the use of both waste material to improve soil properties.
e) As Aggregates in Flexible Pavement.
Mohit Sharma (2013) did a preliminary investigation on possibility of using
Kota stone quarry waste as coarse aggregates in base course. For this study, quarry
waste were first derived into aggregates of required sizes, they were then subjected to
physical property test. Test result showed that recycled stone has desired strength,
hardness and stripping value, making them suitable to be used as aggregates. The
study further evaluated bituminous concrete mix prepared with 100% Kota stone
waste and tested strength and stability values as per MoRT&H 2013. Test result was
compared with control mix prepared with conventional materials. Test result indicated
that mix prepared with 100% Kota stone waste satisfied required strength, stability
and flow values. The mix gave comparable results with respect to control sample.
Another study by Pawan Patidar (2014) evaluated the use of reformed Kota stone
aggregates (KSA) in Wet Mix Macadam (WMM) and Water Bound Macadam
(WBM). The KSA was first tested for physical properties, and then mixes were
evaluated for load-bearing capacity using CBR test. Test result indicated that made of
KSA satisfied minimum CBR value and deemed suitable to be used for WBM and
WMM mixes.
f) As Binding Material in Mortar Mixes.
A preliminary investigation carried out by (Harshwardhan et al. 2017)
investigated possibility of using Kota stone slurry waste as replacement of cement in
mortar mixes. Test results were evaluated on the basis of change in compressive and
flexure strength values. Replacement of cement was done in step of 5% till 30%. Test
result indicated that up to 10% replacement of cement with fine slurry improved
strength properties of mix.

Literature Review
55
g) As Carbonate Source in Production of Ternary Cement.
(Krishnan et al. 2018) evaluated the possibility of using Kota stone mining
waste, marble waste along with calcined clay as a reactive component in cement
hydration process in ternary cement blend. The raw material were mixed by mass,
with quantity of ordinary Portland cement, calcined clay and waste material being
55%, 30% and 15% respectively. Hydration process and 1, 3,7, 29 and 90 days
compressive strength of the mixes were studied. Test results advocated the use of Kota
and marble stone dust as the source of carbonate in ternary cement. The presence of
stone dust stabilized ettringite and formed carboalumination during hydration process.
28 days compressive strength was found better than OPC, reason for which was
attributed to formation of stratlingite, occupying more volume in the mix.
2.3 Summary of Literature Review.
1. Limestone Waste as Subgrade Material.
Literature suggests that use of limestone waste have a positive impact on soil
properties. A general trend of increase in plasticity limit and a decrease in liquid limit
was observed with inclusion of this waste in all type of soil. Improvement in plastic
limit and decrease in plasticity index improves workability and compaction
characteristics of soil (Gadre & Chandrasekaran 1994), (Bomag 2004). A well-
compacted soil subgrade ensures better support to overlying layers and promises
longer lifespan of flexible pavements. Conventionally used stabilizing material like
lime and cement improve compaction properties of soil by mechanism like cation
exchange, flocculation and agglomeration reaction, hydration, pozzolanic reaction and
potential carbonation (Sargent 2015), these process increase the dry density and load
bearing property of sub-grade. Investigation carried by authors using locally generated
waste containing calcium oxide as dominant chemical compound reported similar
chemical activities taking place in waste stabilized soil. Another prominent
observation was that use of quarry and slurry waste have high percentage of fine
particles (particles < 75µ), incorporating them in soil as additive resulted in denser
well-compacted structure. Studies have reported a general trend of an increase in
maximum dry density and decrease in optimum moisture content, advocating the use
of stone dust and slurry use as additive in soil. This improvement in workability and
dry density had positive impact on the mechanical and durability properties of soil

Literature Review
56
subgrade. Under similar compaction force, the bearing capacity of soil, evaluated
using CBR test, was observed to improve upon the addition of limestone waste and
quarry dust in the soil sample; similar were the observations in UCS test, where
inclusion of waste improved the durability properties of soil sample. The reason
attributed to this behaviour was fine slurry particle improving the gradation of mix,
resulting in dense and compacted structure. Incorporation of limestone waste reduces
swelling in expansive soils. The reason attributed to such behaviour are the non-
expansive nature of waste added to soil sample and, reduction in clay content of the
sample(Ban & Park 2014).
2. Limestone Waste as Non-Bituminous Sub-Base and Base Course.
Limited studies are available where limestone quarry waste has been used as
construction material for granular sub-base course. Except for (Satayanarayan et al.
2013), no specific study pertaining to use of limestone waste as granular base and sub-
base course is available. The study suggests that aggregate derived from mining waste
has required strength and hardness as required for aggregates as granular sub-base
material.
3. Limestone Waste as Aggregates in HMA.
Though ample literature is available where performance of HMA containing
stone waste material as coarse aggregates, fine aggregates and filler still no
comprehensive study pertaining to use of dimensional limestone waste as HMA was
available. A Few preliminary investigations are available where suitability of
dimensional stone in HMA has been evaluated by reforming them into coarse and fine
aggregates and filler. Physical property assessment of these mixes unanimously
supported the use as aggregates and filler material in HMA. Studies suggest that
bituminous mixes containing waste improve strength and satisfy minimum durability
requirement as per code. Use of limestone waste was found limited to BC and DBM
mixes, not a single study was found on its use in OGFC mixes.
It was evident that limestone quarry and polishing waste produced has
potential to be used as construction and building material. However, the quantity of
waste that can be used depends upon various factors like accessibility, petrography
and quality of waste etc. To assess the suitability of any waste material as construction

Literature Review
57
and building material, it must satisfy specific physical, mechanical and durability
requirement as per standards. For any stone waste to be used as flexible pavement
material it should be tested properties as mentioned in Table 2.5, Table 2.6 and Table
2.7. No comprehensive study was available on use of Kota stone slurry and stone
waste as pavement material.
Table 2.5: Property Analysis for Soil Subgrade
Test Name Property Code
Gradation of soil using Sieve
analysis.
Particle size distribution. IS 2720 Part IV (1985)
Liquid Limit, Plastic Limit
and Plasticity Index of soil.
Atterberg limit. IS 2720 part V (1985)
Standard Proctor Test. Optimum Moisture content
and Maximum dry density.
IS 2720 part VII (1980)
Specific Gravity of soil
specimen.
Density of soil specimen. IS 2720 part III (1980)
California Bearing Ratio
(CBR).
Mechanical property of soil. IS 2720 part XVI
(1987)
Unconfined Compressive
Strength of Cohesive Soil.
Durability and Strength
property of soil.
IS 2720 part X (1991)
Free Swell Index test. Swelling property. IS 2720 part XL
Table 2.6: Physical Properties Test for Aggregates
Test Name Property Code
Los Angeles Abrasion loss
Strength IS:2386 Part IV (1963)
Impact Test
Water Absorption Test Water Absorption IS:2386 Part III (1963)
Flakiness and Elongation Index Particle Shape IS 2386 Part I (1963)
Specific Gravity Density of aggregates IS:2386 Part III (1963)

Literature Review
58
Table 2.7: Test and Codes Followed to Evaluate HMA Mixes.
Test Property Code
Marshall mix
design
method
To find optimum binder content (= average
value of binder content giving maximum
stability, percentage air voids and maximum
specific gravity)
Assessing samples on the basis of stability
value, flow value and Marshall quotient
(MQ={stability/flow})
Manual Series-2
Asphalt mix
design
Indirect
tensile
strength
Tensile deformation ASTM D 6931
Tensile
strength ratio Water sensitivity of mixes AASTHO T-283
Resilient
modulus test
Used to investigate the mechanical property of
mix, behaviour under moving load condition and
evaluate low temperature cracking as an index to
assess stripping and fatigue performance
ASTM D 4123
Dynamic
creep test
This test gives good correlation with measured
field rut depth that
BS DD 226
For OGFC only
Cantabro test Durability is measured by measuring breakdown
of compacted specimen
ASTM C131
Aged
Cantabro test
Mix Durability ASTM C131
Drain down
test
Measure the amount of drain down from an
uncompacted sample
AASHTO T 305
Falling head
permeability
test
Permeability of water through samples. ASTM D3637

59
CHAPTER-3
EXPERIMENTAL PROGRAMME
To evaluate Kota stone slurry and aggregate as pavement material black cotton
soil, Kota stone slurry and stone samples were procured at road material testing
laboratory of MNIT Jaipur.
Black cotton soil (BCS) used for this study was procured from Kota city; Kota
stone slurry (KSS) and mining waste was procured from processing units and landfill
sites of Kota and Jhalawar region. The material was collected from five different
locations of dumping site; this was done in order to compensate the variability, if any,
in quality. Quarry waste was transported to crusher site, where it was crushed into
aggregates of size ranging from 19mm to 0.75mm using commercial jaw crusher.
Aggregates of size greater than 19mm were hand crushed at Malaviya National
Institute of Technology, derived from selected samples of Kota stone quarrying and
cutting waste. In-situ soil sample contained moisture and lumps. Before starting
experimental investigation, material was visually inspected for presence of any
impurities like pebbles, stone etc. and removed if any.
3.1 Soil Subgrade: Experimental Investigation and Sample Preparation
a) Chemical Analysis
The chemical composition of Kota stone slurry and Black cotton soil was
determined at the Centre for Development of Stones, Jaipur (Rajasthan). Test results
are summarized in Table no. 4.2., Kota stone slurry had calcium oxide as major
constituent (37.15%), whereas in black cotton soil sample the dominant compound
was SiO2 having a total share of 65.45%.
b) Sieve Analysis
To determine the grain size distribution of soil and slurry sieve analysis was
performed. Particle size greater than 75 microns were analyzed using mechanical
sieve analysis as per IS 2720 part IV (1985). Particle size distribution of material finer
than 75 microns was done using laser diffraction particle size analyzer.

Experimental Programme
60
c) Atterberg limit
Soil classification was done based on its liquid limit (LL), plastic limit (PL)
and plasticity index (PI) properties. Liquid limit is defined as percentage water content
at which soil changes from liquid state to plastic state, and is determined using
Casagrande’s device.
Plastic limit is defined as percentage water content at which soil sample changes
from plastic to semi-solid state. The difference of LL and PL is called Plasticity Index.
LL, PL and PI of each replacement mix were determined as per IS: 2720 Part
V (1985), shown in Figure 3.1. For the preparation of test samples, first soil and slurry
were mixed uniformly at desired proportion, and then the mixture passing 425 micron
sieve was used for testing purpose.
Figure 3.1 Liquid Limit and Plastic Limit Testing
d) Optimum Moisture Content and Maximum Dry Density
Soil compaction is the process in which stress is applied mechanically over
soil to increase its density. Application of stress displaces air present between soil
particles. Addition of water acts as lubricant, enabling easy movement of soil particle
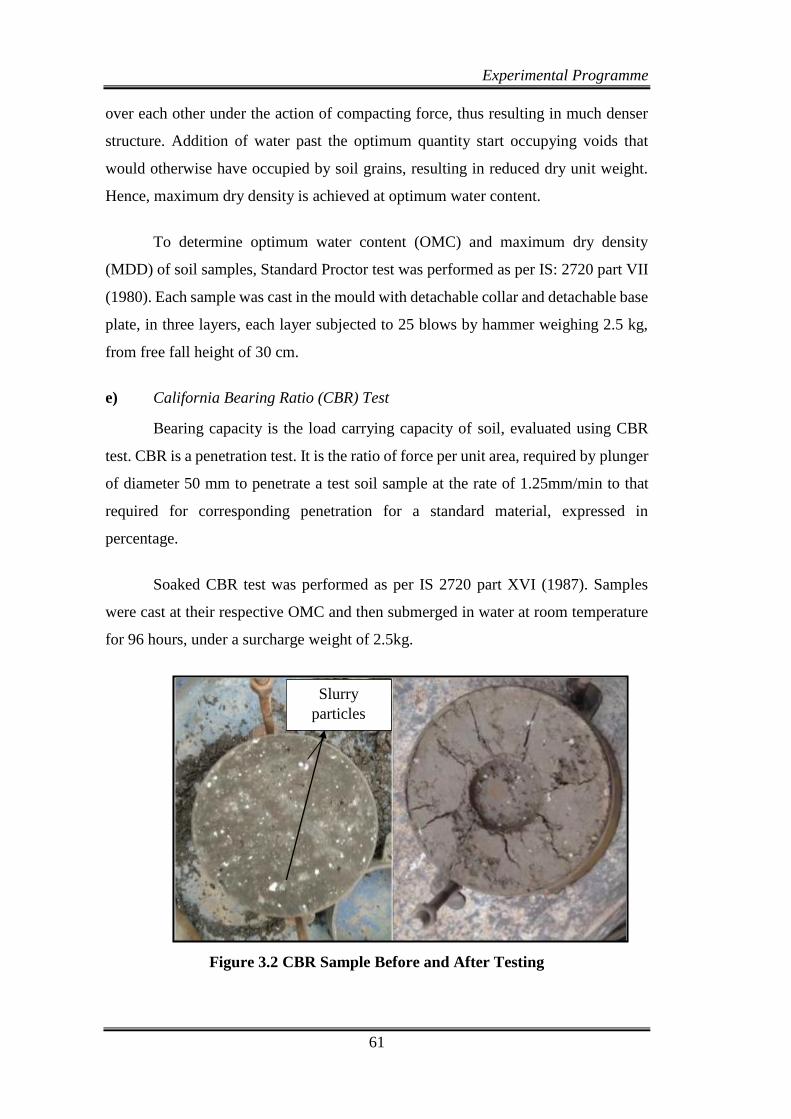
Experimental Programme
61
over each other under the action of compacting force, thus resulting in much denser
structure. Addition of water past the optimum quantity start occupying voids that
would otherwise have occupied by soil grains, resulting in reduced dry unit weight.
Hence, maximum dry density is achieved at optimum water content.
To determine optimum water content (OMC) and maximum dry density
(MDD) of soil samples, Standard Proctor test was performed as per IS: 2720 part VII
(1980). Each sample was cast in the mould with detachable collar and detachable base
plate, in three layers, each layer subjected to 25 blows by hammer weighing 2.5 kg,
from free fall height of 30 cm.
e) California Bearing Ratio (CBR) Test
Bearing capacity is the load carrying capacity of soil, evaluated using CBR
test. CBR is a penetration test. It is the ratio of force per unit area, required by plunger
of diameter 50 mm to penetrate a test soil sample at the rate of 1.25mm/min to that
required for corresponding penetration for a standard material, expressed in
percentage.
Soaked CBR test was performed as per IS 2720 part XVI (1987). Samples
were cast at their respective OMC and then submerged in water at room temperature
for 96 hours, under a surcharge weight of 2.5kg.
Figure 3.2 CBR Sample Before and After Testing
Slurry
particles

Experimental Programme
62
f) Resilient Modulus
Resilient modulus is measure of elastic recovery of subgrade under moving
load condition. Due to the absence of repetitive triaxial facility, resilient modulus of
soil samples was calculated based on the correlation equation given by IRC 37: 2012
between CBR value and resilient modulus; mentioned as follows:
MR= 10* CBR for CBR ≤ 5 --------------------- (9)
MR= 17.6* (CBR) 0.64 for CBR>5 ------------------- (10)
Where, MR= resilient modulus of subgrade in MPa
g) Unconfined Compressive Strength Test
Unconfined compressive strength (UCS) test is a special case of triaxial
strength, conducted on cohesive soil. Here, the confining pressure is zero, and a
cylindrical sample is tested under constant strain without lateral support. The failing
compressive load per unit area of the specimen is called its unconfined compressive
strength. The test was performed per IS 2720 part X (1991); test setup shown in Figure
3.3 The samples were tested for both dry and wet condition both. UCS samples were
prepared at their respective OMC. In dry-UCS, samples were tested immediately,
while in wet-UCS, samples were cured by wrapping in airtight polythene and
submerging in water for seven days prior to testing.
Formula used for calculating UCS is as follows:
qu = 𝑃
𝐴 ………………… (11)
Where, qu= Unconfined compressive strength (KN), P is Maximum load in KN, A is
corrected area, obtained using formula, A = 𝑎
1−ɛ, where a is initial area of specimen,
is axial strain, ratio of change in length to original length of sample. The shear
strength of cohesive soil sample is half the value of the unconfined compressive
strength obtained for sample.
Shear strength = qu/2 ………………… (12)

Experimental Programme
63
Figure 3.3 UCS Test Setup
h) Free Swell Index
Free swell index test measures net increase in volume of soil under submerged
condition, without action of any external constraints. The test was performed as per IS:
2720 part XL (1977). Ten grams of oven dried sample passing 425-micron sieve was
used for this study. Each specimen was poured in two glass graduated cylinder of
100ml capacity. One cylindrical test tube was filled with kerosene oil and other with
distilled water up to 100ml. After removal of entrapped air, samples were left for 24
hours and then final volume change was noted, and free swell index was calculated
using formula
Free swell index = 𝑉d−𝑉k
𝑉𝑑 x100 ………….. (13)
Where,
Vd = Soil specimen volume read (in cm) from graduated cylinder after 24 hours, read
from cylinder containing distilled water
Vk=Soil specimen volume read (in cm) from graduated cylinder after 24 hours, read
from cylinder containing distilled kerosene
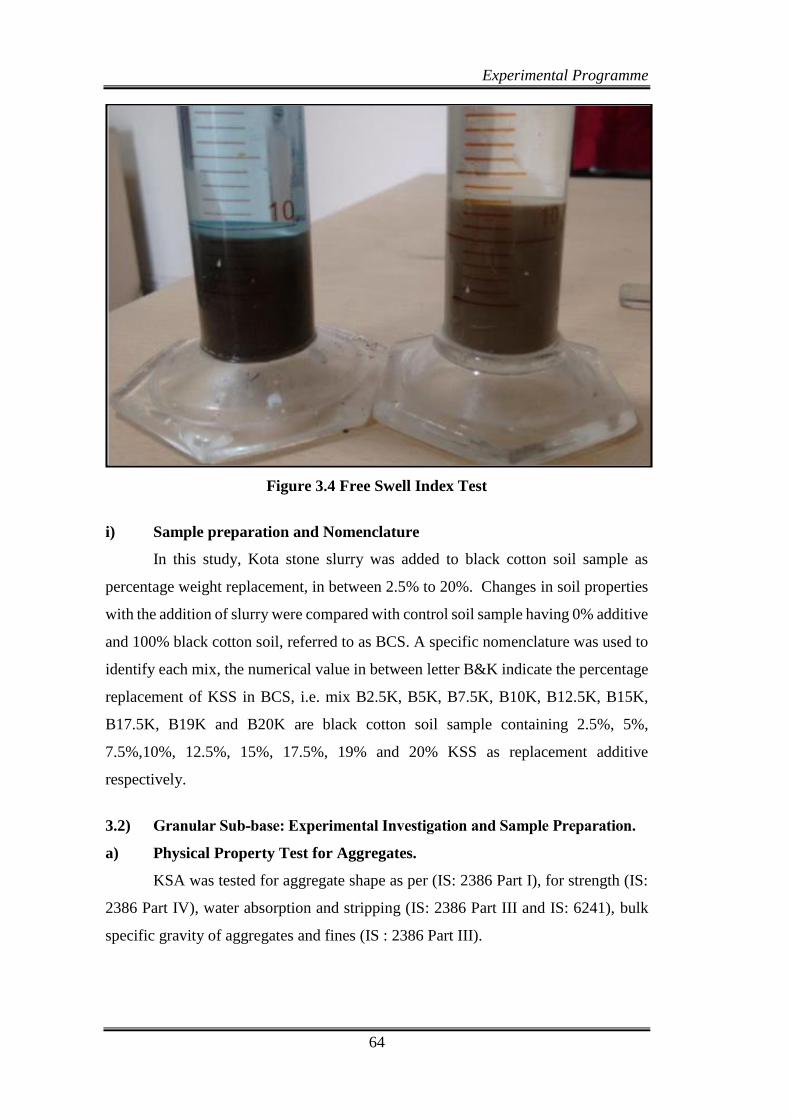
Experimental Programme
64
Figure 3.4 Free Swell Index Test
i) Sample preparation and Nomenclature
In this study, Kota stone slurry was added to black cotton soil sample as
percentage weight replacement, in between 2.5% to 20%. Changes in soil properties
with the addition of slurry were compared with control soil sample having 0% additive
and 100% black cotton soil, referred to as BCS. A specific nomenclature was used to
identify each mix, the numerical value in between letter B&K indicate the percentage
replacement of KSS in BCS, i.e. mix B2.5K, B5K, B7.5K, B10K, B12.5K, B15K,
B17.5K, B19K and B20K are black cotton soil sample containing 2.5%, 5%,
7.5%,10%, 12.5%, 15%, 17.5%, 19% and 20% KSS as replacement additive
respectively.
3.2) Granular Sub-base: Experimental Investigation and Sample Preparation.
a) Physical Property Test for Aggregates.
KSA was tested for aggregate shape as per (IS: 2386 Part I), for strength (IS:
2386 Part IV), water absorption and stripping (IS: 2386 Part III and IS: 6241), bulk
specific gravity of aggregates and fines (IS : 2386 Part III).

Experimental Programme
65
Summary of physical strength and durability test performed are as follows:
1. Los Angeles Test
This test is used to assess aggregates hardness and abrasion characteristics by
measuring resistance against abrasion and attrition. Aggregates are put in Los Angeles
testing machine, along with steel balls of diameter 47 mm. The sample is then
subjected to 500 revolutions. Material obtained after 500 revolutions is passed from
1.7mm sieve size, and percentage loss of material is calculated using formula:
Percentage loss=𝐼𝑛𝑖𝑡𝑖𝑎𝑙 𝑤𝑒𝑖𝑔ℎ𝑡−𝐹𝑖𝑛𝑎𝑙 𝑤𝑒𝑖𝑔ℎ𝑡
𝐼𝑛𝑡𝑖𝑎𝑙 𝑤𝑒𝑖𝑔ℎ𝑡×100 …….. (14)
2. Impact Test
Impact test measures the toughness of aggregates. This is assessed by percentage
loss of material when subjected to 15 blows by hammer weighing 13.5 kg, free falling
from height of 380mm. Aggregates passing 12.5mm sieve and retained on 10mm sieve
are adopted for testing.
Aggregate impact value = 𝑊𝑒𝑖𝑔ℎ𝑡 𝑜𝑓 𝑝𝑜𝑟𝑡𝑖𝑜𝑛 𝑝𝑎𝑠𝑠𝑖𝑛𝑔 2.36𝑚𝑚 𝑠𝑖𝑒𝑣𝑒
𝑁𝑒𝑡 𝑤𝑒𝑖𝑔ℎ𝑡 𝑜𝑓 𝑎𝑔𝑔𝑟𝑒𝑔𝑎𝑡𝑒𝑠 𝑖𝑛 𝑐𝑦𝑙𝑖𝑛𝑑𝑟𝑖𝑐𝑎𝑙 𝑠𝑡𝑒𝑒𝑙 𝑐𝑢𝑝x100 …….. (15)
3. Water Absorption and Specific Gravity Test
Water absorption test and specific gravity test are considered to be a measure
of strength and quality of aggregates. Higher specific gravity and lower water
absorption indicate good quality aggregates. Recommended specific gravity range for
aggregates as pavement material is 2.5gm/cc to 3gm/cc and water absorption should
not be more than 2%. These tests were performed as per IS 2486 part III (1963).
Formula used to calculate the parameters are as follows:
Specific Gravity =𝐷𝑟𝑦 𝑊𝑒𝑖𝑔ℎ𝑡 𝑜𝑓 𝑎𝑔𝑔𝑟𝑒𝑔𝑎𝑡𝑒𝑠
𝑊𝑒𝑖𝑔ℎ𝑡 𝑜𝑓 𝑒𝑞𝑢𝑎𝑙 𝑣𝑜𝑙𝑢𝑚𝑒 𝑜𝑓 𝑤𝑎𝑡𝑒𝑟 =
𝑊4
𝑊3−(𝑊1−𝑊2) …….. (16)
Water Absorption = percentage by weight of water absorbed in terms of oven dried
weight of aggregates = (𝑊3−𝑊4)
𝑊4* 100 …….. (17)
Where,
W = Weight (grams) of saturated aggregates suspended in water with basket.
W2 = Weight (grams) of basket suspended in water in grams.
W3 = Weight (grams) of saturated surface dry aggregate in air in grams.
W4 = Weight (grams) of oven dry aggregates in grams.

Experimental Programme
66
4. Shape Test
This test is conducted to find flakiness and elongation index of aggregates.
Flakiness index is defined as percentage by weight of particle whose least thickness
is less than 0.6 times mean dimension. Elongation index is the percentage by weight
of particle whose greatest dimension is higher than 1.8 times the mean dimension.
Presence of flaky and elongated particles are considered undesirable because their
inherent weakness leads to breaking under heavy load, thus compromising the
structural integrity of pavement. The apparatus consists of a standard thickness gauge
and a standard length gauge. The test proceeded as per IS 2386 part I (1963).
5. Stripping Test
This test is used to find the adhesion property of aggregate with binder under
adverse condition. It is a visual test in which aggregate passing 20mm sieve and
retained on 12.5mm are taken for the study. About 200gm of aggregates were mixed
with bitumen amounting to 5% by weight of aggregates. Aggregates and bitumen were
mixed at 160°C till uniform coating of binder on aggregates. Once accomplished,
mixture was moved into a beaker and allowed to cool for 4 hours. Distilled water was
poured on cold mixture and was covered and kept in water bath at 40 °C for 24 hours.
After curing period, beaker was taken out, allowed to cool at room temperature and
extent of stripping of binder from aggregate surface is observed. By visual estimation,
stripping value was recorded in percentage.
Batch of Kota stone aggregate of size 40mm, 20mm, 10mm, 6mm and stone
dust were mixed together to achieve the required gradation. Samples were prepared at
their optimum moisture content and then tested for properties as per MoRT&H 2013.
Each sample was designated as per the relevant gradation, i.e. sample K1, K2, K3,
K4, K5, and K6 are granular subbase mix prepared using Kota stone waste as coarse
and fine aggregate belonging to gradation I to VI respectively.
Modified Proctor test was used to find OMC and MDD of respective GSB
graded material as per IS 2720 part VIII (1983). The test assembly and procedure is
similar to that of standard Proctor test with the difference that instead of three layers,
material is cast in five layers and a heavy rammer weighing 4.9 kg is used for

Experimental Programme
67
compaction. Soaked CBR test was performed on each mix as per IS 2727 part XVI
(1987) mention above.
3.3) Base Course/ Surface Course: Experimental Investigation and Sample
Preparation.
(I) Bituminous Concrete and Dense Bituminous Macadam
A total of ten different mixes were prepared by replacing conventional
aggregates with recycled Kota stone aggregates at an interval of 25% by weight
ranging from 0 to 100% in BC and DBM. Marshall mix design method was adopted
for sample fabrication with 75 blows each side as per MS-2 asphalt mix design
method. Blended aggregate sample weighing about 1200 gm was kept in the oven
along with cast moulds for 24 hours. The sample was then mixed with bitumen at
mixing temperature of 150-160°C till binder uniformly coated aggregates. The mix
was then placed in a preheated mould and subjected to 75 blows on both sides by
hammer weighing 4.9 kg from a height of 45cm. First trial percentage of bitumen was
kept 5.4% for BC and 4% for DBM by weight of aggregates and increased
subsequently by 0.5%. Three samples were prepared for each bitumen content, and
the average value was adopted for calculation.
(II) Open-Graded Friction Course
Marshall mix design method was used for sample preparation. Procedure was
similar to that followed for preparation of BC and DBM samples with a difference
that samples were subjected to 50 blows on each side. The specimen obtained after
compaction had a thickness of about 63±3mm. In this study, first trial percentage of
bitumen was kept at 3.5% (except in 100% Kota stone sample, where the percentage
was 3.5%) and was subsequently increased by 0.5%.
For this study, to identify prepared mixes, specific nomenclature was adopted.
C indicates conventional mix, K indicates the KSA, numerical value followed by K
indicate percentage replacement of conventional aggregates with recycled limestone
aggregates, thus designated mix C, 25K, 50K, 75K and 100K indicate conventional
stone and replacement of traditional stone by KSA at an interval of 25%
respectively.To identify the type of HMA, abbreviation followed was mix K-bc, K-
dbm and K-ogfc indicating mixes containing conventional limestone for bituminous
concrete, dense bituminous macadam and open-graded friction course respectively.
Detail nomenclature for all mixes adopted is shown in Table 3.1.

Experimental Programme
68
Table 3.1: Nomenclature Adopted
Nomenclature Meaning
BCS Neat black cotton soil sample, taken as control
mix for soil Stabilization testing.
B2.5K, B5K, B7.5K, B10K, B15K,
B17.5K, B19K, B20K
Mix containing 2.5% Kota stone slurry by
weight replacement of black cotton soil
sample.
Granular Sub-Base
K1, K2, K3, K4, K5, K6 Granular sub-base mix prepared with Kota
stone coarse and fine aggregates of gradation I
to VI respectively.
HMA mixes
C-bc; C-dbm, C-ogfc Mix prepared with conventional coarse and
fine aggregates for bituminous concrete (BC),
Dense bituminous macadam (DBM), Open-
graded friction course (OGFC)
25K-bc, 25K-dbm, 25K-ogfc Mix prepared with replacing 25% conventional
coarse and fine aggregates with Kota stone
coarse and fine aggregates for bituminous
concrete (BC), Dense bituminous macadam
(DBM), Open-graded friction course (OGFC).
50K-bc, 50K-dbm, 50K-ogfc Mix prepared with replacing 50% conventional
coarse and fine aggregates with Kota stone
coarse and fine aggregates for bituminous
concrete (BC), Dense bituminous macadam
(DBM), Open-graded friction course (OGFC).
75K-bc, 75K-dbm, 75K-ogfc Mix prepared with replacing 75% conventional
coarse and fine aggregates with Kota stone
coarse and fine aggregates for bituminous
concrete (BC), Dense bituminous macadam
(DBM), Open-graded friction course (OGFC).
100K-bc, 100K-dbm, 100K-ogfc Mix prepared with Kota stone coarse and fine
aggregates for bituminous concrete (BC),
Dense bituminous macadam (DBM), Open-
graded friction course (OGFC)

Experimental Programme
69
a) Marshall Design Mix and Properties Test
Optimum binder content plays a very pivotal role in HMA mix design.
Insufficient binder content exposes mix surface to air and water which result in rapid
hardening and inception of moisture induced damage conditions which eventually
results in failure of the pavement structure. Optimum binder requirement becomes
critical in the case where aggregates are hydrophilic in nature. In this case, water
displaces asphalt, thus compromising asphalt-aggregate cohesion which results in
several distress conditions like ravelling and rutting.
Marshall mix design was used to find the optimum binder content for HMA
mixes. In this study, an average of binder content giving maximum stability, air void
and maximum specific gravity were taken as optimum binder content.
I. Stability: It is defined as maximum load resisted by specimen before deformation.
A minimum stability value of 9KN is recommended by MoRT&H 2013 for BC
and DBM mixes.
II. Flow: Flow value is noted along with the stability value. It is vertical deformation
of a compacted HMA mix corresponding to its maximum stability value. A lower
flow value denotes insufficient asphalt in the mix whereas higher flow value
denotes a plastic mix, more susceptible to permanent deformation under.
MoRT&H 2013 suggest an optimum flow range of 2-4mm.
III. Marshall Quotient: It is the ratio of maximum stability to corresponding flow
value of mix. It is a measure of resistance to permanent deformation. An
optimum MQ range of 2-5 is suggested by code.
IV. Bulk specific gravity: Density of asphalt varies with the addition of different
quantity of binder. The value follows an incremental trend till the point is
reached that binder film around aggregate become thick enough that it pushes
aggregate particles apart resulting in lower density.
V. Void in Mineral aggregate: In a compacted HMA mix, total volume of void
without bitumen is called void in mineral aggregates. It is the total of air voids
and volume of air voids not absorbed by aggregates (Marshall Mix Design and
Analysis 2007). It is another parameter which indicated either the coating on
binder is efficient or not. A low VMA value indicates insufficient binder

Experimental Programme
70
coating on aggregate, while excess binder indicates the presence of an excess
quantity of binder in mix leading to reduced stability value.
VI. Void filled with Bitumen: It is the percentage VMA that is filled with asphalt.
This represents the effective binder film over aggregates(Marshall Mix Design
and Analysis 2007). A less VFB percentage may lead to weak bonding
between aggregate particles, while higher VFB may lead to bleeding during
adverse moisture condition both cases resulting in failure of pavement system.
b) Indirect Tensile Strength Test
In field, sudden temperature drop and embrittlement of asphalt concrete
generate tensile stress on pavement which lead to distress phenomena like low
temperature cracking and ravelling(Baghaee Moghaddam et al. 2014). This test is
used to asses the relative quality of bituminous mixture against such stresses. A higher
indirect tensile stress value indicates better resistance against these low temperature
cracking and rutting (Tayfur et al. 2007).
This test was performed as per ASTM D6931. The loading apparatus consists
of a pair of loading strip,where lower strip mounted on base and upper strip free to
slide on the post. The loading pattern produces relatively uniform tensile stress on
specimen causes a tensile deformation perpendicular to the loading direction, which
yields a tensile failure(Kennedy & Anagnos 1983), shown in Figure 3.5. Marshall
specimens were loaded across their diametrical plane on the loading device as shown
in Figure 3.6. ITS was evaluated by using the following equation:
ITS = 2𝑃
𝜋𝑑𝑡 …….. (18)
Where P is the maximum applied load (KN), t is the thickness of the specimen (mm),
d is the diameter of the sample (mm).

Experimental Programme
71
Figure 3.5: Load Action on ITS Test. (Zaniewski & Srinivasan 2004).
Figure 3.6: Laboratory Test Setup for the Indirect Tensile Strength Test.

Experimental Programme
72
c) Tensile Strength Ratio
Moisture damage is a widespread problem for asphalt concrete. This distress
mechanism can occur from multiple sources among which most common are heavy
precipitation, improper drainage facilities, and imperfect pavement design. Moisture
deteriorates the durability of the pavement system by hampering adhesion between
asphalt and aggregate surface (Washington Transportation Research Board 2015),
which leads to accelerated distress development, eventually leading to defects like
potholes, cracking and revelling (Shen et al. 2009). Tensile strength ratio (TSR)
measures the water sensitivity of the compacted bituminous specimen. It is the ratio
of the tensile strength of water conditioned specimen (wet-ITS) to the tensile strength
of unconditioned sample (dry-ITS) which is expressed in percentage. A TSR value
less than 80% is not desirable.
A higher TSR indicates that the mix exhibit excellent resistance to moisture
damage condition. Each Marshall specimen was subjected to series of freeze and thaw
cycle as per AASTHO T-283. These samples were then mounted on the conventional
Marshall testing apparatus diametrically and load was transferred through loading strip
in similar fashion as for dry-ITS.
Since OGFC mixes have an open structure, to avoid water drainage, except
top surface, samples were wax coated from all sides prior to conditioning (Shirini &
Imaninasab 2016) as shown in Figure 3.7
Figure 3.7: Wax Coated OGFC Samples

Experimental Programme
73
d) Scanning Electron Microscopic Analysis (SEM)
SEM was performed at Material Research Centre (MRC) of Malaviya National
Institute of Technology Jaipur (MNIT Jaipur) to study the morphology of the mixes.
Equipment used in the study is shown in Figure 3.8. It was done to understand bonding
and packing behaviour of mixes with inclusion of Kota stone slurry and aggregates
in the mixes.
Tested UCS samples were analyzed from their broken surface. Samples were
first cut into thin cubes of size 2.5cm x1cm x1cm then coated with a thin gold coating
layer(Aldaood et al. 2014) and then observed through high resolution scanning
electron microscope. In HMA samples, tested Marshall samples were cut into similar
dimensions and observed under high resolution.Thin cleaned section of the sample
was placed inside a Field Emission Scanning Electron Microscope (FE-SEM). A
beam of the primary electron was focused on the surface. The interaction between the
sample surface and primary electron results to secondary electrons which generate a
topographic image of the sample(Rana et al. 2016).
Figure 3.8: SEM Equipment and Thin Film Coating Machine.

Experimental Programme
74
e) Dynamic Creep Test
Hot mix asphalt is a visco-elastic material. The long-term behaviour of such
material is dependent on loading time and temperature. Repeated traffic loading
conditions, axial pressure, traffic volume leads to rutting action. This is primarily
caused by two mechanisms: a) consolidation of asphalt mixture under traffic b) plastic
flow of mixes. Under constant loading conditions, this visco-elastic material
undergoes recoverable or non-recoverable deformations which may be time-
dependent or independent. Dynamic creep test was used for characterization of mix
in term of long-term deformation behaviour. This test provides a better understanding
of local material by evaluating long-term rutting susceptibility of asphalt concrete
mixture.
The result is expressed in graphical form, where x-axis represents cycle
number and y-axis percentage permanent actuator strain value of specimen under the
action of repeated cyclic loading condition. The resulted graph can be divided into
three phases. Phase one is called primary strain, where strain rate increase abruptly.
This is due to particle rearrangement under the action of loading condition. After
primary phase comes secondary phase, where the rate of permanent strain is more or
less constant. Third phase is tertiary phase; here, the rate of increase of permanent
strain increase rapidly as shown in Figure 3.9. The evaluated stress-strain response of
sample at any cycle is the flow number of samples. Flow number is defined as the
postulated load cycle at which shear deformation of specimen starts, the tertiary flow.
Studies are available, where, flow number has given good correlation with long-term
material performance relationship.

Experimental Programme
75
Figure 3.9: Typical Strain Vs. Load Cycle Graph Obtained In Dynamic Creep
Test. (Baghaee Moghaddam et al. 2014)
The test was performed as per BS DD 226. Test parameters used are
summarized in Table 3.2 Marshall specimens prepared at their respective OBC were
used for testing purpose. UTM-25 machine, equipped with environment chamber and
computerized data acquisition system was used for testing purpose, shown in Figure
3.10. Samples were cured in the environment chamber for 24 hours prior to testing
and immediately placed under loading platens. Two Linear variable displacement
transducers were placed in diametrically opposite direction to measure vertical
deflection under application of repeated axial stress pulse as shown in Figure 3.11.
Table 3.2: Parameters Used For Dynamic Creep Test.
Parameters Values
Loading Pattern Rectangular
Loading Period (ms) 500
Rest Period (ms) 1500
Contact Stress (KPa) 10
Applied Repeated Stress (KPa) 200
Temperature(°C) 50

Experimental Programme
76
Figure 3.10: Dynamic Creep Testing Assembly.
Figure 3.11: Loading Assembly in Dynamic Creep Test.
LVDT’s
Loading Jog
Sample
Environment
Chamber.
Samples under
curing.
Data output
Temperature setup,
maintenance device.

Experimental Programme
77
f) Resilient Modulus Test
Resilient modulus is the ratio of repeated stress to recoverable strain (Huang,
2004). This test was used to investigate the behaviour of mix under moving load and
low temperature cracking of HMA mixes as an index to assess stripping and fatigue
performance (Wong et al. 2007), (Tayfur et al. 2007). For a lesser pavement thickness
whilst maintaining its structural integrity, a higher resilient modulus is desirable
(Mills-Beale & You 2010).The test was performed as per ASTM D 4123. For each
design mix, three samples were tested; experimental setup as shown in Figure 3.12,
and parameters used for this study as presented in Table 3.3.
A pneumatic loading system resilient modulus device was used for this study.
The load is applied along the vertical diametric plane of specimen. The device applies
repeated havensquare load waveform of frequency 1 Hz. The load duration was 100
millisecond and rest period was of 1000 milliseconds. Horizontal deformation was
measured using two linear variable differential transformers (LVDTs) diametrically
attached to opposite side of the cylindrical sample. Though the test code suggests that
peak loading force should be 10% of sample’s respective ITS value; in this study,
each sample was tested under uniform load of 1000N. The reason for this was that the
primary aim of this study was to evaluate all mixes under similar conditions. This is
because, at field, the traffic load acting is same. Assessing materials under similar
loading condition give a better understanding of waste material behaviour in the mix
design. Also, during the procurement stage of limestone waste used in this study, it
was observed that variability in quality (shape, size, impurities like dust, gravel and
mixing of other dumped material) was there. Though to counter it, samples were taken
from different parts of dumping site and impurities like dust, soil and gravel were
removed, however, such quality control is feasible in laboratory studies but usually
not taken in consideration in field implementation. To address unwanted variability and
assess the performance under uniform loading condition, 1000N was adopted.

Experimental Programme
78
Table 3.3: Resilient Modulus Test Parameters.
Parameters Values
Loading pulse width (ms) 100
Pulse repetition period (ms) 1000
Conditioning pulse count 50
Target core temperature (°C) 35
Peak loading force (N) 1000
Estimated Poisson's ratio 0.35
Figure 3.12: Resilient Modulus Test Assembly.
g) Cantabro Test
This test was used to assess the durability property of OGFC mixes by
measuring the quantity of material breakdown when subjected to 300 revolutions at
the rate of 30-33 rpm without steel balls in Los Angeles Machine. Test procedure as
per ASTM C131 was referred for this test. The loose material broken from the test
Loading Jog
Loading Strip Sample
LVDT

Experimental Programme
79
specimen was discarded, and percentage weight loss called Cantabro loss was
measured using formula
Percentage Cantabro Loss (C.L.) = 𝐴−𝐵
𝐴×100 …….. (19)
Where,
A= Initial Weight (grams)
B= Retained Weight (grams)
For an unaged sample, i.e., a sample subjected to no conditioning; the
percentage loss of material shall not be more than 20% (Shirini & Imaninasab 2016).
Since voids in OGFC is very high, hardening takes place at a faster rate which
leads to a decrement in cohesion and adhesion which eventually result in ravelling.
Hence it becomes mandatory to subject the specimen to accelerated ageing test (Yang
et al. 2016). This was done by putting the sample in the oven at 60°C for seven days,
then cooled for 4 hours and tested in similar fashion as unaged specimen. The average
value of C.L. must not exceed 30%, and individual C.L. value of specimen should not
exceed 50% (Mallick et al. 2000).
h) Falling Head Permeability Test
This test method was used to find hydraulic conduction of compacted OGFC
samples. ASTM D3637 was referred for this test.
A falling head permeability apparatus was used in this study. Water from
graduated cylinder was allowed to flow through saturated sample and time required
to achieve predetermined head value was noted A minimum permeability of 100m/day
is considered to be sufficient for proper drainage of water (Shen et al. 2009); (Kandhal
& Mallick 1999), (Shirini & Imaninasab 2016). The equation for the coefficient of
permeability is as follows:
k= 𝑎×𝐿
𝐴×𝑡×ln(
ℎ𝑜
ℎ1) ……….(20)
where k is coefficient of permeability, a: area of pipe ; L: length of specimen, A: area
of sample equal to, t: elapsed time (seconds), ho: head at the beginning of test, ht: head
at the end of test.

Experimental Programme
80
Figure 3.13: Falling Head Permeability Test Setup for OGFC.
i) Drain down Test
The test was proceeded as per AASHTO T305. This test is significant for
mixes containing higher coarse content like OGFC. Lack of fines in OGFC under
elevated temperature can lead to bleeding problem. The portion of binder along with
some fines separate and flows downward is called draindown. This test is used to
measure the amount of drain down from an uncompacted sample. This test helps in
understanding the behaviour of the mix during production, storage, transportation and
placing stages. In this test, the samples were prepared at their respective optimum
binder content and then placed immediately in wire basket made of 6.3mm size. The
basket was then put on a plate of known weight and together were placed in an oven
for one hour at 120°C. After the heating period, amount of material drained out on the
plate was measured. Drain down value must not exceed 0.3% by weight of mixture,
and is calculated as:
Draindown =𝐴−𝐵
𝐶−𝐷 …….. (21)
Where A is the total weight of material drained and tray after one hour in the oven, B
is the empty weight of tray, C is the weight of wire basket with sample and D is the
empty weight of wire basket. All weights measured in grams.

Experimental Programme
81
3.4) Binder
Ministry of Road Transport and Highways 2013 (MoRT&H 2013), suggest
that selection of binder should be based on local temperature condition. The intended
use of waste is in local and neighbouring areas of Kota, Rajasthan, where highest daily
mean temperature is more than 30ºC, hence as per clause 500.1.2, VG-30 was used as
binder agent for bituminous concrete and dense bituminous macadam. For open-graded
friction course, use of modified bitumen is recommended (Lyons & Putman 2013), (Lo
Presti 2013), (Washington Transportation Research Board 2015). Use of crumb rubber
modified bitumen give better performance on properties like rutting resistance, skid
resistance, durability and moisture susceptibility resulting in increase in service life
of pavement (Frigio et al. 2013), (Shirini & Imaninasab 2016). Hence, in this study,
crumb rubber modified bitumen of grade-60 (CRMB-60) was used. Following tests
were performed on each binder.
a) Penetration test
This test is used to measure hardness and consistency of bitumen. It is the
vertical distance travelled by standard needle of approximate diameter of 1 to 1.02mm
and length of 50mm into the bitumen surface. The test proceeded as per IS
1203(1978).
b) Softening Point test
Test procedure followed was as per IS 1205(1978). The test purpose is to find
the temperature at which the binder attain specific softening condition. Ring and ball
apparatus was used to carry out the test. A brass ring containing binder sample was
suspended in water. A steel ball of diameter and weight is placed over the ring. Water
is heated at a temperature of 5ºC per minute. The point at which the binder becomes
soft and touch the metal plate is noted.
c) Flash and Fire point
Flashpoint is the lowest temperature at which binder start vaporizing and cause
fire flickers and Fire is the minimum temperature at which the binder catches fire. The
test proceeded as per IS 1209(1978). Binder sample was first softened, stir, removed
air bubble if any and then poured in a cup, covered with lid. Thermometer is fixed to

Experimental Programme
82
measure the flash and fire point temperature. Heating is of sample was proceeded and
test flames are applied at regular interval till flash and fire point is recorded.
d) Specific Gravity
Test proceeded as per IS 1202 (1978). Empty weight of clean and dry specific
gravity bottle is noted. The bottle was then filled with distilled water and then with
binder; both weights were noted. After this weight of specific gravity bottle half filled
with biner was noted and then another weight reading was taken where the other half
was filled with water. Specific gravity was calculated using formula:
Specific gravity of bitumen=𝐶−𝐴
[(𝐵−𝐴)−(𝐷−𝐶) …….. (22)
Where,
A is empty weight of bottle, B is weight of bottle filled with water, C is weight
of specific gravity bottle half filled with bitumen, D is weight of bottle half filled with
bitumen and another half with water and E is weight of bottle completely filled with
bitumen. All weights are in grams.

83
CHAPTER-4
RESULT AND DISCUSSION
4.1 Kota Stone Slurry and Aggregates as Pavement Material
For the present study black cotton soil (BCS), Kota stone slurry (KSS) and
recycled Kota stone aggregates (KSA) were evaluated on the basis of physical and
chemical parameters. 10 soil sample with KSS replacement between 2.5% to 20%, six
granular sub-base mixes and 15 HMA (5 each of BC, DBM and OGFC) prepared by
replacing basalt aggregates with KSA were evaluated. Beginning from physical,
chemical properties of individual material properties of non-bituminous and
bituminous mixes presented in this chapter.
4.2 Soil and Slurry Properties
Geotechnical properties of soil and slurry are summarized in Table 4.1. The
chemical composition of Kota stone slurry/aggregates are summarized in Table 4.2.
Presence of calcium oxide as dominant component establish this material as
limestone. Use of calcium oxide based material as stabilizer has always been preferred
to improve soil properties (Olinic & Olinic 2016). Studies pertaining to successful use
of limestone waste as stabilizing agent for black cotton soil, summarized in literature
review, suggest that this waste can also be successfully used to stabilize black cotton
soil found in the local area.
Table 4.1: Properties of Black Cotton Soil and Kota Stone Slurry.
Parameters BCS KSS Code
Soil Type CI - IS: 1498 (1970)
Liquid limit (%) 49.2 23.90 IS:2720 Part V (1985)
Plastic limit (%) 20.1 Non-Plastic
Optimum moisture content (%) 20.5 21.9 IS: 2720 Part VII (1980)
Maximum Dry density (gm/cc) 1.524 1.604
Specific Gravity 2.62 2.87 IS: 2720 Part III (1980)
Fineness Modulus 5.17 2.16 IS: 383 (1970)

Result and Discussion
84
Table 4.2: Chemical Composition of Black Cotton Soil and Kota Stone.
Chemical composition (in %) CaO SiO2 MgO Fe2O3 Al2O3 LOI
Black cotton soil 6.15 65.45 2.01 4.98 Traces Nill
Kota Stone 37.15 23.14 7.02 Traces Nill 31.89
*LOI= Loss on ignition
a) Gradation
Gradation of Black Cotton Soil (BCS) and Kota Stone Slurry (KSS) material
passing is shown in Figure 4.1, Figure 4.2 and Figure 4.3 respectively. Individual
particle size distribution test results indicate KSS finer as compared to BCS. Majority
of 75 microns passing BCS particle lie between 10 microns to 100 microns where as
in KSS particle size range between 0.5 microns to 100 microns.
Figure 4.1: Gradation of Soil and Slurry Particles.
0
20
40
60
80
100
120
0.010.1110
% p
ass
ing
Particle size (mm)
Black Cotton soil Kota stone Slurry

Result and Discussion
85
Figure 4.2: Particle Size Distribution (finer than 75 microns) of
Black Cotton Soil.
Figure 4.3: Particle Size Distribution (finer than 75 microns) of
Kota Stone Slurry.
4.2.1. Black Cotton Soil- Kota Stone Slurry Mixes
a) Index Properties
Figure 4.4 shows the result of liquid limit, plastic limit and plasticity index
obtained by replacing Black cotton soil (BCS) with Kota stone slurry (K). With the
addition of slurry to the soil samples, the liquid limit decreased, plasticity limit
increased which in turn lead to an overall decrease in plasticity Index of soil,
indicating improved workability of the mixture. This was also experienced during
sample preparation for proctor test and CBR test, where, with an increase in slurry
proportion in the mixes, the mixing, casting and extraction of material from the mould
required less effort as compared to control soil sample. The reason for decreased
plasticity index was attributed to cation exchange reaction taking place between clay

Result and Discussion
86
particle and calcium ion of slurry, leading to flocculation of particles which in turn
behave like silt particles (Bell 1996). Depending on liquid limit value and plasticity
index obtained, the classification of soil as per IS 498 (1970) changed from lean clay
to mild silt upon addition of 20% slurry to the soil.
Figure 4.4: BCS-KSS Atterberg Limits.
b) Optimum Moisture Content and Maximum Dry Density
Figure 4.5 shows OMC and MDD of samples obtained with the addition of
Kota stone slurry. An overall observation of OMC data summarizes that with the
addition of slurry, water requirement and maximum dry density of soil samples
followed an incremental trend. The increase in water requirement was attributed to
higher proportion of smoothly textured slurry particles, demanding more water for
lubrication (Modarres & Nosoudy 2015). Addition of slurry resulted in formation of
hard cementitious matrix with improved maximum dry density. MDD of soil
improved from 1.524gm/cc to 1.66gm/cc on 19% replacement, after which, an
increase in the volume of voids, created due to flocculation and agglomeration of soil
and slurry particles lead to decrease in MDD of the mix.
49.2 49 48.9 47.544.5
43 42.941.21 40 39.7
20.1 20.8 21.0523.08
27.27 2728.57 28.58 30 30.61
29.1 28.2
27.8524.42
17.23 1614.33
12.6310 9.09
0
10
20
30
40
50
60
BCS B2.5K B5K B7.5K B10K B12.5K B15K B17.5K B19K B20.0K
Att
erb
erg
lim
it (
%)
Mix
LL PL PI

Result and Discussion
87
Figure 4.5: BCS-KSS OMC and MDD
c) California Bearing Ratio
Figure 4.6 illustrates the results of soaked CBR test for soil samples. The CBR
value increased from 2.05% of neat soil sample to 15.63% with 19% addition of slurry
after which it decreased. The increment in bearing capacity was more prominent when
slurry proportion increased beyond 7.5% in the mix. This behaviour was attributed to
the fact that till 7.5%, KSS was acting as filler material, occupying voids between clay
particles. After 7.5% replacement, improvement in strength of sample was attributed
to pozzolanic elements present in additive (Bell 1996). Addition of slurry to soil
sample lead to pozzolanic activity under submerged water condition, forming calcium
silicate hydrate gel leading to improved strength properties. Based on test results, it
was established that the use of Kota stone modified black cotton soil can be used as
subgrade in flexible pavements.
20.5
20.1
20.1 20.5 20.5
21.521.5
22.5
22
22.2
1.524 1.536
1.5641.582
1.584
1.604
1.608
1.633
1.66
1.596
1.45
1.5
1.55
1.6
1.65
1.7
18.5
19
19.5
20
20.5
21
21.5
22
22.5
23
BCS B2.5K B5K B7.5K B10K B12.5K B15K B17.5K B19K B20.0K
MD
D (
gm
/cc)
OM
C (
%)
Mix
OMC (%) MDD (gm/cc)

Result and Discussion
88
Figure 4.6: BCS-KSS CBR
d) Resilient Modulus
Based on obtained CBR values, resilient modulus of each sample was calculated
by correlation equations 9 and 10, results of which are shown in Figure 4.7. Sample
containing 19% slurry gave maximum resilient modulus value of 102.25MPa which was
about 400% higher than that obtained for the controlled black cotton soil sample which
was 20.5 MPa respectively. Since the correlation equation used CBR value for resilient
modulus assessment, the improvement in resilient modulus value is directly related to
improvement in overall bearing capacity of the samples.
2.053.07 3.35
4.44
9.9110.73
12.44
13.72
15.63
11.54
0
2
4
6
8
10
12
14
16
18
BCS B2.5K B5K B7.5K B10K B12.5K B15K B17.5K B19K B20.0K
% C
BR
Mix

Result and Discussion
89
Figure 4.7: BCS-KSS Resilient Modulus.
e) Unconfined Compressive Strength Test
The result of UCS and shear strength of mixes are presented in Figure 4.8. The
peak UCS and shear strength value in dry state was obtained with the inclusion of
17.5% Kota stone slurry in soil sample after which it decreased. This increment was
due to a well-graded structure between soil and slurry particles.
For Wet-UCS, it was observed that inclusion of KSS improved strength and
shear properties, however, obtained values were less compared to their respective
Dry-UCS sample. This was because the sample preparation for UCS requires material
passing 425 micron sieve size. The material obtained through this majorly consists of
slurry particles, which are smooth and have less cohesion. However, each Wet-UCS
mix satisfied criteria of maximum allowable strength loss of 20% of Dry UCS value
(Eze-Uzomaka et al. 2010).
The axial stress-strain behaviour of KSS stabilized BCS is presented in Figure
4.9 and Figure 4.10 for the dry-UCS and wet UCS respectively. It was observed that
no sudden drop in peak stress, indicating ductile failure of the mixes. After attaining
peak stress, the failure of sample was attributed to slipping action between round KSS
particles.
20.5
30.733.5
44.4
76.3880.37
88.3594.06
102.25
84.20
0
20
40
60
80
100
120
BCS B2.5K B5K B7.5K B10K B12.5K B15K B17.5K B19K B20.0K
Res
ilie
nt
Mo
du
lus
(MP
a)
Mixes

Result and Discussion
90
Figure 4.8: Dry and Wet UCS of BCS-KSS.
Figure 4.9: Stress-Strain of BCS-KSS in Dry-UCS.
0
50
100
150
200
250
0
50
100
150
200
250
300
350
400
450
BCS B2.5K B5K B7.5K B10K B12.5K B15K B17.5K B19K B20.0K
Sh
ear
Str
eng
th (
KP
a)
UC
S (
KP
a)
Mix
UCS-Dry (KPa) UCS-WET(KPa)
Shear strength (dry-UCS) Shear strength (wet UCS)
0
50
100
150
200
250
300
350
400
450
0 0.5 1 1.5 2 2.5 3 3.5 4 4.5
Axia
l S
tres
s (K
Pa
)
% Strain
BCS B2.5K B5K B7.5K B10K
B12.5K B15K B17.5K B19K B20K

Result and Discussion
91
Figure 4.10: Stress-Strain of BCS-KSS in Wet-UCS
0.00
50.00
100.00
150.00
200.00
250.00
300.00
0 0.5 1 1.5 2 2.5 3 3.5 4 4.5
Axia
l S
tres
s (K
Pa
)
% Strain
BCS B2.5K B5K B7.5K B10K
B12.5K B15K B17.5K B19K B20K

Result and Discussion
92
f) Free Swell Index
The results of the free swell index of treated and untreated soil sample are
presented in Figure 4.11. Swelling in mix decrease with increase in Kota stone slurry.
This behaviour was attributed to addition of non-expansive KSS and to reduction of
clay content in soil matrix upon the addition of slurry as by weight replacement
method. The free swelling index reduced to 34.4% with 20% KSS replacement into
BCS. Slurry was not able to control swelling property completely.
Figure 4.11: BCS-KSS Free Swell Index.
g) Scanning Electron Microscope Analysis
Figure 4.12(a) shows SEM image of black cotton soil sample, where an
irregular, discontinued structure containing cracks clearly visible. These cracks were
observed to be filled by slurry particle as shown in Figure 4.12 (b) SEM image of
sample containing 5% Kota stone slurry. Figure 4.12 (c) shows image of sample
B10K, where formation of calcium silicate hydrate visible. The effect of this was
observed at lower magnification of same sample, which gives a dense, well structure
image (Figure 4.12 (d)) compared to that of SEM of BCS. The CSH gel was more
prominent in magnified image of sample B19K as shown in Figure 4.12 (e). A more
uniform, well-packed structure with improved MDD, CBR and UCS value of soil
sample containing KSS.
45.643.3 42.2 41.1 40.0 38.9 37.8 36.7 35.6 34.4
0.0
5.0
10.0
15.0
20.0
25.0
30.0
35.0
40.0
45.0
50.0
BCS B2.5K B5K B7.5K B10K B12.5K B15K B17.5K B19K B20.0K
Fre
e S
wel
l In
dex
(%
)
Mix

Result and Discussion
93
Neat Black Cotton Soil Sample B5K sample
B10K Sample B10K sample at higher magnification
B19K sample
Figure 4.12 (a-e) SEM images of BCS-KSS samples.
CSH gel
(e)
(c)
(b)
KSS
particle
s
KSS particles
filling cracks
CSH gel formation
upon addition of KSS
(d)
(a)
BCS
Cracks

Result and Discussion
94
4.3 As Aggregate Material in Granular Sub-Base Course.
The KSA was subjected to physical property tests, results of which are
summarized in Table 4.3. Figure 4.13 shows a relative difference in the physical
texture of KSA and conventional aggregates used for the study. The surface of KSA
observed comparatively smoother than conventional aggregates.
From the test result, it was established that recycled/reformed Kota stone
aggregates (KSA) has required physical attributes which make it fit to be used as
aggregates in GSB and HMA.
Figure 4.13: Texture Difference of Kota Stone Aggregates (left)
Compared to Conventional Aggregate (right)
Table 4.3: Aggregate Property Test Results.
Property KSA Conventional
aggregate
Permissible
Value
Test Method
Los Angeles test (500
revolution)
25.34 % 14.26% 35% max. IS:2386 Part IV (1963)
Impact test 18.41% 13.53% 27% max. IS:2386 Part IV (1963)
Water Absorption Test 0.23% 0.18% 2% max. IS:2386 Part III (1963)
Combined Flakiness and
Elongation indices
33 % 28.24% 35% max IS: 2386 Part I (1963)
Bulk Specific Gravity of
Coarse Aggregate (gm/cc)
2.87 2.75 - IS :2386 Part III (1963)
Stripping value 100% 99% Minimum
retained coating
95%
IS:6241 (1971)
KSA CS
CS

Result and Discussion
95
Section 401.2.1 of MoRT&H 2013 specifies six gradation for granular sub-
base material. Table 4.4 shows gradation achieved using recycled KSA and
recommended gradation range as per code. Gradation of reformed Kota stone
aggregates (KSA) in granular sub-base course and base course were achieved using
hit and trial approach.
Table 4.4 KSA Gradation with Recommended Limits.
Sieve
Size
(mm)
Combined Grading Achieved
Recommended Passing Percentage
Grade 1 Grade 2 Grade 3 Grade 4 Grade 5 Grade 6
75 100.00%
100
- - - 100.00%
100
-
53 94.75%
80-100
100.00%
100
100%
100
100.00%
100
100.00%
80-100
100.00%
100
26.5 68.15%
55-90
81.80%
70-100
65.42%
55-75
65.42%
50-80
86.35%
55-90
81.80%
75-100
9.5 56.27%
35-65
66.91%
50-80
- - 64.05%
35-65
66.91%
55-75
4.75 37.85%
25-55
44.05%
40-65
29.08%
10-30
27.74%
15-35
36.12%
25-50
44.05%
30-55
2.36 31.25%
20-40
30.50%
30-50
- - 19.50%
10-20
22.50%
10-25
.85 - - - - 5.45%
2-10
-
.425 11.77%
10-15
8.97%
10-15
- - 1.87%
0-5
7.97%
0-8
0.075 2.32%
< 5
2.57%
< 5
2.46%
< 5
1.63%
< 5
- 2.57%
< 5

Result and Discussion
96
a) Optimum Moisture Content and Maximum Dry Density
After ascertaining that aggregates derived from Kota stone fulfil the physical
parameters, they were mixed in respective gradations; OMC and MDD of each sample
were found using modified proctor test. Test result showed that all sample gave
satisfactory MDD value. Highest compaction value was obtained by sample K2 while
sample K3 and sample K6 gave comparatively lesser MDD value. Samples prepared
for soaked CBR were on respective OMC obtained. Figure 4.14 shows OMC and
MDD obtained.
Figure 4.14: OMC and MDD of GSB mixes
b) California Bearing Ratio
Figure 4.15 compiles the values obtained by soaked CBR test. All the GSB
specimen satisfied minimum CBR value of 30% indicating suitability of waste Kota
stone aggregate as granular sub-base material. Highest CBR value was obtained for
sample K1 and K2 belonging to gradation 1 and 2 respectively. The reason for this
can be attributed to well-graded gradation specification resulting in dense well-
compacted sample which resulted in higher bearing capacity. Using KSA as Water
Bound Macadam (WBM) and Wet Mix Macadam (WMM) mixes were prepared and
tested for their suitability as base course material by Pawan Patidar (2014). The Result
8.1
7.8
7.65 7.65
8.1
8.2
2.116
2.142
2.128
2.136
2.14
2.129
2.1
2.105
2.11
2.115
2.12
2.125
2.13
2.135
2.14
2.145
7.3
7.4
7.5
7.6
7.7
7.8
7.9
8
8.1
8.2
8.3
K1 K2 K3 K4 K5 K6
Ma
xim
um
Dry
Den
sity
(g
m/c
c)
Op
tim
um
Mo
istu
re C
on
ten
t (%
)
Mix
OMC(%) MDD (gm/cc)

Result and Discussion
97
of this study align with the study by Pawan Patidar. (2014), supporting the use of KSA
as granular sub-base.
Figure 4.15: Soaked CBR of GSB mixes.
4.4 As Aggregates in Base Course/Wearing Course.
An aggregate to be used in HMA should be hydrophobic, i.e. water hating in
nature (Tarrer & Wagh 1991). Carbonate rock, such as limestone is known to exhibit
water repelling characteristics and exhibiting excellent resistance against stripping of
asphalt. Same was observed in stripping test conducted on KSA, seen in Table 4.3
supporting its usability in HMA.
For bituminous concrete and dense bituminous macadam, gradation type 2 was
used as specified by section 505 and 507 of MoRT&H 2013. For Open graded friction
course (OGFC), gradation specified by National Centre for Asphalt Technology
(NCAT) was adopted. In HMA, the procedure adopted for replacement of KSA as
replacement of conventional aggregates was done similar to Montegomry et al.
(1996). KSA were washed, dried and sieved through standard sieves and then mixed
to obtain gradation similar to that for conventional aggregates. This method helps in
maintaining homogeneous gradation in all mix replacements, eliminates chances of
40.37
38.60
33.9434.3
37.53
35.91
30.00
32.00
34.00
36.00
38.00
40.00
42.00
K1 K2 K3 K4 K5 K6
CB
R (
%)
Mix

Result and Discussion
98
variation in binder content for durability and mechanical property analysis (Qasrawi
& Asi 2016). Properties of the VG-30 and CRMB-60 are summarized in Table 4.5
Table 4.5: Binder Properties of VG-30 and CRMB-60 Bitumen.
Properties Value for
VG-30
Values for
CRMB-60
Test Method
Penetration value at 25°C (0.1mm,
5sec)
64 55 IS: 1203(1978)
Softening point 47°C 60°C IS: 1205(1978)
Flashpoint 220°C 220°C IS: 1209(1978)
Bulk specific gravity (g /cm3) 0.99 1.01 IS:1202(1978)
I. Bituminous Concrete
a) Gradation and Marshall Test Results
The gradation used for BC mixes as shown in Figure 4.16. Once the aggregate
achieved desired gradation, Marshall mix design method was used for sample
preparation and finding Optimum binder content (OBC). OBC was taken as average
of binder content giving maximum stability, 4% air void and maximum density. Each
replacement mix was fabricated at their respective OBC and tested for Marshall
Parameters; results of which are summarized in Table 4.6. Detail graphs showing mix
properties viz binder vs stability, bulk density, VMA, VFB and flow values are
attached in Appendix.

Result and Discussion
99
Figure 4.16: Gradation Curve for BC Mix
All BC mixes satisfied the minimum binder content requirement as per
specifications. Stability values were observed decreasing with inclusion of KSA.
However, all BC mixes satisfied the minimum stability criteria(9KN) ; except 100K-
bc, mix flow value of mixes were within permissible limits, indicating proper
interlocking and friction between aggregates particles. The reason for mix 100K-bc to
surpass the recommended value was attributed to smooth texture of KSA which may
have caused sliding of aggregate particles over one another, thus giving a higher flow
value. As for overall mix behaviour, shown by Marshall quotient, BC mixes satisfied
the required criteria indicating required strength, rigidity, and flexibility. The bulk
specific gravity was observed increasing with increase in KSA proportion; this
increment was attributed to the higher specific gravity of KSA as compared to
conventional aggregates. Decrease in air voids with addition of KSA resulted into
improved bulk density of mixes. A marginal decrease in binder content was also
observed with increase in KSA content in BC mixes.
0
20
40
60
80
100
120
0.0 5.0 10.0 15.0 20.0
Per
cen
tag
e P
ass
ing
Sieve Size (mm)
Combined Grading Achieved Mid Upper Limit Lower Limit
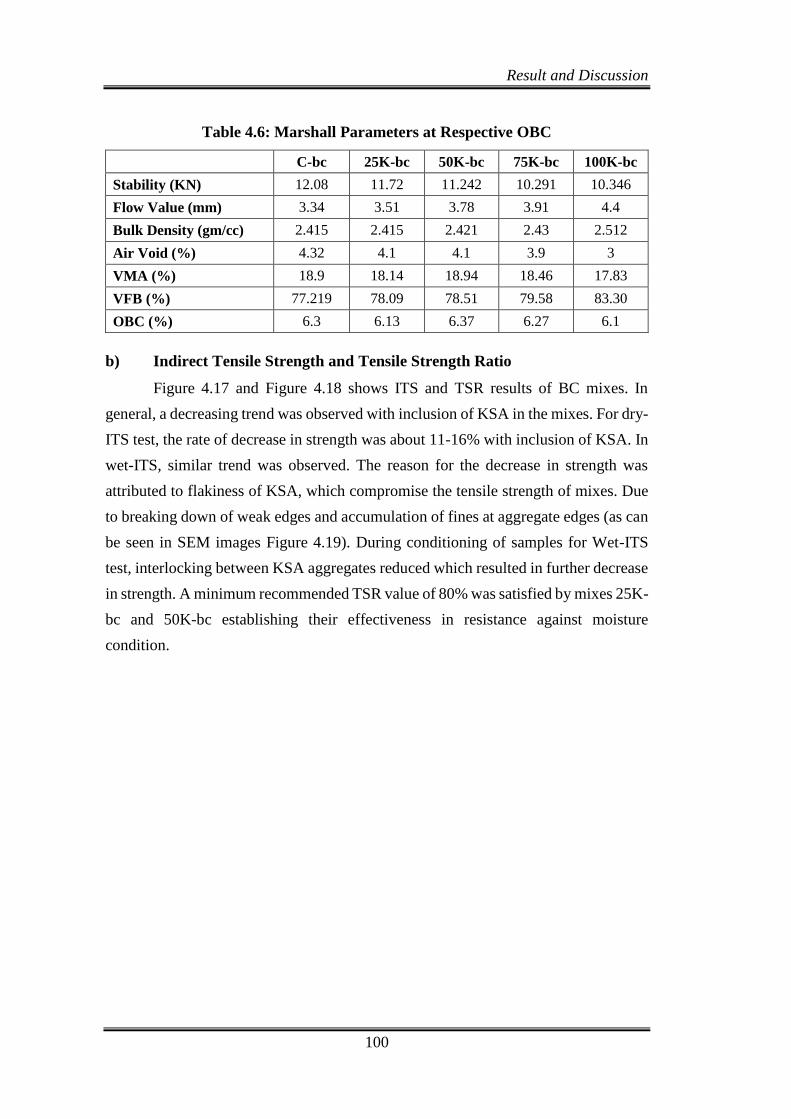
Result and Discussion
100
Table 4.6: Marshall Parameters at Respective OBC
C-bc 25K-bc 50K-bc 75K-bc 100K-bc
Stability (KN) 12.08 11.72 11.242 10.291 10.346
Flow Value (mm) 3.34 3.51 3.78 3.91 4.4
Bulk Density (gm/cc) 2.415 2.415 2.421 2.43 2.512
Air Void (%) 4.32 4.1 4.1 3.9 3
VMA (%) 18.9 18.14 18.94 18.46 17.83
VFB (%) 77.219 78.09 78.51 79.58 83.30
OBC (%) 6.3 6.13 6.37 6.27 6.1
b) Indirect Tensile Strength and Tensile Strength Ratio
Figure 4.17 and Figure 4.18 shows ITS and TSR results of BC mixes. In
general, a decreasing trend was observed with inclusion of KSA in the mixes. For dry-
ITS test, the rate of decrease in strength was about 11-16% with inclusion of KSA. In
wet-ITS, similar trend was observed. The reason for the decrease in strength was
attributed to flakiness of KSA, which compromise the tensile strength of mixes. Due
to breaking down of weak edges and accumulation of fines at aggregate edges (as can
be seen in SEM images Figure 4.19). During conditioning of samples for Wet-ITS
test, interlocking between KSA aggregates reduced which resulted in further decrease
in strength. A minimum recommended TSR value of 80% was satisfied by mixes 25K-
bc and 50K-bc establishing their effectiveness in resistance against moisture
condition.

Result and Discussion
101
Figure 4.17: ITS of BC Mixes
Figure 4.18: Tensile Strength Ratio Values for BC Mixes.
93.71
83.03 83.95
70.26
59.31
85.28
71.17 69.35
49.27
20.99
0.00
10.00
20.00
30.00
40.00
50.00
60.00
70.00
80.00
90.00
100.00
C-bc 25K-bc 50K-bc 75K-bc 100K-bc
ITS
(M
Pa
)
Mix
Dry ITS Wet ITS
91.0085.72
82.61
70.13
35.39
80.00
0.00
10.00
20.00
30.00
40.00
50.00
60.00
70.00
80.00
90.00
100.00
C-bc 25K-bc 50K-bc 75K-bc 100K-bc
% T
SR
Mix
TSR Minimum Percentage

Result and Discussion
102
Figure 4.19 shows surface morphology images of 25K-bc and 50K-bc showing
dense, well compactedplate like pattern similar to that of sample C-bc. As the
proportion of KSA increases beyond 50%, a more irregular structure pattern was
observed. Samples containing 75% KSA and 100% KSA showed segregation of fines
along the edges of KSA. Uneven distribution of fines compromised the overall
strength of mix 75K-bc and 100K-bc. The effect of which was more prominent when
samples were subjected to resistance to moisture condition, where, sample 75K-bc
and sample 100K-bc failed to achieve the desired standards.

Result and Discussion
103
C-bc sample 25K-bc sample
50K-bc Sample 75K-bc Sample
100K-bc
Figure 4.19: SEM images of C-bc, 25K-bc, 50K-bc, 75K-bc, 100K-bc
a b
c d
e

Result and Discussion
104
c) Dynamic Creep Test
Figure 4.20 shows the test results of dynamic creep test. As the proportion of
KSA increases, accumulated strain was also observed increasing, indicating early
permanent deformation and decrease in service life. It was noted that by 6485th cycle
all mixes reached the tertiary stage. Percentage actuator strain value at 6485th pulse
count as shown in Table 4.7 for each BC mix. With increase in KSA content in BC
mixes flow number observed decreasing, indicating low resistance of these mixes
toward permanent deformation.
Figure 4.20: Dynamic Creep Test Result for BC Mixes
Table 4.7: Percentage Actuator Strain Value for BC Mixes
Mix Permanent actuator strain (%)
C-bc 2.689
25K-bc 2.972
50K-bc 3.245
75K-bc 3.601
100K-bc 4.782
0
1
2
3
4
5
6
7
8
0 2000 4000 6000 8000 10000
% p
erm
an
ent
act
ua
tor
stra
in
cycles
C-bc 25K-bc 50K-bc 75K-bc 100K-bc

Result and Discussion
105
Figure 4.21: Flow Number Results for BC Mixes.
d) Resilient Modulus Test
As per guidelines of IRC 37 (2012): Design of flexible pavement, under
section 7.4, Table 7.1 recommend that for BC and DBM mixes with using VG30 as
binder (tested at 35°C) must have a minimum resilient modulus value of 1700 MPa.
Using KSA up to 50% in BC satisfies desired specification; results as shown in Figure
4.22.
Figure 4.22: Resilient Modulus Results of BC Mixes.
6485
5821
4077
30192719
0
1000
2000
3000
4000
5000
6000
7000
C-bc 25K-bc 50K-bc 75K-bc 100K-bc
Flo
w N
um
ber
Mix
3497.00
2281.00
1969.00
1502.00
1219.00
0.00
500.00
1000.00
1500.00
2000.00
2500.00
3000.00
3500.00
4000.00
C-bc 25K-bc 50K-bc 75K-bc 100K-bc
Res
ilie
nt
Mo
du
lus
(MP
a).
Mix
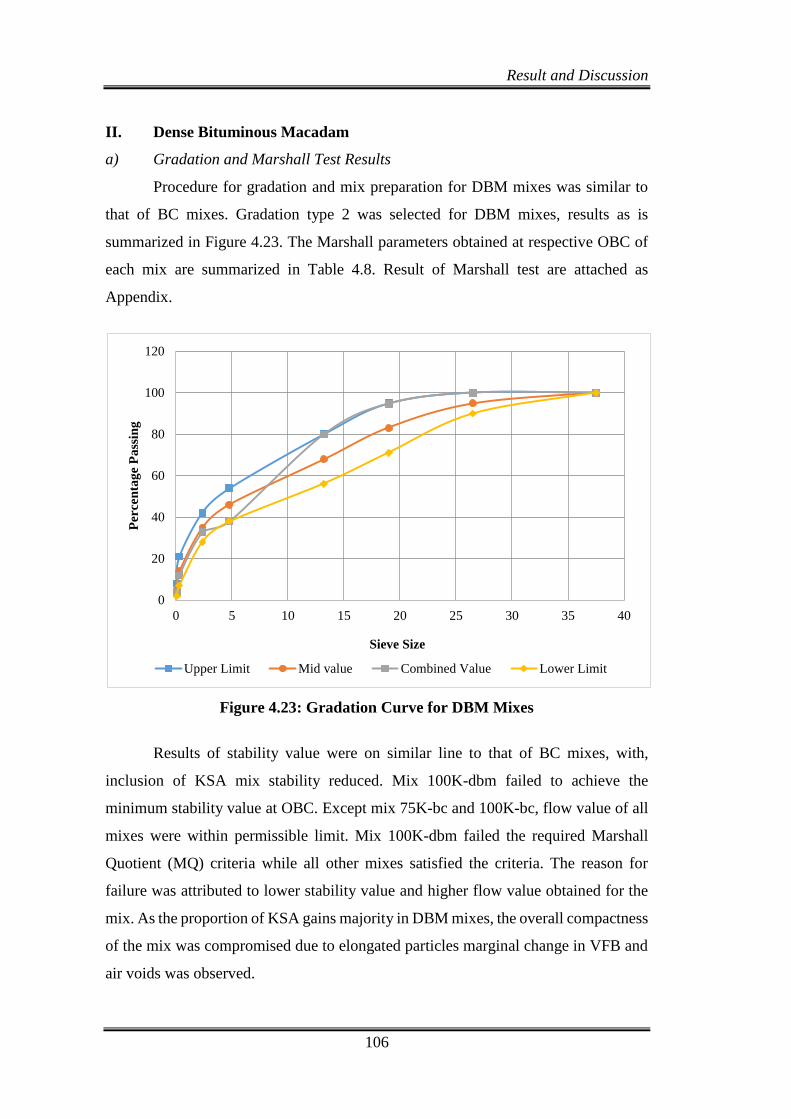
Result and Discussion
106
II. Dense Bituminous Macadam
a) Gradation and Marshall Test Results
Procedure for gradation and mix preparation for DBM mixes was similar to
that of BC mixes. Gradation type 2 was selected for DBM mixes, results as is
summarized in Figure 4.23. The Marshall parameters obtained at respective OBC of
each mix are summarized in Table 4.8. Result of Marshall test are attached as
Appendix.
Figure 4.23: Gradation Curve for DBM Mixes
Results of stability value were on similar line to that of BC mixes, with,
inclusion of KSA mix stability reduced. Mix 100K-dbm failed to achieve the
minimum stability value at OBC. Except mix 75K-bc and 100K-bc, flow value of all
mixes were within permissible limit. Mix 100K-dbm failed the required Marshall
Quotient (MQ) criteria while all other mixes satisfied the criteria. The reason for
failure was attributed to lower stability value and higher flow value obtained for the
mix. As the proportion of KSA gains majority in DBM mixes, the overall compactness
of the mix was compromised due to elongated particles marginal change in VFB and
air voids was observed.
0
20
40
60
80
100
120
0 5 10 15 20 25 30 35 40
Per
cen
tag
e P
ass
ing
Sieve Size
Upper Limit Mid value Combined Value Lower Limit

Result and Discussion
107
Table 4.8: Marshall Test Results of DBM Mixes
C-
dbm
25K-
dbm
50K-
dbm
75K-
dbm
100K-
dbm
Stability (KN) 13.481 10.7 10.83 9.87 8.143
Flow Value (mm) 3.34 2.82 3.75 4.16 4.16
Bulk Density (gm/cc) 2.429 2.459 2.466 2.44 2.440
Air Void (%) 4.6 4.2 4.1 4.2 4.5
VMA (%) 17.59 16.69 16.81 17.23 17.39
VFB (%) 73.72 75.05 75.39 75.69 75.9
OBC (%) 5.47 5.2 5.3 5.5 5.5
b) Indirect Tensile Strength and Tensile Strength Ratio
Figure 4.24 and Figure 4.25 shows result of ITS and TSR. The resistance of
DBM mixes against tensile failure, moisture, was observed to decrease with inclusion
of KSA in the mixes. Mix 50K-dbm, 75K-dbm and 100K-dbm failed to achieve the
minimum TSR of 80%. Marginal difference in dry-ITS values was observed at each
KSA replacement level. Significant fall in strength was observed for wet-ITS at 100%
KSA replacement. Based on TSR, only 25% replacement of conventional aggregate
in DBM mixes showed moisture susceptibility.
Figure 4.24: Dry and Wet ITS Values for DBM Mixes.
68.8966.06
59.77 60.6858.458.31
53.84
46.54
41.52
24.64
0
10
20
30
40
50
60
70
80
C-dbm 25K-dbm 50K-dbm 75K-dbm 100K-dbm
ITS
(M
Pa
)
Mix
Dry ITS (Mpa) Wet ITS(Mpa)

Result and Discussion
108
Figure 4.25: Tensile Strength Ratio Values for DBM Mixes.
Decrease in ITS ratio of DBM mixes was attributed to weak KSA, the SEM
image at higher magnification for 75K-dbm as shown in Figure 4.26 (a) and (b) witness
hairline crack on surface of KSA due to compactness which results into poor mix
performance.
SEM analysis of each DBM mix was done to understand change in
microstructure with increase in KSA content shown in Figure 4.27. SEM of sample
25K-dbm shows well-arranged structural matrix, similar to that of conventional sample.
However, as percentage of KSA increased beyond 25%, an irregular pattern was
observed, due to breaking of flaky edges. This could be reason for reduced stability
and Marshall Quotient values observed during Marshall testing of specimen. This
aggregate performance also justifies the obtained ITS ratio of the mixes. Since flaky
particle has low tensile strength(Chen et al. 2005); (Naidu & Adiseshu 2013), as the
proportion of KSA increased the ITS value of the mix kept on decreasing.
84.6481.50
77.87
68.42
42.19
80
0.00
10.00
20.00
30.00
40.00
50.00
60.00
70.00
80.00
90.00
C-dbm 25K-dbm 50K-dbm 75K-dbm 100K-dbm
%T
SR
Mix
Tensile Strength Ratio Minimum Percentage

Result and Discussion
109
Figure 4.26: SEM Image Showing Cracks on KSA Aggregates.
Hairline cracks
(a)
(b)
Zoomed section, showing hammering impact
created on KSA surface during sample
preparation

Result and Discussion
110
C-dbm 25K-dbm
50K-dbm 75K-dbm
100K-dbm
Figure 4.27: SEM Images C-dbm, 25K-dbm, 50K-dbm, 75K-dbm, 100K-dbm
(a) (b)
(c) (d)
(e)

Result and Discussion
111
c) Dynamic Creep Test
Result of dynamic creep test was on similar line to that obtained for BC mixes.
With increase in KSA proportions, percentage permanent actuator strain value
increased. Percentage accumulated strain value at 4561st pulse count as shown in
Table 4.9. Figure 4.28 shows that 25K-dbm mix with almost similar performance to
control mix C-dbm, indicating substantial resistance to rutting. The flow number was
observed decreasing upon inclusion of KSA as shown in Figure 4.29
Figure 4.28: Dynamic Creep Result for DBM Mixes.
Table 4.9: Percentage Actuator Strain Value for DBM mixes.
0.000
1.000
2.000
3.000
4.000
5.000
6.000
0 2000 4000 6000 8000 10000
% p
erm
an
ent
stra
in
cycles
C-dbm 25K-dbm 50K-dbm 75K-dbm 100K-dbm
Mix Permanent actuator strain (%)
C-dbm 2.282
25K-dbm 2.351
50K-dbm 2.658
75K-dbm 2.763
100K-dbm 3.102

Result and Discussion
112
Figure 4.29: Flow Number Results for DBM Mixes.
e) Resilient Modulus
Figure 4.30 shows resilient modulus test results. Mix 25K-dbm satisfied the
recommended resilient modulus value, while other KSA mix failed to achieve the
minimum value. The reason for low resilient modulus value this was attributed to the
fact that KSA observed inferior to conventional aggregates on physical parameters.
Figure 4.30: Resilient Modulus Results of DBM Mixes.
4561
3895
2955
2557 2511
0
500
1000
1500
2000
2500
3000
3500
4000
4500
5000
C-dbm 25K-dbm 50K-dbm 75K-dbm 100K-dbm
Cy
cle
Mix
2042
1714
1261 1251
1016
0
500
1000
1500
2000
2500
C-dbm 25K-dbm 50K-dbm 75K-dbm 100K-dbm
Res
ilie
nt
Mo
du
lus
(MP
a)
Mix
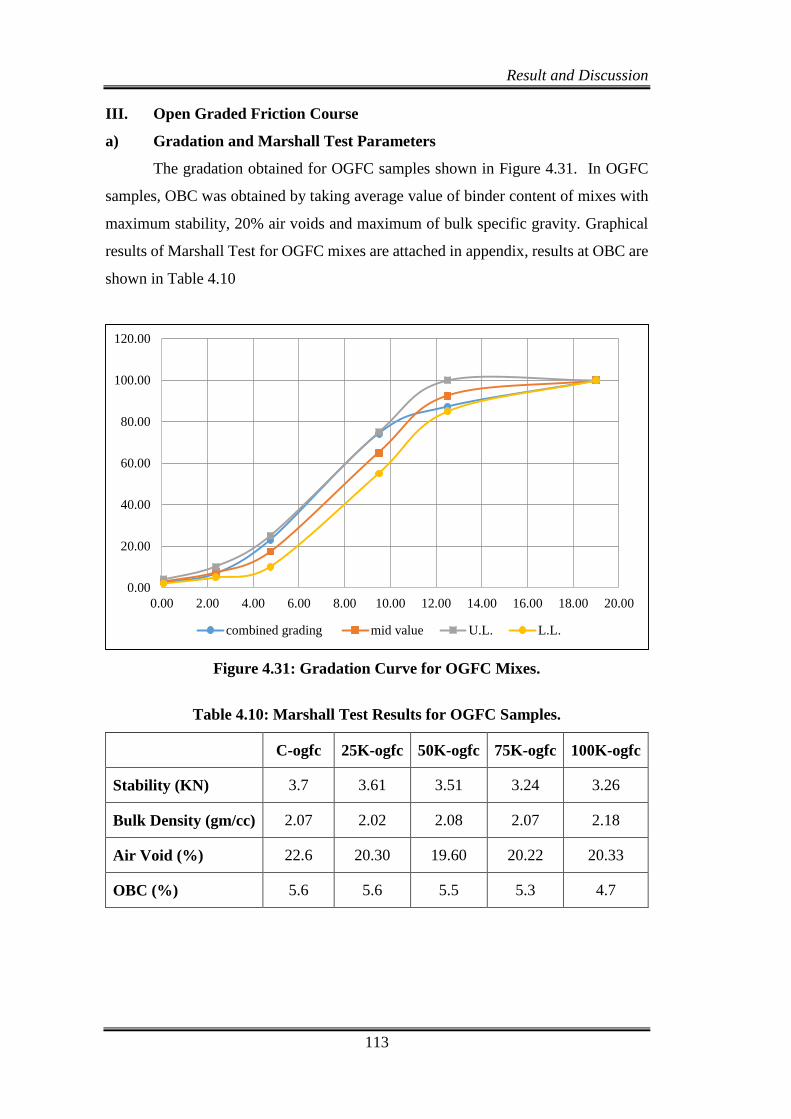
Result and Discussion
113
III. Open Graded Friction Course
a) Gradation and Marshall Test Parameters
The gradation obtained for OGFC samples shown in Figure 4.31. In OGFC
samples, OBC was obtained by taking average value of binder content of mixes with
maximum stability, 20% air voids and maximum of bulk specific gravity. Graphical
results of Marshall Test for OGFC mixes are attached in appendix, results at OBC are
shown in Table 4.10
Figure 4.31: Gradation Curve for OGFC Mixes.
Table 4.10: Marshall Test Results for OGFC Samples.
C-ogfc 25K-ogfc 50K-ogfc 75K-ogfc 100K-ogfc
Stability (KN) 3.7 3.61 3.51 3.24 3.26
Bulk Density (gm/cc) 2.07 2.02 2.08 2.07 2.18
Air Void (%) 22.6 20.30 19.60 20.22 20.33
OBC (%) 5.6 5.6 5.5 5.3 4.7
0.00
20.00
40.00
60.00
80.00
100.00
120.00
0.00 2.00 4.00 6.00 8.00 10.00 12.00 14.00 16.00 18.00 20.00
combined grading mid value U.L. L.L.

Result and Discussion
114
b) Indirect Tensile Strength and Indirect Tensile Strength Ratio.
Figure 4.32 and Figure 4.33 results of dry-ITS and wet-ITS for OGFC mixes.
Inclusion of KSA reduced the ITS value of mixes. Mix 25K-ogfc and 50K-ogfc were
found to satisfy the moisture resistance condition as upto 50% KSA replacement
OGFC mixes fulfilled criteria of 80% TSR. Use of crumb rubber modified bitumen
improved moisture susceptibility of mixes(Shirini & Imaninasab 2016). Test results
indicate that KSA aggregate can be used only as a partial replacement to conventional.
Figure 4.32: Dry and Wet ITS Values for OGFC Mixes.
285.51271.14
170.54153.29
130.3
235.69219.5
137.01119.76
92.93
0
50
100
150
200
250
300
C-ogfc 25K-ogfc 50K-ogfc 75K-ogfc 100K-ogfc
ITS
(K
Pa
)
Mix
DRY ITS WET ITS

Result and Discussion
115
Figure 4.33: Tensile Strength Ratio of OGFC Mixes
c) Cantabro Test
Result of cantabro test as shown in Figure 4.34 reveals that with inclusion of
KSA percentage loss reduce up to 75% replacement. Loss of material was observed
maximum (10.45%) for 100K-ogfc mix and minimum (5%) for 50K-ogfc mix.
Results of aged cantabro as shown in Figure 4.34 show that sample of 100K-
ogfc mix was found to be partially dismembered and deemed unfit for testing purpose.
With increase in KSA proportion aged cantabro performance reduced. As seen in
microstructure studies of different mixes in Figure 4.36 at elevated temperature, the
binding between KSA and bitumen become weak leading to loosening of material.
Interlocking among aggregates reduced due to uneven fines distribution and smooth
texture of aggregates were unable to uphold the overall stone matrix resulting in
reduce material strength and higher material loss.
82.6
8180.34
78.12
71.32
80
64
66
68
70
72
74
76
78
80
82
84
C-ogfc 25K-ogfc 50K-ogfc 75K-ogfc 100K-ogfc
% T
SR
MIx
TSR Minimum

Result and Discussion
116
Figure 4.34: Aged and Unaged Cantabro Loss Test Results
d) Falling Head Permeability Test
Figure 4.35 compiles result of falling head permeability test. Minimum
permeability requirement was satisfied by all sample. Permeability value was
observed less than the control, the reason for this is higher air voids at OBC in control
mix compared to other samples containing KSA.
Figure 4.35: Falling Head Permeability Test Result for OGFC Samples.
10.236 5 6.16
10.4512.75 13.4318.02 19.1
100
0
20
40
60
80
100
120
C-ogfc 25K-ogfc 50K-ogfc 75K-ogfc 100K-ogfc
% C
an
tab
ro L
oss
Mix
CANTABRO TEST AGED CANTABRO TEST
121.1
112.04
100.17106.81 106.15
100
0
20
40
60
80
100
120
140
C-ogfc 25K-ogfc 50K-ogfc 75K-ogfc 100K-ogfc
Co
effi
cien
t o
f P
erm
eab
ilit
y (
m/d
ay
)
Mix
Coefficient of Permeability (m/day) Permissible Value

Result and Discussion
117
e) Draindown Test
Drain down test results, shown in Table 4.11, were observed within a
prescribed range (0.3%), indicating excellent adhesion between KSA, conventional
aggregate and binder at elevated temperature.
Table 4.11: Drain down Test Result.
C-ogfc 25K-ogfc 50K-ogfc 75K-ogfc 100K-ogfc
Weight of basket
(gm) 2878 2878 2878 2878 2878
Weight of tray
(gm) 858 858 858 858 858
Weight of basket +
sample (gm) 4039 4040 4036.5 4039.5 4040.5
Weight of tray
after an hour in
oven (gm) 860 859.5 859.5 859.5 859.5
Percentage Drain
down 0.129 0.086 0.086 0.086 0.086
All OGFC mixes showed satisfactory bonding between conventional
aggregates, KSA and binder. A clear difference in surface texture of Kota stone
aggregates and conventional aggregates was visible as shown in Figure 4.36. This
justifies the decrease in durability values obtained in TSR and aged Cantabro test. As
the samples were subjected to elevated temperature.

Result and Discussion
118
C-ogfc 25K-ogfc
50K-ogfc 75K-ogfc
100K-ogfc
Figure 4.36: SEM Image of C-ogfc, 25K-ogfc, 50K-ogfc, 75K-ogfc, 100K-ogfc
(a) (b)
(c) (d)
(e)

Result and Discussion
119
Figure 4.37 (a-c): SEM Images of OGFC Sample
KSA
KSA
CS
CS
(a)
(b)
(c)
Magnified section of
image showing difference
in texture and
accumulation of fines on
KSA and conventional
aggregates surface.

Result and Discussion
120
f) Dynamic Creep Test
The results of dynamic creep test for OGFC mixes containing KSA as shown
in Figure 4.38, Figure 4.39. were observed on similar line to BC and DBM
mixes,indicating reduced resistance to rutting. It was observed that by 1713th cycle all
samples attained tertiary phase; value of percentage actuator stain obtained at this
cycle number as shown in Table 4.12. In OGFC, low fines and smooth surface of KSA
effects binding which in turn make specimen sensitive against rising temperature and
diminish the elastic property of mix. Mix 75K-ogfc and 100K-ogfc with high actutator
strain (9.010% for 75K-ogfc and 12.681% for 100K-ogfc) showed poor susceptibility
towards rutting.
Figure 4.38: Dynamic Creep Test Results for OGFC Mixes.
Table 4.12: Percentage Actuator Strain Value of OGFC Mixes.
0
5
10
15
20
25
0 500 1000 1500
% p
erm
enen
t a
ccu
tato
r S
tra
in
Cycle
C-ogfc 25K-ogfc 50K-ogfc 75K-ogfc 100K-ogfc
Mix Permanent actuator strain (%)
C-ogfc 1.282
25K-ogfc 3.347
50K-ogfc 3.668
75K-ogfc 9.010
100K-ogfc 12.681

Result and Discussion
121
Figure 4.39: Flow Number Results of OGFC Mixes.
g) Resilient Modulus Test.
With the inclusion of KSA in OGFC mixes, Resilient Modulus decreased.
Resilient modulus was obtained maximum (2418 MPa) for C-ogfc mix and minimum
(1481MPa) for 100K-ogfc mix.
Figure 4.40: Resilient Modulus Results of OGFC Mixes.
1713
1511 1491
1187
911
0
200
400
600
800
1000
1200
1400
1600
1800
C-ogfc 25K-ogfc 50K-ogfc 75K-ogfc 100K-ogfc
Flo
w N
um
ber
Mix
2418
2000
16891534 1481
0
500
1000
1500
2000
2500
3000
C-ogfc 25K-ogfc 50K-ogfc 75K-ogfc 100K-ogfc
Res
ilie
nt
Mo
du
lus
(MP
a)
Mix

122
Chapter-5
CONCLUSION AND RECOMMENDATIONS
In the present study, an attempt was made to utilize locally available Kota
stone mining, processing waste as a construction material in the flexible pavement.
Based on laboratory investigation following conclusion were drawn:
1. The test results indicate that inclusion of slurry modified the engineering
properties of black cotton soil. Replacement of Kota stone slurry between 17-
19% in black cotton soil increase workability (decreasing Liquid limit,
increasing the plastic limit and reducing plasticity index) and strength (MDD,
CBR, UCS and MR Values). Improvement in soil properties was attributed to
high calcium oxide content, non-plastic nature and fineness of slurry.
2. Kota stone aggregates, though satisfied specifications, were observed inferior
to basalt aggregate. Mixes prepared with Kota stone satisfied the required
specifications for granular sub-base (GSB), non-bituminous base course
(WBM, WMM; Pawan et al. 2014) and bituminous base and wearing course
(DBM, BC, OGFC).
3. Strength and durability parameters of hot mix asphalt mix indicated property
enhancement up to a certain replacement level. Test results show that mixes
containing Kota stone aggregate perform well compare with conventional
stones at normal test condition. However, at adverse test condition, hot asphalt
mixes with Kota stone aggregates above showed poor performance.
4. The reason for poor performance of HMA mixes with increase in Kota stone
aggregates was accounted for low abrasion, impact values, high flaky,
elongated particles and smooth texture of Kota stone aggregates which
compromise overall structural matrix of product. SEM images of these HMA
mixes were observed with accumulation of fines near broken flaky-elongated
particles with hairline cracks along the edges.
5. Marginal change in binder content was observed for BC and DBM mixes
containing Kota stone aggregates. However, a noticeable decrease in binder
content of OGFC mixes was observed with increase in KSA content. This

Conclusion and Recommendations
123
decrease in binder content was attributed to affinity of CRMB-60 binder with
Kota stone aggregates.
6. Replacement of Kota stone aggregate in place of conventional aggregates was
found suitable up to 50% for BC and OGFC mixes and upto 25% for DBM
mixes.
Recommendation and Future Scope
From this study, it can be deduced that Kota stone aggregate and slurry derived
from mining, cutting and polishing waste has potential to be used as construction
material for flexible pavement system and hence, their use is recommended. The scope
of this study was limited to laboratory investigation. A test section containing slurry
as additive and KSA as partial replacement of conventional aggregates should be laid
and behaviour of pavement under actual traffic and environmental condition must be
studied. Comprehensive laboratory investigation using Kota stone aggregates as
partial or complete replacement of conventional aggregates with plastic waste, rubber
waste modified bitumen also recommended.

124
REFERENCES
Abed, A.N. & Eyada, S.O., 2012. The Use of Sulaimania Marble Waste to Improve
The Properties of. Anbar Journal for Engineering Sciences, 1(special issue
part II), pp.139–151. Available at: https://www.iasj.net/iasj?func=fulltext
&aId=69194.
Agarwal, N., 2015. Effect of Stone Dust On Some Geotechnical properties Of Soil.
IOSR Journal of Mechanical and Civil Engineering Ver. I, 12(1), pp.2320–
334. Available at: www.iosrjournals.org.
Ahmedzade, P. & Sengoz, B., 2009. Evaluation of steel slag coarse aggregate in hot
mix asphalt concrete. Journal of Hazardous Materials, 165(1–3), pp.300–305.
Akbulut, H. & Gürer, C., 2007. Use of aggregates produced from marble quarry waste
in asphalt pavements. Building and Environment, 42(5), pp.1921–1930.
Al-Joulani, N., 2012. Effect of stone powder and lime on strength, compaction and
CBR properties of fine soils. Jordan Journal of Civil Engineering, 6(1), pp.1–
16.
Al-Rawas, A.A., Hago, A.W. & Al-Sarmi, H., 2005. Effect of lime, cement and Sarooj
(artificial pozzolan) on the swelling potential of an expansive soil from Oman.
Building and Environment, 40(5), pp.681–687.
Aldaood, A., Bouasker, M. & Al-Mukhtar, M., 2014. Free swell potential of lime-
treated gypseous soil. Applied Clay Science, 102, pp.93–103. Available at:
http://dx.doi.org/10.1016/j.clay.2014.10.015.
Ali, M.S. & Koranne, S.S., 2011. Performance analysis of expansive soil treated with
stone dust and fly ash. Electronic Journal of Geotechnical Engineering, 16
I(1), pp.913–982.
Amadi, A.A., 2014. Enhancing durability of quarry fines modified black cotton soil
subgrade with cement kiln dust stabilization. Transportation Geotechnics,
1(1), pp.55–61. Available at: http://dx.doi.org/10.1016/j.trgeo.2014.02.002.
Amit, V. & Singh, R.R., 2013. UTILIZATION OF MARBLE SLURRY TO
ENHANCE SOIL PROPERTIES AND PROTECT ENVIRONMENT.
Journal of Environmental Research and Development, 7(4), pp.1479–1483.
Arulrajah, A. et al., 2013. Geotechnical and Geoenvironmental Properties of Recycled

References
125
Construction and Demolition Materials in Pavement Subbase Applications.
Journal of Materials in Civil Engineering, 25(August), pp.1077–1088.
Arulrajah, A. et al., 2012. Geotechnical Properties of Waste Excavation Rock in
Pavement Subbase Applications,
Arulrajah, A. et al., 2017. Recycled plastic granules and demolition wastes as
construction materials: Resilient moduli and strength characteristics.
Construction and Building Materials, 147, pp.639–647. Available at:
http://linkinghub.elsevier.com/retrieve/pii/S095006181730836X.
Ashmole, I. & Motloung, M., 2008. DIMENSION STONE : THE LATEST TRENDS
IN EXPLORATION AND PRODUCTION TECHNOLOGY. The Southern
African Institute of Mining and Metallurgy, pp.35–70. Available at:
http://www.saimm.co.za/Conferences/SurfaceMining2008/035-
070_Ashmole.pdf.
Attom, M.F. & Al-Sharif, M.M., 1998. Soil stabilization with burned olive waste.
Applied Clay Science, 13(3), pp.219–230.
Aydin, G., Kaya, S. & Karakurt, I., 2017. Utilization of solid-cutting waste of granite
as an alternative abrasive in abrasive waterjet cutting of marble. Journal of
Cleaner Production, 159, pp.241–247. Available at:
http://dx.doi.org/10.1016/j.jclepro.2017.04.173.
Baghaee Moghaddam, T., Soltani, M. & Karim, M.R., 2014. Evaluation of permanent
deformation characteristics of unmodified and Polyethylene Terephthalate
modified asphalt mixtures using dynamic creep test. Materials and Design,
53, pp.317–324. Available at: http://dx.doi.org/10.1016/j.
matdes.2013.07.015.
Ban, H. & Park, S.-W., 2014. Characteristics of modified soil-aggregate system and
their application in pavements. KSCE Journal of Civil Engineering, 18(6),
pp.1672–1678. Available at: http://link.springer.com/10.1007/s12205-014-
0639-3.
Basha, E.A. et al., 2005. Stabilization of residual soil with rice husk ash and cement.
Construction and Building Materials, 19(6), pp.448–453.
Bell, F.G., 1996. Lime stabilization of clay minerals and soils. Engineering Geology,
42(4), pp.223–237.
Bhuvaneshwari, S., Robinson, R.G. & Gandhi, S.R., 2005. Stabilization of Expansive

References
126
Soils Using Flyash. In Fly Ash India. pp. 1–10.
Bomag, 2004. Soil and Asphalt compaction equipments : Selection Guide.
Wackernueson, pp.1–39. Available at: http://www.wackerneuson.us/
fileadmin/user_upload/downloads/reg1_USA/downloads/wacker_neuson_soi
l_asphalt_compaction_en.pdf.
Borhan, M.N., Ismail, A. & Rahmat, R.A., 2010. Evaluation of Palm Oil Fuel Ash (
POFA) on Asphalt Mixtures. Australian Journal of Basic and Applied
Sciences, (1970), pp.1–8.
British Geological Survey, 2005. MINERAL PROFILE BUILDING AND November
2005, Great Britain. Available at: https://www.bgs.ac.uk/downloads/start.
cfm?id=1407.
Brooks, R., Udoeyo, F.F. & Takkalapelli, K. V., 2011. Geotechnical Properties of
Problem Soils Stabilized with Fly Ash and Limestone Dust in Philadelphia.
Journal of Materials in Civil Engineering, 23(May), pp.711–716.
Chandra, D. & Mandal, J.N., 2017. Laboratory investigations on Reclaimed Asphalt
Pavement ( RAP ) for using it as base course of flexible pavement. In Procedia
Engineering. The Author(s), pp. 434–439. Available at:
http://dx.doi.org/10.1016/j.proeng.2017.05.069.
Chawda, S., 2014. Effect of crusher dust on engineering properties of lime stablized
black cotton soil. International Journal of Engineering Research and Science
& Technology, 3(4), pp.2–11. Available at: http://www.ijerst.com/current
issue.php.
Chen, J.-S., Chang, M.K. & Lin, K.Y., 2005. Influence of Coarse Aggregate Shape
on the Strength of Asphalt Concrete Mixtures. Journal of the Eastern Asia
Society for Transportation Studies, 6, pp.1062–1075. Available at: https://
www.jstage.jst.go.jp/article/easts/6/0/6_0_1062/_pdf/-char/ja.
Chen, M.Z. et al., 2011. Utilization of recycled brick powder as alternative filler in
asphalt mixture. Construction and Building Materials, 25(4), pp.1532–1536.
Available at: http://dx.doi.org/10.1016/j.conbuildmat.2010.08.005.
Ebrahim, A. & Behiry, A.E., 2012. Fatigue and rutting lives in flexible pavement. Ain
Shams Engineering Journal, 3(4), pp.367–374. Available at:
http://dx.doi.org/10.1016/j.asej.2012.04.008.
Etim, R.K., Eberemu, A.O. & Osinubi, K.J., 2017. Stabilization of Black Cotton Soil

References
127
With Lime and Iron Ore Tailings Admixture. Transportation Geotechnics, 10,
pp.85–95. Available at: http://linkinghub.elsevier.com/retrieve/pii/
S2214391217300119.
Eze-Uzomaka, Johnson, O. & Daniel, A., 2010. Suitability of Quarry Dust as
Improvement to Cement Stabilized- Laterite for Road Bases. Electronic
Journal of Geotechnical Engineering, 15, pp.1053–1066.
Frigio, F. et al., 2013. Improved durability of recycled porous asphalt. Construction
and Building Materials, 48, pp.755–763. Available at: http://dx.doi.org
/10.1016/j.conbuildmat.2013.07.044.
Gadre, a. D. & Chandrasekaran, V.S., 1994. Swelling of Black Cotton Soil Using
Centrifuge Modeling. Journal of Geotechnical Engineering, 120(5), pp.914–
919.
Gandhi, K.S., 2013. Stabilization of Expansive Soil of Surat Region using Rice Husk
Ash & Marble Dust. International Journal of Current Engineering and
Technology, 3(4), pp.1516–1521.
Ganie, M.A., Abhishek & Sharma, R., 2017. SOIL INVESTIGATION AND EFFECT
OF STONE DUST ON GEOTECHNICAL. International Journal of
Information Movement, 2(VII), pp.73–80.
Geological Survey of India, 2011. Geology and Mineral Resources of Rajasthan.,
Ghausuddin, Q.S. & Koranne, S.S., 2011. Evaluation of soil-quarry dust mixtures
reinforced with polypropylene fibers. Electronic Journal of Geotechnical
Engineering, 16 I, pp.1007–1017.
Government of India, 2018. Bharatmala Pariyojana Phase-1,
Government of Rajasthan, 2015. MINERAL Policy 2015,
Gupta, C. & Sharma, R.K., 2013. Influence of Marble Dust , Fly Ash and Beas Sand
on Sub Grade Characteristics of Expansive Soil. IOSR Journal of Mechanical
and Civil Engineering, (February), pp.13–18.
Gupta, C. & Sharma, R.K., 2014. Influence of Marble Dust , Fly Ash and Beas Sand
on Sub Grade Characteristics of Expansive Soil. Journal of Mechanical and
Civil Engineering, 2014(13), pp.13–18.
Gupta, S., Pandey, M.K. & Srivastava, R.K., 2015. Evaluation of Cement Kiln Dust
Stabilized Heavy Metals Contaminated Expansive Soil – A Laboratory Study.
European Journal of Advances in Engineeing and Technology, 2(6), pp.37–

References
128
42.
Gurbuz, A., 2015. Marble powder to stabilise clayey soils in sub- bases for road
construction. Road Materials and Pavement Design, 0629(December),
pp.481–492. Available at: http://dx.doi.org/10.1080/14680629.2015.102
0845.
Hall, M.R., Najim, K.B. & Keikhaei Dehdezi, P., 2012. Soil stabilization and earth
construction: materials, properties, and techniques. In Modern Earth
Buildings. pp. 222–255. Available at: https://books.google.com.co/books?id=
YYBwAgAAQBAJ&pg=PA222&lpg=PA222&dq=9+?+Soil+stabilisation+a
nd+earth+construction:+materials,+properties+and+techniques&source=bl&
ots=cPkpzUlywg&sig=V7ngy6iLHW1Rq6bi0H5-
RAPZCcM&hl=es&sa=X&ei=ruw_VeeiFMXlsASG-IGI.
Hamza, R. a., El-Haggar, S. & Khedr, S., 2011. Marble and Granite Waste:
Characterization and Utilization in Concrete Bricks. International Journal of
Bioscience, Biochemistry and Bioinformatics, 21(4), pp.115–119.
Hargreaves, R., 2010. Introduction to Stone Polishing. manchester minerals, pp.1–8.
Available at: https://www.manchesterminerals.co.uk/acatalog/tumblebk.pdf
[Accessed February 14, 2018].
Harshwardhan, S.C. et al., 2017. Partial Replacement of Cement by Kota Stone Slurry
in Mortar. STM Journals, 7(3), pp.8–13.
Huang, Y., Bird, R.N. & Heidrich, O., 2007. A review of the use of recycled solid
waste materials in asphalt pavements. Resources, Conservation and Recycling,
52(1), pp.58–73.
Husain, M.N. & Aggarwal, P., 2015. Improving Soil subgrade strength of
Kurukshetra soil using Stone dust,
Ibrahim, A., Faisal, S. & Jamil, N., 2009. Use of basalt in asphalt concrete mixes.
Construction and Building Materials, 23(1), pp.498–506. Available at:
http://dx.doi.org/10.1016/j.conbuildmat.2007.10.026.
Jain, S., Joshi, Y.P. & Goliya, S.S., 2013. Design of Rigid and Flexible Pavements by
Various Methods & Their Cost Analysis of Each Method. International
Journal of Engineering Research and Applications, 3(5), pp.119–123.
Jayawardena, U.D.S. & Dissanayake, D.M.S., 2006. Use of quarry dust instead of
river sand for future constructions in Sri Lanka. the Geological Society of

References
129
London, 01(38), pp.1–4.
Kandhal, P.S. & Mallick, R.B., 1999. Design of New-Generation Open-Graded
Friction Course,
Karakus, A., 2011. Investigating on possible use of Diyarbakir basalt waste in Stone
Mastic Asphalt. Construction and Building Materials, 25, pp.3502–3507.
Karaşahin, M. & Terzi, S., 2007. Evaluation of marble waste dust in the mixture of
asphaltic concrete. Construction and Building Materials, 21(3), pp.616–620.
Ken, C.O., Okafor, F. & Nwachukwu, D., 2006. Geophysical Use of Quarry Dust (As
Admixture) As Applied To Soil Stabilization and Modification-a Review.
ARPN Journal of Earth Sciences, 1(1), pp.2002–2004. Available at:
http://d.researchbib.com/f/0nq3q3YzSlpT5do3IlozSfpl5wo20inzImY3Wyp2I
upzAbK3OupTIlpl9lpS8lZQRlY2cyp18kZQRlKmNlYaOxMt.pdf.
Kennedy, T.W. & Anagnos, J.N., 1983. Engineering properties of recycled asphalt
mixtures, Texas. Available at: https://library.ctr.utexas.edu/digitized/texas
archive/phase2/252-4F-CTR.pdf.
Keshavan, V. et al., 2017. Soil Stabilization using Marble Dust and Granite Dust in
Clay Soil. INternational Journal of Engineering Science and Computing, 7(4),
pp.10084–10086.
Khader, S., Baba, V. & Haripriya, S., 2017. PERFORMANCE ANALYSIS OF
BLACK COTTON SOIL TREATED WITH GRANITE DUST AND.
International Journal of Civil Engineering and Technology, 8(10), pp.1341–
1350.
Kiran Kumar, B.V., Manjunatha, S. & Prasad N, S., 2014. Porous Asphalt Pavement
a Tentative Mix Design Guidelines – By New Generation Open Graded
Friction. International Journal of Engineering Science Invention Research &
Development, I(III), pp.105–112.
Krishnan, S. et al., 2018. Hydration kinetics and mechanisms of carbonates from stone
wastes in ternary blends with calcined clay. Construction and Building
Materials, 164, pp.265–274. Available at: https://doi.org/10.1016/
j.conbuildmat.2017.12.240.
Kuamr, U.A. & Biradar, K.B., 2014. Soft Subgrade Stabilization With Quarry Dust-
an Industrial Waste. INternational Journal of Research in Engineering and
Technology, 3(8), pp.2319–2322. Available at: http://esatjournals.net/ijret/

References
130
2014v03/i08/IJRET20140308063.pdf.
Kumar, P., Chandra, S. & Vishal, R., 2006. Comparative Study of Different Subbase
Materials. Journal of Materials in Civil Engineering, 18(August), pp.576–
580.
Kumar, R. & Lakhani, R., 2017. A simple novel mix design method and properties
assessment of foamed concretes with limestone slurry waste, Elsevier B.V.
Available at: http://linkinghub.elsevier.com/retrieve/pii/S0959652617323661.
Leite, F.D.C. et al., 2011. Laboratory evaluation of recycled construction and
demolition waste for pavements. Construction and Building Materials, 25(6),
pp.2972–2979.
Lokeshwari, M. & Jagadish, K.S., 2016. Eco-friendly Use of Granite Fines Waste in
Building Blocks. Procedia Environmental Sciences, 35, pp.618–623.
Available at: http://linkinghub.elsevier.com/retrieve/pii/S1878029616301384.
Lynn, C.J., Ghataora, G.S. & Dhir, R.K., 2016. Municipal Incinerated Bottom Ash
(MIBA) Characteristics and Potential for Use in Road Pavements.
International Journal of Pavement Research and Technology, pp.1–16.
Available at: http://linkinghub.elsevier.com/retrieve/pii/S1996681416301729.
Lyons, K.R. & Putman, B.J., 2013. Laboratory evaluation of stabilizing methods for
porous asphalt mixtures. Construction and Building Materials, 49, pp.772–
780. Available at: http://dx.doi.org/10.1016/j.conbuildmat.2013.08.076.
Mahent, R., 2015. Improvement of Soil Index Properties by Adding Stone Dust Mix.
International Journal of Science Technology & Engineering, 2(02), pp.61–68.
Mallick, R.B. et al., 2000. Design, Construction, and Performance of New-Generation
Open-Graded Friction Courses,
Mancinİ, R. et al., 2001. Technical and economic substantiation of the cutting
techniques in high-strength dimension stone quarries. In 17th Internationa
Mining Congress and Exhibition of Turkey. Turkey, pp. 1–6. Available at:
http://www.maden.org.tr/resimler/ekler/01627aa14e37bd1_ek.pdf.
Marshall Mix Design and Analysis, 2007. Marshall Mix Design and Analysis. In
Marshall Mix Design and Analysis. Cochin University of Science and
Technology, pp. 48–77. Available at: http://shodhganga.inflibnet.ac.in/
bitstream/10603/6226/9/09_chapter 4.pdf.
Masoud, T., 2015. Study the effect of using stone cutting slurry waste (Al-Khamkha)

References
131
on the compaction characteristics of Jerash sandy soil. Journal of Engineering
and Applied Sciences, 10(5), pp.107–109.
Mccarthy, M.J. et al., 2014. Engineering and durability properties of fly ash treated
lime-stabilised sulphate-bearing soils. Engineering Geology, 174, pp.139–
148. Available at: http://dx.doi.org/10.1016/j.enggeo.2014.03.001.
Mccarthy, S., 2011. Diamond wire cutting. In Queensland Roads. pp. 29–39.
Available at: file:///C:/Users/Acer/Downloads/Page2939Diamondcutred2.pdf.
Medina, G. et al., 2017. Granite quarry waste as a future eco-efficient supplementary
cementitious material (SCM): Scientific and technical considerations. Journal
of Cleaner Production, 148, pp.467–476.
Mehta, P. & Mehta, V., 2015. Waste Generation and Minimization : A Study of
Marble Mines of Rajsamand. International Journa of Informative & Futuristic
Research, 2(9), pp.3049–3058.
Mills-Beale, J. & You, Z., 2010. The mechanical properties of asphalt mixtures with
Recycled Concrete Aggregates. Construction and Building Materials, 24(3),
pp.230–235. Available at: http://dx.doi.org/10.1016/j.conbuildmat.2009.
08.046.
Minhas, A. & Devi, V.U., 2016. Soil Stabilization of Alluvial Soil By Using Marble
Powder. International Journal of Civil Engineering and Technology, 7(5),
pp.87–92. Available at: http://www.iaeme.com/IJCIET/issues.asp?JType=
IJCIET&VType=7&IType=5.
Mishra, J., Yadav, R.K. & Singhai, A.K., 2014. Effect of Granite Dust on Index
Properties of Lime Stabilized Black Cotton Soil. International Journal of
Engineering Research & Science & Technology, 3(1), pp.832–837. Available
at: http://www.ijerst.com/currentissue.php.
Modarres, A. & Nosoudy, Y.M., 2015. Clay stabilization using coal waste and lime -
Technical and environmental impacts. Applied Clay Science, 116–117,
pp.281–288. Available at: http://dx.doi.org/10.1016/j.clay.2015.03.026.
Mohammadinia, A. et al., 2017. Effect of lime stabilization on the mechanical and
micro-scale properties of recycled demolition materials. Sustainable Cities
and Society, 30, pp.58–65. Available at: http://dx.doi.org/10.1016/j.scs.
2017.01.004.
Naidu, G. & Adiseshu, S., 2013. Influence of Coarse Aggregate Shape Factors on

References
132
Bituminous Mixtures. International Journal of Engineering Research and
Applications, 1(4), pp.2013–2024. Available at: http://www.kresttechnology.
com/krest-academic-projects/krest-mtech-projects/Civil/Civil M.tech Projects
2017 -2018/3. Transportation Engineering/BASE PAPERS/10.influence of
coarse aggregate shape factors on bituminous mixture.pdf.
Nayak, D. et al., 2015. Effect of Lime on Granite Dust Stabilized Mud Blocks. In 4th
World Conference on Applied Sciences, Engineering & Technology. pp. 251–
257.
Nejad, F.M., Azarhoosh, A.R. & Hamedi, G.H., 2013. Laboratory Evaluation of Using
Recycled Marble Aggregates on the Mechanical Properties of Hot Mix
Asphalt. American Society of Civil Engineers, 25(June), pp.741–746.
Ogbonnaya, I. & Illobachie, D.E., 2011. THE POTENTIAL EFFECT OF GRANITE
DUST ON THE GEOTECHNICAL PROPERTIES OF ABAKALIKI
CLAYS. Continental Journal of Earth Science, 1(January 2011), pp.23–30.
Okagbue, C.O. & Onyeobi, T.U.S., 1999. Potential of marble dust to stabilise red
tropical soils for road construction. Engineering Geology, 53(3–4), pp.371–
380.
Okagbue, C.O. & Yakubu, J. a, 2000. Limestone ash waste as a substitute for lime in
soil improvement for engineering construction. Bulletin of Engineering
Geology and the Environment, 58, pp.107–113. Available at: http://link.
springer.com/article/10.1007/s100640050004.
Olinic, T. & Olinic, E., 2016. The Effect of Quicklime Stabilization on Soil Properties.
Agriculture and Agricultural Science Procedia, 10, pp.444–451. Available at:
http://linkinghub.elsevier.com/retrieve/pii/S2210784316302066.
Oncu, S. & Bilsel, H., 2016. Ageing effect on swell , shrinkage and flexural strength
of sand and waste marble powder stabilized expansive soil. In 3rd European
conference on Unsaturated soil. Paris: EDP Sciences, pp. 1–6.
Pawan Patidar, Using Kota stone minig waste as non-bituminious base course
material, M.Tech Thesis.
Paranavithana, S. & Mohajerani, A., 2006. Effects of recycled concrete aggregates on
properties of asphalt concrete. Resources, Conservation and Recycling, 48(1),
pp.1–12.
Pérez, I., Pasandín, A.R. & Medina, L., 2012. Hot mix asphalt using C&D waste as

References
133
coarse aggregates. Materials and Design, 36, pp.840–846.
Pérez, P. et al., 2013. Application of cement-treated recycled materials in the
construction of a section of road in Malaga, Spain. Construction and Building
Materials, 44, pp.593–599.
Poon, C.S. & Chan, D., 2006. Feasible use of recycled concrete aggregates and
crushed clay brick as unbound road sub-base. Construction and Building
Materials, 20(8), pp.578–585.
Pradeep, T.L. & Imanka, U.K., 2016. Analytical Investigation on Isolated Foundation
Improvement Using Quarry Dust. International Journal of Emerging
Technology and Advanced Engineering, 6(1), pp.60–66.
Prasad, D. & Prasada Raju, D., 2015. Study on Geotechnical Properties of Stabilized
Expansive Soil- Quarry Dust Mixes. IOSR Journal of Mechanical and Civil
Engineering, 12(6), pp.2278–1684. Available at: www.iosrjournals.org.
Lo Presti, D., 2013. Recycled Tyre Rubber Modified Bitumens for road asphalt
mixtures: A literature review. Construction and Building Materials, 49,
pp.863–881. Available at: http://dx.doi.org/10.1016/j.conbuildmat.2013.09.007.
PRS India legislative research, 2018. Demand for Grants 2018-19 Analysis Road
Transport and Highways, Available at: http://www.prsindia.org/uploads/
media/DFG 2018-19/DFG Analysis Roads 2018.pdf.
Puppala, A.J., Saride, S. & Williammee, R., 2012. Sustainable Reuse of Limestone
Quarry Fines and RAP in Pavement Base/Subbase Layers. Journal of
Materials in Civil Engineering, 24(4), pp.418–429. Available at:
http://ascelibrary.org/doi/10.1061/%28ASCE%29MT.1943-5533.0000404.
Qasrawi, H. & Asi, I., 2016. Effect of bitumen grade on hot asphalt mixes properties
prepared using recycled coarse concrete aggregate. Construction and Building
Materials, 121, pp.18–24. Available at: http://dx.doi.org/10.1016/j.
conbuildmat.2016.05.101.
Rahman, M.K., Rehman, S. & Al-Amoudi, O.S.B., 2011. Literature Review on
Cement Kiln Dust Usage in Soil and Waste Stabilization and Experimental
Investigation. International Journal of Research and Review in Applied
Science, 7(1), pp.77–87. Available at: www.arpapress.com/Volumes/
Vol7Issue1/IJRRAS_7_1_12.pdf.
Ramadas, T.L., Kumar, N.D. & Aparna, G., 2010. Swelling and Strength

References
134
Characteristics of Expansive Soil Treated with Stone Dust and Fly Ash. In
Indian Geotechnical Conference (GEOtrendz). Mumbai: Iinternational Societ
of Soil Mechanics and Geotechnical Engineering, pp. 557–560. Available at:
https://gndec.ac.in/~igs/ldh/conf/2010/articles/t019.pdf.
Rana, A., Kalla, P. & Csetenyi, L.J., 2016. Recycling of dimension limestone industry
waste in concrete. International Journal of Mining, Reclamation and
Environment, 0930(January), pp.1–20. Available at:
http://www.tandfonline.com/doi/full/10.1080/17480930.2016.1138571.
Report., G. of R., 2013. Indian Minerals Yearbook 2013 (part III: Mineral Reviews).
Sipri, pp.1–18.
Roohbakhshan, A. & Kalantari, B., 2016. Stone Powder. Amirkabir Journal of
Science and Research- Civil and Environmental Engineering, 48(4), pp.163–
165. Available at: http://ceej.aut.ac.ir/?_action=showPDF&sc=1&article=
679&_ob=947bac1c6eaf96322de7261b8f6e56b9&fileName=full_text.pdf.
Rubio, M.C. et al., 2010. Reuse of waste material from decorative quartz solid
surfacing in the manufacture of hot bituminous mixes. Construction and
Building Materials, 24(4), pp.610–618. Available at: http://dx.doi.org/
10.1016/j.conbuildmat.2009.09.004.
Sabat, A.K. & Nanda, R., 2011. Effect of marble dust on strength and durability of
Rice husk ash stabilised expansive soil. International Journal of Civil and
Structural Engineering, 1(4), pp.3768–3772.
Saini, Y. & Soni, D.K., 2017. STABILIZATION OF CLAYEY SOIL BY USING
STONE SLURRY WASTE AND CEMENT : REVIEW. International
Journal of Advance Technology in Engineering Science, 5(01), pp.343–349.
Salam, S. et al., 2018. Crushed Limestone Aggregate Strength Influenced by
Gradation, Fines Content, and Dust Ratio. Journal of Transport Engineering,
Part B, 144(1), pp.1–11.
Saltan, M. & Selcan Findik, F., 2008. Stabilization of subbase layer materials with
waste pumice in flexible pavement. Building and Environment, 43(4), pp.415–
421.
Sargent, P., 2015. 21 – The development of alkali-activated mixtures for soil
stabilisation. In Handbook of Alkali-Activated Cements, Mortars and
Concretes. Woodhead Publishing Limited, pp. 555–604. Available at:

References
135
http://www.sciencedirect.com/science/article/pii/B9781782422761500216.
Sargin, S. et al., 2013. Evaluation of rice husk ash as filler in hot mix asphalt concrete.
Construction and Building Materials, 48, pp.390–397.
Saride, S., Puppala, A.J. & Williammee, R., 2010. Assessing recycled / secondary
materials as pavement bases. Institute of Civil Engineering, 63(February),
pp.3–12.
Sarvade, P.G. & Nayak, S., 2014. Studies on the utilization of quarry dust to improve
the geotechnical properties of lithomargic clay. Internation Journal of
Advanced Structures and Geotechnical Enginering, 03(01), pp.1–6.
Satyanarayana, P.V. V, Teja, R.P., et al., 2013. A Study on the Use of Crushed Stone
Aggregate and. International Journal of Scientific & Engineering Research,
4(11), pp.1126–1136.
Satyanarayana, P.V. V, Pradeep, N. & Varnma, N.S.C., 2013. A Study on the
Performance of Crusher Dust In Place Of Sand and Red Soil as A Subgrade
And Fill Material. IOSR Journal of Mechanical and Civil Engineering, 3(1),
pp.285–288. Available at: http://www.iosrjournals.org/iosr-jmce/papers/
vol9-issue2/G0925357.pdf?id=7319.
Satyanarayana P, R.K., Abdul Moin, V, P. V & V, J.P., 2016. Application of Two
Industrial Wastes Rice Husk Ash and Crusher Dust as Embankment and Sub-
Grade Materials. International Journal of Engineering Science and Innovative
Technology, 5(2), pp.57–63.
Sen, T. & Mishra, U., 2010. Usage of Industrial Waste Products in Village Road
Construction. International Journal of Environmental Science and
Development, 1(2), pp.122–126. Available at: http://www.ijesd.org/show-23-
284-1.html.
Šernas, O., Strumskys, M. & Skrodenis, D., 2014. Possibility of Use of Granite Fines
in Asphalt Pavements. In 9th International Conference “Environmental
Engineering". Lithuania: VGTU Press, pp. 7–13. Available at:
http://enviro.vgtu.lt.
SevilKofteci & Niyaziugurkockal, 2014. Using Marble Wastes as Fine Aggregate in
Hot Mix Asphalt Production. In Proc. of the Intl. Conf. on Advances In Civil,
Structural And Construction Engineering - CSCE 2014. Institute of Research
Engineers and Doctors, pp. 117–121. Available at: http://seekdl.org/

References
136
nm.php?id=3648.
Sharma, P.K., Khandelwal, M. & Singh, T.N., 2007. Variation on physico-mechanical
properties of Kota stone under different watery environments. Building and
Environment, 42(12), pp.4117–4123.
Shen, D.H., Wu, C.M. & Du, J.C., 2009. Laboratory investigation of basic oxygen
furnace slag for substitution of aggregate in porous asphalt mixture.
Construction and Building Materials, 23(1), pp.453–461. Available at:
http://dx.doi.org/10.1016/j.conbuildmat.2007.11.001.
Shirini, B. & Imaninasab, R., 2016. Performance evaluation of rubberized and SBS
modified porous asphalt mixtures. Construction and Building Materials, 107,
pp.165–171. Available at:
http://dx.doi.org/10.1016/j.conbuildmat.2016.01.006.
Siddique, R., 2008. Cement Kiln Dust. In Waste Materials and By-Products in
Concrete. pp. 351–380.
Siddique, R., 2014. Utilization of industrial by-products in concrete. Procedia
Engineering, 95(January), pp.335–347. Available at: http://dx.doi.org/
10.1016/j.proeng.2014.12.192.
Sivrikaya, O., Kiyildi, K.R. & Karaca, Z., 2014. Recycling waste from natural stone
processing plants to stabilise clayey soil. Environment Earth Science, 71,
pp.4397–4407. Available at: http://link.springer.com/article/10.1007/s12665-
013-2833-x.
Sonthwal, V. & Soni, G., 2016. STABILIZATION OF SOIL REINFORCED WITH
QUARRY DUST. International Journal of Recent Trends in Engineering and
Research, 02(9), pp.318–323.
Soosan, T.G. et al., 2005. Utilization of quarry dust to improve the geotechnical
properties of soils in highway construction. Geotechnical Testing Journal,
28(4), pp.391–400.
Sridharan, A. et al., 2006. Shear strength studies on soil-quarry dust mixtures.
Geotechnical and Geological Engineering, 24(5), pp.1163–1179.
Su, K., Hachiya, Y. & Maekawaa, R., 2009. Study on recycled asphalt concrete for
use in surface course in airport pavement. Resources, Conservation and
Recycling, 54(1), pp.37–44.
Sung Do, H., Hee Mun, P. & Suk keun, R., 2008. A study on engineering

References
137
characteristics of asphalt concrete using filler with recycled waste lime. Waste
Management, 28(1), pp.191–199.
Tarrer, A.R. & Wagh, V., 1991. The Effect of the Physical and Chemical
Characteristics of the Aggregate on Bonding,
Tayfur, S., Ozen, H. & Aksoy, A., 2007. Investigation of rutting performance of
asphalt mixtures containing polymer modifiers. Construction and Building
Materials, 21(2), pp.328–337.
Thirumalai, R. & Naveennayak, V., 2017. Stabilization of Black Cotton Soil Using
Granite Waste and Quarry Dust. International Research Journal of
Engineering and Technology, 4(8), pp.226–229. Available at:
https://irjet.net/archives/V4/i8/IRJET-V4I839.pdf.
Uzun, S. & Terzi, S., 2012. Evaluation of andesite waste as mineral filler in asphaltic
concrete mixture. Construction and Building Materials, 31, pp.284–288.
Venkateswarlu, H. et al., 2015. Study on Behaviour of Expansive Soil Treated With
Quarry Dust. International Journal of Engineering and Innovative Technology
(IJEIT), 4(10), pp.193–196.
Washington Transportation Research Board, 2015. Moisture Damage to Hot-Mix
Asphalt Mixtures, DC.
Wong, Y.D., Sun, D.D. & Lai, D., 2007. Value-added utilisation of recycled concrete
in hot-mix asphalt. Waste Management, 27, pp.294–301.
Yang, S. et al., 2016. Influence of aging and moisture on laboratory performance of
asphalt concrete. Construction and Building Materials, 115, pp.527–535.
Available at:
http://linkinghub.elsevier.com/retrieve/pii/S0950061816306109.
Yilmaz, M., Kök, B.V. & Kulog, N., 2011. Effects of using asphaltite as filler on
mechanical properties of hot mix asphalt. Construction and Building
Materials, 25, pp.4279–4286.
Zaumanis, M., Mallick, R.B. & Frank, R., 2016. 100 % hot mix asphalt recycling :
challenges and benefits. In Transportation Research Procedia. Elsevier B.V.,
pp. 3493–3502. Available at: http://dx.doi.org/10.1016/j.trpro.2016.05.315.
Zorluer, I. & Gucek, S., 2017. Usage of Fly Ash and Granite Dust for Soil
Stabilization. In 5th International Symposium on Innovative Technologiesin
Engineering and Science. pp. 532–538.
References
138
Zulkati, A., Wong, Y.D. & Sun, D.D., 2013. Mechanistic Performance of Asphalt-
Concrete Mixture Incorporating Coarse Recycled Concrete Aggregate.
Journal of Materials in Civil Engineering, 25(9), pp.1299–1305. Available
at:http://www.scopus.com/inward/record.url?eid=2-s2.0-
84883327710&partnerID=tZOtx3y1.
Zauba.com. (2017). Export analysis and trends of Kota stone | Zauba. [online]
Available at: https://www.zauba.com/exportanalysis-KOTA+STONE-
report.html [Accessed 2 Nov. 2017].

139
LIST OF PUBLICATIONS FROM THESIS
Gautam, P. K., Kalla, P., Jethoo, A. S., Agrawal, R., & Singh, H. (2018).
Sustainable use of waste in flexible pavement: A review. Construction and
Building Materials, 180, 239–253, SCI
http://doi.org/10.1016/j.conbuildmat. 2018.04.067
Gautam, P. K., Kalla, P., Nagar, R., & Jethoo, A. S. (2018). Laboratory
investigation on use of quarry waste in open graded friction course. Resources
Policy, (February), 0–1. http://doi.org/10.1016/j.resourpol. 2018.02.009, SCI
Gautam, P. K., Kalla, P., Nagar, R., Agrawal, R., & Jethoo, A. S. (2018).
Laboratory investigations on hot mix asphalt containing mining waste as
aggregates. Construction and Building Materials, 168, 143–152.
http://doi.org/ 10.1016/j.conbuildmat.2018.02.115, SCI
P.Gautam, P.Kalla, A.S. Jethoo, Use of quarry waste as building material: A
review at International Conference on Science, Innovation and Management,
London, U.K. 7-8th June 2018, International Conference.
P.K. Gautam, P. Kalla, A.S. Jethoo, S.C. Harshwardhan, Dimensional Stone
Waste Characterization in Rajasthan and Suggesting their possible
Remedies, Int. J. Emerg. Technol. 8 (2017) 40–42, National Conference.

140
APPENDIX
Marshall Test Results of BC Mixes
a) C-bc
y = -2593.5x2 + 32256x - 88192
R² = 0.9994
7500.00
8500.00
9500.00
10500.00
11500.00
12500.00
5 5.5 6 6.5 7 7.5
Sta
bil
ity
(N
)
% binder
y = 0.2038x2 - 3.9321x + 21.008
R² = 0.9992
0.00
2.00
4.00
6.00
8.00
10.00
5.4 5.9 6.4 6.9 7.4%
air
void
% binder
y = -0.0048x2 + 0.0593x + 2.2327
R² = 0.9429
2.405
2.407
2.409
2.411
2.413
2.415
2.417
2.419
5 5.5 6 6.5 7 7.5
Bu
lk S
pec
ific
Gra
vit
y
(gm
/cc)
% Binder
y = 0.2737x2 - 2.8908x + 10.693R² = 0.9933
22.5
33.5
44.5
55.5
6
5 6 7 8
Flo
w v
alu
e (
mm
)
% binder
y = -1.1531x2 + 22.709x - 20.081
R² = 0.9996
60.00
65.00
70.00
75.00
80.00
85.00
90.00
5 6 7
VF
B
% binder
y = 0.2541x2 - 2.3396x + 23.621
R² = 0.9931
18.00
18.50
19.00
19.50
20.00
20.50
5 6 7 8
VM
A
% binder

Appendix
141
b) 25K-bc
y = -2040.1x2 + 24984x -
64767
R² = 0.9998
7500.008000.008500.009000.009500.00
10000.0010500.0011000.0011500.0012000.00
5 5.5 6 6.5 7 7.5
ST
AB
ILIT
Y (
N)
% Binder
y = 0.7069x2 - 10.24x + 40.252
R² = 0.9959
3.00
3.50
4.00
4.50
5.00
5.50
6.00
5 5.5 6 6.5 7 7.5
% A
IR V
OID
% Binder
y = -0.0173x2 + 0.2143x + 1.7523
R² = 0.9789
2.380
2.400
2.420
5 6 7
BU
LK
SP
EC
IFIC
GR
AV
ITY
(g
m/c
c)
% Binder
y = 0.2042x2 - 1.9749x + 7.9437
R² = 0.9971
3
3.5
4
4.5
5
5.5
6
5 6 7
FL
OW
(m
m)
% Binder
y = -3.7507x2 + 55.703x - 122.46
R² = 0.9979
60.000
65.000
70.000
75.000
80.000
85.000
90.000
5 6 7 8
VF
B
% Binder
y = 0.3556x2 - 3.3226x + 25.413
R² = 0.9975
17.50
18.00
18.50
19.00
19.50
20.00
20.50
21.00
5 6 7 8
VM
A
% Binder

Appendix
142
c) 50K-bc
y = -2502.9x2 + 31512x -
87929
R² = 0.996
7500.00
8000.00
8500.00
9000.00
9500.00
10000.00
10500.00
11000.00
11500.00
5 5.5 6 6.5 7 7.5
ST
AB
ILIT
Y (
N)
% Binder
y = 0.7738x2 - 11.155x + 43.729
R² = 0.9993
2.00
3.00
4.00
5.00
6.00
7.00
8.00
5 5.5 6 6.5 7 7.5
% A
IR V
OID
% Binder
y = -0.017x2 + 0.2123x + 1.7583
R² = 0.999
2.360
2.380
2.400
2.420
2.440
5 6 7
BU
LK
SP
EC
IFIC
GR
AV
ITY
(g
m/c
c)
% BINDER
y = 0.2429x2 - 2.3671x + 9.0043
R² = 0.9981
3
3.5
4
4.5
5
5.5
5.5 6.5 7.5
FL
OW
(M
M)
% BINDER
y = -4.0349x2 + 59.727x - 138.23
R² = 0.9992
60.00
65.00
70.00
75.00
80.00
85.00
5 6 7 8
VF
B
% BINDER
y = 0.4078x2 - 3.9656x + 27.657
R² = 0.9929
18.000
18.500
19.000
19.500
20.000
20.500
21.000
5 6 7 8
VM
A
% BINDER

Appendix
143
d) 75K-bc
y = -2922.6x2 + 36151x -
101479
R² = 0.9999
5000.00
6000.00
7000.00
8000.00
9000.00
10000.00
11000.00
5 5.5 6 6.5 7 7.5
ST
AB
ILIT
Y (
N)
% Binder
y = 0.3648x2 - 6.1279x + 27.866
R² = 1
2.00
3.00
4.00
5.00
6.00
7.00
5 5.5 6 6.5 7 7.5
% A
IR V
OID
% Binder
y = -0.0089x2 + 0.1149x +
2.0597
R² = 0.9989
2.420
2.430
2.440
5 6 7
BU
LK
SP
EC
IFIC
GR
AV
ITY
(g
m/c
c)
% Binder
y = -0.1571x2 + 3.2529x - 10.306
R² = 0.9943
2
2.5
3
3.5
4
4.5
5
5.5
6
5 6 7
FL
OW
(m
m)
% Binder
y = -1.8495x2 + 32.326x - 50.391
R² = 1
70.00
75.00
80.00
85.00
90.00
5 6 7 8
VF
B
% Binder
y = 0.4997x2 - 5.5526x + 33.635
R² = 0.9922
18.00
18.50
19.00
19.50
20.00
20.50
5 6 7
VM
A
% Binder

Appendix
144
d) 100K-bc
y = -2270.9x2 + 28456x -
78735
R² = 0.9989
7500.00
8000.00
8500.00
9000.00
9500.00
10000.00
10500.00
11000.00
5 5.5 6 6.5 7 7.5
ST
AB
ILIT
Y (
N)
% Binder
y = 0.5335x2 - 8.3025x + 33.772
R² = 0.9998
0.00
2.00
4.00
6.00
8.00
10.00
5 5.5 6 6.5 7 7.5
% A
IR V
OID
S
% Binder
y = -0.0133x2 + 0.171x + 1.9634
R² = 0.9961
2.4942.4962.4982.5002.5022.5042.5062.5082.5102.5122.514
5 6 7 8
BU
LK
SP
EC
IFIC
GR
AV
ITY
(g
m/c
c)
% BINDER
y = -0.4286x2 + 6.4114x - 18.713
R² = 0.9937
2
2.5
3
3.5
4
4.5
5
5.5
6
5 6 7
FL
OW
(m
m)
% BINDER
y = -3.1139x2 + 48.65x - 97.565
R² = 1
75.00
80.00
85.00
90.00
95.00
5 5.5 6 6.5 7 7.5 8
VF
B
% BINDER
y = 0.2995x2 - 3.0208x + 25.115
R² = 0.9986
17.000
17.500
18.000
18.500
19.000
19.500
5 6 7 8
VM
A
% BINDER

Appendix
145
Marshall Test Results of DBM Mixes
a) C-dbm
y = -3864.5x2 + 39313x - 85931
R² = 0.9939
9000.00
10000.00
11000.00
12000.00
13000.00
14000.00
15000.00
4 4.5 5 5.5 6 6.5
Sta
bil
ity
(N
)
% Binder
y = 0.6507x2 - 9.7248x + 38.336
R² = 0.9924
3.00
4.00
5.00
6.00
7.00
8.00
9.00
10.00
4 4.5 5 5.5 6 6.5
% A
IR V
OID
% Binder
y = -0.0171x2 + 0.2169x +
1.7641
R² = 0.9771
2.38
2.40
2.42
2.44
2.46
2.48
2.50
4.5 5.5 6.5
Bu
lk S
pec
ific
Gra
vit
y
(gm
/cc)
% BINDER
y = -0.1x2 + 1.79x - 3.43
R² = 0.9975
2
2.5
3
3.5
4
4.5
5
5.5
6
4.5 5 5.5 6 6.5
Flo
w v
alu
e (m
m)
% BINDER
y = -2.1902x2 + 38.2x - 69.704
R² = 0.9933
40.00
50.00
60.00
70.00
80.00
90.00
3.5 4.5 5.5 6.5
VF
B
% BINDER
y = 0.4765x2 - 5.4831x + 33.322
R² = 0.9141
17.00
17.50
18.00
18.50
19.00
19.50
4 5 6 7
VM
A
% BINDER

Appendix
146
b) 25K-dbm
y = -5108.4x2 + 52684x -
125106
R² = 0.9931
4000.00
5000.00
6000.00
7000.00
8000.00
9000.00
10000.00
11000.00
12000.00
4 4.5 5 5.5 6 6.5
Sta
bil
ity
(N
)
% Binder
y = 1.1241x2 - 13.001x + 41.473
R² = 0.9986
3.00
4.00
5.00
6.00
7.00
8.00
4 4.5 5 5.5 6 6.5
% A
IR V
OID
% Binder
y = -0.0287x2 + 0.2953x + 1.6993
R² = 0.9919
2.410
2.430
2.450
2.470
4 5 6
Bu
lk S
pec
ific
Gra
vit
y
(gm
/cc)
% BINDER
y = 0.0714x2 + 0.1957x - 0.16
R² = 0.9989
2
2.5
3
3.5
4
4.5 5 5.5 6 6.5
Flo
w v
alu
e (m
m)
% BINDER
y = -5.7017x2 + 68.259x - 125.99
R² = 0.9991
55.00
60.00
65.00
70.00
75.00
80.00
4 5 6 7
VF
B
% BINDER
y = 1.0288x2 - 9.5559x + 38.524
R² = 0.9927
16.00
16.50
17.00
17.50
18.00
18.50
4 5 6 7
VM
A
% BINDER

Appendix
147
c) 50K-dbm
y = -5677.8x2 + 57974x -
136946
R² = 0.9985
4100.00
5100.00
6100.00
7100.00
8100.00
9100.00
10100.00
11100.00
12100.00
4 4.5 5 5.5 6 6.5
Sta
bil
ity
(N
)
% Binder
y = 1.2089x2 - 13.821x + 43.413
R² = 0.9991
0.00
2.00
4.00
6.00
8.00
10.00
4 4.5 5 5.5 6 6.5
% A
IR V
OID
% Binder
y = -0.0324x2 + 0.3337x +
1.6073
R² = 0.9926
2.412
2.432
2.452
4 4.5 5 5.5 6 6.5
Bu
lk S
pec
ific
Gra
vit
y
(gm
/cc)
% BINDER
y = -0.1286x2 + 2.2557x - 4.59
R² = 0.9978
2
2.5
3
3.5
4
4.5
5
5.5
6
4.5 5 5.5 6 6.5
Flo
w v
alu
e (m
m)
% BINDER
y = -5.9263x2 + 70.418x - 131.06
R² = 1
55.00
60.00
65.00
70.00
75.00
80.00
4 4.5 5 5.5 6
VF
B
% BINDER
y = 0.9999x2 - 9.3795x + 38.442
R² = 0.9979
16.000
16.500
17.000
17.500
18.000
18.500
4 5 6 7
VM
A
% BINDER

Appendix
148
d) 75K-dbm
y = -2372.6x2 + 26066x -
61716
R² = 0.9822
5000.00
6000.00
7000.00
8000.00
9000.00
10000.00
11000.00
4 4.5 5 5.5 6 6.5
Sta
bil
ity
(N
)
% Binder
y = 0.4792x2 - 5.9842x + 22.644
R² = 0.9952
3.00
3.50
4.00
4.50
5.00
5.50
6.00
6.50
7.00
4 4.5 5 5.5 6 6.5
% A
IR V
OID
% Binder
y = -0.0119x2 + 0.1106x +
2.1984
R² = 0.957
2.430
2.450
2.470
4 5 6
Bu
lk S
pec
ific
Gra
vit
y
(gm
/cc)
% BINDER
y = 0.0571x2 + 0.1686x + 1.53
R² = 0.9955
3.5
3.7
3.9
4.1
4.3
4.5
4.7
4.9
4.5 5 5.5 6 6.5
Flo
w v
alu
e (m
m)
% BINDER
y = -2.8333x2 + 37.415x - 44.478
R² = 0.9981
51.00
56.00
61.00
66.00
71.00
76.00
81.00
4 5 6 7
VF
B
% BINDER
y = 0.3554x2 - 2.4311x + 19.899
R² = 0.9965
15.500
16.000
16.500
17.000
17.500
18.000
18.500
4 5 6 7
VM
A
% BINDER

Appendix
149
e) 100K-dbm
y = -2345.5x2 + 22628x -
45359
R² = 0.9949
4100.00
5100.00
6100.00
7100.00
8100.00
9100.00
10100.00
4 4.5 5 5.5 6 6.5
Sta
bil
ity
(N
)
% Binder
y = 0.5529x2 - 7.776x + 30.142
R² = 0.9959
0.00
2.00
4.00
6.00
8.00
10.00
4 4.5 5 5.5 6 6.5
% A
IR V
OID
% Binder
y = -0.0142x2 + 0.1625x +
1.9867
R² = 0.9735
2.390
2.410
2.430
2.450
4 5 6
Bu
lk S
pec
ific
Gra
vit
y
(gm
/cc)
% BINDER
y = 0.2286x2 - 1.6057x + 6.08
R² = 0.9907
2
2.5
3
3.5
4
4.5
5
5.5
6
4.5 5 5.5 6 6.5
Flo
w v
alu
e (m
m)
% BINDER
y = -2.517x2 + 38.417x - 59.173
R² = 0.9967
52.00
57.00
62.00
67.00
72.00
77.00
82.00
3.5 4.5 5.5 6.5
VF
B
% BINDER
y = 0.4964x2 - 4.8283x + 28.626
R² = 0.9102
16.80016.90017.00017.10017.20017.30017.40017.500
17.60017.700
3.5 4.5 5.5 6.5
VM
A
% BINDER

Appendix
150
Marshall Test Results of OGFC mixes
a) C-ogfc
y = -1197.5x2 + 12567x - 29130
R² = 0.9961
1800.00
2300.00
2800.00
3300.00
3800.00
4300.00
4.5 5 5.5 6 6.5
Sta
bil
ity
(N
)
% Binder
y = 2.8658x2 - 38.592x + 148.86
R² = 0.9914
0.00
5.00
10.00
15.00
20.00
25.00
30.00
35.00
4.5 5 5.5 6 6.5
% A
ir V
oid
s
% Binder
y = -0.0761x2 + 0.995x - 1.1799
R² = 0.9891
1.70
1.75
1.80
1.85
1.90
1.95
2.00
2.05
2.10
4.5 5 5.5 6 6.5Bu
lk S
pec
ific
gra
vit
y (
gm
/cc)
% BINDER

Appendix
151
b) 25K-ogfc
y = -532.23x2 + 5807.9x - 12225
R² = 0.9939
3000.00
3100.00
3200.00
3300.00
3400.00
3500.00
3600.00
3700.00
4.5 5 5.5 6 6.5
Sta
bil
ity
(N
% Binder
y = 2.5615x2 - 31.592x + 116.89
R² = 0.9829
15.00
17.00
19.00
21.00
23.00
25.00
27.00
29.00
4.5 5 5.5 6 6.5
% A
ir V
oid
s
% Binder
y = -0.0657x2 + 0.7847x - 0.3092
R² = 0.9715
1.70
1.75
1.80
1.85
1.90
1.95
2.00
2.05
2.10
4.5 5 5.5 6 6.5Bu
lk S
pec
ific
gra
vit
y (
gm
/cc)
% Binder

Appendix
152
c) 50K-ogfc
y = -322.66x2 + 3248.9x - 4657
R² = 0.9911
2700.00
2800.00
2900.00
3000.00
3100.00
3200.00
3300.00
3400.00
3500.00
3600.00
4.5 5 5.5 6 6.5
Sta
bil
ity
(N
)
% Binder
y = 2.7135x2 - 34.126x + 125.21
R² = 0.9948
17.0018.0019.0020.0021.0022.0023.0024.0025.0026.0027.0028.00
4.5 5 5.5 6 6.5
% A
ir V
oid
s
% Binder
y = -0.0711x2 + 0.8663x - 0.5335
R² = 0.9918
1.800
1.850
1.900
1.950
2.000
2.050
2.100
2.150
4.5 5 5.5 6 6.5Bu
lk S
pec
ific
gra
vit
y (
gm
/cc)
% Binder

Appendix
153
d) 75K-ogfc
y = -508.94x2 + 5251.4x - 10292
R² = 0.9977
2200.00
2400.00
2600.00
2800.00
3000.00
3200.00
3400.00
4.5 5 5.5 6 6.5
Sta
bil
ity
(N
)
%BINDER
y = 1.6417x2 - 20.148x + 80.891
R² = 0.9961
10.00
12.00
14.00
16.00
18.00
20.00
22.00
24.00
26.00
4.5 5 5.5 6 6.5
% A
ir V
oid
s
%BINDER
y = -0.0426x2 + 0.4965x + 0.6364
R² = 0.9894
2.000
2.010
2.020
2.030
2.040
2.050
2.060
2.070
2.080
2.090
4.5 5 5.5 6 6.5Bu
lk S
pec
ific
gra
vit
y (
gm
/cc
%BINDER

Appendix
154
e) 100K-ogfc
y = -1473.1x2 + 14260x - 31219
R² = 0.9914
750.00
1250.00
1750.00
2250.00
2750.00
3250.00
3750.00
3.5 4 4.5 5 5.5 6
Sta
bil
ity
(N
% Binder
y = -0.0267x2 + 0.2619x + 1.5375
R² = 0.9989
2.12
2.13
2.14
2.15
2.16
2.17
2.18
2.19
3.5 4 4.5 5 5.5 6 6.5Bu
lk S
pec
ific
gra
vit
y (
gm
/cc
% Binder
y = 1.718x2 - 18.388x + 68.803
R² = 0.9992
18.00
19.00
20.00
21.00
22.00
23.00
24.00
25.00
26.00
3 3.5 4 4.5 5 5.5 6
% A
ir V
oid
s
% Binder

Curriculum Vitae of Author
155
To pursue higher research, which can help me to develop an expertise in my area of
interest and provide a platform to serve society and country.
Class/Qualification University
/
Board
Institute/ School Year CGPA/
%
Ph.D.
(Transportation
Engineering)
Deemed
University
Malaviya National
Institute of Technology,
Jaipur(Rajasthan)
2014-
present
7.5
M. TECH. (Water
Resource
Engineering)
Deemed
University
Malaviya National
Institute of Technology,
Jaipur(Rajasthan)
2012-
2014
7.68
B. TECH. BBDNITM,
Lucknow
Gautam Buddh Technical
University, Lucknow
2007-
2011
65.96
XII Std. A.I.S.S.C.E St. Gabriel’s Academy
Roorkee
2007 67
X Std. A.I.S.S.E St. Gabriel’s Academy
Roorkee
2004 62.4
Curriculum Vitae of Author
Email: [email protected] , [email protected]
Mobile:8107608807
Permanent Address: MIG 503 Ganga Vihar Colony Avas Vikas Roorkee-
247667 ; Correspondence Address: Civil Engineering Department, MNIT
Jaipur-302017
Birth Date: 29-04-1988
Name: Pradeep Kumar Gautam
Gender- Male
OBJECTIVE
EDUCATION

Curriculum Vitae of Author
156
Designing and testing of hot mix asphalt.
SEM Analysis of hot mix asphalt.
Dynamic creep and resilient modulus examination of hot mix asphalt. MS Office (MS
Word, Excel, Power point).
Auto CAD.
Basic Knowledge of Storm water management model.
A 45 days summer training at “Construction of school building at Deoband, district
Saharanpur.” M.Tech dissertation on “Modeling to manage urban storm- A case study
of MNIT campus.” B.Tech project on “Suggesting alternative route between Zarib
Chowki to Mandhana.”
SCI index
[1] P.K. Gautam, P. Kalla, A.S. Jethoo, R. Agrawal, H. S. Chauhan, Sustainable
use of waste in flexible pavement: A review, accepted (in print) in
Construction and Building Material. Date of acceptance: 9-04-2018 (impact
factor 3.169)
[2] P.K. Gautam, P. Kalla, R. Nagar, R. Agrawal, A.S. Jethoo, Laboratory
investigations on hot mix asphalt containing mining waste as aggregates,
Constr. Build. Mater. 168 (2018) 143– 152. doi:10.1016/j.conbuildmat.
2018.02.115. (impact factor 3.169)
[3] P.K. Gautam, P. Kalla, R. Nagar, A.S. Jethoo, Laboratory investigation on use
of quarry waste in open graded friction course, J. Resource Policy. (2018) 0–
1. doi:10.1016/j.resourpol.2018.02.009. (impact factor 2.618)
TECHNICAL SKILLS
TRAINING AND PROJECT WORK
PUBLICATIONS
Curriculum Vitae of Author
157
Peer Reviewed International Journals and Conferences
[1] P.Gautam, P.Kalla, A.S. Jethoo, Use of quarry waste as building material: A
review at International Conference on Science, Innovation and Management,
London, U.K. 7-8th June 2018.
[2] P. Gautam, P. Patidar, P. Kalla, A. S. Jethoo, H. S.C., Use of Kota stone cutting
and quarry waste as sub-base material, Interdiscip. Environ. Rev. 18 (2017)
93–100.
[3] P.K. Gautam, P. Kalla, A.S. Jethoo, R. Agarwal, S. Alaria, H. S.C., Evaluation
of use of Kota Stone Mining Waste as Fine Aggregate in Bituminous Courses
., Int. J. Eng. Technol. Manag. Appl. Sci. 5 (2017) 834–838. (Impact factor
2.24)
[4] S.C. Harshwardhan, P. Kalla, R. Nagar, P.K. Gautam, Partial Replacement of
Cement by Kota Stone Slurry in Mortar, STM Journals. 7 (2017) 8–13.
[5] Vyas, N.K. Gupta, S.K. Gupta, P. Gautam, a. S. Jethoo, Mini/Micro Hydel
Power System Design and its Implementation in Rajasthan, Aquat. Procedia.
4 (2015) 1537–1544. doi:10.1016/j.aqpro.2015.02.199.
[6] P.K. Gautam, A.S. Jethoo, S. Shrivastava, S.K. Gupta, Sustainability In Civil
Construction and The Role of Civil Engineers, Int. J. Eng. Technol. Manag.
Appl. Sci. 3 (2015) 2013–2015. (impact factor 2.24)
[7] S.K. Gupta, A.S. Jethoo, J. Tyagi, N.K. Gupta, P.K. Gautam, Application of
Hydrological Models in Water resources : A Review, Int. J. Comput. Math.
Sci.4(2015)94–100.
Peer Reviewed National Conferences
[1] P.K. Gautam, P. Kalla, A.S. Jethoo, S.C. Harshwardhan, Dimensional Stone
Waste Characterization in Rajasthan and Suggesting their possible Remedies,
Int. J. Emerg. Technol. 8 (2017)40–42.
Construction and Building Materials.
Journal of Rehabilitation in Civil Engineering
REVIEWER

Curriculum Vitae of Author
158
Highway Engineering.
Construction of Low-Cost Roads and use of alternative materials in Low and
heavy volume traffic roads.
Sustainable Materials and Construction
Water Resource Engineering.
Concrete Technology
Soil Mechanics
Environment Engineering
Hydraulics Engineering
Fluid Mechanics
PERT-CPM
Railway Engineering
Strength of Materials
Structure Engineering
Performance analysis of pavement containing waste materials.
Sustainable development.
Sustainable use of waste as construction and building materials.
Low cost building materials.
GIAN Course on “Building resilient and sustainable road structure” from 12-
23 Dec 2016 at IIT Madras.
National Conference on “Urban Environmental Management in India:
Problems and Prospects” held on 13-14th February 2017 at MNIT Jaipur.
One week short term course on “Mathematical Modeling, MATLAB
Programing and their application in engineering Sciences” held during January
19-23, 2015 at MNIT Jaipur.
International Conference on “Emerging Trends of Engineering, Science,
Management and its Application” held on March 01, 2015 at JNU, NewDelhi.
TEACHING INTEREST
RESEARCH INTEREST
SEMINARS/CONFERENCES/COURSES/WORKSHOP ATTENDED

Curriculum Vitae of Author
159
Second in T-shirt designing competition on occasion of National unity day
celebration event, 2017.
Secured third position in bodybuilding competition at Malaviya SportFest-
2012, 2017.
Member of Jodhana photography Association, Jodhpur, Rajasthan.
Organizing committee member in Co-NIT’s Meet held at MNIT Jaipur in
October2015
Organizing committee member for “Gainful utilization of mining waste”
summit, sponsored by Centre of Development of Stones, held at MNIT Jaipur.
Participated in other co-curricular activities as volunteer and as participants.
Drawing, Sketching.
Photography
Chalk carving
Weightlifting
EXTRA-CURRICULAR ACTIVITIES
HOBBIES


![Limestone, Chert, or Limestone? [2013225_fieldtrip]](https://static.fdocuments.net/doc/165x107/558421bfd8b42a86478b4731/limestone-chert-or-limestone-2013225fieldtrip.jpg)