GAIN FROM OUR PERSPECTIVE THIS FESTIVE … Advantage Fund 4 Birla Dividend Yield Plus 5 Birla Midcap...
44
ANYWAY YOU LOOK AT IT GAIN FROM OUR PERSPECTIVE THIS FESTIVE SEASON
Transcript of GAIN FROM OUR PERSPECTIVE THIS FESTIVE … Advantage Fund 4 Birla Dividend Yield Plus 5 Birla Midcap...

ANYWAY YOU LOOK AT IT
GAIN FROM OUR PERSPECTIVETHIS FESTIVE SEASON

NAV & Contents 2
Market Outlook 3
Birla Advantage Fund 4
Birla Dividend Yield Plus 5
Birla Midcap Fund 6
Birla MNC Fund 7
Birla IndiaOpportunities Fund 8
Birla India GenNext Fund 9
Birla Index Fund 10
Birla Equity Plan 11
Birla Top 100 Fund 12
Birla Sun Life Buy India Fund 13
Birla Sun Life New Millennium Fund 13
Birla Sun Life Basic Industries Fund 14
Birla Sun Life Frontline Equity Fund 15
Birla Sun Life Equity Fund 16
Birla Sun Life Tax Relief '96 17
Birla Balance 18
Birla Sun Life '95 Fund 19
Birla MIP 20
Birla MIP II 21 - 22
Birla Sun Life Monthly Income 23
Birla Income Plus 24
Birla Sun Life Income Fund 25
Birla Gilt Plus 26
Birla Sun Life Gilt - Long Term Plan 27
Birla Sun Life Gilt - Short Term Plan 27
Birla Dynamic Bond Fund 28
Birla Bond Index Fund 28
Birla Bond Plus 29
Birla Sun Life Short Term Fund 30
Birla Floating Rate Fund 31
Birla Cash Plus 32
Birla Sun Life Cash Manager 33
Birla Asset Allocation Fund 34
India Advantage Fund 35
Methodology of Ranking 36
Load Structure 37
Dividend History 38 - 39
Performance 40 - 41
Contact Details 44
CONTENTSNAV as on October 31, 2005
Payment /Growth 21.9246Quaterly Dividend 10.5816
BIRLA DYNAMIC BOND FUNDRetail Plan (Growth) 10.5696Retail Plan (Quarterly Dividend) 10.4929
BIRLA BOND INDEX FUNDDividend 10.3496Growth 10.9844
BIRLA GILT PLUS - Liquid PlanDiv.-Payout/Reinvest 10.6590Growth 16.7590Annual Dividend 11.1599PF Plan Div.-Payout/Reinvest 10.8101Growth 19.5672Annual Dividend 19.5678Regular PlanDiv.-Payout/Reinvest 11.2082Growth 21.6429Annual Dividend 21.6758
BIRLA SUN LIFE GSF-Short Term PlanDividend 10.1572Growth 14.6911
BIRLA SUN LIFE GSF-Long Term Plan Dividend 10.3333Growth 18.8138
BIRLA INCOME PLUSDividend 10.2157Growth 28.6231
BIRLA SUN LIFE INCOME FUNDRegular Dividend 10.4324Regular Growth 23.7058Quarterly Dividend 10.184454EA Dividend 10.438754EA Growth 23.689154EB Dividend 10.449954EB Growth 23.5400
BIRLA BOND PLUSRetail Dividend 11.2141Retail Growth 12.7212Institutional Dividend 10.4701Institutional Growth 12.8038
BIRLA SUN LIFE SHORT TERM FUND Dividend 10.0416Growth 12.1639
BIRLA FLOATING RATE FUND - Short TermDividend 10.3761Growth 11.2557Daily Dividend 10.0015
Institutional Plan-Daily Dividend 10.0086
Institutional Plan-Growth 10.0157
Institutional Plan-Weekend Dividend 10.0092
BIRLA FLOATING RATE FUND - Long Term Dividend 10.3687Growth 11.3055
BIRLA CASH PLUSRetail Dividend 16.3693Retail Growth 18.3949Institutional Dividend 10.8023Institutional Plan - Weekly Dividend Option 10.8117Institutional Plan - Fortnightly Dividend Option 10.8261Institutional Growth 18.4975Institutional Premium Plan - Dividend 10.0195Institutional Premium Plan - Weekly Div. Option 10.0272Institutional Premium Plan - Fortnightly Dividend Option 10.0632Institutional Premium Plan - Monthly Dividend 10.0000Institutional Premium Plan - Growth 10.8327
BIRLA SUN LIFE CASH MANAGER Institutional Daily Dividend 10.0020Retail Growth 16.8117Institutional Growth 11.3830Retail Weekly Dividend 10.0095Instittutional Weekly Dividend 10.0097
BIRLA ADVANTAGE FUNDDividend 60.55
Growth 78.44
BIRLA DIVIDEND YIELD PLUSDividend 11.26 Growth 32.55
BIRLA MNC FUNDDividend 41.15 Growth 82.05
BIRLA INDEX FUNDDividend 13.4727 Growth 24.3580
BIRLA INDIA OPPORTUNITIES FUNDDividend 14.08 Growth 32.80
BIRLA INDIA GENNEXT FUNDDividend 10.35 Growth 10.35
BIRLA MIDCAP FUNDDividend 18.03 Growth 39.78
BIRLA EQUITY PLAN 42.51
BIRLA TOP 100 FUND
Dividend 9.6531Growth 9.6537
BIRLA SUN LIFE TAX RELIEF ‘96 150.20
BIRLA SUN LIFE EQUITY FUND Dividend 48.95 Growth 106.09
BIRLA SUN LIFE NEW MILLENIUM FUND Dividend 11.68 Growth 11.68
BIRLA SUN LIFE BUY INDIA FUND Dividend 19.16Growth 19.16
BIRLA SUN LIFE BASIC INDUSTRIES FUND Dividend 31.39 Growth 43.57
BIRLA SUN LIFE FRONTLINE EQUITY FUND Dividend 23.16 Growth 29.60
BIRLA SUN LIFE ‘95 FUND Dividend 58.36 Growth 121.89
BIRLA BALANCEDiv. - Payout/Reinvest 17.74 Growth 20.05
BIRLA ASSET ALLOCATION FUND - Aggressive PlanDividend 13.8086Growth 13.8096
BIRLA ASSET ALLOCATION FUND - Conservative PlanDividend 11.7560Growth 11.7556
BIRLA ASSET ALLOCATION FUND - Moderate PlanDividend 12.9502Growth 12.9499
BIRLA MIPMonthly Dividend 10.7670Monthly Payment 17.0453Monthly Growth 17.0453
BIRLA MIP II - SAVINGS 5Monthly Dividend 10.1517Monthly Growth 10.6901Monthly Payment 10.6901
BIRLA MIP II - WEALTH 25Monthly Dividend 10.6021Monthly Growth 11.5847Monthly Payment 11.5847
BIRLA SUN LIFE MONTHLY INCOME Dividend 10.4810
Market Outlook
3
Market Outlook
3
Equity Markets
The second quarter corporate results largely exceeded expectations and confirmed the buoyancy in industrial and services growth. Healthy sales and profit growth across sectors reaffirmed the growth potential of the economy.
Consumption plays such as automobiles, FMCG and telecom returned stellar numbers. Two wheeler sales continue to do well as more and more Indians get to own their first motorized transport. Commercial vehicles demand was healthy but was a bit dampened by the excessive rains in some parts of the country.
The broad recovery in the economy has finally seen FMCG companies post good results with both volume and pricing gains finally setting in. Cellular services continue to attract subscribers at a healthy rate. The world’s leading cellular services operator - Vodafone, took a minority equity stake of 10% in Bharti Televentures, the country’s leading cellular services company.
IT companies once again had a splendid quarter with the leading companies reporting good results. Having achieved scale in operations, many of these IT companies are now poised to be significant forces at the global level. Banking companies continued to report good earnings backed by strong credit demand. Most of the MNC pharma companies capitalized on the restructuring initiatives undertaken over the last few years and reported above average growth. Agrochemical companies posted good results with companies benefiting from a good monsoon in turn leading to a robust demand for agri inputs.
The commodities and Indian pharmaceutical companies were the only ones whose results disappointed. While cement companies reeled under increase of input costs, the steel companies were hit by a global price erosion of their products. Domestic pharmaceutical companies reported lackluster results as price erosion in global markets took toll on their operating margins.
The recent correction in the markets again affords long-term investors with an opportunity to buy into the India growth story. The latest SEBI announcements regarding the number of FII’s getting registered in the last quarter reconfirm that the interest of international investors is ever rising and that India is the destination of choice for investors looking at growth and value. The emergence of strong domestic retail inflows into mutual fund offerings is a step in the right direction. With rising income levels more and more Indians are willing to invest for the long term in the equity markets and the traditionally low share of equities in the overall household savings pie is set to change. Over a period of time, household savings have the potential to negate the volatile impact of FII fund flows and will lend stability to the markets. Good stock picking based on thorough fundamental research will continue to dictate portfolio outperformance. For individual investors, approaching equity investments via the mutual fund route would ensure professional expertise at low transaction costs.
Debt Market
In October, bonds changed early course and regained initial losses as uncertainty over the policy review abated. The yield on the actively traded 7.37% GOI 2014 bond firmed up to 7.08% before slipping to 6.97%, 8 basis points (bps) down from the previous month's close of 7.05%. The yield on the less liquid 10-year
benchmark 7.38% GOI 2015 bond eased marginally by a basis point to 7.09%, off an intra-month high of 7.18%.
Early in the month, yields rose as players focused on the increasing probability that the Reserve Bank of India (RBI) would hike interest rates at its policy review on October 25, due to the strong economic growth and inflationary pressures. Also concerns over current account deficit, prospects of higher US yields and firm global oil prices added to market ambiguities. But the RBI's unexpected move to cancel the Rs.4,000 crore auction caught players completely by surprise and sparked a small rally. However skepticism over interest rate decision, weak rupee and falling stock market caused some jitters and kept the market in check ahead of the policy review. The Mid-term review of RBI's monetary policy was largely in line with expectations and underlined the robust economic fundamentals. Even as the repo rate hike induced some ambiguities, lack of any negative surprises in the policy review sparked a good rally as the reverse repo rate hike had been priced in. The heartening remark of the RBI Governor Y.V. Reddy that rates could ease if the inflation mandate is achieved gave a further boost and propelled buying once again. However wariness ahead of the twin auctions worth Rs. 8,000 crore and rising inflation rate induced traders to cash in some of their post-policy gains.
During the first week of October, the RBI rejected all bids at the Rs. 6,000 crore auction of the 11.83% 2014 and set at a lower cut-off price of Rs 97.00 at the Rs. 4,000 crore auction of the 7.40% 2035. The central bank cancelled the Rs.4,000 crore issuance scheduled between Oct 18-25.
The widely anticipated Mid-Term Review Credit Policy focused on price stability, growth and managing inflation. The Bank rate and the CRR rate were unchanged. The reverse repo rate was raised by 25 bps to 5.25% and spread between repo and reverse repo was maintained at 100 bps. The growth forecast has been raised to 7.0-7.5% from around 7.0% for FY 2005-06 while the inflation target maintained at 5.0-5.5%, but the RBI cautioned that the pass-through of the impact of global oil prices has not yet been completed. The central bank announced the introduction of intra-day short selling in government bonds and extension of the NDS Order Matching (NDS-OM) module to all insurance firms. As the rate hike was fully discounted, bond markets reacted positively.
The inflation rate sustained its upward movement and rose to 4.71% on an annual basis in the week ending Oct. 15 due to a rise in food, manufactured products and mineral prices. Going ahead, with no favorable base effect, the rate is likely to inch up further and the recent RBI's rate decision was timely in this regard. The Brent crude oil prices eased to $58.77 from $60.85 per barrel previously.
Liquidity remained comfortable but festival demand and excess covering in anticipation of a rate hike sustained some pressure. The average daily reverse repo subscription stood around Rs. 18,700 crore. Call rates realigned to the new reverse repo rate and rose to 5.20-5.35%. We expect liquidity to tighten in the coming month.
Going forward, with the uncertainty over interest rates out of the way, domestic inflation, rupee and global interest rates will be key factors for determining the course of the market.
N O V E M B E R 2 0 0 5

Systematic Investment Plan (SIP)
SIP is a powerful tool that can help you create wealth over time. If you had invested* in BAF...Monthly Investment 1,000
Number of Investment periods (Since Inception) 128
Total Investment 128,000
Value of Investment (As of October 31, 2005) 601,183
Return on Investment (CAGR) 27.07%
* Load has not been taken into consideration. Past performance may or may not be sustained in future. In the same period, a SIP in BSE Sensex would have given a return of 12.81%
* Dividend Reinvestment NAVs has been considered for the analysis.
Date of First Installment: March 01, 1995
Birla Advantage FundAn open-ended diversified equity fund
Issuer Market Value % to Net AssetsRs. in Lacs
Software 6720.71 15.25
Tata Consultancy Services Ltd. 2057.00 4.67
Infosys Technologies Ltd. 1971.44 4.47
Satyam Computer Services Ltd. 1679.64 3.81
I-Flex Solutions Ltd. 1012.63 2.30
Banks 5711.97 12.96
State Bank of India 3541.61 8.03
Syndicate Bank 999.35 2.27
Canara Bank 892.94 2.03
Oriental Bank of Commerce 278.08 0.63
Pharmaceuticals 5282.39 11.98
Pfizer Ltd. 1936.00 4.39
Glaxosmithkline Pharmaceuticals Ltd. 1431.43 3.25
Novartis India Ltd. 1024.46 2.32
Aventis Pharma Ltd. 890.51 2.02
Consumer Non Durables 5006.99 11.36
Mcdowell & Company Ltd. 2179.90 4.95
I T C Ltd. 1998.78 4.53
Hindustan Lever Ltd. 828.30 1.88
Industrial Capital Goods 3320.87 7.53
Larsen & Toubro Ltd. 1677.88 3.81
Siemens Ltd. 1642.98 3.73
Telecom-Services 3176.77 7.21
Bharti Tele-Ventures Ltd. 3176.77 7.21
Auto 3006.67 6.82
Hero Honda Motors Ltd. 2356.99 5.35
Bajaj Auto Ltd. 649.68 1.47
Pesticides 2760.62 6.26
United Phosphorous Ltd. 2066.45 4.69
Rallis India Ltd. 694.16 1.57
Hotels 1995.49 4.53
Indian Hotels Co. Ltd. 1995.49 4.53
Chemicals 1919.05 4.35
Indian Petrochemicals Corporation Ltd. 1919.05 4.35
Finance 1750.08 3.97
LIC Housing Finance Ltd. 968.66 2.20
Housing Development Finance Corp. Ltd. 781.42 1.77
Hardware 1023.57 2.32
CMC Ltd. 1023.57 2.32
Petroleum Products 924.21 2.10
Reliance Industries Ltd. 924.21 2.10
Cement 10.47 0.02
Dharti Dredging & Construction Ltd. 10.47 0.02
Cash & Current Assets 1469.00 3.33
Net Assets 44078.85 100.00
Issuer Wise Portfolio as of 31-October-2005
Fund Manager's Speak - Birla Advantage Fund (BAF)
Nishid Shah
4
! Raised cash levels.
! Realignment of exposure in banks & consumer non-durables.
! Increased exposure to auto (two-wheelers) and software services sectors.
! Portfolio continues to be well diversified across banks, consumer non-durables, software, pharmaceuticals, telecom, pesticides & automobile.
^^ for methodology please refer page 36
Asset Allocation 31-October-2005
0.02%
2.10%
2.32%
3.33%
3.97%
4.35%
4.53%
6.26%
6.82%
7.21%
7.53%
11.36%
11.98%
12.96%
15.25%
0.00% 2.00% 4.00% 6.00% 8.00% 10.00% 12.00% 14.00% 16.00% 18.00%
Other Equity & Preference
Petroleum Products
Hardware
Cash & Current Assets
Finance
Chemicals
Hotels
Pesticides
Auto
Telecom-Services
Industrial Capital Goods
Consumer Non Durables
Pharmaceuticals
Banks
Software
N O V E M B E R 2 0 0 5

Systematic Investment Plan (SIP)
SIP is a powerful tool that can help you create wealth over time. If you had invested* in BDYP...
Monthly Investment 1,000
Number of Investment periods (Since Inception) 32
Total Investment 32,000
Value of Investment (As of October 31, 2005) 53,719
Return on Investment (CAGR) 42.00%
* Load has not been taken into consideration. Past performance may or may not be sustained in future. In the same period, a SIP in CNX 500 would have given a return of 36.82%
Date of First Installment: March 01, 2003
Birla Dividend Yield PlusAn open-ended growth scheme investing in high dividend yield companies
Issuer Market Value % to Net AssetsRs. in Lacs
Consumer Non Durables 9864.54 14.93Hindustan Lever Ltd. 2658.80 4.02Colgate Palmolive (I) Ltd. 2103.34 3.18Nestle India Ltd. 1945.03 2.94Procter & Gamble Hygiene & Health Care Ltd 1885.94 2.85Godrej Consumer Products Ltd. 1271.43 1.92
Banks 7710.49 11.67Vijaya Bank 2083.19 3.15Union Bank of India 1779.73 2.69Indian Overseas Bank 1658.38 2.51Andhra Bank 1513.88 2.29Syndicate Bank 675.31 1.02
Pharmaceuticals 6422.50 9.72Glaxosmithkline Pharmaceuticals Ltd. 2555.74 3.87Abbott India Ltd. 2192.29 3.32Wyeth Ltd. 1674.48 2.53
Petroleum Products 5668.91 8.58Indian Oil Corporation Ltd. 1755.56 2.66Castrol (India) Ltd. 1513.07 2.29Kochi Refineries Ltd. 1061.03 1.61Bongaigaon Refinery & Petrochemicals Ltd 670.32 1.01Hindustan Petroleum Corporation Ltd. 668.93 1.01
Auto 5224.79 7.91Hero Honda Motors Ltd. 4387.47 6.64Ashok Leyland Ltd. 837.32 1.27
Industrial Capital Goods 4848.60 7.34Alfa Laval (India) Ltd. 2401.61 3.63Crompton Greaves Ltd. 1522.12 2.30Thermax Ltd. 924.87 1.40
Software 3857.50 5.84HCL Technologies Ltd. 3857.50 5.84
Fertilisers 3838.34 5.81Tata Chemicals Ltd. 3641.44 5.51Rashtriya Chemicals & Fertilizers Ltd. 196.90 0.30
Industrial Products 3096.16 4.69Cummins India Ltd. 1849.29 2.80Essel Propack Ltd. 970.26 1.47Cosmo Films Ltd. 276.60 0.42
Ferrous Metals 2219.76 3.36Tata Steel Ltd 1666.09 2.52PSL Ltd. 553.67 0.84
Hardware 2023.00 3.06HCL Infosystems Ltd. 1839.27 2.78Tata Elxsi Ltd. 183.73 0.28
Gas 1976.55 2.99GAIL (India) Ltd. 1976.55 2.99
Oil 1756.27 2.66Oil & Natural Gas Corporation Ltd. 1756.27 2.66
Chemicals 1634.61 2.47Clariant (India) Ltd. 1228.08 1.86Finolex Industries Ltd. 406.53 0.62
Textiles-Synthetic 1464.69 2.22Century Enka Ltd. 1464.69 2.22
Transportation 1186.31 1.80Great Eastern Shipping Co. Ltd. 1186.31 1.80
Telecom-Services 1144.69 1.73Mahanagar Telephone Nigam Ltd. 1144.69 1.73
Auto Ancillaries 510.37 0.77Carborundum Universal Ltd. 510.37 0.77
Cash & Current Assets 1637.21 2.48
Net Assets 66085.29 100.00
Issuer Wise Portfolio as of 31-October-2005
5
Fund Manager's Speak - Birla Dividend Yield Plus (BDYP)
Nishid Shah
• Increased exposure to pharmaceuticals.
! Maintained over weight on FMCG and banks.
Asset Allocation 31-October-2005
Did you know that the Dividend Yield of the portfolio is 3.53% vis-a-vis the BSE Sensex Dividend Yield of 1.73%?
2.22%
2.47%
2.48%
2.66%
2.99%
3.06%
3.36%
4.30%
4.69%
5.81%
5.84%
7.34%
7.91%
8.58%
9.72%
11.67%
14.93%
0.00% 2.00% 4.00% 6.00% 8.00% 10.00% 12.00% 14.00% 16.00%
Textiles-SyntheticChemicals
Cash & Current Assets
Oil
Gas
Hardware
Ferrous Metals
Other Equity & Preference
Industrial Products
Fertilisers
Software
Industrial Capital GoodsAuto
Petroleum Products
Pharmaceuticals
Banks
Consumer Non Durables
N O V E M B E R 2 0 0 5

Systematic Investment Plan (SIP)
SIP is a powerful tool that can help you create wealth over time. If you had invested* in BMC...
Monthly Investment 1,000
Number of Investment periods (Since Inception) 36
Total Investment 36,000
Value of Investment (As of October 31, 2005) 74,001
Return on Investment (CAGR) 56.81%
* Load has not been taken into consideration. Past performance may or may not be sustained in future. In the same period, a SIP in CNX Midcap would have given a return of 49.26%
Date of First Installment: November 01, 2002
Birla Midcap FundAn open-ended growth scheme investing primarily in midcap stocks
Issuer Market Value % to Net AssetsRs. in Lacs
Banks 1436.60 11.49Syndicate Bank 590.17 4.72Oriental Bank of Commerce 425.29 3.40Jammu & Kashmir Bank Ltd. 243.93 1.95Federal Bank Ltd. 177.21 1.42
Software 1402.99 11.22Mastek Ltd. 506.02 4.05Nucleus Software Exports Ltd. 471.73 3.77Subex Systems Ltd. 307.20 2.46Hinduja TMT Ltd. 118.04 0.94
Consumer Non Durables 1283.88 10.27Mcdowell & Company Ltd. 732.26 5.86Kajaria Ceramics Ltd. 224.45 1.80Macmillan India Ltd. 142.46 1.14I T C Ltd. 129.92 1.04SPL Industries Ltd. 54.79 0.44
Pharmaceuticals 1252.34 10.02Pfizer Ltd. 414.94 3.32Wyeth Ltd. 388.82 3.11Aventis Pharma Ltd. 255.62 2.04Fulford (India) Ltd. 192.96 1.54
Industrial Products 1101.24 8.81Kirloskar Brothers Ltd 290.51 2.32Torrent Cables Ltd. 286.62 2.29Finolex Cables Ltd. 266.48 2.13Kirloskar Oil Engines Ltd. 257.64 2.06
Industrial Capital Goods 983.80 7.87Alstom Projects India Ltd. 452.35 3.62ABB Ltd. 226.44 1.81Thermax Ltd. 171.05 1.37Crompton Greaves Ltd. 133.96 1.07
Hardware 737.30 5.90Tata Elxsi Ltd. 497.30 3.98CMC Ltd. 240.00 1.92
Fertilisers 687.62 5.50Tata Chemicals Ltd. 516.11 4.13DCM Shriram Consolidated Ltd. 171.50 1.37
Finance 629.64 5.04LIC Housing Finance Ltd. 629.64 5.04
Pesticides 476.69 3.81Rallis India Ltd. 476.69 3.81
Construction 324.20 2.59Hindustan Construction Co. Ltd. 324.20 2.59
Transportation 317.68 2.54Gateway Distriparks Ltd. 317.68 2.54
Hotels 287.01 2.30Taj GVK Hotels & Resorts Ltd. 287.01 2.30Cement 254.15 2.03Birla Corporation Ltd. 254.15 2.03
Retailing 249.11 1.99Trent Ltd 167.81 1.34Trent Ltd. - Warrants 81.30 0.65
Consumer Durables 198.18 1.59Voltas Ltd. 198.18 1.59
Auto Ancillaries 128.36 1.03Automobile Corporation of Goa Ltd. 128.36 1.03
Ferrous Metals 111.75 0.89Kalyani Steel 111.75 0.89
Corporate Debt 55.22 0.44Trent Ltd 55.22 0.44
Cash & Current Assets 583.03 4.66
Net Assets 12500.78 100.00
Issuer Wise Portfolio as of 31-October-2005
6
Fund Manager's Speak - Birla Midcap Fund (BMC)
Nishid Shah! Increased exposure in capital goods to benefit from growing
capital spending and infrastructure investment.
! Portfolio is well diversified across banks, software, pharmaceuticals, consumer non-durables and capital goods.
! Overall portfolio remains attractive in terms of risk reward ratio.
Asset Allocation 31-October-2005
0.44%2.03%
2.30%2.54%
2.59%
3.81%4.66%
5.04%5.50%
5.50%5.90%
7.87%
8.81%10.02%
10.27%11.22%
11.49%
0.00% 2.00% 4.00% 6.00% 8.00% 10.00% 12.00% 14.00%
Corporate DebtCement
Hotels
TransportationConstruction
PesticidesCash & Current Assets
Finance
Other EquityFertilisers
Hardware
Industrial Capital GoodsIndustrial Products
Pharmaceuticals
Consumer Non Durables
SoftwareBanks
N O V E M B E R 2 0 0 5
^^ for methodology please refer page 36
Did you know that Birla Midcap Fund has been ranked “CPR-2” by CRISIL?For more details refer to page 38.
#**** -Value Research Rating- Birla Midcap Fund
(Past performance is no guarantee of future results.)
# for methodology please refer page 36
CRISIL~CPR 2 Open Ended Equity Category^^
(Past performance is no guarantee of future results.)

Systematic Investment Plan (SIP)
SIP is a powerful tool that can help you create wealth over time. If you had invested* in BMNC...
Monthly Investment 1,000
Number of Investment periods (Since takeover) 70
Total Investment 70,000
Value of Investment (As of October 31, 2005) 162,275
Return on Investment (CAGR) 28.90%
* Load has not been taken into consideration. Past performance may or may not be sustained in future. In the same period, a SIP in CNX MNC would have given a return of 14.08%
Date of First Installment: January 01, 2000
Birla MNC FundAn open-ended growth scheme investing in multinational companies
Issuer Market Value % to Net Rs. in Lacs
Consumer Non Durables 5296.77 27.74I T C Ltd. 1440.35 7.54Hindustan Lever Ltd. 1093.32 5.73Nestle India Ltd. 787.31 4.12Glaxo Smithkline Consumer Healthcare Ltd. 546.13 2.86Britannia Industries Ltd. 480.38 2.52Colgate Palmolive (I) Ltd. 474.88 2.49Procter & Gamble Hygiene & Health Care Ltd. 474.40 2.48
Pharmaceuticals 4248.06 22.25Pfizer Ltd. 1303.75 6.83Glaxosmithkline Pharmaceuticals Ltd. 1120.62 5.87Aventis Pharma Ltd. 1006.55 5.27Novartis India Ltd. 540.85 2.83Wyeth Ltd. 276.30 1.45
Industrial Capital Goods 2240.38 11.73Siemens Ltd. 1127.44 5.90ABB Ltd. 790.92 4.14Alstom Projects India Ltd. 322.02 1.69
Telecom-Services 1498.71 7.85Bharti Tele-Ventures Ltd. 1498.71 7.85
Auto 1367.77 7.16Hero Honda Motors Ltd. 1367.77 7.16
Industrial Products 1362.46 7.14BOC India Ltd. 883.21 4.63ESAB India Ltd. 307.67 1.61Vesuvius India Ltd. 171.58 0.90
Software 1284.04 6.72I-Flex Solutions Ltd. 1125.54 5.89Scandent Solutions Corporation Ltd. 158.50 0.83
Pesticides 800.70 4.19Monsanto India Ltd. 479.57 2.51Syngenta (India) Ltd. 321.13 1.68
Gas 185.25 0.97Gujarat Gas Co. Ltd. 185.25 0.97
Trading 93.92 0.493M India Ltd. 93.92 0.49
Chemicals 34.92 0.18Ciba Specialty Chemicals (India) Ltd. 34.92 0.18
Cash & Current Assets 681.03 3.57
Net Assets 19094.01 100.00
Issuer Wise Portfolio as of 31-October-2005
Fund Manager's Speak - Birla MNC Fund (BMNC)
Nishid Shah
! Portfolio spread across top class MNC companies having Strong Growth Potential.
! Overweight in Industrial/Capital Goods, Pharmaceuticals and FMCG.
Asset Allocation 31-October-2005
7
1.64%
3.57%
4.19%
6.72%
7.14%
7.16%
7.85%
11.73%
22.25%
27.74%
0.00% 5.00% 10.00% 15.00% 20.00% 25.00% 30.00%
Other Equity
Cash & Current Assets
Pesticides
Software
Industrial Products
Auto
Telecom-Services
Industrial Capital Goods
Pharmaceuticals
Consumer Non Durables
N O V E M B E R 2 0 0 5

Systematic Investment Plan (SIP)
SIP is a powerful tool that can help you create wealth over time. If you had invested* in BIOF...Monthly Investment 1,000
Number of Investment periods (Since takeover) 70
Total Investment 70,000
Value of Investment (As of October 31, 2005) 154,871
Return on Investment (CAGR) 28.17%
* Load has not been taken into consideration. Past performance may or may not be sustained in future. In the same period, a SIP in CNX 500 would have given a return of 25.82%
Date of First Installment: January 01, 2000
Birla India Opportunities FundAn open-ended equity fund that focuses on businessesemanating from India's competitive strengths
Issuer Market Value % to Net AssetsRs. in Lacs
Software 3562.14 38.83Infosys Technologies Ltd. 779.81 8.50Tata Consultancy Services Ltd. 556.08 6.06Mastek Ltd. 538.32 5.87Nucleus Software Exports Ltd. 519.71 5.66I-Flex Solutions Ltd. 413.41 4.51Satyam Computer Services Ltd. 412.18 4.49Subex Systems Ltd. 342.62 3.73
Industrial Capital Goods 1448.88 15.79Crompton Greaves Ltd. 524.13 5.71Thermax Ltd. 364.43 3.97Siemens Ltd. 322.32 3.51ABB Ltd. 238.00 2.59
Hardware 1135.80 12.38HCL Infosystems Ltd. 488.66 5.33CMC Ltd. 402.33 4.39Tata Elxsi Ltd. 244.82 2.67
Pharmaceuticals 1039.34 11.33Torrent Pharmaceuticals Ltd. 360.81 3.93Cipla Ltd. 251.93 2.75Aventis Pharma Ltd. 231.32 2.52IPCA Laboratories Ltd. 195.28 2.13
Pesticides 633.71 6.91United Phosphorous Ltd. 633.71 6.91
Auto Ancillaries 426.34 4.65Sundaram Fasteners Ltd. 426.34 4.65
Industrial Products 405.31 4.42Bharat Forge Ltd. 254.67 2.78Essel Propack Ltd. 148.30 1.62Bharat Forge Ltd. - Warrants 2.34 0.03
Consumer Non Durables 248.68 2.71Macmillan India Ltd. 166.42 1.81SPL Industries Ltd. 82.26 0.90
Textiles-Silk 90.25 0.98Himatsingka Seide Ltd. 90.25 0.98
Cash & Current Assets 184.03 2.01
Net Assets 9174.48 100.00
Issuer Wise Portfolio as of 31-October-2005
Fund Manager's Speak - Birla India Opportunities Fund (BIOF)
Nishid Shah
@ for methodology please refer page 36
@ICRA Online Awards 2005 : Ranked MFR1 in 'Open Ended Sectoral
Schemes - Technology' (3 year)
(Past performance is no guarantee of future results.)
8
Asset Allocation 31-October-2005
! Maintained overweight in software services where earnings and outlook continues to remain strong.
! Depreciation of rupee versus the US$ argues favorably for export oriented companies in the portfolio companies.
0.98%
2.01%
2.71%
4.42%
4.65%
6.91%
11.33%
12.38%
15.79%
38.83%
0.00% 5.00% 10.00% 15.00% 20.00% 25.00% 30.00% 35.00% 40.00% 45.00%
Other Equity
Cash & Current Assets
Consumer Non Durables
Industrial Products
Auto Ancillaries
Pesticides
Pharmaceuticals
Hardware
Industrial Capital Goods
Software
N O V E M B E R 2 0 0 5

Birla India GenNext FundAn open-ended growth scheme investing in companiesexpected to benefit from the rising consumption pattern in India.
Issuer Market Value % to Net AssetsRs. in Lacs
Consumer Non Durables 11227.13 25.95I T C Ltd. 2930.51 6.77Mcdowell & Company Ltd. 2901.85 6.71Hindustan Lever Ltd. 1153.04 2.67Nestle India Ltd. 1089.31 2.52Glaxo Smithkline Consumer Healthcare Ltd 923.67 2.14Heritage Foods (India) Ltd. 922.58 2.13Procter & Gamble Hygiene & Health Care Ltd 665.35 1.54Kajaria Ceramics Ltd. 640.81 1.48
Banks 7162.41 16.56State Bank of India 3492.99 8.07Syndicate Bank 2264.35 5.23Oriental Bank of Commerce 823.88 1.90Canara Bank 581.19 1.34
Pharmaceuticals 6461.03 14.94Wyeth Ltd. 1985.32 4.59Novartis India Ltd. 1590.03 3.68Pfizer Ltd. 1569.53 3.63Glaxosmithkline Pharmaceuticals Ltd. 1041.90 2.41Fulford (India) Ltd. 274.24 0.63
Hotels 4133.71 9.56Indian Hotels Co. Ltd. 2155.09 4.98Taj GVK Hotels & Resorts Ltd. 1406.17 3.25Asian Hotels Ltd. 572.45 1.32
Auto 3627.04 8.38Hero Honda Motors Ltd. 2902.33 6.71Bajaj Auto Ltd. 724.71 1.68
Telecom-Services 3453.65 7.98Bharti Tele-Ventures Ltd. 3453.65 7.98
Finance 2254.67 5.21LIC Housing Finance Ltd. 1349.31 3.12Housing Development Finance Corp. Ltd. 905.36 2.09
Hardware 1315.23 3.04HCL Infosystems Ltd. 1315.23 3.04
Retailing 838.47 1.94Trent Ltd 838.47 1.94
Industrial Products 262.31 0.61Finolex Cables Ltd. 262.31 0.61
Cash & Current Assets 2524.25 5.84
Net Assets 43259.88 100.00
Issuer Wise Portfolio as of 31-October-2005
Fund Manager's Speak - Birla India GenNext Fund (BIGNF)
Nishid Shah
9
! Overweight in non-cyclical FMCG and Pharmaceutical sectors.
! Holding in companies likely to benefit from changing lifestyles, increasing disposable income and growing number of middle-income class households.
Asset Allocation 31-October-2005
Did you know that investments through our Systematic Investment Plans (SIPs)have No Entry Load*?
* No entry load on applications where each installment valued less than/equal to Rs. 10 lacs. However, Exit Load equivalent to waived entry load will be charged if redeemed/switched out within 365 days from date of allotment.
2.54%
3.04%
5.21%
5.84%
7.98%
8.38%
9.56%
14.94%
16.56%
25.95%
0.00% 5.00% 10.00% 15.00% 20.00% 25.00% 30.00%
Other Equity
Hardware
Finance
Cash & Current Assets
Telecom-Services
Auto
Hotels
Pharmaceuticals
Banks
Consumer Non Durables
N O V E M B E R 2 0 0 5

Systematic Investment Plan (SIP)
SIP is a powerful tool that can help you create wealth over time. If you had invested* in BIF...Monthly Investment 1,000
Number of Investment periods (Since Inception) 37
Total Investment 37,000
Value of Investment (As of October 31, 2005) 58,552
Return on Investment (CAGR) 31.22%
* Load has not been taken into consideration. Past performance may or may not be sustained in future. In the same period, a SIP in S & P Nifty would have given a return of 31.46%
Date of First Installment: October 01, 2002
Birla Index FundAn open-ended index fund tracking the Nifty
Issuer Market Value % to Net AssetsRs. in Lacs
Software 55.82 10.96Infosys Technologies Ltd. 17.38 3.41Tata Consultancy Services Ltd. 17.08 3.35Wipro Ltd. 13.05 2.56Satyam Computer Services Ltd. 4.91 0.96HCL Technologies Ltd. 3.40 0.67
Oil 33.62 6.60Oil and Natural Gas Corporation Ltd. 33.62 6.60
Petroleum Products 32.33 6.35Reliance Industries Ltd. 26.97 5.30Bharat Petroleum Corporation Ltd. 2.80 0.55Hindustan Petroleum Corporation Ltd. 2.56 0.50
Banks 30.14 5.92State Bank of India 11.21 2.20ICICI Bank Ltd. 9.36 1.84HDFC Bank Ltd. 4.80 0.94Punjab National Bank 3.23 0.63Oriental Bank Of Commerce 1.54 0.30
Consumer Non Durables 22.68 4.45I T C Ltd. 11.41 2.24Hindustan Lever Ltd 8.99 1.76Dabur India Ltd. 1.21 0.24Tata Tea Ltd. 1.07 0.21Colgate Palmolive (I) Ltd. 0.00 0.00
Telecom-Services 19.21 3.77Bharti Tele-Ventures Ltd. 15.34 3.01Videsh Sanchar Nigam Ltd. 2.11 0.41Mahanagar Telephone Nigam Ltd. 1.76 0.34
Auto 18.45 3.62Bajaj Auto Ltd. 4.39 0.86Tata Motors Ltd. 4.33 0.85Maruti Udyog Ltd. 4.03 0.79Hero Honda Motors Ltd. 3.59 0.70Mahindra & Mahindra Ltd. 2.11 0.42
Industrial Capital Goods 13.52 2.65Bharat Heavy Electricals Ltd. 7.02 1.38Larsen & Toubro Ltd. 4.69 0.92ABB Ltd. 1.81 0.36
Pharmaceuticals 12.46 2.45Ranbaxy Laboratories Ltd. 3.32 0.65Sun Pharmaceutical Industries Ltd. 2.82 0.55Cipla Ltd. 2.74 0.54GlaxoSmithKline Pharmaceuticals Ltd. 2.01 0.39Dr. Reddys Laboratories Ltd. 1.57 0.31
Ferrous Metals 10.14 1.99Steel Authority of India Ltd. 5.37 1.05Tata Steel Limited 4.77 0.94
Cement 7.02 1.38Grasim Industries Ltd. 2.61 0.51Gujarat Ambuja Cements Ltd. 2.38 0.47The Associated Cement Companies Ltd. 2.02 0.40
Finance 6.12 1.20Housing Development Finance Corp. Ltd. 6.12 1.20
Non-Ferrous Metals 5.28 1.04Hindalco Industries Ltd. 2.70 0.53National Aluminium Company Ltd. 2.58 0.51
Gas 5.03 0.99GAIL India Ltd 5.03 0.99
Power 4.54 0.89Reliance Energy Ltd. 2.56 0.50Tata Power Co. Ltd. 1.98 0.39
Transportation 3.29 0.65Jet Airways (India) Ltd. 2.20 0.43Shipping Corporation of India Ltd. 1.08 0.21
Media & Entertainment 1.47 0.29Zee Telefilms Ltd. 1.47 0.29
Chemicals 1.37 0.27Indian Petrochemicals Corporation Ltd. 1.37 0.27
Fertilisers 1.04 0.21Tata Chemicals Ltd. 1.04 0.21
Cash & Current Assets 225.77 44.33
#Cash balance is held against outstanding long position in Nifty November Futures & Margin Money
Net Assets 509.30 100.00
Issuer Wise Portfolio as of 31-October-2005
Fund Manager's Speak - Birla Index Fund (BIF)
Navneet Munot
! Outlook for Equity market continues to remain positive considering strong domestic economy and corporate fundamentals.
10
Asset Allocation 31-October-2005
#Cash balance is held against outstanding long position in Nifty November Futures & Margin Money
2.45%
2.65%
3.62%
3.77%
4.45%
5.92%
6.35%
6.60%
8.90%
10.96%
44.33%
0.00% 5.00% 10.00% 15.00% 20.00% 25.00% 30.00% 35.00% 40.00% 45.00% 50.00%
Pharmaceuticals
Industrial Capital Goods
Auto
Telecom-Services
Consumer Non Durables
Banks
Petroleum Products
Oil
Other Equity
Software
Cash & Current Assets
N O V E M B E R 2 0 0 5

Systematic Investment Plan (SIP)
SIP is a powerful tool that can help you create wealth over time. If you had invested* in BEP...Monthly Investment 1,000
Number of Investment periods (Since Inception) 80
Total Investment 80,000
Value of Investment (As of October 31, 2005) 248,095
Return on Investment (CAGR) 33.70%
* Load has not been taken into consideration. Past performance may or may not be sustained in future. In the same period, a SIP in BSE Sensex would have given a return of 18.87%
**Dividend reinvestment NAVs have been considered for the analyses.
Date of First Installment: March 01,1999
Birla Equity PlanAn open-ended Equity Linked Savings Scheme with a lock-in for 3 years (ELSS)
Issuer Market Value % to Net AssetsRs. in Lacs
Consumer Non Durables 763.27 13.53Mcdowell & Company Ltd. 227.98 4.04I T C Ltd. 225.56 4.00Glaxo Smithkline Consumer Healthcare Ltd 190.84 3.38Nestle India Ltd. 118.88 2.11
Pharmaceuticals 734.02 13.01Glaxosmithkline Pharmaceuticals Ltd. 163.08 2.89Pfizer Ltd. 156.82 2.78Fulford (India) Ltd. 152.77 2.71Aventis Pharma Ltd. 139.59 2.47Novartis India Ltd. 121.77 2.16
Software 708.31 12.55Satyam Computer Services Ltd. 242.46 4.30Tata Consultancy Services Ltd. 210.04 3.72I-Flex Solutions Ltd. 133.36 2.36Nucleus Software Exports Ltd. 122.45 2.17
Banks 541.33 9.59State Bank of India 251.48 4.46Punjab National Bank 161.98 2.87Syndicate Bank 74.50 1.32Bank Of India 53.38 0.95
Hotels 511.00 9.06Taj GVK Hotels & Resorts Ltd. 339.82 6.02Asian Hotels Ltd. 111.64 1.98Oriental Hotels Ltd. 59.53 1.06
Pesticides 497.56 8.82United Phosphorous Ltd. 257.00 4.55Rallis India Ltd. 240.56 4.26
Hardware 288.40 5.11Tata Elxsi Ltd. 187.48 3.32CMC Ltd. 100.92 1.79
Auto 285.50 5.06Hero Honda Motors Ltd. 176.71 3.13Tata Motors Ltd. 108.79 1.93
Telecom-Services 258.12 4.57Bharti Tele-Ventures Ltd. 258.12 4.57
Auto Ancillaries 251.60 4.46Automobile Corporation of Goa Ltd. 136.84 2.43Sundaram Fasteners Ltd. 114.76 2.03
Industrial Capital Goods 240.77 4.27Siemens Ltd. 176.45 3.13Alstom Projects India Ltd. 64.32 1.14
Industrial Products 136.64 2.42Kirloskar Oil Engines Ltd. 136.64 2.42
Chemicals 86.70 1.54Indian Petrochemicals Corporation Ltd. 86.70 1.54
Finance 65.20 1.16Infrastructure Development Fin. Co. Ltd. 65.20 1.16
Textile Products 51.96 0.92Gokaldas Exports Ltd. 51.96 0.92
Cash & Current Assets 222.07 3.94
Net Assets 5642.43 100.00
Issuer Wise Portfolio as of 31-October-2005
Fund Manager's Speak - Birla Equity Plan (BEP)
Nishid Shah
! Volatility in the FX markets (rupee-dollar exchange rate) and its related impact on domestic interest rates an overbearing concern.
! Reduced exposure in banking and auto-ancillary sector, restructured software services holdings.
11
#**** -Value Research Rating- Birla Equity Plan
(Past performance is no guarantee of future results.)
# for methodology please refer page 36
Asset Allocation 31-October-2005
Did you know that BEP has declared a dividend* of 40% on October 21, 2005?
* Rs. 4 per unit on a face value of Rs. 10. Cum dividend NAV of Rs. 42.10 as on October 21, 2005. After payment of dividend, NAV will fall to the extent of payout.
2.42%
3.61%
3.94%
4.27%
4.46%
4.57%
5.06%
5.11%
8.82%
9.06%
9.59%
12.55%
13.01%
13.53%
0.00% 2.00% 4.00% 6.00% 8.00% 10.00% 12.00% 14.00% 16.00%
Industrial Products
Other Equity
Cash & Current Assets
Industrial Capital Goods
Auto Ancillaries
Telecom-Services
Auto
Hardware
Pesticides
Hotels
Banks
Software
Pharmaceuticals
Consumer Non Durables
N O V E M B E R 2 0 0 5

Birla Top 100 FundAn open-ended growth scheme seeking to invest primarily in the top 100 companies as defined by market capitalization
Issuer Market Value % to Net AssetsRs. in Lacs
Industrial Capital Goods 6535.54 11.11Larsen & Toubro Ltd. 2483.24 4.22Siemens Ltd. 1998.74 3.40Bharat Heavy Electricals Ltd. 1030.44 1.75Engineers India Ltd. 1023.12 1.74
Consumer Non Durables 5864.89 9.97Mcdowell & Company Ltd. 2050.86 3.49I T C Ltd. 1628.02 2.77Nestle India Ltd. 1216.56 2.07Hindustan Lever Ltd. 969.45 1.65
Banks 5807.19 9.87Oriental Bank of Commerce 2037.70 3.46State Bank of India 1906.18 3.24Syndicate Bank 1306.10 2.22Punjab National Bank 557.21 0.95
Software 5761.46 9.79Satyam Computer Services Ltd. 1795.42 3.05Tata Consultancy Services Ltd. 1449.26 2.46Infosys Technologies Ltd. 1370.48 2.33HCL Technologies Ltd. 1146.31 1.95
Auto 5173.05 8.79Hero Honda Motors Ltd. 3162.09 5.38Bajaj Auto Ltd. 2010.96 3.42
Finance 3700.81 6.29Housing Development Finance Corp. Ltd. 1977.27 3.36LIC Housing Finance Ltd. 1723.54 2.93
Hotels 3285.63 5.59Indian Hotels Co. Ltd. 1820.24 3.09Taj GVK Hotels & Resorts Ltd. 1465.40 2.49
Pharmaceuticals 3158.15 5.37Glaxosmithkline Pharmaceuticals Ltd. 1240.31 2.11Pfizer Ltd. 1164.07 1.98Aventis Pharma Ltd. 753.76 1.28
Chemicals 2923.09 4.97Indian Petrochemicals Corporation Ltd. 2923.09 4.97
Telecom-Services 2443.75 4.15Bharti Tele-Ventures Ltd. 2443.75 4.15
Pesticides 2170.30 3.69United Phosphorous Ltd. 1552.07 2.64Rallis India Ltd. 618.23 1.05
Petroleum Products 2064.99 3.51Reliance Industries Ltd. 2064.99 3.51
Oil 565.61 0.96Oil & Natural Gas Corporation Ltd. 565.61 0.96
Cement 565.57 0.96Ultratech Cement Ltd. 565.57 0.96
Ferrous Metals 535.36 0.91Tata Steel Ltd 535.36 0.91
Fertilisers 383.30 0.65Tata Chemicals Ltd. 383.30 0.65
Money Market Instruments 3080.81 5.24L&T Finance Ltd. 1984.96 3.37CMC Ltd. 997.18 1.70Kotak Mahindra Bank Ltd. 98.67 0.17
Cash & Current Assets 4805.35 8.17
Net Assets 58824.84 100.00
Issuer Wise Portfolio as of 31-October-2005
Fund Manager's Speak - Birla Equity Plan (BEP)
Nishid Shah
! Fund received a very good response from investors and is now open for ongoing subscriptions
! Portfolio allocations designed to capture value and growth across sectors, from a universe of India’s top listed companies
12
Asset Allocation 31-October-2005
N O V E M B E R 2 0 0 5
3.48%
3.51%
3.69%
4.15%
4.97%
5.24%
5.37%
5.59%
6.29%
8.17%
8.79%
9.79%
9.87%
9.97%
11.11%
0.00% 2.00% 4.00% 6.00% 8.00% 10.00% 12.00%
Other Equity
Petroleum Products
Pesticides
Telecom-Services
Chemicals
Money Market Instruments
Pharmaceuticals
Hotels
Finance
Cash & Current Assets
Auto
Software
Banks
Consumer Non Durables
Industrial Capital Goods

Issuer Market Value % to Net AssetsRs. in Lacs
Consumer Non Durables 1578.46 46.10Godrej Consumer Products Ltd. 291.58 8.52Mcdowell & Company Ltd. 248.04 7.24Asian Paints (India) Ltd. 239.50 7.00I T C Ltd. 211.61 6.18Hindustan Lever Ltd. 201.75 5.89Dabur India Ltd. 194.59 5.68United Breweries Ltd 191.40 5.59Pharmaceuticals 1079.76 31.54Biocon Ltd. 236.74 6.91Cipla Ltd. 208.74 6.10Sun Pharmaceutical Industries Ltd. 208.55 6.09Cadila Healthcare Ltd. 177.30 5.18Divis Laboratories Ltd. 132.87 3.88Glenmark Pharmaceuticals Ltd. 115.56 3.38Retailing 446.41 13.04Pantaloon Retail Ltd 237.75 6.94Trent Ltd 208.67 6.09Media & Entertainment 85.40 2.49UTV Software Communications Ltd. 42.90 1.25ETC Networks Ltd. 42.50 1.24Magnasound India Ltd 0.00 0.00Cash & Current Assets 233.63 6.82Net Assets 3423.66 100.00
Issuer Wise Portfolio as of 31-October-2005
13
Birla Sun Life Buy India Fund(Formerly Alliance Buy India Fund)An open ended growth scheme focusing on investing in businesses driven by India’s large population and inherent consumption patterns.
Fund Manager's Speak - Birla Sun Life Buy India Fund
! Portfolio significantly Overweight on Consumer Non-Durables, Pharma and Retailing.
! High allocation to sectors likely to benefit from changing lifestyles, increasing disposable income and growing number of middle-income class households.
Asset Allocation 31-October-2005
(Formerly Alliance New Millennium Fund)An open-ended growth scheme focusing on investing in technology, technology dependent and technology enabled companies.
Birla Sun Life New Millennium Fund
Issuer Market Value % to Net AssetsRs. in Lacs
Software 7290.51 75.63Infosys Technologies Ltd. 1319.80 13.69Satyam Computer Services Ltd. 1212.30 12.58Tata Consultancy Services Ltd. 1162.21 12.06Hinduja TMT Ltd. 903.37 9.37HCL Technologies Ltd. 880.20 9.13Geodesic Information Systems Ltd. 753.41 7.82Mphasis BFL Ltd. 462.17 4.79I-Flex Solutions Ltd. 222.26 2.31Nucleus Software Exports Ltd. 200.83 2.08Allsec Technologies Ltd. 173.96 1.80Telecom-Services 1214.41 12.60Bharti Tele-Ventures Ltd. 1214.41 12.60Media & Entertainment 520.78 5.40ETC Networks Ltd. 349.17 3.62Pritish Nandy Communications Ltd. 107.26 1.11UTV Software Communications Ltd. 64.34 0.67Magnasound India Ltd 0.00 0.00Cash & Current Assets 613.85 6.37Net Assets 9639.54 100.00
Issuer Wise Portfolio as of 31-October-2005 Asset Allocation 31-October-2005
Fund Manager's Speak - Birla Sun Life New Millennium Fund Nishid Shah
! Maintained higher exposure to IT sector considering the sustained growth exhibited by heavyweights within the sector and the favorable dollar rupee movement.
! Investment in Telecom remains only with the market leader having a scalable business model.
SIP is a powerful tool that can help you create wealth over time. If you had invested* in BSLBIF...Monthly Investment 1,000
Number of Investment periods (Since Inception) 68
Total Investment 68,000
Value of Investment (As of October 31, 2005) 200,613
Return on Investment (CAGR) 38.78%
* Load has not been taken into consideration. Past performance may or may not be sustained in future. In the same period, a SIP in BSE 200 would have given a return of 25.38%
Date of First Installment: March 01, 2000
Systematic Investment Plan (SIP)
Nishid Shah
SIP is a powerful tool that can help you create wealth over time. If you had invested* in BSLNMF...Monthly Investment 1,000
Number of Investment periods (Since Inception) 68
Total Investment 68,000
Value of Investment (As of October 31, 2005) 144,419
Return on Investment (CAGR) 26.67%
* Load has not been taken into consideration. Past performance may or may not be sustained in future. In the same period, a SIP in BSE Teck would have given a return of 20.92%
Date of First Installment: March 01, 2000
Systematic Investment Plan (SIP)
2.49%
6.82%
13.04%
31.54%
46.10%
0.00% 5.00% 10.00% 15.00% 20.00% 25.00% 30.00% 35.00% 40.00% 45.00% 50.00%
Media & Entertainment
Cash & Current Assets
Retailing
Pharmaceuticals
Consumer Non Durables
5.40%
6.37%
12.60%
75.63%
0.00% 10.00% 20.00% 30.00% 40.00% 50.00% 60.00% 70.00% 80.00%
Media & Entertainment
Cash & Current Assets
Telecom-Services
Software
N O V E M B E R 2 0 0 5

Systematic Investment Plan (SIP)
SIP is a powerful tool that can help you create wealth over time. If you had invested* in BSLBIF...Monthly Investment 1,000
Number of Investment periods (Since Inception) 68
Total Investment 68,000
Value of Investment (As of ) 229,041
Return on Investment (CAGR) 43.78%
* Load has not been taken into consideration. Past performance may or may not be sustained in future. In the same period, a SIP in BSE 200 would have given a return of 25.38%
March 01, 2000
October 31, 2005
Date of First Installment:
Issuer Market Value % to Net AssetsRs. in Lacs
Industrial Capital Goods 1132.65 22.00Siemens Ltd. 408.36 7.93Bharat Heavy Electricals Ltd. 344.99 6.70Larsen & Toubro Ltd. 215.51 4.19Crompton Greaves Ltd. 87.66 1.70Engineers India Ltd. 76.13 1.48
Banks 625.87 12.16Punjab National Bank 212.74 4.13State Bank of India 189.44 3.68Jammu & Kashmir Bank Ltd. 126.24 2.45Syndicate Bank 97.45 1.89
Auto 601.11 11.67Hero Honda Motors Ltd. 231.85 4.50Bajaj Auto Ltd. 230.20 4.47Tata Motors Ltd. 139.06 2.70
Ferrous Metals 564.82 10.97Jindal Steel & Power Ltd. 301.26 5.85PSL Ltd. 263.56 5.12
Pesticides 378.93 7.36United Phosphorous Ltd. 378.93 7.36
Chemicals 329.13 6.39Indian Petrochemicals Corporation Ltd. 250.35 4.86Aarti Industries Ltd. 78.79 1.53
Industrial Products 279.81 5.43BOC India Ltd. 279.81 5.43
Fertilisers 214.65 4.17Tata Chemicals Ltd. 214.65 4.17
Oil 185.75 3.61Oil & Natural Gas Corporation Ltd. 185.75 3.61
Cement 174.54 3.39Grasim Industries Ltd. 121.98 2.37Ultratech Cement Ltd. 52.56 1.02
Consumer Non Durables 143.79 2.79SPL Industries Ltd. 143.79 2.79
Petroleum Products 125.81 2.44Chennai Petroleum Corporation Ltd. 125.81 2.44
Cash & Current Assets 392.13 7.62
Net Assets 5149.00 100.00
Issuer Wise Portfolio as of 31-October-2005
Fund Manager's Speak - Birla Sun Life Basic Industries Fund
Nishid Shah
! Reduced exposure to the steel sector.
! Increased exposure to chemicals sector and to companies that are an indirect play on the capex cycle in the industrial/infrastructure sector.
! Maintained overweight in capital goods, banking and auto sectors.
14
Asset Allocation 31-October-2005
Birla Sun Life Basic Industries Fund(Formerly Alliance Basic Industries Fund)An open-ended growth scheme focusing on companies sensitive to economic cycles and commodity pricing cycles.
2.44%
2.79%
3.39%
3.61%
4.17%
5.43%
6.39%
7.36%
7.62%
10.97%
11.67%
12.16%
22.00%
0.00% 5.00% 10.00% 15.00% 20.00% 25.00%
Petroleum Products
Consumer Non Durables
Cement
Oil
Fertilisers
Industrial Products
Chemicals
Pesticides
Cash & Current Assets
Ferrous Metals
Auto
Banks
Industrial Capital Goods
N O V E M B E R 2 0 0 5
#**** -Value Research Rating- Birla Sun Life Basic Industries Fund
(Past performance is no guarantee of future results.)
# for methodology please refer page 36

Systematic Investment Plan (SIP)
SIP is a powerful tool that can help you create wealth over time. If you had invested* in BSLFEF...Monthly Investment 1,000
Number of Investment periods (Since Inception) 37
Total Investment 37,000
Value of Investment (As of ) 68,800
Return on Investment (CAGR) 43.32%
* Load has not been taken into consideration. Past performance may or may not be sustained in future. In the same period, a SIP in BSE 200 would have given a return of 35.90%
Date of First Installment: October 01, 2002
October 31, 2005
Issuer Market Value % to Net AssetsRs. in Lacs
Software 140.39 18.49Infosys Technologies Ltd. 63.10 8.31Satyam Computer Services Ltd. 47.89 6.31Tata Consultancy Services Ltd. 29.41 3.87
Banks 106.35 14.00State Bank of India 40.24 5.30Canara Bank 28.27 3.72Punjab National Bank 22.68 2.99Union Bank of India 15.16 2.00
Petroleum Products 58.25 7.67Chennai Petroleum Corporation Ltd. 22.12 2.91Reliance Industries Ltd. 21.42 2.82Bharat Petroleum Corporation Ltd. 14.70 1.94
Auto 52.86 6.96Hero Honda Motors Ltd. 31.10 4.10Tata Motors Ltd. 21.76 2.87
Consumer Non Durables 49.49 6.52Nestle India Ltd. 31.44 4.14I T C Ltd. 18.05 2.38
Telecom-Services 39.52 5.20Bharti Tele-Ventures Ltd. 39.52 5.20
Chemicals 37.06 4.88Indian Petrochemicals Corporation Ltd. 37.06 4.88
Ferrous Metals 36.33 4.78Jindal Steel & Power Ltd. 36.33 4.78
Industrial Capital Goods 35.18 4.63Bharat Heavy Electricals Ltd. 35.18 4.63
Gas 34.30 4.52Gujarat Gas Co. Ltd. 34.30 4.52
Pharmaceuticals 28.92 3.81Glaxosmithkline Pharmaceuticals Ltd. 18.12 2.39Cipla Ltd. 10.80 1.42
Pesticides 23.80 3.13United Phosphorous Ltd. 23.80 3.13
Retailing 15.05 1.98Trent Ltd 15.05 1.98
Media & Entertainment 11.51 1.52ETC Networks Ltd. 11.51 1.52
Cement 11.13 1.47The Associated Cement Companies Ltd. 11.13 1.47
Fertilisers 9.58 1.26Tata Chemicals Ltd. 9.58 1.26
Cash & Current Assets 69.66 9.17
Net Assets 759.38 100.00
Issuer Wise Portfolio as of 31-October-2005
Fund Manager's Speak - Birla Sun Life Frontline Equity Fund
Nishid Shah
! Higher banking exposure to benefit from the strong credit growth in the economy.
! Pharmaceuticals and auto exposures are a play on the strong domestic consumption story.
! Maintained overweight in quality IT/software services companies.
15
Asset Allocation 31-October-2005
Birla Sun Life Frontline Equity Fund(Formerly Alliance Frontline Equity Fund)An open-ended growth scheme focusing on investing across various industries and/or sectors
3.13%
3.81%
4.52%
4.63%
4.78%
4.88%
5.20%
6.23%
6.52%
6.96%
7.67%
14.00%
18.49%
9.17%
0.00% 2.00% 4.00% 6.00% 8.00% 10.00%12.00%14.00%16.00%18.00%20.00%
Pesticides
Pharmaceuticals
Gas
Industrial Capital Goods
Ferrous Metals
Chemicals
Telecom-Services
Other Equity
Consumer Non Durables
Auto
Petroleum Products
Banks
Software
Cash & Current Assets
N O V E M B E R 2 0 0 5

Systematic Investment Plan (SIP)
SIP is a powerful tool that can help you create wealth over time. If you had invested* in BSLEF...Monthly Investment 1,000
Number of Investment periods (Since Inception) 85
Total Investment 85,000
Value of Investment (As of October 31, 2005) 314,588
Return on Investment (CAGR) 36.46%
* Load has not been taken into consideration. Past performance may or may not be sustained in future. In the same period, a SIP in BSE 200 would have given a return of 21.19%
Date of First Installment: October 1, 1998
Issuer Market Value % to Net AssetsRs. in Lacs
Software 4576.91 17.85Infosys Technologies Ltd. 2040.55 7.96%Hinduja TMT Ltd. 757.80 2.95Satyam Computer Services Ltd. 652.82 2.55Tata Consultancy Services Ltd. 635.71 2.48HCL Technologies Ltd. 490.02 1.91
Industrial Capital Goods 3745.89 14.61Siemens Ltd. 1557.11 6.07Bharat Heavy Electricals Ltd. 1280.56 4.99Larsen & Toubro Ltd. 908.21 3.54
Retailing 2137.41 8.33Pantaloon Retail Ltd 1124.69 4.39Trent Ltd 1012.72 3.95
Banks 2127.23 8.29State Bank of India 984.94 3.84Punjab National Bank 645.68 2.52Oriental Bank of Commerce 252.58 0.98Jammu & Kashmir Bank Ltd. 244.03 0.95
Telecom-Services 1564.06 6.10Bharti Tele-Ventures Ltd. 1564.06 6.10
Consumer Non Durables 1513.95 5.90I T C Ltd. 721.80 2.81United Breweries Ltd 424.14 1.65SPL Industries Ltd. 368.01 1.44
Pesticides 1333.49 5.20United Phosphorous Ltd. 1333.49 5.20
Auto 1302.54 5.08Bajaj Auto Ltd. 655.07 2.55Hero Honda Motors Ltd. 647.47 2.52
Pharmaceuticals 1289.99 5.03Cadila Healthcare Ltd. 518.65 2.02Glaxosmithkline Pharmaceuticals Ltd. 378.44 1.48Divis Laboratories Ltd. 368.90 1.44Maestro Mediline Systems Limited 12.60 0.05Torrent Pharmaceuticals Ltd. 11.40 0.04
Industrial Products 1135.64 4.43BOC India Ltd. 786.83 3.07Essel Propack Ltd. 348.82 1.36
Chemicals 1107.38 4.32Indian Petrochemicals Corporation Ltd. 1107.38 4.32
Gas 1019.54 3.98Gujarat Gas Co. Ltd. 1019.54 3.98
Finance 850.25 3.32United Breweries Holdings Ltd 850.25 3.32
Floating Rate Instruments 600.00 2.34Sterlite Industries (India) Ltd. 600.00 2.34
Transportation 497.07 1.94Container Corporation of India Ltd. 497.07 1.94
Ferrous Metals 380.87 1.49PSL Ltd. 380.87 1.49
Media & Entertainment 16.65 0.06ETC Networks Ltd. 16.65 0.06
Cash & Current Assets 446.28 1.74
Net Assets 25645.13 100.00
Issuer Wise Portfolio as of 31-October-2005
Fund Manager's Speak - Birla Sun Life Equity Fund
Nishid Shah
! Primary focus on lowering the portfolio beta, keeping it diversified across key sectors likely to benefit from the rapid economic growth both, domestic and export led.
! Increased exposure to the IT sector while reducing exposure in retailing and banking sectors.
! Realignment of exposure within Auto sector from four wheelers to the faster growing two wheelers.
! Overweight in capital goods, banking sector and IT.
16
Asset Allocation 31-October-2005
Birla Sun Life Equity Fund(Formerly Alliance Equity Fund)
An open-ended diversified growth scheme
1.74%
2.34%
3.32%
3.49%
3.98%
4.32%
4.43%
5.03%
5.08%
5.20%
5.90%
6.10%
8.29%
8.33%
14.61%
17.85%
0.00% 2.00% 4.00% 6.00% 8.00%10.00%12.00%14.00%16.00%18.00%20.00%
Cash & Current Assets
Floating Rate Instruments
Finance
Other Equity
Gas
Chemicals
Industrial Products
Pharmaceuticals
Auto
Pesticides
Consumer Non Durables
Telecom-Services
Banks
Retailing
Industrial Capital Goods
Software
N O V E M B E R 2 0 0 5
Did you know that Birla Sun Life Equity Fund has been ranked “CPR-2” by CRISIL?for more details refer to page 36
CRISIL~CPR 2 Open Ended Equity Category^^
(Past performance is no guarantee of future results.)
^^ for methodology please refer page 36

Systematic Investment Plan (SIP)
SIP is a powerful tool that can help you create wealth over time. If you had invested* in BSLTR’96F...Monthly Investment 1,000
Number of Investment periods (Since Inception) 115
Total Investment 115,000
Value of Investment (As of October 31, 2005) 820,232
Return on Investment (CAGR) 38.75%
* Load has not been taken into consideration. Past performance may or may not be sustained in future. In the same period, a SIP in BSE 200 would have given a return of 16.85%
**Dividend reinvestment NAVs have been considered for the analyses.
Date of First Installment: April 1, 1996
Issuer Market Value % to Net AssetsRs. in Lacs
Software 280.93 21.33Infosys Technologies Ltd. 119.89 9.10Mphasis BFL Ltd. 40.57 3.08HCL Technologies Ltd. 36.34 2.76Hinduja TMT Ltd. 33.73 2.56Satyam Computer Services Ltd. 27.28 2.07Allsec Technologies Ltd. 23.12 1.76
Banks 170.60 12.95Jammu & Kashmir Bank Ltd. 53.40 4.05State Bank of India 44.43 3.37Oriental Bank of Commerce 38.01 2.89Punjab National Bank 34.76 2.64
Auto 105.78 8.03Hero Honda Motors Ltd. 55.13 4.19Bajaj Auto Ltd. 25.58 1.94Tata Motors Ltd. 25.07 1.90
Pesticides 100.00 7.59United Phosphorous Ltd. 100.00 7.59
Telecom-Services 98.41 7.47Bharti Tele-Ventures Ltd. 98.41 7.47
Industrial Capital Goods 96.11 7.30Bharat Heavy Electricals Ltd. 96.11 7.30
Pharmaceuticals 94.49 7.17Cadila Healthcare Ltd. 54.16 4.11Divis Laboratories Ltd. 40.32 3.06
Transportation 69.27 5.26Container Corporation of India Ltd. 69.27 5.26
Consumer Non Durables 66.44 5.05SPL Industries Ltd. 42.26 3.21United Breweries Ltd 24.18 1.84
Chemicals 66.33 5.04Indian Petrochemicals Corporation Ltd. 66.33 5.04
Petroleum Products 42.11 3.20Chennai Petroleum Corporation Ltd. 42.11 3.20
Finance 34.06 2.59United Breweries Holdings Ltd 34.06 2.59
Media & Entertainment 9.23 0.70ETC Networks Ltd. 9.23 0.70
Cash & Current Assets 83.22 6.32
Net Assets 1316.97 100.00
Issuer Wise Portfolio as of 31-October-2005
Fund Manager's Speak - Birla Sun Life Tax Relief '96
Nishid Shah
! Increased exposure to auto, software & chemicals.
! Portfolio remains over weight on software & banks.
! Maintained high exposure to telecom and capital goods considering high growth prospects.
17
Systematic Investment Plan (SIP)
SIP is a powerful tool that can help you create wealth over time. If you had invested* in BSLTR’96F...Monthly Investment 1,000
Number of Investment periods (Since Inception) 115
Total Investment 115,000
Value of Investment (As of October 31, 2005) 820,232
Return on Investment (CAGR) 38.75%
* Load has not been taken into consideration. Past performance may or may not be sustained in future. In the same period, a SIP in BSE 200 would have given a return of 16.85%
**Dividend reinvestment NAVs have been considered for the analyses.
Date of First Installment: April 1, 1996
Issuer Market Value % to Net AssetsRs. in Lacs
Software 280.93 21.33Infosys Technologies Ltd. 119.89 9.10Mphasis BFL Ltd. 40.57 3.08HCL Technologies Ltd. 36.34 2.76Hinduja TMT Ltd. 33.73 2.56Satyam Computer Services Ltd. 27.28 2.07Allsec Technologies Ltd. 23.12 1.76
Banks 170.60 12.95Jammu & Kashmir Bank Ltd. 53.40 4.05State Bank of India 44.43 3.37Oriental Bank of Commerce 38.01 2.89Punjab National Bank 34.76 2.64
Auto 105.78 8.03Hero Honda Motors Ltd. 55.13 4.19Bajaj Auto Ltd. 25.58 1.94Tata Motors Ltd. 25.07 1.90
Pesticides 100.00 7.59United Phosphorous Ltd. 100.00 7.59
Telecom-Services 98.41 7.47Bharti Tele-Ventures Ltd. 98.41 7.47
Industrial Capital Goods 96.11 7.30Bharat Heavy Electricals Ltd. 96.11 7.30
Pharmaceuticals 94.49 7.17Cadila Healthcare Ltd. 54.16 4.11Divis Laboratories Ltd. 40.32 3.06
Transportation 69.27 5.26Container Corporation of India Ltd. 69.27 5.26
Consumer Non Durables 66.44 5.05SPL Industries Ltd. 42.26 3.21United Breweries Ltd 24.18 1.84
Chemicals 66.33 5.04Indian Petrochemicals Corporation Ltd. 66.33 5.04
Petroleum Products 42.11 3.20Chennai Petroleum Corporation Ltd. 42.11 3.20
Finance 34.06 2.59United Breweries Holdings Ltd 34.06 2.59
Media & Entertainment 9.23 0.70ETC Networks Ltd. 9.23 0.70
Cash & Current Assets 83.22 6.32
Net Assets 1316.97 100.00
Issuer Wise Portfolio as of 31-October-2005
Fund Manager's Speak - Birla Sun Life Tax Relief '96
Nishid Shah
! Increased exposure to auto, software & chemicals.
! Portfolio remains over weight on software & banks.
! Maintained high exposure to telecom and capital goods considering high growth prospects.
17# for methodology please refer page 36
Asset Allocation 31-October-2005
Birla Sun Life Tax Relief '96(Formerly Alliance Capital Tax Relief '96)An open-End Equity Linked Savings Scheme (ELSS) with a lock-in period of 3 years
0.70%
2.59%
3.20%
5.04%
5.05%
5.26%
6.32%
7.17%
7.30%
7.47%
7.59%
8.03%
12.95%
21.33%
0.00% 5.00% 10.00% 15.00% 20.00% 25.00%
Other Equity
Finance
Petroleum Products
Chemicals
Consumer Non Durables
Transportation
Cash & Current Assets
Pharmaceuticals
Industrial Capital Goods
Telecom-Services
Pesticides
Auto
Banks
Software
N O V E M B E R 2 0 0 5

Birla BalanceAn open-ended balanced fund investing in a mix of Debt and Equity
Issuer Market Value % to Net AssetsRs. in Lacs
Equity and Equity related
Listed / Awaiting listing on stock Exchange
Software 2,143.90 9.62Infosys Technologies Ltd. 555.99 2.50Tata Consultancy Services Ltd. 546.10 2.45Nucleus Software Exports Ltd. 332.37 1.49Mastek Ltd. 277.25 1.24Allsec Technologies Ltd. 239.53 1.08Subex Systems Ltd. 192.67 0.86
Banks 1,621.99 7.28State Bank of India 647.97 2.91Oriental Bank of Commerce 472.44 2.12Syndicate Bank 376.58 1.69Canara Bank 125.01 0.56
Industrial Capital Goods 1,285.62 5.77Larsen & Toubro Ltd. 537.37 2.41Siemens Ltd. 284.32 1.28Alstom Projects India Ltd. 183.31 0.82Crompton Greaves Ltd. 168.56 0.76Engineers India Ltd. 112.06 0.50
Auto 1,130.24 5.07Bajaj Auto Ltd. 574.65 2.58Hero Honda Motors Ltd. 555.58 2.49
Pharmaceuticals 1,104.88 4.96Glaxosmithkline Pharmaceuticals Ltd. 432.74 1.94Pfizer Ltd. 386.83 1.74Novartis India Ltd. 215.52 0.97Aventis Pharma Ltd. 69.79 0.31
Consumer Non Durables 979.67 4.40Mcdowell & Company Ltd. 580.88 2.61I T C Ltd. 398.79 1.79
Finance 929.38 4.17Housing Development Finance Corp. Ltd. 523.85 2.35LIC Housing Finance Ltd. 239.72 1.08IL&FS Investmart Ltd. 165.81 0.74
Telecom-Services 842.12 3.78Bharti Tele-Ventures Ltd. 842.12 3.78
Industrial Products 625.07 2.81BOC India Ltd. 531.97 2.39Torrent Cables Ltd. 93.10 0.42
Chemicals 530.52 2.38Indian Petrochemicals Corporation Ltd. 530.52 2.38
Hotels 485.65 2.17Indian Hotels Co. Ltd. 373.18 1.67Asian Hotels Ltd. 112.47 0.50
Pesticides 481.43 2.16United Phosphorous Ltd. 481.43 2.16
Petroleum Products 251.64 1.13Reliance Industries Ltd. 251.64 1.13
Hardware 161.03 0.72CMC Ltd. 161.03 0.72
Auto Ancillaries 155.45 0.70Automobile Corporation of Goa Ltd. 155.45 0.70
Construction 140.68 0.63D.S. Kulkarni Developers Ltd. 140.68 0.63
Debt
Floating Rate Instruments 2,406.23 10.79Housing Development Finance Corp. Ltd.(AAA) 2,004.15 8.99LIC Housing Finance Ltd. (AAA) 402.07 1.80
PSU/PFI Bonds/Banks 1,203.20 5.40Citibank N A (AAA) 817.52 3.67Indian Oil Corporation Ltd. (LAAA) 340.27 1.53HDFC Bank Ltd. (AAA) 45.42 0.20
Securitised Debt 1,022.47 4.59BHPC Auto Sec Trust Jun 05 - Sr. A3 (AAA(SO)) 1,022.47 4.59
Government Bond 627.60 2.82Govt Bond 10.25% 2021 (Sovereign) 627.60 2.82
Money Market Instruments 398.62 1.79Citicorp Finance (I) Ltd. (P1+) 398.62 1.79
Cash & Current Assets 3,756.60 16.86
Net Assets 22,284.02 100.00
Issuer Wise Portfolio as of 31-October-2005
Systematic Investment Plan (SIP)
SIP is a powerful tool that can help you create wealth over time. If you had invested* in Birla Balance...
Monthly Investment 1,000
Number of Investment periods (Since Inception) 72
Total Investment 72,000
Value of Investment (As of ) 129,227
Return on Investment (CAGR) 19.36%
* Load has not been taken into consideration. Past performance may or may not be sustained in future. Benchmark return since inception not available.
November 1, 1999
October 31, 2005
Date of First Installment:
Fund Managers' Speak - Birla Balance
Nishid Shah & Navneet Munot
! Equity exposure was capped at 58% and increased exposure to fixed income instruments.
! Portfolio geared to benefit from both the country's growing consumption needs as well as its ability to serve global industries in niche verticals such as IT.
! Banking & finance and IT sector exposures key portfolio overweightage.
18
Asset Allocation 31-October-2005
Rating Profile 31-October-2005
1.79%2.16%2.17%2.38%
2.81%2.82%
3.18%3.78%
4.17%4.40%4.59%
4.96%5.07%
5.40%5.77%
7.28%9.62%
10.79%16.86%
0.00% 2.00% 4.00% 6.00% 8.00% 10.00% 12.00% 14.00% 16.00% 18.00%
Money Market InstrumentsPesticides
HotelsChemicals
Industrial ProductsGovernment Bond
Other Equity Telecom-Services
FinanceConsumer Non Durables
Securitised DebtPharmaceuticals
AutoPSU/PFI Bonds/Banks
Industrial Capital GoodsBanks
SoftwareFloating Rate Instruments
Cash & Current Assets
2.82%
16.86%
22.57%
57.75%
0.00% 10.00% 20.00% 30.00% 40.00% 50.00% 60.00% 70.00%
Sovereign
Cash & Current Assets
AAA
Other Equity
N O V E M B E R 2 0 0 5

Birla Sun Life '95 Fund(Formerly The Alliance ’95 Fund)
An open-ended Balanced fund investing in a mix of debt and equity
Fund Managers' Speak - Birla Sun Life '95 Fund
Nishid Shah & Navneet Munot
! Increased exposure in consumer non-durables.
! Maintained overweight in IT services, banking and consumer non-durables.
! Equity exposure currently around 67%.
Issuer Wise Portfolio as of 31-October-2005
Issuer Market Value % to Net RatingRs. in. Lacs Assets
Software 1450.07 12.70Infosys Technologies Ltd. 643.59 5.63 Hinduja TMT Ltd. 339.90 2.98 Tata Consultancy Services Ltd. 317.86 2.78 HCL Technologies Ltd. 148.72 1.30
Banks 806.69 7.06State Bank of India 419.13 3.67 Jammu & Kashmir Bank Ltd. 151.91 1.33 Punjab National Bank 120.19 1.05 Oriental Bank of Commerce 115.46 1.01
Consumer Non Durables 667.25 5.84United Breweries Ltd 303.97 2.66 I T C Ltd. 270.68 2.37 SPL Industries Ltd. 92.61 0.81
Telecom-Services 640.14 5.60Bharti Tele-Ventures Ltd. 640.14 5.60
Pharmaceuticals 614.13 5.38Cipla Ltd. 251.93 2.21 Cadila Healthcare Ltd. 219.01 1.92 Divis Laboratories Ltd. 143.19 1.25
Finance 557.91 4.88United Breweries Holdings Ltd 444.25 3.89 IL&FS Investmart Ltd. 92.54 0.81 Jindal South West Holdings Ltd 21.11 0.18
Pesticides 536.85 4.70United Phosphorous Ltd. 536.85 4.70
Industrial Capital Goods 532.24 4.66Bharat Heavy Electricals Ltd. 304.14 2.66 Larsen & Toubro Ltd. 228.10 2.00
Retailing 399.35 3.50Trent Ltd 399.35 3.50
Auto 339.64 2.97Hero Honda Motors Ltd. 271.43 2.38 Bajaj Auto Ltd. 68.21 0.60
Chemicals 267.25 2.34Indian Petrochemicals Corporation Ltd. 267.25 2.34
Gas 266.70 2.33Gujarat Gas Co. Ltd. 266.70 2.33
Transportation 197.25 1.73Container Corporation of India Ltd. 197.25 1.73
Petroleum Products 155.46 1.36Chennai Petroleum Corporation Ltd. 155.46 1.36
Ferrous Metals 151.56 1.33Jindal Steel & Power Ltd. 151.56 1.33
Floating Rate Instruments 2002.59 17.53Sterlite Industries (India) Ltd. 1500.00 13.13 P1+LIC Housing Finance Ltd. 502.59 4.40 AAA
Securitised Debt 1347.63 11.80Goldstar Trust (CITI) 15 MARCH 2008** 380.47 3.33 AAA(SO)Goldstar Trust May 2004 Series 2004-A** 315.75 2.76 P1+(SO)Fleet Trust July 2004 A2 Series** 284.92 2.49 AAA(SO)Goldstar Trust July 2004 A2 Series** 260.11 2.28 AAA(SO)SFL Securitization Trust April 2004** 66.90 0.59 A1+(SO)India MBS 2003 Series III Trust** 32.89 0.29 AAA(SO)BHPC Auto Loan Securitisation Trust 2003** 6.58 0.06 MAAA
Government Bond 362.75 3.18Govt Bond 7.37% 2014 256.25 2.24 SovereignGovt Bond 8.07%2017 106.50 0.93 Sovereign
Corporate Debt 303.43 2.66Lafarge India Ltd** 303.43 2.66 AA-
Cash & Current Assets -176.94 -1.55
**Represents thinly traded/ non traded securities and illiquid securities Total Percentage of thinly/non traded securities is 14.46%
Net Assets 11421.96 100.00
19
As on 31-October-2005
Systematic Investment Plan (SIP)
SIP is a powerful tool that can help you create wealth over time. If you had invested* in BSL‘95F...Monthly Investment 1,000
Number of Investment periods (Since Inception) 127
Total Investment 127,000
Value of Investment (As of October 31, 2005) 672,354
Return on Investment (CAGR) 29.38%
* Load has not been taken into consideration. Past performance may or may not be sustained in future. Benchmark return since inception not available.
Date of First Installment: April 1, 1995
Asset Allocation
Rating Profile
Maturity Profile
-1.55%2.33%2.34%
2.66%2.97%3.18%
3.50%4.42%4.66%4.70%4.88%
5.38%5.60%5.84%
7.06%11.80%
12.70%17.53%
-5.00% 0.00% 5.00% 10.00% 15.00% 20.00%
Cash & Current AssetsGas
ChemicalsCorporate Debt
AutoGovernment Bond
RetailingOther Equity
Industrial Capital GoodsPesticides
FinancePharmaceuticalsTelecom-Services
Consumer Non DurablesBanks
Securitised DebtSoftware
Floating Rate Instruments
-1.55%
2.66%
3.18%
29.33%
66.38%
-10.00% 0.00% 10.00% 20.00% 30.00% 40.00% 50.00% 60.00% 70.00%
Cash & Current Assets
AA
Sovereign
AAA
Other
-1.55%
0.26%
0.59%
11.28%
23.01%
66.41%
-10.00% 0.00% 10.00% 20.00% 30.00% 40.00% 50.00% 60.00% 70.00%
Cash & Current Assets
1 Years To 2 Years
6 Months To 1 Years
Above 2 Years
Less Than 6 Months
Other
N O V E M B E R 2 0 0 5

Birla MIPAn open- ended fund. Monthly income is not assured and is subject to availability of distributable surplus
Issuer Wise Portfolio as of 31-October-2005
Issuer Market Value % to Net RatingRs. in. Lacs Assets
DEBT INSTRUMENTS
Corporate Debt 7678.45 25.98
Reliance Industries Ltd. ** 1976.59 6.69 AAA
Tata Sons Ltd.** 1525.85 5.16 AAA
L & T Infrastructure Devp Projects Ltd,** 1321.25 4.47 AAA(SO)
Hindalco Industries Ltd.** 996.13 3.37 AAA
Great Eastern Shipping Co. Ltd.** 955.77 3.23 AAA
Electrosteel Castings Ltd.** 591.62 2.00 AA+
CitiFinancial Consumer Finance (I) Ltd.** 211.21 0.71 AAA
Gujarat Ambuja Cements Ltd.** 100.05 0.34 AAA
Securitised Debt 6915.96 23.40
Loan Sec Trust Sr XVI NTPC (ICICI Bank) ** 1988.03 6.73 LAAA(SO)
Loan Receivable Trust II 2003 (Guj Amb) ** 929.74 3.15 AAA(SO)
Fleet Trust Aug I 2003 A3 CFIL (IL&FS)** 619.85 2.10 AAA(SO)
MART 2003 II A2 SCB (UTI Bank)** 532.77 1.80 P1+(SO)
MART 2004-SERIES III(CLASS A2)(04DEC06) ** 530.79 1.80 AAA(SO)
BHPC Auto Sec Tr JUNE2005 A3 ** 511.24 1.73 AAA(SO)
SME Revol Sec Tr Mar04 A1 Sr(Citibank)** 500.19 1.69 AAA(SO)
BHPC Auto Sec Tr DEC2003 A2 ** 462.88 1.57 AAA(SO)
MART 2003 II A2 SCB (UTI Bank)** 320.83 1.09 AAA(SO)
Loan Sec Trust SrXII NTPC (ICICI)** 276.93 0.94 LAAA(SO)
PFSL Sr A2 Chola Nov 2003** 113.68 0.38 MAAA(SO)
HDFC Bank Retail 2004 Sr 1 A2 (IL&FS)** 113.56 0.38 MAAA(SO)
Fleet Trust Oct 2003 A1 (CFIL) UTI Bank** 15.48 0.05 AAA(SO)
PSU/PFI Bonds/Banks 5481.99 18.55
Bharat Heavy Electricals Ltd.** 2358.97 7.98 AAA
Neyveli Lignite Corporation Ltd.** 783.87 2.65 LAAA
Nuclear Power Corporation of India Ltd** 758.72 2.57 AAA
Power Finance Corporation Ltd.** 558.18 1.89 AAA
Hindustan Aeronautics Ltd.** 512.15 1.73 AAA
Rural Electrification Corporation Ltd** 499.85 1.69 AAA
Housing Development Finance Corp. Ltd.** 10.25 0.03 AAA
Money Market Instruments 3684.50 12.47
UCO Bank Ltd 2871.28 9.72 P1+
Jammu & Kashmir Bank Ltd. 813.21 2.75 P1+
EQUITY 3637.31 12.31
Bharti Tele-Ventures Ltd. 285.85 0.97
State Bank of India 277.46 0.94
I T C Ltd. 249.02 0.84
Tata Consultancy Services Ltd. 226.18 0.77
Infosys Technologies Ltd. 220.11 0.74
Hero Honda Motors Ltd. 202.16 0.68
Mcdowell & Company Ltd. 195.60 0.66
Glaxosmithkline Pharmaceuticals Ltd. 191.55 0.65
Pfizer Ltd. 178.40 0.60
Indian Hotels Co. Ltd. 177.49 0.60
United Phosphorous Ltd. 164.15 0.56
Indian Petrochemicals Corporation Ltd. 150.40 0.51
Larsen & Toubro Ltd. 144.14 0.49
Syndicate Bank 124.16 0.42
Tata Elxsi Ltd. 117.06 0.40
LIC Housing Finance Ltd. 105.79 0.36
Novartis India Ltd. 104.80 0.35
IL&FS Investmart Ltd. 95.46 0.32
CMC Ltd. 83.73 0.28
Reliance Industries Ltd. 80.83 0.27
Thermax Ltd. 77.43 0.26
Canara Bank 76.54 0.26
Allsec Technologies Ltd. 62.47 0.21
D.S. Kulkarni Developers Ltd. 46.53 0.16
Issuer Wise Portfolio as of 31-October-2005(Contd.)
Floating Rate Instruments 522.83 1.77
Industrial Development Bank of India Ltd 522.83 1.77 AA+
Government Bond 102.10 0.35
Govt Bond 7.27% 2013 102.10 0.35 Sovereign
Mutual Fund Units 80.77 0.27
Birla Fixed Term Debt Fund Ser 3 -18 B 50.52 0.17
Birla Fixed Term Debt Fund Ser 3 -36 B 30.26 0.10
Cash & Current Assets 1447.32 4.90
**Represents thinly traded/ non traded securities and illiquid securities
Total Percentage of thinly/non traded securities is 67.93%
Net Assets 29551.21 100.00
Issuer Market Value % to Net RatingRs. in. Lacs Assets
Fund Managers' Speak - Birla MIP
Navneet Munot & Nishid Shah
! Average maturity of the debt component around 1.44 years in the fixed income portion.
! Continuing to maintain a portfolio of high quality corporate short term papers.
! Equity exposure around 12% in a diversified portfolio of large and mid-cap stocks.
20
As on 31-October-2005
2.04%
4.90%
8.51%
12.31%
12.79%
22.49%
36.97%
0.00% 5.00% 10.00% 15.00% 20.00% 25.00% 30.00% 35.00% 40.00%
Above 5 Years
Cash & Current Assets
Less Than 6 Months
Equity
3 Years To 5 Years
6 Months To 1 Years
1 Years To 3 Years
Rating Profile
Maturity Profile
Asset Allocation0.27%
0.35%1.77%
4.90%12.31%
12.47%18.55%
23.40%25.98%
0.00% 5.00% 10.00% 15.00% 20.00% 25.00% 30.00%
Mutual Fund Units
Government Bond
Floating Rate InstrumentsCash & Current Assets
EquityMoney Market Instruments
PSU/PFI Bonds/BanksSecuritised Debt
Corporate Debt
0.27%
0.35%
3.77%
4.90%
12.31%
78.40%
0.00% 10.00% 20.00% 30.00% 40.00% 50.00% 60.00% 70.00% 80.00% 90.00%
Mutual Fund Units
Sovereign
AA
Cash & Current Assets
Equity
AAA
N O V E M B E R 2 0 0 5

Birla MIP II - Savings 5 PlanAn open- ended fund. Monthly income is not assured and is subject to availability of distributable surplus
Fund Managers' Speak - Birla MIP II - Savings 5 Plan
Navneet Munot & Nishid Shah
! Average maturity of the debt component around 0.48 years predominantly consisting of 2006 corporate bonds and securitized papers.
! Continuing to maintain a low average maturity and looking at trading in G-Secs to optimize returns.
! Equity exposure around 3.5 % in a diversified portfolio of large and mid-cap stocks.
Issuer Wise Portfolio as of 31-October-2005
Issuer Market Value % to Net RatingRs. in. Lacs Assets
DEBT INSTRUMENTS
Securitised Debt 216.82 21.73
Ind Retail ABS Trust Ser XIII A3PTC** 197.89 19.83 MAAA(SO)HDFC Bank Retail 2004 Sr 1 A2 (IL&FS)** 18.93 1.90 MAAA(SO)
PSU/PFI Bonds/Banks 203.07 20.35Bharat Heavy Electricals Ltd.** 102.56 10.28 AAANuclear Power Corporation of India Ltd** 100.51 10.07 AAA
Corporate Debt 73.95 7.41Electrosteel Castings Ltd.** 73.95 7.41 AA+
EQUITY 34.96 3.50Infosys Technologies Ltd. 5.55 0.56 Indian Hotels Co. Ltd. 5.20 0.52 Tata Consultancy Services Ltd. 4.20 0.42 Novartis India Ltd. 3.95 0.40 Pfizer Ltd. 3.87 0.39 Chennai Petroleum Corporation Ltd. 3.57 0.36 State Bank of India 3.50 0.35 Hero Honda Motors Ltd. 2.79 0.28 Bharti Tele-Ventures Ltd. 2.32 0.23
Cash & Current Assets 469.14 47.01
**Represents thinly traded/ non traded securities and illiquid securities Total Percentage of thinly/non traded securities is 49.49%
Net Assets 997.95 1000.00
21
As on 31-October-2005
Asset Allocation
Maturity Profile
Asset Allocation
Rating Profile
3.50%
7.41%
20.35%
21.73%
47.01%
0.00% 5.00%10.00%15.00%20.00%25.00%30.00%35.00%40.00%45.00%50.00%
Equity
Corporate Debt
PSU/PFI Bonds/Banks
Securitised Debt
Cash & Current Assets
3.50%
7.41%
42.08%
47.01%
0.00%5.00%10.00%15.00%20.00%25.00%30.00%35.00%40.00%45.00%50.00%
Equity
AA
AAA
Cash & Current Assets
3.50%
47.01%
49.49%
0.00% 10.00% 20.00% 30.00% 40.00% 50.00% 60.00%
Equity
Cash & Current Assets
1 Years To 3 Years
N O V E M B E R 2 0 0 5

Birla MIP II - Wealth 25 PlanAn open- ended fund. Monthly income is not assured and is subject to availability of distributable surplus
Fund Managers' Speak - Birla MIP II - Wealth 25 Plan
Navneet Munot & Nishid Shah
! Average maturity of the debt component around 1.83 years predominantly consisting of 2006/2007 corporate bonds and securitized papers.
! Cash levels around 4%.
! Equity exposure around 21% in a diversified portfolio of large and mid-cap stocks.
Issuer Wise Portfolio as of 31-October-2005
Issuer Market Value % to Net RatingRs. in. Lacs Assets
PSU/PFI Bonds/Banks 1775.17 23.27ICICI Bank Ltd.** 508.80 6.67 AAAHousing Development Finance Corp. Ltd.** 499.94 6.55 P1+Export-Import Bank of India** 409.41 5.37 AAARural Electrification Corporation Ltd ** 357.02 4.68 AAA
EQUITY 1635.50 21.44Bharti Tele-Ventures Ltd. 139.38 1.83 State Bank of India 116.52 1.53 Hero Honda Motors Ltd. 104.61 1.37 Mcdowell & Company Ltd. 95.75 1.26 Indian Hotels Co. Ltd. 87.63 1.15 I T C Ltd. 85.77 1.12 Infosys Technologies Ltd. 82.51 1.08 Indian Petrochemicals Corporation Ltd. 82.15 1.08 Tata Consultancy Services Ltd. 81.21 1.06 United Phosphorous Ltd. 77.73 1.02 Novartis India Ltd. 75.45 0.99 Nucleus Software Exports Ltd. 70.26 0.92 Glaxosmithkline Pharmaceuticals Ltd. 69.73 0.91 Pfizer Ltd. 62.90 0.82 Larsen & Toubro Ltd. 55.98 0.73 Siemens Ltd. 54.11 0.71 Syndicate Bank 47.83 0.63 Subex Systems Ltd. 41.76 0.55 LIC Housing Finance Ltd. 39.51 0.52 Canara Bank 39.38 0.52 Satyam Computer Services Ltd. 34.55 0.45 Voltas Ltd. 34.13 0.45 IL&FS Investmart Ltd. 32.14 0.42 Automobile Corporation of Goa Ltd. 24.50 0.32
Securitised Debt 1591.03 20.86Ind Retail ABS Trust Ser XIII A3PTC** 890.52 11.68 MAAA(SO)BHPC Auto Sec Tr JUNE2005 A3 ** 511.24 6.70 AAA(SO)HDFC Bank Retail 2004 Sr 1 A2 (IL&FS)** 189.27 2.48 MAAA(SO)
Corporate Debt 1499.47 19.66Great Eastern Shipping Co. Ltd.** 477.89 6.27 AAAReliance Industries Ltd.** 474.48 6.22 AAAHindalco Industries Ltd.** 473.16 6.20 AAAElectrosteel Castings Ltd.** 73.95 0.97 AA+
Money Market Instruments 669.70 8.78Jammu & Kashmir Bank Ltd. 669.70 8.78 P1+
Mutual Fund Units 80.77 1.06Birla Fixed Term Debt Fund Ser 3 -18 B 50.52 0.66 Birla Fixed Term Debt Fund Ser 3 -36 B 30.26 0.40
Government Bond 43.32 0.57Govt Bond 9.39% 2011 43.32 0.57 Sovereign
Cash & Current Assets 332.43 4.36
**Represents thinly traded/ non traded securities and illiquid securities Total Percentage of thinly/non traded securities is 63.79%
Net Assets 7627.40 100.00
22
As on 31-October-2005
Asset Allocation
Maturity Profile
Asset Allocation
Rating Profile
0.57%
1.06%
4.36%
8.78%
19.66%
20.86%
21.44%
23.27%
0.00% 5.00% 10.00% 15.00% 20.00% 25.00%
Government Bond
Mutual Fund Units
Cash & Current Assets
Money Market Instruments
Corporate Debt
Securitised Debt
Equity
PSU/PFI Bonds/Banks
0.57%
0.97%
1.06%
4.36%
21.44%
71.60%
0.00% 10.00% 20.00% 30.00% 40.00% 50.00% 60.00% 70.00% 80.00%
Sovereign
AA
Mutual Fund Units
Cash & Current Assets
Equity
AAA
4.36%
5.25%
6.27%
15.00%
15.71%
21.44%
31.98%
0.00% 5.00% 10.00% 15.00% 20.00% 25.00% 30.00% 35.00%
Cash & Current Assets
Above 5 Years
3 Years To 5 Years
6 Months To 1 Years
Less Than 6 Months
Equity
1 Years To 3 Years
N O V E M B E R 2 0 0 5

Fund Managers' Speak - Birla Sun Life Monthly Income
Navneet Munot & Nishid Shah
! Average maturity of the debt component around 1.44 years in the fixed income portion.
! G-Sec exposure around 6% mainly concentrated in the mid segment of the yield curve.
! Equity exposure around 12% in a diversified portfolio of large and mid-cap stocks.
Issuer Wise Portfolio as of 31-October-2005
Issuer Market Value % to Net RatingRs. in. Lacs Assets
Floating Rate Instruments 4050.84 24.04Sterlite Industries (India) Ltd. 2000.00 11.87 P1+Industrial Development Bank of India Ltd 1045.66 6.21 AA+LIC Housing Finance Ltd. 1005.18 5.97 AAA
Corporate Debt 3634.26 21.57Kotak Mahindra Primus Ltd.** 1000.00 5.93 P1+Citicorp Finance (I) Ltd.** 997.17 5.92 AAATata Steel Limited** 911.41 5.41 AAAIndia Infrastructure Developers Limited ** 725.68 4.31 AA-
Money Market Instruments 2329.45 13.82Rabo India Finance Pvt. Ltd. 1333.82 7.92 P1+CMC Ltd. 497.93 2.96 A1+Rico Auto Industries Ltd. 497.70 2.95 A1+
EQUITY 1967.15 11.67Bajaj Auto Ltd. 153.47 0.91 United Breweries Holdings Ltd 133.52 0.79 Punjab National Bank 129.47 0.77 Infosys Technologies Ltd. 119.89 0.71 Bharti Tele-Ventures Ltd. 113.90 0.68 Hinduja TMT Ltd. 113.45 0.67 Bharat Heavy Electricals Ltd. 109.38 0.65 Container Corporation of India Ltd. 106.99 0.63 United Phosphorous Ltd. 103.76 0.62 Cadila Healthcare Ltd. 101.74 0.60 Indian Petrochemicals Corporation Ltd. 98.84 0.59 United Breweries Ltd 97.92 0.58 Gujarat Gas Co. Ltd. 91.64 0.54 Oriental Bank of Commerce 90.21 0.54 Tata Consultancy Services Ltd. 82.61 0.49 SPL Industries Ltd. 77.66 0.46 Jammu & Kashmir Bank Ltd. 77.45 0.46 Divis Laboratories Ltd. 57.84 0.34 Chennai Petroleum Corporation Ltd. 38.30 0.23 HCL Technologies Ltd. 38.02 0.23 Hero Honda Motors Ltd. 30.39 0.18 Alok Industries Ltd. 0.71 0.00
PSU/PFI Bonds/Banks 1485.65 8.82Power Finance Corporation Ltd.** 777.46 4.61 AAAIndian Railways Finance Corp. Ltd.** 408.87 2.43 AAAHousing Development Finance Corp. Ltd.** 299.32 1.78 AAA
Securitised Debt 1354.33 8.04Fleet Trust April 2004 Series** 392.50 2.33 AAA(SO)Fleet Trust July 2004 A2 Series** 284.92 1.69 AAA(SO)Goldstar Trust July 2004 A2 Series** 260.11 1.54 AAA(SO)Indian Retail ABS Trust SerXIII A3** 198.76 1.18 MAAA(SO)Goldstar Trust (CITI) 15 MARCH 2008** 152.19 0.90 AAA(SO)India MBS 2003 Series III Trust ** 32.89 0.20 AAA(SO)BHPC Auto Loan Securitisation Trust 2003** 17.54 0.10 MAAA(SO)Fleet Trust Oct 2003 A1 (CFIL) UTI Bank ** 15.43 0.09 AAA(SO)
Government Bond 1034.20 6.14Govt Bond 7.37% 2014 563.75 3.35 SovereignGovt Bond 8.07%2017 266.25 1.58 SovereignGovt Bond 7.27% 2013 204.20 1.21 Sovereign
Treasury Bills 165.82 0.98Treasury Bills 165.82 0.98 Sovereign
Cash & Current Assets 828.56 4.92
**Represents thinly traded/ non traded securities and illiquid securitiesTotal Percentage of thinly/non traded securities is 38.43%
Net Assets 16850.25 100.00
23
As on 31-October-2005
Birla Sun Life Monthly Income(Formerly Alliance Monthly Income)An open-ended fund. Monthly income is not assured and is subject to availability of distributable surplus
Maturity Profile
Rating Profile
Asset Allocation
0.98%
4.92%
6.14%
8.04%
8.82%
11.67%
13.82%
21.57%
24.04%
0.00% 5.00% 10.00% 15.00% 20.00% 25.00% 30.00%
Treasury Bills
Cash & Current Assets
Government Bond
Securitised Debt
PSU/PFI Bonds/Banks
Equity
Money Market Instruments
Corporate Debt
Floating Rate Instruments
4.92%
7.12%
10.51%
11.67%
65.77%
0.00% 10.00% 20.00% 30.00% 40.00% 50.00% 60.00% 70.00%
Cash & Current Assets
Sovereign
AA
Equity
AAA
4.92%
10.34%
11.69%
12.68%
19.00%
41.37%
0.00% 5.00% 10.00% 15.00% 20.00% 25.00% 30.00% 35.00% 40.00% 45.00%
Cash & Current Assets
6 Months To 1 Years
Equity
1 Years To 2 Years
Above 2 Years
Less Than 6 Months
N O V E M B E R 2 0 0 5

Birla Income PlusAn open-ended diversified income fund
Fund Managers' Speak - Birla Income Plus
Navneet Munot
! Average maturity around 2.82 years. ! Exposure to G-Secs is around 26%. ! Cash levels around 2%.
Issuer Wise Portfolio as of 31-October-2005
Issuer Market Value % to Net RatingRs. in. Lacs Assets
Debt Instruments
Government Bond 6902.04 25.85Govt Bond 7.37% 2014 3618.25 13.55 SovereignGovt Bond 7.55% 2010 2262.79 8.47 SovereignGovt Bond 7.27% 2013 1021.00 3.82 Sovereign
Corporate Debt 5684.65 21.29Hindalco Industries Ltd. ** 2477.35 9.28 AAAReliance Industries Ltd. ** 2002.98 7.50 AAAEssel Propack Ltd. ** 1000.00 3.74 UnratedGreat Eastern Shipping Co. Ltd. ** 204.32 0.77 AAA
Securitised Debt 5385.69 20.17AAWAS Trust MLS (PTC Series A) ** 3818.95 14.30 AAA(SO)Loan Sec Trust SrXII NTPC (ICICI) ** 830.79 3.11 LAAA(SO)BHPC Auto Sec Trust Jun 05 - Sr. A3 511.24 1.91 AAA(SO)Ind Retail ABS Trust Ser XIII A3PTC ** 98.95 0.37 MAAA(SO)Fleet Trust Aug-I 2003 Sr A2 (CFIL) ** 79.40 0.30 AAA(SO)Mumbai Auto Rec Tr 2003 SR I UTI SCB A2 ** 33.75 0.13 AAA(SO)HDFC Bank Retail 2004 Sr 1 A2 (IL&FS) ** 9.46 0.04 MAAA(SO)Secured Loan Rec.Sec.Trust Sr3 (ICICI) ** 3.15 0.01 MAAA(SO)
Money Market Instruments 3318.83 12.43Jammu & Kashmir Bank Ltd. 3318.83 12.43 P1+
Floating Rate Instruments 2914.75 10.91Housing Development Finance Corp. Ltd. 1519.54 5.69 LAAAIndian Retail ABS Trust SerXIII A3 993.14 3.72 MAAA(SO)LIC Housing Finance Ltd. 402.07 1.51 AAA
PSU/PFI Bonds/Banks 1993.45 7.46Indian Oil Corporation Ltd. ** 500.37 1.87 LAAACanara Bank ** 498.58 1.87 AAAPower Finance Corporation Ltd. ** 498.37 1.87 AAARural Electrification Corporation Ltd. ** 496.13 1.86 AAA
Cash & Current Assets 505.21 1.89
**Represents thinly traded/ non traded securities and illiquid securities Total Percentage of thinly/non traded securities is 48.92%
Net Assets 26704.62 100.00
24
@ICRA Online Awards 2005 : Ranked MFR1 in 'Open Ended Debt
Schemes (3 year)'
(Past performance is no guarantee of future results.)
@ for methodology please refer page 36
CNBC-TV 18- CRISIL MUTUAL FUND OF THE YEAR Awards^
Open-ended Income Fund
(Past performance is no guarantee of future results.)
^ for methodology please refer page 36
As on 31-October-2005
Rating Profile
Maturity Profile
Asset Allocation
1.89%
7.46%
10.91%
12.43%
20.17%
21.29%
25.85%
0.00% 5.00% 10.00% 15.00% 20.00% 25.00% 30.00%
Cash & Current Assets
PSU/PFI Bonds/Banks
Floating Rate Instruments
Money Market Instruments
Securitised Debt
Corporate Debt
Government Bond
1.89%
3.74%
25.85%
68.52%
0.00% 10.00% 20.00% 30.00% 40.00% 50.00% 60.00% 70.00% 80.00%
Cash & Current Assets
Unrated
Sovereign
AAA
1.89%
11.56%
15.32%
20.73%
21.10%
29.40%
0.00% 5.00% 10.00% 15.00% 20.00% 25.00% 30.00% 35.00%
Cash & Current Assets
1 Years To 3 Years
3 Years To 5 Years
Less Than 6 Months
Above 5 Years
6 Months To 1 Years
N O V E M B E R 2 0 0 5

Birla Sun Life Income Fund(Formerly Alliance Income Fund)
An open-end diversified Income Fund
Fund Managers' Speak - Birla Sun Life Income Fund
Navneet Munot
! Average maturity around 4.19 years.
! Exposure to G-Secs is around 25%.
! Cash levels around 3%.
Issuer Wise Portfolio as of 31-October-2005
Issuer Market Value % to Net RatingRs. in. Lacs Assets
Government Bond 1,199.07 25.34Govt Bond 10.25% 2021 627.60 13.26 SovereignGovt Bond 7.55% 2010 207.12 4.38 SovereignGovt Bond 8.07%2017 159.75 3.38 SovereignGovt Bond 7.37% 2014 102.50 2.17 SovereignGovt Bond 7.27% 2013 102.10 2.16 Sovereign
Money Market Instruments 952.73 20.13Rabo India Finance Pvt. Ltd. 952.73 20.13 P1+
PSU/PFI Bonds/Banks 797.60 16.85Power Finance Corporation Ltd.** 598.05 12.64 AAAHousing Development Finance Corp. Ltd.** 199.55 4.22 AAA
Corporate Debt 702.30 14.84India Infrastructure Developers Limited** 403.15 8.52 AA-Citicorp Finance (I) Ltd.** 299.15 6.32 AAA
Securitised Debt 620.84 13.12Goldstar Trust (CITI) MARCH 2008 ** 228.28 4.82 AAA(SO)Fleet Trust April 2004 Series ** 157.00 3.32 AAA(SO)India MBS 2003 Series III Trust ** 98.67 2.08 AAA(SO)BHPC Auto Loan Securitisation Trust 2003 ** 4.38 0.09 MAAA(SO)Indian Retail ABS Trust SerXIII A3 ** 132.51 2.80 MAAA(SO)
Floating Rate Instruments 300.00 6.34GE Capital Services India 300.00 6.34 AAA
Cash & Current Assets 159.87 3.38
**Represents thinly traded/ non traded securities and illiquid securitiesTotal Percentage of thinly/non traded securities is 44.81%
Net Assets 4,732.42 100.00
25
As on 31-October-2005
Maturity Profile
Rating Profile
Asset Allocation
3.38%
6.34%
13.12%
14.84%
16.85%
20.13%
25.34%
0.00% 5.00% 10.00% 15.00% 20.00% 25.00% 30.00%
Cash & Current Assets
Floating Rate Instruments
Securitised Debt
Corporate Debt
PSU/PFI Bonds/Banks
Money Market Instruments
Government Bond
3.38%
8.52%
25.34%
62.77%
0.00% 10.00% 20.00% 30.00% 40.00% 50.00% 60.00% 70.00%
Cash & Current Assets
AA
Sovereign
AAA
3.38%
10.81%
16.92%
25.93%
42.96%
0.00% 5.00% 10.00%15.00%20.00%25.00%30.00%35.00%40.00%45.00%50.00%
Cash & Current Assets
Less Than 6 Months
1 Years To 2 Years
6 Months To 1 Years
Above 2 Years
N O V E M B E R 2 0 0 5

Birla Gilt Plus An open-ended government securities scheme
Fund Managers' Speak - Birla Gilt Plus
Navneet Munot
! Average maturity of Regular Plan around 6.70 years and of PF Plan around 6.75 years.
! Average maturity of both plans has increased.
! Continuing to look at trading opportunities to enhance returns.
Issuer Wise Portfolio as of 31-October-2005
Issuer Market Value % to Net RatingRs. in. Lacs Assets
Liquid Plan
Treasury Bills 1,003.94 44.16Treasury Bills 1,003.94 44.16 Sovereign
Government Bond 527.58 23.20Govt Bond 11.90% 2007 527.58 23.20 Sovereign
Cash & Current Assets 742.13 32.64
PF PlanGovernment Bond 15,483.45 83.87Govt Bond 7.27% 2013 5,870.75 31.80 SovereignGovt Bond 7.55% 2010 4,142.40 22.44 SovereignGovt Bond 7.37% 2014 3,587.50 19.43 SovereignGovt Bond 10.25% 2021 1,882.80 10.20 Sovereign
Cash & Current Assets 2,978.80 16.13
Regular Plan
Government Bond 11,624.56 84.46Govt Bond 7.27% 2013 4,084.00 29.67 SovereignGovt Bond 7.55% 2010 3,210.36 23.32 SovereignGovt Bond 7.37% 2014 3,075.00 22.34 SovereignGovt Bond 10.25% 2021 1,255.20 9.12 Sovereign
Cash & Current Assets 2,139.39 15.54
Net Assets 2,273.65 100.00
Net Assets 18,462.25 100.00
Net Assets 13,763.95 100.00
26
@ICRA Online Awards 2005 : Ranked MFR1 in Open Ended Gilt Schemes -
Short Term (1 year)
(Past performance is no guarantee of future results.)
@ICRA Online Awards 2005 : Ranked MFR1 in Open Ended Gilt Schemes -
Short Term (3 year)
(Past performance is no guarantee of future results.)
@ for methodology please refer page 36 # for methodology please refer page 36
#***** -Value Research Rating- Birla Gilt Plus - Liquid Plan
(Past performance is no guarantee of future results.)
#**** -Value Research Rating- Birla Gilt Plus - Regular Plan
(Past performance is no guarantee of future results.)
As on 31-October-2005
Asset Allocation
Asset Allocation
Asset Allocation
Liquid Plan
PF Plan
Regular Plan
23.20%
32.64%
44.16%
0.00% 5.00% 10.00% 15.00% 20.00% 25.00% 30.00% 35.00% 40.00% 45.00% 50.00%
Government Bond
Cash & Current Assets
Treasury Bills
16.13%
83.87%
0.00% 10.00% 20.00% 30.00% 40.00% 50.00% 60.00% 70.00% 80.00% 90.00%
Cash & Current Assets
Government Bond
15.54%
84.46%
0.00% 10.00% 20.00% 30.00% 40.00% 50.00% 60.00% 70.00% 80.00% 90.00%
Cash & Current Assets
Government Bond
N O V E M B E R 2 0 0 5

Birla Sun Life Government Securities Fund(Formerly Alliance Government Securities Fund)
An open-ended government securities scheme
Fund Managers' Speak - BSLGSF- Long Term Plan
Navneet Munot
! Average maturity around 5.53 years.
! Cash levels are around 32%.
Issuer Wise Portfolio as of 31-October-2005
Issuer Market Value % to Net RatingRs. in. Lacs Assets
Government Bond 204.60 67.73Govt Bond 7.37% 2014 102.50 33.93 SovereignGovt Bond 7.27% 2013 102.10 33.80 Sovereign
Cash & Current Assets 97.46 32.27
Net Assets 302.06 100.00
27
As on 31-October-2005
Short Term Plan
Issuer Wise Portfolio as of 31-October-2005
Issuer Market Value % to Net RatingRs. in. Lacs Assets
Treasury Bills 48.77 64.49Treasury Bills 48.77 64.49 Sovereign
Cash & Current Assets 26.85 35.51
Net Assets 75.62 100.00
As on 31-October-2005
Navneet Munot
! Average maturity around 0.29 years.
! Continue to look at trading opportunities to enhance returns.
Fund Managers' Speak - BSLGSF - Short Term Plan
Long Term Plan
Maturity Profile
Rating Profile
Asset Allocation
Maturity Profile
Rating Profile
Asset Allocation
32.27%
67.73%
0.00% 10.00% 20.00% 30.00% 40.00% 50.00% 60.00% 70.00% 80.00%
Cash & Current Assets
Government Bond
32.27%
67.73%
0.00% 10.00% 20.00% 30.00% 40.00% 50.00% 60.00% 70.00% 80.00%
Cash & Current Assets
Sovereign
32.27%
67.73%
0.00% 10.00% 20.00% 30.00% 40.00% 50.00% 60.00% 70.00% 80.00%
Cash & Current Assets
Above 2 Years
35.51%
64.49%
0.00% 10.00% 20.00% 30.00% 40.00% 50.00% 60.00% 70.00%
Cash & Current Assets
Treasury Bills
35.51%
64.49%
0.00% 10.00% 20.00% 30.00% 40.00% 50.00% 60.00% 70.00%
Cash & Current Assets
Sovereign
35.51%
64.49%
0.00% 10.00% 20.00% 30.00% 40.00% 50.00% 60.00% 70.00%
Cash & Current Assets
Less Than 6 Months
N O V E M B E R 2 0 0 5

Birla Dynamic Bond FundAn open-ended income scheme
Issuer Wise Portfolio as of 31-October-2005
Issuer Market Value % to Net RatingRs. in. Lacs Assets
Government Bond 255.25 10.13Govt Bond 7.27% 2013 255.25 10.13 Sovereign
Cash & Current Assets 2264.71 89.87
Net Assets 2519.96 100.00
28
Fund Managers' Speak - Birla Dynamic Bond Fund
! Average maturity around 0.8 years.
! Portfolio has around 10% in G-Secs
! Cash levels around 90%.
Navneet Munot
Fund Managers' Speak - Birla Bond Index Fund
Satyabrata Mohanty
! Average maturity around 3.23 years.
! Asset allocation and the portfolio are in line with the CRISIL composite bond Index.
Issuer Wise Portfolio as of 31-October-2005
Issuer Market Value % to Net RatingRs. in. Lacs Assets
PSU/PFI Bonds/Banks 81.07 61.34Housing Development Finance Corp. Ltd. ** 40.98 31.01 AAAPower Finance Corporation Ltd.** 29.90 22.63 AAAOriental Bank of Commerce ** 10.18 7.71 AA+
Government Bond 36.03 27.27Govt Bond 7.37% 2014 20.50 15.51 SovereignGovt Bond 7.55% 2010 15.53 11.75 Sovereign
Cash & Current Assets 15.05 11.39
**Represents thinly traded/ non traded securities and illiquid securities Total Percentage of thinly/non traded securities is 61.34%
Net Assets 132.15 100.00
Birla Bond Index FundAn open-ended diversified income fund tracking theCRISIL Composite Bond Fund Index
Rating: "AAA(F)" - Crisil
As on 31-October-2005
As on 31-October-2005
Asset Allocation
Maturity Profile
Rating Profile
Rating Profile
Maturity Profile
Asset Allocation
10.13%
89.87%
0.00%10.00%20.00%30.00%40.00%50.00%60.00%70.00%80.00%90.00%100.00%
Government Bond
Cash & Current Assets
10.13%
89.87%
0.00%10.00%20.00%30.00%40.00%50.00%60.00%70.00%80.00%90.00%100.00%
Sovereign
Cash & Current Assets
10.13%
89.87%
0.00% 10.00%20.00% 30.00%40.00% 50.00% 60.00%70.00% 80.00%90.00%100.00%
Above 1 Years
Cash & Current Assets
11.39%
27.27%
61.34%
0.00% 10.00% 20.00% 30.00% 40.00% 50.00% 60.00% 70.00%
Cash & Current Assets
Government Bond
PSU/PFI Bonds/Banks
7.71%
11.39%
27.27%
53.64%
0.00% 10.00% 20.00% 30.00% 40.00% 50.00% 60.00%
AA
Cash & Current Assets
Sovereign
AAA
7.71%
11.39%
15.51%
31.01%
34.38%
0.00% 5.00% 10.00% 15.00% 20.00% 25.00% 30.00% 35.00% 40.00%
1 Years To 3 Years
Cash & Current Assets
Above 5 Years
Less Than 1 Years
3 Years To 5 Years
N O V E M B E R 2 0 0 5

Birla Bond PlusAn open-ended short term income fund
Fund Managers' Speak - Birla Bond Plus
Navneet Munot
! Average maturity around 1.03 years. Portfolio predominantly consists of corporate bonds in the 1-1.5 year maturity segment.
! Increased exposure to Certificate of Deposits (CD) of good banks.
! Continuing to look at opportunistic trading in short-end G-Secs to improve returns but in a controlled manner.
Issuer Wise Portfolio as of 31-October-2005
Issuer Market Value % to Net RatingRs. in. Lacs Assets
Debt Instruments
Money Market Instruments 9645.91 24.63HDFC Bank Ltd. 2448.59 6.25 P1+UCO Bank Ltd 2415.74 6.17 P1+Federal Bank Ltd. 2391.05 6.11 P1+State Bank of Travancore 1427.51 3.64 P1+Bhararat Overseas Bank 963.03 2.46 A1+
Corporate Debt 9032.59 23.06Mahindra & Mahindra Financial Ser Ltd.** 2999.98 7.66 AA+GE Capital Services India** 1999.57 5.11 AAACitiFinancial Consumer Finance (I) Ltd.** 1299.86 3.32 AAAReliance Industries Ltd.** 1024.00 2.61 AAAL & T Infrastructure Devp Projects Ltd.** 1007.26 2.57 AAA(SO)Hindalco Industries Ltd.** 512.31 1.31 AAACiticorp Finance (I) Ltd.** 139.60 0.36 AAANational Housing Bank** 50.00 0.13 AAA
PSU/PFI Bonds/Banks 7898.83 20.17National Bank for Agri & Rural Devp** 3809.51 9.73 AAAIndustrial Development Bank of India Ltd** 1682.90 4.30 AA+Housing Development Finance Corp. Ltd. 956.45 2.44 AAAPower Finance Corporation Ltd.** 551.25 1.41 AAAIndian Oil Corporation Ltd.** 500.37 1.28 LAAAPower Grid Corporation of India Ltd.** 398.36 1.02 AAA
Floating Rate Instruments 4529.51 11.57Housing Development Finance Corp. Ltd. 2026.05 5.17 LAAAICICI Bank Ltd. 1000.00 2.55 AAAICICI Bank Ltd. 503.66 1.29 LAAAICICI Securities Ltd. 500.00 1.28 AAAGruh Finance Ltd 499.80 1.28 AA
Securitised Debt 4107.40 10.49UBL Trust Series 10 (A3)** 1863.35 4.76 AAA(SO)Loan Sec Trust SrXII NTPC (ICICI)** 1107.72 2.83 LAAA(SO)Ind Retail ABS Trust Ser XIII A3PTC** 692.63 1.77 MAAA(SO)Loan Receivable Trust II 2003 (Guj Amb)** 371.89 0.95 AAA(SO)VE Trust 4 Sr A1 MMFSL (UTI Bank)** 71.80 0.18 AAA(SO)
Treasury Bills 475.16 1.21Treasury Bills 475.16 1.21 Sovereign
Cash & Current Assets 3474.90 8.87
**Represents thinly traded/ non traded securities and illiquid securities Total Percentage of thinly/non traded securities is 51.28%
Net Assets 39164.30 100.00
29^ for methodology please refer page 36
CNBC-TV 18- CRISIL MUTUAL FUND OF THE YEAR Awards^
Open-ended Income Short Term Fund
(Past performance is no guarantee of future results.)
As on 31-October-2005
Maturity Profile
Rating Profile
Asset Allocation
1.21%
8.87%
10.49%
11.57%
20.17%
23.06%
24.63%
0.00% 5.00% 10.00% 15.00% 20.00% 25.00% 30.00%
Treasury Bills
Cash & Current Assets
Securitised Debt
Floating Rate Instruments
PSU/PFI Bonds/Banks
Corporate Debt
Money Market Instruments
1.21%
8.87%
13.23%
76.68%
0.00% 10.00% 20.00% 30.00% 40.00% 50.00% 60.00% 70.00% 80.00% 90.00%
Sovereign
Cash & Current Assets
AA
AAA
8.87%
10.54%
17.01%
27.77%
35.80%
0.00% 5.00% 10.00% 15.00% 20.00% 25.00% 30.00% 35.00% 40.00%
Cash & Current Assets
Less Than 3 Months
3 Months To 6 Months
6 Months To 1 Years
Above 1 Years
N O V E M B E R 2 0 0 5

Birla Sun Life Short Term Fund(Formerly Alliance Short Term Fund)
An open Ended Short Term Income Scheme
Fund Managers' Speak - Birla Sun Life Short Term Fund
Navneet Munot
! Average maturity around 0.45 years.
! ·Continuing to look at trading opportunities to enhance returns.
Issuer Wise Portfolio as of 31-October-2005
Issuer Market Value % to Net RatingRs. in. Lacs Assets
Treasury Bills 273.11 88.03
Treasury Bills 273.11 88.03 Sovereign
PSU/PFI Bonds/Banks 41.15 13.26Industrial Development Bank of India Ltd ** 41.15 13.26 AA+
Cash & Current Assets -4.03 -1.30
**Represents thinly traded/ non traded securities and illiquid securitiesTotal Percentage of thinly/non traded securities is 13.26%
Net Assets 310.24 100.00
30
As on 31-October-2005
Maturity Profile
Rating Profile
Asset Allocation
-1.30%
13.26%
88.03%
-10.00% 0.00% 10.00%20.00%30.00%40.00%50.00%60.00%70.00%80.00%90.00%100.00%
Cash & Current Assets
PSU/PFI Bonds/Banks
Treasury Bills
-1.30%
13.26%
88.03%
-10.00% 0.00% 10.00%20.00% 30.00% 40.00%50.00% 60.00% 70.00% 80.00% 90.00%100.00%
Cash & Current Assets
AA
Sovereign
-1.30%
101.30%
-20.00% 0.00% 20.00% 40.00% 60.00% 80.00% 100.00% 120.00%
Cash & Current Assets
Less Than 6 Months
N O V E M B E R 2 0 0 5

Fund Managers' Speak - Floating Rate Fund
Satyabrata Mohanty
! Weightage to instruments related to Reuters INBMK (G-sec Benchmark yield) increased.
! Average maturity of the Short Term Plan is 0.21 years and of the Long Term Plan is 0.32 years.
! Fund is a good investment option in times of interest rate volatility.
Birla Floating Rate Fund - Long Term PlanIssuer Wise Portfolio as of 31-October-2005
UTI Bank Ltd. 1504.34 1.65 LAA+Indian Oil Corporation Ltd. 1500.00 1.65 LAAAHousing & Urban Developement Corp. Ltd. 1300.47 1.43 AAInfrastructure Development Fin. Co. Ltd. 1002.99 1.10 AAABajaj Auto Finance Ltd. 1002.82 1.10 AA+Cholamandalam Investments & Fin Co. Ltd. 1000.00 1.10 MAA+Gruh Finance Ltd 999.60 1.10 AASundaram Finance Ltd 900.00 0.99 P1+Indian Retail ABS Tr Ser XXIII A1 830.23 0.91 P1+(SO)Asset Securitisation Trust Dec2004 IV A6 647.55 0.71 AAA(SO)ICICI Bank Ltd. 503.66 0.55 LAAACitiFinancial Consumer Finance (I) Ltd. 501.49 0.55 AAAICICI Securities Ltd. 500.00 0.55 P1+Cholamandalam Investments & Fin Co. Ltd. 500.00 0.55 LAA
Money Market Instruments 9105.17 10.00Federal Bank Ltd. 2391.05 2.63 P1+Kotak Mahindra Primus Ltd. 2358.96 2.59 P1+ABN Amro Bank 2357.60 2.59 P1+Rabo India Finance Pvt. Ltd. 1997.56 2.19 P1+
Corporate Debt 3500.00 3.84Punjab Tractors Ltd.** 2500.00 2.75 P1+Canbank Factors Ltd.** 1000.00 1.10 P1+
Securitised Debt 2170.99 2.38BHPC Auto Sec Tr JUN2003 A1 Telco** 2170.99 2.38 AAA(SO)
PSU/PFI Bonds/Banks 1532.00 1.68Industrial Development Bank of India Ltd** 1532.00 1.68 AA+
Cash & Current Assets 6193.13 6.80
**Represents thinly traded/ non traded securities and illiquid securities Total Percentage of thinly/non traded securities is 7.91%
Net Assets 91067.67 100.00
Issuer Market Value % to Net RatingRs. in. Lacs Assets
Birla Floating Rate FundAn open-ended income scheme investing primarily in floating rate debt instruments
Issuer Market Value % to Net RatingRs. in. Lacs Assets
BIRLA FLOATING RATE FUND - LONG TERM PLANDebt InstrumentsFloating Rate Instruments 43275.31 81.97
Housing Development Finance Corp. Ltd. 7026.50 13.31 AAA
GE Capital Services India 4030.63 7.63 AAA
Industrial Development Bank of India Ltd 3086.55 5.85 AA+
Housing Development Finance Corp. Ltd. 3039.08 5.76 LAAA
UTI Bank Ltd. 2507.23 4.75 LAA+
Housing & Urban Developement Corp. Ltd. 2501.47 4.74 AA
National Housing Bank 2498.71 4.73 AAA
Citicorp Finance (I) Ltd. 2016.75 3.82 AAA
Infrastructure Development Fin. Co. Ltd. 2005.98 3.80 AAA
LIC Housing Finance Ltd. 1509.87 2.86 AAA
Bajaj Auto Finance Ltd. 1504.23 2.85 AA+
ICICI Bank Ltd. 1502.78 2.85 AAA
Export-Import Bank of India 1501.82 2.84 AAA
Indian Retail ABS Trust SerXIII A3 1489.72 2.82 MAAA(SO)
Cholamandalam Investments & Fin Co. Ltd. 1000.00 1.89 LAA
Gruh Finance Ltd 999.60 1.89 AA
Fleet Trust Jan 2005 SrsA2 PTC(ILFS) 934.62 1.77 AAA(SO)
Secured Loan Rec.Sec.Trust Sr3 (ICICI) 883.32 1.67 LAAA(SO)
Fleet Trust Jan2004 Series A5 775.21 1.47 AAA(SO)
Sundaram Finance Limited 502.79 0.95 MAAA
CitiFinancial Consumer Finance (I) Ltd. 501.49 0.95 AAA
Rabo India Finance Pvt. Ltd. 501.15 0.95 AAA
Mahindra & Mahindra Financial Ser Ltd. 500.00 0.95 AA+
Indian Retail ABS Tr Ser XXIII A1 355.81 0.67 P1+(SO)
Sundaram Finance Limited 100.00 0.19 P1+
Securitised Debt 5002.42 9.48
Indian Retail ABS SerXXV A2(WITECL)** 2513.88 4.76 AAA(SO)
Indian Retail Abs Trust Sr XXXIII A2** 1440.69 2.73 AAA(SO)
UBL Trust Series 10 (A3)** 976.04 1.85 AAA(SO)
VE Trust 4 Sr A1 MMFSL (UTI Bank)** 71.80 0.14 AAA(SO)
Money Market Instruments 2866.12 5.43
ABN Amro Bank 2357.60 4.47 P1+
Jindal Steel & Power Ltd. 498.53 0.94 A1+
ICICI Bank Ltd. 9.99 0.02 A1+
PSU/PFI Bonds/Banks 696.11 1.32
National Bank for Agri & Rural Devp** 696.11 1.32 AAA
Cash & Current Assets 951.70 1.80
**Represents thinly traded/ non traded securities and illiquid securities
Total Percentage of thinly/non traded securities is 10.80%
Net Assets 52791.65 100.00
Birla Floating Rate Fund - Short Term PlanIssuer Wise Portfolio as of 31-October-2005
Issuer Market Value % to Net RatingRs. in. Lacs Assets
BIRLA FLOATING RATE FUND - SHORT TERM PLANDebt InstrumentsFloating Rate Instruments 68566.37 75.29Housing Development Finance Corp. Ltd. 11529.28 12.66 AAAIndustrial Development Bank of India Ltd 6556.22 7.20 AA+LIC Housing Finance Ltd. 4724.97 5.19 AAAMahindra & Mahindra Financial Ser Ltd. 4006.28 4.40 AA+Export-Import Bank of India 4005.26 4.40 AAAGE Capital Services India 3700.00 4.06 AAAHousing Development Finance Corp. Ltd. 3545.59 3.89 LAAACiticorp Finance (I) Ltd. 3005.63 3.30 AAANational Housing Bank 3000.00 3.29 AAASundaram Finance Ltd 2500.00 2.75 MAAAUnited Phosphorous Ltd. 2500.00 2.75 AA-ICICI Bank Ltd. 2500.00 2.75 AAAKotak Mahindra Primus Ltd. 2300.00 2.53 MAA+Dewan Housing Finance Corporation Ltd 2000.00 2.20 AA
Birla Floating Rate Fund - Short Term Plan Issuer Wise Portfolio as of 31-October-2005 (Contd.)
31
#**** -Value Research Rating- Birla FRF - Long Term Plan
(Past performance is no guarantee of future results.)
# for methodology please refer page 36
Long Term Plan
Short Term Plan
Asset Allocation
Asset Allocation
1.32%
1.80%
5.43%
9.48%
81.97%
0.00% 10.00% 20.00% 30.00% 40.00% 50.00% 60.00% 70.00% 80.00% 90.00%
PSU/PFI Bonds/Banks
Cash & Current Assets
Money Market Instruments
Securitised Debt
Floating Rate Instruments
1.68%
2.38%
3.84%
6.80%
10.00%
75.29%
0.00% 10.00% 20.00% 30.00% 40.00% 50.00% 60.00% 70.00% 80.00%
PSU/PFI Bonds/Banks
Securitised Debt
Corporate Debt
Cash & Current Assets
Money Market Instruments
Floating Rate Instruments
N O V E M B E R 2 0 0 5

Fund Managers' Speak - Birla Cash Plus
Navneet Munot
! Average maturity around 88 days.
! Continue to look at yield pick up by investing in top quality unrated/AA/AA+ short term papers to improve the portfolio yield.
! Ensuring at least 75% of the portfolio invested in AAA/P1+/call money/repo at any point in time.
Issuer Wise Portfolio as of 31-October-2005
Issuer Wise Portfolio as of 31-October-2005 (Contd.)
Swaraj Mazda Ltd. ** 1500.00 0.47 P1+Citicorp Maruti Finance Ltd. ** 1499.79 0.47 P1+Infrastructure Development Fin. Company ** 1330.16 0.42 CARE AAACiticorp Finance (I) Ltd. ** 1001.58 0.32 AAAThe Associated Cement Companies Ltd. ** 1000.35 0.32 UNRATEDElectrosteel Castings Ltd. ** 1000.00 0.32 UNRATEDSwaraj Engines Ltd. ** 1000.00 0.32 P1+Gujarat Ambuja Cements Ltd. ** 900.45 0.28 AA+Sundaram Finance Ltd ** 500.36 0.16 P1+Citicorp Maruti Finance Ltd. ** 500.26 0.16 AAATata Sons Ltd. ** 500.20 0.16 AAADCM Shriram Consolidated Ltd. ** 500.00 0.16 A1+Tube Investment of India Ltd. ** 500.00 0.16 P1+Sundaram Finance Ltd. ** 499.98 0.16 MAAA
PSU/PFI Bonds/Banks 20846.31 6.58Industrial Development Bank of India ** 7329.46 2.31 AA+Power Finance Corp. Ltd. ** 5018.19 1.58 AAAExport-Import Bank of India ** 3500.00 1.11 AAANational Bank for Agri. & Rural Devt. ** 2499.51 0.79 P1+National Bank for Agri. & Rural Devt. ** 1504.73 0.48 AAAHousing Development Finance Corp. Ltd. ** 994.42 0.31 AAA
Cash & Current Assets 7269.74 2.30
**Represents thinly traded/ non traded securities and illiquid securities Total Percentage of thinly/non traded securities is 38.61%
Net Assets 316723.35 100.00
Issuer Market % to Net RatingValue Assets
Birla Cash PlusAn open-ended high liquidity fund investingin short term debt and money market instruments
Issuer Market Value % to Net RatingRs. in. Lacs Assets
Floating Rate Instruments 97017.30 30.63Housing Development Finance Corp. Ltd. 16498.70 5.21 AAANational Housing Bank 12000.00 3.79 AAARanbaxy Holding Company. 10000.00 3.16 AAIndian Oil Corporation Ltd. 8500.00 2.68 LAAAHousing Development Finance Corp. Ltd. 7091.18 2.24 LAAA(SO)UBL Trust Sr 16 5012.58 1.58 AA(SO)Housing & Urban Developement Corp. Ltd. 5000.00 1.58 PR1+Citicorp Finance (I) Ltd. 4505.63 1.42 AAASundaram Finance Ltd 4000.00 1.26 P1+Mahindra & Mahindra Financial Ser. Ltd. 3000.60 0.95 AA+Gujarat Glass Ltd. 3000.00 0.95 UNRATEDCiti Financial Consumer Finance (I) Ltd. 2001.61 0.63 AAABlue Star Ltd. 2000.00 0.63 AAAICICI Bank Ltd. 2000.00 0.63 PR1+Indian Ret ABS Ser XXXII - Pac Sr 1896.19 0.60 LAAA(SO)GE Capital Services India Ltd 1800.00 0.57 AAACholamandalam Investments & Finance Ltd. 1500.29 0.47 LAASundaram Finance Ltd 1500.00 0.47 MAAAICICI Bank Ltd. 1007.32 0.32 LAAAICICI Bank Ltd. 1001.86 0.32 CARE AAAHousing & Urban Developement Corp. Ltd. 1001.60 0.32 F1+Raymond Ltd. 1000.00 0.32 PR1+Motherson Sumi Systems Ltd. 500.00 0.16 AA+Union Bank of India 500.00 0.16 A1+National Housing Bank 499.74 0.16 AAAKotak Mahindra Primus Ltd. 200.00 0.06 P1+
Money Market Instruments 90145.02 28.46Indusind bank 13833.56 4.37 P1+State Bank of Indore 9009.45 2.84 P1+Jammu & Kashmir Bank Ltd. 7210.10 2.28 P1+Housing Development Finance Corp. Ltd. 6952.51 2.20 P1+HDFC Bank Ltd. 5872.91 1.85 P1+State Bank of Bikaner and Jaipur 4864.99 1.54 A1+Uco Bank 4839.31 1.53 P1+Export-Import Bank of India 4809.23 1.52 P1+National Housing Bank 3978.23 1.26 P1+Mahindra & Mahindra Financial Ser. Ltd. 2983.85 0.94 P1+Yes Bank Ltd. 2488.80 0.79 A1+Eicher Motors Ltd. 2452.15 0.77 A1+Federal Bank 2391.05 0.75 P1+Blue Dart Express Limited 1975.84 0.62 F1+Karnataka Bank Ltd 1924.00 0.61 A1+State Bank of Patiala 1896.73 0.60 A1+Kotak Mahindra Bank Ltd. 1598.43 0.50 P1+Ballarpur Industries Ltd. 1468.31 0.46 F1+Industrial Development Bank of India 1456.19 0.46 P1+Bharat Overseas Bank 1444.55 0.46 A1+Shree Cements Ltd. 998.94 0.32 PR1+Jindal Steel & Power Ltd 998.80 0.32 P1+Bajaj Auto Finance Ltd. 997.82 0.32 P1+Apollo Tyres Ltd. 997.79 0.32 P1+Supreme Industries Ltd. 988.98 0.31 P1Kotak Mahindra Primus Ltd. 986.13 0.31 P1+DIC India Ltd 398.41 0.13 P1+ICICI Bank Ltd. 212.73 0.07 A1+Rabo India Finance Pvt. Ltd. 95.27 0.03 P1+GE Countrywide Consumer Fin Ser Ltd. 19.97 0.01 P1+
Securitised Debt 64711.56 20.43Indian Retail ABS Trust Sr 44 ** 19538.63 6.17 AAAIndian Retail ABS Trust Sr 42 ** 10018.61 3.16 P1+ITI October 2005 Trust - (ILFS) ** 5017.43 1.58 LAAIndiaRetail ABS Tr44 ** 4713.69 1.49 AAA(SO)Retail Trust Sept. 2004 Sr-A3 (Citi) ** 3612.59 1.14 AAA(SO)UBL Trust Series 12 - A1 (27-Mar-2006) ** 3503.68 1.11 AAA(SO)India Loan Sec Sr IV 15Apr08 ** 3288.18 1.04 AAA(SO)Indian Retail ABS Trust Sr. XXXIV (A1) ** 3238.99 1.02 P1+(SO)India Loan Sec Sr IV 15JUN6 ** 3210.39 1.01 P1+(SO)Bhpc Auto Securitisation Trust Sept A2 ** 2996.01 0.95 LAAAIndian Retail Abs Trust Sr 49 (A2) ** 1633.37 0.52 P1+Retail Trust 2004 Ser. III A3(HDFC Bank) ** 1331.86 0.42 AAA(SO)Retail Trust 2004 Ser. III A1(HDFC Bank) ** 1126.57 0.36 AAA(SO)Ind Ret ABS Tr Sr. XXXI -18 Dec5 (ICICI) ** 1071.55 0.34 AAA(SO)UBL Ser. 11 Senior PTC Ser. A1 (UTI BK) ** 410.03 0.13 AAA(SO)
Corporate Debt 36733.42 11.60Bajaj Hindusthan Ltd. ** 5500.00 1.74 F1+Larsen & Toubro Finance Ltd. ** 3500.00 1.11 UNRATEDRanbaxy Holding Company. ** 2501.57 0.79 UNRATEDGE Capital Services India Ltd ** 2500.00 0.79 AAAUnited Phosphorus Ltd ** 2500.00 0.79 UNRATEDBallarpur Industries Ltd. ** 2498.96 0.79 F1+Motherson Sumi Systems Ltd. ** 2000.00 0.63 A1+Citi Financial Consumer Finance (I) Ltd. ** 1999.77 0.63 AAACanbank Factors Ltd. ** 1500.00 0.47 UNRATED
32
+'mfAAA' by ICRAThe grading has been assigned by ICRA and indicates highest quality. The investment quality is similar to that of fixed income obligations of highest safety and with maturity corresponding upto 1 year. This grading should however, not be construed as an indication of the performance of the Mutual Fund scheme or of volatility in its returns.
^^ for methodology please refer page 36
CRISIL~CPR 2 Open Ended Liquid Category^^
(Past performance is no guarantee of future results.)
Asset Allocation
Rating Profile
2.30%
6.58%
11.60%
20.43%
28.46%
30.63%
0.00% 5.00% 10.00% 15.00% 20.00% 25.00% 30.00% 35.00%
Cash & Current Assets
PSU/PFI Bonds/Banks
Corporate Debt
Securitised Debt
Money Market Instruments
Floating Rate Instruments
2.30%
4.74%
10.81%
82.15%
0.00% 10.00% 20.00% 30.00% 40.00% 50.00% 60.00% 70.00% 80.00% 90.00%
Cash & Current Assets
Unrated
AA
AAA
N O V E M B E R 2 0 0 5
#**** -Value Research Rating- Birla Cash Plus
(Past performance is no guarantee of future results.)
# for methodology please refer page 36

Birla Sun Life Cash Manager(Formerly Alliance Cash Manager)
An open Ended Liquid Scheme
Fund Managers' Speak - Birla Sun Life Cash Manager
Navneet Munot
! Average maturity around 88 days.
! Fund has a high exposure to certificate of deposits and floating rate notes
Issuer Wise Portfolio as of 31-October-2005
Issuer Market Value % to Net RatingRs. in. Lacs Assets
Floating Rate Instruments 19499.90 59.68Sundaram Finance Ltd. 4000.00 12.24 P1+Raymond Ltd. 2300.00 7.04 PR1+Mahindra & Mahindra Financial Services Ltd. 2000.00 6.12 P1+CitiFinancial Consumer Finance (I) Ltd. 1999.63 6.12 AAARabo India Finance Pvt. Ltd. 1500.26 4.59 P1+Berger Paints India Ltd. 1500.00 4.59 P1+Kotak Mahindra Primus Ltd. 1500.00 4.59 P1+Citicorp Finance (I) Ltd. 1500.00 4.59 AAAICICI Bank Ltd. 1000.00 3.06 AAASundaram Finance Ltd. 1000.00 3.06 MAAAGlobal Trade Finance Ltd. 1000.00 3.06 P1+GE Capital Services India 200.00 0.61 AAA
Money Market Instruments 11186.15 34.24UCO Bank Ltd. 2898.75 8.87 P1+Industrial Development Bank of India Ltd. 1942.66 5.95 P1+Industrial Development Bank of India Ltd. 1449.35 4.44 A1+Rabo India Finance Pvt. Ltd. 1436.04 4.39 P1+Kotak Mahindra Bank Ltd. 1427.63 4.37 P1+Export-Import Bank of India 1064.60 3.26 P1+Jammu & Kashmir Bank Ltd. 967.13 2.96 P1+
Corporate Debt 1592.18 4.87Tata Power Co. Ltd. ** 889.90 2.72 AAAKotak Mahindra Primus Ltd. ** 500.00 1.53 P1+Lafarge India Ltd. ** 202.29 0.62 AA-
Securitised Debt 151.02 0.46Goldstar Trust July 2004 A1 ** 150.05 0.46 AAA(SO)Indian Retail ABS TRUST Series II ICICI ** 0.97 0.00 AAA(SO)
Cash & Current Assets 245.15 0.75
**Represents thinly traded/ non traded securities and illiquid securities Total Percentage of thinly/non traded securities is 5.34%
Net Assets 32674.41 100.00
33
As on 31-October-2005
Maturity Profile
Rating Profile
Asset Allocation
0.46%
0.75%
4.87%
34.24%
59.68%
0.00% 10.00% 20.00% 30.00% 40.00% 50.00% 60.00% 70.00%
Securitised Debt
Cash & Current Assets
Corporate Debt
Money Market Instruments
Floating Rate Instruments
0.62%
0.75%
98.63%
0.00% 20.00% 40.00% 60.00% 80.00% 100.00% 120.00%
AA
Cash & Current Assets
AAA
0.75%
34.69%
64.56%
0.00% 10.00% 20.00% 30.00% 40.00% 50.00% 60.00% 70.00%
Cash & Current Assets
6 Months To 1 Years
Less Than 6 Months
N O V E M B E R 2 0 0 5#**** -Value Research Rating
- Birla Sun Life Cash Manager(Past performance is no guarantee of future results.)
# for methodology please refer page 36

Fund Managers' Speak - Birla Asset Allocation Fund
Jayashankar Madhavan
Issuer Wise Portfolio as of 31-October-2005
Birla Asset Allocation FundAn open-ended 'Fund of Funds' Scheme
Market Value % to NetRs. In Lacs Assets
Mutual Fund Units 772.30 98.84
Birla MNC Plan 217.36 27.82
Birla Sun Life Basic Industries Fund 109.25 13.98
Birla Advantage Fund 107.93 13.81
Birla Dynamic Bond Fund - Retail Growth 104.95 13.43
Birla Bond Plus 55.93 7.16
Birla Generation Next Fund 55.49 7.10
Birla Index Fund 53.62 6.86
Birla Midcap Fund 30.54 3.91
Birla Floating Rate Short Term - Growth 20.55 2.63
Birla Gilt Plus Inv - Growth 16.68 2.14
Birla Gilt Plus Liquid Plan 0.01 0.00
Cash & Current Assets 9.06 1.16
Net Assets 781.36 100.00
34
Aggressive Plan
Market Value % to NetRs. In Lacs Assets
Mutual Fund Units 595.68 98.44
Birla Dynamic Bond Fund - Retail Growth 165.85 27.41
Birla MNC Plan 122.38 20.22
Birla Sun Life Basic Industries Fund 78.74 13.01
Birla Cash Plus Institutional Growth 71.05 11.74
Birla Generation Next Fund 67.46 11.15
Birla Floating Rate Short Term - Growth 34.78 5.75
Birla Index Fund 32.17 5.32
Birla Midcap Fund 23.24 3.84
Cash & Current Assets 9.46 1.56
Net Assets 605.14 100.00
Moderate Plan
Market Value % to NetRs. In Lacs Assets
Mutual Fund Units 690.79 97.43
Birla Cash Plus Institutional Growth 244.19 34.44
Birla Dynamic Bond Fund - Retail Growth 210.49 29.69
Birla Floating Rate Short Term - Growth 71.54 10.09
Birla Advantage Fund 60.34 8.51
Birla Index Fund 36.56 5.16
Birla Sun Life Basic Industries Fund 27.31 3.85
Birla MNC Plan 26.83 3.78
Birla Midcap Fund 13.53 1.91
Cash & Current Assets 18.20 2.57
Net Assets 708.99 100.00
Conservative Plan
Aggressive Plan
! One-year performance of 32.44% was marginally lower than comparable pure equity index’s (Nifty) return of 32.68%.
! However, monthly return for Oct 05 was (4.91%) better than Nifty’s performance of (8.86%) for the same period establishing the downside protection of the Fund.
Moderate Plan
! Plan outperformed benchmark on 1year basis as well, for the month of Oct 05.
! 1 year Performance: 24.76% Crisil Balanced Fund Index 21.66%
! One month performance: -3.51% Crisil Balanced Fund Index: -5.21%
Conservative Plan
! Annual return (1 year: 12.72%) better than benchmar’s performance of 9.75%.
! However for the month of Oct 05, the Fund under-performed benchmark by 0.41% (The Fund: 1.45% Crisil MIP Index: -1.04%) due to volatility in the debt market.
As on 31-October-2005
#***** -Value Research Rating- BAAF - Conservative Plan
(Past performance is no guarantee of future results.)
# for methodology please refer page 36
Asset Allocation
Asset Allocation
Asset AllocationAggressive Plan
Moderate Plan
Conservative Plan
98.84%
1.16%
0.00% 20.00% 40.00% 60.00% 80.00% 100.00% 120.00%
Cash & Current Assets
Mutual Fund Units
1.56%
98.44%
0.00% 20.00% 40.00% 60.00% 80.00% 100.00% 120.00%
Cash & Current Assets
Mutual Fund Units
2.57%
97.43%
0.00% 20.00% 40.00% 60.00% 80.00% 100.00% 120.00%
Cash & Current Assets
Mutual Fund Units
N O V E M B E R 2 0 0 5

India Advantage Fund Ltd.India dedicated offshore investment opportunity(For Non-Resident Indians and eligible foreign nationals)
Issuer Wise Portfolio as of 31-October-2005
Issuer Sector Market % to NetValue Assets
TOP 20 EQUITY INVESTMENTS State Bank Of India Banks 8,592,619 7.64Bharti Televentures Ltd. Telecom-Services 8,012,265 7.13Hero Honda Ltd. Auto 5,827,077 5.18Mcdowell & Company Limited Consumer Non Durables 5,440,221 4.84ITC Ltd. Consumer Non Durables 5,083,808 4.52United Phosphorus Ltd. Pesticides 4,982,472 4.43Indian Petrochemical Corp. Ltd. Chemicals 4,744,350 4.22Indian Hotels Co Ltd. Hotels 4,581,755 4.08Tata Consultancy Services Ltd Software 4,312,863 3.84Pfizer India Ltd. Pharmaceuticals 4,011,068 3.57Larsen & Toubro Ltd. Construction & Engineering 3,968,586 3.53Infosys Technologies Ltd. Software 3,422,486 3.04Glaxo Smithkline Pharma Ltd. Pharmaceuticals 3,366,362 2.99Siemens Ltd. Industrial Capital Goods 3,210,001 2.86Syndicate Bank Ltd. Banks 2,911,592 2.59Satyam Computers Services Ltd. Software 2,630,570 2.34Mastek Ltd. Software 2,551,298 2.27LIC Housing Finance Ltd. Finance 2,498,714 2.22Novartis Pharma Ltd. Pharmaceuticals 2,495,078 2.22Canara Bank Banks 2,307,200 2.05
Total of top 20 Equity Holdings 84,950,385 75.5780
Other Equity Investments 23,893,874 21.77
Total Equity Holdings 108,844,259 97.35
CALL & CALL EQUIVALENTS :Cash and Cash Equivalent 3,389,315 3.02
CORPORATE DEBT :Trent Ltd 167,374 0.15
TOTAL 112,400,949 100.00
OTHER NET ASSETS (SUB FUND) 100,058
OTHER NET ASSETS (MAIN FUND) (0.00)
Investment via sub-fund, India Advantage (Offshore) Fund, are stated at market/fair value at the date of determination. Securities listed on a recognised stock exchange are valued at the last quoted closing price on the principal exchange on which the security istraded Non-traded securities are valued at amortised cost and/or fair value as determined in good faith by Birla Sun Life Asset Management Company Limited, India, Conversion Rate: 1 USD = INR 45.10
NET ASSETS 112,501,006.38
Fund Manager's Speak - India Advantage Fund
Nishid Shah
! Realigned allocation in banks & pharmaceuticals.
! Vodafone's re entry in India boosts the confidence of the immense growth potential in the Indian telecom industry. Maintained overweight in telecom.
! Overall raised cash levels & increased exposure in IT in view of sustained growth & favorable dollar rupee movement.
Investment Performance (in%)
1 Year Returns are Absolute Returns. 2 Year, 3 Year, 5 Year and Since Inception Returns are Compounded Annualised Growth Rates (CAGR) Returns.
Bloomberg Ticker Code: INDADVC MP* For methodology refer page 36
S&P Fund Management Rating: 'A'*
Birla Sun Life AMC (Mauritius) Limited India Advantage Fundawarded 1st Place in the Standard & Poor's Five Years
Offshore Funds Equity India Sector out of 11 funds
2004 @@
2004
@@ for methodology please refer page 36
(Past performance is no guaranteeof future results.)
3rd consecutive award since 2002.
NAV($/UNIT)
107.27
1 year 2 Years 3 Years 5 Years Since Inception20-Aug-96
Compounded Annualized Returns India Advantage Fund Ltd. 47.51 46.48 71.24 27.24 29.10
Sensex 39.14 26.78 38.79 16.28 9.88
MSCI 35.20 24.78 38.36 15.21 8.27
35
Asset Allocation 31-October-2005
0.15%1.02%
2.01%2.41%
3.02%3.53%3.78%3.80%3.85%
4.08%4.22%
6.06%6.66%
7.13%11.00%11.03%
12.95%13.32%
0.00% 2.00% 4.00% 6.00% 8.00% 10.00% 12.00% 14.00%
Trent Ltd. - Warrants Fertilisers
Petroleum ProductsAuto Ancillaries
Cash and Cash EquivalentConstruction & Engineering
HardwareFinance
Industrial Capital GoodsHotels
ChemicalsPesticides
AutoTelecom-Services
Consumer Non DurablesPharmaceuticals
BanksSoftware
N O V E M B E R 2 0 0 5

# Value Research RankingsValue Research Fund Ratings are a composite measure of historical risk-adjusted returns. In the case of equity and hybrid funds this rating is based on the weighted average monthly returns for the last 3 and 5-year periods. In the case of debt funds this rating is based on the weighted average weekly returns for the last 18 months and 3-year periods and in case of short-term debt funds - weekly returns for the last 18 months. These ratings do not take into consideration any entry or exit load.Five-stars indicate that a fund is in the top 10 per cent of its category in terms of historical risk-adjusted returns. Four stars indicate that a fund is in the next 22.5 per cent of its category. The number of schemes in each category is mentioned along side the categories name. Equity Diversified (62), Equity Tax Planning (19), Hybrid Equity Oriented (25), Hybrid: Monthly Income (15), Debt: Medium-term (35), Gilt: Medium and Long-term (28), Gilt: Short-term (15), Debt: Ultra Short-term (38), Debt: Short-term (19) Hybrid: Debt-oriented (10). These Fund Ratings are as on October 31, 2005. The Value Research Ratings are published in Monthly Mutual Fund Performance Report and Mutual Fund Insight. The Ratings are subject to change every month. The Rating is based on primary data provided by respective funds, Value Research does not guarantee the accuracy.Ranking Entity : Value Research
^CNBC Award Methodology
CNBC TV18 - CRISIL Mutual Fund of the Year Award for Birla Income Plus Plan B and Birla Bond Plus - Retail
Birla Income Plus Plan B was among the 2 schemes that won the CNBC TV18 - CRISIL Mutual Fund of the Year Award in the Open - ended Income Funds Category. In total 13 schemes were eligible for the award universe.Birla Bond Plus - Retail was among the 2 schemes that won the CNBC TV18 - CRISIL Mutual Fund of the Year Award in the Open-ended Income-Short Term Funds Category. In total 14 schemes were eligible for the award universe Schemes present in all four quarter CRISIL CPRs were considered for the award. The awards are based on consistency of schemes' performance in the four quarterly CRISIL CPR rankings released during the calendar year 2004. The individual CRISIL CPR parameter scores averaged for the four quarters and further multiplied by the parameter weight as per the CRISIL CPR methodology to arrive at the final scores. The criteria used in computing the CRISIL Composite Performance Rank are Superior Return Score, Average Maturity, Concentration, Liquidity and Asset Quality of the scheme. The methodology does not take into account the entry and exit loads levied by the scheme. The CRISIL CPR is no indication of the performance that can be expected from the scheme in future. A detailed methodology of the CRISIL CPR is available at www.crisil.com.
Rankings and Award Source: CRISIL FundServices, CRISIL Ltd.
@ICRA - Ranking Methodology & Disclaimer: Birla India Opportunities Fund has been ranked ICRA MFR 1 by ICRA Online in the category 'Open Ended Sectoral Schemes - Technology' for its 3 year performance till December 31, 2004. The rank indicates performance within the top 10% of the stated category, which had a total of 10 similar funds, including this scheme. Birla Income Plus has been ranked ICRA MFR 1 by ICRA Online in the category 'Open Ended Debt Schemes - Long Term' for its 3 year performance till December 31, 2004. The rank indicates performance within the top 10% of the stated category, which had a total of 22 similar funds, including this scheme. Birla Gilt Plus Liquid Plan has been ranked ICRA MFR 1 by ICRA Online in the category 'Open ended Gilt Schemes - Short Term' for its 1 year performance till December 31, 2004. The rank indicates performance within the top 10% of the stated category, which had a total of 12 similar funds, including this scheme. Birla Gilt Plus Liquid Plan has been ranked ICRA MFR 1 by ICRA Online in the category 'Open ended Gilt Schemes - Short Term' for its 3 year performance till December 31, 2004. The rank indicates performance within the top 10% of the stated category, which had a total of 9 similar funds, including this scheme. The ranks are an outcome of an objective and comparative analysis against various performance parameters, including: risk adjusted return; fund size, Sector Concentration, and average maturity. The ranking methodology did not take into account the entry and exit loads imposed by the Fund. The ranks are neither a certificate of statutory compliance nor any guarantee on the future performance of Birla India Opportunities Fund, Birla Gilt Plus Liquid Plan or Birla Income Plus. Ranking Source: ICRA Online
^^CRISIL CPR - Ranking Methodology & Disclaimer: Birla Midcap Fund-Growth: CRISIL~CPR 2 Open End Equity Scheme, October 2004 to September 2005.CRISIL~CPR 2: The composite performance of Birla Cash Plus Retail Plan is 'Good' in the Open End Liquid Category, and ranks within the top 30 % of the 47 schemes ranked in this category. The criteria used in computing the CRISIL Composite Performance Rank are Superior Return Score, based on NAVs over the 1-year period ended September 2005, Average Maturity, Concentration, Liquidity and Asset Quality of the scheme. The methodology does not take into account the entry and exit loads levied by the scheme. The CRISIL CPR is no indication of the performance that can be expected from the scheme in future. Ranking Source: CRISIL FundServices, CRISIL Limited
Methodology of Ranking
Birla Sun Life Equity Fund-Growth: CRISIL~CPR 2 Open End Equity Scheme, October 2004 to September 2005.CRISIL~CPR 2: The composite performance of Birla Cash Plus Retail Plan is 'Good' in the Open End Liquid Category, and ranks within the top 30 % of the 47 schemes ranked in this category. The criteria used in computing the CRISIL Composite Performance Rank are Superior Return Score, based on NAVs over the 1-year period ended September 2005, Average Maturity, Concentration, Liquidity and Asset Quality of the scheme. The methodology does not take into account the entry and exit loads levied by the scheme. The CRISIL CPR is no indication of the performance that can be expected from the scheme in future. Ranking Source: CRISIL FundServices, CRISIL Limited
Birla Cash Plus - Retail Plan : CRISIL~CPR 2 Open End Liquid Scheme, October 2004 to September 2005.CRISIL~CPR 2: The composite performance of Birla Cash Plus Retail Plan is 'Good' in the Open End Liquid Category, and ranks within the top 30 % of the 23 schemes ranked in this category. The criteria used in computing the CRISIL Composite Performance Rank are Superior Return Score, based on NAVs over the 1-year period ended September 2005, Average Maturity, Concentration, Liquidity and Asset Quality of the scheme. The methodology does not take into account the entry and exit loads levied by the scheme. The CRISIL CPR is no indication of the performance that can be expected from the scheme in future. Ranking Source: CRISIL FundServices, CRISIL Limited
@@ STANDARD & POOR'S FUND AWARDS 2004 MethodologyFunds must have minimum assets under management of US$4m, as at end of June 2003. The Offshore fund universe for the purposes of these Awards excludes funds that are domiciled in Luxembourg or Ireland. Awards are calculated for 1 and 5 years. There must be a minimum of 10 funds in a sector to qualify for the calculation. For detailed methodology, kindly visit http://www.funds-sp.comFund Management RatingsA S&P Rating is its current opinion of a fund's adherence to consistent investment processes combined with the level of volatility adjusted returns. In S&P's opinion, funds which adhere to disciplined processes and exhibit strong management, are more likely, over the long run, to provide consistent, above average volatility adjusted returns, relative to the funds in the same sector. The rating is based on an evaluation of qualitative (management, investment process and organization) and quantitative (historic performance, portfolio construction and volatility) factors which contribute to long term performance. The rating does not address, the market, credit or counter party risk of a fund, nor a fund's suitability as a counter party or obligor.Ratings Definition Funds rated in the AAA to A categories demonstrate to S&P an ability to provide above average volatility, adjusted returns over long term period (relative to funds in the same sector) along with a strong ability to adhere to a consistent investment process. The differentiation in the rating categories is based on quantitative factors along with Standard & Poor's The McGraw-Hill Companies's assessment of the investment process and management.AAA: A fund which demonstrates an extremely strong ability to adhere to consistent investment processes and provides above average volatility adjusters returns relative to funds with similar objectives. AA: The fund demonstrates very high standards of quality in its sector based on its investment process and management's consistency of performance as compared to funds with similar objectives. A: The fund demonstrates a high standard or quality in its sector based on its investment process arid management's consistency of performance as compared with funds with similar objectives NR: Funds designated as NR (not rated) currently do not meet the requisite performance standards and / or the minimum qualitative criteria.
Outlook Money Wealth Creator Awards: Best Equity Fund House (Runners Up) - Ranking Methodology: The Wealth Creator Awards (Mutual Funds) have been broken down in two parts; qualitative and quantitative parameters. The qualitative parameters carried 40% weightage and the quantitative carried 60% weightage. For the quantitative parameters, risk-adjusted returns (returns adjusted for downside risk) - was the key parameter for evaluation. The database of Credence Analytics was the data source for this analysis.For the qualitative part, questionnaires were sent to fund houses, asking them for information on operational aspects like nature of schemes, Online subscription and redemprion facilities, SIP, SWP, Lock-ins, Fines imposed by any authority, Trigger facility, No-load switching option, Information on website, Quarterly newsletters, Investor complaints, etc. All Fund Houses with assets under management of at least Rs 500 crore, as of 30 June 2004, were only considered. A minimum track-record of 5 years was also specified for the Equity schemes.
36
N O V E M B E R 2 0 0 5

DEBT FUNDSENTRY LOAD EXIT LOAD
Birla Income Plus Retail Plan Nil
Nil
Nil
Nil
Nil
Nil
Birla Cash Plus
Birla MIP (An open-ended fund. Monthly income is not assured and is subject to the availability of distributable surplus.)
Birla Bond Plus
Birla Bond Index Fund
Birla Floating Rate Fund
Short Term Plan
Long Term Plan
Nil
Nil
Nil
Nil
Birla Gilt Plus
Plan A - Liquid Plan
Plan B - PF Plan
Plan C - Regular Plan
1.00% if exited within 365 daysNil
In respect of each purchase / switch-in of Units, upto and including Rs. 10 lacs in value, an Exit Load of 0.60% is payable if Units are redeemed / switch-out within 180 days. In respect of each purchase /switch-inof Units, greater than Rs. 10 lacs in value, no exit load is payable
In respect of each purchases / switch-in of Units, upto and including Rs. 10 lacs in value, an Exit Load of 0.60% is payable if Units are redeemed / switch-out within 90 days from the date of allotment. In respect of each purchase / switch-in of Units, greater than Rs. 10 lacs in value, no exit load is payable
In respect of each purchase / switch-in of Units, upto and including Rs. 10 lacs in value, an Exit Load of 0.50% is payable if Units are redeemed / switch-out within 180 days. In respect of each purchase / switch-in of Units, greater than Rs. 10 lacs in value, no exit load is payable
Nil
Nil Nil
Nil
Nil
Nil
Birla MIP II (An open-ended fund. Monthly income is not assured and is subject to the availability of distributable surplus.) Saving 5 Plan
Wealth 25 Plan
Please check the applicable load structure at the time of investing.Disclaimer: Any information contained in this publication does not constitute and shall be deemed not to constitute an advice, an offer to sell/ purchase or as an invitation or solicitation to do so for any securities of any entity, and further, Birla Sun Life AMC Ltd./ its subsidiaries / affiliates / sponsors / trustee or their officers, employees, personnel, directors shall not be liable for any loss, damage, liability whatsoever for any direct or indirect loss arising from the use or access of any information that may be displayed in this publication from time to time. Recipients of the information contained herein should exercise due care and caution and read the offer documents (including if necessary, obtaining the advice of tax / legal / accounting / financial / other professionals) prior to taking of any decision, acting or omitting to act, on the basis of the information contained herein.Editorial opinions expressed in the 'Connect' are not necessarily those of Birla Sun Life AMC Ltd. or any of their officers, employees, personnel, directors and Birla Sun Life AMC Ltd. and its officers, employees, personnel, directors do not accept responsibility for the editorial content. Birla Sun Life AMC Ltd. or any of its officers, employees, personnel, directors make no representation as to the accuracy, completeness or reliability of the editorial content and hereby disclaim any liability with regard to the same.
Aggressive Plan
Moderate Plan
Conservative Plan
1.50%
1.00%
0.50%
Nil
Nil
Nil
FUND OF FUNDS ENTRY LOAD EXIT LOAD
Birla Asset Allocation Fund
Nil
In respect of each purchases /switch-in of Units, upto and including Rs. 10 lacs in value, an Exit Load of 0.60% is payable if Units are redeemed / switch-out within 180 days from the date of allotment. In respect of each purchase / switch-in of Units, greater than Rs. 10 lacs in value, no exit load is payable
In respect of each purchases / switch-in of Units, upto and including Rs. 10 lacs in value, an Exit Load of 0.25% is payable if Units are redeemed / switch-out within 90 days from the date of allotment. In respect of each purchase / switch-in of Units, greater than Rs. 10 lacs in value, no exit load is payable
Birla Dynamic Bond Fund Retail Nil
Nil
Growth
NilQuarterly /
Annual DividendNil
Birla Sun Life Monthly Income
Birla Sun Life Cash ManagerBirla Sun Life Government Securities FundBirla Sun Life Short Term Fund
• For purchase / switch-in of Units, upto and including Rs. 10 lacs in value, an exit load of 0.60% is payable if Units are redeemed / switched out within 180 days from the date of allotment.
• For purchase / switch-in of Units, greater than Rs. 10 lacs in value, no exit load is payable
• For purchase / switch-in of Units, upto and including Rs. 10 lacs in value, an exit load of 0.60% is payable if Units are redeemed / switched out within 90 days from the date of allotment.
• For purchase / switch-in of Units, greater than Rs. 10 lacs in value, no exit load is payable.
Birla Sun Life Income Fund
Nil
LOAD STRUCTURE AT A GLANCEEQUITY FUNDS ENTRY LOAD EXIT LOAD
Birla Advantage FundBirla India Opportunities Fund(Formerly Birla IT Fund)Birla Midcap FundBirla Dividend Yield PlusBirla MNC FundBirla Equity Plan(An open-ended Equity Linked Savings Scheme with a lock-in of 3 years)
Nil
Invest in Equity Schemes through an SIP. For investments less than or equal to Rs. 10 Lac per cheque, there will be no Entry Load. However, such investments will be charged an Exit Load equivalent to the waived entry load, if redeemed/switched out within 365 days from the date of allotment. Any switch-in of units from Birla Cash Plus to Birla Advantage Fund, Birla Dividend Yield Plus, Birla Midcap Fund, Birla MNC Fund, Birla India Opportunities Fund and Birla Balance, an entry load of 2.25% shall be applicable.
Birla India GenNext Fund
Birla Sun Life Equity FundBirla Sun Life New Millennium FundBirla Sun Life Buy India FundBirla Sun Life Basic Industries FundBirla Sun Life Tax Relief '96 FundBirla Sun Life '95 Fund
Nil
Nil
Nil
1.00% if redeemed/
switched out within 6 months from the date of allotment.
Birla Balance
(i) In respect of each purchases/switch-in of Units less than Rs. 2 crores in value, an Entry load of 2.25 % is applicable.
(ii) In respect of each purchases/switch-in of Units , equal to or greater than Rs. 2 crores and less than Rs. 5 crores in value, an Entry load of 0.50% is applicable.
(iii) In respect of each purchases /switch-in of Units, equal to or greater than Rs. 5 crores in value, No Entry load is applicable
Birla Index FundFor purchase/switch-in of units equal to or less than Rs. 10 lakhs in value, no entry load is applicable.For purchase/switch-in of units greater than Rs. 10 lacs in value, an entry load of 0.50% is applicable.
(i) In respect of each purchases/switch-in of Units less than Rs. 2 crores in value, an Entry load of 2.25 % is applicable.
(ii) In respect of each purchases/switch-in of Units , equal to or greater than Rs. 2 crores and less than Rs. 5 crores in value, an Entry load of 0.50% is applicable.
(iii) In respect of each purchases /switch-in of Units, equal to or greater than Rs. 5 crores in value, No Entry load is applicable
Birla Top 100 Fund
1.00% if redeemed/ switched out within 3 months from the date
of allotment.
Birla Sun Life Frontline Equity Fund

Dividend History#EQUITY SCHEMES Declared Dividend Dividend Face value Cum Dividend NAV
on date (%) (Rs. per unit) (Rs.) (Rs. per unit)
Birla Advantage Fund 27-Aug-99 20 2.00 10.00 33.81
22-Mar-00 80 8.00 10.00 70.37
28-Nov-03 30 3.00 10.00 44.88
23-Jan-04 20 2.00 10.00 47.33
12-Mar-04 25 2.50 10.00 46.10
23-Mar-05 50 5.00 10.00 54.25
Birla Equity Plan 31-Mar-00 25 2.50 10.00 30.43
15-Feb-02 10 1.00 10.00 12.45
17-Oct-03 15 1.50 10.00 24.89
26-Mar-04 15 1.50 10.00 26.90
21-Oct-05 4 0.40 10.00 42.10
Birla India
Opportunities Fund 04-Feb-00 25 2.50 10.00 28.97
14-Jan-03 10 1.00 10.00 12.16
27-Feb-04 60 6.00 10.00 18.69
26-Oct-04 12.5 1.25 10.00 14.17
16-Sep-05 40 4.00 10.00 14.90
Birla MNC Fund 22-Feb-02 40 4.00 10.00 27.16
29-Aug-03 50 5.00 10.00 30.58
18-Jan-05 50 5.00 10.00 42.80
26-Aug-05 75 7.50 10.00 41.05
Birla Midcap Fund 24-Jan-03 5 0.50 10.00 10.52
19-Jun-03 10 1.00 10.00 11.83
22-Jul-03 10 1.00 10.00 11.81
24-Dec-03 60 6.00 10.00 18.35
8-Oct-04 12.5 1.25 10.00 13.72
28-Jan-05 10 1.00 10.00 14.75
Birla Dividend Yield Plus 30-May-03 8 0.80 10.00 11.84
13-Jun-03 5 0.50 10.00 10.88
24-Jul-03 12 1.20 10.00 11.62
19-Sept-03 18 1.80 10.00 12.09
31-Oct-03 10 1.00 10.00 11.87
26-Dec-03 15 1.50 10.00 13.93
13-Feb-04 10 1.00 10.00 12.58
28-Sep-04 8 0.80 10.00 11.57
24-Dec-04 14 1.40 10.00 13.75
11-Mar-05 10 1.00 10.00 12.85
1-July-05 8 0.80 10.00 11.26
28-Oct-05 8 0.80 10.00 11.94
Birla Index Fund 17-Oct-03 56 5.60 10.00 16.19
03-Feb-04 16.5 1.65 10.00 11.9857
Birla Balance 17-Oct-03 15 1.50 10.00 13.32
(For select Schemes)
38
N O V E M B E R 2 0 0 5
Past performance may or may not be sustained in future. #Dividend distribution is not assured and is subject to availability of distributable surplus. After payment of dividend the NAV will fall to the extent of payout.
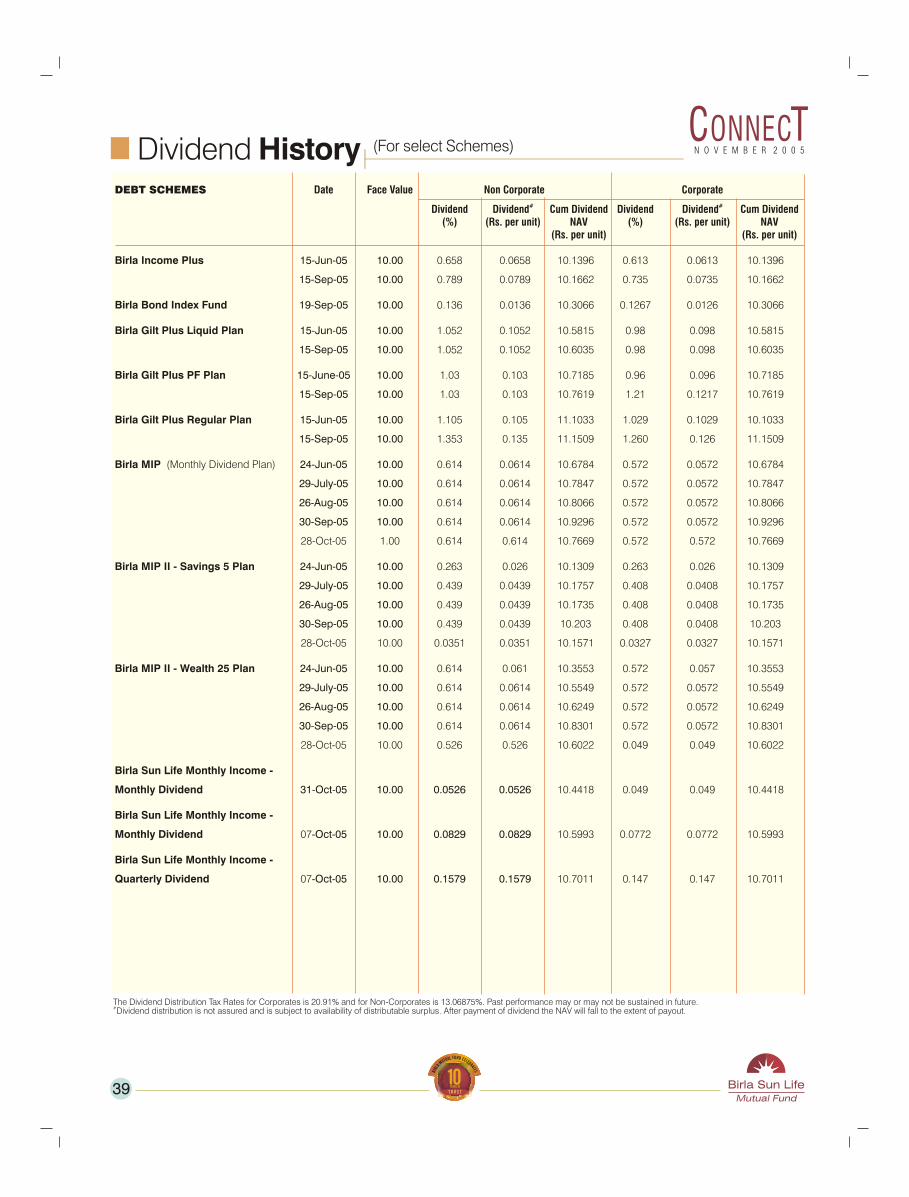
Dividend HistoryDEBT SCHEMES Date Face Value Non Corporate Corporate
# #Dividend Dividend Cum Dividend Dividend Dividend Cum Dividend(%) (Rs. per unit) NAV (%) (Rs. per unit) NAV
(Rs. per unit) (Rs. per unit)
Birla Income Plus 15-Jun-05 10.00 0.658 0.0658 10.1396 0.613 0.0613 10.1396
15-Sep-05 10.00 0.789 0.0789 10.1662 0.735 0.0735 10.1662
Birla Bond Index Fund 19-Sep-05 10.00 0.136 0.0136 10.3066 0.1267 0.0126 10.3066
Birla Gilt Plus Liquid Plan 15-Jun-05 10.00 1.052 0.1052 10.5815 0.98 0.098 10.5815
15-Sep-05 10.00 1.052 0.1052 10.6035 0.98 0.098 10.6035
Birla Gilt Plus PF Plan 15-June-05 10.00 1.03 0.103 10.7185 0.96 0.096 10.7185
15-Sep-05 10.00 1.03 0.103 10.7619 1.21 0.1217 10.7619
Birla Gilt Plus Regular Plan 15-Jun-05 10.00 1.105 0.105 11.1033 1.029 0.1029 10.1033
15-Sep-05 10.00 1.353 0.135 11.1509 1.260 0.126 11.1509
Birla MIP (Monthly Dividend Plan) 24-Jun-05 10.00 0.614 0.0614 10.6784 0.572 0.0572 10.6784
29-July-05 10.00 0.614 0.0614 10.7847 0.572 0.0572 10.7847
26-Aug-05 10.00 0.614 0.0614 10.8066 0.572 0.0572 10.8066
30-Sep-05 10.00 0.614 0.0614 10.9296 0.572 0.0572 10.9296
28-Oct-05 1.00 0.614 0.614 10.7669 0.572 0.572 10.7669
Birla MIP II - Savings 5 Plan 24-Jun-05 10.00 0.263 0.026 10.1309 0.263 0.026 10.1309
29-July-05 10.00 0.439 0.0439 10.1757 0.408 0.0408 10.1757
26-Aug-05 10.00 0.439 0.0439 10.1735 0.408 0.0408 10.1735
30-Sep-05 10.00 0.439 0.0439 10.203 0.408 0.0408 10.203
28-Oct-05 10.00 0.0351 0.0351 10.1571 0.0327 0.0327 10.1571
Birla MIP II - Wealth 25 Plan 24-Jun-05 10.00 0.614 0.061 10.3553 0.572 0.057 10.3553
29-July-05 10.00 0.614 0.0614 10.5549 0.572 0.0572 10.5549
26-Aug-05 10.00 0.614 0.0614 10.6249 0.572 0.0572 10.6249
30-Sep-05 10.00 0.614 0.0614 10.8301 0.572 0.0572 10.8301
28-Oct-05 10.00 0.526 0.526 10.6022 0.049 0.049 10.6022
Birla Sun Life Monthly Income -
Monthly Dividend 31-Oct-05 10.00 0.0526 0.0526 10.4418 0.049 0.049 10.4418
Birla Sun Life Monthly Income -
Monthly Dividend 07-Oct-05 10.00 0.0829 0.0829 10.5993 0.0772 0.0772 10.5993
Birla Sun Life Monthly Income -
Quarterly Dividend 07-Oct-05 10.00 0.1579 0.1579 10.7011 0.147 0.147 10.7011
(For select Schemes)
The Dividend Distribution Tax Rates for Corporates is 20.91% and for Non-Corporates is 13.06875%. Past performance may or may not be sustained in future. #Dividend distribution is not assured and is subject to availability of distributable surplus. After payment of dividend the NAV will fall to the extent of payout.
39
N O V E M B E R 2 0 0 5

$Performanceat a glance
$Performanceat a glance
DEBT SCHEME
Period 1 Year 2 Years 3 Years 5 Years Since Inception
Birla MIP (Growth)Crisil MIP Blended IndexInception - November 20, 2000
Birla Income Plus (Growth)Crisil Composite Bond Fund IndexInception - October 23, 1995
Birla Gilt Plus - Liq. (Growth)I-Sec Si-Bex
Birla Gilt Plus - PF (Growth)Birla Gilt Plus - Reg (Growth)I-Sec Li-BexInception - October 12, 1999
Birla Sun Life G-Sec Fund - LT (Growth)I-Sec Li-BEX Inception - October 28, 1999
Birla Sun Life G-Sec Fund - ST - (Growth)I-Sec Si-BEX Inception - October 28, 1999
Birla Sun Life Income Fund - (Growth)Crisil Composite Bond Fund Index Inception - March 03, 1997
Birla Sun Life Monthly Income - (Growth)Crisil MIP Blended Index Inception - July 14, 1999
Birla Sun Life Short Term Fund - (Growth)CRISIL Short-Term Bond Fund Index Inception - April 19, 2002
Birla AAF - Conservative Plan (Growth)Crisil MIP Blended IndexInception - January 23, 2004
Period 1 Month 2 Months 3 Months 1 Year 3 Years 5 Years Since Inception
Birla Cash Plus - Retail (Growth)Crisil Liquid Fund IndexInception - June 16,1997
Birla Bond Plus - Retail (Growth)CRISIL Short-Term Bond Fund IndexInception - November 26, 2001
Birla Bond Index Fund (Growth)Crisil Composite Bond Fund IndexInception - April 24, 2003
Birla Floating Rate Fund LTP - GrowthSTP - Growth Crisil Liquid Fund IndexInception - June 04, 2003
Birla MIP II - Saving 5 (Growth)Crisil MIP Blended IndexInception - May 01, 2004
Birla MIP II - Wealth 25 (Growth)Crisil MIP Blended IndexInception - May 01, 2004
Birla Dynamic Bond Fund (Growth)Crisil Composite Bond Fund IndexInception - September 24, 2004
Birla SunLife Cash Manager (Growth)Crisil Liquid Fund IndexInception - May 14, 1998
EQUITY SCHEME
Period 1 Year 2 Years 3 Years 5 Years SinceInception/Takeover
Birla Advantage Fund (Growth)S&P NiftyBSE SensexInception - February 24, 1995
Birla Equity PlanS&P NiftyBSE SensexInception - February 16, 1999
8.82 7.25 10.18 -- 11.389.72 5.89 9.76 -- –
4.64 1.6 5.1 9.25 11.055.88 2.48 5.25 -- –
5.55 4.63 6.21 8.44 8.95.23 4.38 5.56 -- –
6.57 1.5 7.5 12.15 11.726.64 1.91 7.84 13.92 13.59
10.04 1.91 8.23 -- –
5.77 1.42 7.06 11.35 11.0810.04 1.91 8.23 -- –
3.42 1.29 3.15 6.03 6.615.23 4.38 5.56 -- –
5.29 2.31 5.34 9.35 10.475.88 2.48 5.25 -- –
9.11 7.64 11.56 11.34 13.269.72 5.89 9.76 -- –
4.76 4.54 5.12 -- 5.695.31 3.92 4.7 -- 5.41
-1.46 - - - 9.56-1.04 - - - 4.68
0.45 0.87 1.31 5.13 4.99 6.19 7.540.35 0.76 1.15 4.65 4.44 -- --
0.37 0.82 1.33 5.91 5.57 -- 6.310.31 0.77 1.23 5.31 4.7 -- --
0.47 0.9 1.2 5.44 -- -- 3.790.37 0.78 1.17 5.88 5.25 -- 3.88
0.42 0.84 1.33 5.44 -- -- 5.220.44 0.88 1.34 5.36 -- -- 5.030.35 0.76 1.15 4.65 4.44 -- 4.26
-0.01 0.55 1.17 5.55 -- -- 4.55-1.04 0.62 1.44 9.72 9.76 -- 4.54
-1.3 0.58 2.35 12.59 -- -- 10.29-1.04 0.62 1.44 9.72 9.76 -- 4.54
0.4 0.74 1.02 5.25 -- -- 5.160.37 0.78 1.17 5.88 5.25 -- 4.39
0.44 0.87 1.29 5.05 5.13 6.23 7.20.35 0.76 1.15 4.65 4.44 -- --
50.09 34.48 52.22 17.88 21.2532.48 23.41 35.54 15.11 8.1938.89 26.78 38.79 16.28 8.03
45.14 34.84 58.22 20.52 24.0732.48 23.41 35.54 15.11 14.4438.89 26.78 38.79 16.28 13.65
N O V E M B E R 2 0 0 5
40

$Performanceat a glance
$Performanceat a glance
EQUITY SCHEME (contd.)
Period 1 Year 2 Years 3 Years 5 Years SinceInception/Takeover
Birla India Opportunities Fund (Growth)(formerly Birla IT Fund)CNX500Takeover - December 27, 1999
Birla MNC Fund (Growth)CNX MNCTakeover - December 27, 1999
Birla Balance (Growth)Crisil Balanced Fund IndexInception - October 12, 1999
Birla Index Fund (Growth)S&P NiftyInception - September 17, 2002
Birla Midcap Fund (Growth)CNX MidcapInception - October 16, 2002
Birla Dividend Yield Plus (Growth)CNX500Inception - February 10, 2003
Birla Sun Life 95 (Growth)Crisil Balanced Fund IndexInception - February 10, 1995
Birla Sun Life Basic Industries Fund (Growth)BSE200Inception - January 15, 2000
Birla Sun Life Buy India Fund (Growth)BSE200Inception - January 15, 2000
Birla Sun Life Tax Relief ‘96BSE200Inception - March 29, 1996
Birla Sun Life Equity Fund (Growth)BSE200Inception - August 27, 1998
Birla Sun Life Frontline Equity Fund (Growth)BSE200Inception - August 30, 2002
Birla Sun Life New Millennium (Growth)BSE TECKInception - January 15, 2000
Birla AAF - Aggressive Plan (Growth)S&P NiftyInception - January 23, 2004
Birla AAF - Moderate Plan (Growth)Crisil Balanced Fund IndexInception - January 23, 2004
Period 1 Month 2 Months 3 Months 1 Year Since Inception
Birla India GenNext Fund (Growth)S&P NiftyInception - August 05, 2005
Returns calculated as on October 31, 2005 Absolute returns for period less than 1 year, CAGR for period 1year or more
$ All return figures are in percentage. Performance has been calculated on the basis of the Advertisement Code as prescribed under SEBI (Mutual Funds) Regulations, 1996. Past performance may or may not be sustained in future.
34.84 34.34 43.38 16.47 5.737.43 30.23 43.99 19.42 8.21
42.37 39.61 46.37 23.08 15.0644.23 22.72 25.24 10.91 3.59
28.1 23.02 35.51 13.5 12.1721.6 15.96 23.65 -- –
31.77 22.74 35.42 -- 32.9832.48 23.41 35.54 15.11 32.05
56.03 50.62 58.34 -- 57.4148.63 39.96 57.14 35.21 55.22
38.37 36.54 -- -- 54.2637.43 30.23 43.99 19.42 44.32
38.98 32.38 40.84 18.27 26.2521.6 15.96 23.65 -- –
38.73 37.34 64.53 39.3 28.933.74 27.44 41.34 19.52 8.74
88.3 62.57 60.59 27.29 11.8733.74 27.44 41.34 19.52 8.74
34.39 27.87 45.95 18.47 32.6233.74 27.44 41.34 19.52 11.71
64.54 53.22 66.89 24.99 38.9333.74 27.44 41.34 19.52 17.67
44.59 36.38 48.33 -- 40.7833.74 27.44 41.34 19.52 35.9
49.61 44.35 44.97 8.57 2.7135.45 38.56 38.89 1.7 –
-4.91 - - - 19.97-8.86 - - - 15.11
-3.51 - - - 15.7-5.22 - - - 11.22
-7.26 -0.67 3.50-8.86 -0.57 0.41
N O V E M B E R 2 0 0 5
41

CONSTITUTION: Birla Mutual Fund (BMF), has been setup as a Trust under the Indian Trust Act, 1882. SPONSORS: Sun Life (India) AMC Investments Inc. and Birla Global
Finance Ltd. (liability restricted to seed corpus of Rs. 1 lac) TRUSTEE: Birla Sun Life Trustee Co. Pvt. Ltd. INVESTMENT MANAGER: Birla Sun Life Asset Management
Company Ltd. RISK FACTORS: Mutual Funds and securities investments are subject to usual risks associated with capital and money market instruments. There can be no
assurance that the fund's objectives will be achieved. As with any investment in securities, the Net Asset Value (NAV) of the Units issued under the scheme can go up or down
depending on the various factors and forces affecting the securities markets. Past performance of the Sponsors and its Affiliates / Mutual Fund / Scheme(s) /AMC does not
indicate the future performance of the schemes of the Mutual Fund and does not form a basis of comparison with other investments. The name of the scheme does not in
any manner indicate either the quality of the scheme, its future prospects or returns. SCHEME SPECIFIC RISK FACTORS: Risks associated with high dividend yield stocks:
Though the investments would be made in companies having a track record of dividend payments, the performance of the scheme would inter-alia depend on the ability of
these companies to sustain dividends in future. These stocks, at times, may be relatively less liquid as compared to growth stocks. For details and risk factors read the Offer
Document carefully and refer to your financial advisor before investing. SCHEME OBJECTIVE: An open-ended growth scheme to provide capital growth and income by
investing primarily in a well-diversified portfolio of dividend paying companies that have a relatively high dividend yield. LIQUIDITY: The fund offers NAVs, purchases and
redemptions on all business days. LOAD STRUCTURE: ENTRY LOAD: In respect of each purchase/ lateral shift in of units, less than Rs. 2 crores in value, an entry load of
2.25% is applicable. In respect of each purchase / lateral shift in of units, equal to or greater than Rs. 2 crores and less than Rs. 5 crores in value an entry load of 0.50% is
applicable. In respect of each purchase /lateral shift in of units, equal to or greater than Rs. 5 crores in value no entry load is applicable. EXIT LOAD: Nil.

Constitution: Birla Mutual Fund (BMP), has been set up as a trust under the Indian Trust Ad, 1882. Sponsors: Sun Life (India) AMC Investments Inc. and Birla Global Finance Ltd. (liability restricted to seed corpus of Rs. 1 lac) Trustee: Birla Sun Life Trustee Co. Pvt. Ltd. Investment Manager: Birla Sun Life Asset Management Company Ltd. Risk Factors: Mutual Funds and securities investments are subject to usual risks associated with capital and money market instruments. There con be no assurance that the funds objectives will be achieved. As with any investment in securities, the NAV of the units issued under the schemes can go up or down depending on the factors and forces affecting the securities markets. Past performance of BMF does not guarantee the future performance of the schemes of BMF and does not form a basis of comparison with other investments. The names of schemes do not in any manner indicate either the quality of the schemes, their future prospects or returns. Liquidity: The scheme offers NAVs, subscription and redemptions on all business days. Please check applicable load structure before investing. For details and scheme specific risk factors read offer documents and refer to your financial advisor before investing.
Prin
ted
in N
ovem
ber
2005
The name inspires trust
For further details on our Fund, please contact our Customers Service Centres at details given below.
BIRLA SUN LIFE AMC LTD.: BRANCHES - OFFICIAL POINTS OF ACCEPTANCE OF APPLICATIONS : AHMEDABAD: 079-2640 3553 /48; BANGALORE: 080-2238 9991/2/3; CHENNAI: 044- 5204 5003 /2819 1681; KOLKATA: 033-2288 2595/288 2592/94; MUMBAI (Head Office): 022 - 5692 8000; MUMBAI (SALES Office): 022 - 5637 9999; NEW DELHI: 011-2332 3070; PUNE: 020-56011865 /66 /67; SECUNDARABAD: 040- 2772 1818 /5531 1052/3580. OTHER BRANCHES: BARODA: 0265- 558 2984 / 2986; BHUBANESHWAR: 0674-253 5521/3413; CHANDIGARH: 0172-274 9172/73; COCHIN: 0484-238 3969 /236 6817; COIMBATORE: 0422 - 535 0262 / 64; GOA: 0832-243 7628/29; GUWAHATI: 0361-259 9273; INDORE: 0731-504 6789/0496,253 4502; JAIPUR: 0141-2372935 /2367882; KANPUR: 0512-233 1116 /1121; LUCKNOW: 0522- 229 4110; LUDHIANA: 0161-508 8847/277 1217; PATNA: 0612-220 7022/7023 / 3090873; SURAT: 0261- 558 1707/ 1708. OTHER OFFICIAL POINTS OF ACCEPTANCE OF APPLICATIONS - CAMS: Agra: 0562-252 1812; Ahmedabad: 079 -2642 4940 / 2646 4929; Allahabad: 0532 – 260 1602; Amritsar: 0183 – 221 1194; Bangalore: 080 -2225 9491 / 2220 3157; Belgaum: 0831-2425 305; Bhilai: 0788 -505 0568; Bhopal: 0755 – 528 5266; Bhubaneswar: 0674-253 4909 / 253 5395; Calicut: 0495 - 2723175; Chandigarh: 0172– 2706 651/ 2711 325; Chennai: 044 - 2855 9950; Coimbatore: 0422- 252 5353 / 252 0817; Dehradun: 0135 - 271 3233; Durgapur: 0343 -254 8190; Goa: 0832 –242 4527/ 564 1070; Guwahati: 0361-2607771; Hubli: 0836- 2358688; Indore: 0731-252 8609 / 252 9261; Jaipur: 141-222-0948 / 0141-222-0951; Jalandhar: 0181-2456336; Jamnagar: 0288 - 255 8467; Jamshedpur: 0657 – 310 5930; Jodhpur: 0291-309 2892 / 262 8039; Kanpur: 0512-230 6668 / 230 6685; Kochi: 0484– 238 0443; Kolkata: 033- 22171474 / 22171475; Lucknow: 0522–237309; Ludhiana: 0161-501 7502 / 241 0279; Madurai: 0452 - 2622 682; Mangalore: 0824- 243 6567/ 525 2525; Manipal: 0820 -257 3333; Moradabad: 0591-3092844; Mumbai: 022 - 22702414 / 22702415 / 22702416; Mysore: 0821- 309 1244 / 234 2182; Nagpur: 0712-253 2447/ 253 7321; Nasik: 0253 - 257 7449; New Delhi: 011- 2335 3832/33; Patiala: 0175-2229633 / 3093724; Patna: 0612-2322 206; Pondicherry: 0413 -5210030/ 3092468; Pune: 020 – 2545 9439 / 2545 9440; Raipur: 0771 – 309 0830; Rajahmundry: 02883 - 5565531; Rajkot: 0281- 2241 399; Ranchi: 0651-3095122; Salem: 0427-244 6338; Secundarabad: 040 - 5532 1531 / 5532 1532; Siliguri: 0353-2216065; Surat: 0261– 246 4887 / 246 4679; Trichur: 0487-2420646; Trichy: 0431 - 274 1717; Trivandrum: 0471- 272 4687; Udaipur: 0294 -3091722; Vadodara: 0265- 222 5146 / 236 2412; Valsad: 02632-249 957; Varanasi: 0542–220 8546 / 311 3810; Vijaywada: 0866 – 559 5657; Visakhapatnam: 0891–2598 875 / 2540 175.
Constitution: Birla Mutual Fund (BMF), has been set up as a trust under the Indian Trust Act, 1882. Sponsors: Sun Life (India) AMC Investments Inc. and Birla Global Finance Ltd. (liability restricted to seed corpus of Rs. 1 lac) Trustee: Birla Sun Life Trustee Co. Pvt. Ltd. Investment Manager: Birla Sun Life Asset Management Company Ltd. Risk Factors: Mutual Funds and securities investments are subject to usual risks associated with capital and money market instruments. There can be no assurance that the funds objectives will be achieved. As with any investment in securities, the NAV of the units issued under the schemes can go up or down depending on the factors and forces affecting the securities markets. Past performance of BMF does not guarantee the future performance of the schemes of BMF and does not form a basis of comparison with other investments. The names of schemes do not in any manner indicate either the quality of the schemes, their future prospects or returns. Scheme Objective: Birla Advantage Fund: An Open-ended Growth Scheme to achieve long-term growth of capital at relatively moderate levels of risk through a diversified research based investment approach. Birla Equity Plan: An Open-ended Equity Linked Savings Scheme to achieve long-term growth of capital along with income tax relief for investment. Birla India Opportunities Fund: An Open-ended Growth Scheme to achieve superior long-term growth of capital by investing in shares of companies that do one or more of the following: Leverage India's intellectual capital for providing services, research and creative inputs; Seek to use current and impending changes in patent laws / import tariffs / quotas to supply goods and services; Leverage India's lower labour costs for providing services and manufactured goods; Leverage India's large population of English speaking people for providing services. Birla MNC Fund: An Open-ended Growth Scheme to achieve long-term growth of capital at relatively moderate levels of risk by making investments in securities of multi-national companies through a research based investment approach. Birla Midcap Fund: An Open-ended Growth Scheme to achieve long-term growth of capital at controlled level of risk by primarily investing in midcap stocks. Birla Index Fund: An Open-ended Index-Linked Scheme to generate returns commensurate with the performance of Nifty subject to tracking errors. Birla Dividend Yield Plus: An Open-ended Growth Scheme to provide capital growth and income by investing primarily in a well diversified portfolio of dividend paying companies that have a relatively high dividend yield. Birla India GenNext Fund: An Open-ended growth scheme with an objective to target growth of capital by investing in equity/equity related instruments of companies that are expected to benefit from the rising consumption patterns in India, which in turn is getting fuelled by high disposable incomes of the young generation (Generation Next). The scheme will invest in companies that have the following characteristics: 1. Companies that seek growth in revenues arising out of demand from the younger generation (GenNext) for their products or services. 2. They should be engaged in manufacturing of products or rendering of services that go directly to the consumer. 3. The products and services should have distinct brand identity, thereby enabling choice. Birla Top 100 Fund: An open-ended growth scheme that seeks to provide medium to long-term capital appreciation, by investing predominantly in a diversified portfolio of equity and equity related securities of top 100 companies as measured by market capitalization. Birla Sun Life Sector Select Series (Formerly The Alliance Sector Select Series): Birla Sun Life Buy India Fund (Formerly Alliance Buy India Fund): A multi-sector open-end growth scheme with the objective of long term growth of capital, through a portfolio with a target allocation of 100% equity, focusing on investing in businesses that are driven by India's large population and inherent consumption patterns. The focus of the scheme will be in the consumer and healthcare sectors. The secondary objective is income generation and distribution of dividend. Birla Sun Life New Millennium Fund (Formerly Alliance New Millennium Fund): A multi-sector open-end growth scheme with the objective of long term growth of capital, through a portfolio with a target allocation of 100% equity, focusing on investing in technology and technology dependent companies, hardware, peripherals and components, software, telecom, media, internet and e-commerce and other technology enabled companies. The secondary objective is income generation and distribution of dividend. Birla Sun Life Basic Industries Fund (Formerly Alliance Basic Industries Fund): A multi-sector open-end growth scheme with the objective of long term growth capital, through a portfolio with a target allocation of 100% equity, focusing on investing in companies sensitive to economic cycles and commodity pricing cycles. The investments will be in companies which are often referred to as cyclical companies. The secondary objective is income generation and distribution of dividend. Birla Sun Life Equity Fund (Formerly Alliance Equity Fund): An open-end growth scheme with the objective of long term growth of capital, through a portfolio with a target allocation of 90% equity and 10% debt and money market securities. Birla Sun Life Tax Relief '96 Fund (Formerly Alliance Capital Tax Relief '96): An open-end equity linked savings scheme (ELSS) with the objective of long term growth of capital through a portfolio with a target allocation of 80% equity, 20% debt and money market securities. Birla Sun Life '95 Fund (Formerly The Alliance '95 Fund): An open-end balanced scheme with the objective of long term growth of capital and current income, through a portfolio with a target allocation of 60% equity and 40% debt and money market securities. Birla Sun Life Frontline Equity Fund (Formerly Alliance Frontline Equity Fund): An open-end growth scheme with the objective of long term growth of capital, through a portfolio with a target allocation of 100% equity by aiming at being as diversified across various industries and or sectors as its chosen benchmark index, BSE 200. The secondary objective is income generation and distribution of dividend. Birla Balance: An Open-ended Balanced Scheme with an objective to balance income requirements with long-term growth of capital at relatively moderate levels of risks through a diversified research based investment approach. Birla MIP: An Open-ended Fund to generate regular income so as to make monthly distribution to unit holders with the secondary objective being growth of capital. Monthly Income is not assured and is subject to availability of distributable surplus. Birla MIP II: An Open-ended Fund to generate regular income so as to make monthly payment or distribution to unit holders with the secondary objective being growth of capital. Monthly Income is not assured and is subject to availability of distributable surplus. Birla Sun Life Monthly Income (Formerly Alliance Monthly Income): An open-end income Scheme. The primary objective to generate regular income so as to make monthly and quarterly distributions to Unitholders and the secondary objective is growth of capital. Monthly income is not assured and is subject to availability of distributable surplus. Birla Income Plus: An Open-ended Income Scheme to generate consistent income through superior yields on its investments at moderate levels of risk through a diversified investment approach. Birla Sun Life Income Fund (Formerly Alliance Income Fund): The investment objective of the Scheme is to generate income and capital appreciation by investing 100% of the corpus in a diversified portfolio of debt and money market securities. Birla Bond Index Fund: An Open-ended Income Scheme tracking the CRISIL Composite Bond Fund Index. Birla Dynamic Bond Fund: An Open-ended Income Scheme to generate optimal returns with high liquidity through active management of the portfolio by investing in High Quality Debt and Money Market Instruments. Birla Gilt Plus: An Open-ended Government Securities Scheme to generate income and capital appreciation through investments exclusively in Government Securities. Birla Sun Life Government Securities Fund (Formerly Alliance Government Securities Fund): The Scheme seeks to provide investors current income consistent with a portfolio invested 100% in securities issued by the Government of India or the State Governments, and the secondary objective is capital appreciation. Birla Floating Rate Fund: An Open-ended Income Scheme to generate regular income through investment in a portfolio comprising substantially of floating rate debt / money market instruments. Birla Bond Plus: An Open-ended Short Term Income Scheme to generate regular returns through investments in debt and money market securities. Birla Sun Life Short Term Fund (Formerly Alliance Short Term Fund): The investment objective of the Scheme is to generate income and capital appreciation by investing 100% of the corpus in a diversified portfolio of debt and money market securities with relatively low levels of interest rate risk. Birla Cash Plus: An Open-ended Liquid Scheme to provide reasonable returns at a high level of safety and liquidity through judicious investments in high quality debt and money market instruments. Birla Sun Life Cash Manager (Formerly Alliance Cash Manager): The investment objective of the Scheme is to provide current income which is consistent with a portfolio that offers investors superior liquidity by investing 100% in a diversified portfolio of debt (Fixed Income) and money market securities. Birla Asset Allocation Fund: An Open-ended Fund of Funds Scheme to provide income and capital appreciation along with diversification by investing in a basket of debt and equity Mutual Fund schemes in line with the risk profile of the investor. Birla Fixed Maturity Plan: An open-ended scheme with an objective to generate regular income through investments in a portfolio of fixed income securities normally maturing in line with the time profile of the plan. The fixed maturity plans may not be able to generate similar returns as compared to the debt instruments with similar maturity. India Advantage Fund and Excel India Fund: Funds designed to seek long-term appreciation through investment primarily in equity related securities of companies in India that are run by efficient management, have a sustainable and robust business model and are available at reasonable valuations. Liquidity: The schemes offer NAVs, subscription and redemptions on all business days. For all schemes please check applicable load structure before investing. For details and scheme specific risk factors read offer documents and refer to your financial advisor before investing.
The Material provided in the Connect cannot be reproduced or quoted anywhere without express permission from Birla Sun Life Asset Management Company Ltd.