GAFSP Monitoring and Evaluation Plan · 2019-12-16 · GAFSP Monitoring & Evaluation FINAL DRAFT...
67
GAFSP Monitoring & Evaluation FINAL DRAFT May, 2017 GAFSP Monitoring and Evaluation Plan 2017
Transcript of GAFSP Monitoring and Evaluation Plan · 2019-12-16 · GAFSP Monitoring & Evaluation FINAL DRAFT...
GAFSP Monitoring & Evaluation FINAL DRAFT May, 2017
GAFSP Monitoring and Evaluation Plan
2017

GAFSP Monitoring & Evaluation FINAL DRAFT May, 2017
ii
GAFSP Monitoring & Evaluation FINAL DRAFT May, 2017
i
Contents
ACRONYMS AND ABBREVIATIONS ........................................................................................................................ III
1 OVERVIEW OF THE PLAN AND GAFSP FRAMEWORK ..................................................................................... 1
1.1 DEVELOPMENT AND ORGANIZATION OF THE UPDATED M&E PLAN ................................................................................ 1 1.2 THE GAFSP MONITORING AND EVALUATION FRAMEWORK ......................................................................................... 2
2 MEASUREMENT AND EVALUATION OF TIER 1 INDICATORS .......................................................................... 5
2.1 OVERVIEW .......................................................................................................................................................... 5 2.2 APPROACH TO THE SELECTION OF TIER 1 INDICATORS .................................................................................................. 7 2.3 APPROACH TO MEASUREMENT AND VERIFICATION (TIER 1).......................................................................................... 8 2.4 APPROACH TO TRACKING TIER 1 INDICATORS: IMPACT EVALUATION .............................................................................. 9 2.5 IMPLEMENTING ARRANGEMENTS FOR IMPACT EVALUATIONS ...................................................................................... 10
3 MONITORING AND REPORTING OF TIER 2 INDICATORS .............................................................................. 11
3.1 OVERVIEW ........................................................................................................................................................ 11 3.2 APPROACH TO THE SELECTION OF TIER 2 INDICATORS ................................................................................................ 11 3.3 APPROACH TO TRACKING TIER 2 INDICATORS ........................................................................................................... 15
4 MONITORING AND REPORTING ON PORTFOLIO PERFORMANCE (TIER 3) ................................................... 15
4.1 OVERVIEW ........................................................................................................................................................ 15 4.2 THE KEY PERFORMANCE INDICATOR APPROACH FOR TIER 3 ........................................................................................ 15 4.3 LINK TO THE SUSTAINABLE DEVELOPMENT GOALS ..................................................................................................... 17
ANNEX 1: DETAILED DISCUSSION OF GAFSP INDICATORS, THEIR DEFINITION, AND MEASUREMENT METHODOLOGIES ................................................................................................................................................ 19
ANNEX 2: “TOOLKIT” FOR GAFSP PUBLIC SECTOR WINDOW PROJECTS ............................................................... 32
ANNEX 3: PRIVATE SECTOR WINDOW PORTFOLIO M&E PROCESSES ................................................................... 42
ANNEX 4A: SIX MONTHLY PROJECT PROGRESS REPORTING TEMPLATES –DISBURSING PROJECTS ....................... 45
ANNEX 4B: SIX MONTHLY PROJECT PROGRESS REPORTING TEMPLATES – NON DISBURSING PROJECTS .............. 50
ANNEX 5: INTERIM PROJECT COMPLETION REPORT – GAFSP TEMPLATE (INVESTMENT PROJECTS) ..................... 52
ANNEX 6: PROJECT COMPLETION REPORT – GAFSP TEMPLATE (TECHNICAL ASSISTANCE PROJECTS)................... 57
Tables
TABLE 1: KEY UPDATES AND REVISIONS FOR EACH TIER OF THE GAFSP M&E FRAMEWORK .............................................................. 5 TABLE 2: TIER 2 INDICATORS FOR ALL GAFSP PROJECTS .......................................................................................................... 13 TABLE 3: AGREED TIER 3 KEY PERFORMANCE/PROGRAM MANAGEMENT INDICATORS ..................................................................... 16
Annex Tables
TABLE A2.1: KEY FEATURES OF M&E TOOLS DURING THE PROJECT PREPARATION PHASE ................................... 32
TABLE A2.2: KEY FEATURES OF M&E TOOLS DURING THE PROJECT IMPLEMENTATION PHASE ............................ 33
TABLE A2.3: KEY FEATURES OF M&E TOOLS AT THE PROJECT COMPLETION PHASE ............................................. 33
TABLE A2.4: KEY M&E TOOLS DURING PROJECT PREPARATION PHASE ................................................................ 34
TABLE A2.5: KEY FEATURES OF M&E TOOLS DURING THE PROJECT IMPLEMENTATION PHASE: ........................... 36
GAFSP Monitoring & Evaluation FINAL DRAFT May, 2017
ii
TABLE A2.6: KEY FEATURES OF M&E TOOLS AT THE PROJECT COMPLETION PHASE ............................................. 37
TABLE A2.7: IMPACT EVALUATION POLICY FOR GAFSP PUBLIC SECTOR WINDOW ............................................... 38
TABLE A2.8: TIMING OF ACTIONS UNDERTAKEN BY THE SUPERVISING ENTITIES, COORDINATION UNIT, AND STEERING COMMITTEE IN IMPLEMENTING THE GAFSP M&E PLAN ...................................................................... 39
Figures
FIGURE 1: GAFSP THEORY OF CHANGE [NOTE: UPDATED GRAPHIC IN PROCESS WITH DESIGN EDITORS – PLACEHOLDER FIGURE BELOW] ... 4
Boxes
BOX 1: GAFSP FRAMEWORK DOCUMENT AND M&E ............................................................................................................... 3 BOX 2: AGREED GAFSP TIER 1 GOALS AND TARGETS................................................................................................................ 7 BOX 3: SUMMARY CHECKLIST OF OPERATIONAL REQUIREMENTS FOR TRACKING TIER 1 INDICATORS FOR PROJECTS UNDER PUBLIC AND
PRIVATE SECTOR WINDOWS........................................................................................................................................ 9 BOX 4: SUMMARY CHECKLIST OF OPERATIONAL REQUIREMENTS FOR TRACKING TIER 2 INDICATORS FOR PROJECTS UNDER PUBLIC AND
PRIVATE SECTOR WINDOWS...................................................................................................................................... 15
Annex Boxes
BOX A1.1: BASIC FEATURES OF IMPACT EVALUATIONS ............................................................................................................. 20 BOX A1.2: OPTIONS FOR IMPACT EVALUATION DESIGN ............................................................................................................ 22 BOX A2.1: STEPS TO SECURE APPROVAL FOR IN-DEPTH PROJECT IMPACT EVALUATIONS, AND RESPONSIBILITIES OF THE TASK TEAM, IMPACT
EVALUATION PARTNER, AND SUPERVISING ENTITY ................................................................................................................... 39
GAFSP Monitoring & Evaluation FINAL DRAFT May, 2017
iii
ACRONYMS AND ABBREVIATIONS CAADP Comprehensive Africa Agriculture Development Program
CU Coordination Unit
DIME Development Impact Evaluation
ERR Economic rate of return
FAO Food and Agriculture Organization of the United Nations
FCS Food Consumption Score
FCV Fragility, conflict, and violence
FIES Food Insecurity Experience Scale
FTE Full-time equivalent
GAFSP Global Agriculture and Food Security
ha Hectare
IE Impact evaluation
IFAD International Fund for Agricultural Development
IFC International Finance Corporation
IFPRI International Food Policy Research Institute
km Kilometer
M&E Monitoring and evaluation
MDD-C Minimum Dietary Diversity of Young Children
MDD-W Minimum Dietary Diversity of Women
MMI Missing Middle Initiative
QE Quasi-experimental
RUTF Ready to Use Therapeutic Food
ReSAKSS Regional Strategic Analysis and Knowledge Support System
SAKSS Strategic Analysis and Knowledge Support System
SC Steering Committee
SDG Sustainable Development Goal
SE Supervising Entity
TA Technical assistance
TTL Task Team Leader
UN United Nations
WFP World Food Programme
GAFSP Monitoring & Evaluation FINAL DRAFT May, 2017
1
1 OVERVIEW OF THE PLAN AND GAFSP FRAMEWORK
1.1 Development and Organization of the Updated M&E Plan
1. The monitoring and evaluation (M&E) of project performance consists of tracking human,
physical, and financial resources and recording how they are converted into outputs (goods and
services delivered through the project) and, in turn, into outcomes and impacts. Timely, regular
reporting of that information provides input for project planning and budgeting and may also
contribute evidence and learning to improve the performance of on-going projects and the
design of future projects.
2. To that end, this updated and revised M&E Plan1 for projects funded under the Global
Agriculture and Food Security Program (GAFSP) serves two main purposes. First, it highlights the
key features of the updated GAFSP M&E Framework, including tools, indicators, and reporting
requirements; second, it explains how they are applied at various stages of the project cycle for
operations funded under the GAFSP Public and Private Sector Windows. In that sense, this plan
is intended to be a manual or guide for the Supervising Entities (SEs) and Coordination Unit (CU)
charged with managing M&E for GAFSP-funded projects.
3. The original GAFSP M&E Plan (for the Public Sector Window) was approved by the GAFSP
Steering Committee (SC) in 2011, when the Public Sector Window portfolio consisted of only a
few projects under preparation, and the Private Sector Window was not yet operational. The
Private Sector Window adopted its M&E Framework in 2013. The updated plan presented here
operationalizes the revised M&E indicators for GAFSP (for both the Public and Private Sector
Windows) as approved by the SC in April 2016. The updated plan harmonizes M&E functions
across the two Windows to the extent possible. It also incorporates lessons from the experience
with M&E for GAFSP to date, and it explicitly links the collection of information and reporting of
results for GAFSP-supported initiatives to the implementation and accountability framework for
the Sustainable Development Goals (SDGs). Readers should note that parts of this document
refer to GAFSP Public Sector Window projects only, where noted, and some sections refer
explicitly to the Private Sector Window or the International Finance Corporation (IFC).
4. The remainder of this first section recaps the basic objectives of GAFSP (as specified in the
GAFSP Framework Document) and reviews the M&E Framework for GAFSP, which is a three-
tiered system of indicators that help to advance GAFSP goals. Sections 2, 3, and 4 then discuss
each of the three tiers, listing all indicators that support M&E of inputs, outputs, and outcomes
from GAFSP support under the Public and Private Sector Windows. To help the GAFSP SEs
implement these updated M&E guidelines and indicators, and to further the harmonization of
monitoring and reporting across SEs, Annex 1 provides full details on all of the indicators, their
definitions, and measurement methodologies. Annex 2 summarizes implementation guidelines
1 This document benefits from input from Supervising Entities, Steering Committee members, the World Bank Institute’s Mapping for Results Initiative for geo-referencing, and the International Food Policy Research Institute (IFPRI).
GAFSP Monitoring & Evaluation FINAL DRAFT May, 2017
2
and an M&E toolkit that are specific to operations funded under the Public Sector Window, and
Annex 3 provides specific guidance on processes related to the Private Sector Window.
1.2 The GAFSP Monitoring and Evaluation Framework
5. M&E has long been a important consideration of all key GAFSP stakeholders. Around the
time that GAFSP was launched, the Global Donor Platform for Rural Development, FAO, and
World Bank cooperated to update good practice and develop a sourcebook of practical M&E
indicators.2 More recently (October 2016), the UN Sustainable Development 2030 Agenda
initiated a process to develop and adopt a revised set of indicators for monitoring and evaluating
global targets and goals relevant to poverty reduction and food security.3
6. Acknowledgments of the importance and value of M&E are no guarantee that practice will
match the stated ambitions, however,4 and the development community continues to call for
stronger compliance and performance in monitoring results. GAFSP approaches M&E with full
due diligence so that all parties concerned can monitor progress effectively, use monitoring data
to inform appropriate managerial actions, and undertake evaluations to determine what was
achieved through the program interventions. Individual SEs are encouraged to harmonize,
wherever possible, their M&E processes to ensure that results from individual investments and
programs can contribute to country-level monitoring on food security and reaching the SDGs in
general. In the same spirit, in the cases where two or more SEs are involved in the same
operation or related operations supported by GAFSP, all efforts should be made to align
objectives and harmonize M&E processes among SEs in order to increase the synergy – during
both design and implementation.
7. In line with the basic rules and principles outlined in the GAFSP Framework Document (Box
1), the M&E Framework for GAFSP is organized on the basis of three tiers, corresponding to
program or impact goals (Tier 1), “core” project results indicators (Tier 2), and portfolio
performance indicators (Tier 3). At its January 2016 meeting in Kigali, the SC of GAFSP reviewed
and subsequently endorsed a new set of indicators for GAFSP for each tier of the Framework,
based on a Theory of Change approach that tracks the direct and indirect causal linkage between
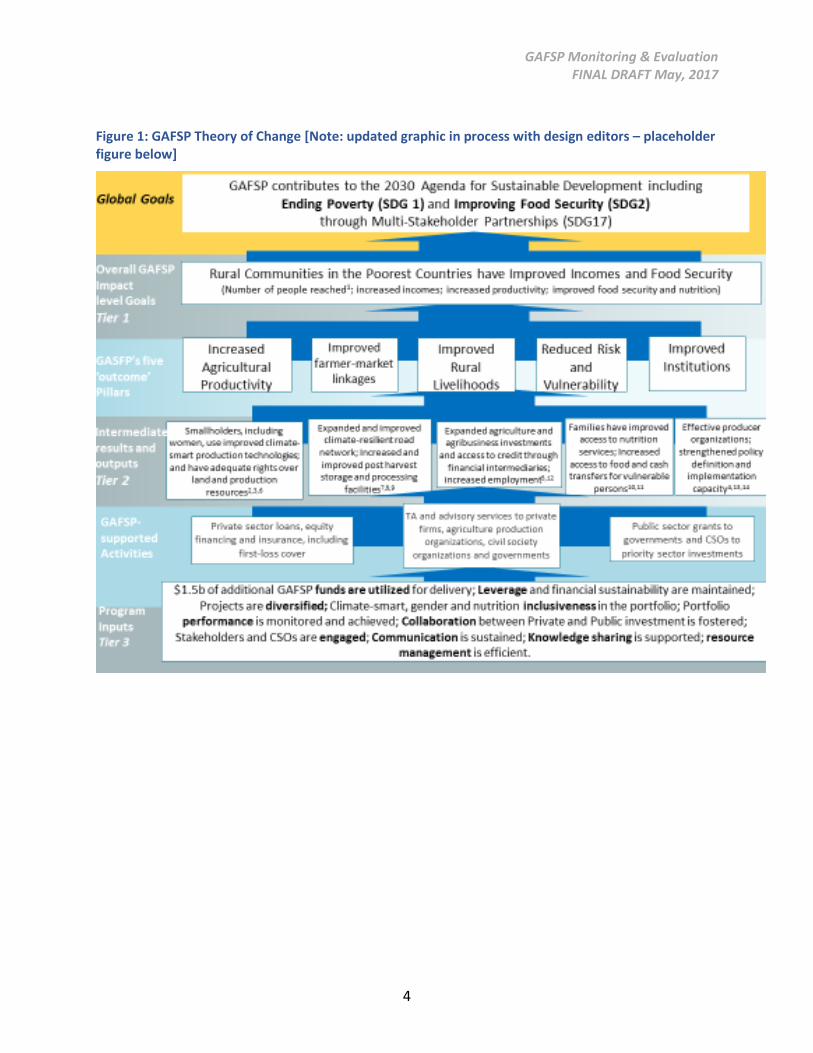
inputs, outputs, intermediary outcomes, and final outcomes. The GAFSP Theory of Change
(Figure 1) is built on the causal chains that lead to achieving the goals of increased rural incomes
and food security through the five outcome pillars of the original framework agreed at the
inception of GAFSP, whether through the Public Sector Window or the Private Sector Window.
The five outcome pillars consist of: (1) increased agricultural productivity; (2) linking farmers to
2 GDPRD, FAO, and World Bank (2008). 3 See the Resolution of the UN General Assembly (http://www.un.org/ga/search/view_doc.asp?symbol=A/RES/70/1&Lang=E) and the Report of the Inter-Agency and Expert Group on Sustainable Development Goal Indicators (http://unstats.un.org/unsd/statcom/47th-session/documents/2016-2-IAEG-SDGs-Rev1-E.pdf). 4 See IEG (2009: 27).
GAFSP Monitoring & Evaluation FINAL DRAFT May, 2017
3
market5; (3) reducing risk and vulnerability (including improving nutrition); (4) improving non-
farm rural livelihoods; and (5) institution and capacity building. The new indicators were
approved in their final form in April 2016. Table 1 summarizes the key updates and revisions of
indicators for each tier.
Box 1: Basic monitoring and evaluation information from the GAFSP Framework document
GAFSP Program Objective: The Global Agriculture and Food Security Program (GAFSP) aims to improve the income and food security of poor people in developing countries through more and better public and private sector investment in the agriculture and rural sectors that is country-owned and led and through technical assistance.
Program Level Indicators: (1) Additional financing provided through GAFSP and (2) Number of people (disaggregated by gender) directly benefitting from investments to improve income and food security funded by the GAFSP.
Component Level Indicators: The Framework document includes several core indicators for four out of five components of GAFSP. Furthermore, the document mentions that: (1) an expanded set of core indicators would be developed to capture intermediate outcomes and outputs of the different investments envisaged under GAFSP; (2) baseline values and targets are not specified, as they depend on the specific country-level programs implemented under GAFSP; and (3) SEs are expected to commission independent evaluations of the activities they implement under GAFSP for overall accountability and in order to facilitate lesson learning and knowledge sharing on the investment impact of agriculture and food security activities.
Using an in-depth working group process carried out through 2015, the GAFSP Steering Committee (SC) took stock of M&E practice and results to date. While still governed by the GAFSP Framework document, the resulting recommendations agreed by the SC in April 2016 focus principally on: (1) bringing the Private and Public Sector Windows under an overall GAFSP M&E framework; (2) the aggregation, to the degree possible, of project-level core indicators into a more strategic number of results indicators; and (3) the explicit monitoring of priority thematic objectives (nutrition and food security; climate-smart operations, and so on).
Source: Annex 1, GAFSP Framework document.
5 The concept of market here envelopes local, regional and national markets which can be in rural, urban or peri-urban areas.
GAFSP Monitoring & Evaluation FINAL DRAFT May, 2017
4
Figure 1: GAFSP Theory of Change [Note: updated graphic in process with design editors – placeholder figure below]
GAFSP Monitoring & Evaluation FINAL DRAFT May, 2017
5
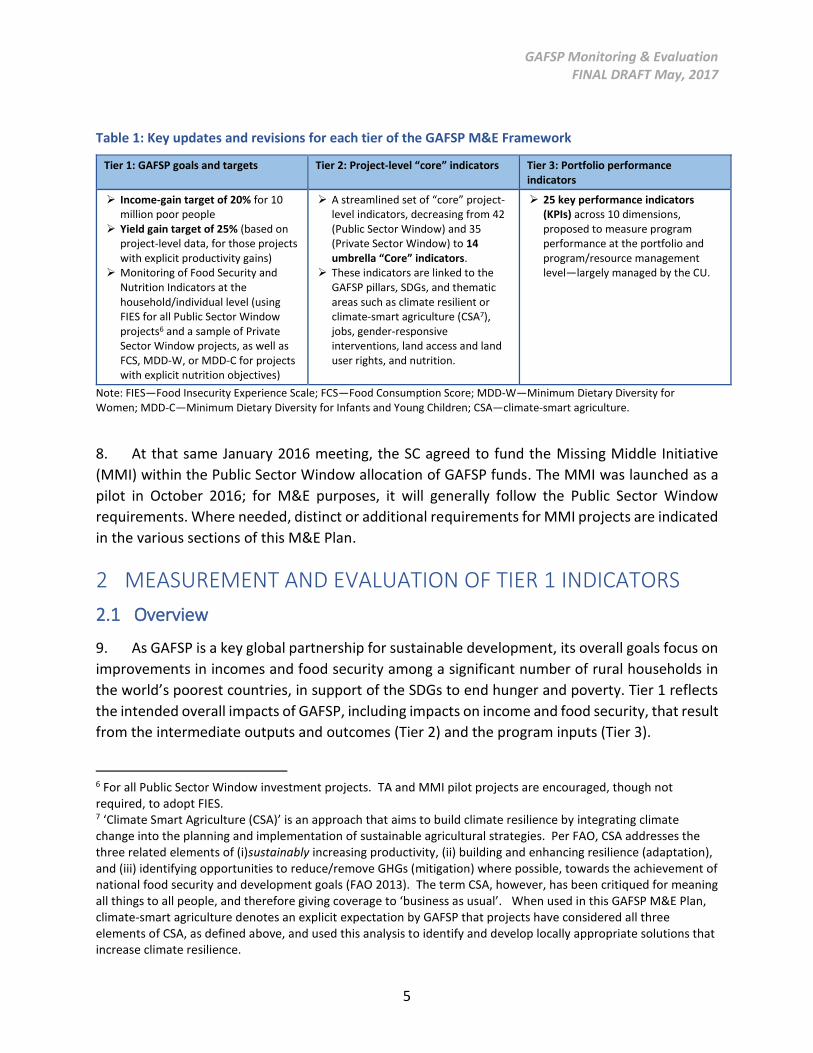
Table 1: Key updates and revisions for each tier of the GAFSP M&E Framework
Tier 1: GAFSP goals and targets Tier 2: Project-level “core” indicators Tier 3: Portfolio performance indicators
Income-gain target of 20% for 10 million poor people
Yield gain target of 25% (based on project-level data, for those projects with explicit productivity gains)
Monitoring of Food Security and Nutrition Indicators at the household/individual level (using FIES for all Public Sector Window projects6 and a sample of Private Sector Window projects, as well as FCS, MDD-W, or MDD-C for projects with explicit nutrition objectives)
A streamlined set of “core” project-level indicators, decreasing from 42 (Public Sector Window) and 35 (Private Sector Window) to 14 umbrella “Core” indicators.
These indicators are linked to the GAFSP pillars, SDGs, and thematic areas such as climate resilient or climate-smart agriculture (CSA7), jobs, gender-responsive interventions, land access and land user rights, and nutrition.
25 key performance indicators (KPIs) across 10 dimensions, proposed to measure program performance at the portfolio and program/resource management level—largely managed by the CU.
Note: FIES—Food Insecurity Experience Scale; FCS—Food Consumption Score; MDD-W—Minimum Dietary Diversity for Women; MDD-C—Minimum Dietary Diversity for Infants and Young Children; CSA—climate-smart agriculture.
8. At that same January 2016 meeting, the SC agreed to fund the Missing Middle Initiative
(MMI) within the Public Sector Window allocation of GAFSP funds. The MMI was launched as a
pilot in October 2016; for M&E purposes, it will generally follow the Public Sector Window
requirements. Where needed, distinct or additional requirements for MMI projects are indicated
in the various sections of this M&E Plan.
2 MEASUREMENT AND EVALUATION OF TIER 1 INDICATORS
2.1 Overview
9. As GAFSP is a key global partnership for sustainable development, its overall goals focus on
improvements in incomes and food security among a significant number of rural households in
the world’s poorest countries, in support of the SDGs to end hunger and poverty. Tier 1 reflects
the intended overall impacts of GAFSP, including impacts on income and food security, that result
from the intermediate outputs and outcomes (Tier 2) and the program inputs (Tier 3).
6 For all Public Sector Window investment projects. TA and MMI pilot projects are encouraged, though not required, to adopt FIES. 7 ‘Climate Smart Agriculture (CSA)’ is an approach that aims to build climate resilience by integrating climate change into the planning and implementation of sustainable agricultural strategies. Per FAO, CSA addresses the three related elements of (i)sustainably increasing productivity, (ii) building and enhancing resilience (adaptation), and (iii) identifying opportunities to reduce/remove GHGs (mitigation) where possible, towards the achievement of national food security and development goals (FAO 2013). The term CSA, however, has been critiqued for meaning all things to all people, and therefore giving coverage to ‘business as usual’. When used in this GAFSP M&E Plan, climate-smart agriculture denotes an explicit expectation by GAFSP that projects have considered all three elements of CSA, as defined above, and used this analysis to identify and develop locally appropriate solutions that increase climate resilience.
GAFSP Monitoring & Evaluation FINAL DRAFT May, 2017
6
10. Both the number of beneficiaries reached and income increases (rather than number of
people lifted out of poverty) are the ex-ante higher-level goals for GAFSP, in line with the
Program’s foundational focus on poverty and food security. For hunger and food security, the
Program will use the Food Insecurity Experience Scale (FIES) and early in 2017 will explore the
feasibility of targets associated with this indicator.
GAFSP Monitoring & Evaluation FINAL DRAFT May, 2017
7
2.2 Approach to the Selection of Tier 1 Indicators
11. Through a review process led by a technical working group, the following approaches were
used to select each set of indicators:
Beneficiaries and income increases: The working group strongly supported using both the
number of beneficiaries reached and income increases as aspirational ex-ante goals. Income
increases were selected over poverty reduction targets, given that many GAFSP beneficiaries
are significantly below the international extreme poverty line: average incomes of the poor in
low-income countries would need to increase by 60 percent to reach the international extreme
poverty line. The estimate of projected income increases is based on a “representative”
household that GAFSP programs are likely to reach. The key assumption in establishing the
target values is that farmers reached (under both GAFSP windows) are poor and will witness
similar income gains over the five-year horizon.
Productivity: A significant part of any income increase will be driven by farm productivity
improvements—with the related SDG target to double agricultural productivity of small-scale
producers by 2030. Therefore, raising crop yields8 was selected as an explicit objective for those
projects with productivity aims.
Nutrition, hunger, and food security: A measure of food insecurity, rather than explicit changes
in hunger/stunting, was assessed to be the most feasible approach among various alternatives
considered. The Food Insecurity Experience Scale (FIES)9, developed by FAO, was selected based
on the use of extensive external validation criteria focusing (for example) on whether the
indicator: (1) is an SDG indicator or correlates highly with the SDG nutrition indicators (such as
stunting), (2) is relatively low cost to collect information, and (3) has wide country coverage.
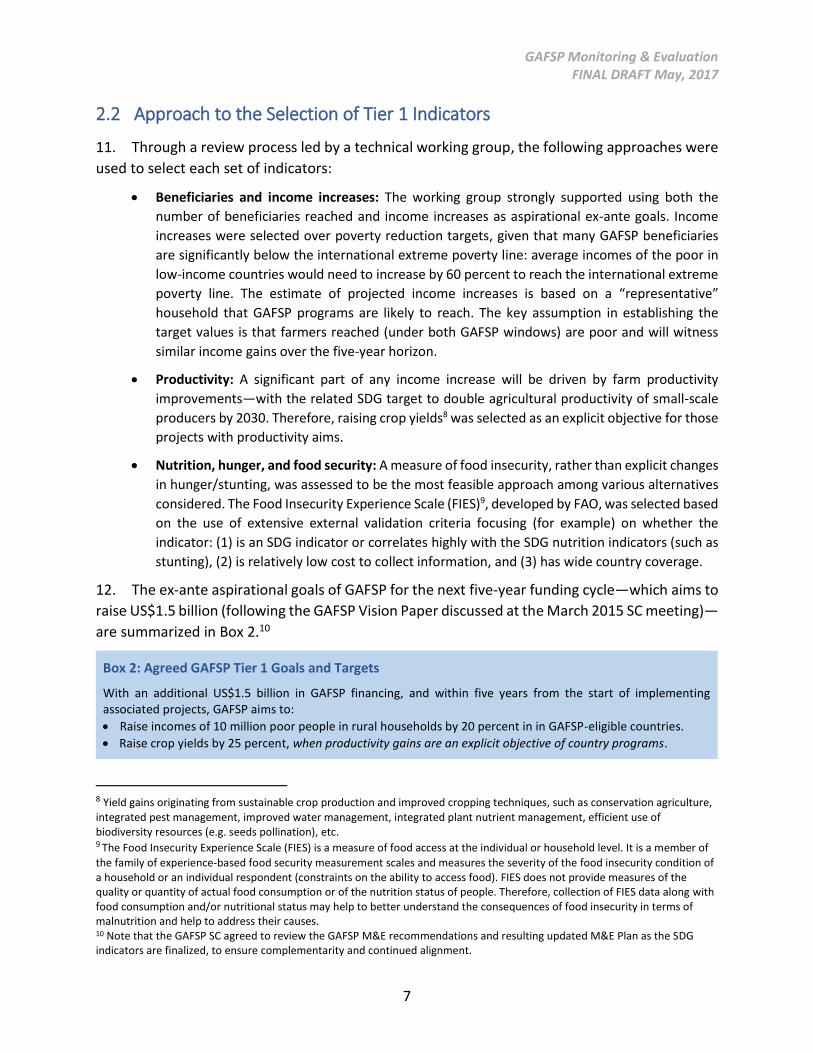
12. The ex-ante aspirational goals of GAFSP for the next five-year funding cycle—which aims to
raise US$1.5 billion (following the GAFSP Vision Paper discussed at the March 2015 SC meeting)—
are summarized in Box 2.10
Box 2: Agreed GAFSP Tier 1 Goals and Targets
With an additional US$1.5 billion in GAFSP financing, and within five years from the start of implementing associated projects, GAFSP aims to:
Raise incomes of 10 million poor people in rural households by 20 percent in in GAFSP-eligible countries.
Raise crop yields by 25 percent, when productivity gains are an explicit objective of country programs.
8 Yield gains originating from sustainable crop production and improved cropping techniques, such as conservation agriculture, integrated pest management, improved water management, integrated plant nutrient management, efficient use of biodiversity resources (e.g. seeds pollination), etc. 9 The Food Insecurity Experience Scale (FIES) is a measure of food access at the individual or household level. It is a member of
the family of experience-based food security measurement scales and measures the severity of the food insecurity condition of a household or an individual respondent (constraints on the ability to access food). FIES does not provide measures of the quality or quantity of actual food consumption or of the nutrition status of people. Therefore, collection of FIES data along with food consumption and/or nutritional status may help to better understand the consequences of food insecurity in terms of malnutrition and help to address their causes. 10 Note that the GAFSP SC agreed to review the GAFSP M&E recommendations and resulting updated M&E Plan as the SDG indicators are finalized, to ensure complementarity and continued alignment.

GAFSP Monitoring & Evaluation FINAL DRAFT May, 2017
8
Implicit in these goals is the need for a concerted effort to increase climate resilience and offset any negative effects on agricultural productivity from climate change, to which the poorest countries are the most vulnerable.
GAFSP will also measure progress toward food security by:
Using the Food Insecurity Experience Scale (FIES) to track progress on food security of all Public Sector Window–supported households11 and a sample of Private Sector Window–supported households;
Using the Food Consumption Score (FCS) to track progress on improving dietary diversity of households or, for individuals, using the Minimum Dietary Diversity of Women/Young Children (MDD-W/C) where nutrition is an explicit objective in GAFSP projects.
Developing targets on higher-level goals of reducing prevalence of food insecurity (as measured by the FIES)12 as more information on this relatively new measure becomes available.
2.3 Approach to Measurement and Verification (Tier 1)
13. The intent is that all Public Sector Window investment projects and a sample of Private
Sector Window projects will have both an income measure and a food security measure (FIES).
A smaller share of projects is expected to have a productivity measure (about 50 percent, based
on ongoing projects) and a more specific “nutrition”-related measure (less than 50 percent,
based on ongoing GAFSP projects). It is difficult to stipulate these exact shares upfront as both
Windows are demand-driven, with the GAFSP Public Sector Window responding to country policy
and priority needs, which leads to variation in the dimensions that are prioritized by each project
and captured in respective projects.
Income is measured through a production-based approach (revenues minus costs), and home-
produced food that is not sold but is consumed by the household is valued as income. The
Private Sector Window is also piloting the use of the SWIFT tool, developed by the World Bank,
to estimate income. These approaches are preferred over the use of consumption-expenditure
surveys, which are more time consuming, more costly, and less practical for the purposes of a
mandatory indicator (especially for the 70 percent of projects that are expected to undertake a
“rapid” assessment as per the GAFSP SC decision). GAFSP anticipates using income data
generated from the subset of the portfolio that will be using statistically-grounded impact
evaluations (both experimental and quasi-experimental). See Annex 1 for more detail.
The standard methodologies for FIES, FCS, MDD-W, and MDD-C will be used. A separate “roll-
out” program will begin in January 2017 for GAFSP M&E systems to start implementing these
indicators focused on food security and nutrition. The roll-out program will include capacity
building of SE’s monitoring and evaluation teams.
11For all Public Sector Window investment projects. TA and MMI pilot projects are encouraged, though not required, to adopt FIES. 12 Based on agreement with the GAFSP Steering Committee in January 2016, the CU has committed to undertake an exercise that lays out the feasibility and approach of estimating an indicative FIES target. The study will explore different types (Micro-level and Macro-level) data and statistically grounded methodologies, consistent with country-specific contexts. The preliminary findings of the study will be presented at the March 2017 Steering Committee.
GAFSP Monitoring & Evaluation FINAL DRAFT May, 2017
9
Crop yields are value weighted across crops at the farm level. The methodology for value-
weighted yield measurement is based on consultation with those SEs that support governments
in implementing GAFSP-funded operations and whose teams determine—with government
counterparts—the nature and frequency of data collection. Overall, GAFSP proposes using a
unified way of addressing specific issues such as the value of agricultural products consumed by
households, crops, fisheries, or livestock, among others. This indicator will apply only to those
projects with explicit productivity gain goals.
2.4 Approach to Tracking Tier 1 Indicators: Impact Evaluation
14. Both the Public Sector Window and the Private Sector Window monitor Tier 1 results and
conduct impact evaluations (IEs) within the framework of the Tier 1 indicators described
previously. Annex 1 further defines these Tier 1 indicators in relation to both windows. Annexes
2 and 3 present the specific operational requirements for the Public Sector Window and Private
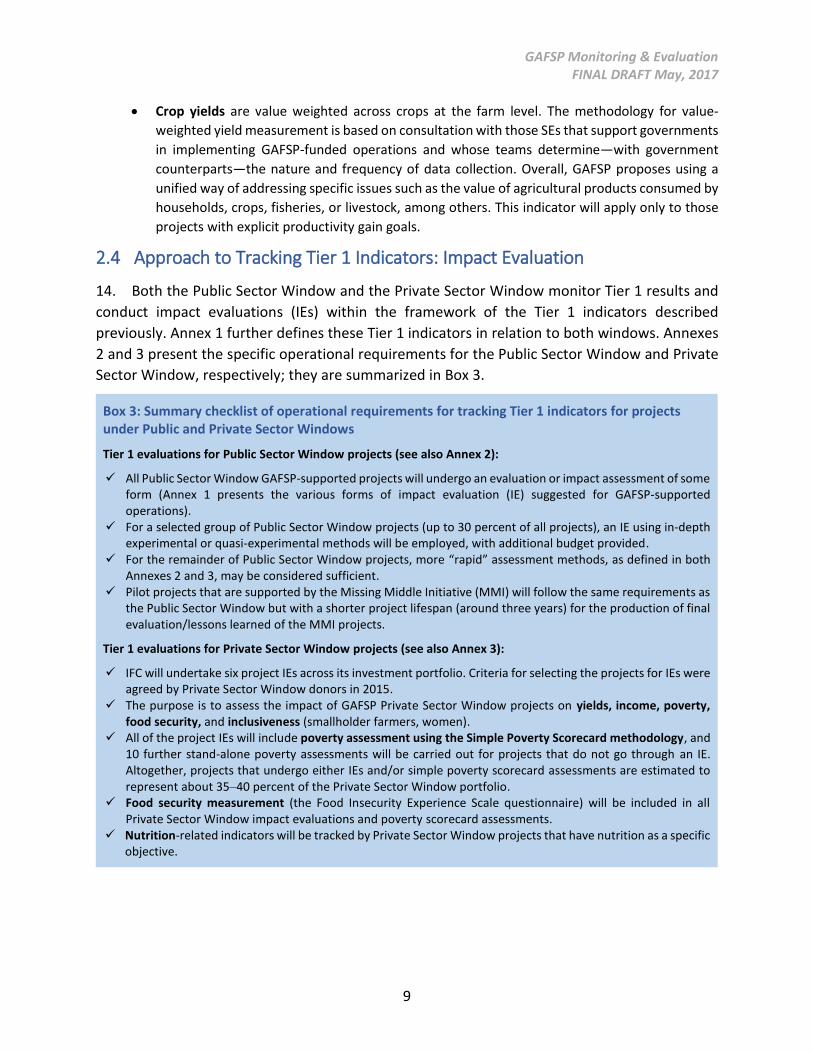
Sector Window, respectively; they are summarized in Box 3.
Box 3: Summary checklist of operational requirements for tracking Tier 1 indicators for projects under Public and Private Sector Windows
Tier 1 evaluations for Public Sector Window projects (see also Annex 2):
All Public Sector Window GAFSP-supported projects will undergo an evaluation or impact assessment of some form (Annex 1 presents the various forms of impact evaluation (IE) suggested for GAFSP-supported operations).
For a selected group of Public Sector Window projects (up to 30 percent of all projects), an IE using in-depth experimental or quasi-experimental methods will be employed, with additional budget provided.
For the remainder of Public Sector Window projects, more “rapid” assessment methods, as defined in both Annexes 2 and 3, may be considered sufficient.
Pilot projects that are supported by the Missing Middle Initiative (MMI) will follow the same requirements as the Public Sector Window but with a shorter project lifespan (around three years) for the production of final evaluation/lessons learned of the MMI projects.
Tier 1 evaluations for Private Sector Window projects (see also Annex 3):
IFC will undertake six project IEs across its investment portfolio. Criteria for selecting the projects for IEs were agreed by Private Sector Window donors in 2015.
The purpose is to assess the impact of GAFSP Private Sector Window projects on yields, income, poverty, food security, and inclusiveness (smallholder farmers, women).
All of the project IEs will include poverty assessment using the Simple Poverty Scorecard methodology, and 10 further stand-alone poverty assessments will be carried out for projects that do not go through an IE. Altogether, projects that undergo either IEs and/or simple poverty scorecard assessments are estimated to represent about 35–40 percent of the Private Sector Window portfolio.
Food security measurement (the Food Insecurity Experience Scale questionnaire) will be included in all Private Sector Window impact evaluations and poverty scorecard assessments.
Nutrition-related indicators will be tracked by Private Sector Window projects that have nutrition as a specific objective.
GAFSP Monitoring & Evaluation FINAL DRAFT May, 2017
10
2.5 Implementing Arrangements for Impact Evaluations
Evaluation by a recognized research entity
15. The impacts of GAFSP projects should be evaluated by a recognized research entity with a
track record of conducting IEs.13 This is to ensure that the quality of the work (data collection and
analysis) is high, and also for them to maintain a certain level of independence from the project
as they carry out their work. Annexes 2 and 3 provide specific details on good practices for
implementing such evaluations for projects funded under the Public and Private Sector Windows,
respectively. Some reference materials may also be useful. 14
16. Under all design scenarios, the research entity should start engaging with the project –
including its primary stakeholders - as soon as possible. Engagement should start in the project
preparation phase if feasible, to ensure that proper baseline data are collected, and periodic field
visits should also take place as necessary. While technical rigor is a key concern, GAFSP as a
program also places high value on broad-based consultation and stakeholder participation in the
IE design and delivery process, and encourages engagement of field-level stakeholders and
primary beneficiaries (e.g., farmers) throughout.
Roles of SEs and CU in Tier 1 indicators and impact evaluation
17. The SEs (supporting their client counterparts) ensure the design of the M&E system for
individual operations under the Public Sector Window and Private Sector Window (IFC), including
the establishment of an appropriate baseline and the planning for and undertaking of
evaluations, including the collection of relevant data for Tier 1 indicators.
18. Although SE project teams are instrumental in ensuring the collection and reporting of
specific Tier 1 indicators at the project level, the CU plays a role in reviewing/advising where
necessary, reports on the aggregate evaluation to the SC, and disseminates it to the public
through the GAFSP website. For example, the CU reports to the SC on IEs both individually and
13 They could include universities, research organizations such as IFPRI, the Development Impact Evaluation (DIME) initiative of the World Bank, Brookings Institution, Center for Global Development, regional technical organizations, or initiatives such as 3IE (www.3ieimpact.org). 14 The needs vary considerably, so it is not easy to provide general guidance or a small number of overarching models to serve as examples. Even so, a convenient source of guidance and examples of practice is the IFPRI website, which has data and analysis from several surveys in Bangladesh related to nutrition and poverty (http://www.ifpri.org/publication/contribution-ifpri-research-and-impact-food-education-program-bangladesh-schooling-outco; http://www.ifpri.org/dataset/chronic-poverty-and-long-term-impact-study-bangladesh http://www.ifpri.org/dataset/impact-evaluation-food-education-program-bangladesh-2000); a survey and analysis of the nutritional impact of policies in Malawi (http://www.ifpri.org/publication/analyzing-nutritional-impact-policies-malawi); and a baseline survey and initial results for the World Bank’s Uganda NAADS project (http://www.ifpri.org/publication/assessing-impact-national-agricultural-advisory-services-naads-uganda-rural-livelihoods), for example.
GAFSP Monitoring & Evaluation FINAL DRAFT May, 2017
11
across the GAFSP portfolio—tracking/reporting progress for those projects carrying out IEs in
depth, and summarizing results at completion for all projects. The CU supports the cohort of
projects carrying out IEs in depth and advises project teams, if needed, in carrying out their rapid
assessments. Where needed, and especially for any indicators that may be updated or
introduced into Tier 1, the CU is responsible for the coordination, definition, and rollout of those
indicators. For example, in 2016 by the SC agreed that the FIES was to be adopted as part of the
M&E framework and rolled out in 2017.
19. In January 2017, and in collaboration with FAO’s Voices of the Hungry team, a program was
initiated to build capacity and implement this indicator in GAFSP operations. During the FIES
workshop, January 2017, the Voices of Hungry (VoH) team and members of GAFSP CU agreed to
strengthen the FIES data repository, which aspires to include national level and project level data
for all relevant GAFSP countries fielding FIES. To adhere to the commitment of SDG2
accountability, GAFSP strongly encourages SE partners and recipient governments to strengthen
data collection and ensure accessibility of FIES survey data. Availability and accessibility of raw
FIES survey data will be contingent on the data disclosure policy of the recipient government’s
national statistics.
3 MONITORING AND REPORTING OF TIER 2 INDICATORS
3.1 Overview
20. Tier 2 captures the project-level results. Indicators were selected based on their capacity to
make a direct contribution to achieving the Tier 1 goals through the five outcome pillars
(described earlier) and the overarching SDGs.
3.2 Approach to the selection of Tier 2 indicators
21. Since the inception of GAFSP, the principle of following pre-existing SE protocols and
standard formats has applied to the overall M&E Plan, and the updated plan reflects this
important principle. The updated list of Tier 2 indicators (Table 2), which cover operations under
both the Public and Private Sector Windows, is based on the following principles and findings:
Relevant: The indicators should measure progress toward priorities enunciated in the Tier 1
overall goals of GAFSP. They should also reflect the GAFSP Framework Document, subsequent
lessons learned from operations under the Public and Private Sector Windows, and feedback
from GAFSP SEs and project team leaders. The indicators should help assess the impact of
individual GAFSP projects in terms of the current poverty and food security systems and should
anticipate data needs for the near future.
Measurable: The proposed indicators should have clear and unambiguous definitions and
methodologies.
Aggregable: Data for most of the proposed indicators should be available immediately by
logically grouping current indicators for the existing portfolio. The indicators should also be
GAFSP Monitoring & Evaluation FINAL DRAFT May, 2017
12
designed to be aggregable, as far as possible, across both current windows and the MMI “pilot”
under GAFSP. Shared indicators also make it possible to draw a fuller picture of the total impact
of the GAFSP.
Flexible: Individual SEs are not expected to have operations that fulfill all of the common
indicators, but they are expected to report on all of those indicators that are applicable in any
GAFSP-financed operation. Individual SEs will continue to track additional indicators of
relevance to their operations.
Indicators at the output and intermediate outcome levels (Tier 2)
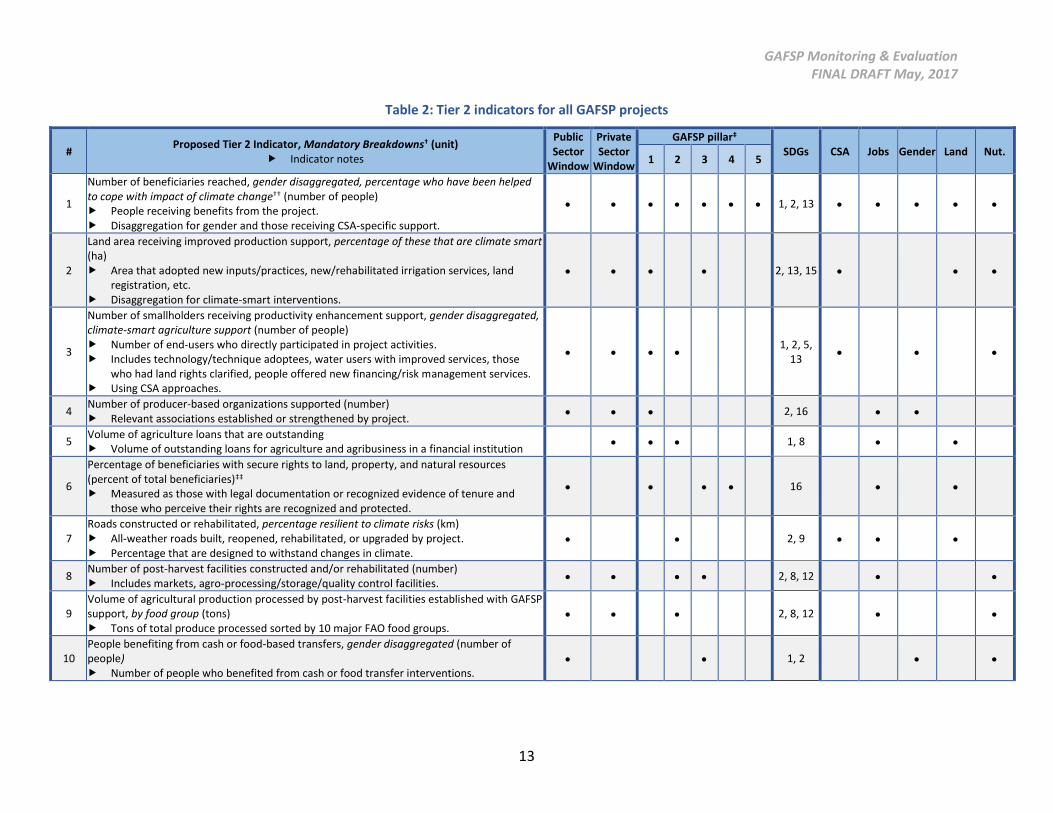
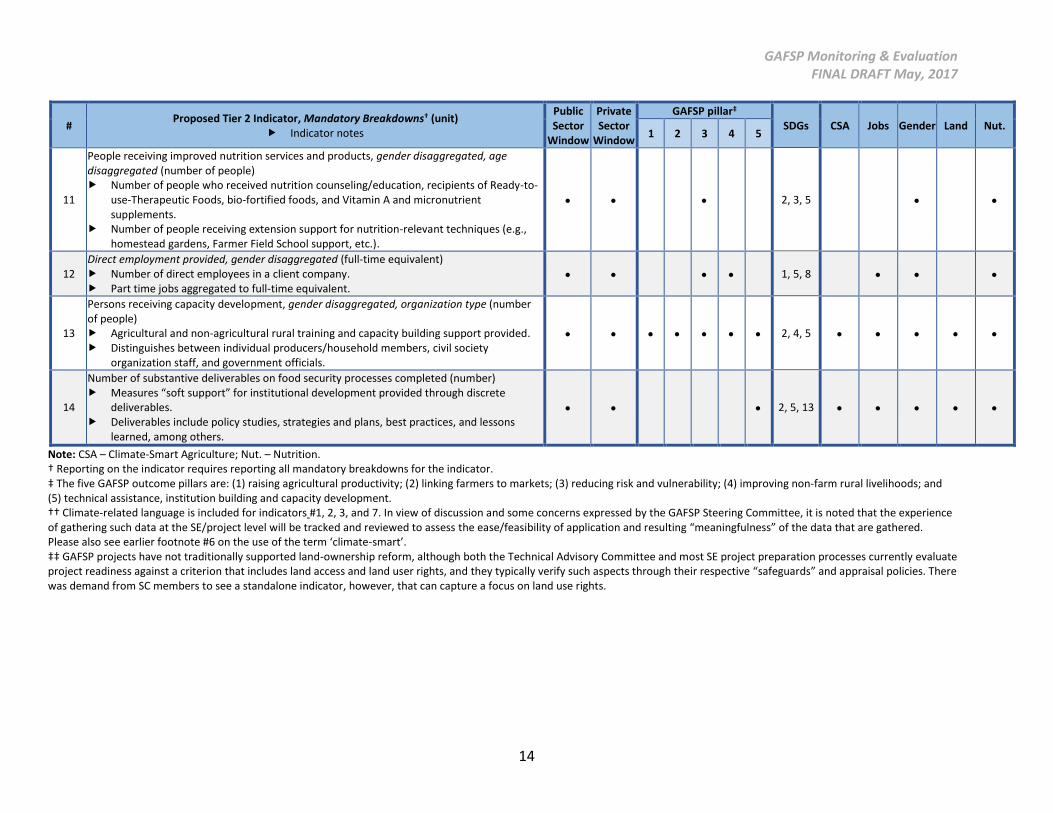
22. Table 2 lists output and outcome indicators that aim to provide aggregable data coverage,
consistency, and the ability to measure efforts under GAFSP to improve agricultural productivity
and ensure food security. Reporting will take place on a six-monthly basis for the Public Sector
Window and annually for the Private Sector Window. Most of these indicators are relevant to
both Windows; Table 2 indicates their applicability to each, their linkages to the five GAFSP
outcome pillars and SDGs, and their relevance to thematic areas of interest, such as climate-
smart agriculture (CSA), jobs, gender-responsive interventions, land access and land user rights,
and nutrition. SEs will continue to maintain additional customized indicators as dictated by their
specific business models and by project and institutional requirements.
GAFSP Monitoring & Evaluation FINAL DRAFT May, 2017
13
Table 2: Tier 2 indicators for all GAFSP projects
# Proposed Tier 2 Indicator, Mandatory Breakdowns† (unit)
Indicator notes
Public Sector
Window
Private Sector
Window
GAFSP pillar‡ SDGs CSA Jobs Gender Land Nut.
1 2 3 4 5
1
Number of beneficiaries reached, gender disaggregated, percentage who have been helped to cope with impact of climate change†† (number of people) People receiving benefits from the project. Disaggregation for gender and those receiving CSA-specific support.
1, 2, 13
2
Land area receiving improved production support, percentage of these that are climate smart (ha) Area that adopted new inputs/practices, new/rehabilitated irrigation services, land
registration, etc. Disaggregation for climate-smart interventions.
2, 13, 15
3
Number of smallholders receiving productivity enhancement support, gender disaggregated, climate-smart agriculture support (number of people) Number of end-users who directly participated in project activities. Includes technology/technique adoptees, water users with improved services, those
who had land rights clarified, people offered new financing/risk management services. Using CSA approaches.
1, 2, 5,
13
4 Number of producer-based organizations supported (number) Relevant associations established or strengthened by project.
2, 16
5 Volume of agriculture loans that are outstanding Volume of outstanding loans for agriculture and agribusiness in a financial institution
1, 8
6
Percentage of beneficiaries with secure rights to land, property, and natural resources (percent of total beneficiaries)‡‡ Measured as those with legal documentation or recognized evidence of tenure and
those who perceive their rights are recognized and protected.
16
7 Roads constructed or rehabilitated, percentage resilient to climate risks (km) All-weather roads built, reopened, rehabilitated, or upgraded by project. Percentage that are designed to withstand changes in climate.
2, 9
8 Number of post-harvest facilities constructed and/or rehabilitated (number) Includes markets, agro-processing/storage/quality control facilities.
2, 8, 12
9 Volume of agricultural production processed by post-harvest facilities established with GAFSP support, by food group (tons) Tons of total produce processed sorted by 10 major FAO food groups.
2, 8, 12
10 People benefiting from cash or food-based transfers, gender disaggregated (number of people) Number of people who benefited from cash or food transfer interventions.
1, 2
GAFSP Monitoring & Evaluation FINAL DRAFT May, 2017
14
# Proposed Tier 2 Indicator, Mandatory Breakdowns† (unit)
Indicator notes
Public Sector
Window
Private Sector
Window
GAFSP pillar‡ SDGs CSA Jobs Gender Land Nut.
1 2 3 4 5
11
People receiving improved nutrition services and products, gender disaggregated, age disaggregated (number of people) Number of people who received nutrition counseling/education, recipients of Ready-to-
use-Therapeutic Foods, bio-fortified foods, and Vitamin A and micronutrient supplements.
Number of people receiving extension support for nutrition-relevant techniques (e.g., homestead gardens, Farmer Field School support, etc.).
2, 3, 5
12 Direct employment provided, gender disaggregated (full-time equivalent) Number of direct employees in a client company. Part time jobs aggregated to full-time equivalent.
1, 5, 8
13
Persons receiving capacity development, gender disaggregated, organization type (number of people) Agricultural and non-agricultural rural training and capacity building support provided. Distinguishes between individual producers/household members, civil society
organization staff, and government officials.
2, 4, 5
14
Number of substantive deliverables on food security processes completed (number) Measures “soft support” for institutional development provided through discrete
deliverables. Deliverables include policy studies, strategies and plans, best practices, and lessons
learned, among others.
2, 5, 13
Note: CSA – Climate-Smart Agriculture; Nut. – Nutrition. † Reporting on the indicator requires reporting all mandatory breakdowns for the indicator. ‡ The five GAFSP outcome pillars are: (1) raising agricultural productivity; (2) linking farmers to markets; (3) reducing risk and vulnerability; (4) improving non-farm rural livelihoods; and (5) technical assistance, institution building and capacity development. †† Climate-related language is included for indicators #1, 2, 3, and 7. In view of discussion and some concerns expressed by the GAFSP Steering Committee, it is noted that the experience of gathering such data at the SE/project level will be tracked and reviewed to assess the ease/feasibility of application and resulting “meaningfulness” of the data that are gathered. Please also see earlier footnote #6 on the use of the term ‘climate-smart’. ‡‡ GAFSP projects have not traditionally supported land-ownership reform, although both the Technical Advisory Committee and most SE project preparation processes currently evaluate project readiness against a criterion that includes land access and land user rights, and they typically verify such aspects through their respective “safeguards” and appraisal policies. There was demand from SC members to see a standalone indicator, however, that can capture a focus on land use rights.
GAFSP Monitoring & Evaluation FINAL DRAFT May, 2017
15
3.3 Approach to Tracking Tier 2 Indicators
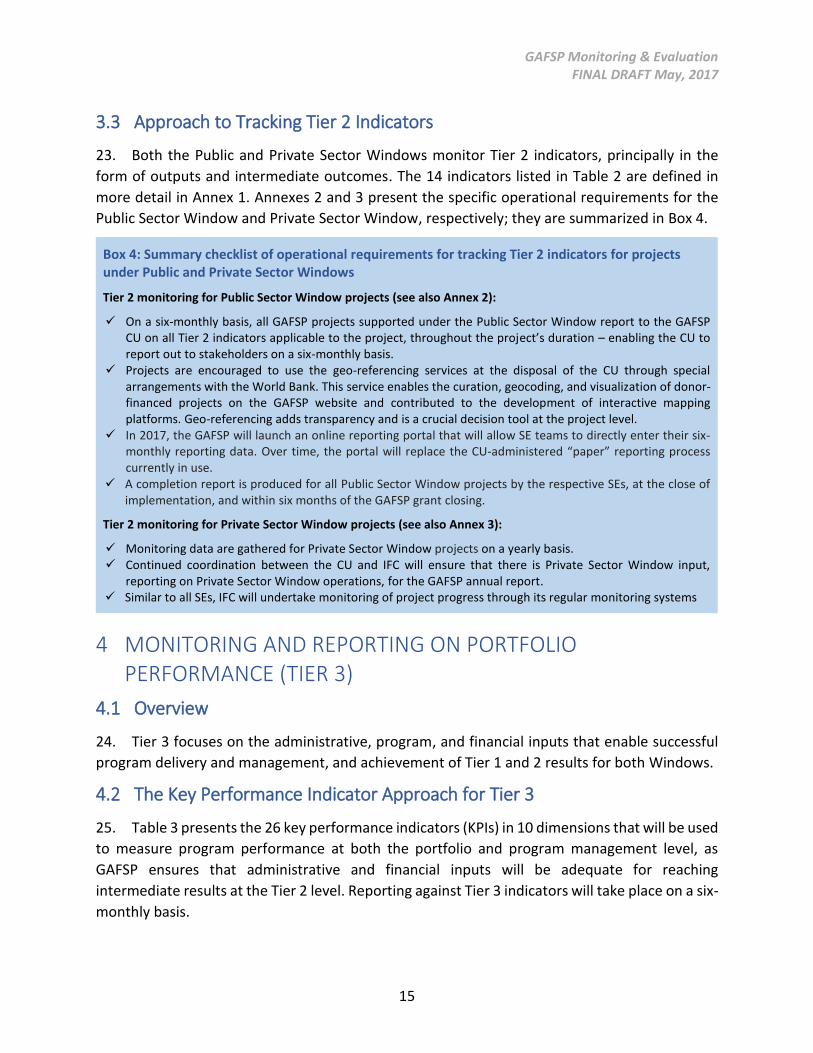
23. Both the Public and Private Sector Windows monitor Tier 2 indicators, principally in the
form of outputs and intermediate outcomes. The 14 indicators listed in Table 2 are defined in
more detail in Annex 1. Annexes 2 and 3 present the specific operational requirements for the
Public Sector Window and Private Sector Window, respectively; they are summarized in Box 4.
Box 4: Summary checklist of operational requirements for tracking Tier 2 indicators for projects under Public and Private Sector Windows
Tier 2 monitoring for Public Sector Window projects (see also Annex 2):
On a six-monthly basis, all GAFSP projects supported under the Public Sector Window report to the GAFSP CU on all Tier 2 indicators applicable to the project, throughout the project’s duration – enabling the CU to report out to stakeholders on a six-monthly basis.
Projects are encouraged to use the geo-referencing services at the disposal of the CU through special arrangements with the World Bank. This service enables the curation, geocoding, and visualization of donor-financed projects on the GAFSP website and contributed to the development of interactive mapping platforms. Geo-referencing adds transparency and is a crucial decision tool at the project level.
In 2017, the GAFSP will launch an online reporting portal that will allow SE teams to directly enter their six-monthly reporting data. Over time, the portal will replace the CU-administered “paper” reporting process currently in use.
A completion report is produced for all Public Sector Window projects by the respective SEs, at the close of implementation, and within six months of the GAFSP grant closing.
Tier 2 monitoring for Private Sector Window projects (see also Annex 3):
Monitoring data are gathered for Private Sector Window projects on a yearly basis. Continued coordination between the CU and IFC will ensure that there is Private Sector Window input,
reporting on Private Sector Window operations, for the GAFSP annual report. Similar to all SEs, IFC will undertake monitoring of project progress through its regular monitoring systems
4 MONITORING AND REPORTING ON PORTFOLIO PERFORMANCE (TIER 3)
4.1 Overview
24. Tier 3 focuses on the administrative, program, and financial inputs that enable successful
program delivery and management, and achievement of Tier 1 and 2 results for both Windows.
4.2 The Key Performance Indicator Approach for Tier 3
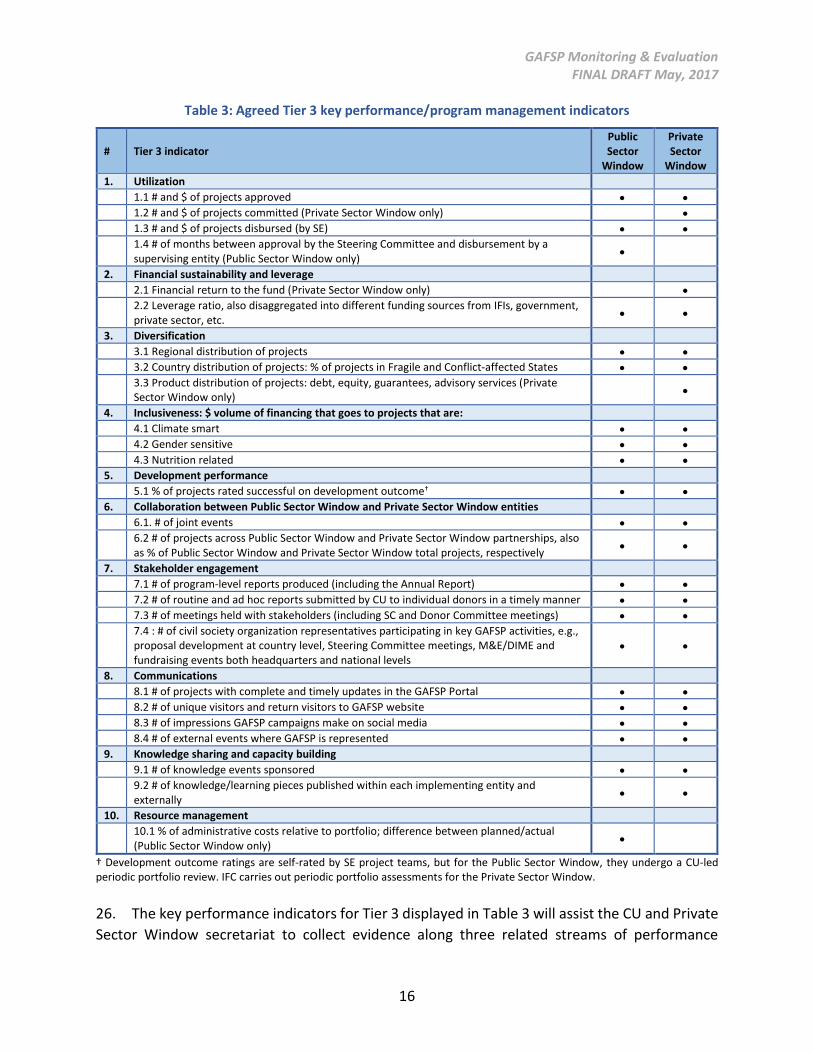
25. Table 3 presents the 26 key performance indicators (KPIs) in 10 dimensions that will be used
to measure program performance at both the portfolio and program management level, as
GAFSP ensures that administrative and financial inputs will be adequate for reaching
intermediate results at the Tier 2 level. Reporting against Tier 3 indicators will take place on a six-
monthly basis.
GAFSP Monitoring & Evaluation FINAL DRAFT May, 2017
16
Table 3: Agreed Tier 3 key performance/program management indicators
# Tier 3 indicator Public Sector
Window
Private Sector
Window
1. Utilization
1.1 # and $ of projects approved
1.2 # and $ of projects committed (Private Sector Window only)
1.3 # and $ of projects disbursed (by SE)
1.4 # of months between approval by the Steering Committee and disbursement by a supervising entity (Public Sector Window only)
2. Financial sustainability and leverage
2.1 Financial return to the fund (Private Sector Window only)
2.2 Leverage ratio, also disaggregated into different funding sources from IFIs, government, private sector, etc.
3. Diversification
3.1 Regional distribution of projects
3.2 Country distribution of projects: % of projects in Fragile and Conflict-affected States
3.3 Product distribution of projects: debt, equity, guarantees, advisory services (Private Sector Window only)
4. Inclusiveness: $ volume of financing that goes to projects that are:
4.1 Climate smart
4.2 Gender sensitive
4.3 Nutrition related
5. Development performance
5.1 % of projects rated successful on development outcome†
6. Collaboration between Public Sector Window and Private Sector Window entities
6.1. # of joint events
6.2 # of projects across Public Sector Window and Private Sector Window partnerships, also as % of Public Sector Window and Private Sector Window total projects, respectively
7. Stakeholder engagement
7.1 # of program-level reports produced (including the Annual Report)
7.2 # of routine and ad hoc reports submitted by CU to individual donors in a timely manner
7.3 # of meetings held with stakeholders (including SC and Donor Committee meetings)
7.4 : # of civil society organization representatives participating in key GAFSP activities, e.g., proposal development at country level, Steering Committee meetings, M&E/DIME and fundraising events both headquarters and national levels
8. Communications
8.1 # of projects with complete and timely updates in the GAFSP Portal
8.2 # of unique visitors and return visitors to GAFSP website
8.3 # of impressions GAFSP campaigns make on social media
8.4 # of external events where GAFSP is represented
9. Knowledge sharing and capacity building
9.1 # of knowledge events sponsored
9.2 # of knowledge/learning pieces published within each implementing entity and externally
10. Resource management
10.1 % of administrative costs relative to portfolio; difference between planned/actual (Public Sector Window only)
† Development outcome ratings are self-rated by SE project teams, but for the Public Sector Window, they undergo a CU-led periodic portfolio review. IFC carries out periodic portfolio assessments for the Private Sector Window.
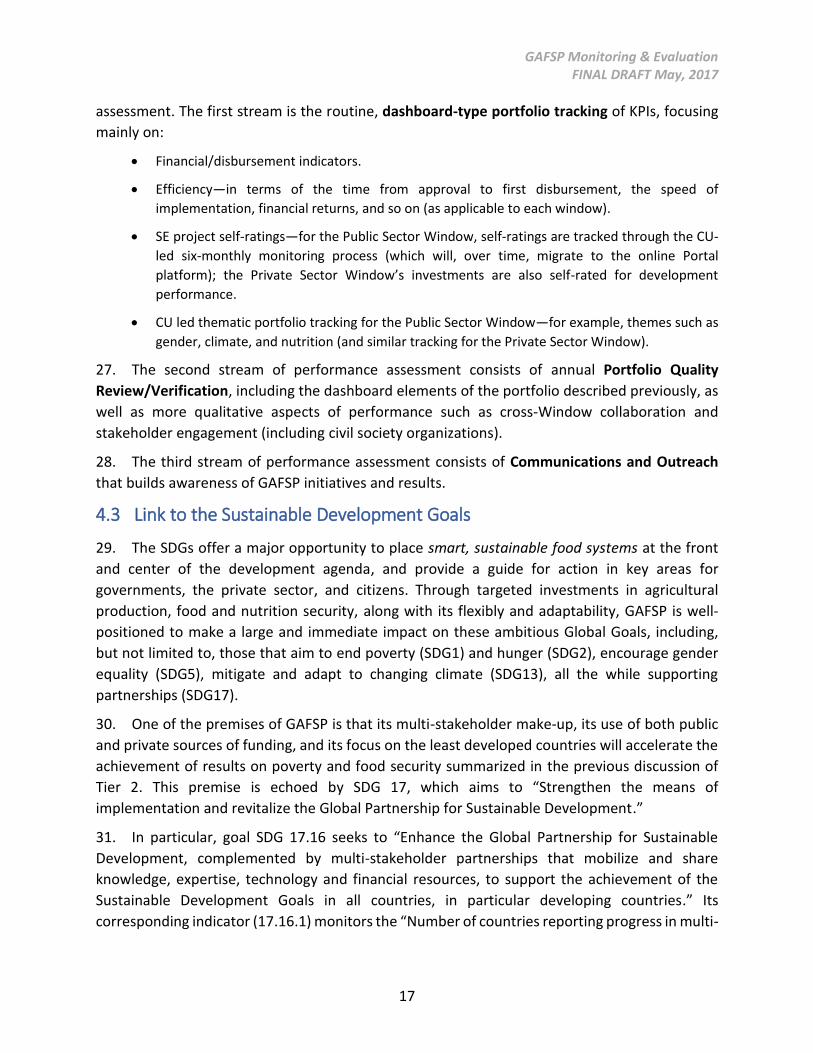
26. The key performance indicators for Tier 3 displayed in Table 3 will assist the CU and Private
Sector Window secretariat to collect evidence along three related streams of performance
GAFSP Monitoring & Evaluation FINAL DRAFT May, 2017
17
assessment. The first stream is the routine, dashboard-type portfolio tracking of KPIs, focusing
mainly on:
Financial/disbursement indicators.
Efficiency—in terms of the time from approval to first disbursement, the speed of
implementation, financial returns, and so on (as applicable to each window).
SE project self-ratings—for the Public Sector Window, self-ratings are tracked through the CU-
led six-monthly monitoring process (which will, over time, migrate to the online Portal
platform); the Private Sector Window’s investments are also self-rated for development
performance.
CU led thematic portfolio tracking for the Public Sector Window—for example, themes such as
gender, climate, and nutrition (and similar tracking for the Private Sector Window).
27. The second stream of performance assessment consists of annual Portfolio Quality
Review/Verification, including the dashboard elements of the portfolio described previously, as
well as more qualitative aspects of performance such as cross-Window collaboration and
stakeholder engagement (including civil society organizations).
28. The third stream of performance assessment consists of Communications and Outreach
that builds awareness of GAFSP initiatives and results.
4.3 Link to the Sustainable Development Goals
29. The SDGs offer a major opportunity to place smart, sustainable food systems at the front
and center of the development agenda, and provide a guide for action in key areas for
governments, the private sector, and citizens. Through targeted investments in agricultural
production, food and nutrition security, along with its flexibly and adaptability, GAFSP is well-
positioned to make a large and immediate impact on these ambitious Global Goals, including,
but not limited to, those that aim to end poverty (SDG1) and hunger (SDG2), encourage gender
equality (SDG5), mitigate and adapt to changing climate (SDG13), all the while supporting
partnerships (SDG17).
30. One of the premises of GAFSP is that its multi-stakeholder make-up, its use of both public
and private sources of funding, and its focus on the least developed countries will accelerate the
achievement of results on poverty and food security summarized in the previous discussion of
Tier 2. This premise is echoed by SDG 17, which aims to “Strengthen the means of
implementation and revitalize the Global Partnership for Sustainable Development.”
31. In particular, goal SDG 17.16 seeks to “Enhance the Global Partnership for Sustainable
Development, complemented by multi-stakeholder partnerships that mobilize and share
knowledge, expertise, technology and financial resources, to support the achievement of the
Sustainable Development Goals in all countries, in particular developing countries.” Its
corresponding indicator (17.16.1) monitors the “Number of countries reporting progress in multi-
GAFSP Monitoring & Evaluation FINAL DRAFT May, 2017
18
stakeholder development effectiveness monitoring frameworks that support the achievement of
the sustainable development goals.”
32. Similarly, Goal SDG 17.17 aims to “Encourage and promote effective public, private and civil
society partnerships, building on the experience and resourcing strategies of partnerships,” with
a corresponding indicator (17.17.1) measuring the “Amount of United States dollars committed
to public-private and civil society partnerships.”
33. The Tier 3 indicators can serve as direct inputs into these two SDG17 indicators, both by the
GAFSP globally, and also by members of its SC and donor and recipient countries, to demonstrate
their commitment to partnerships. Furthermore, coordination in the mobilization and use of
GAFSP funds is done within the framework of existing partnerships (CAADP, for example), and
the efficiency in the use of funds as monitored by Tier 3 indicators will ensure that GAFSP can
play its role in implementation, reporting and lesson-learning for the SDG “accountability
framework.”
GAFSP Monitoring & Evaluation FINAL DRAFT May, 2017
19
ANNEX 1: Detailed Discussion of GAFSP Indicators, Their Definition, and
Measurement Methodologies
1. TIER 1 INDICATORS AND EVALUATION METHODOLOGIES
a. Tier 1 indicators
i. Income is measured through a production-based approach (revenues minus costs), and
home-produced food that is not sold but home consumed is valued as income. This
approach is preferred over the use of consumption-expenditure surveys, which are more
time consuming, more costly, and less practical for the purposes of a mandatory indicator
(especially for the 70 percent of projects that are expected to undertake a “rapid”
assessment as per the GAFSP SC decision). We anticipate using income data generated from
the subset of the portfolio that will be using statistically grounded impact evaluations (both
experimental and quasi-experimental). The income15 is estimated equivalent to farmers’
gross margin [gross margin= gross income – input costs]. For the projects using
experimental and quasi-experimental IE designs, the baseline and follow-up surveys
include revenue data generating from both agriculture (crops, poultry, and livestock, fishing
and fish-raising, forestry and agroforestry, agricultural labor, and so on) and non-
agricultural sources (services, business revenue, pension, scholarships, bank interest, loan
interest, remittances, unskilled wage labor/casual labor, self-employment, sale of asset,
rentals, cash/gift contributions from relatives, cash support from NGO, and so on). The
definition/coverage of non-farm income may differ across projects based on the activities
of the targeted households. While measuring the income gain, in the calculation we
discount for income derived from household assets and nonfarm activities (etc.) that are
outside the scope of the project.
ii. For food and nutrition security, the standard methodologies for FIES, FCS, MDD-W, and
MDD-C will be used. Starting in January 2017, these food-security/nutrition focused
indicators will be rolled out in GAFSP M&E systems. FIES will be used by all Public Sector
Window projects16 and a sample of Private Sector Window projects, with either FCS, MDD-
W, or MDD-C used by those projects with explicit nutrition objectives.
iii. Crop yields are value weighted across crops at the farm level. The methodology for value-
weighted yield measurement is based on consultation with the SEs that support
governments in their implementation of GAFSP-funded operations and whose teams
determine—with government counterparts—the nature and frequency of data collection.
Any unified methodology will include the following: (1) total agricultural production (using
any of the farmer-based or third-party based accepted methodologies) and (2) agricultural
price indices obtained by a base-weighted formulation and expressed in nominal terms or
as deflated indices based on the use of an implicit consumer prices deflator (depending
15 Income is measured through sales, including imputed in-kind consumption and does not include imputed returns for asset. 16 For all Public Sector Window investment projects. TA and MMI pilot projects are encouraged, though not required, to adopt FIES.
GAFSP Monitoring & Evaluation FINAL DRAFT May, 2017
20
upon the choice of SEs). Overall, we propose a unified way of addressing specific issues such
as the value of agricultural products consumed by households, crops, fisheries or livestock,
etc. This will only apply to those projects with explicit productivity gain goals.
b. Methodology for impact evaluation (IE)
i. Both the Public Sector Window and the Private Sector Window monitor Tier 1 results and
conduct IEs within the framework of the Tier 1 indicators, with IE design and survey tools
intended to cover and collect relevant Tier 1 indicator data, as applicable to the project. Box
A1.1 summarizes the basic features of IE.
ii. Definition of impact evaluation: Impact evaluation is the systematic identification of the
effects—positive or negative, intended or not—on individual households, institutions, and
the environment caused by a given development activity such as a program or project. IEs
assess the primary or secondary longer-term changes in the wellbeing of targeted people
that can be directly or indirectly attributed to the contribution of an intervention,17 and
they help to measure the extent to which activities reach the poor and the magnitude of
their effects. The essence of IE is to focus on causality and attribution, where addressing
causality determines the methods that can be used.18 The fundamental challenge of IE is to
determine the counterfactual—in other words, what would have happened to the project
beneficiaries in the absence of the intervention. Overall, finding a convincing and
reasonable counterfactual that allows attribution of impact to an intervention is the
methodological key to more rigorous evaluation approaches. The validity of the
counterfactual is related to the attribution concern. Validity entails comparability between
control and treatment groups, in all relevant dimensions, to ensure that outcome changes
for the treatment groups are due solely to program participation.
iii. Types of impact evaluation: IEs can range from large-scale sample surveys in which project
populations and control groups are compared before and after, and possibly at several
points during program intervention, to smaller-scale rapid assessment and participatory
appraisals, during which estimates of impact are obtained by combining information from
group interviews, key informants, case studies, and available secondary data.
Box A1.1: Basic features of impact evaluations
Purpose
Measuring outcomes and impacts of an activity and distinguishing these from the influence of other, external factors.
Helping to clarify whether costs for an activity are justified.
Informing decisions on whether to expand, modify, or eliminate projects, programs, or policies.
Drawing lessons for improving the design and management of future activities.
Comparing the effectiveness of alternative interventions.
Strengthening accountability for results.
Advantages
Provides estimates of the magnitude of outcomes and impacts for different demographic groups, regions, or over time.
17 Westhorp (2014). 18 Gertler et al. (2016).
GAFSP Monitoring & Evaluation FINAL DRAFT May, 2017
21
Provides answers to some of the most central development questions: To what extent are we making a difference? What are the results on the ground? How can we do better?
Systematic analysis and rigor can give managers and policy makers added confidence in decision making.
Disadvantages
Some approaches are expensive and time-consuming. To the extent possible, faster and more economical approaches are also used.
Difficulties in identifying an appropriate counterfactual if non-rigorous impact evaluation designs are used.
Can lack precision in deriving the full extent of the impact due to limited assumptions and prior knowledge, making it harder to extrapolate outside the exact context in which it was conducted.
Cost IEs range from US$200,000–1,000,000 depending on program size, complexity, and frequency of data collection as well as standard costs in the survey country. Simpler and rapid assessments can be conducted for significantly less than US$100,000, and in some cases for as little as US$10,000–20,000, although at the cost of considerable rigor.
Source: Clark, Sarforius, and Bamberger (2004); Deaton and Catwright (2016).
iv. Prevailing debates on impact evaluations: The premise of a rigorous (experimental) IE is to
address counterfactual questions, such as how the targeted beneficiaries (target group)
would have fared in the absence of an intervention, or how the population not targeted by
the project (a properly constructed control or comparison group) fared in the presence of
the intervention. Application of randomized evaluation designs counter the issue of
“selection bias” (e.g., systematic differences between treatment and control groups at the
outset of the intervention)19 by randomly selecting the treatment and comparison groups
from a potential (“large n”) population of participants20 to statistically “prove” a difference.
In practice. Use of these designs involves high levels of costs, time, expertise, and
methodological constraints, however. As a result, most IEs use less expensive and less
rigorous evaluation designs. For an overview of options, see Box A1.2.
v. Evaluation in contemporary practice: Along a wide continuum, three broad approaches to
IE designs attempt to show statistically that an intervention, as a cause, has a resulting
effect. The first is the so-called “gold standard” of an experimental design, mentioned in the
previous paragraph. The second is a quasi-experimental design, which uses counterfactuals
but is not based on randomized assignment of the intervention. In the third approach,
which is also referred to as a non-experimental design, ex-post comparisons can be
conducted between project beneficiaries and control groups, using multivariate
regression—although such comparisons can be challenging to construct, after the fact. An
additional fourth approach, of more rapid or “small n“ impact assessment, often using
mixed methods (e.g., including qualitative methods such as informant interviews, focus
groups, community interviews, direct observations, scoring and ranking, and so on) and
commonly theory- or case-based, is also typically conducted ex post. Given that this
approach does not rest on clear-cut methods to assure statistical validity, there can be wide
19 Selection bias can arise when there are systematic differences in the way participants are accepted or rejected for a specific trial. It can also arise based on how the intervention is assigned to participants once they have been accepted.
20 Duflo and Kremer (2003).
GAFSP Monitoring & Evaluation FINAL DRAFT May, 2017
22
variation in approach and quality, even though it can allow for the evaluation of more
complex or multi-dimensional programs. Rigor and causal inference need to be assured
through more qualitative or theory-based measures of reliability in these designs. Any IE
design, however, should attempt to reconcile three elements—evaluation questions,
appropriate methods, and program attributes.
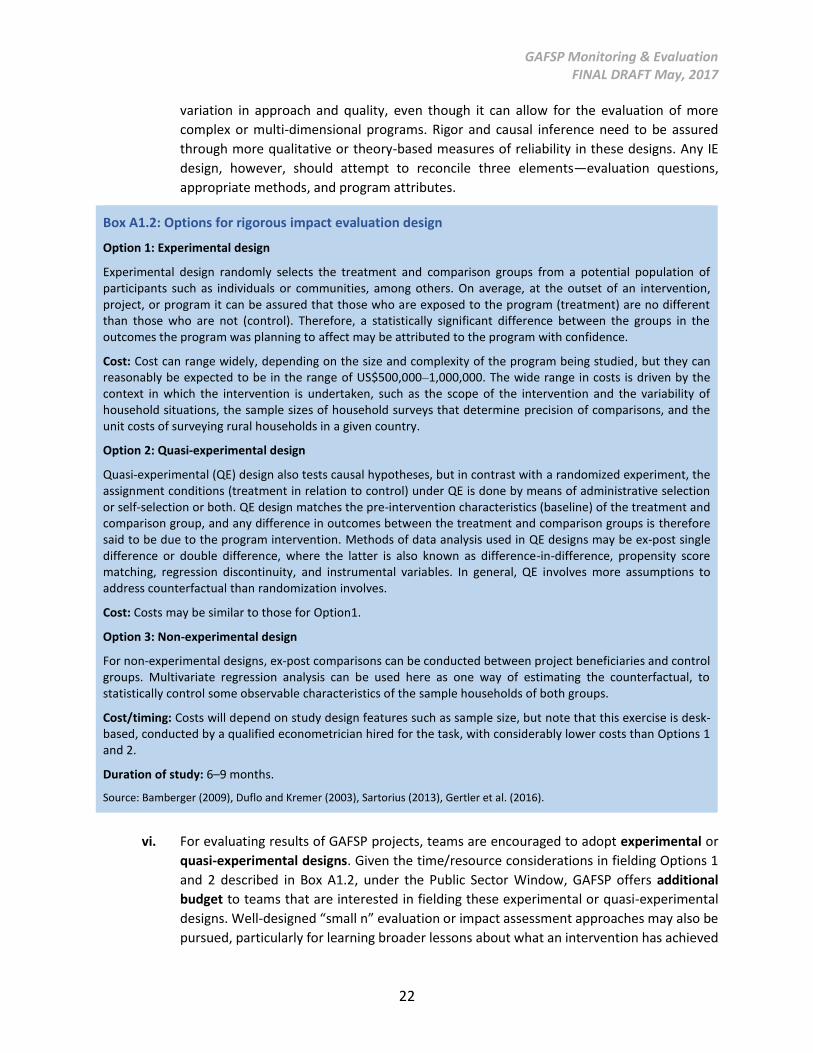
Box A1.2: Options for rigorous impact evaluation design
Option 1: Experimental design
Experimental design randomly selects the treatment and comparison groups from a potential population of participants such as individuals or communities, among others. On average, at the outset of an intervention, project, or program it can be assured that those who are exposed to the program (treatment) are no different than those who are not (control). Therefore, a statistically significant difference between the groups in the outcomes the program was planning to affect may be attributed to the program with confidence.
Cost: Cost can range widely, depending on the size and complexity of the program being studied, but they can reasonably be expected to be in the range of US$500,000–1,000,000. The wide range in costs is driven by the context in which the intervention is undertaken, such as the scope of the intervention and the variability of household situations, the sample sizes of household surveys that determine precision of comparisons, and the unit costs of surveying rural households in a given country.
Option 2: Quasi-experimental design
Quasi-experimental (QE) design also tests causal hypotheses, but in contrast with a randomized experiment, the assignment conditions (treatment in relation to control) under QE is done by means of administrative selection or self-selection or both. QE design matches the pre-intervention characteristics (baseline) of the treatment and comparison group, and any difference in outcomes between the treatment and comparison groups is therefore said to be due to the program intervention. Methods of data analysis used in QE designs may be ex-post single difference or double difference, where the latter is also known as difference-in-difference, propensity score matching, regression discontinuity, and instrumental variables. In general, QE involves more assumptions to address counterfactual than randomization involves.
Cost: Costs may be similar to those for Option1.
Option 3: Non-experimental design
For non-experimental designs, ex-post comparisons can be conducted between project beneficiaries and control groups. Multivariate regression analysis can be used here as one way of estimating the counterfactual, to statistically control some observable characteristics of the sample households of both groups.
Cost/timing: Costs will depend on study design features such as sample size, but note that this exercise is desk-based, conducted by a qualified econometrician hired for the task, with considerably lower costs than Options 1 and 2.
Duration of study: 6–9 months.
Source: Bamberger (2009), Duflo and Kremer (2003), Sartorius (2013), Gertler et al. (2016).
vi. For evaluating results of GAFSP projects, teams are encouraged to adopt experimental or
quasi-experimental designs. Given the time/resource considerations in fielding Options 1
and 2 described in Box A1.2, under the Public Sector Window, GAFSP offers additional
budget to teams that are interested in fielding these experimental or quasi-experimental
designs. Well-designed “small n” evaluation or impact assessment approaches may also be
pursued, particularly for learning broader lessons about what an intervention has achieved
GAFSP Monitoring & Evaluation FINAL DRAFT May, 2017
23
and why/why not, but it is worth emphasizing that these approaches have more limited
quantitative validity and additional budget is not offered for these. Under the Private Sector
Window, a cohort of projects is being identified for rigorous IEs.
vii. Mixed Methods21: SE entities are also strongly encouraged to adopt ‘Mixed Method’
approaches to impact assessment. A Mixed-Method design integrates quantitative and
qualitative approaches to form the theory, and perform collection, analysis and
interpretation of project level data. Mixed methods carry a number of operational benefits,
such as enhancing the interpretation and credibility of the results, using the findings of one
method (qualitative or quantitative) to develop the sample or instrument of the other,
enhancing its relevance. Another advantage of Mixed Methods is that the approach
promotes and provides the room to broaden the ways in which the counterfactual can be
defined and estimated. A balanced Mixed Method approach can be designed using
quantitative methods for sample selection, baseline surveys, and follow-up surveys; using
qualitative methods for exploratory research to develop the sample and context of the
study and to ensure relevance to the respondent groups; using triangulation to compare
results from both qualitative and quantitative methods; and ensuring participation and
voice of key stakeholders throughout the assessment/evaluation process.
viii. Rationale and value-addition of Impact Evaluation: It is fairly widely established that
rigorous causal evidence has been scarce for agriculture and food security interventions.
For GAFSP, the rationale for using impact evaluations therefore has multiple dimensions.
First, the Program intends to use the systematic evidence coming out of these to inform
policy/project design, and, subject to timing, guide project and program mid-course
corrections. In addition, lessons learnt from evaluations are intended to inform broader
adoption in and across countries/actors and the potential scale-up of proven good
practices. Further, through an ability to extrapolate statistically robust data on higher-level
indicators such as income and food security for a sub-set of projects, this allows the
Program to derive potential aggregated program-wide impacts of interest to multiple
stakeholders, including donors. Finally, monitoring and evaluation of new indicators (e.g.
FIES) will help generate operational evidence of broader public interest, testing the value
of such new tools. GAFSP also sees enormous value in the lessons learned on both process
and substance through mixed methods approaches, including the ability to hear directly
from our primary beneficiaries, ensuring the continued relevance of GAFSP’s investments.
ix. For the Public Sector Window, the Coordination Unit plays a role in quality assurance of the
IE cohort, in facilitating coordination, in partnership with the respective Supervising Entity,
Government, and Impact Evaluation technical partner, and also, in supporting
dissemination. As the portfolio continues to mature, the CU will pay increasing attention to
knowledge sharing, taking advantage of various media and opportunities to share relevant
findings on both process and content from GAFSP-financed IEs. For the Private Sector
21 Adato, M (2012) “Combining quantitative and qualitative methods for program monitoring and evaluation: Why are mixed
methods designs best?” World Bank; Bamberger, M. (2010). Reconstructing baseline data for impact evaluation and results measurement; Bamberger, M. (2012).Introduction of Mixed Method in Impact Evaluation.
GAFSP Monitoring & Evaluation FINAL DRAFT May, 2017
24
Window, the IFC Secretariat plays a comparable role, and will support the CU in its broader
Program-wide learning and dissemination effort.
2. TIER 2 INDICATORS: DEFINITIONS
a. #1 Number of beneficiaries22 reached, gender disaggregated, percentage who have been helped
to cope with impact of climate change (number of people): This indicator measures the number
of people who receive benefits from the activities supported by the project through various
service provisions or technical assistance. The number must be disaggregated by the gender of
the beneficiary. If data are collected at the household level, the data can be either converted to
people by using the locally appropriate household size or reported along with appropriate
household size. The number must also capture those whose resilience to climate risks has been
increased though climate change adaptation and mitigation practices (including, but not limited
to, carbon sequestration, clean energy, and energy efficiency as related to agriculture). Do not
double count people who have been provided with more than one type of benefit under the
project. Note: the average household size must be consistent with what is reported in the baseline
survey (from the available household roster). In the absence of a household roster module, the
project team can report average household size in rural areas consistent with Census, Household
Income Expenditure Survey, or Living Standard Measurement Study.
b. #2 Land area receiving improved production practices under GAFSP, percentage of which is
climate smart (ha): This indicator measures the total land area, measured in hectares, that has
benefited from the project’s activities, investments, and/or technical assistance. Such activities
may include, but are not limited to, areas that have adopted new technologies and sustainable
land management practices promoted by the project. Technologies and sustainable land
management practices include crop genetics, cultural practices, pest management, disease
management, soil-related fertility and conservation, construction or rehabilitation of irrigation
and drainage infrastructure, using climate adaptation and mitigation methods, and use of
mechanization in land preparation. Do not double count land area provided multiple services. Per
the intent to track climate related data, please identify the percentage of the reported land area
that may be considered as under ‘climate smart’ practices – e.g., those that have resulted from a
consideration of the three elements of CSA and have been identified and developed as locally
appropriate solutions that increase climate resilience .
c. #3 Number of smallholders23 receiving productivity enhancement support from GAFSP, gender
disaggregated, climate smart agriculture support (number of people): This indicator measures
22 It is acknowledged that the term ‘beneficiary’ can imply pejorative notions of dependency. While other terms like ‘citizen’, ‘client’, ‘consumer’ etc, could be seen to be more empowering, they are not necessarily apt for GAFSP project usage. We will therefore continue to use ‘beneficiary’, while noting its drawbacks and also that the term encompasses a wide range of population groups covered by both GAFSP Public Sector and Private Sector Windows. This includes smallholder farmers, small-scale producers, share-croppers, landless laborers, returnee migrants engaged in civil work as a part of cash transfer program,
fisherfolk etc. 23 The definition of smallholder may differ across countries and agro-ecological zones (FAO 2004). Landholding size is often considered as one of the direct and more readily used indicators. In areas that are arid and in areas with high population densities, smallholders are associated with cultivation of less than one or two hectares. In semi-arid areas, they can be associated with cultivation of 10 hectares and managing 10 head of livestock. GAFSP will accept the definition of smallholder as applied by each SE (including IFC for the Private Sector Window), noting that it may vary.

GAFSP Monitoring & Evaluation FINAL DRAFT May, 2017
25
the number of people who have directly participated in the project’s activities and is expected to
be a subset of all direct beneficiaries. Examples include the number who have adopted improved
food production technologies and sustainable management practices being promoted by the
project (including percentage of these that are climate-smart technologies); the number of water
users who have been provided with new or improved irrigation and drainage systems through the
project (including those that are also climate-smart); the number of farmers accessing climate
services (including early warning systems) and benefitting from weather-based crop insurance or
index-based insurance. This indicator must be disaggregated by gender of the recipient. This
indicator includes farmers, ranchers, fishers, and other primary sector producers who adopted
technology that supports higher productivity. Do not double count people who receive more than
one type of support. Per the intent to track climate related data, please identify the percentage
of beneficiaries, who may be considered as having received support to use ‘climate smart’
practices.
d. #4 Number of producer-based organizations supported by GAFSP (number): This indicator
measures the number of relevant associations that are either established through or
strengthened by the project to achieve or enhance the project development outcomes in the
project area. Such associations include but are not limited to: water user associations, producer
organizations, trade and business associations, community-based organizations, and financial
cooperatives.
e. #5 Volume of agriculture loans that are outstanding: This indicator is the volume of outstanding
loans for agribusiness-related purposes in the portfolio of a financial intermediary at the end of
its fiscal year.
f. #6 Percentage of beneficiaries with secure rights to land, property, and natural resources
(percent of total beneficiaries), measured by: (1) percentage with legally documented or
recognized evidence of tenure and (2) percentage who perceive their rights are recognized and
protected. This indicator seeks to track both the legal and administrative progress by governments
in recognizing secure rights to land (documentation) and the people-defined progress on the
quality of land rights (perceptions). Secure rights encompass “tenure security” rather than land
ownership, ensuring coverage of those with secure access to land, even in those locations where
individual ownership is not applicable/practiced.
g. #7 Roads constructed or rehabilitated, percentage resilient to climate risks (km): This indicator
measures the kilometers of all-weather, climate-resilient road construction that enables equitable
and affordable transportation in rural spaces where rural-based production activities are taking
place. The road construction or rehabilitation can directly or indirectly connect farmers with areas
where market centers are located. The construction or rehabilitation is expected to ease
commercial transportation along the road to provide beneficiaries (farmers, fisheries,
communities, and others) with better market access, helping on-farm as well as non-farm
activities.
h. #8 Number of post-harvest facilities constructed and/or rehabilitated (number): This indicator
measures the number of facilities developed by the GAFSP-supported project that support
activities such as (1) improved storage/improved packaging house technologies, (2) warranty
contracts, (3) investments to comply with sanitary/phytosanitary and other food safety standards,
GAFSP Monitoring & Evaluation FINAL DRAFT May, 2017
26
(4) temperature and humidity control, (5) improved quality control technologies and practices,
such as for sorting and grading; and (6) decay and insect control.
i. #9 Volume of agricultural production processed by post-harvest facilities established with
GAFSP support (tons, by food group)24: This indicator measures volume of agricultural production
supported by project activities such as (1) improved storage/improved packaging house
technologies, (2) warranty contracts, (3) investments to comply with sanitary/phytosanitary and
other food safety standards, (4) temperature and humidity control, (5) improved quality control
technologies and practices, such as for sorting and grading; and (6) decay and insect control.
j. #10 People benefiting from cash or food-based transfers, gender disaggregated (number of
people): This indicator measures the total number of people who benefitted from cash or food
transfer interventions through the project. The data must be disaggregated by gender.
k. #11 People receiving improved nutrition services and products, gender disaggregated, age
disaggregated (number of people): This indicator measures the increase in the number of people
with access to a basic package of nutrition services through a GAFSP-financed project. The
contents of the basic package are defined by countries, and are therefore not identical. The
indicator is calculated from the increase in the number of people with access to a defined basic
package of nutrition services as a result of project investment.
i. Guidance on “Ready to Use Therapeutic Food” (RUTF): This energy-dense,
mineral/vitamin-enriched food is designed specifically to treat severe acute malnutrition. It
is equivalent in formulation to Formula 100 (F100), which is recommended by the World
Health Organization to treat malnutrition.25 RUTF is usually oil-based and contains little
available water, which means that it is microbiologically safe, will keep for several months
in simple packaging, and can be made easily using low-tech production methods. As it is
eaten uncooked, it is ideal for delivering many micronutrients that might otherwise be
broken down by heat. RUTFs permit community-based therapeutic care (CTC)—treatment
at home and in the community—rather than costly and more problematic clinical care. A
successful example of RUTFs is Plumpy’Nut.®
ii. Guidance on “Biofortification”: Biofortification improves the micronutrient density of
staple food crops. This process helps to reduce the high prevalence of specific nutritional
deficiencies, especially of iron, zinc, and vitamin A, which commonly occur in low-income
populations. Biofortification differs from ordinary fortification because it focuses on making
plant foods more nutritious as the plants are growing, rather than on adding nutrients to
foods when they are processed. Examples of some foods that have been biofortified are
sweet potatoes and corn.
iii. Guidance on “Micronutrients”: These essential nutrients are needed by the human body in
small quantities for it to function normally. Categories of essential nutrients include
vitamins, dietary minerals, essential fatty acids, phytochemicals, and essential amino-acids.
24 Provide disaggregated data by gender, if available. 25 WHO (1999a).
GAFSP Monitoring & Evaluation FINAL DRAFT May, 2017
27
iv. Guidance on “vulnerable groups”: Vulnerable groups include pregnant women, nursing
mothers, infants, and young children, as well as people living with HIV/AIDS and
tuberculosis.
l. #12 Direct employment provided by GAFSP, gender disaggregated (full-time equivalent): This
indicator measures the net additional employment gains (for example, jobs provided) owing to
implementation of the GAFSP-supported project. The indicator includes direct employment (for
example, new jobs directly provided through the intervention)26. For direct employment, this
indicator counts the jobs that are provided by the service provider or producers that the project
works with directly. Direct employment provided considers the provision of temporary jobs as
well. Direct employment could therefore be estimated through net-full time equivalent (FTE)
jobs27 (for example, the number of FTE jobs generated by the project, both on-farm as well as off-
farm through forward and backward linkage employment effects such as those arising from
processing, marketing, farm input provision, and related services) or short-term employment
supported by the activities of the project. The indicator must be disaggregated by gender. To the
degree possible, the CU encourages SEs to follow the principles of Decent Rural Employment, and
encourages related monitoring28.
m. #13 Persons receiving capacity development through GAFSP support, gender disaggregated,
organization type (number of people): The indicator measures the number of people who
received any training organized or provided by the project (formal or informal training degree and
non-degree courses, vocational, on-the-job training, field demonstrations, and so on). The
training that forms a part of technical assistance includes the transfer of knowledge and/or
expertise by way of staff, formal or informal skills training, and research work to support quality
of program implementation and impact, support administration, management, representation,
publicity, policy development, and capacity building. It may also include short-term agricultural
training or nutrition related training29.
n. #14 Number of GAFSP-supported substantive deliverables on food security processes
completed (number): This indicator measures the number of policy studies, strategies and
investment plans, best practices, and other deliverables that serve to meet or enhance the
project’s development outcomes to support improved food and nutrition security.
26 The definition also includes all-types of farm labor, where applicable. For example, (i) hired without farm ownership claims,
(ii) unpaid farm labor, or (iii) salaried labor having ownership claims. The definition of farm labor can vary according to the definition used by respective SE partner. 27 For Public Sector Window projects, the total number of FTE jobs created by a program can be measured by dividing the net additional days of work due to a program intervention by 240. For Private Sector Window projects, it can be measured as the number of FTE employees as per local definition working for the client company or project at the end of the reporting period. This number includes individuals hired directly and individuals hired through third-party agencies, as long as those individuals provide on-site services related to the operations of the client company. Also, this number includes the FTE worked by seasonal, contractual, and part-time employees. Part-time jobs are converted to FTE jobs on a pro rata basis, based on the local definition (for instance, if the working week equals 40 hours, a 24 hr/week job would be equal to a 0.6 FTE job). Seasonal or short-term jobs are prorated on the basis of the portion of the reporting period that was worked (for example, a full-time position for three months would be equal to a 0.25 FTE job if the reporting period is one year). If the information is not available, the rule-of-thumb is that two part-time jobs equal a full-time job. Note: employment for the purpose of the construction of the client company's hard assets is not to be included in this indicator. For such jobs, please use the indicator Direct Employment – Construction Phase. 28 http://www.fao.org/3/a-bc270e.pdf 29 It may also include capacity development training of householder through nutrition awareness training.
GAFSP Monitoring & Evaluation FINAL DRAFT May, 2017
28
3. TIER 3 INDICATORS: DEFINITIONS
a. Utilization
i. Number and value of projects approved: The number of projects approved measures the
number of projects supported by GAFSP as recommended by: (1) the independent Technical
Advisory Committee and approved by the GAFSP SC for the Public Sector Window; or, (2) as
approved by IFC’s Blended Finance Committee for the Private Sector Window. Value covers
the total number of projects and associated GAFSP funding volume (expressed in
US$ millions).
ii. Number and value of projects committed (Private Sector Window only): Number of
projects and their associated dollar volume for which IFC has entered legal agreements that
establish IFC's obligation to provide the financial products to clients for those projects.
iii. Number and value of projects disbursed: For the Public Sector window, this indicator
shows the economic efficiency of total dollars invested by tracking the aggregate amount
of GAFSP funding disbursed, and the related ratio to the net amount available/allocated.
The Private Sector Window will track principal outflow from the implementing entity under
the GAFSP fund to client, in accordance with the Investment Agreement.
iv. Number of months between approval by the SC and disbursement by an SE (Public Sector
Window only): This indicator measures the effectiveness of the release of funds.
b. Financial sustainability and leverage
i. Financial return to the fund (Private Sector Window only): This indicator is applicable to
the investment instrument of Private Sector Window funds and is expressed as the
projected internal rate of return on Private Sector Window GAFSP investments at a given
time, based on projected cash flows.
ii. Leverage ratio, disaggregated into different funding sources from development partners,
government, private sector, and communities and groups that are used for scaling-up
phases of the project: The term leverage can be used interchangeably with other terms,
including mobilizing, catalyzing, co-financing, and co-investment. For the Public Sector
Window, co-financing is considered to be a subset of leverage that helps to achieve a
“transformational” impact of the intervention. For both Windows, the indicator is
calculated as the ratio of non-GAFSP funds over GAFSP funds that are invested in GAFSP-
supported operations to reflect the co-financing component. For the Private Sector
Window, this may include funding from IFC and other private sector sources.
c. Diversification
i. Regional distribution of projects: Number of approved projects and associated US dollar
volume by region.
GAFSP Monitoring & Evaluation FINAL DRAFT May, 2017
29
ii. Country distribution of projects—percentage of projects in Fragile and Conflict-Affected
States: Number of approved projects and associated US dollar volume in FCV (fragility,
conflict, and violence)30 versus non-FCV countries.
iii. Product distribution of projects—debt, equity, guarantees, advisory services (Private
Sector Window): The number of approved projects and associated dollar volume by
product.
d. Inclusiveness—Volume of financing that goes to projects that are:
i. Climate smart: The GAFSP Public Sector Window currently applies a methodology
developed by the World Bank to track engagement in the areas of climate change
adaptation and mitigation. The system is designed to capture the financing of adaptation
and mitigation co-benefits in projects across the Public Sector Window portfolio, even when
climate change adaptation/mitigation is not the main project objective. Specifically, the
approach tracks project/grant commitments with climate change co-benefits at the time of
project approval—not the amount of emission reductions or increased climate resilience
resulting from the financing associated with each operation. This approach is in line with
the emerging SDG indicators for climate. For the Private Sector Window, IFC is scaling up
its climate change mitigation work as well as incorporating adaptation and climate risk
assessment and management into private sector investment through its Investment and
Advisory Services businesses. In September 2016, IFC revised its climate definitions31 to
incorporate and recognize activities and investments that contribute to CSA as an approach
to managing landscapes—cropland, livestock, forests, and fisheries—that aims to achieve
three “wins”: (1) increased productivity to improve food security and boost farmers’
incomes; (2) enhanced resilience to drought, pests, disease, and other shocks linked to
climate change impacts; and (3) reduced greenhouse gas emissions. IFC, together with its
clients and partners, plans to support CSA, including through GAFSP, by providing
investments and advisory operations that contribute to one or more of these three CSA
“wins.”
ii. Gender sensitive: Gender-sensitive investment is investment that directly promotes
women’s rights, gender equality and women’s empowerment. For the Public Sector
Window, in addition to routinely reporting the percentage of women among the total
number of GAFSP beneficiaries, the CU reviews all projects for gender sensitivity across
three dimensions: (1) underlying gender analysis and consultation (for example, during
project preparation and design); (2) gender-informed activities (as part of the resulting
project’s design and implementation, for example); and (3) gender-disaggregated M&E. The
CU reports regularly on the number and percentage of projects meeting one or more of
these dimensions, with the goal that all projects will meet all three (at the end of 2016, 87
percent of Public Sector Window projects met all three dimensions). For the Private Sector
30 Countries facing challenges such as extremist activities or forced displacement, which threaten development progress and citizens’ security. 31 See “IFC Definitions and Metrics for Climate-Related Activities,” http://www.ifc.org/wps/wcm/connect/534495804a803b32b266fb551f5e606b/IFC_Climate_Definitions_2013.pdf?MOD=AJPERES.
GAFSP Monitoring & Evaluation FINAL DRAFT May, 2017
30
Window, IFC uses gender-sensitive appraisal questions as part of the due diligence for
direct agricultural investments as a means of raising awareness of the importance of gender
sensitivity in agribusiness projects and business operations with the project sponsors. The
analysis involves the disaggregation of quantitative data by sex and highlights the different
roles and learned behaviors based on gender attributes. This framework informs company
actions and interventions (which can lead to significant business benefits), produces and
provides gender-disaggregated evidence for policy making, develops tools and expertise to
identify and unlock barriers to women’s participation, ensures gender-inclusive
implementation strategies, and makes gender visible and relevant in M&E processes. In
particular, IFC applies a flag system, in which the AS (Advisory Services) Gender Flag is a
yes/no indication of whether an investment project is designed and implemented with a
gender lens. The Gender Flag is applied if the project/investment includes an analysis in the
board paper on gaps between women and men that will be addressed either in the client’s
workforce and leadership or among suppliers, customers, leaders, or community
stakeholders. Based on the analysis, the board paper needs to spell out at least one gender
intervention, which is then reflected in a monitoring indicator. The AS Gender Flag is
applied if the project design explains which gender gaps between men and women will be
addressed by the project (corporate leadership, suppliers, employees, customers, and so
on) and how the project will reduce the gap, highlighting the activities that will be
undertaken.
iii. Nutrition related: This indicator will collate the GAFSP investments that contribute directly
to the improved nutrition of recipient households. SEs are engaged in the global goal for
improved nutrition as a priority, especially for women and infants, and have developed
implementation plans for increasing these investments. Informed by joint work undertaken
by the World Bank Group’s Health, Nutrition, Population, and Agriculture Global Practices,
a tool is used to screen all Public Sector Window projects for activities that include direct
nutrition non-agricultural activities (those activities addressing immediate determinants of
fetal and child nutrition, and couched in the health sector), and explicit and implicit
nutrition-sensitive agricultural activities (activities addressing underlying determinants of
fetal and child nutrition, couched in sectors outside health, such as agriculture). On the basis
of this screening and review, a dollar amount is assigned across these categories, in order
to track the number of projects that contribute to improved nutrition. The CU reports
annually on the number of projects and estimated project financing that includes direct
nutrition non-agricultural activities and/ or explicit nutrition-sensitive agricultural activities
only. It does not report on implicit nutrition-sensitive agricultural activities.
e. Development performance
i. Percentage of projects rated successful on development outcome: As noted, SE project
teams use a self-rating process for assessing development outcomes, but the CU leads an
annual portfolio review for projects under the Public Sector Window, and IFC carries out an
annual portfolio assessment for the Private Sector Window.
f. Collaboration between Public Sector Window and Private Sector Window entities:

GAFSP Monitoring & Evaluation FINAL DRAFT May, 2017
31
i. Number of joint events: These include events for joint strategy planning, lesson-learning
during implementation of projects, and evaluation/application of lessons learned in
recommendations for the improvement of GAFSP.
ii. Number of projects across Public Sector Window and Private Sector Window
partnerships, also as a percentage of Public Sector Window and Private Sector Window
projects, respectively: These are operations that would include joint activities, active
collaboration, and/or funding both from the Public and Private Sector Windows.
g. Stakeholder engagement
i. Number of program-level reports produced (including the Annual Report).
ii. Number of routine and ad-hoc reports submitted by CU and the Private Sector Window
Secretariat to individual donors in a timely manner.
iii. Number of meetings held with stakeholders (including SC and Donor Committee
meetings).
iv. Number of civil society organization representatives participating in key GAFSP activities
such as proposal development at country level, SC meetings, M&E/DIME and fundraising
events, both at headquarters and national levels.
h. Communications:
i. Number of projects with complete and timely updates in the GAFSP Portal: Also maybe
be expressed as a percentage.
ii. Number of unique visitors and return visitors to the GAFSP website: This indicator is
measured at regular intervals (monthly).
iii. Number of impressions GAFSP campaigns make on social media
iv. Number of external events where GAFSP is represented: These are events that lead
directly to the dissemination of GAFSP lessons and results and the mobilization of global
partnerships for poverty reduction, food security, and nutrition in the poorest countries.
i. Knowledge sharing and capacity building
i. Number of knowledge events sponsored: This indicator measures the number of technical
and non-technical events and workshops organized by GAFSP in partnership with SEs,
partners (such as DIME, Voices of the Hungry, and so on), civil society organizations, and
the Private Sector Window.
ii. Number of knowledge/learning pieces published within each implementing entity and
externally: This indicator involves the knowledge products that are based –partly or
completely—on evidence from GAFSP-supported operations.
j. Resource management
i. Percentage of administrative costs relative to portfolio: This indicator is the ratio of
administrative budget (including CU budget and SE fees) to total cumulative funding
decisions (Public Sector Window only).
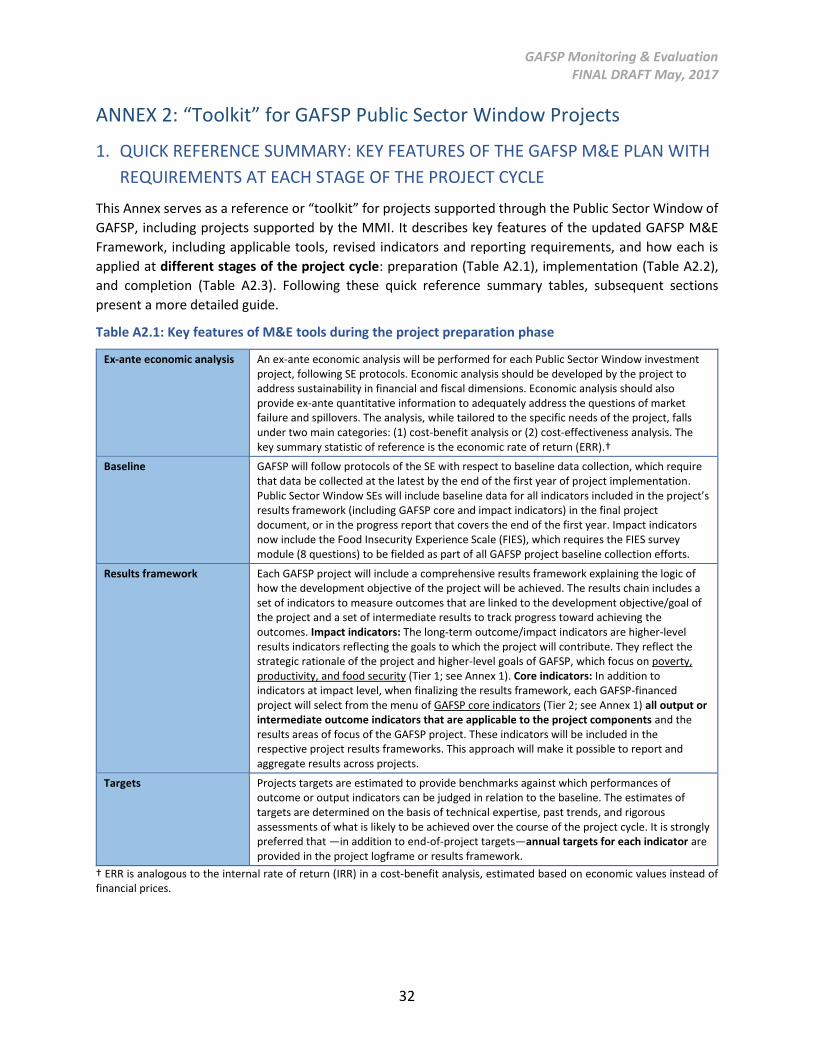
GAFSP Monitoring & Evaluation FINAL DRAFT May, 2017
32
ANNEX 2: “Toolkit” for GAFSP Public Sector Window Projects
1. QUICK REFERENCE SUMMARY: KEY FEATURES OF THE GAFSP M&E PLAN WITH
REQUIREMENTS AT EACH STAGE OF THE PROJECT CYCLE
This Annex serves as a reference or “toolkit” for projects supported through the Public Sector Window of
GAFSP, including projects supported by the MMI. It describes key features of the updated GAFSP M&E
Framework, including applicable tools, revised indicators and reporting requirements, and how each is
applied at different stages of the project cycle: preparation (Table A2.1), implementation (Table A2.2),
and completion (Table A2.3). Following these quick reference summary tables, subsequent sections
present a more detailed guide.
Table A2.1: Key features of M&E tools during the project preparation phase
Ex-ante economic analysis An ex-ante economic analysis will be performed for each Public Sector Window investment project, following SE protocols. Economic analysis should be developed by the project to address sustainability in financial and fiscal dimensions. Economic analysis should also provide ex-ante quantitative information to adequately address the questions of market failure and spillovers. The analysis, while tailored to the specific needs of the project, falls under two main categories: (1) cost-benefit analysis or (2) cost-effectiveness analysis. The key summary statistic of reference is the economic rate of return (ERR).†
Baseline GAFSP will follow protocols of the SE with respect to baseline data collection, which require that data be collected at the latest by the end of the first year of project implementation. Public Sector Window SEs will include baseline data for all indicators included in the project’s results framework (including GAFSP core and impact indicators) in the final project document, or in the progress report that covers the end of the first year. Impact indicators now include the Food Insecurity Experience Scale (FIES), which requires the FIES survey module (8 questions) to be fielded as part of all GAFSP project baseline collection efforts.
Results framework Each GAFSP project will include a comprehensive results framework explaining the logic of how the development objective of the project will be achieved. The results chain includes a set of indicators to measure outcomes that are linked to the development objective/goal of the project and a set of intermediate results to track progress toward achieving the outcomes. Impact indicators: The long-term outcome/impact indicators are higher-level results indicators reflecting the goals to which the project will contribute. They reflect the strategic rationale of the project and higher-level goals of GAFSP, which focus on poverty, productivity, and food security (Tier 1; see Annex 1). Core indicators: In addition to indicators at impact level, when finalizing the results framework, each GAFSP-financed project will select from the menu of GAFSP core indicators (Tier 2; see Annex 1) all output or intermediate outcome indicators that are applicable to the project components and the results areas of focus of the GAFSP project. These indicators will be included in the respective project results frameworks. This approach will make it possible to report and aggregate results across projects.
Targets Projects targets are estimated to provide benchmarks against which performances of outcome or output indicators can be judged in relation to the baseline. The estimates of targets are determined on the basis of technical expertise, past trends, and rigorous assessments of what is likely to be achieved over the course of the project cycle. It is strongly preferred that —in addition to end-of-project targets—annual targets for each indicator are provided in the project logframe or results framework.
† ERR is analogous to the internal rate of return (IRR) in a cost-benefit analysis, estimated based on economic values instead of financial prices.
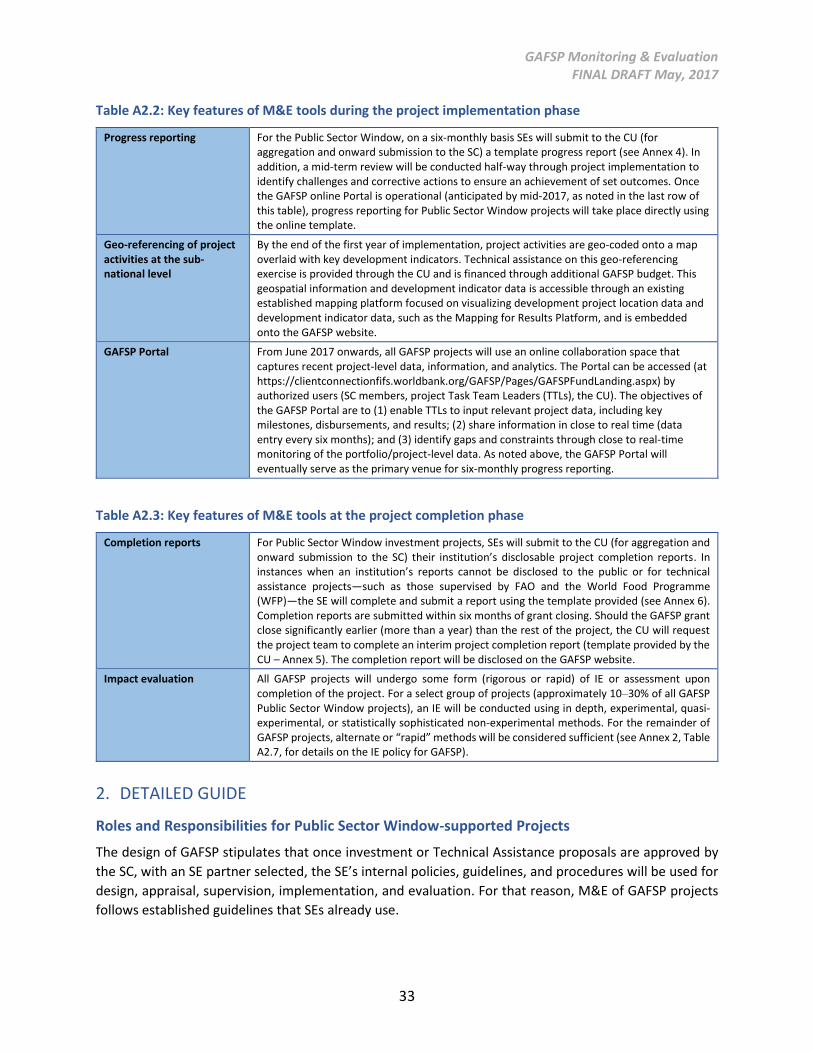
GAFSP Monitoring & Evaluation FINAL DRAFT May, 2017
33
Table A2.2: Key features of M&E tools during the project implementation phase
Progress reporting For the Public Sector Window, on a six-monthly basis SEs will submit to the CU (for aggregation and onward submission to the SC) a template progress report (see Annex 4). In addition, a mid-term review will be conducted half-way through project implementation to identify challenges and corrective actions to ensure an achievement of set outcomes. Once the GAFSP online Portal is operational (anticipated by mid-2017, as noted in the last row of this table), progress reporting for Public Sector Window projects will take place directly using the online template.
Geo-referencing of project activities at the sub-national level
By the end of the first year of implementation, project activities are geo-coded onto a map overlaid with key development indicators. Technical assistance on this geo-referencing exercise is provided through the CU and is financed through additional GAFSP budget. This geospatial information and development indicator data is accessible through an existing established mapping platform focused on visualizing development project location data and development indicator data, such as the Mapping for Results Platform, and is embedded onto the GAFSP website.
GAFSP Portal From June 2017 onwards, all GAFSP projects will use an online collaboration space that captures recent project-level data, information, and analytics. The Portal can be accessed (at https://clientconnectionfifs.worldbank.org/GAFSP/Pages/GAFSPFundLanding.aspx) by authorized users (SC members, project Task Team Leaders (TTLs), the CU). The objectives of the GAFSP Portal are to (1) enable TTLs to input relevant project data, including key milestones, disbursements, and results; (2) share information in close to real time (data entry every six months); and (3) identify gaps and constraints through close to real-time monitoring of the portfolio/project-level data. As noted above, the GAFSP Portal will eventually serve as the primary venue for six-monthly progress reporting.
Table A2.3: Key features of M&E tools at the project completion phase
Completion reports For Public Sector Window investment projects, SEs will submit to the CU (for aggregation and onward submission to the SC) their institution’s disclosable project completion reports. In instances when an institution’s reports cannot be disclosed to the public or for technical assistance projects—such as those supervised by FAO and the World Food Programme (WFP)—the SE will complete and submit a report using the template provided (see Annex 6). Completion reports are submitted within six months of grant closing. Should the GAFSP grant close significantly earlier (more than a year) than the rest of the project, the CU will request the project team to complete an interim project completion report (template provided by the CU – Annex 5). The completion report will be disclosed on the GAFSP website.
Impact evaluation All GAFSP projects will undergo some form (rigorous or rapid) of IE or assessment upon completion of the project. For a select group of projects (approximately 10–30% of all GAFSP Public Sector Window projects), an IE will be conducted using in depth, experimental, quasi-experimental, or statistically sophisticated non-experimental methods. For the remainder of GAFSP projects, alternate or “rapid” methods will be considered sufficient (see Annex 2, Table A2.7, for details on the IE policy for GAFSP).
2. DETAILED GUIDE
Roles and Responsibilities for Public Sector Window-supported Projects
The design of GAFSP stipulates that once investment or Technical Assistance proposals are approved by
the SC, with an SE partner selected, the SE’s internal policies, guidelines, and procedures will be used for
design, appraisal, supervision, implementation, and evaluation. For that reason, M&E of GAFSP projects
follows established guidelines that SEs already use.
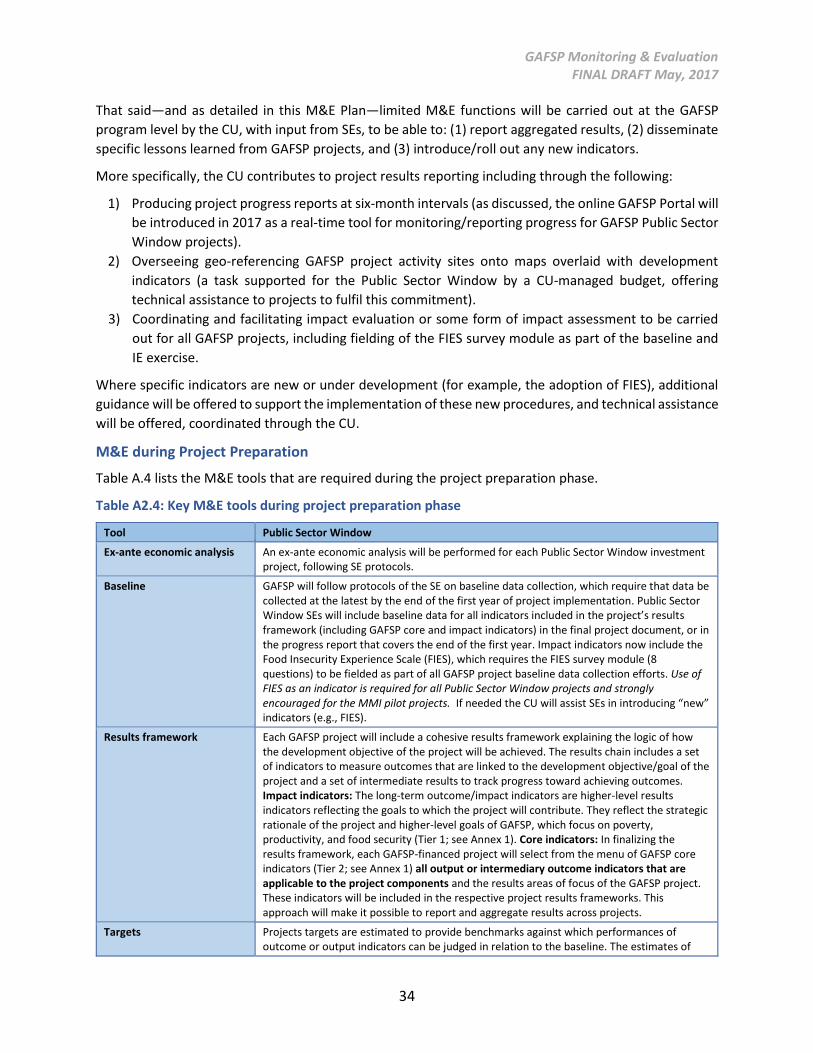
GAFSP Monitoring & Evaluation FINAL DRAFT May, 2017
34
That said—and as detailed in this M&E Plan—limited M&E functions will be carried out at the GAFSP
program level by the CU, with input from SEs, to be able to: (1) report aggregated results, (2) disseminate
specific lessons learned from GAFSP projects, and (3) introduce/roll out any new indicators.
More specifically, the CU contributes to project results reporting including through the following:
1) Producing project progress reports at six-month intervals (as discussed, the online GAFSP Portal will
be introduced in 2017 as a real-time tool for monitoring/reporting progress for GAFSP Public Sector
Window projects).
2) Overseeing geo-referencing GAFSP project activity sites onto maps overlaid with development
indicators (a task supported for the Public Sector Window by a CU-managed budget, offering
technical assistance to projects to fulfil this commitment).
3) Coordinating and facilitating impact evaluation or some form of impact assessment to be carried
out for all GAFSP projects, including fielding of the FIES survey module as part of the baseline and
IE exercise.
Where specific indicators are new or under development (for example, the adoption of FIES), additional
guidance will be offered to support the implementation of these new procedures, and technical assistance
will be offered, coordinated through the CU.
M&E during Project Preparation
Table A.4 lists the M&E tools that are required during the project preparation phase.
Table A2.4: Key M&E tools during project preparation phase
Tool Public Sector Window
Ex-ante economic analysis An ex-ante economic analysis will be performed for each Public Sector Window investment project, following SE protocols.
Baseline GAFSP will follow protocols of the SE on baseline data collection, which require that data be collected at the latest by the end of the first year of project implementation. Public Sector Window SEs will include baseline data for all indicators included in the project’s results framework (including GAFSP core and impact indicators) in the final project document, or in the progress report that covers the end of the first year. Impact indicators now include the Food Insecurity Experience Scale (FIES), which requires the FIES survey module (8 questions) to be fielded as part of all GAFSP project baseline data collection efforts. Use of FIES as an indicator is required for all Public Sector Window projects and strongly encouraged for the MMI pilot projects. If needed the CU will assist SEs in introducing “new” indicators (e.g., FIES).
Results framework Each GAFSP project will include a cohesive results framework explaining the logic of how the development objective of the project will be achieved. The results chain includes a set of indicators to measure outcomes that are linked to the development objective/goal of the project and a set of intermediate results to track progress toward achieving outcomes. Impact indicators: The long-term outcome/impact indicators are higher-level results indicators reflecting the goals to which the project will contribute. They reflect the strategic rationale of the project and higher-level goals of GAFSP, which focus on poverty, productivity, and food security (Tier 1; see Annex 1). Core indicators: In finalizing the results framework, each GAFSP-financed project will select from the menu of GAFSP core indicators (Tier 2; see Annex 1) all output or intermediary outcome indicators that are applicable to the project components and the results areas of focus of the GAFSP project. These indicators will be included in the respective project results frameworks. This approach will make it possible to report and aggregate results across projects.
Targets Projects targets are estimated to provide benchmarks against which performances of outcome or output indicators can be judged in relation to the baseline. The estimates of
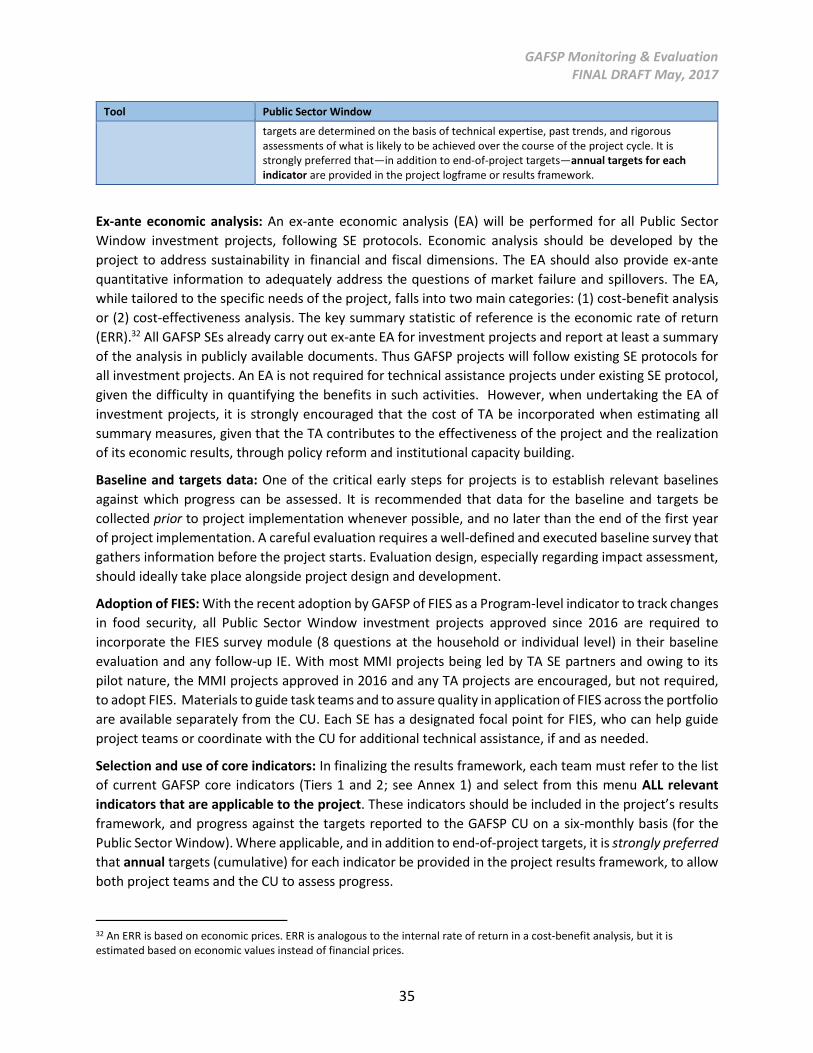
GAFSP Monitoring & Evaluation FINAL DRAFT May, 2017
35
Tool Public Sector Window
targets are determined on the basis of technical expertise, past trends, and rigorous assessments of what is likely to be achieved over the course of the project cycle. It is strongly preferred that—in addition to end-of-project targets—annual targets for each indicator are provided in the project logframe or results framework.
Ex-ante economic analysis: An ex-ante economic analysis (EA) will be performed for all Public Sector
Window investment projects, following SE protocols. Economic analysis should be developed by the
project to address sustainability in financial and fiscal dimensions. The EA should also provide ex-ante
quantitative information to adequately address the questions of market failure and spillovers. The EA,
while tailored to the specific needs of the project, falls into two main categories: (1) cost-benefit analysis
or (2) cost-effectiveness analysis. The key summary statistic of reference is the economic rate of return
(ERR).32 All GAFSP SEs already carry out ex-ante EA for investment projects and report at least a summary
of the analysis in publicly available documents. Thus GAFSP projects will follow existing SE protocols for
all investment projects. An EA is not required for technical assistance projects under existing SE protocol,
given the difficulty in quantifying the benefits in such activities. However, when undertaking the EA of
investment projects, it is strongly encouraged that the cost of TA be incorporated when estimating all
summary measures, given that the TA contributes to the effectiveness of the project and the realization
of its economic results, through policy reform and institutional capacity building.
Baseline and targets data: One of the critical early steps for projects is to establish relevant baselines
against which progress can be assessed. It is recommended that data for the baseline and targets be
collected prior to project implementation whenever possible, and no later than the end of the first year
of project implementation. A careful evaluation requires a well-defined and executed baseline survey that
gathers information before the project starts. Evaluation design, especially regarding impact assessment,
should ideally take place alongside project design and development.
Adoption of FIES: With the recent adoption by GAFSP of FIES as a Program-level indicator to track changes
in food security, all Public Sector Window investment projects approved since 2016 are required to
incorporate the FIES survey module (8 questions at the household or individual level) in their baseline
evaluation and any follow-up IE. With most MMI projects being led by TA SE partners and owing to its
pilot nature, the MMI projects approved in 2016 and any TA projects are encouraged, but not required,
to adopt FIES. Materials to guide task teams and to assure quality in application of FIES across the portfolio
are available separately from the CU. Each SE has a designated focal point for FIES, who can help guide
project teams or coordinate with the CU for additional technical assistance, if and as needed.
Selection and use of core indicators: In finalizing the results framework, each team must refer to the list
of current GAFSP core indicators (Tiers 1 and 2; see Annex 1) and select from this menu ALL relevant
indicators that are applicable to the project. These indicators should be included in the project’s results
framework, and progress against the targets reported to the GAFSP CU on a six-monthly basis (for the
Public Sector Window). Where applicable, and in addition to end-of-project targets, it is strongly preferred
that annual targets (cumulative) for each indicator be provided in the project results framework, to allow
both project teams and the CU to assess progress.
32 An ERR is based on economic prices. ERR is analogous to the internal rate of return in a cost-benefit analysis, but it is estimated based on economic values instead of financial prices.
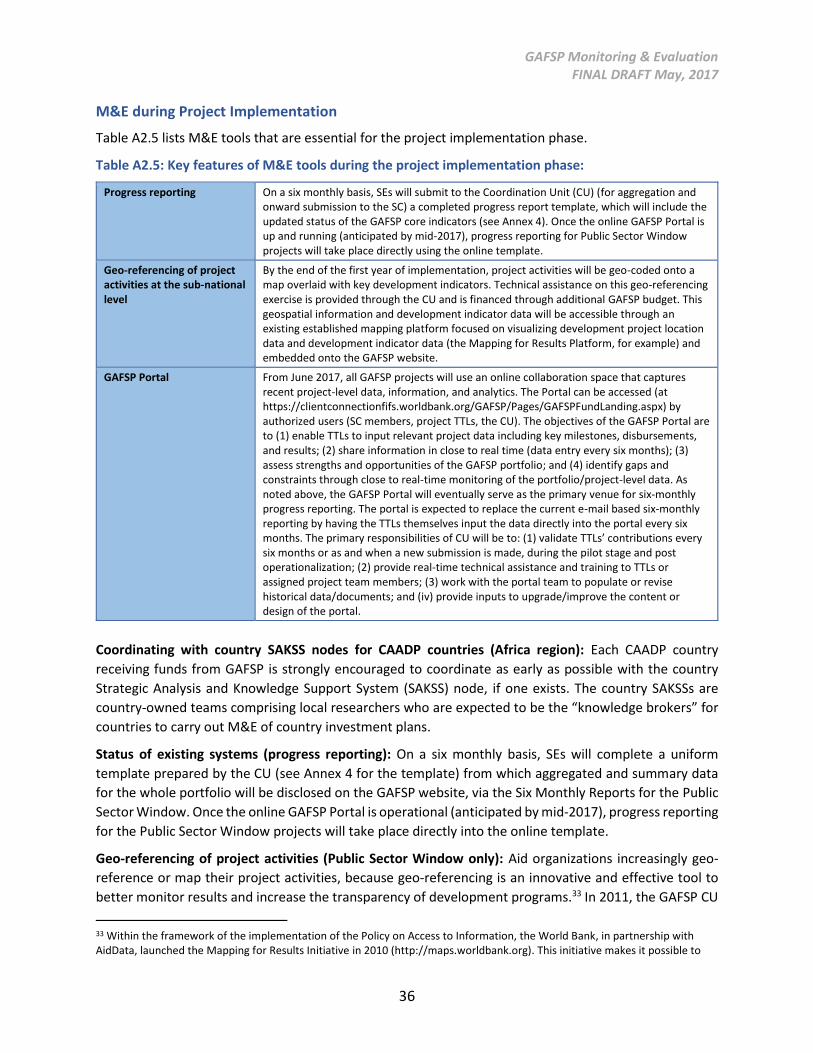
GAFSP Monitoring & Evaluation FINAL DRAFT May, 2017
36
M&E during Project Implementation
Table A2.5 lists M&E tools that are essential for the project implementation phase.
Table A2.5: Key features of M&E tools during the project implementation phase:
Progress reporting On a six monthly basis, SEs will submit to the Coordination Unit (CU) (for aggregation and onward submission to the SC) a completed progress report template, which will include the updated status of the GAFSP core indicators (see Annex 4). Once the online GAFSP Portal is up and running (anticipated by mid-2017), progress reporting for Public Sector Window projects will take place directly using the online template.
Geo-referencing of project activities at the sub-national level
By the end of the first year of implementation, project activities will be geo-coded onto a map overlaid with key development indicators. Technical assistance on this geo-referencing exercise is provided through the CU and is financed through additional GAFSP budget. This geospatial information and development indicator data will be accessible through an existing established mapping platform focused on visualizing development project location data and development indicator data (the Mapping for Results Platform, for example) and embedded onto the GAFSP website.
GAFSP Portal From June 2017, all GAFSP projects will use an online collaboration space that captures recent project-level data, information, and analytics. The Portal can be accessed (at https://clientconnectionfifs.worldbank.org/GAFSP/Pages/GAFSPFundLanding.aspx) by authorized users (SC members, project TTLs, the CU). The objectives of the GAFSP Portal are to (1) enable TTLs to input relevant project data including key milestones, disbursements, and results; (2) share information in close to real time (data entry every six months); (3) assess strengths and opportunities of the GAFSP portfolio; and (4) identify gaps and constraints through close to real-time monitoring of the portfolio/project-level data. As noted above, the GAFSP Portal will eventually serve as the primary venue for six-monthly progress reporting. The portal is expected to replace the current e-mail based six-monthly reporting by having the TTLs themselves input the data directly into the portal every six months. The primary responsibilities of CU will be to: (1) validate TTLs’ contributions every six months or as and when a new submission is made, during the pilot stage and post operationalization; (2) provide real-time technical assistance and training to TTLs or assigned project team members; (3) work with the portal team to populate or revise historical data/documents; and (iv) provide inputs to upgrade/improve the content or design of the portal.
Coordinating with country SAKSS nodes for CAADP countries (Africa region): Each CAADP country
receiving funds from GAFSP is strongly encouraged to coordinate as early as possible with the country
Strategic Analysis and Knowledge Support System (SAKSS) node, if one exists. The country SAKSSs are
country-owned teams comprising local researchers who are expected to be the “knowledge brokers” for
countries to carry out M&E of country investment plans.
Status of existing systems (progress reporting): On a six monthly basis, SEs will complete a uniform
template prepared by the CU (see Annex 4 for the template) from which aggregated and summary data
for the whole portfolio will be disclosed on the GAFSP website, via the Six Monthly Reports for the Public
Sector Window. Once the online GAFSP Portal is operational (anticipated by mid-2017), progress reporting
for the Public Sector Window projects will take place directly into the online template.
Geo-referencing of project activities (Public Sector Window only): Aid organizations increasingly geo-
reference or map their project activities, because geo-referencing is an innovative and effective tool to
better monitor results and increase the transparency of development programs.33 In 2011, the GAFSP CU
33 Within the framework of the implementation of the Policy on Access to Information, the World Bank, in partnership with AidData, launched the Mapping for Results Initiative in 2010 (http://maps.worldbank.org). This initiative makes it possible to
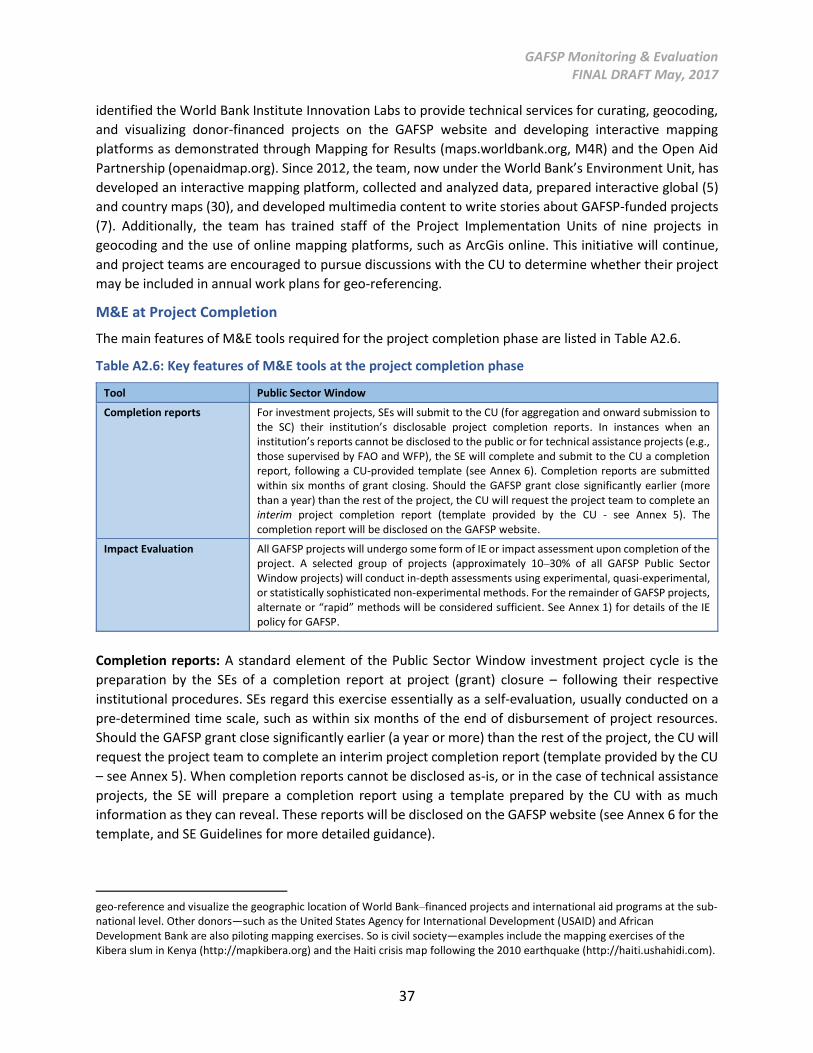
GAFSP Monitoring & Evaluation FINAL DRAFT May, 2017
37
identified the World Bank Institute Innovation Labs to provide technical services for curating, geocoding,
and visualizing donor-financed projects on the GAFSP website and developing interactive mapping
platforms as demonstrated through Mapping for Results (maps.worldbank.org, M4R) and the Open Aid
Partnership (openaidmap.org). Since 2012, the team, now under the World Bank’s Environment Unit, has
developed an interactive mapping platform, collected and analyzed data, prepared interactive global (5)
and country maps (30), and developed multimedia content to write stories about GAFSP-funded projects
(7). Additionally, the team has trained staff of the Project Implementation Units of nine projects in
geocoding and the use of online mapping platforms, such as ArcGis online. This initiative will continue,
and project teams are encouraged to pursue discussions with the CU to determine whether their project
may be included in annual work plans for geo-referencing.
M&E at Project Completion
The main features of M&E tools required for the project completion phase are listed in Table A2.6.
Table A2.6: Key features of M&E tools at the project completion phase
Tool Public Sector Window
Completion reports For investment projects, SEs will submit to the CU (for aggregation and onward submission to the SC) their institution’s disclosable project completion reports. In instances when an institution’s reports cannot be disclosed to the public or for technical assistance projects (e.g., those supervised by FAO and WFP), the SE will complete and submit to the CU a completion report, following a CU-provided template (see Annex 6). Completion reports are submitted within six months of grant closing. Should the GAFSP grant close significantly earlier (more than a year) than the rest of the project, the CU will request the project team to complete an interim project completion report (template provided by the CU - see Annex 5). The completion report will be disclosed on the GAFSP website.
Impact Evaluation All GAFSP projects will undergo some form of IE or impact assessment upon completion of the project. A selected group of projects (approximately 10–30% of all GAFSP Public Sector Window projects) will conduct in-depth assessments using experimental, quasi-experimental, or statistically sophisticated non-experimental methods. For the remainder of GAFSP projects, alternate or “rapid” methods will be considered sufficient. See Annex 1) for details of the IE policy for GAFSP.
Completion reports: A standard element of the Public Sector Window investment project cycle is the
preparation by the SEs of a completion report at project (grant) closure – following their respective
institutional procedures. SEs regard this exercise essentially as a self-evaluation, usually conducted on a
pre-determined time scale, such as within six months of the end of disbursement of project resources.
Should the GAFSP grant close significantly earlier (a year or more) than the rest of the project, the CU will
request the project team to complete an interim project completion report (template provided by the CU
– see Annex 5). When completion reports cannot be disclosed as-is, or in the case of technical assistance
projects, the SE will prepare a completion report using a template prepared by the CU with as much
information as they can reveal. These reports will be disclosed on the GAFSP website (see Annex 6 for the
template, and SE Guidelines for more detailed guidance).
geo-reference and visualize the geographic location of World Bank–financed projects and international aid programs at the sub-national level. Other donors—such as the United States Agency for International Development (USAID) and African Development Bank are also piloting mapping exercises. So is civil society—examples include the mapping exercises of the Kibera slum in Kenya (http://mapkibera.org) and the Haiti crisis map following the 2010 earthquake (http://haiti.ushahidi.com).

GAFSP Monitoring & Evaluation FINAL DRAFT May, 2017
38
Impact Evaluation Policy for GAFSP Public Sector Window projects: The GAFSP policy on IE is presented
in Table A2.7. All GAFSP projects will undergo an impact evaluation or assessment of some form upon
completion. A selected group (up to 30 percent) of GAFSP projects will conduct an in-depth assessment
using experimental or quasi-experimental methods, with additional budget provided to do so. For the
remainder of GAFSP projects, “rapid” assessment methods may be considered sufficient. All approved
GAFSP projects will have the opportunity to opt into the cohort performing IEs in depth. The final selection
of projects to undergo IEs in depth will be made by the SC upon discussion with the specialized
organization that will carry out the work, following submission of an outline concept, methodology, and
budget.
Table A2.7: Impact evaluation policy for GAFSP Public Sector Window
Target Indicative cost Implementation Funding
I. In-depth IEs (experimental or quasi-experimental IE, statistically robust non-experimental IE)
Up to 30% of GAFSP projects selected upon discussion with the specialized organization
c. US$800,000 for each IE
Following screening and approval of concepts, a project may contract a specialized organization to carry out the in-depth IE. The CU may facilitate a partnership between selected projects and organizations specialized in providing impact evaluations, for example, the World Bank’s Development Impact Evaluation Group (DIME).
To be funded separately by the SC, upon approval
II. Mixed method/rapid Impact assessments
All GAFSP projects (except for those that have been chosen to carry out the in-depth IEs)
US$50,000–200,000 for each IE
Each project to make arrangements that may include contracting a specialized organization to design/ carry out its rapid IE.
To be funded from each GAFSP-awarded Grant amount
Implementing arrangement of IEs: The IEs for GAFSP projects should be carried out by a recognized
research entity with a track record of conducting such studies.34 For in-depth IEs (options 1 and 2 in Box
A1.2, Annex 1) of projects in the Public Sector Window, which are approved to receive additional funds,
the CU can facilitate a link with the World Bank’s DIME evaluation group or the project can contract a
research entity with a solid track record in carrying out similar IEs for agricultural development projects.
For more “rapid” impact assessments, each project will contract a research entity and manage its work.
Under all design scenarios, the research entity should start engaging with the project as soon as possible,
34 This group could include universities, research organizations such as IFPRI, the World Bank’s DIME initiative, Brookings Institution, Center for Global Development, regional technical organizations, or initiatives such as 3IE (www.3ieimpact.org), for example.
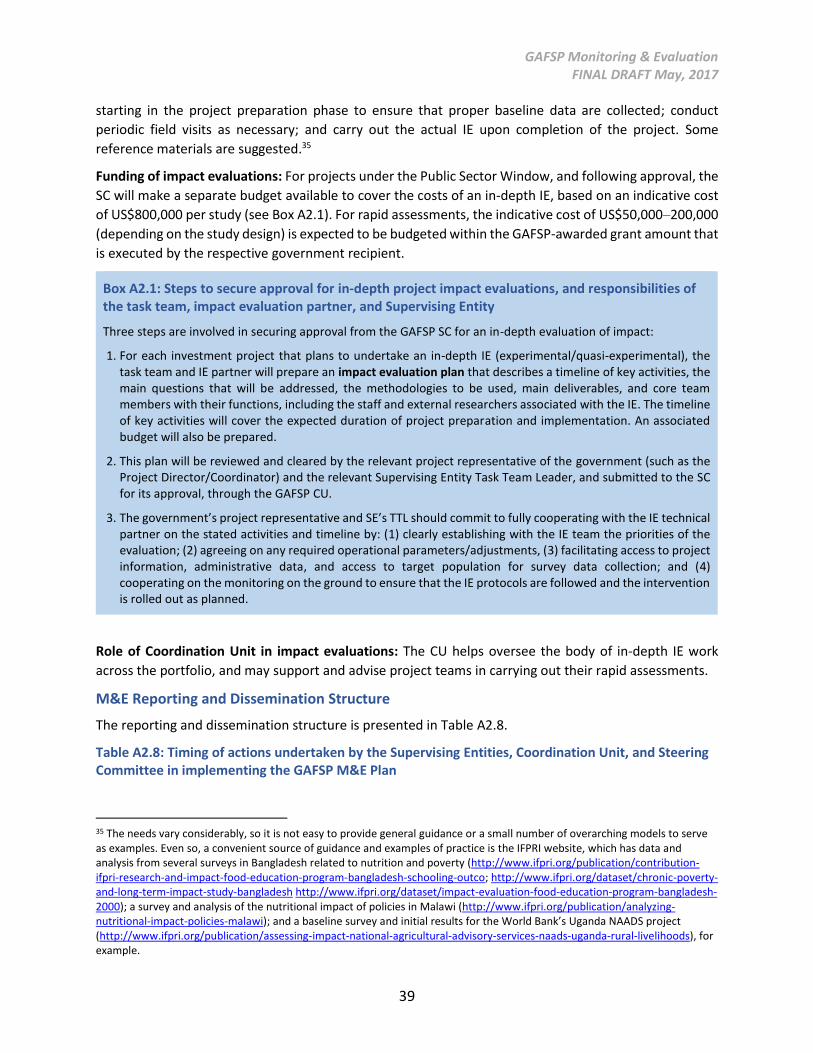
GAFSP Monitoring & Evaluation FINAL DRAFT May, 2017
39
starting in the project preparation phase to ensure that proper baseline data are collected; conduct
periodic field visits as necessary; and carry out the actual IE upon completion of the project. Some
reference materials are suggested.35
Funding of impact evaluations: For projects under the Public Sector Window, and following approval, the
SC will make a separate budget available to cover the costs of an in-depth IE, based on an indicative cost
of US$800,000 per study (see Box A2.1). For rapid assessments, the indicative cost of US$50,000–200,000
(depending on the study design) is expected to be budgeted within the GAFSP-awarded grant amount that
is executed by the respective government recipient.
Box A2.1: Steps to secure approval for in-depth project impact evaluations, and responsibilities of the task team, impact evaluation partner, and Supervising Entity
Three steps are involved in securing approval from the GAFSP SC for an in-depth evaluation of impact:
1. For each investment project that plans to undertake an in-depth IE (experimental/quasi-experimental), the task team and IE partner will prepare an impact evaluation plan that describes a timeline of key activities, the main questions that will be addressed, the methodologies to be used, main deliverables, and core team members with their functions, including the staff and external researchers associated with the IE. The timeline of key activities will cover the expected duration of project preparation and implementation. An associated budget will also be prepared.
2. This plan will be reviewed and cleared by the relevant project representative of the government (such as the Project Director/Coordinator) and the relevant Supervising Entity Task Team Leader, and submitted to the SC for its approval, through the GAFSP CU.
3. The government’s project representative and SE’s TTL should commit to fully cooperating with the IE technical partner on the stated activities and timeline by: (1) clearly establishing with the IE team the priorities of the evaluation; (2) agreeing on any required operational parameters/adjustments, (3) facilitating access to project information, administrative data, and access to target population for survey data collection; and (4) cooperating on the monitoring on the ground to ensure that the IE protocols are followed and the intervention is rolled out as planned.
Role of Coordination Unit in impact evaluations: The CU helps oversee the body of in-depth IE work
across the portfolio, and may support and advise project teams in carrying out their rapid assessments.
M&E Reporting and Dissemination Structure
The reporting and dissemination structure is presented in Table A2.8.
Table A2.8: Timing of actions undertaken by the Supervising Entities, Coordination Unit, and Steering Committee in implementing the GAFSP M&E Plan
35 The needs vary considerably, so it is not easy to provide general guidance or a small number of overarching models to serve as examples. Even so, a convenient source of guidance and examples of practice is the IFPRI website, which has data and analysis from several surveys in Bangladesh related to nutrition and poverty (http://www.ifpri.org/publication/contribution-ifpri-research-and-impact-food-education-program-bangladesh-schooling-outco; http://www.ifpri.org/dataset/chronic-poverty-and-long-term-impact-study-bangladesh http://www.ifpri.org/dataset/impact-evaluation-food-education-program-bangladesh-2000); a survey and analysis of the nutritional impact of policies in Malawi (http://www.ifpri.org/publication/analyzing-nutritional-impact-policies-malawi); and a baseline survey and initial results for the World Bank’s Uganda NAADS project (http://www.ifpri.org/publication/assessing-impact-national-agricultural-advisory-services-naads-uganda-rural-livelihoods), for example.
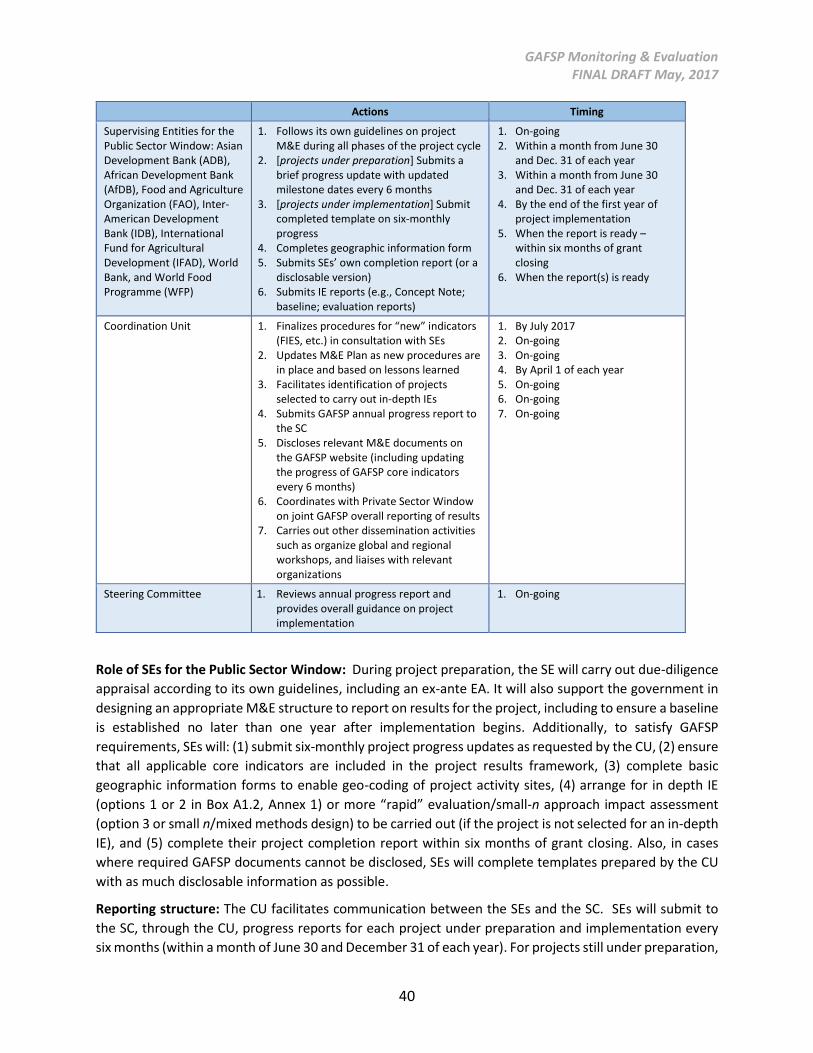
GAFSP Monitoring & Evaluation FINAL DRAFT May, 2017
40
Actions Timing
Supervising Entities for the Public Sector Window: Asian Development Bank (ADB), African Development Bank (AfDB), Food and Agriculture Organization (FAO), Inter-American Development Bank (IDB), International Fund for Agricultural Development (IFAD), World Bank, and World Food Programme (WFP)
1. Follows its own guidelines on project M&E during all phases of the project cycle
2. [projects under preparation] Submits a brief progress update with updated milestone dates every 6 months
3. [projects under implementation] Submit completed template on six-monthly progress
4. Completes geographic information form 5. Submits SEs’ own completion report (or a
disclosable version) 6. Submits IE reports (e.g., Concept Note;
baseline; evaluation reports)
1. On-going 2. Within a month from June 30
and Dec. 31 of each year 3. Within a month from June 30
and Dec. 31 of each year 4. By the end of the first year of
project implementation 5. When the report is ready –
within six months of grant closing
6. When the report(s) is ready
Coordination Unit 1. Finalizes procedures for “new” indicators (FIES, etc.) in consultation with SEs
2. Updates M&E Plan as new procedures are in place and based on lessons learned
3. Facilitates identification of projects selected to carry out in-depth IEs
4. Submits GAFSP annual progress report to the SC
5. Discloses relevant M&E documents on the GAFSP website (including updating the progress of GAFSP core indicators every 6 months)
6. Coordinates with Private Sector Window on joint GAFSP overall reporting of results
7. Carries out other dissemination activities such as organize global and regional workshops, and liaises with relevant organizations
1. By July 2017 2. On-going 3. On-going 4. By April 1 of each year 5. On-going 6. On-going 7. On-going
Steering Committee 1. Reviews annual progress report and provides overall guidance on project implementation
1. On-going
Role of SEs for the Public Sector Window: During project preparation, the SE will carry out due-diligence
appraisal according to its own guidelines, including an ex-ante EA. It will also support the government in
designing an appropriate M&E structure to report on results for the project, including to ensure a baseline
is established no later than one year after implementation begins. Additionally, to satisfy GAFSP
requirements, SEs will: (1) submit six-monthly project progress updates as requested by the CU, (2) ensure
that all applicable core indicators are included in the project results framework, (3) complete basic
geographic information forms to enable geo-coding of project activity sites, (4) arrange for in depth IE
(options 1 or 2 in Box A1.2, Annex 1) or more “rapid” evaluation/small-n approach impact assessment
(option 3 or small n/mixed methods design) to be carried out (if the project is not selected for an in-depth
IE), and (5) complete their project completion report within six months of grant closing. Also, in cases
where required GAFSP documents cannot be disclosed, SEs will complete templates prepared by the CU
with as much disclosable information as possible.
Reporting structure: The CU facilitates communication between the SEs and the SC. SEs will submit to
the SC, through the CU, progress reports for each project under preparation and implementation every
six months (within a month of June 30 and December 31 of each year). For projects still under preparation,
GAFSP Monitoring & Evaluation FINAL DRAFT May, 2017
41
the SE will submit a brief progress update note, which includes updated milestone dates and a brief
description of progress. Upon completion of the project, the SEs will submit a completion report to the
CU, as well as any independent evaluation carried out by the SE’s independent evaluation unit.
Role of CU: The CU will design applicable forms and report templates for SEs to fill in, collect and aggregate
data, and send timely reminders to the SEs on any documents that will be due. It will also develop a results
page in the GAFSP website to report on progress made Program-wide as well as at the project level, at
least every six months. At the program level, it will report on the progress of the GAFSP results framework
as well as aggregated progress on the core indicators (see Annex 1), which will be reported by the SEs
through the progress reports. This information will be provided to the SC as an annual progress report
every year by April 1. At the project level, the CU will maintain a page for each project on the website, and
upload to the website any disclosable documents provided by the SEs, embed a project activity map,
create a link to the project website, media material, and any other pertinent information/material
provided by the SE. The CU will also contract and supervise the work of specialized organizations, namely
organizations identified to carry out in-depth IEs, and the mapping platform. Timely provision of project
data by all SEs to the CU is essential.
The CU will also prepare one-page results sheets and other opportune dissemination materials; liaise with
the M&E offices of relevant organizations such as the Regional Strategic Analysis and Knowledge Support
System (ReSAKSS), which is in charge of the review of M&E for CAADP country investment plans; organize
and participate in global and regional workshops as needed; and aim to incorporate other best practice
M&E tools. The CU will update team leaders on changes and revisions, including through the annual GAFSP
Knowledge Forum. For CAADP countries, GAFSP will provide input into CAADP’s Mutual Accountability
Framework as requested by the ReSAKSS.
GAFSP Monitoring & Evaluation FINAL DRAFT May, 2017
42
ANNEX 3: Private Sector Window Portfolio M&E Processes
1. BACKGROUND
To monitor outcomes and assess impacts of the GAFSP Private Sector Window projects, the GAFSP Donor
Committee approved the Private Sector Window M&E Framework in September 2013.
The M&E framework for Private Sector Window support includes four inter-related components that
reinforce each other: monitoring, poverty assessments, impact evaluations, and program evaluations.
The GAFSP Private Sector Window goals are monitored by proxy indicators in IFC’s monitoring systems
(such as farmers reached, production volume, employment provided, agri-loans, and so on), but impact
measures such as farmer income, poverty, food security, and gender effects take longer to observe,
require more sophisticated tools to measure, and take time and resources to assess rigorously and
credibly.
The following sections provide a brief explanation of the four components and how they relate to each
other and also reflect updates following GAFSP M&E Working Group recommendations to the GAFSP
Steering Committee in January 2016.
2. MONITORING
Coverage: All GAFSP-supported investment and advisory projects.
Purpose: Regular (once a year) tracking and reporting of output and outcome indicators.
Methodology: Through IFC’s regular monitoring systems (DOTS for investments and the Advisory Services
Operations Portal for advisory projects).
Linkage with other M&E activities under the framework: Monitoring serves as the building block for both
the project evaluations and program evaluations.
3. POVERTY ASSESSMENTS
Coverage: Sixteen poverty assessments using the Simple Poverty Scorecard. Criteria for selecting projects
for Simple Poverty Scorecard assessments were proposed by the Private Sector Window Secretariat and
agreed by Private Sector Window donors in 2015.
Purpose: To assess poverty status of beneficiaries of GAFSP projects.
Methodology: The Simple Poverty Scorecard (sometimes also called the Progress out of Poverty Index)
developed by Mark Schreiner (sample scorecards and list of countries with available scorecards can be
found at: http://www.microfinance.com/).
Linkage with other M&E activities under the framework: Poverty assessments can be conducted as part
of a project impact evaluation (see Project Impact Evaluations, next) or as a stand-alone tool to provide
insights on poverty rates of beneficiaries. Findings from the poverty assessments will also inform the
program evaluations (see the section on Program Evaluations.)
4. PROJECT IMPACT EVALUATIONS
GAFSP Monitoring & Evaluation FINAL DRAFT May, 2017
43
Coverage: Six project impact evaluations. Criteria for selecting projects for impact evaluations were
proposed by the Private Sector Window Secretariat and agreed by Private Sector Window donors in 2015.
Purpose: To assess the impact of GAFSP projects on yields, income, poverty, food security, and
inclusiveness (smallholder farmers, women).
Methodology: Randomized control trials (if possible), or quasi-experimental design methods. Impacts are
measured through household surveys of beneficiaries based on random sampling approach.
Linkage with other M&E activities under the framework: Some, if not all, of the project impact
evaluations will include a poverty assessment using the Simple Poverty Scorecard. The poverty
assessments will also inform the program evaluations, in particular the summative one and likely the mid-
term one as well. Altogether, projects that undergo either or both impact evaluations and simple poverty
scorecard assessments are estimated to represent about 35–40 percent of the Private Sector Window
portfolio (current funding is estimated to support about 40–45 investment projects).
5. PROGRAM EVALUATIONS
Coverage: Three program evaluations, including:
1. One formative, proposed completion date: December 2016
2. One mid-term, proposed completion date: January 2019
3. One summative, proposed completion date: January 2026
Purpose: To assess the overall performance, additionality, and results of the program.
Methodology: Depending on availability of existing information (such as from the above three M&E
activities, project documents, and other sources), desk reviews, field visits, interviews with key
stakeholders (including donors), and beneficiaries.
Linkage with other M&E activities under the framework: May rely heavily on the monitoring data and
findings from the project evaluations and poverty scorecards.
6. UPDATES FOLLOWING THE GAFSP M&E WORKING GROUP
RECOMMENDATIONS TO THE STEERING COMMITTEE IN JANUARY 2016
Income measures (direct or using other tools) will be included in all impact evaluations and poverty
scorecard assessments.
Food security measures (the FIES questionnaire) will be included in all impact evaluations and poverty
scorecard assessments.
Yields will be included in all impact evaluations, and tracked in annual monitoring of projects that have
yield increase as a specific objective.
Nutrition-related indicator will be tracked by projects that have nutrition as a specific objective.
7. MONITORING INDICATORS FOR THE MONITORING OF PRIVATE SECTOR
WINDOW PROJECTS
Within IFC’s existing operations, the Private Sector Window operations are of two types:
GAFSP Monitoring & Evaluation FINAL DRAFT May, 2017
44
1. Investment Projects: These include loans, equities, and guarantees through financial institutions
or directly invested in agribusiness firms.
2. Advisory Services: IFC provides advisory services to firms, farmer organizations, and farmers to
help increase access to agricultural finance, improve farmer productivity, establish standards and
market links, reduce risks, and mitigate climate change effects.
Because investment projects and advisory service projects are different in nature, they also apply different
sets of standard IFC indicators. IFC is currently reviewing its agribusiness advisory services indicators, and
they will be updated once that review is complete.
In the process of developing the set of overall GAFSP indicators in Annex 1, the Private Sector Window
indicators were compared to the Public Sector Window indicators and, where possible, merged under
joint indicators. Alternatively, Private Sector Window were listed as distinct indicators within the overall
set of GAFSP indicators.
Coordination on Reporting with the CU: IFC is the SE for the Private Sector Window. Given the difference
in the level of disclosability of data between the Public and Private Sector Windows, the IFC has developed
an M&E plan applicable for the Private Sector Window in consultation with the donors to that window.
The CU has coordinated with IFC during the drafting of the overall plan to ensure that a proper reporting
structure is established between the IFC and the CU. The IFC is expected to submit input to the CU on
progress of the Private Sector Window projects for the GAFSP annual progress report by February 1 of
each year.
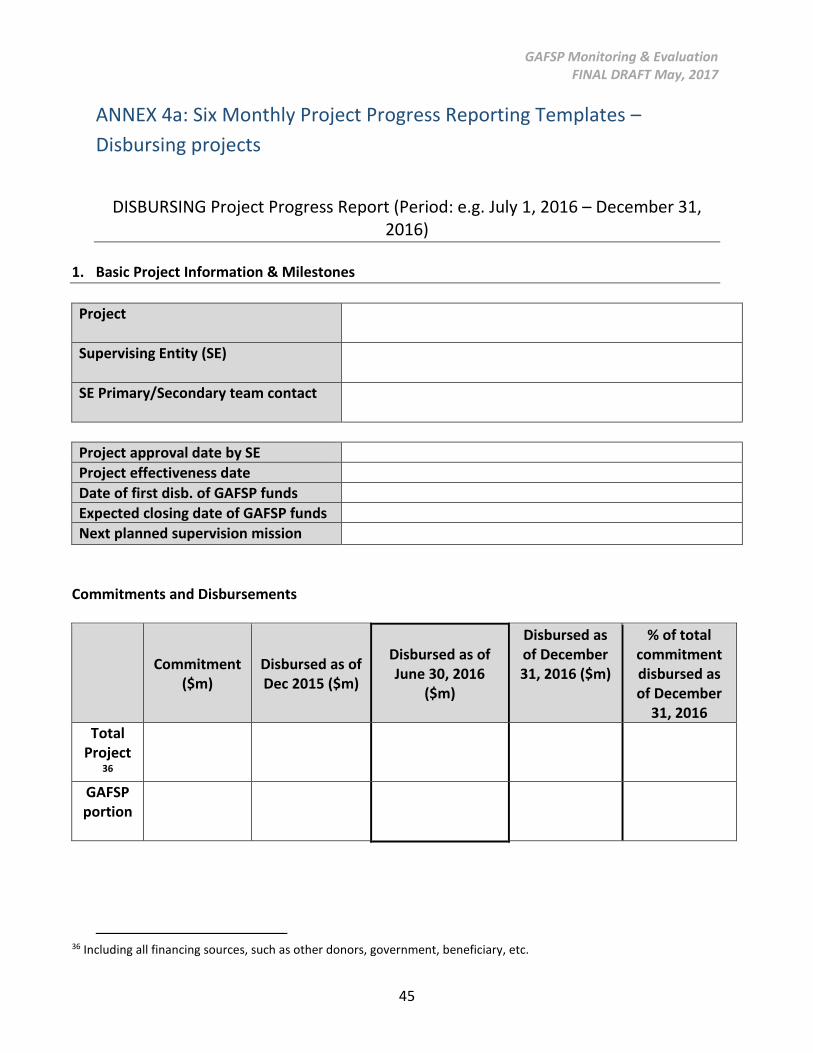
GAFSP Monitoring & Evaluation FINAL DRAFT May, 2017
45
ANNEX 4a: Six Monthly Project Progress Reporting Templates –
Disbursing projects
DISBURSING Project Progress Report (Period: e.g. July 1, 2016 – December 31,
2016)
1. Basic Project Information & Milestones
Project
Supervising Entity (SE)
SE Primary/Secondary team contact
Project approval date by SE
Project effectiveness date
Date of first disb. of GAFSP funds
Expected closing date of GAFSP funds
Next planned supervision mission
Commitments and Disbursements
Commitment
($m) Disbursed as of Dec 2015 ($m)
Disbursed as of June 30, 2016
($m)
Disbursed as of December 31, 2016 ($m)
% of total commitment disbursed as of December
31, 2016
Total Project
36
GAFSP portion
36 Including all financing sources, such as other donors, government, beneficiary, etc.
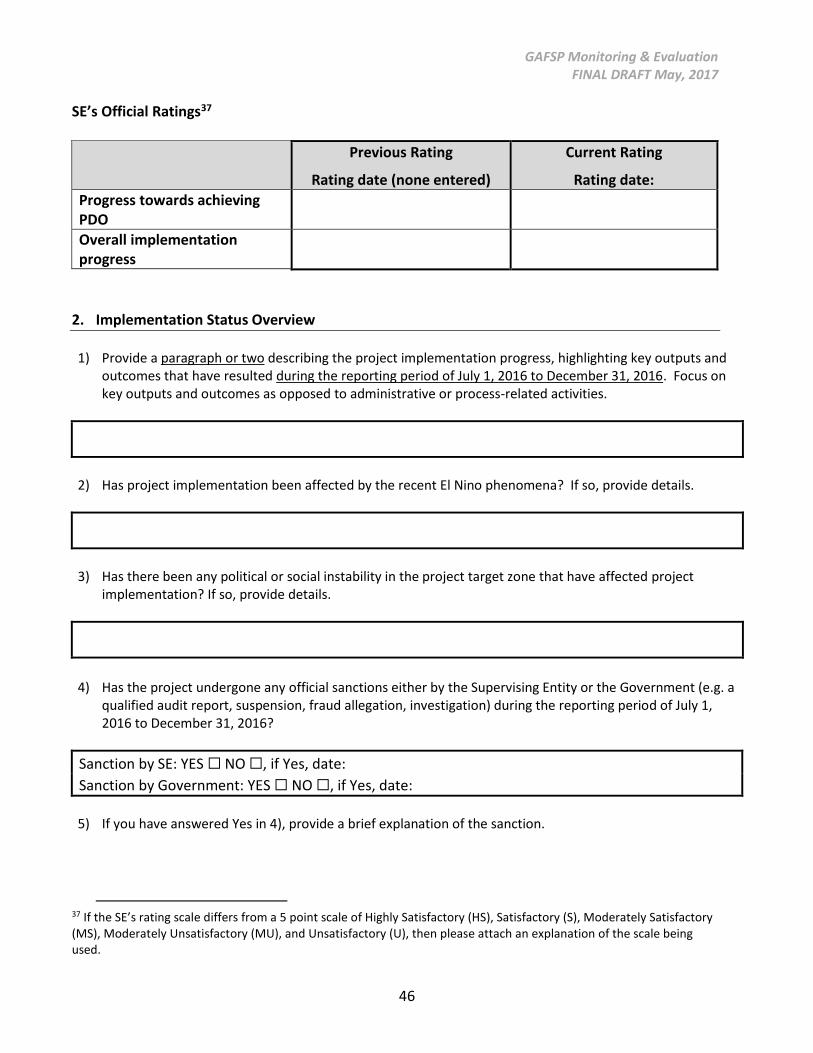
GAFSP Monitoring & Evaluation FINAL DRAFT May, 2017
46
SE’s Official Ratings37
Previous Rating
Rating date (none entered)
Current Rating
Rating date:
Progress towards achieving PDO
Overall implementation progress
2. Implementation Status Overview
1) Provide a paragraph or two describing the project implementation progress, highlighting key outputs and outcomes that have resulted during the reporting period of July 1, 2016 to December 31, 2016. Focus on key outputs and outcomes as opposed to administrative or process-related activities.
2) Has project implementation been affected by the recent El Nino phenomena? If so, provide details.
3) Has there been any political or social instability in the project target zone that have affected project
implementation? If so, provide details.
4) Has the project undergone any official sanctions either by the Supervising Entity or the Government (e.g. a
qualified audit report, suspension, fraud allegation, investigation) during the reporting period of July 1, 2016 to December 31, 2016?
Sanction by SE: YES ☐ NO ☐, if Yes, date:
Sanction by Government: YES ☐ NO ☐, if Yes, date:
5) If you have answered Yes in 4), provide a brief explanation of the sanction.
37 If the SE’s rating scale differs from a 5 point scale of Highly Satisfactory (HS), Satisfactory (S), Moderately Satisfactory (MS), Moderately Unsatisfactory (MU), and Unsatisfactory (U), then please attach an explanation of the scale being used.
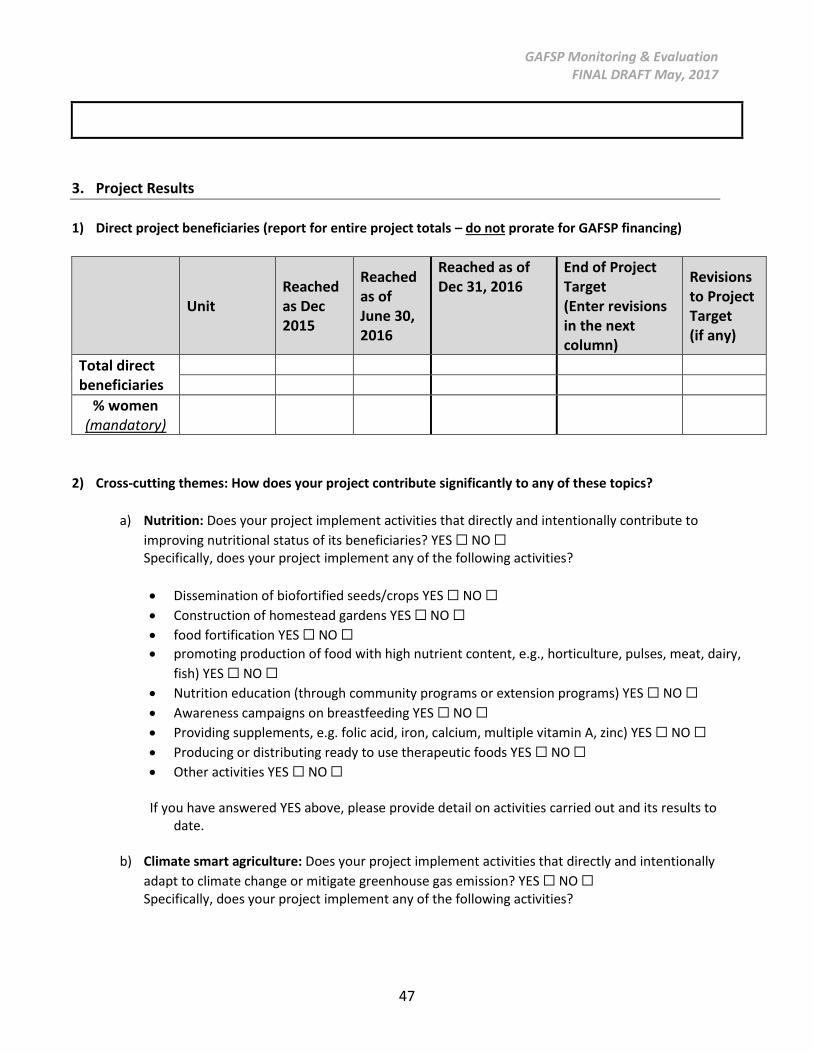
GAFSP Monitoring & Evaluation FINAL DRAFT May, 2017
47
3. Project Results
1) Direct project beneficiaries (report for entire project totals – do not prorate for GAFSP financing)
Unit Reached as Dec 2015
Reached as of June 30, 2016
Reached as of Dec 31, 2016
End of Project Target (Enter revisions in the next column)
Revisions to Project Target (if any)
Total direct beneficiaries
% women (mandatory)
2) Cross-cutting themes: How does your project contribute significantly to any of these topics?
a) Nutrition: Does your project implement activities that directly and intentionally contribute to
improving nutritional status of its beneficiaries? YES ☐ NO ☐ Specifically, does your project implement any of the following activities?
Dissemination of biofortified seeds/crops YES ☐ NO ☐
Construction of homestead gardens YES ☐ NO ☐
food fortification YES ☐ NO ☐
promoting production of food with high nutrient content, e.g., horticulture, pulses, meat, dairy,
fish) YES ☐ NO ☐
Nutrition education (through community programs or extension programs) YES ☐ NO ☐
Awareness campaigns on breastfeeding YES ☐ NO ☐
Providing supplements, e.g. folic acid, iron, calcium, multiple vitamin A, zinc) YES ☐ NO ☐
Producing or distributing ready to use therapeutic foods YES ☐ NO ☐
Other activities YES ☐ NO ☐ If you have answered YES above, please provide detail on activities carried out and its results to
date.
b) Climate smart agriculture: Does your project implement activities that directly and intentionally
adapt to climate change or mitigate greenhouse gas emission? YES ☐ NO ☐ Specifically, does your project implement any of the following activities?
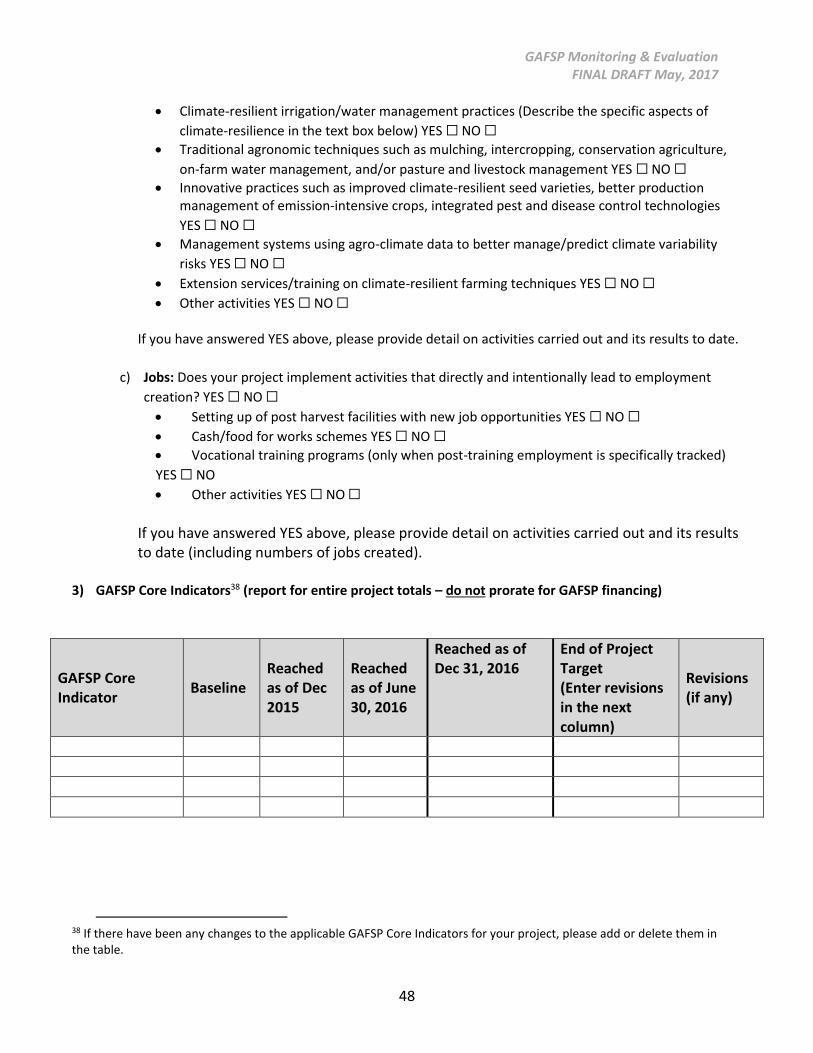
GAFSP Monitoring & Evaluation FINAL DRAFT May, 2017
48
Climate-resilient irrigation/water management practices (Describe the specific aspects of
climate-resilience in the text box below) YES ☐ NO ☐
Traditional agronomic techniques such as mulching, intercropping, conservation agriculture,
on-farm water management, and/or pasture and livestock management YES ☐ NO ☐
Innovative practices such as improved climate-resilient seed varieties, better production management of emission-intensive crops, integrated pest and disease control technologies
YES ☐ NO ☐
Management systems using agro-climate data to better manage/predict climate variability
risks YES ☐ NO ☐
Extension services/training on climate-resilient farming techniques YES ☐ NO ☐
Other activities YES ☐ NO ☐
If you have answered YES above, please provide detail on activities carried out and its results to date.
c) Jobs: Does your project implement activities that directly and intentionally lead to employment
creation? YES ☐ NO ☐
Setting up of post harvest facilities with new job opportunities YES ☐ NO ☐
Cash/food for works schemes YES ☐ NO ☐
Vocational training programs (only when post-training employment is specifically tracked)
YES ☐ NO
Other activities YES ☐ NO ☐
If you have answered YES above, please provide detail on activities carried out and its results to date (including numbers of jobs created).
3) GAFSP Core Indicators38 (report for entire project totals – do not prorate for GAFSP financing)
GAFSP Core Indicator
Baseline Reached as of Dec 2015
Reached as of June 30, 2016
Reached as of Dec 31, 2016
End of Project Target (Enter revisions in the next column)
Revisions (if any)
38 If there have been any changes to the applicable GAFSP Core Indicators for your project, please add or delete them in the table.
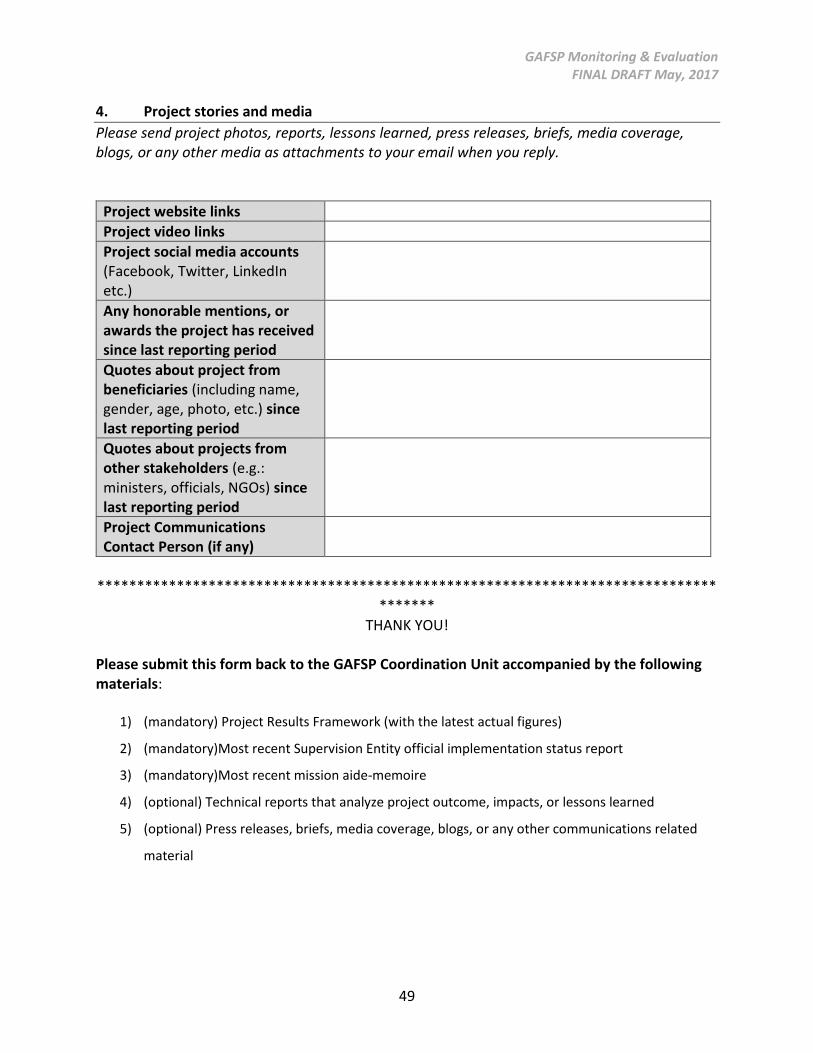
GAFSP Monitoring & Evaluation FINAL DRAFT May, 2017
49
4. Project stories and media
Please send project photos, reports, lessons learned, press releases, briefs, media coverage, blogs, or any other media as attachments to your email when you reply.
Project website links
Project video links
Project social media accounts (Facebook, Twitter, LinkedIn etc.)
Any honorable mentions, or awards the project has received since last reporting period
Quotes about project from beneficiaries (including name, gender, age, photo, etc.) since last reporting period
Quotes about projects from other stakeholders (e.g.: ministers, officials, NGOs) since last reporting period
Project Communications Contact Person (if any)
******************************************************************************
******* THANK YOU!
Please submit this form back to the GAFSP Coordination Unit accompanied by the following materials:
1) (mandatory) Project Results Framework (with the latest actual figures)
2) (mandatory)Most recent Supervision Entity official implementation status report
3) (mandatory)Most recent mission aide-memoire
4) (optional) Technical reports that analyze project outcome, impacts, or lessons learned
5) (optional) Press releases, briefs, media coverage, blogs, or any other communications related
material
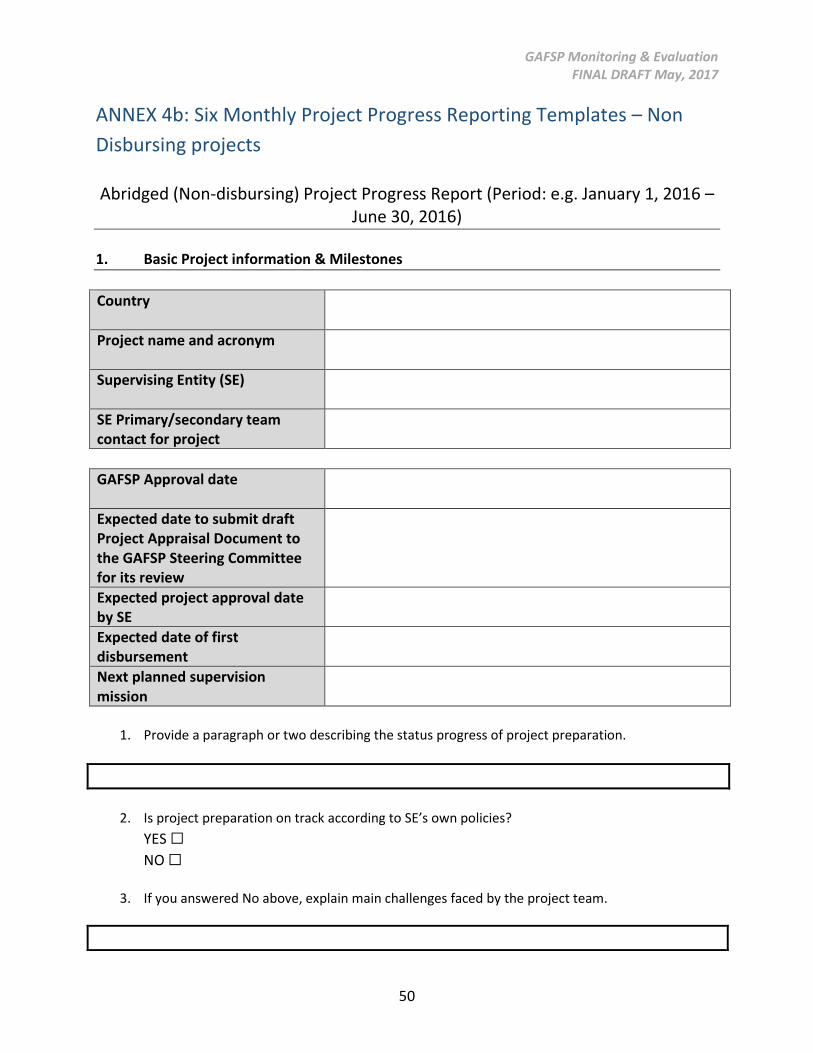
GAFSP Monitoring & Evaluation FINAL DRAFT May, 2017
50
ANNEX 4b: Six Monthly Project Progress Reporting Templates – Non
Disbursing projects
Abridged (Non-disbursing) Project Progress Report (Period: e.g. January 1, 2016 – June 30, 2016)
1. Basic Project information & Milestones
Country
Project name and acronym
Supervising Entity (SE)
SE Primary/secondary team contact for project
GAFSP Approval date
Expected date to submit draft Project Appraisal Document to the GAFSP Steering Committee for its review
Expected project approval date by SE
Expected date of first disbursement
Next planned supervision mission
1. Provide a paragraph or two describing the status progress of project preparation.
2. Is project preparation on track according to SE’s own policies?
YES ☐
NO ☐
3. If you answered No above, explain main challenges faced by the project team.
GAFSP Monitoring & Evaluation FINAL DRAFT May, 2017
51
4. If you answered No above, explain key actions taken by the Supervising Entity to address the
main challenges faced by the project team.
Thank you for your cooperation!
****************************
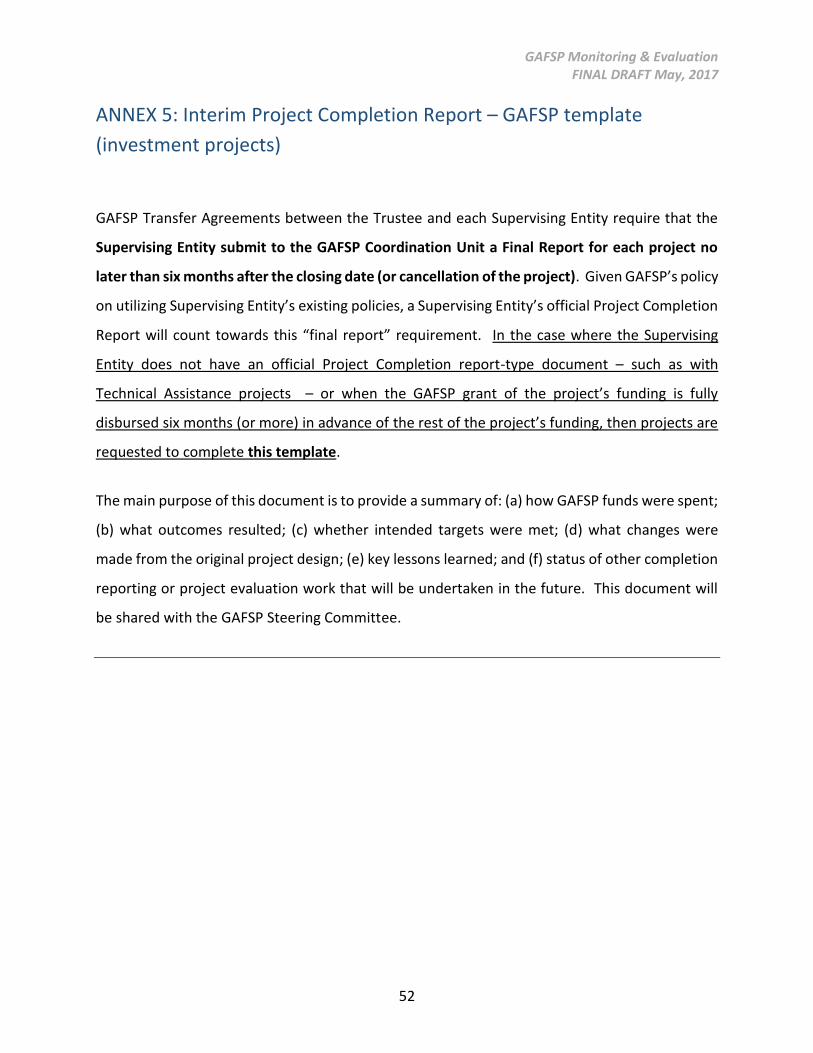
GAFSP Monitoring & Evaluation FINAL DRAFT May, 2017
52
ANNEX 5: Interim Project Completion Report – GAFSP template
(investment projects)
GAFSP Transfer Agreements between the Trustee and each Supervising Entity require that the
Supervising Entity submit to the GAFSP Coordination Unit a Final Report for each project no
later than six months after the closing date (or cancellation of the project). Given GAFSP’s policy
on utilizing Supervising Entity’s existing policies, a Supervising Entity’s official Project Completion
Report will count towards this “final report” requirement. In the case where the Supervising
Entity does not have an official Project Completion report-type document – such as with
Technical Assistance projects – or when the GAFSP grant of the project’s funding is fully
disbursed six months (or more) in advance of the rest of the project’s funding, then projects are
requested to complete this template.
The main purpose of this document is to provide a summary of: (a) how GAFSP funds were spent;
(b) what outcomes resulted; (c) whether intended targets were met; (d) what changes were
made from the original project design; (e) key lessons learned; and (f) status of other completion
reporting or project evaluation work that will be undertaken in the future. This document will
be shared with the GAFSP Steering Committee.
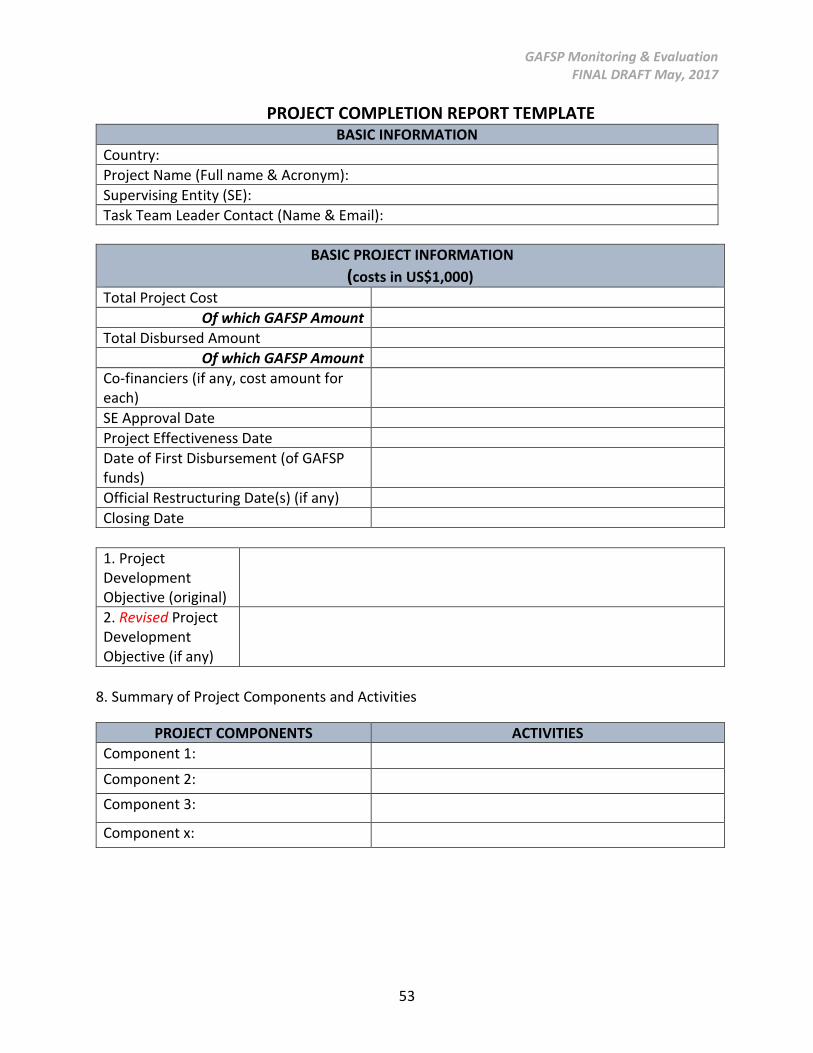
GAFSP Monitoring & Evaluation FINAL DRAFT May, 2017
53
PROJECT COMPLETION REPORT TEMPLATE BASIC INFORMATION
Country:
Project Name (Full name & Acronym):
Supervising Entity (SE):
Task Team Leader Contact (Name & Email):
BASIC PROJECT INFORMATION
(costs in US$1,000)
Total Project Cost
Of which GAFSP Amount
Total Disbursed Amount
Of which GAFSP Amount
Co-financiers (if any, cost amount for each)
SE Approval Date
Project Effectiveness Date
Date of First Disbursement (of GAFSP funds)
Official Restructuring Date(s) (if any)
Closing Date
1. Project Development Objective (original)
2. Revised Project Development Objective (if any)
8. Summary of Project Components and Activities
PROJECT COMPONENTS ACTIVITIES
Component 1:
Component 2:
Component 3:
Component x:
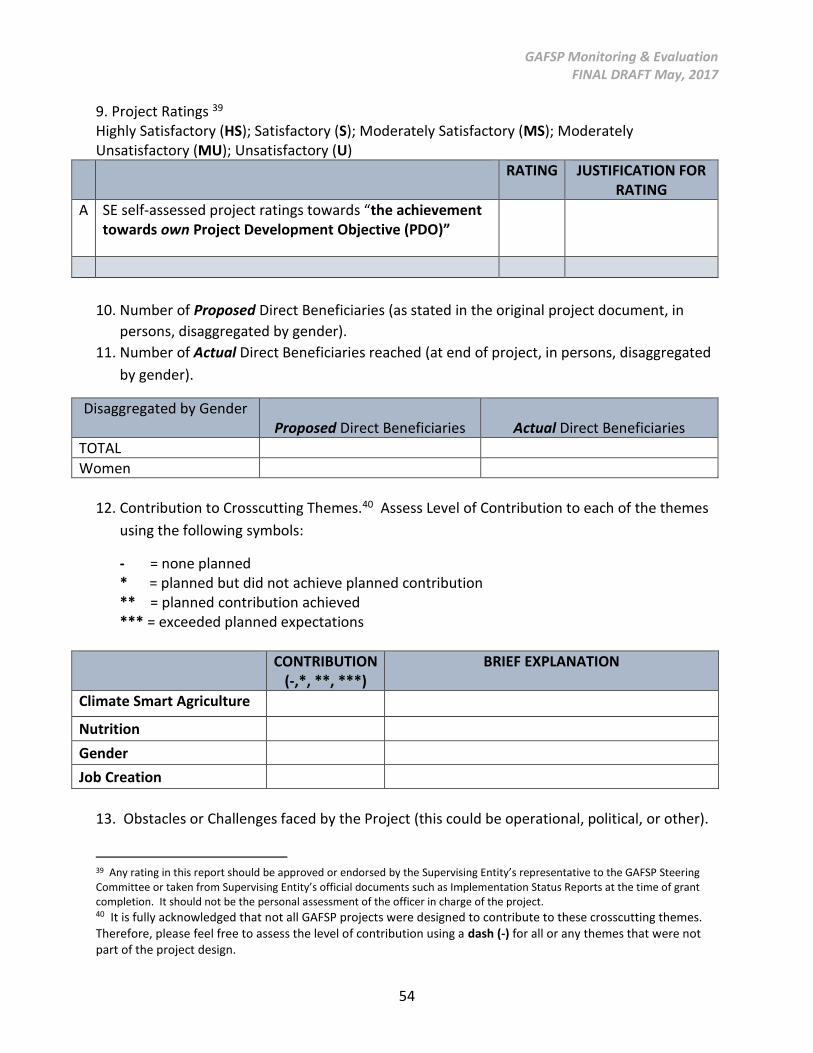
GAFSP Monitoring & Evaluation FINAL DRAFT May, 2017
54
9. Project Ratings 39 Highly Satisfactory (HS); Satisfactory (S); Moderately Satisfactory (MS); Moderately Unsatisfactory (MU); Unsatisfactory (U)
RATING JUSTIFICATION FOR RATING
A SE self-assessed project ratings towards “the achievement towards own Project Development Objective (PDO)”
10. Number of Proposed Direct Beneficiaries (as stated in the original project document, in
persons, disaggregated by gender).
11. Number of Actual Direct Beneficiaries reached (at end of project, in persons, disaggregated
by gender).
Disaggregated by Gender Proposed Direct Beneficiaries
Actual Direct Beneficiaries
TOTAL
Women
12. Contribution to Crosscutting Themes.40 Assess Level of Contribution to each of the themes
using the following symbols:
- = none planned * = planned but did not achieve planned contribution ** = planned contribution achieved *** = exceeded planned expectations
CONTRIBUTION (-,*, **, ***)
BRIEF EXPLANATION
Climate Smart Agriculture
Nutrition
Gender
Job Creation
13. Obstacles or Challenges faced by the Project (this could be operational, political, or other).
39 Any rating in this report should be approved or endorsed by the Supervising Entity’s representative to the GAFSP Steering Committee or taken from Supervising Entity’s official documents such as Implementation Status Reports at the time of grant completion. It should not be the personal assessment of the officer in charge of the project. 40 It is fully acknowledged that not all GAFSP projects were designed to contribute to these crosscutting themes. Therefore, please feel free to assess the level of contribution using a dash (-) for all or any themes that were not part of the project design.
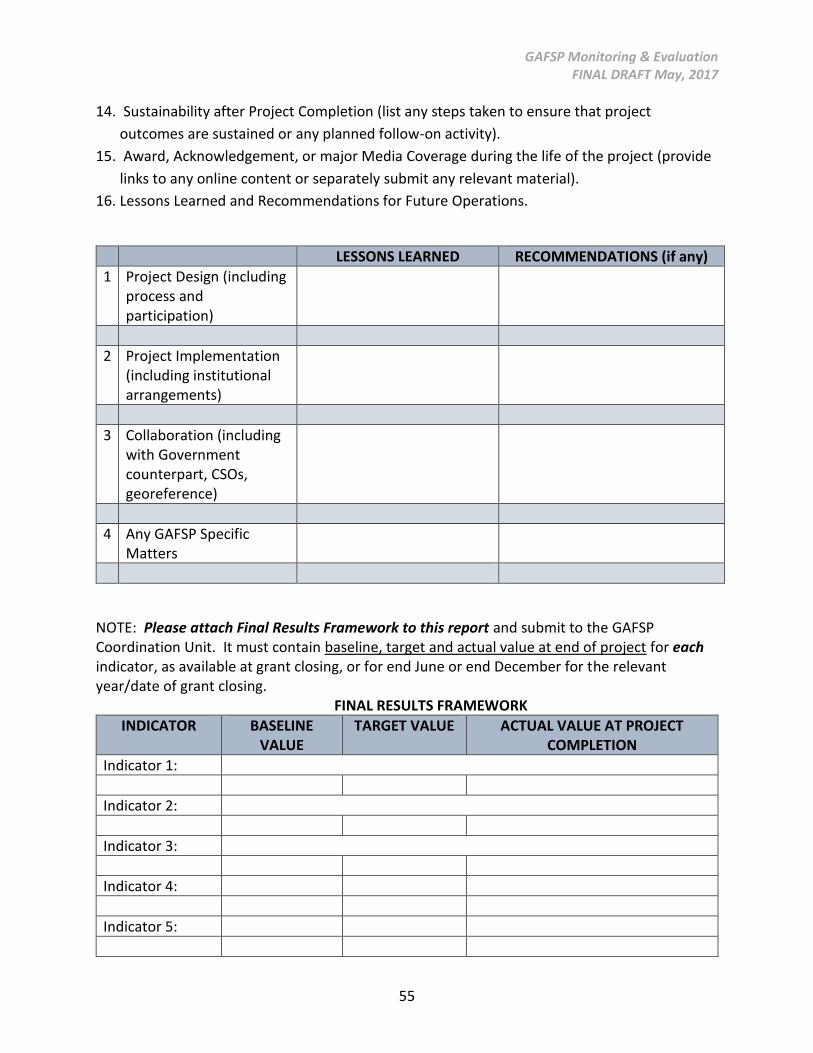
GAFSP Monitoring & Evaluation FINAL DRAFT May, 2017
55
14. Sustainability after Project Completion (list any steps taken to ensure that project
outcomes are sustained or any planned follow-on activity).
15. Award, Acknowledgement, or major Media Coverage during the life of the project (provide
links to any online content or separately submit any relevant material).
16. Lessons Learned and Recommendations for Future Operations.
LESSONS LEARNED RECOMMENDATIONS (if any)
1 Project Design (including process and participation)
2 Project Implementation (including institutional arrangements)
3 Collaboration (including with Government counterpart, CSOs, georeference)
4 Any GAFSP Specific Matters
NOTE: Please attach Final Results Framework to this report and submit to the GAFSP Coordination Unit. It must contain baseline, target and actual value at end of project for each indicator, as available at grant closing, or for end June or end December for the relevant year/date of grant closing.
FINAL RESULTS FRAMEWORK
INDICATOR BASELINE VALUE
TARGET VALUE ACTUAL VALUE AT PROJECT COMPLETION
Indicator 1:
Indicator 2:
Indicator 3:
Indicator 4:
Indicator 5:
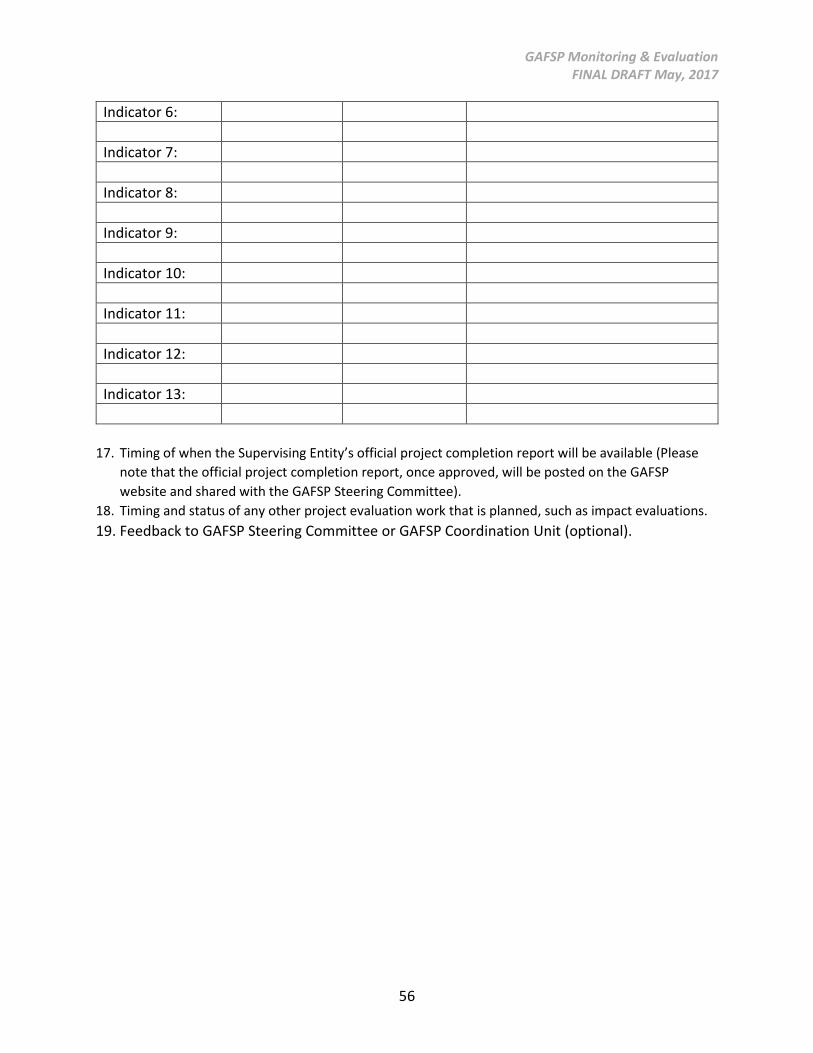
GAFSP Monitoring & Evaluation FINAL DRAFT May, 2017
56
Indicator 6:
Indicator 7:
Indicator 8:
Indicator 9:
Indicator 10:
Indicator 11:
Indicator 12:
Indicator 13:
17. Timing of when the Supervising Entity’s official project completion report will be available (Please
note that the official project completion report, once approved, will be posted on the GAFSP
website and shared with the GAFSP Steering Committee).
18. Timing and status of any other project evaluation work that is planned, such as impact evaluations.
19. Feedback to GAFSP Steering Committee or GAFSP Coordination Unit (optional).
GAFSP Monitoring & Evaluation FINAL DRAFT May, 2017
57
ANNEX 6: Project Completion Report – GAFSP template (Technical
Assistance projects)
GAFSP Transfer Agreements between the Trustee and each Supervising Entity require that the
Supervising Entity submit to the GAFSP Coordination Unit a Final Report for each project no
later than six months after the closing date (or cancellation of the project). Given GAFSP’s policy
on utilizing Supervising Entity’s existing policies, a Supervising Entity’s official Project Completion
Report will count towards this “final report” requirement. In the case where the Supervising
Entity does not have an official Project Completion report-type document – such as with
Technical Assistance projects – then projects are requested to complete this template.
The main purpose of this document is to provide a summary of: (a) how GAFSP funds were spent;
(b) what outcomes resulted; (c) whether intended targets were met; (d) what changes were
made from the original project design; (e) how the Technical Assistance projects collaborated
with the associated investment projects; and, (f) key lessons learned. This document will be
shared with the GAFSP Steering Committee as well as made public through the GAFSP website
(www.gafspfund.org).
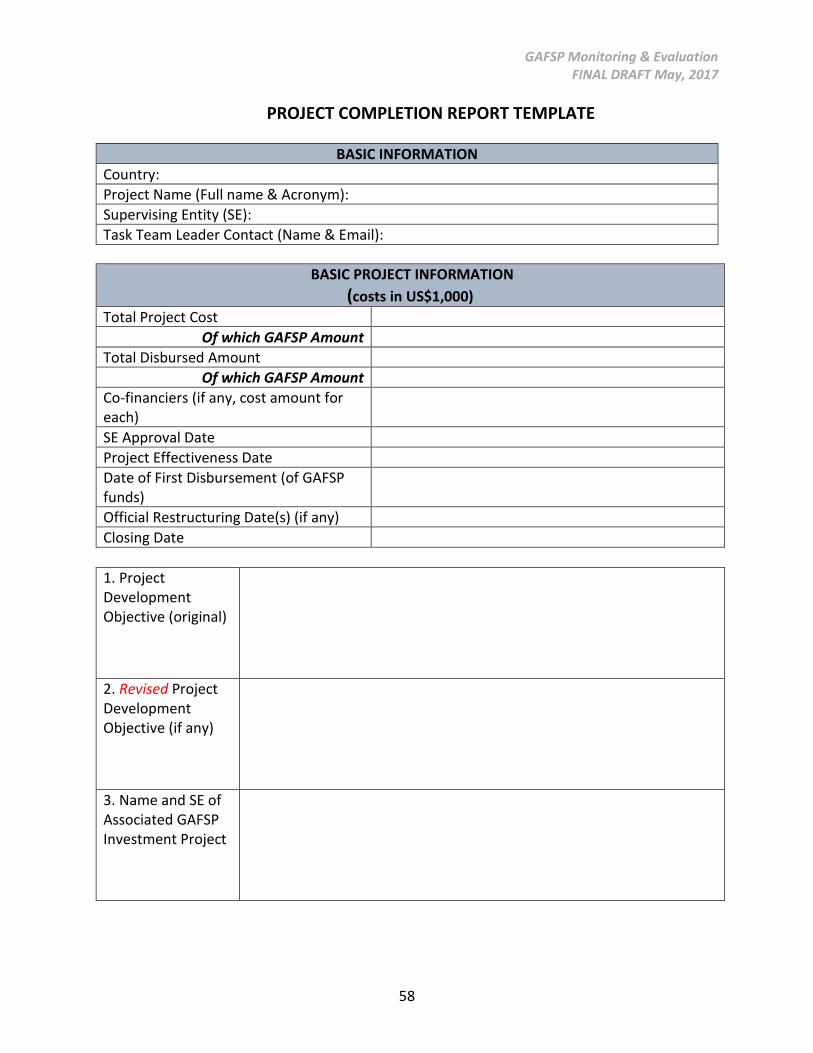
GAFSP Monitoring & Evaluation FINAL DRAFT May, 2017
58
PROJECT COMPLETION REPORT TEMPLATE
BASIC INFORMATION
Country:
Project Name (Full name & Acronym):
Supervising Entity (SE):
Task Team Leader Contact (Name & Email):
BASIC PROJECT INFORMATION
(costs in US$1,000)
Total Project Cost
Of which GAFSP Amount
Total Disbursed Amount
Of which GAFSP Amount
Co-financiers (if any, cost amount for each)
SE Approval Date
Project Effectiveness Date
Date of First Disbursement (of GAFSP funds)
Official Restructuring Date(s) (if any)
Closing Date
1. Project Development Objective (original)
2. Revised Project Development Objective (if any)
3. Name and SE of Associated GAFSP Investment Project
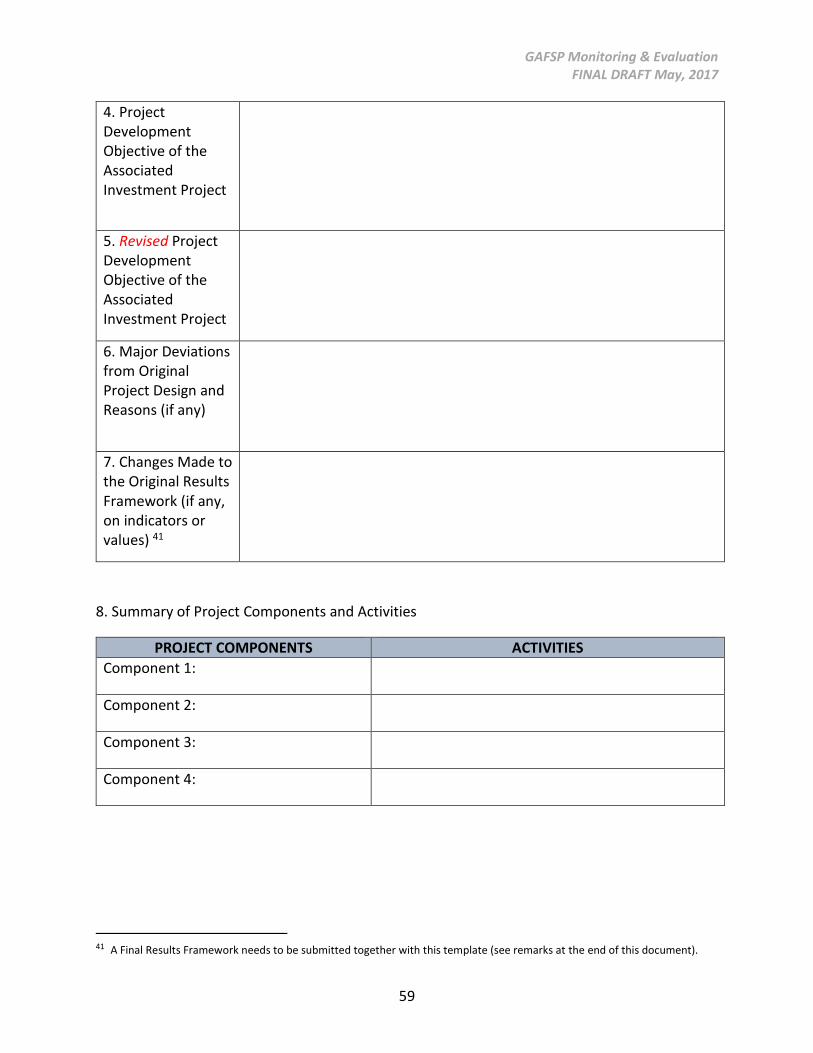
GAFSP Monitoring & Evaluation FINAL DRAFT May, 2017
59
4. Project Development Objective of the Associated Investment Project
5. Revised Project Development Objective of the Associated Investment Project
6. Major Deviations from Original Project Design and Reasons (if any)
7. Changes Made to the Original Results Framework (if any, on indicators or values) 41
8. Summary of Project Components and Activities
PROJECT COMPONENTS ACTIVITIES
Component 1:
Component 2:
Component 3:
Component 4:
41 A Final Results Framework needs to be submitted together with this template (see remarks at the end of this document).
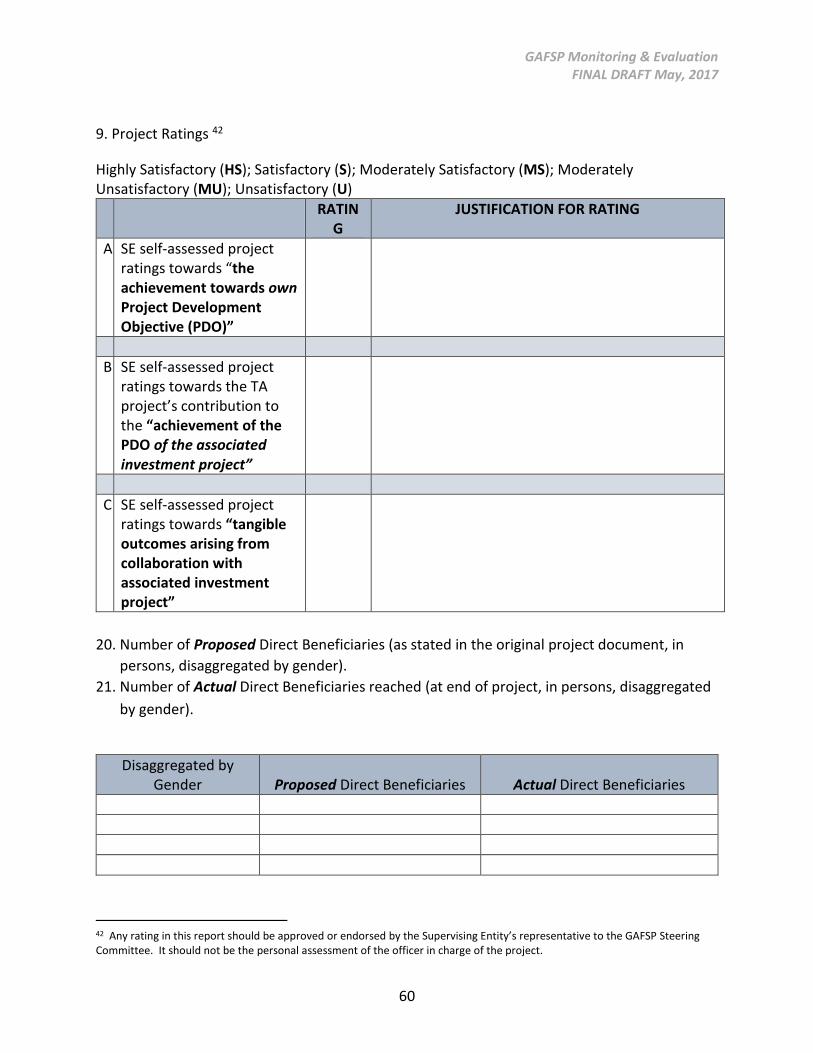
GAFSP Monitoring & Evaluation FINAL DRAFT May, 2017
60
9. Project Ratings 42
Highly Satisfactory (HS); Satisfactory (S); Moderately Satisfactory (MS); Moderately Unsatisfactory (MU); Unsatisfactory (U)
RATING
JUSTIFICATION FOR RATING
A SE self-assessed project ratings towards “the achievement towards own Project Development Objective (PDO)”
B SE self-assessed project ratings towards the TA project’s contribution to the “achievement of the PDO of the associated investment project”
C SE self-assessed project ratings towards “tangible outcomes arising from collaboration with associated investment project”
20. Number of Proposed Direct Beneficiaries (as stated in the original project document, in
persons, disaggregated by gender).
21. Number of Actual Direct Beneficiaries reached (at end of project, in persons, disaggregated
by gender).
Disaggregated by Gender
Proposed Direct Beneficiaries
Actual Direct Beneficiaries
42 Any rating in this report should be approved or endorsed by the Supervising Entity’s representative to the GAFSP Steering Committee. It should not be the personal assessment of the officer in charge of the project.

GAFSP Monitoring & Evaluation FINAL DRAFT May, 2017
61
22. Contribution to Crosscutting Themes.43 Assess Level of Contribution to each of the themes
using the following symbols:
- = none planned * = planned but did not achieve planned contribution ** = planned contribution achieved *** = exceeded planned expectations
CONTRIBUTION (-,*, **, ***)
BRIEF EXPLANATION
Climate Smart Agriculture
Nutrition
Gender
Job Creation
23. Obstacles or Challenges faced by the Project (this could be operational, political, or other).
24. Sustainability after Project Completion (list any steps taken to ensure that project
outcomes are sustained or any planned follow-on activity).
25. Award, Acknowledgement, or major Media Coverage during the life of the project (provide
links to any online content or separately submit any relevant material).
26. Lessons Learned and Recommendations for Future Operations.
LESSONS LEARNED RECOMMENDATIONS (if any)
1 Project Design (including process and participation)
2 Project Implementation (including institutional arrangements)
3 Collaboration (including with Government counterpart, SE of
43 It is fully acknowledged that not all GAFSP projects were designed to contribute to these crosscutting themes. Therefore, please feel free to assess the level of contribution using a dash (-) for all or any themes that were not part of the project design.

GAFSP Monitoring & Evaluation FINAL DRAFT May, 2017
62
associated investment project, CSOs)
4 Any GAFSP Specific Matters
NOTE: Please attach Final Results Framework to this report and submit to the GAFSP Coordination Unit. It must contain baseline, target and actual value at end of project for each indicator.
FINAL RESULTS FRAMEWORK
INDICATOR BASELINE VALUE
TARGET VALUE ACTUAL VALUE AT PROJECT COMPLETION
Indicator 1:
Indicator 2:
Indicator 3:
27. Feedback to GAFSP Steering Committee or GAFSP Coordination Unit (optional).