การวิเคราะห์รูปแบบการใช้ที่ดินโดยการจาแนกประเภทข้อมูลภาพ ... · classifier

Data Min Knowl Disc (2014) 28:670–701DOI 10.1007/s10618-013-0316-z
GA-TVRC-Het: genetic algorithm enhanced timevarying relational classifier for evolvingheterogeneous networks
Ismail Günes · Zehra Çataltepe ·Sule Gündüz-Ögüdücü
Received: 29 June 2012 / Accepted: 4 April 2013 / Published online: 18 April 2013© The Author(s) 2013
Abstract Evolving heterogeneous networks, which contain different types of nodesand links that change over time, appear in many domains including protein–proteininteractions, scientific collaborations, telecommunications. In this paper, we aim to dis-cover temporal information from a heterogenous evolving network in order to improvenode classification. We propose a framework, Genetic Algorithm enhanced Time Vary-ing Relational Classifier for evolving Heterogeneous Networks (GA-TVRC-Het), toextract the effects of different relationship types in different time periods in the past.These effects are discovered adaptively by utilizing genetic algorithms. A relationalclassifier is extended as the classification method in order to be able to work with dif-ferent types of nodes. The proposed framework is tested on two real world data sets.It is shown that using the optimal time effect improves the classification performanceto a large extent. It is observed that the optimal time effect does not necessarily followa certain functional trend, for example linear or exponential decay in time. Anotherobservation is that the optimal time effect may be different for each type of interaction.Both observations reveal the reason why GA-TVRC-Het outperforms methods thatrely on a predefined form of time effect or the same time effect for each link type.
Responsible editor: Eamonn Keogh.
I. Günes (B) · Z. Çataltepe · S. Gündüz-ÖgüdücüComputer Engineering Department, Istanbul Technical University, Istanbul, Turkeye-mail: [email protected]
Z. Çataltepee-mail: [email protected]
S. Gündüz-Ögüdücüe-mail: [email protected]
123

GA-TVRC-Het: genetic algorithm enhanced time 671
Keywords Network data · Heterogeneous networks · Evolving networks · Socialnetworks · Node classification · Relational Bayesian classifier · Genetic algorithms ·Evolutionary strategies
1 Introduction
We produce and depend on networks of people and entities that contain an enormousnumber of nodes and relations. Examples include world wide web network (Albert etal. 1999), biological networks (Scala et al. 2001), movie-actor networks (Watts andStrogatz 1998) and scientific collaboration networks (Newman 2001). Such real worldnetworks often have complex structures with interacting multi-type components andthese interactions and components may change over time. The evolution in the networkmay be through the addition or removal of a node or a link or changes of the nodeattributes. For example, change of shared activities, interests, affiliations, similaritiesmay affect the links between people in a social networking site.
Node classification is one of the important problems on network data. While onecan use only the current network data for classification, the past may include criticalinformation and it may also influence the classification results. Relations betweennodes and the evolution of these relations can be taken into account for classificationon an evolving network. When the network is heterogeneous containing different typesof nodes and links, the evolution of the network may need to be considered separatelyfor each node and link type.
Consider a citation network consisting of different types of nodes, namely, papers,the papers cited by them, the authors of the papers, the journals in which the papers arepublished together with the dates of publication. In this heterogeneous network thereare different types of nodes and links. The number of links of a certain type to a nodemay be different for each node, for example, a paper may have different numbers ofauthors and references. Consider the classification of papers according to their subjectareas, such as “neural networks”, “genetic algorithms”, etc. In order to determine theclass of a paper, a number of different methodologies could be used:
1. Using only the attributes and classes of the papers referenced by the paper as inputs(Fortuna et al. 2007; Macskassy and Provost 2007) (homogeneous classification).
2. Using the attributes and classes of (i) all papers referenced by the paper, (ii) authorof the paper and all other papers by the authors of the paper (iii) journal of the paperand all other papers in the journal as inputs (Neville et al. 2003) (heterogeneousclassification). This methodology gives equal weight to old and new papers.
3a. Using the attributes and classes of (i) papers referenced by the paper, (ii) author ofthe paper and other papers by the authors of the paper (iii) journal of the paper andother papers in the journal as inputs, modeling the time effect by giving weights toinputs depending on their occurrence time (Sharan and Neville 2008). For example,old inputs could be given exponentially or linearly decreasing weights accordingto some predetermined decay factor (evolving heterogeneous classification withhomogeneous weights).
123

672 I. Günes et al.
Fig. 1 Node classification example
3b. Using the attributes and classes of (i) papers referenced by the paper, (ii) author ofthe paper and all other papers by the authors of the paper (iii) journal of the paperand other papers in the journal as inputs, determining weights for occurrence timeof links based on the data and using an adaptive learning technique which is calledGenetic Algorithm enhanced Time Varying Relational Classifier (GA-TVRC) andour previous work (Günes et al. 2011) (evolving heterogeneous classification withdynamic weights). This methodology gives equal weight to different link typesoccurring at the same time period.
3c. Using the attributes and classes of (i) papers referenced by the paper, (ii) authorsof the paper and other papers by the authors of the paper (iii) journal of the paperand other papers in the journal as inputs, determining weights for each link typeand occurrence time based on the data and using an adaptive learning technique,which is the method used in this paper.
Figure 1 gives an example network for classification of the subject area of a paperand the output produced after applying one of the methodologies mentioned above.In the figure, the inputs that can be used for classification are shown on the left.They include related nodes of different types of paper, author, journal and interactionsamong these nodes. Each methodology given above would use a different subset ofinputs. On the right part of the figure, the classification output, the subject area of thegiven node, is shown.
If there is no time dependency in the network, using only homogeneous classifica-tion could give acceptable results. On the other hand, there are problems that couldbenefit from adaptive weights for both time and link type. For example, for the nodeclassification problem in a citation network, the effect of classes of past papers writtenby the author may increase by time and it has a sharper decay in time than the effect
123

GA-TVRC-Het: genetic algorithm enhanced time 673
of classes of past papers published in the journal. Because, although both journals andauthors may choose to publish in different areas, the change is probably much slowerin time for the journal than the authors.
In this paper we focus on solving the node classification problem using the method-ology introduced in (3c) above. We propose a novel framework, Genetic Algorithmenhanced Time Varying Relational Classifier for evolving Heterogeneous Networks(GA-TVRC-Het), to classify a new node in a heterogeneous network by effectivelyusing nodes connected to the node and the connections from the past. A genetic algo-rithm based method is used to learn the optimal time effects of the past connections.Interactions which occurred in different time periods may affect the classification ofa node differently and it may be hard to fit a mathematical equation for this effect.Genetic algorithms (GAs) may be used for better discovery of the actual time effects.In order to utilize the time information, a relational classifier is extended. The pro-posed framework is compared with similar methods in the literature. The results ofvarious tests on real world data sets show that, in terms of classification accuracy, theframework is superior to other methods which do not utilize the time information orutilize it in a constant or predetermined way. The framework enables incorporation oftime information without the need to predetermine a functional form or parameters.The self adaptive learning of this time effect without an assumption is the biggestadvantage of our framework.
The rest of the paper is organized as follows: In Sect. 2, we discuss the existingwork on evolving networks and classification in an evolving network. Then, we presentthe necessary background information for our proposed framework in Sect. 3. Formalspecification and detailed description of the framework is given in Sect. 4. The exper-imental results are presented in Sect. 5. Finally we discuss the findings, future workand conclude the paper in Sect. 6.
2 Related work
In this paper, node classification on evolving heterogeneous network data will beperformed by means of adaptively determining the contribution of past network datausing GAs. This section includes related work on evolving networks, machine learningapplications on evolving networks and use of GAs on network data.
Real world networks evolve over time and many studies have been performed tounderstand the growth and dynamics of evolving networks. First, the network growthis modeled by adding new nodes to the network (Barabasi and Albert 1999). Theaddition of a new node is explained by preferential attachment mechanism whichassumes that the probability of connecting to a node depends on the node’s degree.A node with higher degree value is more likely to get more new connections. Thiswell-known principle is then extended by an evolving network model (Li and Chen2003). This network model is based on local-world connectivity such that a new nodemay only be connected to a subset of existing nodes. Although the connection stillfollows preferential attachment, the node to be connected is chosen among a localset as it is in many real world networks. The degree distribution of the network maybe either power-law or exponential, based on parameters such as the selected neigh-
123
674 I. Günes et al.
borhood size. The network growth is also predicted by considering network structure(Kumar et al. 2006). The nodes of a network are classified into some segments and theproperties of each segment is observed. Based on these observations, a biased prefer-ential attachment is proposed in order to simulate addition of new nodes. The networkevolution is examined for many different type of networks, for example, scientificcolaboration network (Barabasi et al. 2002), Internet (Pastor-Satorras et al. 2001) andprotein network (Sole et al. 2002). Several topological quantities characterizing thenetwork and their evolution are investigated by means of empirical measurements.These quantities include average degree, degree distribution, clustering coefficient,size of largest cluster and node selection strategy. The network growth models basedon these measurements are also proposed.
There are a number of other studies which make use of the information about thechange in the network over time for a specific purpose. For example, in link prediction,new interactions among the nodes are predicted by analyzing the past interactions.Markov models are used on temporal data to predict links for purposes such as assistinguser navigation on a website (Zhu et al. 2002). The pages on a website are clusteredaccording to the similarities of their hyperlinks and these clustering results are used toform a conceptual hierarchy of pages. Then, in order to suggest new nodes, a Markovmodel based method is applied on this hierarchy. Extension of a time-agnostic linkprediction method to use time information as edge weights is another method oftime-aware link prediction (Tylenda et al. 2009). Lagrange Multipliers are utilized tooptimize the maximum entropy and old interactions are penalized since they couldbe less relevant for link prediction. Another work on time-aware link prediction aimsto overcome the difficulty of representing temporal data (Acar et al. 2009). The timeeffect is considered by using third order tensor structure which includes the timeinformation as the third dimension instad of collapsing the data. The tensor model isutilized in order to reveal temporal patterns.
The evolution of a network may be used to improve clustering in the network. Bothclustering and cluster update problems on temporal network data can be solved byutilizing past interactions (Gaertler et al. 2006). In order to update the cluster structureafter a minor change, a measure which maximizes the cluster quality and minimizes thedifference between consecutive cluster structures is optimized. A novel concept time-expanded graph is used for clustering nodes in a time-varying network. Both currentand past connections are represented in this graph where clustering is performed. Thiswork is extended by addition of new metrics (Chakrabarti et al. 2006). The incrementalquality of a clustering is computed and some traditional clustering algorithms areextended to work with evolving networks. Another approach on evolving networkclustering is the analysis of evolution of two different networks and checking somegeneral assumptions on evolving clusters (Palla et al. 2007). These assumptions includethe positive correlation between the ages and sizes of clusters. It is also claimed thatmemberships change more frequently in big clusters and the lifetime of a clusterdepends on these frequent changes. It is concluded that, each cluster may predict itsown future. Clustering is also utilized on evolving mobile networks (Chan et al. 2009).A history accumulator is stored for each connection and k-clique structures are usedas clusters. The effect of past interactions on clustering is adjusted by changing theparameters of the history accumulator.
123

GA-TVRC-Het: genetic algorithm enhanced time 675
Classification of a node is also a well studied research area for both the homogeneousnetworks (Sen et al. 2008; Zheleva and Getoor 2009) and the heterogenous networks(Macskassy and Provost 2007; Neville et al. 2003). However, there are only a smallnumber of studies which utilize the past data for node classification. Random walkingagents are employed for classifying nodes in evolving homogeneous networks usingMarkov chains (Callut et al. 2008) or network content (Aggarwal and Li 2011). In orderto classify nodes in an evolving heterogenous network with different types of nodesand relations, time information is included by extending the relational classifiers, suchas relational Bayes classifier or relational probability tree (Sharan and Neville 2007,2008). The relational probability tree is also extended to use both spatial and temporaldata (McGovern et al. 2008). Both types of data are used as relational attributes andclass probabilities are computed in leaf nodes of the tree. In addition to these relationalclassifiers, a framework is also proposed in order to find the most optimal temporal–relational representation (Rossi and Neville 2011). Several temporal–relational rep-resentations are discovered instead of focusing on only one specific temporal pattern.The selections of time-varying relational components, temporal granularity, tem-poral influence and weighted relational classifiers are included in this framework.Although past interactions among different types of nodes are utilized for classi-fication, all of these studies fit the time effect using some pre-defined equationswhose parameters are determined beforehand. The time effect in a heterogeneousnetwork has also been learned adaptively, using a genetic algorithm based methodin (Günes et al. 2011). The effects of each time period are learned and used by thismethod.
GAs have been widely employed for network analysis. The majority of these worksaim to detect densely connected groups in a social network (Freeman 1993; Pizzuti2008; Lipczak and Milios 2009). The genetic algorithm is used to optimize a pre-defined quantity such as node centrality or similarity. Detection of communicationpatterns on social networks is another application example of genetic algorithms (Wil-son and Banzhaf 2009). Some important interactions among the nodes of a networkare discovered to reveal organizations. Formation of these interactions have also beenestimated using genetic algorithms to recommend possible friends in a social network(Naruchitparames et al. 2011).
In this paper, we propose a novel genetic algorithm based framework for nodeclassification on an evolving heterogeneous network. Although we previously uti-lized GAs for node classification in heterogeneous evolving networks in GA-TVRC(Günes et al. 2011), there we assumed that each link type evolved the same wayin time. In this study, we extend our previous work in several directions. First ofall, our new framework adaptively learns the time effect separately for each differ-ent type of past interaction, which increases the classification performance. In thispaper, we also perform tests to compare performance of different methods whenthere is link noise and show that GA-TVRC-Het is more robust than GA-TVRC.The time and space complexity analysis of our algorithm is performed. We also ana-lyze the effect of using different combinations of link types, as opposed to using allof them.
123

676 I. Günes et al.
3 Background
In this section, we provide the necessary background information for our frameworkGA-TVRC-Het. In Sect. 3.1 we formulate the problem of node classification in anevolving heterogeneous network. Section 3.2 introduces the Relational Bayes Classi-fier (RBC) which is extended in this paper to be used in an evolving heterogeneousnetwork for node classification. Section 3.3 provides a general overview on the geneticalgorithm used for learning the time effect.
3.1 Problem definition
A network can be represented as a graph G = (V, E), with a set of nodes V and a setof edges E . For heterogeneous networks, nodes can be of different types, thereforeV = ⋃M
m=1 Vm , where each node set Vm consists of nodes of the same type m, forexample, journal, paper or author in a citation network. Each vertex of type m has
a set of attributes Xm ={
X1m, . . . , X Nxm
m
}, where Nxm is the number of attributes
for a vertex of type m. For example, a journal may have attributes such as name,country and publisher. Each vertex of type m has also a class label from the set of
class labels for that node type, Cm ={
C1m, . . . , C Ncm
m
}, where Ncm is the number of
class labels for a vertex of type m. For example, for a vertex of type paper, the classlabels could be the area of the paper such as Neural Networks and Databases. EdgesE of a heterogenous network can be of different types. E = ⋃K
k=1 Ek where eachedge set Ek consists of edges of the same type, for example, citation relation betweentwo papers or authorship relation between a paper and an author.
An evolving network can be represented as GT = (VT , ET ), where VT =⋃Tt=1 V t
and V t is the set of nodes that occurred within a time period t , for example paperspublished in a certain year, authors and journals of these papers. ET = ⋃T
t=1 Et ,where Et is the set of (undirected and unweighted) edges between nodes that occurredin time period t and nodes that occurred in time period t or before, i.e. Et = {{u, v} :u ∈ V t , v ∈ V t ′, t ′ ≤ t}.
Given an evolving heterogeneous network GT = (VT , ET ), we formulate the nodeclassification problem as follows: Estimate the node labels for nodes in V T , giventhe attributes of nodes in
⋃Tt=1 V t , the class labels for nodes in
⋃T−1t=1 V t and all of
the edges ET . Types of changes which are considered in this work are the addition orremoval of a node or an edge. However, attributes of a node are assumed not to bechanged in time.
3.2 Relational Bayes classifier
A good solution for the node classification problem in an evolving heterogeneousnetwork needs to be able to use all the information available, including the attributesof the node to be classified and the available information about the related nodes.Relational Bayes classifiers (RBCs) are a certain type of relational classifier (Setnesand Babuska 1999; Macskassy and Provost 2003) that extend the Naive Bayes classifier
123

GA-TVRC-Het: genetic algorithm enhanced time 677
by taking into consideration the attributes of the related nodes in addition to the nodeattributes.
Given a node u of type m, u ∈ V T , whose label needs to be estimated, we denote
the attributes of u as Xm(u) ={
X1m(u), . . . , X Nxm (u)
m
}∈ Xm . We define the set of
related nodes of node u as:
R(u) = {v : e = {u, v} ∈ ET ∨ f = {u, x} ∈ ET ∧ g = {x, v} ∈ ET }
(1)
The related nodes R(u) should be reachable from node u via at most two nodes.Each v ∈ R(u) may be of different types and have a set of attributes of different types.Also, there may be a different number of related nodes of a certain type, for example,the paper may be cited by ten or 100 different papers and may be written by oneor five different authors. Therefore RBC needs an estimation method to effectivelyuse that information. Among the different estimation methods, INDEPVAL, whichassumes that each attribute value is independently drawn from the same distribution,was found to perform better (Neville et al. 2003; Atak and Ögüdücü 2010). In this paperwe use the RBC classifier based on INDEPVAL estimation method which estimatesthe probability of each class C ∈ Cm given the node attributes Xm(u) and relatednodes R(u) as follows:
P(C |Xm(u), R(u)) ∝∏
X jm∈Xm (u)
P(X jm(u)|C) ·
∏
v∈R(u)
∏
Xkm′ ∈Xm′ (v)
P(Xk
m′(v)|C) · P(C) (2)
In this equation, each related node v ∈ R(u) may have a different type m′ andtherefore different attributes Xk
m′(v).The RBC framework has been extended to include the time information on each
node. The resulting framework is called the Time Varying-RBC (TV-RBC) (Sharanand Neville 2007). TV-RBC estimates the class labels by including the occurrancetime of edges as follows:
P(C |Xm(u), R(u)) ∝∏
X jm∈Xm (u)
P(X jm(u)|C) ·
∏
v∈R(u)
∏
Xkm′ ∈Xm′ (v)
wt (v) P(Xkm′(v)|C) · P(C) (3)
where, t (v) ∈ {1, . . . , T } denotes the occurrance time of a related node v. The valueof the weight wt (v) is determined based on the occurrance time t (v) of the relatednode v ∈ R(u). An exponentially decaying function in time was used for wt (v) and itwas shown to perform better than other methods in (Sharan and Neville 2008). In thispaper, we extend the TV-RBC so that the weight values are determined adaptively foreach link type using a genetic algorithm.
123

678 I. Günes et al.
3.3 Genetic algorithm
GAs (Holland 1975) have commonly been used for difficult optimization problems,where methods like gradient descent are not applicable due to the nature of the criterionto be optimized. GAs were successfully applied for solution of community detection(Pizzuti 2008), classification (Rokach 2008), feature selection (Tan et al. 2008) andeven job-shop scheduling (Pezzella et al. 2008)
A GA tries to mimic evolution of the fittest individual, using chromosomes torepresent an individual and genes to represent traits of an individual. For any opti-mization problem, representation of an individual solution as a chromosome as wellas evaluating the fitness of that solution are crucial decisions.
The flow of a genetic algorithm is shown in Algorithm 1. The algorithm startsby initializing a population of individuals with random genes. Each individual in thepopulation represents a possible solution for the problem. At each iteration, called ageneration, the fitness value of each individual is calculated and a series of operatorssuch as selection and reproduction (includes crossover and mutation) are applied togenerate a new population of solutions. Usually, the algorithm terminates when atermination condition, such as a maximum number of iterations of the main loop, issatisfied.
The GA turns a population of individuals, each of which is associated with a fitnessvalue into a new generation. The reproduction and survival of the fittest individualprincipals which are inspired by nature follow this transformation. The diversity ofindividuals is ensured by genetic operations mutation and cross-over.
Algorithm 1 Genetic Algorithm FlowInitializePopulation()maxFitness← 0for individualNumber < POPULATIONSIZE do
fitness← EvaluateFitness(individual)if fitness > maxFitness then
maxFitness← fitnessfittestSolution← individual
end ifend forwhile generationNumber < MAXGENERATIONS do
offsprings← CrossOver(parents)offsprings←Mutation(offsprings)fitness← EvaluateFitness(offsprings)if fitness > maxFitness then
maxFitness← fitnessfittestSolution← offspring
elseoffsprings← Reproduce(offsprings)
end ifend while
The main controlling parameters of a GA are the population size in a generation andthe maximum number of generations. These parameters determine the complexity and
123
GA-TVRC-Het: genetic algorithm enhanced time 679
performance of the method and should be selected carefully. In addition, the choiceof a representation scheme is important in the design of a GA which affects the lengthof individuals and alphabet size. Mostly, the alphabet which is used to encode thechromosome’s genes, is binary and each gene of an individual is 0 or 1. However, inour case, a binary alphabet is not appropriate since the effect of each interaction timeneeds to be encoded using a set of real numbers. These types of problems are solvedusing Evolutionary Strategies (Rechenberg 1973) which are special subtypes of GAsbased on adaptation and evolution.
4 Method
In this paper, we propose GA-TVRC-Het, a framework that optimally uses the timeinformation on the past interactions for node classification in an evolving heteroge-neous network. In this section, we give the details of our approach and the phases ofour framework.
The RBC is chosen as the classifier in the proposed framework. By means of arelational classifier, we are able to use several different types of nodes and interactionsbetween them. While the RBC treats all past interactions equally, in GA-TVRC-Hetwe let each past interaction between different types of nodes to be treated differently,so that the classification results of the current nodes are improved. The GA is used tolearn the optimal time effects of the past interactions.
The overview our framework GA-TVRC-Het is shown in Fig. 2. The data set whichis a heterogeneous network is divided into three sets, namely training, validation andtest sets, each of which is represented by subgraphs. The subgraph representation isused in order to utilize the time information for classification. A subgraph includesnot only the node to be classified but also other related nodes (Eq. 1) which haveinteracted with that node at least once before a given time. The proposed frameworkis composed of three main phases.
In the training phase, the computation of the conditional probabilities to be usedin the RBC is performed on the training set. In the validation phase, the GA is usedto optimize the time effect of past interactions. In the last step, the test phase, theclass labels of the nodes in the test set are estimated via considering the conditionalprobabilities and optimal time effects. The classification accuracy is evaluated on thetest set.
4.1 Training phase
The subgraphs with different types of nodes and links representing past interactionsare inputs to the training phase. This phase is composed of calculating the class priors(P(C) for class C in Eq. 2) and conditional probabilities (P(X j
m(u)|C) for nodes uin training data of type m and attribute index j in Eq. 2) used in RBC.
Example 1 Let the node to be classified be Paper1 in Fig. 1. The probabilities ofclass labels and the conditional probabilities of attributes of the related nodes in the
123

680 I. Günes et al.
Fig. 2 The phases of the GA-TVRC-Het
Table 1 The probabilities and values computed in Training
Probabilities Values
P(C = Biology) 3/8
P(Subject = Proteins|C = Biology) 2/3
P(Subject = Cells|C = Biology) 1/3
P(Subject = Genes|C = Biology) 0/3
P(Subject = Moment |C = Biology) 0/3
P(Subject = Sets|C = Biology) 0/3
P(Subject = Molecules|C = Biology) 0/3
P(Subject = Numbers|C = Biology) 0/3
P(Pages = 6|C = Biology) 0/3
P(Pages = 12|C = Biology) 0/3
P(Pages = 16|C = Biology) 1/3
P(Pages = 18|C = Biology) 2/3
P(Domain = phy.edu|C = Biology) 0/2
P(Domain = bio.edu|C = Biology) 2/2
P(K eyword = Molecules|C = Biology) 1/1
P(Class = B|C = Biology) 1/1
sample network are calculated to classify Paper1. These probabilities are given inTable 1.
RBC (Eq. 2) or TV-RBC (Eq. 3) can classify the node Paper1 in the sample network(Fig. 1) by using the conditional probabilities in Table 1 (and predetermined weightsfor the time effects wt (v) in the case of TV-RBC). However, in our framework, theweights of the time effect are further optimized in the validation phase via GA toimprove the classification accuracy.
4.2 Validation phase
Influences of past interactions on node classification are adaptively determined inthe validation phase. We extend the RBC (Neville et al. 2003) to be used with time
123

GA-TVRC-Het: genetic algorithm enhanced time 681
effects, but unlike TV-RBC (Sharan and Neville 2008) which uses a predeterminedkernel function, we optimize the time effect using evolutionary strategies.
We use the probabilities computed in the previous phase as inputs to determine theclass label of a new node in the validation phase. The nodes are classified accordingto:
P(C |Xm(u), R(u)) ∝∏
X jm∈Xm (u)
P(X jm(u)|C) ·
∏
v∈R(u)
∏
Xkm′ ∈Xm′ (v)
wt (v)l P
(Xk
m′(v)|C) · P(C) (4)
The weight values, wt (v)l (which replace wt (v) in Eq. 3) indicate the time effect of
the time period t in which the interaction of type l occurred. First, these effect valuesare set to random values at the beginning of validation phase. These values are adaptiveand learned using GA during this phase. The probabilities calculated in the trainingphase are used in Eq. 4 with the time effect values to determine the unknown classlabels of nodes in the validation set.
Two different approaches are employed to determine the time effect weights. In thefirst appraoch, the time effects are optimized based on the time period in which theinteractions are occurred without considering the type of the interactions. However,since different types of interactions may have different impacts on the classificationaccuracy in heterogeneous networks, the time effect of each interaction type is opti-mized separately as another approach. Based on the classification accuracy, the timeeffect values are evolved and optimized by a GA.
The main components of any GA are the method chosen to represent solutioncandidates, mutation, cross-over and the fitness evaluation method. These will beexplained in detail in the following subsections.
4.2.1 Representation
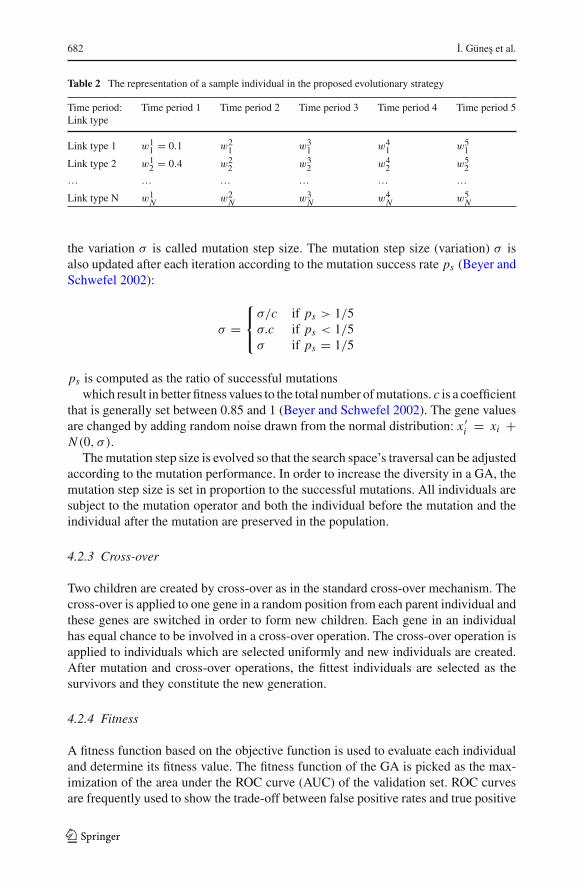
Each individual is represented by a matrix A of l rows where l is the number ofinteraction types. Each row consists of N genes, where N is the number of previoustime periods which are used to predict the class labels of nodes. Gene values vary in therange [0, 1] and the value of a gene denotes the time effect of the corresponding timeperiod for a given link type. An element, w
ji , in the matrix means that the interaction
type i has a weight w in time period j . Sample individuals for three types of interactionsand for five previous time periods may be seen in Table 2. In this representation, thisindividual denotes that the first interaction type that occurred in the first time periodhas a weight value of 0.1 where the second interaction type that occurred in the firsttime period has a weight value of 0.4.
4.2.2 Mutation
Mutation is performed by adding a random value to a gene of an individual. The geneis also chosen randomly among the genes in the matrix. The values to be added aredrawn from the normal distribution N (ξ, σ ) where the mean ξ is set to zero and
123
682 I. Günes et al.
Table 2 The representation of a sample individual in the proposed evolutionary strategy
Time period: Time period 1 Time period 2 Time period 3 Time period 4 Time period 5Link type
Link type 1 w11 = 0.1 w2
1 w31 w4
1 w51
Link type 2 w12 = 0.4 w2
2 w32 w4
2 w52
… … … … … …
Link type N w1N w2
N w3N w4
N w5N
the variation σ is called mutation step size. The mutation step size (variation) σ isalso updated after each iteration according to the mutation success rate ps (Beyer andSchwefel 2002):
σ =⎧⎨
⎩
σ/c if ps > 1/5σ.c if ps < 1/5σ if ps = 1/5
ps is computed as the ratio of successful mutationswhich result in better fitness values to the total number of mutations. c is a coefficient
that is generally set between 0.85 and 1 (Beyer and Schwefel 2002). The gene valuesare changed by adding random noise drawn from the normal distribution: x ′i = xi +N (0, σ ).
The mutation step size is evolved so that the search space’s traversal can be adjustedaccording to the mutation performance. In order to increase the diversity in a GA, themutation step size is set in proportion to the successful mutations. All individuals aresubject to the mutation operator and both the individual before the mutation and theindividual after the mutation are preserved in the population.
4.2.3 Cross-over
Two children are created by cross-over as in the standard cross-over mechanism. Thecross-over is applied to one gene in a random position from each parent individual andthese genes are switched in order to form new children. Each gene in an individualhas equal chance to be involved in a cross-over operation. The cross-over operation isapplied to individuals which are selected uniformly and new individuals are created.After mutation and cross-over operations, the fittest individuals are selected as thesurvivors and they constitute the new generation.
4.2.4 Fitness
A fitness function based on the objective function is used to evaluate each individualand determine its fitness value. The fitness function of the GA is picked as the max-imization of the area under the ROC curve (AUC) of the validation set. ROC curvesare frequently used to show the trade-off between false positive rates and true positive
123

GA-TVRC-Het: genetic algorithm enhanced time 683
rates. AUC is used as a summary statistics and it is formally proven that AUC is sta-tistically consistent and more discriminating than accuracy while evaluating learningalgorithms (Ling et al. 2003). The usage of AUC as a fitness function (Shao et al.2008; Segond et al. 2009; Weninger et al. 2009) provides an unbiased solution.
4.3 Test phase
The inputs of test phase are the time effect values computed in the validation phaseand the probabilites learned in the training phase. The inputs are used in Eq. 4 in orderto classify the nodes in the test set. The output of test phase is the AUC value afterclassification of the new nodes in the test set. After computing time effect values inthe validation phase, the values are used to classify further nodes and it is checkedwhether using the computed values improves the classification performance or not.The test phase involves the computation of conditional probabilities of belonging toeach class label for a node and comparison of them to determine true class label of thenode. Here, the time periods in which each past interaction occurred and their effectson the classification are also taken into account to compute the probabilities of classlabels.
5 Experimental results
The main goal of experiments are the comparison of our framework with differentmethods. The first method to be compared is the RBC and the second method is thetime varying relational Bayes classifier (TV-RBC) that simply utilizes the time infor-mation in relational classification. In addition to these methods, a new method randomtime varying relational classifier (R-TVRC) in which the effects of each time periodare set randomly is also evaluated. The aim of the tests with R-TVRC is measuringthe contributions of other methods when they are compared with using random timeeffect values. Finally, performance of our method is compared with genetic algo-rithm enhanced time-varying relational classifier (GA-TVRC) which we have pro-posed before to extract the time effect of links. GA-TVRC assumes that the linksof different types affect the classification performance equally. The contribution ofconsidering the effects of links of different types are demonstrated.
The methods are applied on two real-world data sets and structures of these data setsare given in the following subsection. Then, the test methodology including the usageof these data sets and determining the parameters of methods are given in details. Testresults using the methodology on given data sets are explained using various tablesand figures.
5.1 Data sets
Experiments are performed on high-energy physics literature (HEP-Th) data set andP2P file sharing (Can-o-sleep) data set. HEP-Th data set has widely been used in
123
684 I. Günes et al.
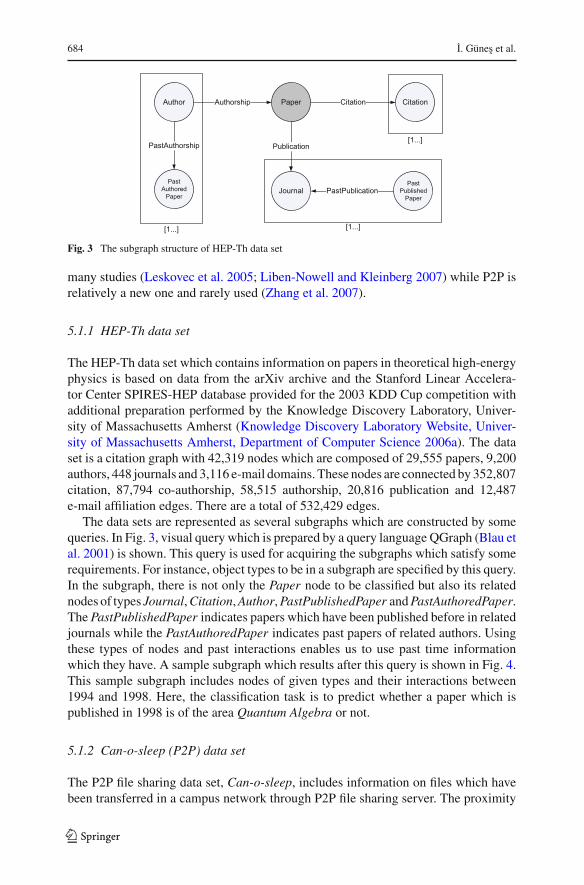
Fig. 3 The subgraph structure of HEP-Th data set
many studies (Leskovec et al. 2005; Liben-Nowell and Kleinberg 2007) while P2P isrelatively a new one and rarely used (Zhang et al. 2007).
5.1.1 HEP-Th data set
The HEP-Th data set which contains information on papers in theoretical high-energyphysics is based on data from the arXiv archive and the Stanford Linear Accelera-tor Center SPIRES-HEP database provided for the 2003 KDD Cup competition withadditional preparation performed by the Knowledge Discovery Laboratory, Univer-sity of Massachusetts Amherst (Knowledge Discovery Laboratory Website, Univer-sity of Massachusetts Amherst, Department of Computer Science 2006a). The dataset is a citation graph with 42,319 nodes which are composed of 29,555 papers, 9,200authors, 448 journals and 3,116 e-mail domains. These nodes are connected by 352,807citation, 87,794 co-authorship, 58,515 authorship, 20,816 publication and 12,487e-mail affiliation edges. There are a total of 532,429 edges.
The data sets are represented as several subgraphs which are constructed by somequeries. In Fig. 3, visual query which is prepared by a query language QGraph (Blau etal. 2001) is shown. This query is used for acquiring the subgraphs which satisfy somerequirements. For instance, object types to be in a subgraph are specified by this query.In the subgraph, there is not only the Paper node to be classified but also its relatednodes of types Journal, Citation, Author, PastPublishedPaper and PastAuthoredPaper.The PastPublishedPaper indicates papers which have been published before in relatedjournals while the PastAuthoredPaper indicates past papers of related authors. Usingthese types of nodes and past interactions enables us to use past time informationwhich they have. A sample subgraph which results after this query is shown in Fig. 4.This sample subgraph includes nodes of given types and their interactions between1994 and 1998. Here, the classification task is to predict whether a paper which ispublished in 1998 is of the area Quantum Algebra or not.
5.1.2 Can-o-sleep (P2P) data set
The P2P file sharing data set, Can-o-sleep, includes information on files which havebeen transferred in a campus network through P2P file sharing server. The proximity
123

GA-TVRC-Het: genetic algorithm enhanced time 685
Fig. 4 A sample subgraph from HEP-Th data set
Fig. 5 The subgraph structure of P2P data set
Can-o-sleep database is based on data collected by the Privacy, Internetworking, Secu-rity, and Mobile Systems Laboratory at the University of Massachusetts Amherst withadditional preparation by the Knowledge Discovery Laboratory, University of Massa-chusetts Amherst (Knowledge Discovery Laboratory Website, University of Massa-chusetts Amherst, Department of Computer Science 2006b). The data set containsmp3 files shared between users for 81 days in 2003. There are 563,409 nodes whichare composed of 291,925 files; 6,528 users; 221,152 transfers and 43,804 queries.There are more than six million edges of types ownership, transfer and query whichconnect these nodes.
In Fig. 5, visual query for P2P data set is shown. In addition to File node to beclassified there are also its related nodes of types Query, FileTransfer, User and Past-TransferredFile. The PastTransferredFile represents other files which have been trans-ferred in the past by related users. Here, the classification task is to predict whether afile will be transferred more than ten times a week or not.
123

686 I. Günes et al.
Fig. 6 The HEP-Th training, validation and test sets used in the experiments
Table 3 The sizes of HEP-Th training, validation and test sets in terms of number of subgraphs
Period Training set size Validation set size Test set size
1994–1999 3,495 840 886
1995–2000 4,220 864 1,031
1996–2001 4,638 999 1,133
5.2 Methodology
Training, validation and test sets are determined based on sliding windows in time.Time periods which include the training, validation and test sets for an experiment,are shifted in time to generate new training, validation and test sets. The HEP-Thdata set covers a period from 1994 to 2000. The sliding window approach used in ourexperiments is shown in Fig. 6. The relational bayes classifiers, RBC and TV-RBC,are trained on training data and then tested on the test data. The validation set is onlyused by GA-TVRC and GA-TVRC-Het in order to explore time effect values. Forexample, in Fig. 6 for the first time window, the conditional probabilites are estimatedusing 4 years of training data from 1994 to 1998. The papers published in 1998 withtheir current and past interactions are used as validation set for extracting the timeeffect of each year between 1994 and 1998. The time effect values which have beenlearned in this validaton phase are used to classify the test set including the paperspublished in 1999. The time periods in which we apply the validation phase for GA-TVRC and GA-TVRC-Het are added into training data for other methods. Table 3includes training, validation and test set sizes in terms of the number of subgraphs.
The P2P data set is also partitioned into training, validation and test sets usinga sliding window approach similar to HEP-Th data set. For this data set, training,validation and test set sizes consist of 4, 1 and 1 weeks of data respectively. Thenumber of subgraphs for each training, validation and test set is given in Table 4.
The performances of RBC, TV-RBC, R-TVRC, GA-TVRC and GA-TVRC-Het arecompared using AUC scores. All the methods are evaluated on the same test. RBC isused with the INDEPVAL estimator which assumes that each value is independentlydrawn from same distribution. It was experimentally shown that INDEPVAL estimatoroutperforms the others (Neville et al. 2003). Similarly, TV-RBC is also used withthe configuration that was found to give the best results. It was previously shown
123

GA-TVRC-Het: genetic algorithm enhanced time 687
Table 4 The sizes of P2P training, validation and test sets in terms of number of subgraphs
Period Training set size Validation set size Test set size
Week 1–week 6 1,587 952 1,085
Week 2–week 7 1,326 934 1,102
Week 3–week 8 1,435 1,013 1,816
that, among kernel functions which determine the effect of time periods, decayingkernels provide best results (Sharan and Neville 2008). The exponential kernel whichdecreases the time effect values exponentially was the best kernel function amongdecaying kernels. Thus, TV-RBC is used with exponential kernel in our experiments.
Genetic algorithm parameters which should be determined are the number of gen-erations, number of indiviuals in a generation, number of genes in an individual, ratioof cross-over operations and the coefficient that is used in mutation operations. Thegenetic algorithm is run for 50 generations and each generation includes 20 individ-uals. These values are chosen after observing that the algorithm converges to highestAUC values before 50 generations with less than 20 individuals. The number of genesin an individual is chosen as 5, ratio of cross-over operations is set as 0.3, ration ofmutation operations is set as 0.1 and the coefficient c that is used while determiningmutation step size is chosen as 0.9. All of these parameters are determined experimen-tally and we have seen that the results are not much sensitive to the values of theseparameters. Validation and test phases of GA-TVRC and GA-TVRC-Het are repeatedten times and the performances of GA-TVRC and GA-TVRC-Het are determinedby averaging the results of these runs. Similar with GA-TVRC and GA-TVRC-Het,the performance of R-TVRBC is determined by averaging the consecutive ten runs.Performances of each method are quantified by resulting AUC values.
5.3 Results
In this section, various tests are performed to analyze the proposed method. Boththe classification performance and complexity of our method are measured. First, theresults of GA-TVRC, proposed in our previous work (Günes et al. 2011), are given.Then, the performance of our proposed method, GA-TVRC-Het, is compared with bothrelational and non-relational baseline methods. In order to show the performance ofour proposed method, we carried out experiments with larger training data and noisydata. We examined the time effects estimated by our algorithms for each data set.We also included experimental results to demonstrate the contribution of consideringeach link type separately during classification. Last, the time and memory usages ofall methods are compared.
5.3.1 GA-TVRC results
We first summarize the performance of our previous work GA-TVRC, on two realworld data sets. The AUC values of GA-TVRC and different relational baseline
123

688 I. Günes et al.
Table 5 AUC values for HEP-Th data sets
Test set GA-TVRC TV-RBC RBC R-TVRC
1999 0.90± 0.01 0.84 0.80 0.80± 0.02
2000 0.79± 0.01 0.75 0.72 0.73± 0.02
2001 0.84± 0.01 0.83 0.82 0.80± 0.03
Table 6 AUC values for P2P data sets
Test set GA-TVRC TV-RBC RBC R-TVRC
Week 6 0.89± 0.01 0.83 0.80 0.80± 0.03
Week 7 0.84± 0.02 0.80 0.77 0.75± 0.05
Week 8 0.88± 0.02 0.82 0.80 0.80± 0.03
methods are given in Tables 5 and 6. Errorbars for GA-TVRC and R-TVRC areobtained over ten different runs of the methods. As it is seen from the tables, GA-TVRCoutperforms other methods for both data sets and provides a significant improvementin terms of AUC value. TV-RBC achieves slightly better results than RBC by uti-lizing time effect. As it is expected, RBC which has equal unit time effect valuesprovides similar results with R-TVRC which has random effect values. Hence, it canbe claimed that while using decaying time effect values in TV-RBC increases the AUCvalues compared to RBC and R-TVRC, using adaptive time effect values in GA-TVRCgives the best results.
We do further experiments to find the effects of each time period in which pastinteractions occurred. Figure 7 shows the optimal time effects which are determinedby GA-TVRC for all three training-validation-test partitions of both data sets. Thefigure includes the effect values of each time period for ten consecutive runs of GA.As it is seen from the figure, usually time effect values increase over time. However,the shape of time effect curve is not neccessarily an exponential or linear function as ithas been used in the literature previously (Sharan and Neville 2007). Moreover, therecan be time periods which are less important as in the case of year 1997 of the HEP-Thdata set or more important as in the week 5 of the P2P Data Set. These exceptionalcases which may only be discovered by GA-TVRC explain the reason behind thesuperior performance of GA-TVRC as shown in Tables 5 and 6.
5.3.2 GA-TVRC-Het results
GA-TVRC relaxes the assumption that all time effects are the same (as in RBC) or theydecrease over time according to a certain function (as in TV-RBC). However, it doesnot take into account the fact that the time effects do not necessarily change in the sameway for each different link type in a network. An interaction of a certain type occurredin a given time period may affect classification performance more than an interactionof a different type occurred in the same time period. Using GA-TVRC-Het, we applythe GA for each link type separately as explained in Sect. 4.2.1. So, we find the optimal
123

GA-TVRC-Het: genetic algorithm enhanced time 689
(a) (b) (c)
(d) (e) (f)
Fig. 7 The effects of each time period on classification for HEP-Th and P2P data sets. a HEP-Th 1994–1999. b HEP-Th 1995–2000. c HEP-Th 1996–2001. d P2P week 1–week 6. e P2P week 2–week 7. f P2Pweek 3–week 8
time effects for each interaction type separately. Figure 8 shows these time effects fortwo different link types in the HEP-Th network. The first row of the figure showsthe optimal time effects for the PastAuthorship link type (past papers of the author)while the second row shows the optimal time effects for the PastPublication linktype (past papers published on the journal of the paper). The figure shows that whilethere is a significant increase in optimal time effects for the PastAuthorship link, theoptimal time effect values for the PastPublication link are different both in magnitudeand in their trend over time. It may be claimed that authors’ interests change morefrequently than the journals’ topics. Figure 9 shows optimal time effects computedby GA-TVRC-Het algorithm for a given type of interaction (first row: Ownership,second row: PastTransfer, third row: PastQuery) occurred in the P2P network. Thefigure shows that the effect of owning a file by someone in a given time increasessteadily in time. Recent ownerships have more effect on classification, but we can notsay the same about the past transfers of a file’s owner and past queries used to find thefile. The effects may or may not increase in time for these two types of interactions. Itis also worth noting that, as in the Hep-Th data set, for the P2P data set also, not onlythe optimal patterns in time, but also the optimal values of time effects are different foreach link type. GA-TVRC-Het is able to discover these different optimal time effectsto discriminate the importance of each link type for classification.
The performances of GA-TVRC and GA-TVRC-Het are compared to validate thatconsidering the temporal effects of different link types separately will improve theclassification performance. Table 7 includes the AUC values for two different strate-gies, GA-TVRC and GA-TVRC-Het, for HEP-Th and P2P networks after ten con-secutive runs. It is obvious that, applying the GA for different types of interactionsseparately (GA-TVRC-Het), slightly improves the classification performance. Hence,we can say that both GA-TVRC and GA-TVRC-Het outperform other methods. Theone-sample Wilcoxon signed rank test is performed in order to evaluate a possible
123

690 I. Günes et al.
(a) (b) (c)
(d) (e) (f)
Fig. 8 The effects of each time period on classification for two different link types in HEP-Th network. aPastAuthorship 1994–1999. b PastAuthorship 1995–2000. c PastAuthorship 1996–2001. d PastPublication1994–1999. e PastPublication 1995–2000. f PastPublication 1996–2001
(a) (b) (c)
(d) (e) (f)
(g) (h) (i)
Fig. 9 The effects of each time period on classification for two different link types in P2P network. aOwnership week 1–week 6. b Ownership week 2–week 7. c Ownership week 3–week 8. d PastTransferweek 1–week 6. e PastTransfer week 2–week 7. f PastTransfer week 3–week 8. g PastQuery week 1–week6. h PastQuery week 2–week 7. i PastQuery week 3–week 8
123

GA-TVRC-Het: genetic algorithm enhanced time 691
Table 7 AUC values for HEP-Th and P2P data sets
Hep-Th P2P
Test set GA-TVRC GA-TVRC-Het Test set GA-TVRC GA-TVRC-Het
1999 0.90± 0.01 0.91± 0.01 Week 6 0.89± 0.01 0.91± 0.01
2000 0.79± 0.01 0.80± 0.01 Week 7 0.84± 0.02 0.86± 0.01
2001 0.84± 0.01 0.86± 0.01 Week 8 0.88± 0.02 0.89± 0.02
Table 8 AUC values for larger HEP-Th and P2P data sets
Test set GA-TVRC GA-TVRC-Het
2001 (larger training set) 0.89± 0.01 0.93± 0.01
Week 8 (larger training set) 0.88± 0.01 0.93± 0.01
statistical significance in the performance of different methods. The test shows thatthe AUC values of GA-TVRC and GA-TVRC-Het are significantly greater than theother methods, at the 0.05 level.
Although in Table 7, the AUC values for the GA-TVRC-Het method are consistentlylarger than that of the GA-TVRC method, they are also quite close to each other. Weperformed two other sets of experiments which compare the GA-TVRC-Het and GA-TVRC performances. In the first set of experiments, to obtain a larger training set, foreach data set, the data from the last time period are used as the test set and the remainingpart of the data set is used as the training and validation sets. Since GA-TVRC-Hethas more parameters, when there is more data, we expect it to be able to learn morefrom the additional data. More complex models are known to generalize better whenthey are provided with more training data (see, for example, VC bounds (Vapnik1998). Since the change of each link type is utilized by GA-TVRC-Het, it has moreparameters to estimate. The intuition behind this experiment is that since GA-TVRC-Het has more parameters, it is able to learn them accurately as more data becomeavailable. Table 8 confirms the expectation that the performance of GA-TVRC-Hetincreases more, when it is compared to the performance of GA-TVRC, by utilizinglarger time-evolving data. When more training data is used, for the HEP-Th data set,the performance increases from 0.84 to 0.89 for GA-TVRC and increases from 0.86to 0.93 for GA-TVRC-Het. For the P2P data set, the performance remains at 0.88 forGA-TVRC and increases from 0.89 to 0.93 for GA-TVRC-Het.
In other set of experiments, we added noise to only one type of link. In this case,it is expected that GA-TVRC-Het will assign less weight to this link type. If onlysome types of links include noise, GA-TVRC-Het is expected to perform better thanGA-TVRC by extracting the effect of time periods for each link type separately. Thenoisy links are expected to be given lower effect values in time and the influenceof them on classification performance will be lower. The experiments show that theclassification accuracy of GA-TVRC-Het is better than the GA-TVRC. Table 9 showsthe AUC values of both methods for noisy HEP-Th data set which includes noise onthe links of type PastAuthorship. The noise level, which is the ratio of noisy links
123

692 I. Günes et al.
Table 9 AUC values for noisy HEP-Th data set
Non noise 0.2 Noise
Test set GA-TVRC GA-TVRC-Het Test set GA-TVRC GA-TVRC-Het
1999 0.90± 0.01 0.91± 0.01 1999 0.78± 0.02 0.82± 0.02
2000 0.79± 0.01 0.80± 0.01 2000 0.68± 0.01 0.73± 0.01
2001 0.84± 0.01 0.86± 0.01 2001 0.73± 0.01 0.79± 0.01
(a) (b) (c)
Fig. 10 The effects of each time period on GA-TVRC classification for original and noisy HEP-Th networkdata. a HEP-Th 1994–1999. b HEP-Th 1995–2000. c HEP-Th 1996–2001
to the original links, is determined as 0.2. As it is expected, the difference betweenthe AUC values of GA-TVRC-Het and GA-TVRC gets bigger and the superiorityof GA-TVRC-Het is emphasized for noisy data. It is statistically significant that themean of GA-TVRC-Het is higher than the mean of GA-TVRC for p < 0.05. In orderto avoid the pathologies of multiple comparison procedure (Jensen and Cohen 2000),we have also applied some adjustments to statistical tests. We have performed tenfoldcross-validation to evaluate the methods for all test sets. The variable results whichmay be caused by using only one set of data are also avoided. Besides, statistical testsare performed using Bonferroni correction for multiple comparisons.
The effects of link occurance times computed by GA-TVRC are expected to besimilar for both the original data and the noisy data because GA-TVRC treats theoriginal and noisy links in the same manner. Figure 10 confirms that the trend of timeeffect is similar for both the original and noisy data. However, GA-TVRC-Het is likelyto assign lower effect values to noisy links. Indeed, as shown in Fig. 11, time effectvalues which are assigned to the links of type PastAuthorship have been reduced byGA-TVRC-Het.
In the third set of experiments, we aim to analyze the effect of using only some recentinteractions (relations) on classification accuracy. Our proposed method is tested withdifferent time-lag values which are the time periods between the last time step andthe time step of oldest related object. The AUC scores for various time-lag values aregiven in Fig. 12. The figure shows that using only the interactions which happenedin last time step provides decent AUC values. However time-lag value of four is abetter choice and increasing time-lag value, does not contribute more to classificationperformance.
123

GA-TVRC-Het: genetic algorithm enhanced time 693
(a) (b) (c)
(d) (e) (f)
Fig. 11 The effects of each time period on GA-TVRC-Het classification for Noisy HEP-Th network. aPastAuthorship 1994–1999. b PastAuthorship 1995–2000. c PastAuthorship 1996–2001. d PastPublication1994–1999. e PastPublication 1995–2000. f PastPublication 1996–2001
Fig. 12 AUC values fordifferent time-lag values inHEP-Th and P2P data sets
5.3.3 Contribution of each link type
In previous two subsections, we computed the best time effects for links by employ-ing two algorithms, namely GA-TVRC and GA-TVRC-Het, using all link types forclassification. In this subsection, we aim to analyze classification performance wheninstead of all link types, only a subset of link types (for example only a single linktype, pairs of different link types or no links at all) are used for classification. Wereport experimental results of an evaluation study conducted on different data subsetsextracted from original data sets using GA-TVRC and GA-TVRC-Het methods.
AUC values obtained using each method for each extracted data subset are shown inTable 10 for the Hep-Th data set. Note that, as expected, both GA-based methods givethe same results when there is only a single link type. The errorbars for the GA-basedand random methods have been omitted in order to save space and they are on the orderof the errorbars in Table 7. Based on the comparison of PastAuthorship (PastAuthored-Paper) and PastPublication (PastPublishedPaper) rows for all three different test sets
123

694 I. Günes et al.
Table 10 AUC values for Hep-Th data set when different subsets of links are used
Test set Links used RBC TV-RBC R-TVRC GA-TVRC GA-TVRC-Het
1999 PastAuthorship 0.63 0.68 0.62 0.74 0.74
PastPublication 0.72 0.75 0.73 0.79 0.79
Both 0.80 0.83 0.80 0.90 0.91
Only last time step 0.73 – – – –
None 0.47 – – – –
2000 PastAuthorship 0.58 0.64 0.58 0.71 0.71
PastPublication 0.69 0.71 0.68 0.75 0.75
Both 0.72 0.74 0.73 0.78 0.80
Only last time step 0.68 – – – –
None 0.44 – – – –
2001 PastAuthorship 0.62 0.69 0.61 0.74 0.74
PastPublication 0.72 0.74 0.73 0.76 0.76
Both 0.81 0.82 0.79 0.84 0.86
Only last time step 0.74 – – – –
None 0.49 – – – –
(1999, 2000, 2001), it is clear that other papers which have been published in the samejournal (PastPublication) have more impact on the classification accuracy of a paperthan the other papers which have been submitted by the same author (PastAuthorship).
When both PastPublication and PastAuthorship links are used, all methods performbetter. While TV-RBC also results in an increase in AUC values with both types oflinks, the increase of AUC scores is more pronounced for GA-based methods. Table 10also shows the AUC values of the methods on a data set where past interactions andlink information are ignored (“None” row) and only links from the last time stepare available (“Only last time step” row). When no link information is used, theclassification accuracy decreases significantly. On the other hand, using only the lasttime step gives only as good AUC values as using all the past links of PastPublicationlinks by RBC. To summarize, for the Hep-Th data set, using links of both types andusing links from the past which are weighted by GA computed optimal time effectsresults in a significant increase in AUC values.
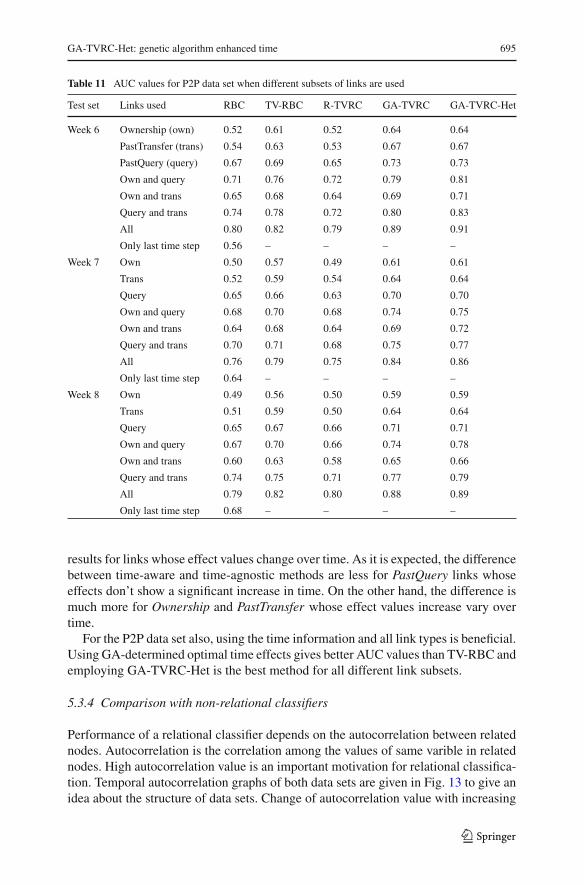
AUC values obtained using each method for each link subset are shown in Table 11for the P2P data set. In this table, the first three rows for each test set include AUCvalues when only a single link type is used. Similar to the Hep-Th data set, for theP2P data set also there are performance differences between different link types. Thequeries which have been used to find a file (PastQuery) provide the biggest contributionon classification for all three test sets. So, the files which have been downloaded morethan a given number, are expected to be found by similar queries. Likewise, the fileswhich have formerly been transferred by a user (PastTransfer) have more effect onclassification than the owner of a file (Ownership).
The AUC values computed for both the HEP-Th and the P2P network data showthat time-aware methods (like TV-RBC, GA-TVRC-Het) are likely to have better
123
GA-TVRC-Het: genetic algorithm enhanced time 695
Table 11 AUC values for P2P data set when different subsets of links are used
Test set Links used RBC TV-RBC R-TVRC GA-TVRC GA-TVRC-Het
Week 6 Ownership (own) 0.52 0.61 0.52 0.64 0.64
PastTransfer (trans) 0.54 0.63 0.53 0.67 0.67
PastQuery (query) 0.67 0.69 0.65 0.73 0.73
Own and query 0.71 0.76 0.72 0.79 0.81
Own and trans 0.65 0.68 0.64 0.69 0.71
Query and trans 0.74 0.78 0.72 0.80 0.83
All 0.80 0.82 0.79 0.89 0.91
Only last time step 0.56 – – – –
Week 7 Own 0.50 0.57 0.49 0.61 0.61
Trans 0.52 0.59 0.54 0.64 0.64
Query 0.65 0.66 0.63 0.70 0.70
Own and query 0.68 0.70 0.68 0.74 0.75
Own and trans 0.64 0.68 0.64 0.69 0.72
Query and trans 0.70 0.71 0.68 0.75 0.77
All 0.76 0.79 0.75 0.84 0.86
Only last time step 0.64 – – – –
Week 8 Own 0.49 0.56 0.50 0.59 0.59
Trans 0.51 0.59 0.50 0.64 0.64
Query 0.65 0.67 0.66 0.71 0.71
Own and query 0.67 0.70 0.66 0.74 0.78
Own and trans 0.60 0.63 0.58 0.65 0.66
Query and trans 0.74 0.75 0.71 0.77 0.79
All 0.79 0.82 0.80 0.88 0.89
Only last time step 0.68 – – – –
results for links whose effect values change over time. As it is expected, the differencebetween time-aware and time-agnostic methods are less for PastQuery links whoseeffects don’t show a significant increase in time. On the other hand, the difference ismuch more for Ownership and PastTransfer whose effect values increase vary overtime.
For the P2P data set also, using the time information and all link types is beneficial.Using GA-determined optimal time effects gives better AUC values than TV-RBC andemploying GA-TVRC-Het is the best method for all different link subsets.
5.3.4 Comparison with non-relational classifiers
Performance of a relational classifier depends on the autocorrelation between relatednodes. Autocorrelation is the correlation among the values of same varible in relatednodes. High autocorrelation value is an important motivation for relational classifica-tion. Temporal autocorrelation graphs of both data sets are given in Fig. 13 to give anidea about the structure of data sets. Change of autocorrelation value with increasing
123

696 I. Günes et al.
(a) (b)
Fig. 13 Temporal autocorrelation of HEP-Th and P2P data sets. a HEP-Th temporal autocorrelation. bP2P temporal autocorrelation
Table 12 AUC values for relational and non-relational classifiers
Relational classifiers Non-relational classifiers
Test set GA-TVRC-Het GA-TVRC TV-RBC RBC Naive Bayes C4.5
HEP-Th 2001 0.86 0.84 0.83 0.82 0.71 0.72
P2P week 8 0.89 0.88 0.82 0.80 0.66 0.69
time lag between related nodes is shown. Figure 13a shows the autocorrelation betweenthe area attributes of papers which are published in 2001 and the area attributes of thepapers which they cite. The autocorrelation between the number of transfer attributesof files transferred in week 8 and the values of the same attribute of files transferred bythe same user is given in Fig. 13b. It is clear that the autocorrelation between relatednodes is decently high and decreases with increasing time-lag. Using relational clas-sifiers and emphasizing the recent relations seem to be a reasonable choice for bothdata sets.
After observing the high autocorrelation among related nodes, our method iscompared with non-relational classifiers, as well. The results of relational and non-relational baseline methods, namely Naive Bayes and C4.5 decision tree, for both datasets are given in Table 12. Previous five time periods are used as training set by non-relational methods. It is obvious that, relational classifiers outperform non-relationalclassifiers for both data sets. The most likely reason is the highly correlated structureof data sets. It is also clear that the difference values between AUC scores of relationaland non-relational methods for HEP-TH data set are greater than the difference valuesfor P2P data set. As it is shown in Fig. 13, autocorrelation value of HEP-TH is slightlyhigher than the P2P’s and this may be the reason behind this behavior. Note that, theNaive Bayes is equal to the RBC with no link information. However, the AUC valueof Naive Bayes in Table 12 is higher than the value of RBC in Table 10. The Citationnodes which are related with papers but actually of type Paper are also considered astraining data for Naive Bayes while they are not counted for RBC with no links.
123

GA-TVRC-Het: genetic algorithm enhanced time 697
(a) (b)
Fig. 14 The comparative time and memory usages of classifiers. a Working time. b Memory usage
5.3.5 Complexity
In this subsection, we present results on the time and memory complexities of ourproposed methods. Since the GA-based methods are stochastic and may include ran-domness, working time and memory usage of these methods are measured insteadof giving an absolute complexity. The working times of GA-TVRC-Het, GA-TVRC,TV-RBC and RBC are computed for different numbers of subgraphs from Hep-Thdata set on an Intel i7 1.73 GHz processor and 4GB of main memory. Sizes of train-ing, validation and test sets are all set to a given number of subgraphs. Each subgraphdenotes a node to be classified and its related nodes as explained in Sect. 3.2. Theworking times of all methods are given in Fig. 14a. It is clear that GA-based methods’complexities are linear in time and the number of nodes to be classified is decisivewhile computing time complexity. Number of generations, number of individuals andnumber of genes are the linear factors. The figure also shows that the time complexityof GA-TVRC-Het is roughly the twice of GA-TVRC’s. This may be due to the factthat the number of genes of an individual is doubled with two different link types to beestimated. The number of mutation and cross-over operations are doubled as well. Wecan also say that TV-RBC has larger time cost than RBC by utilizing a summarizationphase. Among all methods, time complexities of GA-TVRC and GA-TVRC-Het aregreater than RBC and TV-RBC for especially larger number of nodes. It may be prac-tical to use RBC and TV-RBC instead of GA-based methods in return for low AUCvalues. We can talk about a trade-off between model complexity and AUC scores.
Space complexities of the methods are measured in terms of maximum memorycells which are kept until the algorithm ends. Figure 14b shows the memory usagesof all methods for different numbers of nodes. It is obvious from the figure that thememory usage increases linearly with the number of nodes and GA-TVRC-Het usesslightly more memory than GA-TVRC for the same number of nodes. We can alsosay that memory usage of GA-based methods are quite similar to that of RBC andTV-RBC. GA-based methods provides more classification accuracy with reasonableusage of memory.
6 Conclusions and future work
In this paper, we proposed a novel framework, GA-TVRC-Het, which extracts theeffects of past time periods in relational data, in order to improve the classification
123

698 I. Günes et al.
performance. The proposed framework utilizes GAs in order to learn the optimal timeeffects of different link types. The discovered time effects are then used to classifya new node in an evolving heterogeneous network. Not only the nodes related to thenode to be classified, but also the past connections of the related nodes are consideredfor classification.
The proposed framework is tested on two real world datasets. First, the effect ofeach time period in which the links occurred is discovered in order to maximize theclassification accuracy. As it is expected, the time effects of links on classificationtend to mostly increase over time. However, it is clear from our tests that there arealso some situations where there is no specific trend of increase of the time effectsand there may be certain time periods in which there is an unexpected increase ordecrease. In this work, we demonstrate that mathematical modelling of time effectsis difficult, since the time effects may not follow a specific functional pattern suchas exponential or linear decay. We show that using GAs for discovering these effectsimproves the classification performance. In terms of AUC performance, the proposedmethod results in an increase of 10 % compared to time-agnostic RBC method and5 % compared to the time aware TV-RBC method.
In addition to these tests, the effect of each link type is analyzed one by one.The results show that all links of different types do not evolve in the same way andclassification performance may be improved by applying the GA for each type of linkseparately. Although this improvement is achieved at the cost of increased complexity,especially when there are many different types of links whose effects may differ quitea lot from each other, it may be worth the effort.
The methods are also evaluated when there is more training data available or whenthere is noise on the links. Our experiments have shown that GA-TVRC-Het couldgive better results than GA-TVRC when there is link noise or more training data isavailable. Last, the proposed method GA-TVRC-Het is compared with non-relationalbaseline methods. The results show that, especially due to the presence of temporalautocorrelation in the data sets, our proposed method clearly outperforms the non-relational classifiers.
Since the method is a relational classifier, structure of data set will be decisive inperformance. The method performs well for data sets with high autocorrelation. Ifthere is no correlation between related objects, classification accuracy may decrease.Usage of GA also brings some limitations. Although the probability of convergingto local maximum is minimized by applying an adaptive mutation step, high com-putational complexity may still be considered as a drawback. If lower complexityis preferred in return for lower classification performance, using RBC or any othersimpler method may be taken into account. However, considering the increase in clas-sification accuracy, the increase in time complexity is acceptable and the increase inspace complexity is negligible.
Our work in this paper can be extended in a number of different directions. In orderto decrease the time complexity and increase classification accuracy, the nodes in adata set may be grouped into clusters and the optimal time effects for each cluster canbe computed separately for each cluster. In addition to using clusters, running the GA-based algorithm in a distributed environment may also decrease the time complexity.In this work, we used extensions of RBC classifier. Extending other classifiers for
123

GA-TVRC-Het: genetic algorithm enhanced time 699
time-varying relational data could also be considered. When there are many differenttypes of links and a large number of nodes to be classified, eliminating irrelevantlinks from each time period could help with the time performance of GA-TVRC-Het.Experimenting with GA-TVRC-Het on other data sets with a large number of nodesand link types to demonstrate the benefits of the algorithm compared to GA-TVRCand TV-RBC is another possible research direction.
References
Acar E, Dunlavy DM, Kolda TG (2009) Link prediction on evolving data using matrix and tensor factor-izations. In: ICDM workshops. IEEE Computer Society, New York, pp 262–269
Aggarwal C, Li N (2011) On node classification in dynamic content-based networks. SDM,SIAM/Omnipress, Eastbourne, pp 355–366
Albert R, Jeong H, Barabási AL (1999) Diameter of the world wide web. Nature 401:130–131Atak AA, Ögüdücü SG (2010) A framework for social spam detection based on relational bayes classifier.
DMIN, CSREA Press, Las Vegas NevadaBarabasi AL, Albert R (1999) Emergence of scaling in random networks. Science 286:509–512Barabasi AL, Jeong H, Neda Z, Ravasz E, Schubert A, Vicsek T (2002) Evolution of the social network of
scientific collaborations. Phys A 311(3–4):590–614Beyer HG, Schwefel HP (2002) Evolution strategies—a comprehensive introduction. Nat Comput 1(1):3–52Blau H, Immerman N, Jensen D (2001) A visual query language for relational knowledge discovery.
Technical report. University of Massachusetts, AmherstCallut J, Françoisse K, Saerens M, Dupont P (2008) Semi-supervised classification from discriminative
random walks, ECML/PKDD (1), vol 5211 of lecture notes in computer science. Springer, New York,pp 162–177
Chakrabarti D, Kumar R, Tomkins A (2006) Evolutionary clustering. In: twelfth annual SIGKDD interna-tional conference on knowledge discovery and data mining and data mining (KDD), pp. 554–560
Chan SY, Hui P, Xu K (2009) Community detection of time-varying mobile social networks, complex(1). Lecture notes of the institute for computer sciences, social informatics and telecommunicationsengineering, vol 4. Springer, New York, pp 1154–1159
Fortuna B, Rodrigues EM, Milic-Frayling N (2007) Improving the classification of newsgroup messagesthrough social network analysis. In: Proceedings of the sixteenth ACM conference on conference oninformation and knowledge management, CIKM ’07. ACM, New York. pp 877–880
Freeman LC (1993) Finding groups with a simple genetic algorithm. J Math Sociol 17(4):227–241Gaertler M, Görke R, Wagner D, Wagner S (2006) How to cluster evolving graphs. In: European conference
of complex systems, OxfordGünes I, Çataltepe Z, Ögüdücü SG (2011) Ga-tvrc: a novel relational time varying classifier to extract
temporal information using genetic algorithms, MLDM. Lecture notes in computer science, vol 6871.Springer, New York, pp. 568–583.
Holland J (1975) Adaptation in natural and artificial systems. The University of Michigan Press, Ann ArborJensen DD, Cohen PR (2000) Multiple comparisons in induction algorithms. Mach Learn 38(3):309–338Knowledge Discovery Laboratory Website, University of Massachusetts Amherst, Department of Computer
Science (2006a) http://kdl.cs.umass.edu/data/hepth/hepth-info.html. Accessed 17 April 2006Knowledge Discovery Laboratory Website, University of Massachusetts Amherst, Department of Com-
puter Science (2006b) http://kdl.cs.umass.edu/data/canosleep/canosleep-info.html. Accessed 20–23Aug 2006
Kumar R, Novak J, Tomkins A (2006) Structure and evolution of online social networks. In: KDD ’06:proceedings of the 12th ACM SIGKDD international conference on knowledge discovery and datamining. ACM, New York, pp 611–617
Leskovec J, Kleinberg J, Faloutsos C (2005) Graphs over time: densification laws, shrinking diametersand possible explanations. Proceedings of the eleventh ACM SIGKDD international conference onknowledge discovery in data mining. ACM, New York, pp 177–187
Li X, Chen G (2003) A local-world evolving network model. Phys A 328(1–2):274–286Liben-Nowell D, Kleinberg JM (2007) The link-prediction problem for social networks. JASIST
58(7):1019–1031
123

700 I. Günes et al.
Ling CX, Huang J, Zhang H (2003) Auc: a statistically consistent and more discriminating measure thanaccuracy. In: IJCAI. Morgan Kaufmann, San Mateo, pp 519–526
Lipczak M, Milios EE (2009) Agglomerative genetic algorithm for clustering in social networks. In:GECCO. ACM, New York, pp 1243–1250
Macskassy S, Provost F (2003) A simple relational classifier. In: Proceedings of the 2nd workshop onmulti-relational data mining, KDD2003, pp 64–76.
Macskassy S, Provost F (2007) Classification in networked data: a toolkit and a univariate case study. JMach Learn Res 8:935–983
McGovern A, Hiers NC, Collier MW, II DJG, Brown RA (2008) Spatiotemporal relational probability trees:an introduction, ICDM. IEEE Computer Society, New York, pp 935–940
Naruchitparames J, Gunes MH, Louis SJ (2011) Friend recommendations in social networks using geneticalgorithms and network topology. In: IEEE congress on evolutionary computation. IEEE, New York, pp2207–2214
Neville J, Jensen D, Gallagher B (2003) Simple estimators for relational bayesian classifiers. In: Proceedingsof the 3rd IEEE international conference on data mining (ICDM 2003), Melbourne. IEEE ComputerSociety, Washington, DC, 19–22 December 2003, pp 609–612
Newman MEJ (2001) Scientific collaboration networks. I. Network construction and fundamental results.Phys Rev E 64: 016131
Palla G, Barabasi A, Vicsek T (2007) Quantifying social group evolution. Nature 446:664–667Pastor-Satorras R, Vázquez A, Vespignani A (2001) Dynamical and correlation properties of the Internet.
Physl Rev Lett 87(25):258701Pezzella F, Morganti G, Ciaschetti G (2008) A genetic algorithm for the flexible job-shop scheduling
problem. Comput Oper Res 35(10):3202–3212Pizzuti C (2008) Ga-net: a genetic algorithm for community detection in social networks, PPSN. Lecture
notes in computer science, vol 5199. Springer, Berlin; Heidelberg [u.a.], pp 1081–1090Rechenberg I (1973) Evolutionsstrategie: optimierung technischer systeme nach prinzipien der biologischen
evolution, number 15 in problemata. Frommann-Holzboog, Stuttgart-Bad CannstattRokach L (2008) Genetic algorithm-based feature set partitioning for classification problems. Pattern Recog-
nit 41(5):1676–1700Rossi RA, Neville J (2011) Representations and ensemble methods for dynamic relational classification,
CoRR abs/1111.5312Scala A, Amaral LAN, Barthélémy M (2001) Small-world networks and the conformation space of a short
lattice polymer chain. Europhys Lett (EPL) 55(4):594Segond M, Fonlupt C, Robilliard D (2009) Genetic programming for protein related text classification. In:
GECCO. ACM, New York, pp 1099–1106Sen P, Namata G, Bilgic M, Getoor L, Gallagher B, Eliassi-Rad T (2008) Collective classification in network
data. AI Mag 29(3):93–106Setnes M, Babuska R (1999) Fuzzy relational classifier trained by fuzzy clustering. IEEE Trans Syst Man
Cybern B 29(5):619–625Shao H et al. (2008) Fourth international conference on natural computation, ICNC ’08, vol 01. IEEE
Computer Society, Washington, DCSharan and Neville (2007) Workshop on Web mining and social network analysis, WebKDD/SNA-KDD
’07. ACM, New YorkSharan U, Neville J (2008) Temporal–relational classifiers for prediction in evolving domains. In: ICDM.
IEEE Computer Society, New York, pp 540–549Sole RV, Satorras PR, Smith E, Kepler TB (2002) A model of large-scale proteome evolution. Adv Complex
Syst 5(1):43–54Tan F, Fu X, Zhang Y, Bourgeois AG (2008) A genetic algorithm-based method for feature subset selection.
Soft Comput 12(2):111–120Tylenda T, Angelova R, Bedathur S (2009) Towards time-aware link prediction in evolving social networks.
In: SNAKDD. ACM, New York, p 9Vapnik VN (1998) Statistical learning theory. Wiley-Interscience, New YorkWatts DJ, Strogatz SH (1998) Collective dynamics of small-world networks. Nature 393(6684):440–442Weninger T, Hsu WH, Xia J, Aljandal W (2009) An evolutionary approach to constructive induction for
link discovery. In: GECCO. ACM, New York, pp 1941–1942
123
GA-TVRC-Het: genetic algorithm enhanced time 701
Wilson G, Banzhaf W (2009) Discovery of email communication networks from the enron corpus with agenetic algorithm using social network analysis. In: CEC’09: proceedings of the eleventh conference oncongress on evolutionary computation. IEEE Press, New York, pp 3256–3263
Zhang Y, Shen G, Yu Y (2007) Lips: efficient p2p search scheme with novel link prediction techniques. In:ICC. IEEE, New York, pp 1875–1880
Zheleva E, Getoor L (2009) To join or not to join: the illusion of privacy in social networks with mixedpublic and private user profiles. In: WWW ’09: proceedings of the 18th international conference onworld wide web. ACM, New York, pp 531–540
Zhu J, Hong J, Hughes JG (2002) Using markov models for web site link prediction. In: Hypertext. ACM,New York, pp 169–170
123