G0271 Student Activity Workbook - PEMA Home Student Activity Workbook ... SAW-Page 2 Unit 2. ......
25
G0271 Student Activity Workbook October 2013
Transcript of G0271 Student Activity Workbook - PEMA Home Student Activity Workbook ... SAW-Page 2 Unit 2. ......

G0271 Student Activity Workbook
October 2013

Student Activity Workbook G0271
Hazardous Weather and Flooding Preparedness October 2013 SAW-Page 2
Unit 2. Activity 1
WALKTHROUGH ACTIVITY: READING A SURFACE PRESSURE MAP
Follow the steps given by the instructor to complete the activity. Start at the outlined point on the map.
Source: This activity is courtesy of the National Weather Service’s JetStream online school for weather. http://www.srh.noaa.gov/jetstream//synoptic/ll_analyze_slp.htm.
There are many weather lessons available from the NWS JetStream website you are interested in learning more: http://www.srh.noaa.gov/jetstream//index.htm.

Student Activity Workbook G0271
Hazardous Weather and Flooding Preparedness October 2013 SAW-Page 3
Unit 3. Activity 2
Individual Activity: Identifying Potentially Hazardous Situations
Choose two of the hydrometeorological events discussed earlier in this unit and record them in the first row.
For each event, list five community or environmental factors or conditions that may worsen the impact of the event. For example, extensive development and paved surface prohibit water absorption, which worsens the impact of flooding.
Circle the factors or conditions that are present in your community.
Event #1: Event #2:
1
2
3
4
5

Student Activity Workbook G0271
Hazardous Weather and Flooding Preparedness October 2013 SAW-Page 4
Unit 4. Activity 3
Small Group Activity: The Dallas Hailstorm
Working with your table group, read the information on the following page about the May 5, 1995, Dallas-Ft. Worth hailstorm event.
For the two questions that appear after the case study, record your responses on your group’s flipchart.
Be prepared to share your responses with the class.

Student Activity Workbook G0271
Hazardous Weather and Flooding Preparedness October 2013 SAW-Page 5
Scenario: May 5, 1995
On Friday, May 5th 1995, a powerful Springtime North Texas thunderstorm complex struck in the worst possible place (a major metropolitan area) during the worst possible time (a Friday evening during a major outdoor event). The Dallas-Fort Worth Metroplex endured its worst hailstorm ever and its most deadly flash flooding ever. The staggering results included a total of 21 fatalities and 510 injuries—all from a storm that was well forecast. The damages were estimated at $2 billion, making this one of the costliest hail storms in U.S. history. While most of the damage was unavoidable (large hail falling on automobiles and structures), the fatalities and injuries were mostly the result of people failing to respond appropriately to warnings.
In the late afternoon, an isolated thunderstorm formed in a warm, moist, highly unstable air mass ahead of a squall line approaching Tarrant County. (See the radar images on the following page.) Favorable winds in the lower and middle levels of the atmosphere (from the surface to around 12,000 feet) helped the thunderstorm develop storm-scale rotation and a powerful, sustained updraft. A supercell capable of generating one or more tornadoes was born. Additionally, the squall line, a solid line of strong thunderstorms, was overtaking the supercell and exhibited a “bow echo” signature, indicative of damaging straight-line winds. The supercell generated baseball- to softball-sized hail across downtown Fort Worth. More than 500 people were injured by hail at the annual Mayfest celebration, an outdoor event in downtown Fort Worth, when they were caught without shelter.
The NWS Office in Ft. Worth issued a severe thunderstorm warning for Tarrant County 15 minutes before the first reported hail fell. They issued frequent statements updating the storm’s movement.
That evening the squall line overtook the supercell in eastern Tarrant County and the storm complex slowed. As night fell the slower movement of the merged supercell/squall line caused torrential downpours from eastern Tarrant County across most of Dallas County. Rainfall rates of more than three inches per ½-hour resulted in flash flooding. Many who drowned were attempting to drive through flooded low-water crossings or were abandoning their stalled vehicles.
1. As an Emergency Manager, what responsibilities would you have for detecting, warning,
and responding to this event? 2. What personnel or agencies would you have coordinated with prior to and during this event?
Why?

Student Activity Workbook G0271
Hazardous Weather and Flooding Preparedness October 2013 SAW-Page 6
Unit 5. Activity 4
Group Activity: NWS Offices Knowledge Bowl
NWS Offices
Center Weather Service Units (CWSUs)
There are 21 Center Weather Service Units (CWSUs) that operate in cooperation with the Federal Aviation Administration (FAA). There are four CWSUs in the Eastern Region, five in the Central Region, seven in the Southern Region, four in the Western Region, and one in the Alaska Region.
The main responsibility of a CWSU is to provide weather support and consultation to FAA air traffic managers and controllers. Rerouting of aircraft around hazardous weather is based largely on forecasts provided by the CWSU meteorologist. Special emphasis is given to those weather conditions that would be hazardous to aviation or would impede the flow of air traffic in the National Airspace System. CWSU meteorologists also issue Center Weather Advisories (CWA). CWAs are aviation weather warnings for thunderstorms, icing, turbulence, and low ceilings and visibilities.
National Center for Environmental Prediction (NCEP)
The National Center for Environmental Prediction (NCEP) is made up of the following offices:
Aviation Weather Center
o The Aviation Weather Center provides aviation warnings and forecasts of hazardous flight conditions at all levels within domestic and international air space.
Climate Prediction Center
o The Climate Prediction Center monitors and forecasts short-term climate fluctuations and provides guidance information on the long-term global effects climate patterns can have on the nation.
Environmental Modeling Center
o The Environmental Modeling Center develops and improves numerical weather, climate, hydrological and oceanic predictions through programs of applied research in data analysis, modeling, and product development in partnership with the broader research community.
Weather Prediction Center (Formerly Hydrometeorological Prediction Center)
o The Weather Prediction Center provides analysis and forecast products, specializing in quantitative precipitation forecasts to five days in advance, weather forecast guidance to seven days in advance, real-time weather model diagnostics discussions, and surface pressure and frontal analyses.
Student Activity Workbook G0271
Hazardous Weather and Flooding Preparedness October 2013 SAW-Page 7
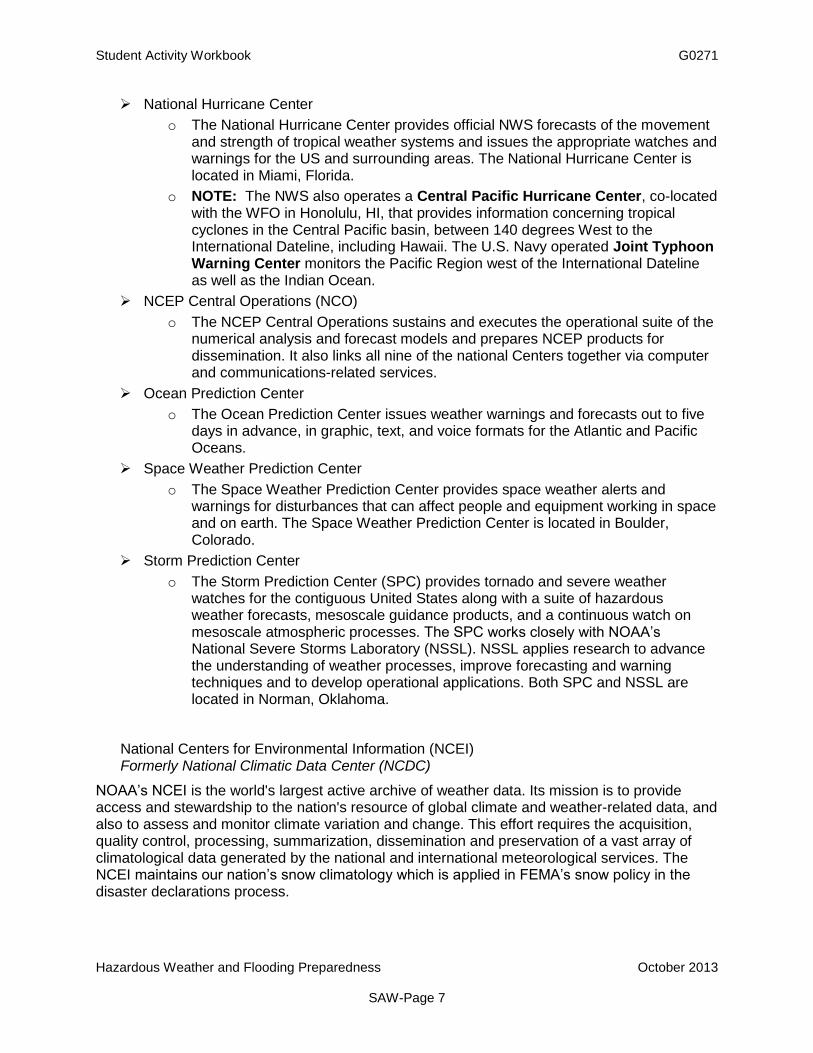
National Hurricane Center
o The National Hurricane Center provides official NWS forecasts of the movement and strength of tropical weather systems and issues the appropriate watches and warnings for the US and surrounding areas. The National Hurricane Center is located in Miami, Florida.
o NOTE: The NWS also operates a Central Pacific Hurricane Center, co-located with the WFO in Honolulu, HI, that provides information concerning tropical cyclones in the Central Pacific basin, between 140 degrees West to the International Dateline, including Hawaii. The U.S. Navy operated Joint Typhoon Warning Center monitors the Pacific Region west of the International Dateline as well as the Indian Ocean.
NCEP Central Operations (NCO)
o The NCEP Central Operations sustains and executes the operational suite of the numerical analysis and forecast models and prepares NCEP products for dissemination. It also links all nine of the national Centers together via computer and communications-related services.
Ocean Prediction Center
o The Ocean Prediction Center issues weather warnings and forecasts out to five days in advance, in graphic, text, and voice formats for the Atlantic and Pacific Oceans.
Space Weather Prediction Center
o The Space Weather Prediction Center provides space weather alerts and warnings for disturbances that can affect people and equipment working in space and on earth. The Space Weather Prediction Center is located in Boulder, Colorado.
Storm Prediction Center
o The Storm Prediction Center (SPC) provides tornado and severe weather watches for the contiguous United States along with a suite of hazardous weather forecasts, mesoscale guidance products, and a continuous watch on mesoscale atmospheric processes. The SPC works closely with NOAA’s National Severe Storms Laboratory (NSSL). NSSL applies research to advance the understanding of weather processes, improve forecasting and warning techniques and to develop operational applications. Both SPC and NSSL are located in Norman, Oklahoma.
National Centers for Environmental Information (NCEI) Formerly National Climatic Data Center (NCDC)
NOAA’s NCEI is the world's largest active archive of weather data. Its mission is to provide access and stewardship to the nation's resource of global climate and weather-related data, and also to assess and monitor climate variation and change. This effort requires the acquisition, quality control, processing, summarization, dissemination and preservation of a vast array of climatological data generated by the national and international meteorological services. The NCEI maintains our nation’s snow climatology which is applied in FEMA’s snow policy in the disaster declarations process.

Student Activity Workbook G0271
Hazardous Weather and Flooding Preparedness October 2013 SAW-Page 8
National Operational Hydrologic Remote Sensing Center (NOHRSC)
Located in Chanhassen, Minnesota, the NOHRSC provides remotely-sensed and modeled hydrology products for the conterminous U.S. and Alaska. NOHRSC airborne, satellite, and modeled snow data and products are used by NWS RFCs, WFOs, as well as other government agencies to support operational and research hydrology programs. Their observed snow data maps are useful for the disaster declaration process.
National Weather Service (National) Headquarters (NWSH)
NOAA NWS maintains a national headquarters in Silver Spring, MD. This is where the Director and Deputy Director of the NWS oversee the organization. There are several offices within
NWSH that work policy, service and operational issues. These offices include: the Office of Operational Systems, NWS Communications, NWS Public Affairs, the Office of Strategic
Planning and Policy, the Office of Science and Technology, the Office of Hydrological Development, and the Office of Climate, Weather, and Water Services (OCWWS). It is OCWWS that works national issues with FEMA, the National Emergency Management Association (NEMA), the International Association of Emergency Managers (IAEM) and other national partners.
National Weather Service Regional Headquarters
There are six Regional Headquarters in the NWS: Eastern (Bohemia, NY), Southern (Fort Worth, TX), Central (Kansas City, MO), Western (Salt Lake City, UT), Alaska (Anchorage, AK) and Pacific (Honolulu, HI). Each Regional Headquarters has its own Director. The NWS Regional Headquarters oversee policy, service and operational issues for the NWS offices in their Regional areas of responsibility. They represent and coordinate regional issues to NWS national headquarters.
River Forecast Centers (RFCs)
There are 13 River Forecast Centers (RFCs). Responsibilities of the RFCs include:
Issuing river stage and flood guidance based on computer models
Providing hydrologic forecast guidance and technical support to Weather Forecast Offices (WFOs)
Running dam break models, providing expert assistance, and performing dam failure analyses for dams that pose an imminent threat to the safety of the residents downstream from the dam
Providing water supply outlooks to water resource managers
Student Activity Workbook G0271
Hazardous Weather and Flooding Preparedness October 2013 SAW-Page 9
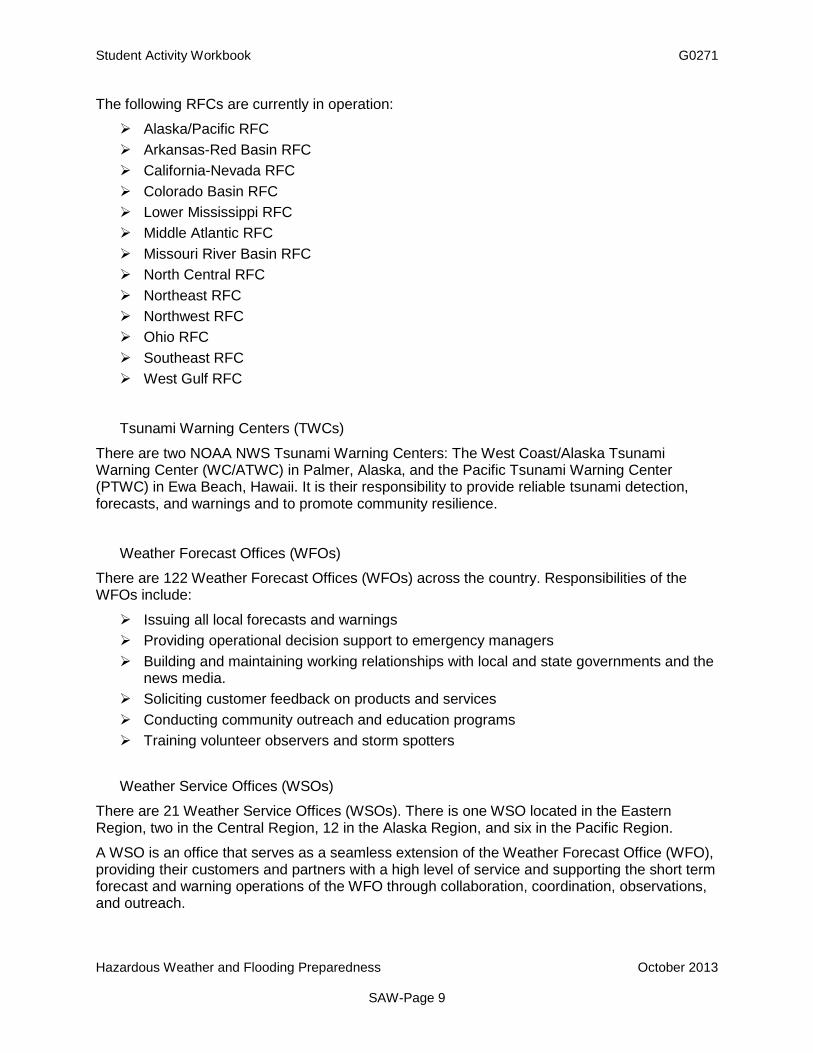
The following RFCs are currently in operation:
Alaska/Pacific RFC
Arkansas-Red Basin RFC
California-Nevada RFC
Colorado Basin RFC
Lower Mississippi RFC
Middle Atlantic RFC
Missouri River Basin RFC
North Central RFC
Northeast RFC
Northwest RFC
Ohio RFC
Southeast RFC
West Gulf RFC
Tsunami Warning Centers (TWCs)
There are two NOAA NWS Tsunami Warning Centers: The West Coast/Alaska Tsunami Warning Center (WC/ATWC) in Palmer, Alaska, and the Pacific Tsunami Warning Center (PTWC) in Ewa Beach, Hawaii. It is their responsibility to provide reliable tsunami detection, forecasts, and warnings and to promote community resilience.
Weather Forecast Offices (WFOs)
There are 122 Weather Forecast Offices (WFOs) across the country. Responsibilities of the WFOs include:
Issuing all local forecasts and warnings
Providing operational decision support to emergency managers
Building and maintaining working relationships with local and state governments and the news media.
Soliciting customer feedback on products and services
Conducting community outreach and education programs
Training volunteer observers and storm spotters
Weather Service Offices (WSOs)
There are 21 Weather Service Offices (WSOs). There is one WSO located in the Eastern Region, two in the Central Region, 12 in the Alaska Region, and six in the Pacific Region.
A WSO is an office that serves as a seamless extension of the Weather Forecast Office (WFO), providing their customers and partners with a high level of service and supporting the short term forecast and warning operations of the WFO through collaboration, coordination, observations, and outreach.

Student Activity Workbook G0271
Hazardous Weather and Flooding Preparedness October 2013 SAW-Page 10
Unit 5. Activity 5
Group Activity: NWS Non-routine Products
In this activity, your table group will be assigned one of the NWS products to examine and outline its features and uses for emergency managers. When you are finished you will report-out what you have learned.
Review the information in Appendix E that corresponds to the non-routine product your group was assigned.
You will have 20 minutes to familiarize yourselves with the product your group was assigned, and then you will give a 5-minute presentation to the class outlining its features and uses for emergency managers.
Your presentation should answer the following questions:
Who issues the product?
What is the purpose of the product?
Under what circumstances is the product issued?
How far into the future does the product project the forecast?
How can the product be used by Emergency Managers?

Student Activity Workbook G0271
Hazardous Weather and Flooding Preparedness October 2013 SAW-Page 11
Unit 5. Activity 6
Individual Activity: Selecting Forecast Products and Resources
In this activity, you will work individually to choose products that are appropriate for use in your community. Use the information provided by each group during their Group Activity: NWS Non-routine Products presentations as a reference. You will have 10 minutes to complete this activity. Be prepared to share your responses in a group discussion when you are finished.
List three hazardous weather events to which your community is particularly vulnerable.
List the forecast products that will help you be prepared for those events.
List the local resources that will help you be prepared for those events.

Student Activity Workbook G0271
Hazardous Weather and Flooding Preparedness October 2013 SAW-Page 12
Unit 5. Activity 7
Questions for Consideration
What office is your primary access point for obtaining NWS weather information?
What NWS office is best equipped to provide guidance on flooding and flash floods?
From what office do you obtain watches, warnings, and advisories for the local area?
Name four dissemination networks for NWS information?
What is the main factor that limits forecast accuracy?
As an Emergency Manager, what steps would you take after you receive a Tornado Watch?
As an Emergency Manager, what steps would you take after you receive a flood warning?

Student Activity Workbook G0271
Hazardous Weather and Flooding Preparedness October 2013 SAW-Page 13
Unit 6. Activity 8
Individual Activity: Analyzing Threats
During this activity, you will work independently to complete an analysis of a specific hydrometerological event using threat analysis worksheets. Then, you will evaluate how effective your community’s EOP is for addressing the event.
You may refer to your local EOP, the Student Manual Appendices, and any other references you wish to complete this activity, following the instructions below:
Complete the Analyzing Threats worksheets for the hydrometeorological event selected for this activity.
For each factor listed, complete the analysis and comment in the columns provided on the worksheets.
o Note: To fully and accurately complete the analysis, you will need access to historical data for your jurisdiction. For the purposes of this class, complete the tables to the best of your ability with all known information.
o These tables can serve as a good starting point for a full analysis when you return home to your jurisdiction.
When you have completed the worksheets, answer the questions on the Summary Worksheet about your community’s local planning and response capability.
Be prepared to discuss your responses with the class.
You will have 45 minutes to complete this activity.

Student Activity Workbook G0271
Hazardous Weather and Flooding Preparedness October 2013 SAW-Page 14
ANALYZING THREATS
THREAT ANALYSIS WORKSHEETS
Threat: ___________________
Climatological Factors
Analysis Area Potentially
Impacted Comments
Maximum probable event or most likely significant threat
State
Region
County
Community
Worst ever event
(Record precipitation, temperature, winds, flood crest, flood volume, destruction, etc.)
Record levels:
Duration:
Deaths:
Injuries:
Damage:
State
Region
County
Community
Average frequency of occurrence
State
Region
County
Community
Average loss per year from this type of event
Deaths:
Injuries:
Property:
Other:
State
Region
County
Community
Percentile chance of occurrence
State
Region
County
Community
Months of peak occurrence
J F M A M J
J A S O N D
State
Region
County
Community

Student Activity Workbook G0271
Hazardous Weather and Flooding Preparedness October 2013 SAW-Page 15
ANALYZING THREATS
THREAT ANALYSIS WORKSHEETS (CONTINUED)
Threat: ___________________
Population Vulnerabilities Analysis Comments
Concentrations in vulnerable areas
Total population: Concentrated areas:
Awareness level (for the type of event)
Low
Medium
High
Sources for public information:
Previous response experience (for the type of event)
None
Moderate
Extensive
Level of responsiveness to warnings:
Little
Moderate
High
Special needs groups Hearing impaired
Physically impaired
Non-English speaking
Elderly
Tourist
Other:
Implications for
Warning:
Response:
Risk associated with population distribution
Floodplain
Storm surge inundation area
Canyon
Mudslide area
Avalanche
Isolated
Other:
Other risk factors affecting the population
Seasonal shift
Time-of-day shift
Day-of-week shift

Student Activity Workbook G0271
Hazardous Weather and Flooding Preparedness October 2013 SAW-Page 16
Property Vulnerabilities Analysis Comments
Do building codes promote hazard-resistant construction?
Yes
No
Somewhat
Potential code related issues:
Are the building codes strictly enforced?
Yes
No
Somewhat
Are there concentrations of properties that are vulnerable to specific events (e.g., beachfront properties)?
Yes
No
Describe (facility, location, and risk):
Are there facilities that pose a risk of “cascading” events (e.g., hazardous materials facilities)?
Yes
No
Describe (facility, location, and risk):
What critical facilities are located in the community?
Fire Stations
Police precincts
Public works yards
Water treatment facilities
Utilities substations
Government buildings
Shelters
EOC
Other:
Consider:
Location
Construction
Age
Use/Population Present
What other key facilities exist in the community?
Hospitals/nursing homes
Schools/universities
Convention centers, stadiums, arenas
Military installations
Other:
Consider:
Location
Construction
Age
Use/Population Present
Student Activity Workbook G0271
Hazardous Weather and Flooding Preparedness October 2013 SAW-Page 17
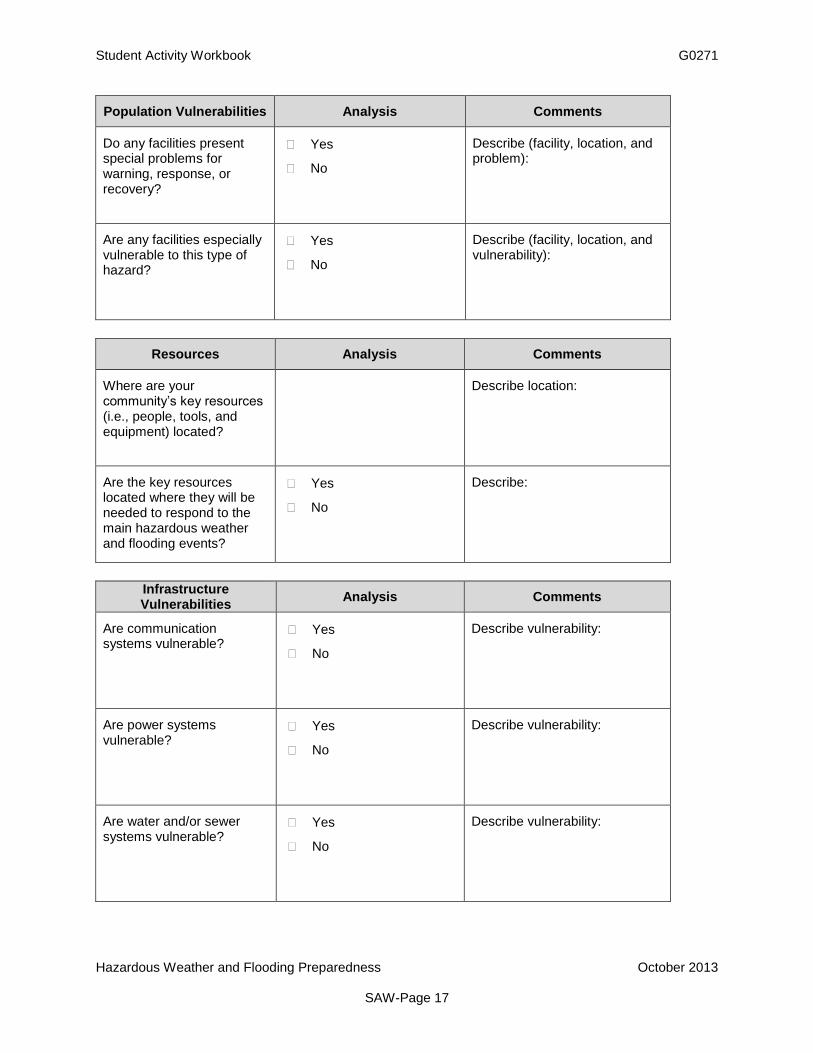
Population Vulnerabilities Analysis Comments
Do any facilities present special problems for warning, response, or recovery?
Yes
No
Describe (facility, location, and problem):
Are any facilities especially vulnerable to this type of hazard?
Yes
No
Describe (facility, location, and vulnerability):
Resources Analysis Comments
Where are your community’s key resources (i.e., people, tools, and equipment) located?
Describe location:
Are the key resources located where they will be needed to respond to the main hazardous weather and flooding events?
Yes
No
Describe:
Infrastructure Vulnerabilities
Analysis Comments
Are communication systems vulnerable?
Yes
No
Describe vulnerability:
Are power systems vulnerable?
Yes
No
Describe vulnerability:
Are water and/or sewer systems vulnerable?
Yes
No
Describe vulnerability:

Student Activity Workbook G0271
Hazardous Weather and Flooding Preparedness October 2013 SAW-Page 18
Infrastructure Vulnerabilities
Analysis Comments
Are transportation systems (including bridges, tunnels, and rail lines) vulnerable?
Yes
No
Describe vulnerability:
Is the community dependent on vulnerable transportation routes for evacuation, rescue, etc.?
Yes
No
Identify vulnerable routes and preparedness options:
Does the community’s infrastructure pose any special threats for warning, response, and/or recovery?
Yes
No
Identify threats for
Warning
Response
Recovery
Geography And
Topography Analysis Comments
Do geographic/topographic features add to the jurisdiction’s vulnerability (e.g., mountain effects, floodplains, lake effect, altitude, etc.)?
Yes
No
Describe the impact caused by geography and/or topography:

Student Activity Workbook G0271
Hazardous Weather and Flooding Preparedness October 2013 SAW-Page 19
ANALYZING THREATS
SUMMARY WORKSHEET
Based on your analysis of the event, as completed on the previous pages, review your community’s Emergency Operations Plan (EOP) and answer the questions below.
Is the event that you analyzed part of the EOP’s hazard analysis? (If yes, under what category of hazard does it fall?)
YES NO
Does your EOP adequately address your community’s ability to:
Warn the public of the risk?
Notify the public of the actions they should take?
Respond to the event?
Does your EOP include timeframes for all key decision points required to respond to this event (e.g., notification of key personnel, warnings to the public, deployment of resources, etc.)?
Do you have access to the main sources of information about the event? (If no, what sources of information do you need? How can you gain access to them?)
Is access available only at a single point? If yes, how is it disseminated?

Student Activity Workbook G0271
Hazardous Weather and Flooding Preparedness October 2013 SAW-Page 20
Unit 7. Activity 9
Activity: Severe Summer Storms
General Notes
Please read the following general notes about this activity before you begin:
This activity has been developed to emphasize important elements associated with hazardous weather planning and preparedness.
Consider your own EOPs as if they were for the affected area.
While working through the discussion questions in this activity, you may refer to the NWS Reference Guidebook, your local EOP, or any other materials at your disposal.
You will receive updates as the situation evolves.
Instructions
This activity presents a scenario that will require you to make decisions about how to respond to a hazardous weather event.
Consider the community information and refer to the maps and NWS products provided.
Discuss the following questions and record your group’s responses.
Choose a spokesperson to share your group’s responses.
Student Activity Workbook G0271
Hazardous Weather and Flooding Preparedness October 2013 SAW-Page 21
Scenario: Discussion Questions #1
1. What course of action would you take considering the convective outlooks?
2. Would you activate any portion of your EOP? If so, which ones?
3. What would you do to continue to monitor this situation?
4. Would you be in contact with your local NWS office? If so, how would coordination take place?
5. What preparedness actions would you take with your community (outside of those in your EOP)?

Student Activity Workbook G0271
Hazardous Weather and Flooding Preparedness October 2013 SAW-Page 22
Scenario: Discussion Questions #2
1. What course of action would you take considering the updated convective outlooks and additional weather information?
2. Based on the scenario, would you consider this forecasted weather event “routine” or “unusually strong” for your area?
3. If you have not yet activated any portion of your EOP, would you activate it now? If so, which portions?
4. What would you do to continue to monitor this situation?
5. Would you be in contact with your local NWS office? If so, how would coordination take place?
6. What public entities would you notify of the current hazards? How will you notify them?
7. What additional preparedness actions would you take with your community (outside of those in your EOP)?

Student Activity Workbook G0271
Hazardous Weather and Flooding Preparedness October 2013 SAW-Page 23
Scenario: Discussion Questions #3
1. What course of action would you take with the issuance of the PDS Severe Thunderstorm Watch?
2. What specific hazards are you concerned with based on the watch text and storm arrival timeline?
3. If you have not yet activated any portion of your EOP, would you activate it now? If so, which portions?
4. What would you do to continue to monitor this situation?
5. Would you be in contact with your local NWS office? If so, how would coordination take place?
6. How will you continue to notify your partners and the public as warnings are issued? How does this change with loss of critical infrastructure such as power and radio systems?
7. What additional preparedness actions would you take with your community (outside of those in your EOP)?

Student Activity Workbook G0271
Hazardous Weather and Flooding Preparedness October 2013 SAW-Page 24
Scenario: Discussion Questions #4
1. Numerous severe thunderstorm warnings and several flash flood warnings are issued for your area. What challenges do you face with the following?
a. Flooded roadways
b. Downed trees & power lines
c. Loss of communications (radio and cellular)
2. If you have not yet activated any portion of your EOP, would you activate it now? If so, which portions?
3. Would you be in contact with your local NWS office? If so, how would coordination take place?
4. How will you continue to notify your partners and the public?
5. What additional actions would you take with your community (outside of those in your EOP)?
6. Did you feel you had enough information to prepare for what is occurring?

Student Activity Workbook G0271
Hazardous Weather and Flooding Preparedness October 2013 SAW-Page 25
Dew Point Conversion Chart
To convert relative humidity and temperature to dew point, find the closest value in the table for relative humidity. Use the corresponding formula with temperature to calculate dew point.
RH = relative humidity DP = dew point T = temperature (ºF)
RH (%) DP (ºF)
97 T – 1
94 T – 2
91 T – 3
88 T – 4
85 T – 5
82 T – 6
79 T – 7
76 T – 8
73 T – 9
70 T – 10
68 T – 11
66 T – 12
64 T – 13
62 T – 14
60 T – 15
58 T – 16
56 T – 17
54 T – 18
52 T – 19
50 T – 20
For example, if relative humidity is 70% and the temperature is 65ºF the dew point can be calculated by using the formula in the chart row corresponding to RH = 70, which is T-10. This gives a dew point of 65ºF - 10ºF = 55ºF.