G R E A T R I V E R E N E R G Y 2 0 1 3
59
GREAT RIVER ENERGY 2013 ANNUAL REPORT
Transcript of G R E A T R I V E R E N E R G Y 2 0 1 3
G R E A T R I V E R E N E R G Y 2 0 1 3
A N N U A L R E P O R T
655,000 homes, farms and businesses served by
4,660 miles of transmission line,
12 power plants and
880 employees for
28 member cooperatives focused on
1 vision
KEEP COOPERATIVE ENERGY COMPETITIVE

C O N T E N T S
Letter to stakeholders . . . . . . . . . . . . . . . . . . . . . . . . . . 2
About Great River Energy . . . . . . . . . . . . . . . . . . . . . . 4
Reliable resources . . . . . . . . . . . . . . . . . . . . . . . . . . . . 6
Generation: Energy that never stops . . . . . . . . . . . . 8
Transmission: Wired to serve . . . . . . . . . . . . . . . . . . 12
Members: Partners in power . . . . . . . . . . . . . . . . . . 16
2013 financial report . . . . . . . . . . . . . . . . . . . . . . . . . . 20
Management and board of directors . . . . . . . . . . . 56

During periods of uncertainty, a company can choose to wait for clarity or take action.
Great River Energy has thrived in recent years because we have discovered opportunities within the challenges facing our industry. We are beginning to see returns from actions taken, and we continue to enact strategies to improve our position in the future.
The challenges facing our industry have not changed. But, together with our member
cooperatives, Great River Energy enters 2014 better prepared to face them.
In many ways, 2013 was among the best financial years in our history. Our margin exceeded budget by more than $10 million, and we were able to budget for no rate increase in 2014.
Our success was the result of the prudent strategies we adopted in response to a trend of flat energy sales over the previous five years. Among the most significant actions were our reduced capital spending plans and heightened focus on reducing
Michael Thorson
Great River Energy Board Chair
David Saggau
Great River Energy President and CEO
EFFICIENT POWER GENERATION
RELIABLE TRANSMISSION
STRONG FINANCES
L E T T E R T O S TA K E H O L D E R S
2

expenses in our daily operations. Those savings are reinforced through our business improvement program, which systematically encourages employees to pursue efficiencies in their work.
Great River Energy’s board of directors and company leaders understand that the strategies that helped us in recent years will not be enough to keep us competitive in the years ahead. That is why we have already taken actions to improve our position in the future.
Our board of directors passed a resolution in July to mitigate business risk associated with pending greenhouse gas regulations. That resolution resulted in immediate actions, including accelerating the depreciation of Great River Energy’s Coal Creek Station and Stanton Station. The resolution also charged Great River Energy with engaging in the development of the regulations to minimize rate impacts and ensure reliable electric service.
Although there are still uncertainties ahead of us, we are seeking clarity through engagement. This fall, we invited several of our external stakeholders to Great River Energy to discuss our business and the challenges we are facing, and to understand their views on pressing issues. By welcoming the perspectives of end-use consumers, financial institutions, low-income advocates and environmental nonprofit organizations, we gained valuable insight into the priorities of those with a vested interest in cooperative electricity in Minnesota.
We are determined to act strategically in the best interests of our members, and not
to wait for outside forces to dictate our decisions. As regulatory proposals are discussed, we are analyzing potential effects on our business and working with a variety of organizations to collaborate on solutions to further the position of Great River Energy and our member cooperatives. While we monitor and influence what lies ahead for our industry, we are also taking action to thrive in the current environment.
The positive results of the past year are not an end result. They are a signal of positive progress and a step toward our mission to continue providing members with reliable energy at affordable rates in harmony with a sustainable environment.
Fifteen years ago, two generation and transmission cooperatives looked far into the future and recognized that they could be better united than apart, so they formed Great River Energy. That same culture of long-term thinking continues to exist at Great River Energy to this day.
The men and women who care for our generation and transmission resources have the training and experience to maintain our system to exacting standards, while working safely. Our member cooperatives and board of directors have the confidence and motivation to improve our operations and financial performance.
Great River Energy exists because our two predecessor companies recognized a better way to achieve their goal of providing reliable, low-cost power to their member distribution cooperatives. Our success in 2013 is the result of a continued focus on that same goal.
Our margin exceeded budget by more than $10 million, and we were able to budget for no rate increase in 2014.
3

GREAT RIVER ENERGY IS A NOT-FOR-PROFIT COOPERATIVE
WHICH PROVIDES WHOLESALE ELECTRIC SERVICE TO
28 DISTRIBUTION COOPERATIVES IN MINNESOTA AND
WISCONSIN. THOSE MEMBER COOPERATIVES DISTRIBUTE
ELECTRICITY TO APPROXIMATELY 655,000 MEMBER
ACCOUNTS – OR ABOUT 1.7 MILLION PEOPLE. WITH
$3.7 BILLION IN ASSETS, GREAT RIVER ENERGY IS THE
SECOND LARGEST ELECTRIC POWER SUPPLIER IN
MINNESOTA AND ONE OF THE LARGEST GENERATION AND
TRANSMISSION COOPERATIVES IN THE UNITED
STATES. GREAT RIVER
ENERGY’S MEMBER
COOPERATIVES RANGE
FROM THOSE IN THE OUTER-
RING SUBURBS OF THE TWIN CITIES
TO THE ARROWHEAD REGION OF
MINNESOTA TO THE FARMLAND OF
SOUTHWESTERN MINNESOTA. GREAT
RIVER ENERGY’S LARGEST DISTRIBUTION
COOPERATIVE SERVES MORE THAN 125,000
MEMBER-CONSUMERS; THE SMALLEST
SERVES ABOUT 2,500. LEARN MORE AT
GREATRIVERENERGY.COM.
OUR MEMBER COOPERATIVES
A B O U T G R E AT R I V E R E N E R G Y
4

Member Cooperative Summary
Number of member accounts . . . . . . . . . 655,000
Sales to members . . . . . 12,105,295 megawatt hours
Total distribution line . . 88,000 miles
Average density 7.5 consumers/mile
Distribution substations . . . . . . . . 553
Combined annual revenue . . . . . . . . . . . . . . $1.35 billion
Electric plant in service (net) . . . . . . . . . . . $1.9 billion
Average kilowatt hours per account . . . . . . . . . 18,000/year
Distribution employees . . . . . . 1,575
Great River Energy 2013
Financial Highlights
Revenue . . . . . . . . . . . $980.4 million
Total assets . . . . . . . . . . . $3.7 billion
Utility plant investment (net) . . . . . . . . $2.7 billion
Long-term obligations, including current maturities . . . . . . $2.7 billion
Systemwide Load
Characteristics*
Residential . . . . . . . . . . . . . . . . . 55.6%
Seasonal . . . . . . . . . . . . . . . . . . . . 1.6%
Commercial, industrial and other . . . . . . . . . . . . . . . . . . 42.8%
*Based on energy sales
5

Coal Creek StationLocation: Underwood, N.D.Generating capability: 1,142 MWStart of operation: Unit 1, 1979; Unit 2, 1980Fuel: Lignite coal and DryFineTM
lignite coal
Elk River Energy Recovery StationLocation: Elk River, MinnesotaGenerating capability: 31 MWStart of operation: Units 1 & 2, 1951; Unit 3, 1959Fuel: Refuse-derived fuel
Stanton StationLocation: Stanton, N.D.Generating capability: 187 MWStart of operation: Unit 1, 1966; Unit 10, 1982Fuel: Powder River Basin coal
Lakefield Junction StationLocation: Martin County, MinnesotaGenerating capability: 522 MW (summer)Start of operation: 2001Fuel: Natural gas; backup, fuel oil
GENERATION
2
1 4
7
Spiritwood StationLocation: Jamestown, N.D.Generating capability: 99 MW Start of operation: November 2014Fuel: DryFine lignite coal
3
345 kV 75 mi500 kV 70 mi±400 kilovolt (kV) DC 436 mi
PROVIDING DEPENDABLE
WHOLESALE ELECTRICITY TO
GREAT RIVER ENERGY’S
MEMBER COOPERATIVES
REQUIRES A WELL
MAINTAINED AND FLEXIBLE
RESOURCE PORTFOLIO THAT
INCLUDES GENERATION
FACILITIES OF A VARIETY OF
SIZES AND FUEL TYPES AND A
WIDESPREAD NETWORK OF
TRANSMISSION LINES.
GREAT RIVER ENERGY
MAINTAINS 4,660 MILES OF
TRANSMISSION LINE AND
OWNS OR PARTIALLY OWNS 102
TRANSMISSION SUBSTATIONS.
R E L I A B L E R E S O U R C E S
TRANSMISSION
6

Arrowhead Emergency Generation StationLocation: Cook County, MinnesotaGenerating capability: 18 MWFuel: Fuel oil
Trimont WindPurchase: 100 MW (nameplate) Turbine: 67 General Electric 1.5-MW wind turbines
Elm Creek WindPurchase: 99 MW (nameplate) Turbine: 66 General Electric 1.5-MW wind turbines
Prairie Star WindPurchase: 101 MW (nameplate) Turbine: 61 Vestas 1.65-MW wind turbines
Ashtabula II WindPurchase: 51 MW (nameplate) Turbine: 34 General Electric 1.5-MW wind turbines
Endeavor I WindPurchase: 100 MW (nameplate) Turbine: 40 Clipper 2.5-MW wind turbines
St. Bonifacius StationLocation: St. Bonifacius, MinnesotaGenerating capability: 56 MW (summer) Fuel: Fuel oil
Rock Lake StationLocation: Pine City, Minnesota Generating capability: 19 MW (summer) Fuel: Fuel oil
Maple Lake StationLocation: Maple Lake, Minnesota Generating capability: 19 MW (summer)Fuel: Fuel oil
Elk River Peaking StationLocation: Elk River, MinnesotaGenerating capability: 185 MW* (summer)Start of operation: 2009Fuel: Natural gas; backup, fuel oil
Cambridge StationLocation: Cambridge, Minnesota Generating capability: 177 MW* (summer)Start of operation: 2007Fuel: Fuel oil (Unit 1), and natural gas (Unit 2)
Pleasant Valley StationLocation: Mower County, MinnesotaGenerating capability: 408 MW (summer)Start of operation: Units 11 & 12, 2001; Unit 13, 2002Fuel: Natural gas; backup, fuel oil
5 6
8
9
OTHER ASSETSBlue Flint EthanolBlue Flint Ethanol is a biorefinery that uses process steam from the nearby Coal Creek Station power plant to produce 65 million gallons of ethanol per year.
Elk River Resource Processing PlantMunicipal solid waste is processed to create refuse-derived fuel (RDF) for powering Great River Energy’s Elk River Energy Recovery Station. Up to 300,000 tons of waste is transformed into RDF each year.
Other wind energy purchases: 17 MW (nameplate) from four Minnesota wind farms.Location: Jackson, Dodge and Murray counties.
Generating capability based on Summer Net Dependable Capacity per NERC Generating Availability Data System for the 2014 - 2015 planning year.*Based on the 2013 - 2014 planning year.
69 kV or less 3,024 mi115 kV 468 mi161 kV 46 mi230 kV 523 mi
10
11
13
14
15
16
17
12
7

Great River Energy’s peaking plants are meticulously maintained so they are ready to produce electricity immediately when demand increases. Peaking Plant Operator Tech Kevin Beske performs maintenance checks at Pleasant Valley Station near Dexter, Minnesota.
Flexible generation resources, dependable fuel supplies, second-to-none maintenance and an ever-present focus on the safety of employees and members add up to the quality of service Great River Energy provides for its member cooperatives.
ENERGY THAT NEVER STOPS
8

uilt on a foundation of two workhorse coal-based power plants complemented by peaking stations and widespread renewable resources, Great River Energy’s generation portfolio has been crafted over decades for reliability, affordability and environmental performance. Each source is important to meet demand for electricity while producing revenue for Great River Energy and its member cooperatives.
Over the past five years, Great River Energy’s coal-based resources have been available to generate electricity nearly 93 percent of every year, which consistently exceeds the averages of other power plants in the region.
Such remarkable plant performance is due to the diligent maintenance performed by Great River Energy employees. In 2013, one of the two units at Great River Energy’s Coal Creek Station power plant successfully completed a major scheduled outage to perform preventive maintenance, inspections and repairs. Taking a plant offline at regular intervals to perform maintenance is vital to ensure that the plant continues to operate reliably.
Bright future for renewable resourcesThe Elk River Resource Recovery Project consists of two facilities: one that processes municipal solid waste to create a burnable fuel and a power plant that produces renewable energy from the resulting refuse-derived fuel. Great River
Energy renewed its contract with Hennepin County to receive up to 100,000 tons of solid waste for the next five and a half years to supply fuel to the facilities.
The contract ensures a dependable supply of waste, allowing the entire project to operate efficiently. The project generates revenue for Great River Energy by selling steel, aluminum and other valuable materials removed from the waste for recycling, and by selling electricity into the market.
Great River Energy signed a 200-megawatt seasonal diversity exchange with Manitoba Hydro of Winnipeg, extending a 150-megawatt arrangement that has been in place between the two utilities since 1995. The diversity exchange means Manitoba Hydro will provide 200 megawatts of renewable hydroelectric capacity to Great River Energy in the summer to meet its energy needs, while Great River Energy will provide Manitoba Hydro with 200 megawatts of capacity during the winter. Each utility receives the additional energy during its peak period of the year. The new agreement runs until 2030.
New solar panels will be installed next to the Great River Energy headquarters
B
9
Great River Energy’s power supply portfolio consists of a diverse mix of energy sources.
The Elk River Resource Processing Plant uses specialized equipment to pull steel and aluminum out of household garbage to be recycled. Each year, the facility removes 9,000 tons of steel – roughly as much as the Eiffel Tower – and 1,500 tons of aluminum – the equivalent of 100 million pop cans.
facility in Maple Grove, Minnesota, in 2014 and throughout the organization’s service area through 2015. The first construction project is a 250 kilowatt solar array slated for land south of Great River Energy’s headquarters facility and will include a mix of technologies to help determine how small solar energy installations can be integrated into cooperative systems.
Great River Energy is working with its member cooperatives to identify potential sites for 20 kilowatt solar installations in their communities.
Progress through researchAt any given time, Great River Energy is involved in several research projects at its generation facilities. The projects range from studies aimed at reducing emissions of mercury, nitrogen oxides and sulfur dioxide to tests for new maintenance practices. Research helps the cooperative
stay aware of innovations in a rapidly changing industry.
By collaborating with research organizations and other utilities, Great River Energy gains more from its research dollars than it ever could acting alone. These alliances give Great River Energy access to a larger body of knowledge and provide opportunities to develop key contacts. The benefits of research include the DryFining™ technology that was installed at Coal Creek Station in 2009.
Developed with financial assistance from the U.S. Department of Energy, DryFining technology is a lignite coal refining process that has yielded environmental, efficiency and maintenance benefits. In 2013, Great River Energy executed a DryFining License and Technology Transfer Agreement with Tangshan Shenzhou Manufacturing Company to make the technology available to utilities in China.
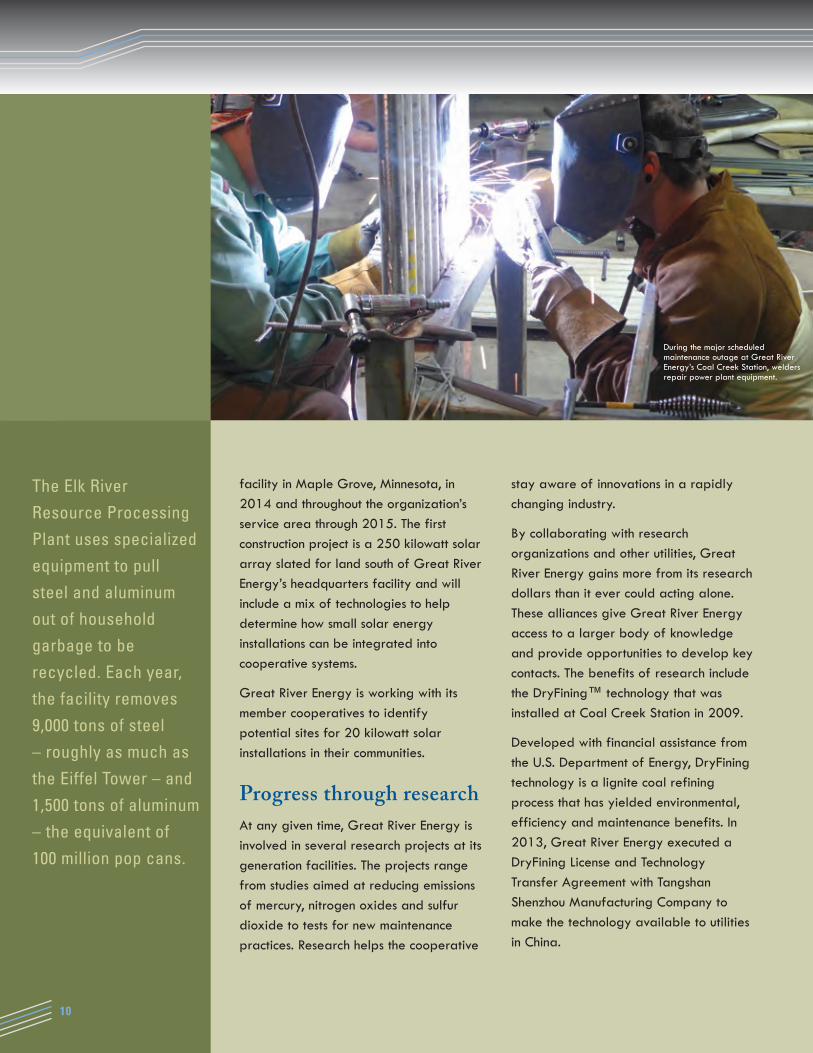
During the major scheduled maintenance outage at Great River Energy’s Coal Creek Station, welders repair power plant equipment.
10
New ventures keep energy competitiveAside from electricity, Great River Energy’s generation facilities produce a variety of other products and services, ranging from ethanol to corn drying, that increase revenue. In a cooperative business model, that revenue directly offsets plant costs. Revenue from steam, water, ash and other products and services marked 2013 as a record year in value created for the membership to benefit overall member rates.
Located adjacent to Coal Creek Station near Underwood, North Dakota, Blue Flint Ethanol is the first co-located, directly integrated biorefinery in North America – and one of the most cost-effective, energy efficient and environmentally friendly biorefineries in the country. By purchasing steam from Great River Energy, Blue Flint Ethanol saved initial capital by not building a gas-fired boiler. The flexible steam supply also contributes other annual operating benefits while Great River Energy enjoys the steam sales revenue.
Construction is underway for Dakota Spirit AgEnergy, a new biorefinery to be co-located next to Spiritwood Station, a combined heat and power plant near Jamestown, North Dakota. The Dakota Spirit AgEnergy biorefinery will begin commercial operation by the second quarter of 2015. Completing its investment fund raising substantially during 2013, about half of the construction investment is coming from international investors through the EB-5 program. The biorefinery will utilize steam from Spiritwood Station in a configuration similar to Blue Flint Ethanol’s, and will produce 65 million gallons of ethanol per year, as well as distillers grains and distillers oil.
Both biorefineries are owned by Midwest AgEnergy Group, an Upper Midwest biofuels enterprise owned by Great River Energy and other private accredited investors, both agricultural and corporate.
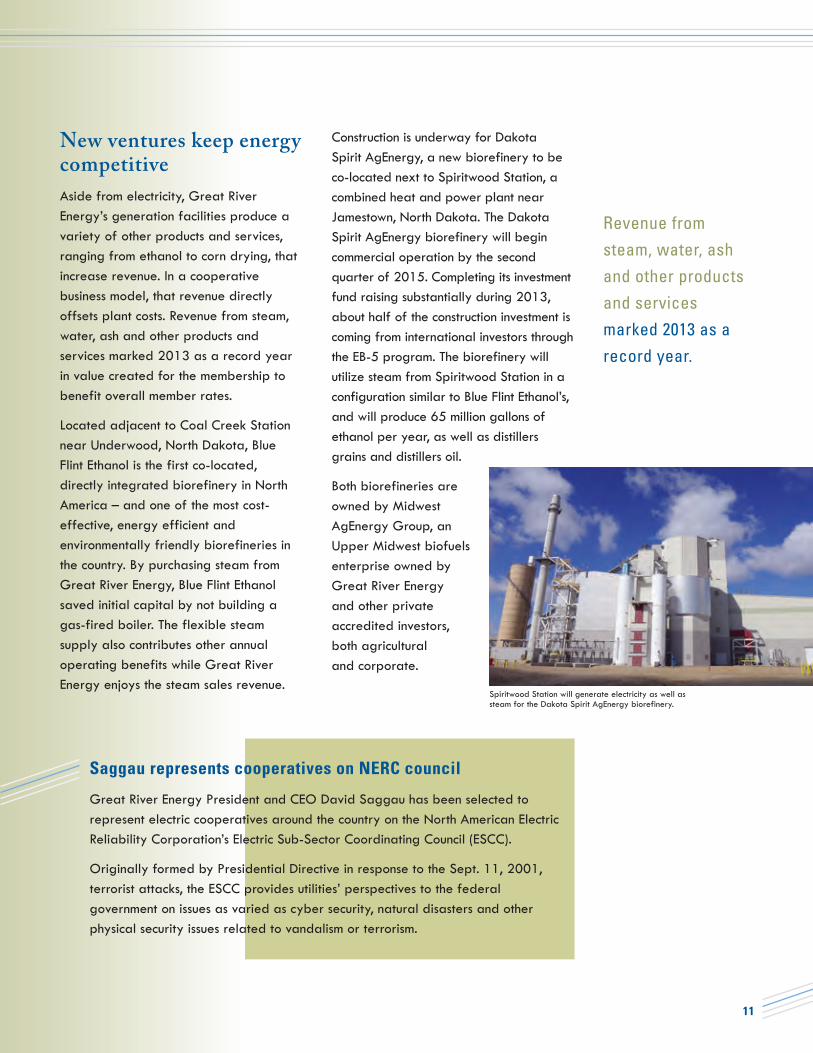
Spiritwood Station will generate electricity as well as steam for the Dakota Spirit AgEnergy biorefinery.
11
Revenue from steam, water, ash and other products and services marked 2013 as a record year.
Saggau represents cooperatives on NERC council
Great River Energy President and CEO David Saggau has been selected to represent electric cooperatives around the country on the North American Electric Reliability Corporation’s Electric Sub-Sector Coordinating Council (ESCC).
Originally formed by Presidential Directive in response to the Sept. 11, 2001, terrorist attacks, the ESCC provides utilities’ perspectives to the federal government on issues as varied as cyber security, natural disasters and other physical security issues related to vandalism or terrorism.

Through carefully constructed and maintained transmission resources, Great River Energy and its member cooperatives consistently deliver exactly the right amount of power to farms, factories and families.
WIRED TO SERVE
Great River Energy Line Technician J.R. McGuire works to remove capacitors containing polychlorinated biphenyls, a potentially harmful material, from Dickinson Station near Buffalo, Minnesota.
12

roducing electricity is only the first step in providing reliable service. Great River Energy must also deliver power through its transmission system. Year after year, Great River Energy’s transmission system is highly reliable, and 2013 was no different.
Great River Energy tracks the reliability of its transmission system using industry-standard indices which measure how often outages occur and how long they last. In 2013, Great River Energy recorded about half of the typical number of momentary outages, ranking it among the best years in the cooperative’s history. Momentary outages are those lasting less than one minute.
Two bouts of extreme weather in the first half of the year significantly affected Great River Energy’s year-end results for total outage hours. A major ice storm April 9-11 and a thunderstorm outbreak June 21-22 accounted for about three-quarters of the total outage time in 2013. That said, Great River Energy’s system was extremely reliable.
New lines for new needsDue to northern Minnesota homeowners increasingly converting from propane to electricity for space heating, the electric transmission system in the region has become strained to its limit. The system must be built to handle the periods of highest electricity use, which now occur in the winter.
Two projects are underway to bring relief to the constrained region surrounding
Grand Rapids, Minnesota. A new transmission line will link a much-needed substation to the local grid, while a second enhancement will increase the capacity of approximately 38 miles of an existing 69-kilovolt transmission line.
Advancing grid technologyGreat River Energy and two of its member cooperatives, Lake Region Electric Cooperative of Pelican Rapids, Minnesota, and Minnesota Valley Electric Cooperative of Jordan, Minnesota, have collaborated on a demonstration project to pilot technologies designed to enable future utility programs and services.
After nearly 18 months of development, the completely new “smart grid” systems delivered the business and technical functionality ready for demonstration and testing. The project illustrates the potential business value that Great River Energy and its member cooperatives can gain from using technology to improve meter data management and demand response management.
The three cooperatives will continue working to improve the technology and establish business practices to uncover additional value from the new capabilities.
The project was coordinated by the National Rural Electric Cooperative Association’s Cooperative Research Network and is funded in part by a U.S. Department of Energy grant.
P
13
In 2013, Great River Energy recorded about half of the typical number of momentary transmission outages.

THE BENEFITS OF CapX2020
GENERATION
The new lines will open pathways to centers of high energy use from areas of power generation, including remote areas with strong wind resources. They will also make the energy market work more efficiently.
RELIABILITY
These high-voltage transmission links assure that wide area reliability will be maintained and make the system less susceptible to disturbances.
ECONOMIC DEVELOPMENT
CapX2020 is an approximately $2 billion investment that will create 8,000 jobs during peak construction and $3.9 billion in total economic impact.
Serving the region at largeFor decades, electric utilities built transmission lines to serve only their customers. That changed over the past decade as regional transmission operators were formed as independent, third-party bodies to oversee and grant access to the grid while creating real-time energy markets.
As this evolution occurred, transmission development was needed to foster a more efficient and effective electricity market. These projects are known as regional transmission, and Great River Energy has spent the past several years involved in an extensive buildout of this kind.
Known as CapX2020, these lengthy high-voltage projects are needed to expand electric transmission and ensure continued reliable and affordable service. CapX2020 is a joint initiative of 11 utilities, and Great River Energy is construction lead on the 345-kilovolt, 240-mile transmission line spanning from Brookings County, South Dakota, to Hampton, Minnesota.
Technology speeds up power restorationEvery moment matters when electric service is interrupted to a home or business. Great River Energy and its member cooperatives are testing ways to use technology to boost system reliability by sharing real-time electric grid information.
The cooperatives are piloting a real-time data interface that will allow cooperatives to automate distribution outage processes and reduce restoration time.
The Chub Lake Substation, located in Scott County, Minnesota, is one of two new substations that were needed on the CapX2020 project between Brookings County, South Dakota, and Hampton, Minnesota.
14
A major ice storm in April accounted for a significant portion of total transmission outage time in 2013. Pictured here, crews restore service to a downed transmission line.

As regulatory proposals are discussed, a Great River Energy task force is analyzing potential effects on the business.
15
During the first half of 2014, federal greenhouse gas regulations are being drafted that have the potential to impose new and significant costs on the operations of electric utilities. As a utility that will be affected by the resulting regulations, Great River Energy is determined to be an active participant in their creation.
Anticipating the likely adoption of greenhouse gas regulations, the Great River Energy board of directors passed a resolution enacting a plan to mitigate the risk of the regulations. That resolution resulted in immediate actions, including
accelerating the depreciation of Great River Energy’s Coal Creek Station and Stanton Station. Great River Energy will depreciate these coal-based resources by 2028, which is significantly sooner than previously planned. The resolution also charged Great River Energy with reducing its reliance on coal-based electricity and managing carbon dioxide emissions to 2005 levels.
Great River Energy is also working with a variety of organizations to shape the proposed regulations to minimize their financial impact on Great River Energy and its members.
Engagement during policy discussions
Great River Energy’s Coal Creek Station power plant is located near Underwood, North Dakota, and generates electricity using DryFineTM lignite coal.

Great River Energy remains in tune with the communities it serves, and that applies to the communities where its 28 member distribution cooperatives operate and where Great River Energy has facilities and employees. Cooperatives find ways to foster thriving communities.
PARTNERS IN POWER
16
Great River Energy’s business improvement program encourages employees to streamline practices to keep rates affordable. In 2013, employees discovered an innovative way to correct a deficiency in vital emission control equipment at Coal Creek Station. The solution will save approximately $66 million in future capital spending. The effort involved many employees, including (left to right) Brian Freed, Skip Oberg, Gary Sawicki, Tyler Kinn and Ethan Vaagene.

lectric cooperatives focus on the needs of the communities they serve, and that goes far beyond providing electricity. In fact, this promise is included in the principles that guide all cooperative businesses. The “concern for community” cooperative principle states that while focusing on member needs, cooperatives must work for the sustainable development of the communities they serve.
Healthy communities and strong economies go hand in hand. A 2013 study showed that Great River Energy’s operations to supply wholesale power throughout greater Minnesota have far reaching positive effects on the region’s economy.
In an analysis of the company’s core operations, the University of Minnesota-Duluth found that Great River Energy has an average annual economic impact of more than $1 billion and 4,000 jobs.
Great River Energy and its member cooperatives work closely with the businesses they serve to ensure they can remain competitive by helping them use energy wisely and by offering ways to invest in their operations. Great River Energy often helps cooperatives pursue funding through the U.S. Department of Agriculture’s Rural Economic Development Loan and Grant program as well as other programs.
Cooperatives commended for conservationGreat River Energy has long worked with its member distribution cooperatives to offer programs that encourage end-use members to manage electricity costs through conservation and energy efficiency improvements. Helping members use energy wisely not only reduces their costs, but also contributes toward more efficient, affordable and reliable electric service.
Great River Energy coordinates a portfolio of programs with its members to encourage homeowners and businesses to replace outdated, inefficient equipment with newer, efficient installations. Programs encourage members to pursue efficient alternatives ranging from small upgrades, such as compact fluorescent light bulbs and LED holiday lights, to large installations, such as ground-source heat pumps, variable frequency drives and manufacturing process improvements.
At the end of 2013, Great River Energy received a letter of commendation from the Minnesota Division of Energy Resources for its 28 member cooperatives’ efforts to achieve Minnesota’s Conservation Improvement Program goal. The law calls for every utility in the state to work toward an energy savings goal that is equivalent to 1.5 percent of annual retail energy sales.
E
17
Great River Energy has an average annual economic impact of more than $1 billion and 4,000 jobs.
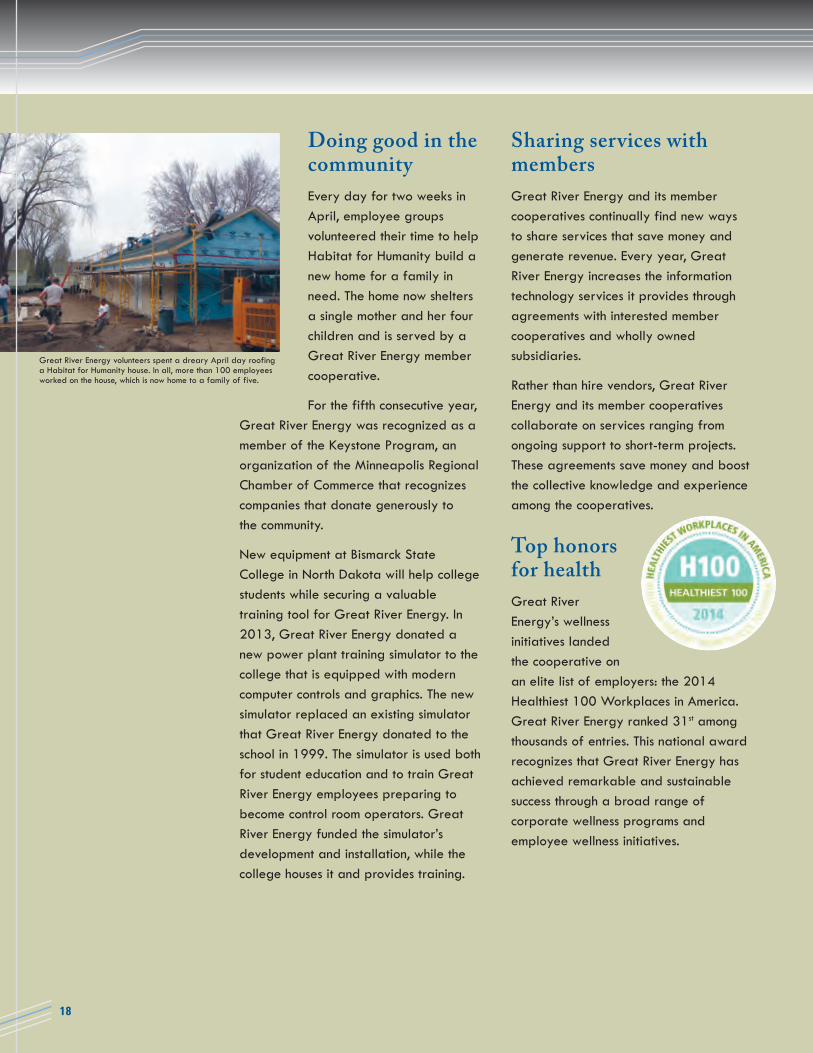
Doing good in the communityEvery day for two weeks in April, employee groups volunteered their time to help Habitat for Humanity build a new home for a family in need. The home now shelters a single mother and her four children and is served by a Great River Energy member cooperative.
For the fifth consecutive year, Great River Energy was recognized as a member of the Keystone Program, an organization of the Minneapolis Regional Chamber of Commerce that recognizes companies that donate generously to the community.
New equipment at Bismarck State College in North Dakota will help college students while securing a valuable training tool for Great River Energy. In 2013, Great River Energy donated a new power plant training simulator to the college that is equipped with modern computer controls and graphics. The new simulator replaced an existing simulator that Great River Energy donated to the school in 1999. The simulator is used both for student education and to train Great River Energy employees preparing to become control room operators. Great River Energy funded the simulator’s development and installation, while the college houses it and provides training.
Sharing services with membersGreat River Energy and its member cooperatives continually find new ways to share services that save money and generate revenue. Every year, Great River Energy increases the information technology services it provides through agreements with interested member cooperatives and wholly owned subsidiaries.
Rather than hire vendors, Great River Energy and its member cooperatives collaborate on services ranging from ongoing support to short-term projects. These agreements save money and boost the collective knowledge and experience among the cooperatives.
Top honors for healthGreat River Energy’s wellness initiatives landed the cooperative on an elite list of employers: the 2014 Healthiest 100 Workplaces in America. Great River Energy ranked 31st among thousands of entries. This national award recognizes that Great River Energy has achieved remarkable and sustainable success through a broad range of corporate wellness programs and employee wellness initiatives.
18
Great River Energy volunteers spent a dreary April day roofing a Habitat for Humanity house. In all, more than 100 employees worked on the house, which is now home to a family of five.

The Falkirk Mine in central North Dakota provides almost eight million tons of coal to Great River Energy’s Coal Creek Station power plant each year. The machinery and effort required to move the earth above the coal, and the coal itself, is immense. But arguably even more immense is the work that comes after the land has been mined.
Falkirk must return mined land to a diverse productive landscape – at least as productive and diverse as it was before mining started. Before it starts removing dirt, Falkirk conducts extensive surveys of the land to create an accurate record of the original composition and topography.
After reclamation, Falkirk must manage the land for at least 10 years from the initial vegetation seeding. Farmers keep careful records of the yields of reclaimed cropland so that Falkirk is able to show that the land has been returned to an equal or greater state of productivity than it was originally. Only then can the land be released from bond, removed from the permit and turned completely over to private or public land management.
Almost two-thirds of Falkirk’s total permitted acres are used by local farmers for agricultural production or grazing. Falkirk has received numerous state and national awards for its reclamation projects.
Providing energy, respecting nature
19
A North Dakota farmer tends to reclaimed cropland as a Falkirk Mine dragline works in the distance.
Mined land must be returned to a diverse productive landscape – at least as productive and diverse as it was before mining started.

FINANCIAL HIGHLIGHTS . . . . . . . . . . . . . . . . . . . . . . 22
FINANCIAL DISCUSSION AND ANALYSIS . . . . . . 22
MANAGEMENT REPORT . . . . . . . . . . . . . . . . . . . . . . 26
INDEPENDENT AUDITORS’ REPORT . . . . . . . . . . . . 27
CONSOLIDATED BALANCE SHEETS . . . . . . . . . . . . 28
CONSOLIDATED STATEMENTS
OF OPERATIONS . . . . . . . . . . . . . . . . . . . . . . . . . . . . . . 30
CONSOLIDATED STATEMENTS OF
COMPREHENSIVE INCOME . . . . . . . . . . . . . . . . . . . . 31
CONSOLIDATED STATEMENTS OF
CHANGES IN CAPITAL . . . . . . . . . . . . . . . . . . . . . . . . 31
CONSOLIDATED STATEMENTS
OF CASH FLOWS . . . . . . . . . . . . . . . . . . . . . . . . . . . . . 32
NOTES TO CONSOLIDATED
FINANCIAL STATEMENTS . . . . . . . . . . . . . . . . . . . . . 33
MANAGEMENT AND
BOARD OF DIRECTORS . . . . . . . . . . . . . . . . . . . . . . . . 56
C O N T E N T S
20

21
F I N A N C I A L R E P O R T 2 0 1 3

Great River Energy’s 2013 financial results were veryimpressive. Great River Energy exceeded its budgetedmargin of $32.0 million by $10.8 million, deferred memberrevenue of $13.8 million to offset future rates, returned apower cost adjustment (PCA) credit of $10.2 million to itsmembers, improved its equity to capitalization to 15.4percent, well on the way to Great River Energy’s targeted20 percent by 2020, maintained its investment gradecredit ratings, and sustained its strong liquidity. Theseimpressive results include unbudgeted additionaldepreciation related to Coal Creek Station and StantonStation of $10.0 million as the estimated service lives wereshortened to the year 2028. This decision affords GreatRiver Energy flexibility as future operating strategies aredeveloped in these changing times. The results of 2013continue to strengthen Great River Energy’s financialposition and prepare the cooperative for the future.
MARGINSNet margin attributable to Great River Energy for the yearended December 31, 2013, was $42.8 million and includesthe net income from Blue Flint Ethanol LLC (Blue Flint) of$10.0 million and Coal Creek Drying & Storage (CCD&S)of $0.6 million. This compares to a budget of $32.0 millionfor 2013 and actual results of $45.4 million for 2012.Great River Energy’s indenture requires the maintenance ofa margin-for-interest (MFI) ratio of 1.1x in order to issueadditional secured debt. In addition, Great River Energy’sboard of directors targeted a debt service coverage (DSC)ratio of 1.17x when setting member rates for 2013. GreatRiver Energy’s 2013 operations produced an MFI of 1.24xand a DSC of 1.22x.
ELECTRIC REVENUEElectric revenue increased $48.4 million or 5.6 percent to$918.0 million in 2013 from $869.6 million in 2012.Electric revenue from member cooperatives was $835.7million during 2013, an increase of $35.4 million or 4.4percent from $800.3 million in 2012. The member revenueincrease was due to increased member energy anddemand unit sales of 3.0 percent and 1.8 percent,respectively, compared to 2012, and a planned wholesalerate increase. Member revenue was reduced for a PCAcredit of $10.2 million and the deferral of memberrevenue of $13.8 million under regulatory accounting. ThePCA allows Great River Energy to bill or credit differencesbetween actual and budgeted results in MidcontinentIndependent System Operator (MISO) market activity,
22
2 013 2 012 Change
OPERATIONSRevenues $ 980.4 $ 921.2 $ 59.2Purchased Power $ 196.4 $ 167.8 $ 28.6Fuel $ 225.7 $ 217.9 $ 7.8Other Operating Expenses $ 279.9 $ 250.4 $ 29.5Depreciation and Amortization $ 115.6 $ 100.5 $ 15.1Interest Expense $ 134.1 $ 143.8 $ (9.7)Other Income $ 3.4 $ 4.5 $ (1.1)Nonutility Operations, Excluding Variable Interest Entity $ 10.7 $ 0.1 $ 10.6Net Margin Attributable to GRE $ 42.8 $ 45.4 $ (2.6)FINANCIAL POSITIONElectric Plant and Plant Held for Future Use $ 4,079.3 $ 3,994.8 $ 84.5Utility Plant - net $ 2,743.9 $ 2,683.6 $ 60.3Deferred Charges $ 215.9 $ 225.1 $ (9.2)Cash and Cash Equivalents $ 271.6 $ 323.1 $ (51.5)Total Assets $ 3,704.4 $ 3,689.8 $ 14.6Long-term Obligations $ 2,605.8 $ 2,712.1 $ (106.3)Members' Capital $ 487.7 $ 444.8 $ 42.9Equity to Capitalization Ratio 15.4% 13.7% 1.7%
Financial Discussion and Analysis
Financial Highlights(DOLLARS IN MILLIONS)
2 0 0 9 2 0 1 0 2 0 1 1 2 0 1 2 2 0 1 3
900
800
700
600
500
400
300
200
100
0
NON-MEMBERS
MEMBERS
Member Cooperatives/Others
(DOLLARS IN MILLIONS )
ELECTRIC REVENUES BILLED
62
705
76
743
60
768
69
801
82
836

purchased power, non-member revenue, and fuel. The2013 PCA credit was due to the strong performance of allof Great River Energy’s power plants, higher marketenergy prices, and strong member energy unit sales.Electric revenue from non-members increased $13.0 millionor 18.8 percent to $82.3 million in 2013 from $69.3 millionin 2012. This increase in revenue was the result of anincrease in megawatt hour (MWh) sales of 12.5 percentand an increase in average market energy prices for thesesales of 6.3 percent in 2013 compared to 2012.
OTHER OPERATING REVENUEOther operating revenue increased $10.8 million or 20.9percent to $62.4 million in 2013 from $51.6 million in2012 due to increased transmission revenue from both theMISO market and under inter-utility transmissionagreements of $9.1 million and increased revenue fromtipping fees and waste recovery at the Elk River ResourceProcessing Plant of $2.1 million.
OPERATING EXPENSESTotal operating expenses for 2013 were $817.6 million, anincrease of $81.0 million or 11.0 percent from $736.6million in 2012. Purchased power increased $28.6 million or 17.0 percent to$196.4 million in 2013 from $167.8 million in 2012. Theincrease is largely due to purchasing 17.2 percent moreMWhs from the MISO market and increased energypurchases under bilateral contracts, including Genoa 3,during 2013. The average energy price paid increased 7.8percent in 2013 compared to 2012. Great River Energy’sincreased power purchases were primarily the result ofincreased member and non-member MWh sales anddecreased generation from Coal Creek Station (CCS) andStanton Station (Stanton) due to scheduled majormaintenance outages during 2013. There were no scheduledmajor maintenance outages during 2012. These increaseswere partially offset by a decrease in capacity costs forGenoa 3 of $3.6 million in 2013 compared to 2012, dueprimarily to an extended maintenance outage in 2012.Fuel expense increased $7.8 million or 3.6 percent to$225.7 million in 2013 from $217.9 million in 2012. Fuelexpense at CCS increased $5.8 million or 3.6 percent dueto increased mining costs per mined ton and increasedrepairs and maintenance in the mining operation and coalhandling system. Fuel expense at the peaking plantsincreased $4.6 million or 23.4 percent in 2013 comparedto 2012. Peaking generation decreased 12.7 percent in2013 compared to 2012; however, the average naturalgas price paid for the year increased 34.1 percent to$3.70/MMBtu in 2013 compared to $2.76/MMBtu in2012. Fuel expense at Stanton decreased $3.9 million or16.0 percent in 2013 compared to 2012 due to Stantongenerating 18.2 percent fewer MWhs, primarily the resultof the 2013 scheduled major maintenance outage.Operation and maintenance expense increased $27.4million or 12.1 percent to $253.9 million in 2013 from$226.6 million in 2012. As Great River Energy’s
infrastructure continues to age, operation and maintenanceexpense will increase due to increased investment andinflationary increases. Great River Energy maintains itsassets to ensure continued reliability. Great River Energyexpensed $11.2 million in 2013 in outage costs related tothe CCS and Stanton 2013 scheduled major maintenanceoutages. Additionally, as regional transmission projectsowned by others are completed within the MISO territory,Great River Energy’s share of these costs will increase.Great River Energy incurred $3.7 million of additionaltransmission expense related to these projects in 2013compared to 2012. Great River Energy also incurred anadditional $5.8 million in transmission expense to servemember load under inter-utility transmission agreements in2013 compared to 2012.
23
Financial Discussion and AnalysisCONTINUED
Depreciation and amortization increased $15.1 million or15.0 percent to $115.6 million in 2013 from $100.5 millionin 2012. Great River Energy shortened the estimatedservice lives for CCS and Stanton to the year 2028,beginning in July 2013, resulting in additional depreciationof $10.0 million for 2013. Additionally, amortizationincreased $4.0 million in 2013 compared to 2012 due toregulatory accounting for CapX2020 projects as GreatRiver Energy received approval from the Federal EnergyRegulatory Commission (FERC) for incentive-based ratetreatment for these projects. Under incentive-based ratetreatment, Great River Energy expenses in the current yearthe equivalent amount of interest capitalized duringconstruction for these projects and records an offsettingregulatory liability that will be amortized over the usefullife of the related asset.
OTHER INCOME (EXPENSE)Interest expense – net of amounts capitalized decreased$9.7 million or 6.8 percent to $134.1 million in 2013 from$143.8 million in 2012. Interest incurred on Great RiverEnergy’s long-term obligations decreased $5.5 million in2013 compared to 2012 due to a lower averageoutstanding long-term obligations balance. Capitalizedinterest increased $4.2 million in 2013 as construction workin progress increased in 2013 compared to 2012.
Purchased Power 19.7%
Fuel 22.7%
Operation andMaintenance 25.6%
Depreciation andAmortization 11.6%
Property Tax 2.6%
Interest Expense 13.5%
Net Margin Attributable to Great
River Energy 4.3%
2 013 EXPENSES AND MARGINS

Other assets and investments decreased $6.8 million to$289.0 million in 2013 from $295.8 million in 2012. Thisdecrease is primarily the result of a decrease in deferredcharges-financing related of $20.5 million to $97.3 millionin 2013, which is due to annual amortization and adecrease in bond issuance costs of $13.1 million, and theimpact of a favorable market valuation of certainderivative instruments accounted for under regulatoryaccounting of $7.4 million. This decrease is offset by anincrease in deferred charges-other of $11.2 million to$118.6 million in 2013. The increase is due to the deferralof refined coal purchase costs associated with theDryFining lease transaction of $12.0 million and thedeferral of scheduled major outage maintenance costs of$27.1 million, offset by a decrease in the deferred chargesassociated with the postretirement defined benefit pensionand medical plans of $26.1 million. The deferred chargesrelated to the DryFining lease will be recognized intomember rates commensurate with the net benefits of thetransaction. The deferred charges related to the scheduledmajor outage maintenance are amortized over themaintenance cycle period, which is three years for CCS andfour years for Stanton. The deferred charges related to thepostretirement benefit plans adjust each year with theremeasurement of the associated benefit obligations. Current assets decreased $43.1 million to $608.6 million in2013 from $651.7 million in 2012. Cash and cashequivalents decreased $51.5 million to $271.6 million in2013 due to a planned strategy to reduce cash on hand.Other inventory, which consists of corn, ethanol, and relatedinventory at Blue Flint, decreased $11.6 million to $10.8million in 2013 due to Blue Flint holding fewer bushels ofcorn in inventory and at significantly lower prices in 2013compared to 2012. These decreases were offset by anincrease in accounts receivable from members of $19.5million to $146.0 million in 2013. This increase is due tomember energy and demand unit sales increases for themonths of December and November in 2013 compared to2012, and the impact of the PCA in those same months asthere were PCA charges for December and November in2013 compared to PCA credits in 2012.
NONUTILITY OPERATIONSNonutility operating revenue and expense represents theoperations of Blue Flint. Operating income increased$10.1 million to $10.0 million in 2013 from $(0.1) million in 2012 due to a record production year and strong crushmargins per gallon as a result of tight ethanol supplies inthe region in 2013.Income from equity method investments primarily representsGreat River Energy’s share of net income from CCD&S for2013 and 2012.In January 2011, Great River Energy closed on a transactionwith North Dakota Refined Coal LLC (NDRC), and itssubsidiaries for the lease and operation of Great RiverEnergy’s DryFining facility. NDRC represents a variableinterest entity of Great River Energy and is consolidated in thefinancial statements. Great River Energy included in nonutilityoperations in the financial statements the noncontrollinginterest net loss of $16.1 million and $14.5 million for theyears ended December 31, 2013 and 2012, respectively,which represents the net operating results of NDRC.
24
Financial Discussion and AnalysisCONTINUED
MEMBER RATEGreat River Energy’s 2013 member billed rate was 70.4mills/kilowatt hour (kWh) compared to 68.5 mills/kWh in 2012.The increase in member rate was due primarily to a plannedrate increase for 2013; however, the rate was favorablyimpacted by the PCA credit of $10.2 million in 2013.
BALANCE SHEET REVIEWGreat River Energy’s total consolidated assets increased$14.6 million to $3.7 billion in 2013. Utility plant - net increased $60.3 million to $2.7 billion in2013. Utility plant increased $190.4 million due toadditions related to Great River Energy’s investment intransmission projects, including CapX2020, of $140.4million and other generation, general plant, and Falkirkadditions of $50.0 million. Additions were offset by netretirements and depreciation of $130.1 million. Nonutility plant and equipment – net increased $4.2 millionto $62.9 million in 2013 from $58.7 million in 2012 dueprimarily to the commencement of construction activities atDakota Spirit AgEnergy, LLC (DSA).
Non-member 8.2%
Member 84.0%
Nonutility Operations, Excluding Variable Interest Entity 1.1%
Nonoperating 0.4%
Other 6.3%
2 013 REVENUES
2 0 0 9 2 0 1 0 2 0 1 1 2 0 1 2 2 0 1 3
70
60
50
40
30
20
10
0
Excluding WAPA (MILLS PER kWh)
MEMBER AVERAGE RATE PER kWh
60.3 64.0 66.3 68.5 70.4
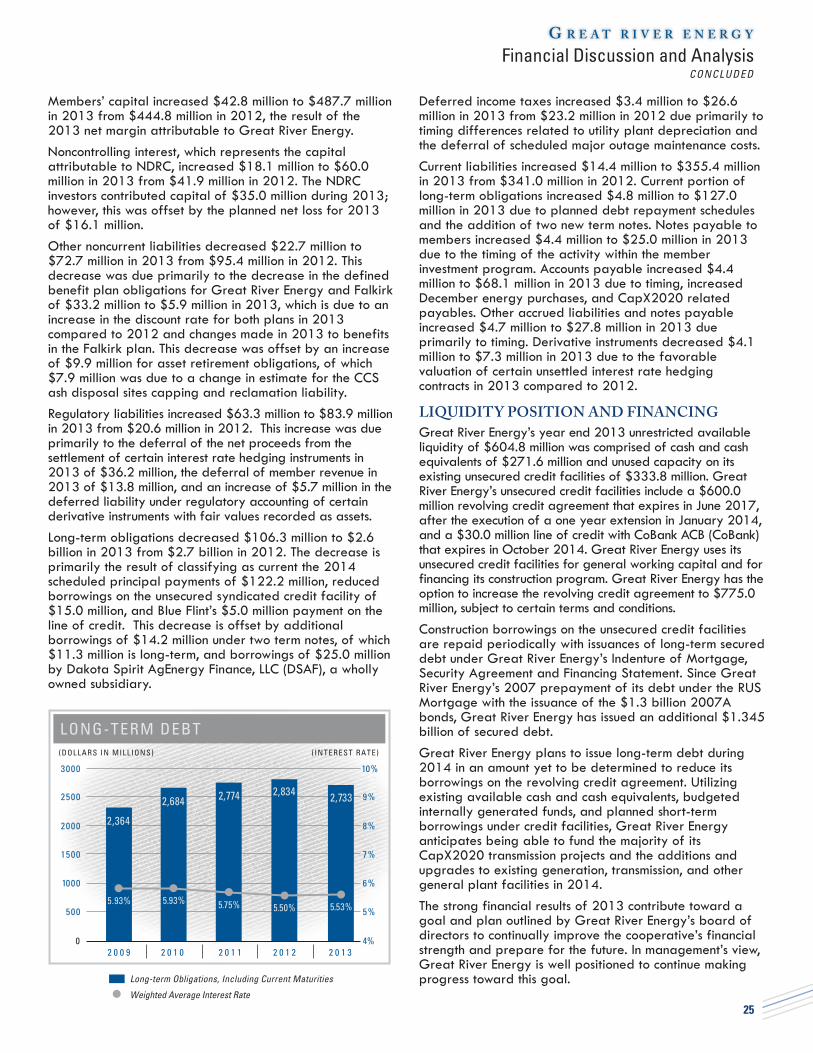
Members’ capital increased $42.8 million to $487.7 millionin 2013 from $444.8 million in 2012, the result of the2013 net margin attributable to Great River Energy.Noncontrolling interest, which represents the capitalattributable to NDRC, increased $18.1 million to $60.0million in 2013 from $41.9 million in 2012. The NDRCinvestors contributed capital of $35.0 million during 2013;however, this was offset by the planned net loss for 2013of $16.1 million.Other noncurrent liabilities decreased $22.7 million to$72.7 million in 2013 from $95.4 million in 2012. Thisdecrease was due primarily to the decrease in the definedbenefit plan obligations for Great River Energy and Falkirkof $33.2 million to $5.9 million in 2013, which is due to anincrease in the discount rate for both plans in 2013compared to 2012 and changes made in 2013 to benefitsin the Falkirk plan. This decrease was offset by an increaseof $9.9 million for asset retirement obligations, of which$7.9 million was due to a change in estimate for the CCSash disposal sites capping and reclamation liability. Regulatory liabilities increased $63.3 million to $83.9 millionin 2013 from $20.6 million in 2012. This increase was dueprimarily to the deferral of the net proceeds from thesettlement of certain interest rate hedging instruments in2013 of $36.2 million, the deferral of member revenue in2013 of $13.8 million, and an increase of $5.7 million in thedeferred liability under regulatory accounting of certainderivative instruments with fair values recorded as assets. Long-term obligations decreased $106.3 million to $2.6billion in 2013 from $2.7 billion in 2012. The decrease isprimarily the result of classifying as current the 2014scheduled principal payments of $122.2 million, reducedborrowings on the unsecured syndicated credit facility of$15.0 million, and Blue Flint’s $5.0 million payment on theline of credit. This decrease is offset by additionalborrowings of $14.2 million under two term notes, of which$11.3 million is long-term, and borrowings of $25.0 millionby Dakota Spirit AgEnergy Finance, LLC (DSAF), a whollyowned subsidiary.
Deferred income taxes increased $3.4 million to $26.6million in 2013 from $23.2 million in 2012 due primarily totiming differences related to utility plant depreciation andthe deferral of scheduled major outage maintenance costs. Current liabilities increased $14.4 million to $355.4 millionin 2013 from $341.0 million in 2012. Current portion oflong-term obligations increased $4.8 million to $127.0million in 2013 due to planned debt repayment schedulesand the addition of two new term notes. Notes payable tomembers increased $4.4 million to $25.0 million in 2013due to the timing of the activity within the memberinvestment program. Accounts payable increased $4.4million to $68.1 million in 2013 due to timing, increasedDecember energy purchases, and CapX2020 relatedpayables. Other accrued liabilities and notes payableincreased $4.7 million to $27.8 million in 2013 dueprimarily to timing. Derivative instruments decreased $4.1million to $7.3 million in 2013 due to the favorablevaluation of certain unsettled interest rate hedgingcontracts in 2013 compared to 2012.
LIQUIDITY POSITION AND FINANCINGGreat River Energy’s year end 2013 unrestricted availableliquidity of $604.8 million was comprised of cash and cashequivalents of $271.6 million and unused capacity on itsexisting unsecured credit facilities of $333.8 million. GreatRiver Energy’s unsecured credit facilities include a $600.0million revolving credit agreement that expires in June 2017,after the execution of a one year extension in January 2014,and a $30.0 million line of credit with CoBank ACB (CoBank)that expires in October 2014. Great River Energy uses itsunsecured credit facilities for general working capital and forfinancing its construction program. Great River Energy has theoption to increase the revolving credit agreement to $775.0million, subject to certain terms and conditions. Construction borrowings on the unsecured credit facilitiesare repaid periodically with issuances of long-term secureddebt under Great River Energy’s Indenture of Mortgage,Security Agreement and Financing Statement. Since GreatRiver Energy’s 2007 prepayment of its debt under the RUSMortgage with the issuance of the $1.3 billion 2007Abonds, Great River Energy has issued an additional $1.345billion of secured debt. Great River Energy plans to issue long-term debt during2014 in an amount yet to be determined to reduce itsborrowings on the revolving credit agreement. Utilizingexisting available cash and cash equivalents, budgetedinternally generated funds, and planned short-termborrowings under credit facilities, Great River Energyanticipates being able to fund the majority of itsCapX2020 transmission projects and the additions andupgrades to existing generation, transmission, and othergeneral plant facilities in 2014.The strong financial results of 2013 contribute toward agoal and plan outlined by Great River Energy’s board ofdirectors to continually improve the cooperative’s financialstrength and prepare for the future. In management’s view,Great River Energy is well positioned to continue makingprogress toward this goal.
25
Financial Discussion and AnalysisCONCLUDED
2 0 0 9 2 0 1 0 2 0 1 1 2 0 1 2 2 0 1 3
3000
2500
2000
1500
1000
500
0
10%
9%
8%
7%
6%
5%
4%
Long-term Obligations, Including Current Maturities
Weighted Average Interest Rate
LONG -TERM DEBT
5.93%
2,364
5.93%
2,684
5.75%
2,774
5.50%
2,834
5.53%
2,733
(DOLLARS IN MILLIONS ) ( INTEREST RATE)

To the Board of Directors and Members of Great River Energy:
Management is responsible for the fairness and accuracy of the financial information presented in this annualreport. The accompanying financial statements have been prepared in accordance with generally acceptedaccounting principles, using management’s best estimates and judgments where appropriate. Great River Energymaintains an internal accounting control system that provides reasonable assurance of the integrity and reliabilityof the financial statements and the protection of assets from loss or unauthorized use or disposition. Directors, whoare not employees, make up the Finance and Audit Committee of the Board of Directors. The committee meetsregularly with management and independent public accountants to review and discuss Great River Energy’sinternal accounting controls and financial reports. The independent public accountants have free access to thecommittee and the Board of Directors, without management present, to discuss the findings of their audits.
David SaggauPresident and CEOGreat River EnergyMaple Grove, MinnesotaMarch 18, 2014
26
Management Report

To the Board of Directors of Great River Energy Maple Grove, Minnesota
We have audited the accompanying consolidated financial statements of Great River Energy (GRE), whichcomprise the consolidated balance sheets as of December 31, 2013 and 2012, and the related consolidatedstatements of operations, comprehensive income, changes in capital, and cash flows for each of the three years inthe period ended December 31, 2013, and the related notes to the consolidated financial statements.
Management’s Responsibility for the Consolidated Financial Statements
Management is responsible for the preparation and fair presentation of these consolidated financial statements inaccordance with accounting principles generally accepted in the United States of America; this includes the design,implementation, and maintenance of internal control relevant to the preparation and fair presentation ofconsolidated financial statements that are free from material misstatement, whether due to fraud or error.
Auditors’ Responsibility
Our responsibility is to express an opinion on these consolidated financial statements based on our audits. We didnot audit the financial statements of Blue Flint Ethanol LLC (Blue Flint), a wholly owned subsidiary, which statementsreflect total assets constituting 1% of consolidated total assets as of December 31, 2013 and 2012, and totalrevenues constituting 16% and 18%, respectively, of consolidated total revenues for the years then ended. Also,we did not audit the financial statements of Blue Flint, GRE’s investment which was accounted for by use of theequity method as of December 31, 2011. GRE’s equity method investment of $23,331,000 in Blue Flint’s net assetsas of December 31, 2011, and of $3,440,000 in Blue Flint’s net income for the year ended December 31, 2011, isincluded in the accompanying consolidated financial statements. Those statements were audited by other auditors,whose report has been furnished to us, and our opinion, in so far as it relates to the amounts included for Blue Flint,is based solely on the report of the other auditors. We conducted our audits in accordance with auditing standardsgenerally accepted in the United States of America. Those standards require that we plan and perform the auditto obtain reasonable assurance about whether the consolidated financial statements are free from materialmisstatement.
An audit involves performing procedures to obtain audit evidence about the amounts and disclosures in theconsolidated financial statements. The procedures selected depend on the auditor’s judgment, including theassessment of the risks of material misstatement of the consolidated financial statements, whether due to fraud orerror. In making those risk assessments, the auditor considers internal control relevant to GRE’s preparation and fairpresentation of the consolidated financial statements in order to design audit procedures that are appropriate inthe circumstances, but not for the purpose of expressing an opinion on the effectiveness of GRE’s internal control.Accordingly, we express no such opinion. An audit also includes evaluating the appropriateness of accountingpolicies used and the reasonableness of significant accounting estimates made by management, as well asevaluating the overall presentation of the consolidated financial statements.
We believe that the audit evidence we have obtained is sufficient and appropriate to provide a basis for our auditopinion.
Opinion
In our opinion, based on our audits and the report of the other auditors, the consolidated financial statementsreferred to above present fairly, in all material respects, the financial position of GRE as of December 31, 2013and 2012, and the results of its operations and its cash flows for each of the three years in the period endedDecember 31, 2013, in accordance with accounting principles generally accepted in the United States of America.
Minneapolis, MinnesotaMarch 18, 2014
27
Independent Auditors’ Report

A S S E T S 2 013 2 012
UTILITY PLANT:Electric plant $ 3,653,224 $ 3,569,607Plant held for future use 426,068 425,156Coal mine plant 351,486 352,789Construction work in progress 221,242 134,028Less accumulated depreciation and amortization (1,908,156) (1,798,030)
Utility plant — net 2,743,864 2,683,550
NONUTILITY PLANT AND EQUIPMENT — Net 62,893 58,679
OTHER ASSETS AND INVESTMENTS: Restricted investments — deferred compensation 12,285 10,762Other investments 28,223 27,716Deferred charges — financing related 97,259 117,756Deferred charges — other 118,632 107,393Other long-term assets 29,045 27,477Other long-term receivables:
Members 566 2,151Others — net of allowance for doubtful accounts of $100
for both 2013 and 2012 3,001 2,564
Total other assets and investments 289,011 295,819
CURRENT ASSETS: Cash and cash equivalents 271,610 323,108Accounts receivable:
Members 146,000 126,532Others — net of allowance for doubtful accounts of $535
and $0 for 2013 and 2012, respectively 17,968 18,005Inventories:
Materials and supplies 69,702 72,680Fuel 22,904 23,700Other 10,833 22,435
Prepaids and other current assets 20,672 25,558Derivative instruments 21,762 15,708Deferred income tax benefit 27,182 23,993
Total current assets 608,633 651,719
TOTAL $ 3,704,401 $ 3,689,767
28
Consolidated Balance SheetsAS OF DECEMBER 31 , 2013 AND 2012( IN THOUSANDS)
Continued

L I A B I L I T I E S A N D C A P I TA L 2 013 2 012
CAPITAL:Members:
Patronage capital $ 487,663 $ 444,827Memberships 3 3
Total members’ capital 487,666 444,830Noncontrolling interest 60,043 41,883
Total capital 547,709 486,713
OTHER NONCURRENT LIABILITIES 72,717 95,395
REGULATORY LIABILITIES 83,895 20,586
LONG-TERM OBLIGATIONS — Less current portion 2,605,797 2,712,106
DEFERRED COMPENSATION 12,285 10,762
DEFERRED INCOME TAXES 26,636 23,220
COMMITMENTS AND CONTINGENCIES (Notes 4, 5, and 10)CURRENT LIABILITIES:
Current portion of long-term obligations 126,950 122,141Notes payable to members 24,969 20,562Obligations under line of credit 10,000 10,000Accounts payable 68,057 63,636Property and other taxes 25,228 22,673Other accrued liabilities and notes payable 27,804 23,118Accrued interest payable 65,056 67,432Derivative instruments 7,298 11,423
Total current liabilities 355,362 340,985
TOTAL $ 3,704,401 $ 3,689,767
See notes to consolidated financial statements.
29
Consolidated Balance Sheets
Concluded
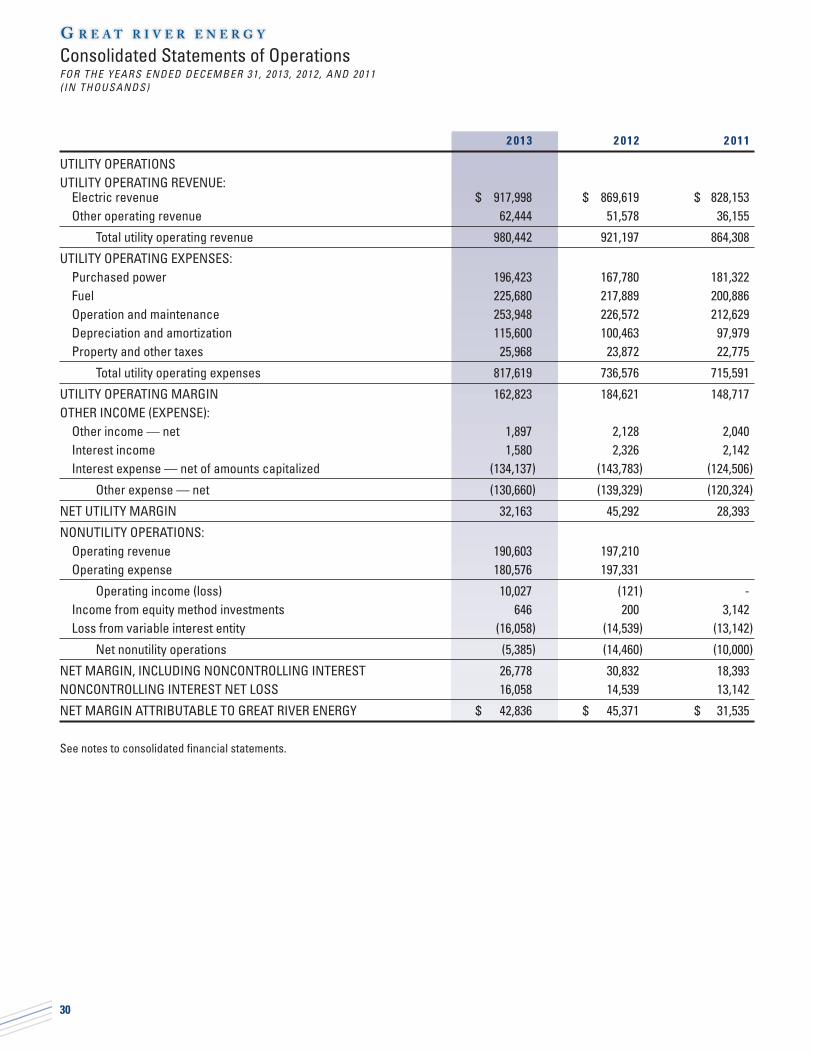
2 013 2 012 2 011
UTILITY OPERATIONSUTILITY OPERATING REVENUE:
Electric revenue $ 917,998 $ 869,619 $ 828,153Other operating revenue 62,444 51,578 36,155
Total utility operating revenue 980,442 921,197 864,308
UTILITY OPERATING EXPENSES:Purchased power 196,423 167,780 181,322Fuel 225,680 217,889 200,886Operation and maintenance 253,948 226,572 212,629Depreciation and amortization 115,600 100,463 97,979Property and other taxes 25,968 23,872 22,775
Total utility operating expenses 817,619 736,576 715,591
UTILITY OPERATING MARGIN 162,823 184,621 148,717OTHER INCOME (EXPENSE):
Other income — net 1,897 2,128 2,040Interest income 1,580 2,326 2,142Interest expense — net of amounts capitalized (134,137) (143,783) (124,506)
Other expense — net (130,660) (139,329) (120,324)
NET UTILITY MARGIN 32,163 45,292 28,393
NONUTILITY OPERATIONS:Operating revenue 190,603 197,210Operating expense 180,576 197,331
Operating income (loss) 10,027 (121) -Income from equity method investments 646 200 3,142Loss from variable interest entity (16,058) (14,539) (13,142)
Net nonutility operations (5,385) (14,460) (10,000)
NET MARGIN, INCLUDING NONCONTROLLING INTEREST 26,778 30,832 18,393NONCONTROLLING INTEREST NET LOSS 16,058 14,539 13,142
NET MARGIN ATTRIBUTABLE TO GREAT RIVER ENERGY $ 42,836 $ 45,371 $ 31,535
See notes to consolidated financial statements.
30
Consolidated Statements of OperationsFOR THE YEARS ENDED DECEMBER 31 , 2013 , 2012 , AND 2011( IN THOUSANDS)

AccumulatedOther
Patronage Comprehensive Noncontrolling TotalCapital Memberships Income (Loss) Interest Capital
BALANCE — January 1, 2011 $ 367,921 $ 3 $ (405) $ - $ 367,519Comprehensive income (loss):
Net margin (loss) 31,535 (13,142) 18,393Change in unrealized loss on interest rate swap —
equity method investment 405 405
Total comprehensive income (loss) 31,535 - 405 (13,142) 18,798Capital contributed by noncontrolling interest 105,930 105,930Capital distributed by noncontrolling interest (13,876) (13,876)
Dividends paid by noncontrolling interest (715) (715)
BALANCE — December 31, 2011 399,456 3 - 78,197 477,656
Net margin (loss) and comprehensive income (loss) 45,371 (14,539) 30,832Capital distributed by noncontrolling interest (21,016) (21,016)Dividends paid by noncontrolling interest (759) (759)
BALANCE — December 31, 2012 444,827 3 - 41,883 486,713Net margin (loss) and comprehensive income (loss) 42,836 (16,058) 26,778Capital contributed by noncontrolling interest 34,989 34,989Dividends paid by noncontrolling interest (771) (771)
BALANCE — December 31, 2013 $ 487,663 $ 3 $ - $ 60,043 $ 547,709
See notes to consolidated financial statements.
31
Consolidated Statements of Changes in CapitalFOR THE YEARS ENDED DECEMBER 31 , 2013 , 2012 , AND 2011
( IN THOUSANDS)
Consolidated Statements of Comprehensive IncomeFOR THE YEARS ENDED DECEMBER 31 , 2013 , 2012 , AND 2011
( IN THOUSANDS)
2 013 2 012 2 011
NET MARGIN, INCLUDING NONCONTROLLING INTEREST $ 26,778 $ 30,832 $ 18,393COMPREHENSIVE INCOME — Change in interest
rate swap valuation — equity method investment 405
COMPREHENSIVE INCOME, INCLUDING NONCONTROLLING INTEREST 26,778 30,832 18,798NONCONTROLLING INTEREST COMPREHENSIVE LOSS 16,058 14,539 13,142
COMPREHENSIVE INCOME ATTRIBUTABLE TO GREAT RIVER ENERGY $ 42,836 $ 45,371 $ 31,940
See notes to consolidated financial statements.

2 013 2 012 2 011
CASH FLOWS FROM OPERATING ACTIVITIES:Net margin, including noncontrolling interest $ 26,778 $ 30,832 $ 18,393Adjustments to reconcile net margin to net cash provided by operating activities:
Depreciation and amortization:Charged to operating expenses 115,600 100,463 97,979Charged to fuel expense and other accounts 30,251 16,958 18,468
Income from equity method investments (646) (200) (2,880)Patronage credits earned from investments (1,205) (906)Deferred charges (39,075) (12,000) (15,670)Regulatory liabilities 13,750Changes in working capital (excluding cash, investments, and borrowings):
Accounts and long-term receivables (17,538) (2,262) 4,401Inventory and other assets 8,737 (26,690) (7,530)Accounts payable, taxes, and other accrued expenses 4,183 (9,492) (11,680)Accrued interest (2,374) (2,355) 2,966Noncurrent liabilities (6,275) 7,772 (3,144)
Net cash provided by operating activities 132,186 102,120 101,303
CASH FLOWS FROM INVESTING ACTIVITIES:Property additions (164,275) (150,745) (144,982)Proceeds from sale of property 348 374 378Purchase transactions and investment in equity method
investments — net of cash acquired of $24,174 in 2012 5,660 (102)Redemption of patronage capital from investments 698 449Purchases of investments (61,230)Proceeds from maturity of investments 60,000 896
Net cash used in investing activities (163,229) (84,262) (205,040)
CASH FLOWS FROM FINANCING ACTIVITIES:Proceeds from issuance of long-term obligations 315,205 120,000 180,475Repayments of long-term obligations (416,726) (127,141) (98,201)Proceeds from interest rate hedging instruments settlement 42,915Costs of new debt issuances, leases, and interest rate hedging instruments (474) (6,445) (10,791)Borrowings on line of credit — net 10,000Notes received from (paid to) members — net 4,407 4,975 (5,258)Capital contributed by noncontrolling interest 34,989 105,930Capital distributed by noncontrolling interest (21,016) (13,876)Dividends paid by noncontrolling interest (771) (759) (715)
Net cash (used in) provided by financing activities (20,455) (20,386) 157,564
NET (DECREASE) INCREASE IN CASH AND CASH EQUIVALENTS (51,498) (2,528) 53,827CASH AND CASH EQUIVALENTS — Beginning of year 323,108 325,636 271,809
CASH AND CASH EQUIVALENTS — End of year $ 271,610 $ 323,108 $ 325,636
See notes to consolidated financial statements.
32
Consolidated Statements of Cash FlowsFOR THE YEARS ENDED DECEMBER 31 , 2013 , 2012 , AND 2011( IN THOUSANDS)

1. ORGANIZATIONORGANIZATION — Great River Energy (GRE) is a Minnesota electric generation and transmission cooperativecorporation providing wholesale electric service to member distribution cooperatives engaged in the retail sale ofelectricity to member consumers in Minnesota and a small section of Wisconsin. This service is provided in accordancewith the terms of the power purchase and transmission service contracts between GRE and the members. These contractshave expiration dates of December 31, 2045, and December 31, 2050, respectively.
BASIS OF ACCOUNTING — The consolidated financial statements are prepared on the accrual basis of accountingand include the accounts of GRE, as well as the following entities:
33
Notes to Consolidated Financial StatementsAS OF DECEMBER 31 , 2013 AND 2012 , AND
FOR THE YEARS ENDED DECEMBER 31 , 2013 , 2012 , AND 2011
YearsEntity Relationship Consolidated
The Falkirk Mining Company (Falkirk) Variable interest entity 2013, 2012, 2011North Dakota Refined Coal LLC (NDRC) Variable interest entity 2013, 2012, 2011
Midwest AgEnergy Group, LLC (MAG) Wholly owned subsidiary 2013Blue Flint Ethanol LLC (Blue Flint) Wholly owned subsidiary 2013, 2012Dakota Spirit AgEnergy Finance, LLC (DSAF) Wholly owned subsidiary 2013Dakota Spirit AgEnergy, LLC (DSA) Wholly owned subsidiary 2013
FALKIRK — GRE has an agreement with Falkirk for thedevelopment and operation of a lignite coal mine. Falkirkis the coal supplier for the Coal Creek Station (CCS),GRE’s steam-generating facility located nearUnderwood, North Dakota. GRE is required to providefinancing for all costs associated with the minedevelopment and operation. Accounting principlesgenerally accepted in the United States of America(“generally accepted accounting principles”) require GREto consolidate its financial statements with Falkirk sinceFalkirk qualifies as a variable interest entity for whichGRE is the primary beneficiary. The coal purchase priceincludes all costs incurred by Falkirk for development andoperation of the mine, including Falkirk’s interest expenseof $3.5 million, $3.9 million, and $4.1 million in 2013,2012, and 2011, respectively; income tax expense of$2.7 million, $3.0 million, and $2.4 million in 2013,2012, and 2011, respectively; and net income of $12.0million, $11.6 million, and $11.3 million in 2013, 2012,and 2011, respectively, all of which are part of thecontract cost of coal purchased under the coal salesagreement. Accordingly, the net effect of consolidatingthe income statement of Falkirk had no impact on GRE’smargin for the years ended December 31, 2013, 2012,and 2011.
Assets and liabilities included in the consolidated balancesheets as of December 31, 2013 and 2012, afterintercompany eliminations, are as follows (in thousands):
2013 2012
Coal mine plant $ 297,855 $ 299,158Construction work in progress 1,582 1,303Accumulated depreciation
and amortization (158,152) (145,710)Deferred charges 10,838 31,680Other long-term assets 6,784 7,436Fuel inventory 5,175 5,404Materials and supplies inventory 21,037 19,284Deferred income tax benefit 546 772Other current assets 323 1,490Other noncurrent liabilities 26,150 47,671Long-term obligations 63,627 78,393Current liabilities 25,791 26,623
Falkirk is a wholly owned subsidiary of the North AmericanCoal Corporation (NACC), which is a wholly ownedsubsidiary of NACCO Industries, Inc. Falkirk is principallyengaged in lignite mining through the operation of asurface mine in North Dakota.
The consolidation of NDRC also includes NDRC’s wholly owned subsidiaries, North Dakota Refined Coal ProjectCompany A LLC and North Dakota Refined Coal Project Company B LLC.
All significant intercompany balances and transactions have been eliminated in consolidation, except for the steamsales between GRE and Blue Flint discussed within Note 1.

NDRC — Beginning on January 21, 2011, GRE has anagreement with NDRC, or its wholly owned subsidiaries, forthe lease and operation of the DryFining facility at CCS.NDRC purchases coal from GRE under fixed pricing,refines the coal in the DryFining facility, and sells therefined coal to GRE under fixed pricing. GRE providescertain other services to NDRC under fee arrangements.The lease and related agreements have a 16-year term;however, included in the participation agreement is apurchase option to buy out the remaining term of thetransaction on January 31, 2020. Generally acceptedaccounting principles require GRE to consolidate itsfinancial statements with NDRC, since NDRC qualifies as avariable interest entity for which GRE is the primarybeneficiary. NDRC entered into an operating andmaintenance agreement with NoDak Energy Services LLC(“NoDak”) to perform the day-to-day operation andmaintenance of the DryFining facility. NoDak qualifies as avariable interest entity for which NDRC is the primarybeneficiary. As a result, GRE is also consolidating NoDakas part of NDRC. The utility fuel operating expense in theconsolidated statements of operations includes a netbenefit to GRE of $11.4 million, $10.1 million and $9.4million for the years ended December 31, 2013, 2012,and 2011, respectively, related to this transaction. Thisincludes the revenue from the lease and other agreementspartially offset by the costs incurred for the purchase ofrefined coal from NDRC. The net loss incurred by NDRC of$16.1 million, $14.5 million, and $13.1 million for theyears ended December 31, 2013, 2012, and 2011,respectively, is reported as nonutility operations in theconsolidated statements of operations.
The agreements include various operational metrics, suchas minimum requirements on the tons of refined coalpurchased by GRE and the achievement of qualifiedemission reductions. In the event that the operationalmetrics are not met over the life of the transaction, GREmay be required to pay specified amounts to NDRC attransaction termination. No liability has been recorded byGRE in the consolidated financial statements related tothese operational metrics as of December 31, 2013 and2012.
Assets and liabilities included in the consolidated balancesheets as of December 31, 2013 and 2012, afterintercompany eliminations, are as follows (in thousands):
2013 2012
Cash $ 4,016 $ 680Prepaids 73 70Current liabilities 234 232
JPM Capital Corporation and WM Refined Coal, LLChold a 55% and 45% membership interest, respectively,in NDRC. NoDak is a wholly owned subsidiary of TRUGlobal Energy Services LLC, a wholly owned subsidiaryof NACC.
BLUE FLINT — Blue Flint operates an ethanol biorefineryfacility located in Underwood, North Dakota. Blue Flint hasa production capacity of approximately 65 million gallonsof undenatured ethanol per year. Blue Flint is a dry-millproduction facility that produces and sells ethanol, dry andmodified distillers grain, and distillers oil.
Prior to 2012, GRE owned 49% of Blue Flint andaccounted for Blue Flint as an equity method investment.On January 1, 2012, GRE purchased the remaining 51%ownership interest in Blue Flint from HES Ethanol Holdings,LLC for a cash purchase price of $18.3 million. As GRE issubject to regulatory accounting, the fair value of GRE’s49% equity interest in Blue Flint was determined to benet book value, as of January 1, 2012, of $23.9 million.The transaction price of $18.3 million was determined tobe fair value for the 51% ownership interest using boththe market and income approaches. GRE did notrecognize any gain or loss related to this transaction.
The recognized amounts of identifiable assets acquiredand liabilities assumed at January 1, 2012, are asfollows (in thousands):
Cash $ 24,174Accounts receivable — net of allowance for
doubtful accounts of $0 5,133Inventory 14,415Other financial assets 3,674Plant and equipment 61,722Financial liabilities (66,938)Total identifiable net assets $ 42,180
The pro forma net margin attributable to GRE wouldhave been $35.9 million for the year ended December31, 2011, had Blue Flint been wholly owned for all yearspresented. Blue Flint’s operating revenue was $187.3million for the year ended December 31, 2011, andwould have been reported as nonutility operations hadBlue Flint been wholly owned for all years presented.
Blue Flint purchases steam and water under a long-termcontract from CCS for use in the production of ethanoland related products. Steam and water purchases were$5.6 million and $5.5 million for the years endedDecember 31, 2013 and 2012, respectively. The sale ofsteam and water by CCS is recorded as utility otheroperating revenue and the purchase by Blue Flint isrecorded as nonutility operating expense. This transactionwas not eliminated in consolidation for 2013 and 2012.
34
Notes to Consolidated Financial StatementsCONTINUED

Notes to Consolidated Financial StatementsCONTINUED
Utility net margin and nonutility operating income (loss) as of December 31, 2013 and 2012, would be as follows hadthis transaction been eliminated (in thousands):
2013 2012
As With As WithPresented Elimination Presented Elimination
Net utility margin $ 32,163 $ 26,564 $ 45,292 $ 39,792
Nonutility operating income (loss) $ 10,027 $ 15,626 $ (121) $ 5,379
Total $ 42,190 $ 42,190 $ 45,171 $ 45,171
The equity method investment activity for Blue Flint for the year ended December 31, 2011, is as follows (in thousands):
2011
Beginning equity investment balance $ 19,486GRE’s share of Blue Flint’s income 3,440GRE’s share of Blue Flint’s other comprehensive income 405
Ending equity investment balance $ 23,331
GRE’s share of Blue Flint’s accumulated other comprehensive income relates to an interest rate swap agreementdesignated as a cash flow hedge, which Blue Flint recorded at fair value. GRE recognized $4.6 million in steam sales toBlue Flint and $1.2 million related to Blue Flint’s use of CCS infrastructure for the year ended December 31, 2011.
During 2013, GRE transferred its ownership interest in Blue Flint to another GRE wholly owned subsidiary, MAG.
MAG — MAG has two wholly owned subsidiaries, Blue Flint and DSAF, as of December 31, 2013. DSAF’s whollyowned subsidiary, DSA, began construction in 2013 of a biorefinery facility located near Jamestown, North Dakota.DSA will be a dry-mill production facility that produces and sells ethanol, dry and modified distillers grain, anddistillers oil, and it will have a production capacity of approximately 65 million gallons of undenatured ethanol per year.
2. SUMMARY OF SIGNIFICANT ACCOUNTING POLICIESREGULATORY ACCOUNTING — GRE operations follow regulatory accounting provisions as provided in generallyaccepted accounting principles and the consolidated financial statements contain various items reported under theseregulatory provisions. As the board of directors sets rates on a cost-of-service basis, GRE follows generally acceptedaccounting principles related to the effects of certain types of regulation, which provides for the reporting of assetsand liabilities consistent with the economic effect of the rate structure. As such, regulatory assets are recorded to reflectprobable future revenues associated with certain costs that are expected to be recovered from customers through therate-making process. Regulatory liabilities are recorded to reflect probable future reductions in revenues associatedwith amounts that are expected to be credited to customers through the rate-making process. For further informationsee Note 11.
CASH AND CASH EQUIVALENTS — Cash equivalents include all highly liquid investments with original maturities ofthree months or less (e.g., money market funds). Certain cash and cash equivalents are classified as investments whenthey relate to trust funds held for long-term purposes.
35

INVENTORIES — Fuel inventory is carried at averagecost and includes coal, lime, oil, and gas used for electricgeneration. Other inventory represents corn, chemical,ethanol, and distillers grain inventory held at Blue Flint.Corn and chemical inventory is stated at the lower of cost(on the first-in, first-out method) or market. Ethanol anddistillers grain inventory is stated at the lower of cost(average monthly cost) or market. Materials and suppliesinventory is stated at the lower of average cost ormarket.
Emission allowances are also accounted for as fuelinventory and recorded at the lower of cost or market.The U.S. Environmental Protection Agency hasrequirements limiting the amount of sulfur dioxide thatcan be emitted from GRE-owned power plants. Underthese requirements, GRE was allotted one emissionallowance per ton of sulfur dioxide emissions based uponhistoric emission levels. GRE had approximately 196,000and 142,000 allowances in inventory and available-for-sale at December 31, 2013 and 2012, respectively, witha recorded cost of $0 for both years.
Renewable energy credits (RECs) are either purchased oracquired in the course of generation, or purchased as aresult of meeting load obligations, and are recorded asfuel inventory at cost. GRE had approximately 4.5 millionand 3.5 million RECs in fuel inventory and available-for-sale at December 31, 2013 and 2012, respectively, witha recorded cost of $0.5 million and $0, respectively.
UTILITY PLANT — Utility plant is stated at original cost,which includes materials, contract and direct labor,overhead, allowance for funds used for construction, andinterest during construction. Interest charged toconstruction on borrowed funds and allowance for fundsused for construction (other than borrowed funds) areincluded as a component of utility plant cost and creditedto interest expense and interest income, respectively. Therates applied reflect the actual rates for borrowed funds
and the prevailing short-term investment rates for otherthan borrowed funds. Repairs and maintenance arecharged to operations as incurred. When generation andtransmission assets are retired, sold, or otherwisedisposed of, the original cost, plus the cost of removal,less salvage, is charged to accumulated depreciation andthe corresponding gain or loss is amortized over theremaining life of the plant. Included in accumulateddepreciation are retired assets totaling $(42.8) millionand $(44.2) million at December 31, 2013 and 2012,respectively, that will continue to be amortized. Alsoincluded in accumulated depreciation are nonlegal ornoncontractual costs of removal components in the amountof $48.0 million and $45.5 million for 2013 and 2012,respectively. When other property assets are retired orsold, the cost and related accumulated depreciation areeliminated and any gain or loss is reflected in otherincome (expense).
PLANT HELD FOR FUTURE USE — Plant held for futureuse represents the costs associated with SpiritwoodStation, the related coal load out facility at CCS, andland held for future use. The plant costs include materials,contract and direct labor, overhead, and interest duringconstruction. Construction activities at Spiritwood Stationhave ceased. The plant is not considered substantiallycomplete in its current state and is not being depreciated.Spiritwood Station will be completed, placed in service,and fully included in member rates in November 2014.
DEPRECIATION AND AMORTIZATION — Depreciationfor financial reporting purposes is provided based uponthe straight-line method at rates designed to amortizethe original cost of properties over their estimatedservice lives. During 2013, GRE revised the estimatedservice lives for CCS and Stanton Station (“Stanton”) tobe 2028. These plants, along with any future additions,will be fully depreciated by the end of 2028. Theeffective depreciation rate was 2.9%, 2.6%, and 2.6%for 2013, 2012, and 2011, respectively. The range of
36
Notes to Consolidated Financial StatementsCONTINUED
2013 2012 2011
Supplemental disclosure of cash flow information:Cash paid for interest — net of amounts capitalized $ 144,429 $ 154,320 $ 126,521
Cash paid for taxes — Falkirk $ 1,759 $ 3,642 $ 3,061
Noncash investing and financing activities:Utility plant acquisitions included in accounts payable $ 8,375 $ 6,994 $ 8,503
Utility plant acquired under capital lease $ 1,264 $ 19,653 $ 5,294
Interest on borrowed funds in the amount of $8.4 million, $4.1 million, and $26.5 million was capitalized in 2013,2012, and 2011, respectively, and these amounts are excluded from the cash payments for interest noted above.
SUPPLEMENTAL CASH FLOW INFORMATION — Supplemental cash flow information for the years ended December31, 2013, 2012, and 2011, is as follows (in thousands):

useful lives for utility plant is three to 50 years. Coal mineequipment is amortized using a straight-line method overthe estimated useful lives. Amortization of coal lands andleaseholds is calculated on the units-of-production methodbased upon estimated recoverable tonnages and isincluded in utility fuel expense in the consolidatedstatements of operations. Amortization expense alsoincludes the amortization of bond discounts, accretionexpense related to asset retirement obligations, and theamortization of deferred charges, except as described inNote 11.
NONUTILITY PLANT AND EQUIPMENT — NET —Nonutility plant and equipment represents Blue Flint plantand equipment and DSA construction work in progress.Blue Flint plant and equipment is recorded at fair value,as determined as of the acquisition date of the remaining51% ownership interest. Depreciation for financialreporting purposes is provided based upon the straight-line method. The range of useful lives for nonutility plantand equipment is three to 40 years.
A summary of nonutility plant and equipment as ofDecember 31, 2013 and 2012, is as follows (inthousands):
2013 2012
Land improvements $ 7,572 $ 7,556Buildings and improvements 14,661 14,640Equipment and other 40,463 39,932Construction work in progress 7,393 126Less accumulated depreciation (7,196) (3,575)
$ 62,893 $ 58,679
RECOVERABILITY OF LONG-LIVED ASSETS — GREreviews its long-lived assets whenever events or changesin circumstances indicate the carrying value of the assetsmay not be recoverable. GRE determines potentialimpairment by comparing the carrying value of the assetwith the net cash flows expected to be provided by theoperating activities of the business or related products.Should the sum of the expected cash flows be less thanthe carrying values, GRE would determine whether animpairment loss should be recognized. No impairmentlosses have been identified in the consolidated financialstatements.
INCOME TAXES — GRE accounts for income taxes usingthe liability method. Under this method, deferred incometaxes are recognized for temporary differences betweenthe tax and financial reporting bases of assets andliabilities using enacted tax rates in effect for the year inwhich the differences are expected to reverse.
MEMBERS’ PATRONAGE CAPITAL — Revenues in excessof current-period costs (net margin attributable to GRE)in any year are designated as assignable margins. Theseassignable margins are considered capital furnished bythe members and are credited to the members’ individualaccounts. Assignable margins are held by GRE until theyare retired and returned, without interest, at thediscretion of the board of directors and subject to long-term obligation agreement restrictions (see Note 5).Retained assignable margins are designated aspatronage capital in the consolidated balance sheets.
USE OF ESTIMATES — The preparation of consolidatedfinancial statements in conformity with generallyaccepted accounting principles requires management tomake estimates and assumptions that affect the reportedamounts of assets and liabilities and disclosure ofcontingent assets and liabilities at the date of theconsolidated financial statements and the reportedamounts of revenues and expenses during the reportingperiod. The significant estimates in the consolidatedfinancial statements relate to key inputs to actuarialcalculations of defined benefit obligations, compensationand benefit accruals, asset retirement obligationliabilities, accrued property and other taxes, useful livesof utility and nonutility plant, recoverability of deferredtax assets, the fair value of Blue Flint assets and liabilitiesat the acquisition date, and contingencies and otherreserves. Actual results could differ from those estimates.
REVENUE RECOGNITION — Electric revenue isrecognized when energy is delivered to GRE’s membersor to other non-member organizations. The GRE rateschedule includes a power cost adjustment that allows forincreases or decreases in member power billings basedupon actual power costs compared to plan. For 2013and 2012, the power cost adjustments were credits toGRE members of $10.2 million and $5.6 million,respectively. For 2011, the power cost adjustment was acharge of $17.3 million. Credits or charges are recordedas a decrease or increase, respectively, in electricrevenue in the consolidated statements of operations. In2013, GRE deferred the recognition of $13.8 million ofmember electric revenue under regulatory accounting(see Note 11).
OTHER OPERATING REVENUE — Other operatingrevenue includes revenue related to the processing plantthat transforms municipal solid waste into refuse-derivedfuel and the burning of that fuel at the Elk River EnergyRecovery Station, revenue received from other utilitiesrelated to providing transmission service under variousintegrated transmission agreements, and revenue fromthe sale of utility plant by-products, such as steam andfly ash. Other operating revenue is recorded as servicesare provided.
37
Notes to Consolidated Financial StatementsCONTINUED

38
NONUTILITY OPERATIONS — Nonutility operatingrevenue and expense represents Blue Flint operations forthe years ended December 31, 2013 and 2012.Revenue from the production of ethanol and relatedproducts is recorded at the time the title of the goodsand all risk of ownership transfers to customers andsettlement price is realizable. Transfer of ownershipgenerally occurs when the product is shipped and risk ofloss is assumed by the customer.
SUBSEQUENT EVENTS — GRE has consideredsubsequent events for recognition or disclosure throughMarch 18, 2014, the date the consolidated financialstatements were available to be issued.
3. RECENTLY ISSUED ACCOUNTING STANDARDS
In December 2011, the Financial Accounting StandardsBoard (FASB) issued guidance on the offsetting of assetsand liabilities, which is effective for GRE in 2013. Theguidance requires additional disclosures regardingoffsetting arrangements of balance sheet derivatives toenable financial statement users to understand the effectof these arrangements on a company’s financial position.The adoption of this standard did not have a materialimpact on GRE’s consolidated financial statementdisclosures.
In December 2013, the FASB issued AccountingStandards Update No. 2013-12, Definition of a PublicBusiness Entity. GRE is currently in the process ofevaluating this guidance; however, GRE believes it meetsthe definition of a public business entity due to theissuance of debt securities that are traded on an over-the-counter market.
4. LEASING TRANSACTIONS OPERATING LEASES — GRE is the lessee on variousoperating leases for equipment used in its operations.These transactions are governed by the terms of variousmaster lease agreements. The lease term of each leaseditem is determined at the time it is added to its respectivemaster lease. Original lease terms ranged from 60 to 96months. Falkirk is the lessee on various short-termoperating leases for equipment. Blue Flint is the lessee onoperating leases for railroad cars and other equipment,with terms expiring at various times through 2017. Leaseexpense was $4.0 million, $4.7 million, and $2.1 millionin 2013, 2012, and 2011, respectively.
The schedule of GRE and Blue Flint future minimum leasepayments as of December 31, 2013, is as follows (inthousands):
Years Ending BlueDecember 31 Flint GRE
2014 $ 2,770 $ 7502015 2,770 5042016 891 4242017 74 3582018 331Thereafter 282
$ 6,505 $ 2,649
CAPITAL LEASES — GRE is the lessee of a dragline usedin the Falkirk coal mining operations. The original leaseagreement was due to expire in 2005. GRE amendedthis lease in 2001 to extend the term to 2015, at whichtime GRE will purchase the asset for $1. The grossamount of this lease was $48.3 million at December 31,2013, with accumulated amortization of $46.7 millionand $45.6 million as of December 31, 2013 and 2012,respectively. GRE has the right of first refusal should adisposition of property occur. The principal and interestpayments were $1.6 million for both 2013 and 2012.
GRE entered into an agreement as the lessee of railroadcars to be used in the future operation of the SpiritwoodStation generation facility. The lease expires in 2020.The gross amount of the lease was $7.6 million atDecember 31, 2013, with accumulated amortization of$2.7 million and $1.9 million at December 31, 2013 and2012, respectively. The principal and interest paymentswere $1.1 million for both 2013 and 2012.
Falkirk has also leased certain equipment that is used inmining operations. The gross amount of these leases was$131.1 million and $137.1 million and the accumulatedamortization was $54.1 million and $46.3 million as ofDecember 31, 2013 and 2012, respectively. Theseamounts are recorded in coal mine plant andaccumulated depreciation and amortization in theconsolidated balance sheets.
Notes to Consolidated Financial StatementsCONTINUED

39
The schedule of future minimum lease payments for GREand Falkirk leases as of December 31, 2013, is asfollows (in thousands):
Years EndingDecember 31 Falkirk GRE
2014 $ 17,698 $ 3,4562015 19,196 1,8562016 16,213 1,0562017 12,590 1,0562018 10,116 1,056Thereafter 10,865 1,320
Total minimum lease payments 86,678 9,800Amounts representing interest (8,259) (1,485)
Present value of minimum lease payments 78,419 8,315Current maturities (14,792) (2,896)
Long-term capital lease obligations — net $ 63,627 $ 5,419
The current and long-term portions of the capital leaseobligations are included in current portion of long-termobligations and long-term obligations in the consolidatedbalance sheets (see Note 5).
5. LONG-TERM OBLIGATIONSThe consolidated long-term obligations as of December 31, 2013 and 2012, are as follows (in thousands):
2013 2012
First Mortgage Bonds, Series 2007A, 5.829%, due 2014–2017 $ 200,300 $ 252,900First Mortgage Bonds, Series 2007A, 6.254%, due 2018–2038 739,100 739,100First Mortgage Bonds, Series 2008A, 7.233%, due 2014–2038 366,816 375,156First Mortgage Bonds, Series 2008B, 3.0999%, due 2014–2023 16,667 18,333First Mortgage Notes, Series 2009A, 5.0% to 7.15%, due 2014–2024 106,800 120,800First Mortgage Bonds, Series 2009B, 5.81% to 6.94%, due 2014–2031 380,000 390,000First Mortgage Note, Series 2010A, 4.875%, due 2026 23,000 23,000First Mortgage Note, Series 2010B, 5.15%, due 2040 50,000 50,000First Mortgage Note, Series 2010C, 3.5%, due 2038 33,000 33,000First Mortgage Bonds, Series 2010D, 4.478%, due 2014–2030 382,000 395,500Syndicated Credit Facility, National Rural Utilities Cooperative Finance Corp, 1.42% at
December 31, 2013, due 2016 285,000 300,000Department of Energy, 0.00%, due 2014–2028, 5.2% to 6.1% imputed interest 6,463 6,932Term Note, LIBOR plus 1.375%, 1.545% at December 31, 2013, due 2014–2019 9,000Term Note, 2.35%, due 2014–2019 5,205Capitalized lease obligations, mining equipment, ends 2015, 6.3% imputed interest 2,962 4,310Capitalized lease obligations, Spiritwood coal cars, ends 2020, 6.9% imputed interest 5,353 6,016Capitalized lease obligations, Falkirk Mine, 1.2% to 5.9% imputed interest 78,419 93,314Term Note, Blue Flint, 5.8%, due 2014–2021 14,769 16,615Term Note, Blue Flint, LIBOR plus 3.75%, 3.92% at December 31, 2013, due 2014–2021 13,898 15,652Revolving Line of Credit, Blue Flint, LIBOR plus 4%, due 2016 5,600Term Note, DSAF, EB-5 Program, 7%, due 2019 25,000Other — at various rates and maturities 3,581 3,825Less unamortized bond discount (14,586) (15,806)
2,732,747 2,834,247Current maturities (126,950) (122,141)Long-term obligations — net $ 2,605,797 $ 2,712,106
Notes to Consolidated Financial StatementsCONTINUED

40
GRE issues secured debt under an Indenture ofMortgage, Security Agreement, and Financing Statement(“Indenture”). The Indenture requires GRE to establish andcollect rates reasonably expected to yield a specifiedmargins-for-interest level. Under the Indenture, GRE haslimitations on the retirement of patronage capital if, afterthe distribution, an event of default would exist or GRE’smembers’ capital would be less than 20% of total long-term debt and members’ capital. Substantially all of thetangible assets of GRE and the power purchase andtransmission service contracts with the members (see Note 1) are pledged as security under the Indenture.
The First Mortgage Note, Series 2010C (“Series 2010CNote”) bears an initial fixed interest rate (3.5%) throughthe initial term rate period, which ends June 30, 2015.After the initial term rate period, the Series 2010C Notecontinues in term rate mode. During the term rate mode,a fixed interest rate is determined periodically by theremarketing agent, as described in the agreement, for aninterest period of at least 180 days. After the initial termrate period, GRE has the option, subject to provisions inthe agreement, to effect a change in mode for all or anyportion of the Series 2010C Note from term rate modeto another form of mode, such as fixed rate, auction rate,daily rate, weekly rate, or other defined rate. After theinitial term rate period, if the Series 2010C Note issubject to remarketing and the remarketing proceeds areinsufficient, GRE will be required to purchase all or aportion of the Series 2010C Note. The Series 2010CNote is not supported by a dedicated liquidity facility.
GRE has a $600.0 million unsecured five-year revolvingcredit facility for which National Rural UtilitiesCooperative Finance Corporation (CFC) is theadministrative agent. This facility was renewed in 2011and expires on June 6, 2016. This facility can beincreased, at GRE’s option, to $775.0 million subject tocertain terms and conditions. At December 31, 2013 and2012, the outstanding balance of this facility was$285.0 million and $300.0 million, respectively. Theseamounts are recorded in long-term obligations in theconsolidated balance sheets. GRE also has an unsecuredline of credit facility with CoBank ACB (“CoBank”) for$30.0 million. This facility’s terms and conditions arerenewable annually, and the principal balance must bepaid in full within one business day of expiration, unlessunilaterally extended by CoBank. This facility expires onOctober 31, 2014. At December 31, 2013 and 2012,the outstanding balance of this facility was $10.0 millionand $10.0 million, respectively.
GRE is subject to a number of customary covenants underthe Indenture, other debt agreements, and the revolvingcredit facility.
Blue Flint’s revolving line of credit has a limit of $14.0million. Blue Flint also has a seasonal line of credit for$10.0 million that expires July 2014. At December 31,2013 and 2012, the outstanding balance on this facilitywas $0 for both years.
Substantially all of the assets of Blue Flint are pledgedas security under the Blue Flint Term Notes. Blue Flint issubject to a number of restrictive covenants under its debtagreements.
DSAF’s term note is collateralized by a subordinatedsecurity interest in substantially all of the assets of DSA.
Future maturities on long-term obligations as ofDecember 31, 2013, are as follows (in thousands):
Years EndingDecember 31
2014 $ 126,9502015 125,2442016 412,2182017 125,4672018 120,516Thereafter 1,822,352
$ 2,732,747
6. INVESTMENTSGRE’s investments as of December 31, 2013 and 2012,are as follows (in thousands):
2013 2012
Other investments:Capital term certificates — CFC $ 19,644 $ 19,644Cooperative investment patronage allocations 8,579 8,072
Total other investments 28,223 27,716Restricted investments — investments for
deferred compensation 12,285 10,762
$ 40,508 $ 38,478
Notes to Consolidated Financial StatementsCONTINUED

41
The capital term certificates bear interest ranging from 5% to 7.5% and a portion of them are required underborrowing arrangements with CFC. At December 31, 2013, GRE had no commitments to purchase additional capitalterm certificates from CFC. Capital term certificates are classified as held to maturity and reported at amortized costusing the specific identification method.
GRE’s cooperative investment patronage allocations are reported at cost, plus allocated equities.
GRE’s investments held for deferred compensation are reported at fair value.
The investments reported at amortized cost at December 31, 2013 and 2012, are as follows (in thousands):
GrossAmortized Unrealized Unrealized Fair
2013 Cost Gains Losses Value
Long-term investments — held-to-maturitysecurities — capital term certificates $ 19,644 $ - $ - $ 19,644
2012
Long-term investments — held-to-maturitysecurities — capital term certificates $ 19,644 $ - $ - $ 19,644
Maturities on investments reported at amortized cost as of December 31, 2013, are as follows (in thousands):
One to five years $ -Five to 10 yearsGreater than 10 years 19,644
$ 19,644
Interest income received on all investments was $1.6 million, $2.3 million, and $2.1 million in 2013, 2012, and 2011,respectively. This income is recorded in interest income in the consolidated statements of operations.
contract inception and it is reported as “Deferredcharges — financing related” in the consolidatedbalance sheet at December 31, 2012.
During 2013, GRE terminated certain interest ratesswaps and the swaption as these instruments wereconsidered less effective hedges in the management ofinterest rate exposure due to delays in the anticipatedtiming of forecasted debt issuances. The proceeds fromthe termination of these instruments, less fees and theswaption premium, of $36.2 million are deferred as aregulatory liability. As the termination of theseinstruments did not coincide with a related debt issuance,the net proceeds will be amortized to the incomestatement under regulatory accounting as determined bythe board of directors.
GRE is exposed to credit risk as a result of entering intothese interest rate hedging agreements. However, as ofDecember 31, 2013, all of the counterparties with
7. DERIVATIVE INSTRUMENTSAs part of its risk management program, GRE mayperiodically use interest rate swaps and interest rateswaptions to manage market exposures. Terms of theswap and swaption agreements are structured to matchthe terms of the risk being managed and are generallyheld to maturity. Marked to market gains and lossesrelated to the interest rate swaps and swaptions aredeferred as regulatory assets or liabilities undergenerally accepted accounting principles and continue tobe deferred until the related debt transaction iscomplete. At that time, the interest rate swaps are settledand any gains and losses are amortized to the incomestatement over the term of the related debt issuance.
During 2012, GRE entered into an interest rate swaptionthat gave GRE the right, but not the obligation, to enterinto a swap in which GRE would pay a fixed rate andreceive a floating rate. GRE paid a swaption premium at
Notes to Consolidated Financial StatementsCONTINUED
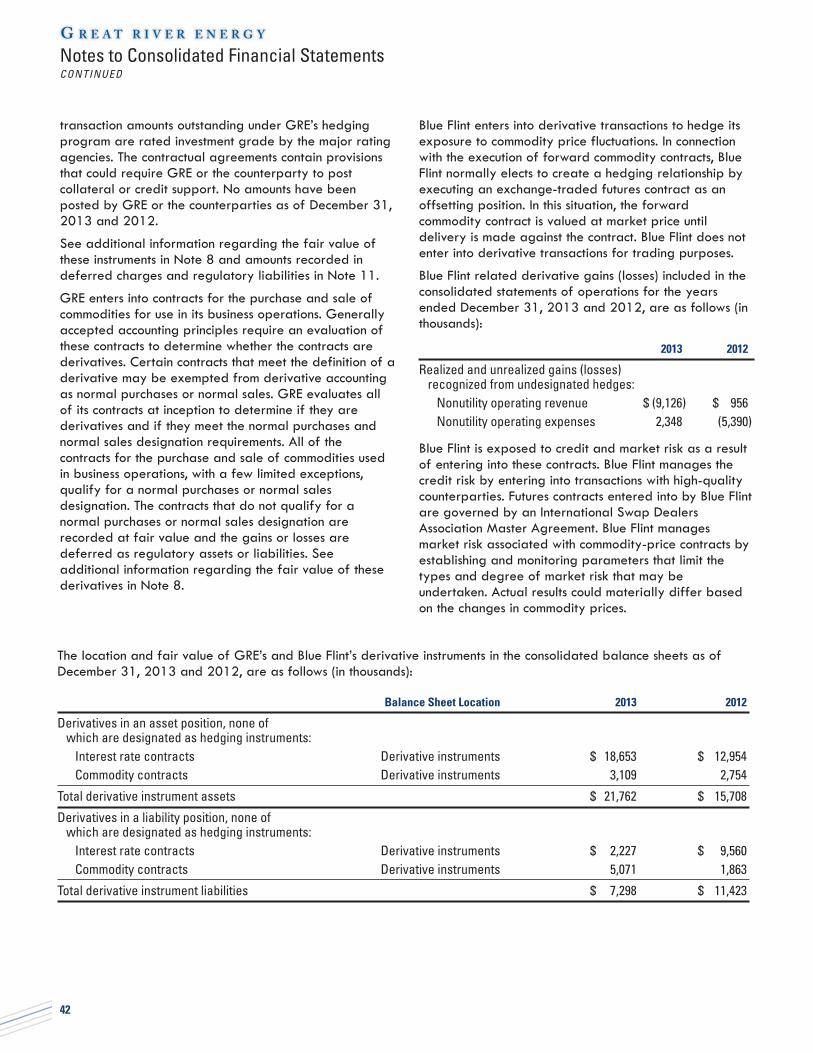
42
transaction amounts outstanding under GRE’s hedgingprogram are rated investment grade by the major ratingagencies. The contractual agreements contain provisionsthat could require GRE or the counterparty to postcollateral or credit support. No amounts have beenposted by GRE or the counterparties as of December 31,2013 and 2012.
See additional information regarding the fair value ofthese instruments in Note 8 and amounts recorded indeferred charges and regulatory liabilities in Note 11.
GRE enters into contracts for the purchase and sale ofcommodities for use in its business operations. Generallyaccepted accounting principles require an evaluation ofthese contracts to determine whether the contracts arederivatives. Certain contracts that meet the definition of aderivative may be exempted from derivative accountingas normal purchases or normal sales. GRE evaluates allof its contracts at inception to determine if they arederivatives and if they meet the normal purchases andnormal sales designation requirements. All of thecontracts for the purchase and sale of commodities usedin business operations, with a few limited exceptions,qualify for a normal purchases or normal salesdesignation. The contracts that do not qualify for anormal purchases or normal sales designation arerecorded at fair value and the gains or losses aredeferred as regulatory assets or liabilities. Seeadditional information regarding the fair value of thesederivatives in Note 8.
Blue Flint enters into derivative transactions to hedge itsexposure to commodity price fluctuations. In connectionwith the execution of forward commodity contracts, BlueFlint normally elects to create a hedging relationship byexecuting an exchange-traded futures contract as anoffsetting position. In this situation, the forwardcommodity contract is valued at market price untildelivery is made against the contract. Blue Flint does notenter into derivative transactions for trading purposes.
Blue Flint related derivative gains (losses) included in theconsolidated statements of operations for the yearsended December 31, 2013 and 2012, are as follows (inthousands):
2013 2012
Realized and unrealized gains (losses) recognized from undesignated hedges:
Nonutility operating revenue $ (9,126) $ 956Nonutility operating expenses 2,348 (5,390)
Blue Flint is exposed to credit and market risk as a resultof entering into these contracts. Blue Flint manages thecredit risk by entering into transactions with high-qualitycounterparties. Futures contracts entered into by Blue Flintare governed by an International Swap DealersAssociation Master Agreement. Blue Flint managesmarket risk associated with commodity-price contracts byestablishing and monitoring parameters that limit thetypes and degree of market risk that may beundertaken. Actual results could materially differ basedon the changes in commodity prices.
The location and fair value of GRE’s and Blue Flint’s derivative instruments in the consolidated balance sheets as ofDecember 31, 2013 and 2012, are as follows (in thousands):
Balance Sheet Location 2013 2012
Derivatives in an asset position, none of which are designated as hedging instruments:
Interest rate contracts Derivative instruments $ 18,653 $ 12,954Commodity contracts Derivative instruments 3,109 2,754
Total derivative instrument assets $ 21,762 $ 15,708
Derivatives in a liability position, none ofwhich are designated as hedging instruments:
Interest rate contracts Derivative instruments $ 2,227 $ 9,560Commodity contracts Derivative instruments 5,071 1,863
Total derivative instrument liabilities $ 7,298 $ 11,423
Notes to Consolidated Financial StatementsCONTINUED

43
8. FAIR VALUE OF FINANCIAL INSTRUMENTSGenerally accepted accounting principles establish a framework for measuring fair value by creating a hierarchy forobservable independent market inputs and unobservable market assumptions, and provides for required disclosuresabout fair value measurements. Considerable judgment may be required in interpreting market data used to developthe estimates of fair value. Accordingly, the estimates presented herein are not necessarily indicative of the amountsthat could be realized in a current market exchange. The use of different market assumptions and/or estimationmethodologies may have a material effect on the estimated fair value.
A description of the inputs used in the valuation of assets and liabilities are as follows:
Level 1 — Inputs represent unadjusted quoted prices for identical assets or liabilities exchanged in active markets.
Level 2 — Inputs include directly or indirectly observable inputs other than Level 1 inputs, such as quoted prices forsimilar assets or liabilities exchanged in active or inactive markets; quoted prices for identical assets or liabilitiesexchanged in inactive markets; and other inputs that are considered in fair value determinations of the assets orliabilities.
Level 3 — Inputs include unobservable inputs used in the measurement of assets and liabilities. Management is requiredto use its own assumptions regarding unobservable inputs because there is little, if any, market activity in the assets orliabilities or related observable inputs that can be corroborated at the measurement date.
Assets are classified in their entirety based on the lowest level of input that is significant to the fair value measurement.GRE’s policy is to recognize significant transfers between levels at December 31.
A summary of the assets and liabilities at fair value at December 31, 2013 and 2012, set forth by level within the fairvalue hierarchy, is as follows (in thousands):
Assets at Fair Value as of December 31, 2013Active Markets Other Significant
for Identical Observable UnobservableAssets Inputs Inputs
Totals (Level 1) (Level 2) (Level 3)
Assets:Cash equivalents — money market funds $ 181,171 $ 181,171 $ - $ -Restricted investments — deferred compensation:
Money market funds 3,202 3,202Mutual funds:
Domestic stock funds 4,951 4,951Balanced funds 1,131 1,131Fixed income funds 1,324 1,324International stock funds 1,677 1,677
Interest rate contracts 18,653 18,653Commodity derivatives 3,109 3,106 3
Total assets $ 215,218 $ 196,562 $ 18,656 $ -
Liabilities:Interest rate contracts $ 2,227 $ - $ 2,227 $ -Commodity derivatives 5,071 3,499 1,572
Total liabilities $ 7,298 $ 3,499 $ 3,799 $ -
Notes to Consolidated Financial StatementsCONTINUED

44
The changes in GRE’s Level 3 assets measured at fairvalue on a recurring basis during the year endedDecember 31, 2013, are as follows (in thousands):
InterestRate Contracts
Balance — beginning of year $ 2,242Total gains or losses (realized/unrealized)
included in regulatory liabilities 1,078PurchasesSales (3,320)Settlements
Balance — end of year $ -
For the years ended December 31, 2013 and 2012,there were no significant transfers in or out of Levels 1, 2,or 3.
MONEY MARKET ACCOUNTS — Fair value isdetermined using quoted prices in active markets foridentical assets.
MUTUAL FUNDS — Shares of registered investmentcompanies (mutual funds) are categorized as Level 1;they are valued at quoted market prices that representthe net asset value of shares held at year-end.
INTEREST RATE CONTRACTS — Fair value isdetermined by comparing the difference between the netpresent value of the cash flows for the swaps at theirinitial fixed rate and the current market fixed rate. Theinitial fixed rate is quoted in the swap agreement andthe current market fixed rate is corroborated byobservable market data and categorized as Level 2. Thefair value of the swaption is estimated utilizing an option-pricing model based on several inputs, including thenotional amount, the forward London InterBank OfferedRate (LIBOR) swap rates, the option volatility, the fixedrate on the underlying swap, the time to expiration, theterm of the underlying swap, and discount rates. Asvaluations of comparable instruments are generally notable to be corroborated by market data, the swaption iscategorized as Level 3.
Assets at Fair Value as of December 31, 2012Active Markets Other Significant
for Identical Observable UnobservableAssets Inputs Inputs
Totals (Level 1) (Level 2) (Level 3)
Assets:Cash equivalents — money market funds $ 294,773 $ 294,773 $ - $ -Restricted investments — deferred compensation:
Money market funds 1,920 1,920Mutual funds:
Domestic stock funds 3,911 3,911Balanced funds 1,172 1,172Fixed income funds 2,840 2,840International stock funds 919 919
Interest rate contracts 12,954 10,712 2,242Commodity derivatives 2,754 1,315 1,439
Total assets $ 321,243 $ 306,850 $ 12,151 $ 2,242
Liabilities:Interest rate contracts $ 9,560 $ - $ 9,560 $ -Commodity derivatives 1,863 80 1,783
Total liabilities $ 11,423 $ 80 $ 11,343 $ -
Notes to Consolidated Financial StatementsCONTINUED

45
COMMODITY DERIVATIVES — Exchange traded futurescontracts and financial transmission rights are valued atquoted market prices and are categorized as Level 1.Fair value for forward contracts is determined bycomparing the difference between the net present valueof the cash flows at the initial price and the currentmarket price. The initial price is quoted in the contractand the market price is corroborated by observablemarket data. These contracts are categorized as Level 2.
GRE continuously monitors the creditworthiness of thecounterparties to its derivative contracts and assesses thecounterparties’ ability to perform on the transactions setforth in the contracts. Liability positions are generally not
adjusted, as GRE has the ability and intent to performunder each of the contracts. In the instance of assetpositions, GRE considers general market conditions andthe observable financial health and outlook of specificcounterparties; forward looking data, such as creditdefault swaps, when available; and historical defaultprobabilities from credit rating agencies in evaluating thepotential impact of nonperformance risk to derivativepositions. Given this assessment, when determining thefair value of derivative assets, the impact of consideringcredit risk was immaterial to the fair value of derivativeassets presented in the consolidated balance sheets.
The estimated fair values of GRE’s financial instruments carried at cost, other than capital leases, at December 31,2013 and 2012, are as follows and are provided for disclosure purposes only (in millions):
2 013 2 012
Carrying Fair Carrying FairCost Value Cost Value
Long-term receivables $ 3.6 $ 3.5 $ 4.7 $ 4.7Long-term obligations 2,646.0 3,066.5 2,685.8 3,292.8
The estimated fair values of GRE’s long-term receivables and long-term obligations, other than capital leases, werebased on present value models using current rates available for similar issues with similar credit ratings. These fairvalue measurements would be characterized as Level 2.
The carrying amounts of GRE’s remaining financial instruments included in current assets and current liabilitiesapproximate their fair value. For other investments — capital term certificates, the carrying amount is assumed toapproximate fair value, as these instruments generally must be held as a condition of financing.
9. INCOME TAXESGRE is a nonprofit taxable cooperative subject to federal and state income taxation and is allowed a deduction formargins allocated to members as patronage capital.
GRE had no regular federal income tax expense during 2013, 2012, or 2011 due to a net loss position. This net lossposition was primarily the result of the allocation of margins to members, tax depreciation in excess of depreciationrecorded for financial reporting purposes, and the deduction of certain costs for income tax reporting purposes, whichwere deferred for financial reporting purposes.
Notes to Consolidated Financial StatementsCONTINUED

46
The noncurrent income tax asset — net is recorded indeferred charges — other in the consolidated balancesheets.
These deferred taxes result from differences in therecognition of accounting transactions for tax andfinancial reporting purposes. The primary temporarydifferences relate to depreciation, the sale andleaseback transaction, deferred charges, retirementbenefits, and certain financial reserves not deductible fortax purposes until paid.
As of December 31, 2013, GRE had a federal netoperating loss (NOL) of $379.4 million that can be usedto offset taxable income in the carryforward period.These NOLs expire in varying amounts from 2022through 2031. GRE has a tax credit carryforward of$7.5 million and a prepaid alternative minimum tax(AMT) credit of $0.6 million. The tax credits expire invarying amounts from 2014 through 2031, while the AMTcredit has no expiration.
There were no uncertain tax positions that were materialto GRE’s results of operations or financial position andGRE does not expect any change to these positions in thenext 12 months.
In the ordinary course of business, there is inherentuncertainty in quantifying GRE’s income tax positions.GRE assesses its income tax positions and records taxbenefits for all years subject to examination based uponmanagement’s evaluation of the facts, circumstances, andinformation available at the reporting dates. For thosetax positions where it is more likely than not that a tax
The consolidated deferred income taxes as of December 31, 2013 and 2012, are as follows (in thousands):
2013 2012
GRE current deferred income tax assets — net $ 26,636 $ 23,220Falkirk current deferred income tax assets — net 546 773
Consolidated current deferred income tax asset — net $ 27,182 $ 23,993
Falkirk noncurrent income tax asset — net:Long-term deferred tax assets $ 12,427 $ 18,664Long-term deferred tax liabilities (9,012) (15,720)
Total deferred tax asset $ 3,415 $ 2,944
GRE noncurrent income tax liability — net:Long-term deferred tax liabilities $ 215,063 $ 190,057Long-term deferred tax assets (188,758) (167,341)Valuation allowance 331 504
Total deferred income tax liability $ 26,636 $ 23,220
benefit will be sustained, GRE records the largest amountof tax benefit with a greater than 50% likelihood ofbeing realized upon ultimate settlement with a taxingauthority that has full knowledge of all relevantinformation. For those income tax positions where it is notmore likely than not that a tax benefit will be sustained,no tax benefit has been recognized in the consolidatedfinancial statements. Where applicable, associatedinterest and penalties will also be recognized.
GRE has determined that its taxable years endedDecember 31, 2007, 2008, 2011, 2012, and 2013, arestill subject to examination under federal tax statutes.GRE has completed examinations by the Internal RevenueService of taxable years ended December 31, 2009and 2010. GRE’s taxable years ended December 31,2007 through 2013, are still subject to examinationunder state tax statutes.
TANGIBLE PROPERTY REGULATIONS — In September2013, the U.S. Treasury issued final regulationsaddressing the tax consequences associated with amountspaid to acquire, produce, or improve tangible property.The regulations have the effect of a change in law, andas a result, the impact should be taken into account in theperiod of adoption. In general, such regulations apply totax years beginning on or after January 1, 2014, withearly adoption permitted. Procedural guidance isexpected in early 2014 to facilitate implementation. GREexpects to implement most, if not all, of the provisions ofthe final regulations in 2014 and analysis performed todate indicates there would be no material impact to theconsolidated financial statements.
Notes to Consolidated Financial StatementsCONTINUED

47
10. PENDING LITIGATION, CONTINGENCIES, AND COMMITMENTSMIDCONTINENT INDEPENDENT SYSTEM OPERATOR (MISO) — The MISO market began on April 1, 2005. Due tothe nature of this market, various disputes and resettlements have taken place and some are still in process. It is theopinion of management that the resolution of the various open MISO disputes and resettlements will not have amaterial effect on the financial position, results of operations, or cash flows.
LITIGATION — GRE is involved in various legal actions arising in the normal course of business. It is the opinion ofmanagement that the resolution of such actions will not have a material adverse effect on the financial position, resultsof operations, or cash flows.
FUTURE COMMITMENTS — GRE is committed to the following estimated expenditures under the various purchasedpower and fuel contracts discussed below (in millions):
2 014 2 015 2 016 2 017 2 018 Thereafter Total
Dairyland Power Cooperative $ 19.1 $ 20.0 $ 21.2 $ 20.5 $ 21.1 $ 238.4 $ 340.3Wind energy purchases 62.9 64.5 66.9 66.9 67.5 1,182.5 1,511.2Other purchased power 15.0 9 .6 5 .0 5 .0 5 .0 40.1 79.7Fuel contracts 8.2 8.2
$ 105.2 $ 94.1 $ 93.1 $ 92.4 $ 93.6 $ 1,461.0 $ 1,939.4
$59.9 million, and $55.3 million for 2013, 2012, and2011, respectively.
GRE has long-term power agreements for the purchaseof energy from other various power suppliers. Agreementterms vary with the longest extending to 2045. GRE isobligated to purchase energy at either fixed or variableprices for the term of the agreements. GRE also has acontract for transmission associated with some of theseagreements that extends into 2015. GRE’s expenses forenergy and transmission purchased under theseagreements were $18.3 million, $19.4 million, and $18.0million for 2013, 2012, and 2011, respectively.
FUEL CONTRACTS — GRE has an agreement with CloudPeak Energy to provide coal to Stanton in North Dakota.GRE also has an agreement with The Burlington NorthernSanta Fe Railroad for the delivery of this coal. The coalagreement runs through the end of 2018; however, thereare no minimum commitments with this contract. Thefreight agreements extend through the end of 2014.GRE’s expenses under these agreements were $18.1million, $22.7 million, and $22.6 million in 2013, 2012,and 2011, respectively.
RECLAMATION GUARANTEE — Falkirk is required bythe North Dakota Public Service Commission (PSC) to carrybonds to cover reclamation of mined lands in the event thesurface mining and reclamation permit is revoked. Thesebonds are released by the PSC after a period of time,generally at least 10 years after final reclamation iscomplete and it has been determined that the land hasbeen returned to its approved postmining use. Under the
PURCHASED POWER CONTRACTS — GRE has a poweragreement with Dairyland Power Cooperative (DPC) toshare costs and benefits of a 379-megawatt generatingunit (“Genoa 3”) located near Genoa, Wisconsin. Thisagreement remains in effect until the retirement of theunit from service or until the payment in full of allobligations arising from the construction and operation ofthe unit, whichever is later. Under the agreement, thecapacity costs are shared equally by GRE and DPC, andGRE is required to pay additional amounts for actualenergy purchased. Included as future commitments in thetable above is GRE’s share of the estimated annualcapacity costs through the end of Genoa 3’s economicuseful life, which is estimated by DPC to be 2029. GRE’sexpenses for capacity, energy, and transmission chargesunder the agreement were $41.3 million, $38.3 million,and $33.6 million for 2013, 2012, and 2011,respectively. At December 31, 2013 and 2012, GRE hadprovided $12.0 million and $8.8 million, respectively, toDPC to fund its share of fuel inventory, which is allowedunder the agreement. This amount is recorded inprepaids and other current assets in the consolidatedbalance sheets.
GRE has long-term power agreements for the purchaseof 468 megawatts of wind energy from various powersuppliers. The agreements have varying terms and somehave extension options. The longest contract term extendsto 2041. GRE is obligated to purchase the energygenerated from these facilities at fixed prices for theterm of the agreements. GRE’s expenses for energypurchased under these agreements were $60.5 million,
Notes to Consolidated Financial StatementsCONTINUED

48
PSC’s self bond program, GRE provides a guarantee forthe majority of Falkirk’s reclamation obligation. As ofDecember 31, 2013, the aggregated value of thisguarantee is $68.5 million. No liability has been recordedin the consolidated financial statements related to thisguarantee as of December 31, 2013 and 2012. Falkirkhas recorded an asset retirement obligation for the costs tocover final reclamation (see Note 14).
LETTER OF CREDIT — GRE has issued a letter of creditfor $1.7 million to MISO in connection with its commodityderivatives. No amount is outstanding as of December31, 2013.
MEMBER GUARANTEES — As of December 31, 2013and 2012, GRE has guaranteed $0.8 million and $1.1million, respectively, of rural development loans thatvarious member distribution cooperatives have securedfrom Rural Utilities Services. The guaranteed loans arecollateralized in the form of land, buildings, orequipment. A liability of $0.1 million and $0.2 million hasbeen recorded in the consolidated financial statementsrelated to these guarantees as of December 31, 2013and 2012, respectively.
11. DEFERRED CHARGES AND REGULATORY LIABILITIESThe amounts of deferred charges recorded by GRE and Falkirk as of December 31, 2013 and 2012, are as follows (in thousands):
2 013 2 012
Regulatory assets:Premiums on refinanced long-term debt $ 11,186 $ 12,329Postretirement benefit plans 29,642 55,737Interest rate derivatives 2,226 9,561Settled interest rate hedging instruments 62,706 66,430Transaction costs related to NDRC 9,186 9,890Refined coal purchase costs 30,000 18,000Interest and plant costs 17,336 17,336Scheduled major outage maintenance 27,075Other 476 530
Total regulatory assets 189,833 189,813Other deferred charges 26,058 35,336
Total deferred charges $ 215,891 $ 225,149
Reported as:Deferred charges — financing related $ 97,259 $ 117,756Deferred charges — other 118,632 107,393
Total deferred charges $ 215,891 $ 225,149
The amounts of regulatory liabilities recorded by GRE as of December 31, 2013 and 2012, are as follows (in thousands):
2013 2012
Regulatory liabilities:Interest rate derivatives $ 18,653 $ 12,954Settled interest rate hedging instruments 36,212Deferred revenue 13,750Incentive-based rate treatment 10,422 4,237Other 4,858 3,395
Total regulatory liabilities $ 83,895 $ 20,586
Notes to Consolidated Financial StatementsCONTINUED

49
PREMIUMS ON REFINANCED LONG-TERM DEBTGRE has refinanced various issues of long-term debt,which resulted in the payment of premiums. This amountwill be fully amortized by 2038, the maturity date of the2007A bonds.
POSTRETIREMENT BENEFIT PLANS — GRE and Falkirkhave defined benefit pension plans and postretirementmedical plans for certain employees. GRE and Falkirkrecord regulatory assets related to items that arenormally reported as accumulated other comprehensiveincome for these plans. GRE has recorded a regulatoryasset of $23.6 million and $29.5 million, and Falkirk hasrecorded a regulatory asset of $6.0 million and $26.2million at December 31, 2013 and 2012, respectively.These amounts are adjusted each year as a result of theremeasurement of the obligations related to these plans.
INTEREST RATE DERIVATIVES — GRE has interest rateswaps that have not been settled as of December 31,2013 and interest rate swaps and a swaption that havenot been settled as of December 31, 2012. Certaininterest rate swaps have been recorded at fair value asa liability, with an offsetting regulatory asset, of $2.2million and $9.6 million as December 31, 2013 and2012, respectively. Certain interest rate swaps andswaption are recorded at fair value as an asset, with anoffsetting regulatory liability, of $18.7 million and $13.0million as of December 31, 2013 and 2012, respectively.Once these interest rate derivatives are settled, anydeferred regulatory asset or liability will be amortizedover the life of the related debt, unless there is norelated debt issuance and then the amortization periodwill be determined by regulatory accounting.
SETTLED INTEREST RATE HEDGING INSTRUMENTSGRE purchased interest rate swaps related to the 2010Dbonds and the 2008A bonds (see Note 5). The settlement ofthe swaps resulted in payments to the swap counterparties inthe amounts of $68.4 million in 2010 and $4.8 million in2008. These settled swaps are amortized over the life ofthe related debt and the amortization is included in interestexpense in the consolidated statement of operations. During2013, GRE terminated certain interest rate swaps and aswaption without a related debt issuance for net proceedsof $36.2 million. The net proceeds from this termination arerecorded as a regulatory liability and will be used toreduce future member rates.
TRANSACTION COSTS RELATED TO NDRCGRE incurred $11.3 million in external transaction costs inconnection with executing agreements with NDRC, or itssubsidiaries, for the sale and purchase of lignite and coaland for the lease of GRE’s refined coal processingfacility (see Note 1). This amount is being amortized overthe life of the facility lease, which is through 2027. Theamortization is included as fuel expense in theconsolidated statement of operations.
REFINED COAL PURCHASE COSTS — In connection withthe facility lease with NDRC and the related refined coalpurchase agreement, GRE is deferring certain refinedcoal purchase costs until January 31, 2020, which is theexercise date of the purchase option to buy out of thetransaction. GRE plans to expense these costs at the timethe purchase option is exercised or amortize over the lastseven years of the lease agreement in the event thepurchase option is not exercised.
INTEREST AND PLANT COSTS — During 2007, GREbegan construction of a generation facility in Spiritwood,North Dakota. GRE delayed construction of this facilityfor portions of 2010 and 2011. GRE has deferred coststotaling $17.3 million for interest, maintenance, and othercosts associated with this project while constructionactivities were suspended. This amount will be amortizedover the useful life of the facility once it is completed andplaced into service, which will be in November 2014.
SCHEDULED MAJOR OUTAGE MAINTENANCEDuring 2013, GRE began deferring scheduled majoroutage maintenance costs for CCS and Stanton andamortizing these costs over the maintenance cycle period,which is three years for CCS and four years for Stantonincluding the year of the outage. The amortization isincluded in operation and maintenance expense in theconsolidated statement of operations.
OTHER DEFERRED CHARGES — Other deferredcharges primarily relate to unamortized debt issuancecosts, deferred lease costs, and deferred income taxes.
DEFERRED REVENUE — GRE deferred the recognitionof $13.8 million of member electric revenue during 2013in accordance with regulatory accounting requirements.This deferred revenue will be recognized in memberelectric revenue in the future as determined by the boardof directors.
INCENTIVE-BASED RATE TREATMENT — GRE receivedapproval from the Federal Energy RegulatoryCommission (FERC) for incentive-based rate treatment forthe CapX2020 transmission projects and is collecting areturn on investment from MISO while these projects areunder construction. As a result, GRE has recordedamortization expense in an amount equal to the interestcapitalized to the project in the current year and hasrecorded an offsetting regulatory liability. Once aproject is complete and placed in service, the regulatoryliability will be amortized over the useful life of theunderlying assets and recorded as a reduction todepreciation expense.
The regulatory assets and regulatory liabilities arerecorded as per regulatory accounting requirements andhave all been approved by the board of directors.
Notes to Consolidated Financial StatementsCONTINUED

50
12. EMPLOYEE BENEFIT PLANSGRE offers various benefit plans to its employees. Approximately 28% of total employees that receive benefits arerepresented by two local labor unions under three collective bargaining agreements. Two agreements extend throughthe end of 2015 and one agreement extends through 2016.
PENSION PLANS — GRE has a defined benefit plan that covers certain employees who chose to remain in a definedbenefit plan, a nonqualified supplemental defined benefit plan that is frozen, and a qualified defined contributionretirement plan for the other employees. GRE also has a nonqualified defined contribution plan for certain employees.
Falkirk has a defined benefit plan that covers employees hired before January 1, 2000, a nonqualified supplementaldefined benefit plan that is frozen, and a defined contribution plan for the other employees. During 2013, Falkirkamended the defined benefit plan to freeze pension benefits effective January 1, 2014. As a result of thisamendment, Falkirk remeasured the plan and recorded a curtailment loss of $0.4 million during 2013.
Changes in benefit obligations and plan assets for all defined benefit plans for the years ended December 31, 2013and 2012, and the amounts recognized in the consolidated balance sheets as of December 31, 2013 and 2012, areas follows (in thousands):
2 013 2 012Falkirk GRE Falkirk GRE
Change in benefit obligation:Benefit obligation — beginning of year $ 71,896 $ 65,442 $ 63,924 $ 61,252Service cost 912 165 1,045 149Interest cost 2,793 1,887 2,902 2,269Actuarial (gain) loss (7,772) (3,846) 6,209 5,966Curtailment (5,360)Plan amendment (151)Benefits paid (2,404) (4,980) (2,184) (4,194)
Benefit obligation — end of year 59,914 58,668 71,896 65,442
Change in plan assets:Fair value of plan assets — beginning of year 47,698 50,571 39,812 47,146Actual return on assets 9,004 2,247 5,070 3,655Employer contributions 4,902 5,618 5,000 3,964Benefits paid (2,404) (4,980) (2,184) (4,194)
Fair value of plan assets — end of year 59,200 53,456 47,698 50,571
Funded status — end of year $ (714) $ (5,212) $ (24,198) $ (14,871)
Amounts recognized as components of net periodic benefit cost as of December 31, 2013 and 2012, are as follows (in thousands):
2 013 2 012Falkirk GRE Falkirk GRE
Other noncurrent liabilities $ 714 $ 5,212 $ 24,198 $ 14,871
Amounts not yet recognized as components of net periodic benefit cost as of December 31, 2013 and 2012, are asfollows (in thousands):
2 013 2 012Falkirk GRE Falkirk GRE
Transition obligation $ - $ 268 $ - $ 330Prior-service cost 163 89 890 117Accumulated loss 4,327 21,835 24,125 27,381
$ 4,490 $ 22,192 $ 25,015 $ 27,828
Notes to Consolidated Financial StatementsCONTINUED

51
The accumulated benefit obligation for the GRE defined benefit pension plans were $57.6 million and $64.4 million asof December 31, 2013 and 2012, respectively. The accumulated benefit obligation for the Falkirk defined benefitpension plan was $59.9 million and $64.7 million as of December 31, 2013 and 2012, respectively.
Components of net periodic benefit cost for the GRE and Falkirk defined benefit pension plans as of December 31,2013, 2012, and 2011, are as follows (in thousands):
2 013 2 012 2 011Falkirk GRE Falkirk GRE Falkirk GRE
Service cost $ 912 $ 165 $ 1,045 $ 149 $ 1,143 $ 131Interest cost 2,793 1,887 2,902 2,269 3,129 2,845Expected return on assets (3,833) (1,880) (3,397) (1,912) (3,295) (3,640)Amortization of prior-service cost 1,493 28 1,700 35 1,216 30Recognized net actuarial loss 134 1,333 225 1,145 225 714Curtailment 442Amortization of net transition obligation 63 63 63
Net periodic benefit cost $ 1,941 $ 1,596 $ 2,475 $ 1,749 $ 2,418 $ 143
The estimated amounts to be amortized from deferred charges into net periodic benefit cost in 2014 are $1.2 millionfor the GRE plans and $0.1 million for the Falkirk plans.
Weighted-average assumptions used to determine benefit obligations for GRE and Falkirk defined benefit pensionplans as of December 31, 2013, 2012, and 2011, are as follows:
2 013 2 012 2 011Falkirk GRE Falkirk GRE Falkirk GRE
Discount rate 4.75% 4.25% 3.90% 3.25% 4.55% 4.20%Rate of compensation increase N/A 3.75 3.75 3.75 3.75 3.75
Weighted-average assumptions used to determine periodic benefit cost for GRE and Falkirk defined benefit pensionplans as of December 31, 2013, 2012, and 2011, are as follows:
2 013 2 012 2 011Falkirk GRE Falkirk GRE Falkirk GRE
Discount rate 3.90/4.70% 3.25% 4.55% 4.20% 5.30% 5.10%Rate of compensation increase 3.75 3.75 3.75 3.75 3.75 3.75Expected return on assets 7.75 4.00 8.25 4.50 8.50 7.75
Falkirk used a discount rate of 3.90% for the period from January 1, 2013, to July 31, 2013, and a rate of 4.70% for the period from August 1, 2013, to December 31, 2013.
During 2012, GRE adjusted its strategy to achieve a mix of approximately 80% for near-term and longer-term benefitpayments and 20% of investments for long-term growth. During a portion of 2012, GRE’s strategy was a mix ofapproximately 60% near-term and longer-term benefit payments and 40% of investments for long-term growth.
The target allocations for the plan assets for 2013 and 2012 are 80% fixed-income securities and 20% equitysecurities. The investment strategy has a wide diversification of asset types, fund strategies, and fund managers. Equitysecurities primarily include investments in large-cap and mid-cap companies located in the United States; however,during a portion of 2012, the plan also invested in small-cap companies primarily located in the United States. Inaddition, during a portion of 2012, the plan invested in international equities, which were predominately, but notexclusively, located in developed countries and large-cap in focus.
Notes to Consolidated Financial StatementsCONTINUED
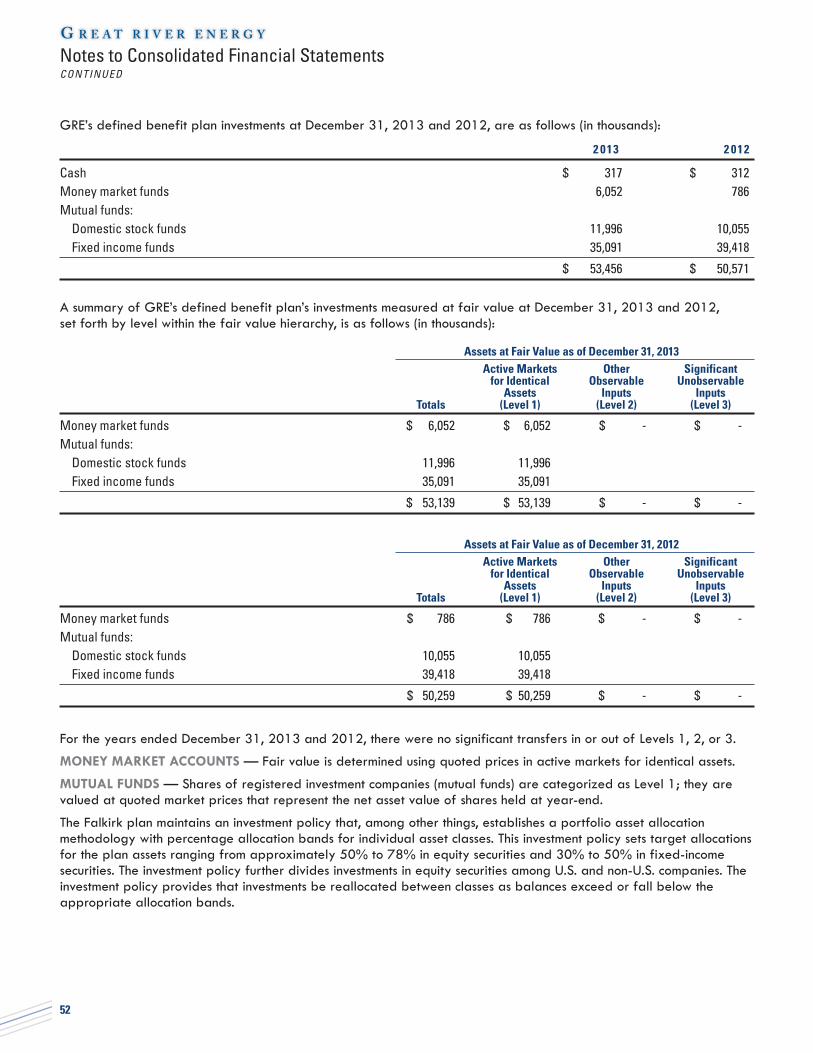
52
GRE’s defined benefit plan investments at December 31, 2013 and 2012, are as follows (in thousands):
2 013 2 012
Cash $ 317 $ 312Money market funds 6,052 786Mutual funds:
Domestic stock funds 11,996 10,055Fixed income funds 35,091 39,418
$ 53,456 $ 50,571
A summary of GRE’s defined benefit plan’s investments measured at fair value at December 31, 2013 and 2012, set forth by level within the fair value hierarchy, is as follows (in thousands):
Assets at Fair Value as of December 31, 2013Active Markets Other Significant
for Identical Observable UnobservableAssets Inputs Inputs
Totals (Level 1) (Level 2) (Level 3)
Money market funds $ 6,052 $ 6,052 $ - $ -Mutual funds:
Domestic stock funds 11,996 11,996Fixed income funds 35,091 35,091
$ 53,139 $ 53,139 $ - $ -
Assets at Fair Value as of December 31, 2012Active Markets Other Significant
for Identical Observable UnobservableAssets Inputs Inputs
Totals (Level 1) (Level 2) (Level 3)
Money market funds $ 786 $ 786 $ - $ -Mutual funds:
Domestic stock funds 10,055 10,055Fixed income funds 39,418 39,418
$ 50,259 $ 50,259 $ - $ -
For the years ended December 31, 2013 and 2012, there were no significant transfers in or out of Levels 1, 2, or 3.
MONEY MARKET ACCOUNTS — Fair value is determined using quoted prices in active markets for identical assets.
MUTUAL FUNDS — Shares of registered investment companies (mutual funds) are categorized as Level 1; they arevalued at quoted market prices that represent the net asset value of shares held at year-end.
The Falkirk plan maintains an investment policy that, among other things, establishes a portfolio asset allocationmethodology with percentage allocation bands for individual asset classes. This investment policy sets target allocationsfor the plan assets ranging from approximately 50% to 78% in equity securities and 30% to 50% in fixed-incomesecurities. The investment policy further divides investments in equity securities among U.S. and non-U.S. companies. Theinvestment policy provides that investments be reallocated between classes as balances exceed or fall below theappropriate allocation bands.
Notes to Consolidated Financial StatementsCONTINUED

53
Falkirk’s defined benefit plan investments at December 31, 2013 and 2012, are as follows (in thousands):
2 013 2 012
Money market funds $ 321 $ 488Domestic equity securities 31,707 24,804International equity securities 7,670 5,944Fixed income securities 19,502 16,462
$ 59,200 $ 47,698
The invested funds are stated at fair value using quoted market prices in active markets for identical assets as the fairvalue measurement (Level 1). For the years ended December 31, 2013 and 2012, there were no significant transfers inor out of Levels 1, 2, or 3.
To develop the expected long-term rate of return on asset assumptions, GRE and Falkirk considered the historicalreturns and the future expectations for returns on each asset class as well as target allocation of the pension portfolio.This resulted in 2013 and 2012 long-term rate of return assumptions of 4.0% and 4.5%, respectively, for GRE and2013 and 2012 long-term rate of return assumptions of 7.75% and 8.25%, respectively, for Falkirk.
The expected future benefits to be paid as of December 31, 2013, are as follows (in thousands):
Years EndingDecember 31 Falkirk GRE
2014 $ 2,601 $ 5,3072015 2,899 4,9332016 3,162 4,8052017 3,415 5,1932018 3,696 4,3942019–2022 20,783 19,610
GRE and Falkirk expect to make contributions of approximately $0.4 million and $0 million, respectively, to thedefined benefit pension plans during 2014.
GRE makes defined contributions to all employees not covered in the GRE defined benefit plan and matchingcontributions to all eligible employees under a defined contribution savings plan. Effective January 1, 2013, GREmerged its defined contribution plan with its defined contribution savings plan and renamed it a retirement plan. GREmade savings and matching contributions to its defined contribution retirement plan of $8.7 million in 2013 and to itstwo plans of $8.0 million and $7.7 million in 2012 and 2011, respectively. Falkirk’s contributions to the definedcontribution pension plan were $1.3 million, $1.2 million, and $0.9 million for 2013, 2012, and 2011, respectively.Falkirk’s contributions to a defined contribution savings plan were $1.7 million, $1.6 million, and $1.4 million for 2013,2012, and 2011, respectively.
POSTRETIREMENT MEDICAL BENEFITS — Employees retiring from GRE who elected to remain in the defined benefitpension plan, have attained age 55, and have at least 10 years of service are entitled to participate in the GREmedical insurance plan. Benefits to the former employees are in the form of monthly payments to cover a portion of thepremium charged for participation in the program. Additionally, employees retiring under a previously offered earlyretirement program could elect to participate in a medical insurance plan until they reach age 65. Benefits to theseretirees are in the form of monthly payments to cover a portion of the premium charged for participation in theprogram. Employees retiring from Falkirk also are eligible to participate in Falkirk’s medical insurance plan with thebenefit in the form of a supplement to the premium.
Costs for the unfunded postretirement medical plan are recognized in the year the employees render service.
Notes to Consolidated Financial StatementsCONTINUED

54
Changes in benefit obligations for the years ended December 31, 2013 and 2012, and amounts recognized in theconsolidated balance sheets as of December 31, 2013 and 2012, are as follows (in thousands):
2 013 2 012Falkirk GRE Falkirk GRE
Change in benefit obligation:Benefit obligation — beginning of year $ 7,670 $ 4,132 $ 7,497 $ 4,853Service cost 139 6 160 9Interest cost 230 119 289 175Actuarial (gain) loss (81) (252) 255 105Benefits paid (477) (777) (531) (1,010)
Benefit obligations — end of year $ 7,481 $ 3,228 $ 7,670 $ 4,132
Amounts recognized in balance sheets as of December 31, 2013 and 2012, are as follows (in thousands):
2 013 2 012Falkirk GRE Falkirk GRE
Current liabilities $ 586 $ 639 $ 550 $ 817Other noncurrent liabilities 6,895 2,589 7,120 3,315
$ 7,481 $ 3,228 $ 7,670 $ 4,132
Amounts not yet recognized as components of net periodic benefit cost as of December 31, 2013 and 2012, are asfollows (in thousands):
2 013 2 012Falkirk GRE Falkirk GRE
Prior service (credit) cost $ (134) $ 238 $ (694) $ 206Accumulated loss 1,347 1,195 1,551 1,518
$ 1,213 $ 1,433 $ 857 $ 1,724
Components of net periodic postretirement benefits cost for December 31, 2013, 2012, and 2011, are as follows (in thousands):
2 013 2 012 2 011Falkirk GRE Falkirk GRE Falkirk GRE
Service cost $ 139 $ 6 $ 160 $ 9 $ 193 $ 5Interest cost 230 119 289 175 365 239Amortization of prior service credit (560) (31) (560) (31) (560) (49)Recognized net actuarial losses 123 71 94 50 178 53
Net periodic (benefit) cost $ (68) $ 165 $ (17) $ 203 $ 176 $ 248
The estimated amounts to be amortized from deferred charges into net periodic benefit cost in 2014 are a net creditof less than $0.1 million for the GRE plan and a net credit of less than $0.1 million for the Falkirk plan.
The weighted-average assumptions used to determine postretirement obligations and net periodic postretirementbenefit costs for the years 2013, 2012, and 2011 are the same applicable assumptions used for the defined benefitpension plans except for Falkirk’s discount rate. Falkirk used 3.85%, 3.05%, and 3.90% for the discount rate for 2013,2012, and 2011, respectively.
Notes to Consolidated Financial StatementsCONTINUED

55
The expected future benefit payments to be paid as ofDecember 31, 2013, are as follows (in thousands):
Years EndingDecember 31 Falkirk GRE
2014 $ 587 $ 6402015 682 4952016 793 3692017 848 2682018 859 2302019–2022 3,973 910
The effect of a one percentage point change in health carecost trend rates on service and interest costs is not material inrelation to the consolidated financial statements taken as awhole.
13. MEMBER RELATED-PARTY TRANSACTIONSGRE provides electric and other services to the members.GRE received revenue of $836.4 million, $803.3 million, and$769.4 million in 2013, 2012, and 2011, respectively, forthese services. GRE received 39.8%, 40.4%, and 39.7% oftotal member revenue from two members for the yearsended December 31, 2013, 2012, and 2011, respectively.
GRE also receives various services from the members andpaid $9.9 million, $7.5 million, and $10.4 million for theseservices in 2013, 2012, and 2011, respectively.
GRE has accounts receivable from the members of $146.0million and $126.5 million at December 31, 2013 and 2012,respectively. GRE has notes receivable from the members of$0.6 million and $2.2 million as of December 31, 2013 and2012, respectively. These notes were issued at face value andhave an effective average interest rate of 5%.
GRE has notes payable to the members of $25.0 million and$20.6 million at December 31, 2013 and 2012, respectively.These notes relate to funds invested with GRE by the membersunder a member investment program. These funds are used byGRE to reduce short-term borrowings. The members receiveinvestment earnings based on GRE’s blended rate of return forspecified investments, adjusted for administrative costs.
14. ASSET RETIREMENT OBLIGATIONSGenerally accepted accounting principles require therecording of liabilities related to asset retirementobligations. An asset retirement obligation is the result oflegal or contractual obligations associated with theretirement of a tangible long-lived asset that result fromthe acquisition, construction, or development and/or thenormal operation of a long-lived asset. GRE determinesthese obligations based on an estimated asset retirementcost adjusted for inflation and projected to the estimatedsettlement dates, and discounted using a credit-adjusted,risk-free interest rate. GRE allocates the amortization for
the offsetting capitalized asset retirement cost to expenseusing the straight-line method over the remaining useful lifeof the related long-lived asset being retired.
GRE has recorded obligations related to capping andreclamation of ash disposal sites for certain base load powerplants, obligations related to future removal and disposal ofasbestos, and obligations related to the disposal of equipmentcontaining polychlorinated biphenyls. During 2012, GREevaluated its obligation for CCS’s ash disposal sites and due tochanges in the estimated reclamation costs and timing for thisobligation, GRE recorded an additional liability of $7.4 million.During 2013, GRE evaluated the timing of the CCS and Stantonash disposal obligations in conjunction with GRE’s change inestimated service lives for CCS and Stanton and recorded anadditional liability of $7.9 million due to this change inestimate. Falkirk has recorded an obligation related to the finalcosts to close its surface mines and reclaim the land disturbed asa result of normal mining operations. There are no assetslegally restricted for purpose of settling these obligations.
GRE also has an obligation to retire its direct current transmissionline upon abandonment. This line transmits the energy from CCSin North Dakota to the GRE service territory in Minnesota. GREhas not recorded a liability related to this obligation becausethe fair value cannot be reasonably estimated due to theretirement date being indefinite at this time.
A reconciliation of the beginning and ending aggregatecarrying amount of the obligations as of December 31,2013 and 2012, is as follows (in thousands):
2 013 2 012
Balance — beginning of year $ 40,347 $ 31,259New obligations incurred 101Obligations recorded as a result of
changes in estimated cash flows 7,911 7,666Accretion expense 2,606 1,856Obligations settled (609) (535)Balance — end of year $ 50,255 $ 40,347
These obligations are recorded in other noncurrent liabilitiesin the consolidated balance sheets. The obligations settledare the only transactions recognized in the consolidatedstatements of cash flows.
15. SUBSEQUENT EVENTSOn January 16, 2014, GRE amended and extended for oneyear its $600.0 million unsecured revolving credit facility.The facility now expires on June 6, 2017.
During January and February 2014, DSAF obtained additionallong-term debt financing of $50.0 million for the construction ofthe DSA biorefinery plant. Effective March 1, 2014, in exchangefor a 20.97% ownership interest, MAG transferred 16,400ownership units to third-party investors for $16.4 million.
Notes to Consolidated Financial StatementsCONCLUDED

GREAT RIVER ENERGY SENIOR STAFF
David Saggau, president and CEO
Jon Brekke, vice president, membership and energy markets
Jim Jones, vice president and chief information officer
Will Kaul, vice president, transmission
Rick Lancaster, vice president, generation
Eric Olsen, vice president and general counsel
Kandace Olsen, vice president, communications and human resources
Greg Ridderbusch, vice president, business development and strategy
Larry Schmid, vice president and chief financial officer
Louy Theeuwen, director, executive services
GREAT RIVER ENERGY BOARD OF DIRECTORS
Chair Michael Thorson, Todd-Wadena Electric Cooperative
Vice Chair Sherman Liimatainen, Lake Country Power
Secretary Gary Wilson, Steele-Waseca Cooperative Electric
Treasurer Robert Thompson, East Central Energy
Thomas Spence, Arrowhead Cooperative, Inc.
Brad Leiding, BENCO Electric Cooperative
Reuben Kokesch, Brown County Rural Electrical Association
Donald Holl, Connexus Energy
James Leroux, Connexus Energy
Peggy Kuettel, Cooperative Light and Power
Robert Kangas, Crow Wing Power
Dwight Thiesse, Crow Wing Power
Margaret Schreiner, Dakota Electric Association
Clay Van De Bogart, Dakota Electric Association
Joe Morley, East Central Energy
David Hernke, Goodhue County Cooperative Electric
Tim Kivi, Itasca-Mantrap Cooperative Electrical Association
Dale Anderson, Kandiyohi Power Cooperative
Robert Bruckbauer, Lake Country Power
Ken Hendrickx, Lake Region Electric Cooperative
Oria Brinkmeier, McLeod Cooperative Power Association
Harold Harms, Mille Lacs Energy Cooperative
Lee York, Nobles Cooperative Electric
Bruce Leino, North Itasca Electric Cooperative, Inc.
William O’Brien, Runestone Electric Association
Dennis O’Donnell, Stearns Electric Association
MEMBER COOPERATIVE CEOs
Agralite Electric Cooperative, Benson Kory Johnson, general manager
Arrowhead Cooperative, Inc., Lutsen Joe Buttweiler, acting general manager
BENCO Electric Cooperative, Mankato Wade Hensel, general manager
Brown County Rural Electrical Association, Sleepy EyeWade Hensel, general manager
Connexus Energy, RamseyMike Rajala, president and CEO
Cooperative Light and Power, Two HarborsSteven Wattnem, general manager
Crow Wing Power, BrainerdBruce Kraemer, CEO
Dakota Electric Association, FarmingtonGreg Miller, president and CEO
East Central Energy, BrahamSteve Shurts, president and CEO
Federated Rural Electric Association, JacksonRichard Burud, general manager
Goodhue County Cooperative Electric, ZumbrotaDouglas Fingerson, general manager
Itasca-Mantrap Cooperative Electrical Association, Park RapidsMichael Monsrud, president and CEO
Kandiyohi Power Cooperative, SpicerDavid George, CEO
Lake Country Power, Grand RapidsGreg Randa, general manager
Lake Region Electric Cooperative, Pelican RapidsTim Thompson, CEO
McLeod Cooperative Power Association, GlencoeGary Connett, acting general manager
Meeker Cooperative Light & Power Association, LitchfieldTim Mergen, CEO/general manager
Mille Lacs Energy Cooperative, AitkinRalph Mykkanen, general manager
Minnesota Valley Electric Cooperative, JordanRoger Geckler, general manager
Nobles Cooperative Electric, WorthingtonRichard Burud, general manager
North Itasca Electric Cooperative, Inc., BigforkJared Echternach, CEO
Redwood Electric Cooperative, ClementsRon Horman, general manager
Runestone Electric Association, AlexandriaRick Banke, CEO
South Central Electric Association, St. JamesRon Horman, general manager
Stearns Electric Association, MelroseRick Banke, general manager
Steele-Waseca Cooperative Electric, OwatonnaSyd Briggs, general manager
Todd-Wadena Electric Cooperative, WadenaRobin Doege, president and CEO
Wright-Hennepin Cooperative Electric Association, RockfordMark Vogt, president and CEO
Management and board of directors listed as of printing of annual report.
M A N A G E M E N T A N D B O A R D O F D I R E C T O R S
56

greatriverenergy.com
12300 Elm Creek BoulevardMaple Grove, MN 55369-4718