g Islamic Banking, Credit and Economic Growth: Some ...
29
Department of Economics and Finance Working Paper No. 16-02 http://www.brunel.ac.uk/economics Economics and Finance Working Paper Series Guglielmo Maria Caporale and Mohamad Husam Helmi Islamic Banking, Credit and Economic Growth: Some Empirical Evidence January 2016
Transcript of g Islamic Banking, Credit and Economic Growth: Some ...
Department of Economics and Finance
Working Paper No. 16-02
http://www.brunel.ac.uk/economics
Eco
nom
ics
and F
inance
Work
ing P
aper
Series
Guglielmo Maria Caporale and Mohamad Husam Helmi
Islamic Banking, Credit and Economic Growth: Some Empirical Evidence
January 2016

ISLAMIC BANKING, CREDIT
AND ECONOMIC GROWTH:
SOME EMPIRICAL EVIDENCE
Guglielmo Maria Caporale
Department of Economics and Finance
Brunel University London
Mohamad Husam Helmi
Department of Economics and Finance
Brunel University London
January 2016
Abstract This paper examines the effects of Islamic banking on the causal linkages between credit and
GDP by comparing two sets of seven emerging countries, the first without Islamic banks, and
the second with a dual banking system including both Islamic and conventional banks. Unlike
previous studies, it checks the robustness of the results by applying both time series and panel
methods; moreover, it tests for both long- and short-run causality. In brief, the findings
highlight significant differences between the two sets of countries reflecting the distinctive
features of Islamic banks. Specifically, the time series analysis provides evidence of long-run
causality running from credit to GDP in countries with Islamic banks only. This is confirmed
by the panel causality tests, although in this case short-run causality in countries without
Islamic banks is also found.
Keywords: Credit, growth, Islamic banking, causality tests
JEL classification: C32, C33, G21, O11
Corresponding author: Professor Guglielmo Maria Caporale, Department of Economics
and Finance, Brunel University, London, UB8 3PH, UK. Tel.: +44 (0)1895 266713. Fax: +44
(0)1895 269770. Email: [email protected]

1
1. Introduction
The finance-growth nexus has been extensively investigated in the literature, with
mixed evidence: some studies reach the conclusion that financial development boosts
economic growth (e.g., Schumpeter, 1911; McKinnon, 1973; Shaw, 1973; King and Levine,
1993; and Beck et al., 2014), whilst others argue that causality runs in the opposite direction
(e.g., Robinson, 1952; Berthelemy and Varoudakis, 1996; Ang, and McKibbin, 2007);
Rousseau and Wachtel (2011) have reported that the linkage has become weaker over time.
Moreover, there is no consensus on how to measure financial development and how to handle
the endogeneity problem. Most recently, the Bank for International Settlements (BIS) has
focused on the role of credit, and whether it might be used as an early warning indicator
(EWI), since excessive lending is thought to be one of the main factors that have caused the
global financial crisis of 2007-8. The credit-to-GDP ratio was in fact adopted by the Basel III
committee (2010) as a guide to build up countercyclical capital buffers during booms in order
to use them during crises (see Drehmann, 2013).
An interesting issue not thoroughly analysed in the literature is whether the
relationship between credit and economic growth is different in countries with Islamic banks.
Such institutions are not allowed to charge a predetermined interest rate, which is replaced by
the ex-post profit and loss sharing rate (Chong and Liu, 2009). Further, they can only provide
credit for transactions related to a tangible, underlying asset and cannot engage in any
speculative activities (Hasan, Dridi 2010; Khan, 2010 and Kammer et al., 2015). Only a few
empirical studies of countries with Islamic banking exist. Majid and Kassim (2010) find
evidence supporting the “supply-leading” view. By contrast, Furqani and Mulyany (2009)
report that economic growth causes financial development only in the short run in a country
with Islamic banking such as Malaysia - on the whole, their analysis is consistent with the
“demand-following” view. Abduh and Omar (2012) find bidirectional causality between
Islamic finance and economic growth in Indonesia. Most recently, Imam and Kpodar (2015)
conclude that countries with Islamic banks experience faster economic growth than those
without Islamic banks.
The present paper aims to examine in depth the effects of Islamic banking on the
causal linkages between credit and GDP by comparing two sets of seven emerging countries,
the first without Islamic banks, and the second with a dual banking system including both
Islamic and conventional banks. Unlike previous studies, it checks the robustness of the
results by applying both time series and panel methods. Moreover, it tests for both long- and
short-run causality; the former has been analysed in the traditional literature on the finance-

2
growth nexus, whilst the latter is relevant for the current debate on macro-prudential policies
and the attempt by the BIS to identify the best EWIs. Our analysis also seeks to contribute to
the on-going debate on whether the profit-and-loss sharing (PLS) paradigm of Islamic
banking might lead to an optimal distribution of funds (Siddiqi, 1999), and on the role of
Islamic finance in promoting economic growth rather than causing an increase in the price
level by linking all financial transaction to real economic activities (Chapra, 1992; Mills and
Presley, 999; Gulzar and Masih, 2015; Kammer et al., 2015).
In brief, our findings highlight significant differences between the two sets of
countries. Specifically, the time series analysis provides evidence of long-run causality
running from credit to GDP in countries with Islamic banks only. This is confirmed by the
panel causality tests, although in this case short-run causality in countries without Islamic
banks is also found. The layout of the paper is as follows: Section 2 briefly reviews the
principles of Islamic banking; Section 3 describes the data; Section 4 outlines the
methodology; Section 5 discusses the empirical results; finally, Section 6 offers some
concluding remarks.
2. Islamic Banking
The principles of Islamic finance are based on the Quran, hadith1 and Islamic
jurisprudence (Sharia). The first is the prohibition of interest payment (Riba), defined by
some Islamic scholars as usury, and by others as any pre-determined interest rate (Chong and
Liu, 2009). In the Holy Quran, ten statements/verses condemned the practice of Riba or
charging pre-determined interest rate. For example, the Surah/chapter al-Baqarah says: "O
you who believe! Fear God and give up whatever remains of Riba (usury), if you are
believers" (Quran 2:278). Another verse in the Surah al-Baqarah distinguishes between Riba
and trading: “Allah has allowed trading and forbidden Riba (usury)” (Quran 2:275).
Accordingly, many financial contracts are constructed on the basis of the difference between
trading and Riba as well as Islamic jurisprudence (Sharia), for instance Musharaka
(partnership), Mudharabah (profit-sharing), Murabahah (cost plus) and Ijarah (leasing)
contracts2. Thus, Islamic financial institutions are not allowed to make money through pure
financing, and financial contracts must be linked directly to real economic activities (Gulzar
and Masih, 2015; Kammer et al., 2015). Each financial transaction is underpinned by an
1 Hadith stands for the actions and quotations of the Prophet Mohammad, which are one of the main
sources of Islamic guidance in many aspects of Muslim life including economic activities. 2 For more details see Appendix A.

3
existing or potential real asset, in contrast to the case of conventional banks that can provide
credit without such constraints (see Siddiqi, 2006 and Askari, 2012).
The second principle is based on the profit and loss sharing paradigm (PLS) between
the two parties of any financial contract, which is seen as a crucial feature that distinguishes
Islamic from conventional banks. Furthermore, the conventional ex-ante interest rate, which
is a risk-shifting rate, is replaced by the ex-post profit and loss sharing rate (PLS), which is
instead a risk-sharing rate (Chong and Liu, 2009). This is thought to encourage Islamic banks
to invest in small and medium enterprises (SMEs) and long-term ventures, and thus to
stimulate economic growth (Chapra, 1992; Mills and Presley, 999; Iqbal and Mirakhor,
2013). Furthermore, the prohibition of the conventional ex-ante interest rate is viewed as a
foundation for improvements in both social justice and economic efficiency (El-Gamal, 2006
and Berg and Kim, 2014).
The third principle does not allow Islamic banks to engage in any speculative
transactions, option and futures contracts, hedging, toxic assets, gambling and funding of any
activities which are considered harmful to the community such as producing alcohol (Hasan,
Dridi 2010; Khan, 2010 and Kammer et al., 2015). It is thought that financing such activities
would cause an increase in prices rather than contributing to GDP. The fourth principle
requires asset-backing: transactions should be related to a tangible, underlying asset. In
addition, the main criterion for the allocation of credit by Islamic banks is the productivity of
the project, instead of the creditworthiness of the customer as in the case of conventional
banks. Therefore, credit is channelled to productive investment rather than speculative
activities, which are not allowed according to the principles of Islamic finance (Di Mauro et
al., 2013). Bernanke (2009) and Turner (2009) argue that excessive and unproductive credit
growth, investment in speculative transactions and interest-based debt financing were in fact
some of the main causes of the 2007-8 financial crisis. In contrast, in the Islamic banking
system, these activities are either not allowed or partly mitigated – for instance, as
highlighted by Mohieldin (2012), asset-backed debt guarantees a direct relationship between
loans and the real economy. In this way, greater market discipline and financial stability are
achieved (Di Mauro et al., 2013). Given the distinctive features of Islamic banking, one
would expect to find differences in the role of credit between countries with and without
Islamic banks. This is the issue analysed in the present study.

4
3. Data Description
We investigate the causal relationship between real credit to the private sector and
real GDP in fourteen emerging countries with sufficiently long time series. These are divided
into two groups (see Table 1): the first includes countries without Islamic banks, specifically
Latin American countries with a similar level of development to those with Islamic banks,
and without recent long periods of colonial history affecting their institutions (namely,
Argentina, Brazil, Chile, Costa Rica, Ecuador, Guatemala, and Peru); the second includes
countries with both Islamic and conventional banks according to the Bankscope database
(Malaysia, Indonesia, Turkey, Iran, Jordan, Singapore and Tunisia). Oil exporting countries
with Islamic banks are excluded from the sample since their economic growth might be
mainly driven by oil revenues rather than financial development or credit. However, Iran has
been included because its economy has many other industrial sectors and does not depend
solely on oil revenues.
Table 1. Sample of Countries Data Set 1
7 countries without
Islamic Banks
Period Data Set 2
7 countries with Islamic
Banks
Period
Argentina 1993Q1-2013Q1 Indonesia 2001Q4-2013Q1
Brazil 2001Q4-2013Q1 Turkey 2001Q4-2012Q4
Chile 1997Q4-2013Q1 Iran 1994Q1-2007Q4
Costa Rica 2001Q4-2012Q4 Singapore 2003Q1-2013Q1
Ecuador 2001Q4-2012Q2 Jordan 1992Q1-2012Q4
Guatemala 2001Q4-2012Q4 Tunisia 2000Q1-2012Q4
Peru 1996Q1-2012Q4 Malaysia 2001Q4-2012Q4
The data source is the International Monetary Fund (IMF) database. The (seasonally
adjusted) series are credit to the private sector (Cr), gross domestic product (GDP) and the
consumer prices index (CPI). These have been logged and real credit (RCr) and GDP
(RGDP) series have been created using the price deflator. Following the IMF definition of
credit,3 we calculated credit as gross credit injected into all private sectors of the economy,
i.e. excluding credit to the government. This is because credit to the private sector increases
in boom periods and decreases during credit crunches or crises, whereas credit to the public
sector moves in the opposite direction (see Drehmann et al., 2011).
3 “Claims on private sector include gross credit from the financial system to individuals, enterprises,
nonfinancial public entities not included under net domestic credit, and financial institutions not included
elsewhere” (IMF-IFS line 32d).

5
Table 2. Descriptive statistics for credit and GDP
Panel A: Countries without Islamic Banks
Variable Argentina Brazil Chile CostaRica Ecuador Guatemala Peru
Mean Credit 99870.15 704847.3 18740.63 5508.063 10928.92 63548.12 61504.52
GDP 683826.7 1257260 48099.18 3389.046 12900.84 65892.21 70018.58
St. Dev Credit 85834.51 253648.7 22983.08 3123.105 4946.739 21882.91 31564.11
GDP 595919.3 820646.9 7891.308 1407.419 4316.059 19632.00 29940.39
Min Credit 37680.37 336492.6 19387.08 1467.960 4965.563 31259.41 21759.39
GDP 223991.2 382406.9 9150.734 1417.687 6384.677 38467.71 32629.44
Max Credit 408004.0 1220474 97289.74 11000.14 21859.28 121762.2 142796.1
GDP 2461950 3093791 33867.75 5768.434 20984.91 101324.8 135014.2
Skewness Credit 2.027 0.324 0.500 0.189 0.594 0.404 1.186
GDP 1.466 0.806 0.398 0.158 0.249 0.245 0.693
Ex. kurtosis Credit 6.347 1.878 2.025 1.535 2.298 3.00 3.244
GDP 4.027 2.411 1.829 1.685 1.901 1.754 2.212
JB Credit 93.346*** 3.216 5.042 4.292 3.418 1.226 16.133***
GDP 32.585*** 5.652* 5.184 3.428 2.608 3.358 7.209**
Obs Credit 81 46 62 45 43 45 68
GDP 81 46 62 45 43 45 68
Panel B: Countries with Islamic Banks
Statistics Variable Indonesia Turkey Iran Singapore Jordan Tunisia Malaysia
Mean Credit 1095585 274679.2 171511.7 256633.6 6923.090 26284.25 686856.2
GDP 1118588 208677.6 175352.4 65438.53 2352.280 11538.97 161416.8
St. Dev Credit 680260.3 217948.5 236101.7 77686.10 4428.236 9612.233 191713.5
GDP 564432.2 83842.08 204990.3 15293.24 1433.630 3144.230 45998.68
Min Credit 294763.6 33557.72 4636.539 168642.4 2004.358 13123.26 448221.6
GDP 427350.1 68784.23 5269.603 39371.97 881.945 7162.824 88475.43
Max Credit 2656303 772647.7 988511.3 432203.2 16138.58 48086.03 1106141
GDP 2170798 360824.3 824121.5 87169.01 5687.685 17020.73 237320.7
Skewness Credit 0.410 0.821 1.778 0.753 0.742 0.775 0.586
GDP 0.730 0.185 1.413 -0.142 0.992 0.247 0.024
Ex. kurtosis Credit 2.486 2.558 5.382 2.396 2.031 2.568 2.222
GDP 1.804 2.060 4.102 1.795 2.576 1.656 1.766
JB Credit 4.601 5.430* 59.58*** 4.497 10.998*** 5.289* 3.716
GDP 4.028 1.913 29.93*** 2.619 14.415*** 4.186 2.856
Obs Credit 46 45 78 41 84 49 45
GDP 46 45 78 41 84 49 45 Note: *, **, and *** indicate significance at the 10 %, 5%, and 1% levels, respectively. JB is the Jarque-Bera
test for normality.
6
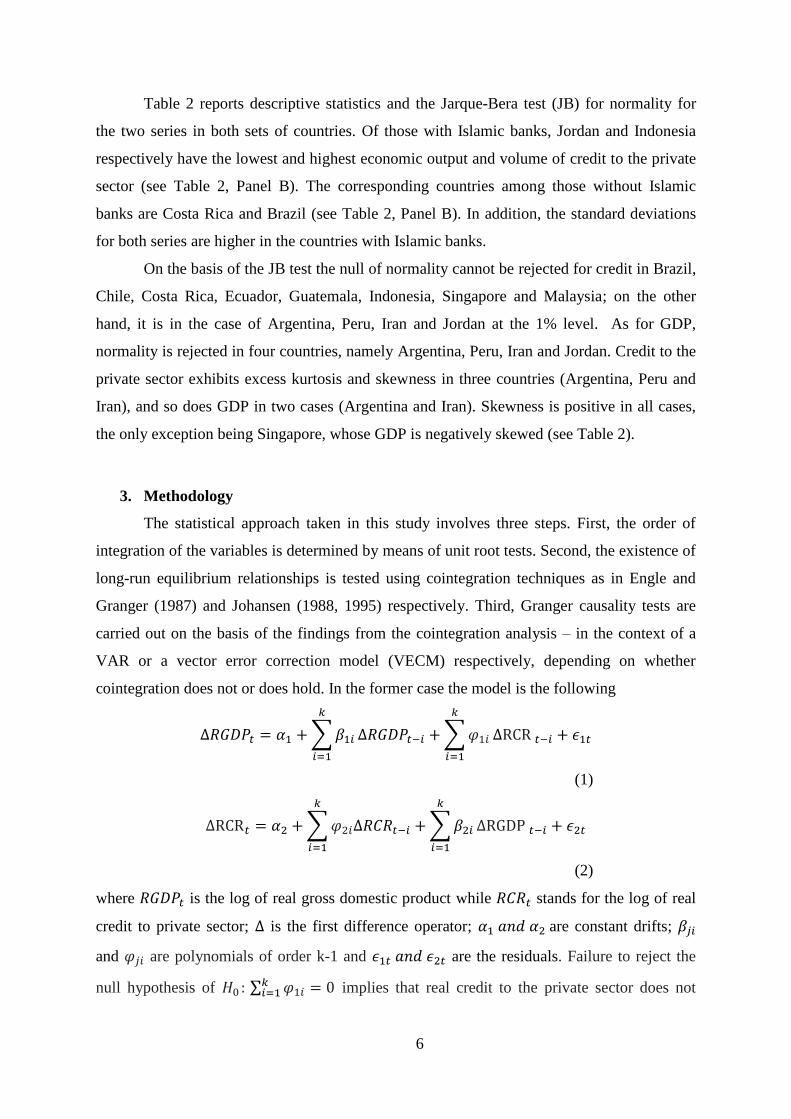
Table 2 reports descriptive statistics and the Jarque-Bera test (JB) for normality for
the two series in both sets of countries. Of those with Islamic banks, Jordan and Indonesia
respectively have the lowest and highest economic output and volume of credit to the private
sector (see Table 2, Panel B). The corresponding countries among those without Islamic
banks are Costa Rica and Brazil (see Table 2, Panel B). In addition, the standard deviations
for both series are higher in the countries with Islamic banks.
On the basis of the JB test the null of normality cannot be rejected for credit in Brazil,
Chile, Costa Rica, Ecuador, Guatemala, Indonesia, Singapore and Malaysia; on the other
hand, it is in the case of Argentina, Peru, Iran and Jordan at the 1% level. As for GDP,
normality is rejected in four countries, namely Argentina, Peru, Iran and Jordan. Credit to the
private sector exhibits excess kurtosis and skewness in three countries (Argentina, Peru and
Iran), and so does GDP in two cases (Argentina and Iran). Skewness is positive in all cases,
the only exception being Singapore, whose GDP is negatively skewed (see Table 2).
3. Methodology
The statistical approach taken in this study involves three steps. First, the order of
integration of the variables is determined by means of unit root tests. Second, the existence of
long-run equilibrium relationships is tested using cointegration techniques as in Engle and
Granger (1987) and Johansen (1988, 1995) respectively. Third, Granger causality tests are
carried out on the basis of the findings from the cointegration analysis – in the context of a
VAR or a vector error correction model (VECM) respectively, depending on whether
cointegration does not or does hold. In the former case the model is the following
∆𝑅𝐺𝐷𝑃𝑡 = 𝛼1 + ∑ 𝛽1𝑖
𝑘
𝑖=1
∆𝑅𝐺𝐷𝑃𝑡−𝑖 + ∑ 𝜑1𝑖
𝑘
𝑖=1
∆RCR 𝑡−𝑖 + 𝜖1𝑡
(1)
∆RCR𝑡 = 𝛼2 + ∑ 𝜑2𝑖∆𝑅𝐶𝑅𝑡−𝑖
𝑘
𝑖=1
+ ∑ 𝛽2𝑖
𝑘
𝑖=1
∆RGDP 𝑡−𝑖 + 𝜖2𝑡
(2)
where 𝑅𝐺𝐷𝑃𝑡 is the log of real gross domestic product while 𝑅𝐶𝑅𝑡 stands for the log of real
credit to private sector; ∆ is the first difference operator; 𝛼1 𝑎𝑛𝑑 𝛼2 are constant drifts; 𝛽𝑗𝑖
and 𝜑𝑗𝑖 are polynomials of order k-1 and 𝜖1𝑡 𝑎𝑛𝑑 𝜖2𝑡 are the residuals. Failure to reject the
null hypothesis of 𝐻0 : ∑ 𝜑1𝑖𝑘𝑖=1 = 0 implies that real credit to the private sector does not

7
Granger-cause real GDP. Similarly, failure to reject the null hypothesis of 𝐻0 : ∑ 𝛽2𝑖𝑘𝑖=1 = 0
implies that real GDP does not Granger-cause real credit to the private sector. Eqs. (1) and (2)
are estimated when 𝑅𝐺𝐷𝑃𝑡 𝑎𝑛𝑑 RCR𝑡 are I(1) and are not cointegrated using differenced
data, and in levels if the series are I(0).
Following Engle and Granger (1987), if the order of integration of the series is I(1)
and they are cointegrated, an error correction term (ECT) is introduced into the model.
Therefore, a VECM is specified as follows:
∆𝑅𝐺𝐷𝑃𝑡 = 𝛼1 + ∑ 𝛽1𝑖
𝑘
𝑖=1
∆𝑅𝐺𝐷𝑃𝑡−𝑖 + ∑ 𝜑1𝑖
𝑘
𝑖=1
∆𝑅𝐶𝑅 𝑡−𝑖 + 𝛿1𝐸𝐶𝑇𝑡−1 + 𝜖1𝑡
(3)
∆𝑅𝐶𝑅𝑡 = 𝛼2 + ∑ 𝜑2𝑖
𝑘
𝑖=1
∆𝑅𝐶𝑅𝑡−𝑖 + ∑ 𝛽2𝑖
𝑘
𝑖=1
∆𝑅𝐺𝐷𝑃𝑡−𝑖 + 𝛿2𝐸𝐶𝑇𝑡−1 + 𝜖2𝑡
(4)
where 𝛼1 𝑎𝑛𝑑 𝛼2 are constant drifts, 𝐸𝐶𝑇𝑡−1 is the error correction term, which represents the
deviations from the long-run cointegration relationship, and 𝛿1 𝑎𝑛𝑑 𝛿2 denote the speeds of
adjustment towards the long-run equilibrium, which are expected to be negative.
Therefore there are two sources of causality between 𝑅𝐺𝐷𝑃𝑡 and 𝑅𝐶𝑅𝑡, either
through the error correction term (𝐸𝐶𝑇𝑡−1) or through the lagged dynamic terms ∆𝑅𝐶𝑅 𝑡−𝑖 in
Eq. (3) or ∆𝑅𝐺𝐷𝑃𝑡−𝑖 in Eq. (4). Consequently, one can test for three types of causality
between real GDP and real credit to the private sector. First, one can test whether ∆𝑅𝐶𝑅 𝑡
Granger-causes ∆𝑅𝐺𝐷𝑃𝑡 in the short run by carrying out a Wald test of the null hypothesis
𝐻0 : ∑ 𝜑1𝑖 𝑘𝑖=1 = 0. Second, one can test for long-run causality by performing a weak-
exogeneity test on the coefficient of the lagged error correction term 𝐸𝐶𝑇𝑡−1. Failure to reject
the null hypothesis 𝐻0: 𝛿1=0 implies that real credit to the private sector does not Granger-
cause real GDP in the long run. Third, strong exogeneity can be tested by testing the joint
significance of the coefficients on the lagged dynamic terms and the lagged error correction
term (Engle et al., 1983 and Charemza and Deadman, 1997). The null hypothesis in this case
is 𝐻0: ∑ 𝜑1𝑖 𝑘𝑖=1 = 𝛿1 = 0. However, this test does not allow to distinguish between long-
and short-run causality (Ang and McKibbin, 2007).4
4 Note: the panel approach follows the same estimation process.

8
In the cointegration analysis, if the Engle-Granger (1987) and Johansen (1988, 1995)
tests produce contradictory results, more weight is attached to the former given the poor finite
sample properties of the latter (see Banerjee et al., 1986; Demetriades and Hussein, 1996) and
the fact that, being a two-stage residual-based test, any error occurring in the first stage is
passed directly onto the second stage (Asteriou and Hall, 2015). In the case of causality
inference, we follow Demetriades and Hussein (1996): if the findings from the VECM and
VAR specifications differ, we place more weight on the former.
Time-series techniques have been criticised because small sample distortions can
affect the power of standard unit root and cointegration tests (see Christopoulos and Tsionas,
2004). These issues can be addressed using panel approaches (Ang, 2008) to carry out
cointegration tests with higher power (Persyn and Westerlund, 2008). With this in mind, we
apply various panel methods as well to check the robustness of our findings (see below).
5. Empirical Analysis
5.1 Unit root tests
As a first step, we carry out a battery of unit root tests to examine the stochastic
properties of the individual series using Augmented Dickey-Fuller (ADF) (Dickey and Fuller,
1981) and Phillips-Perron (PP) tests (Phillips-Perron, 1988). These tests suggest that real
credit to the private sector and real GDP are non-stationary I(1) in the countries with and
without Islamic banks. We also applied panel unit root tests, namely the MW (Maddala and
Wu. 1999) and Im, Pesaran and Shin (IPS) tests (Im et al., 2003)5, which confirm that both
variables can be characterised as I(1).6
5.2 Cointegration Tests
Next, we test for the existence of a long-run relationship between real credit to the
private sector and real GDP. For this purpose we use both time series (Engle and Granger,
1987 and Johansen, 1988, 1995) and panel cointegration (Pedroni, 2004, Kao, 1999 and
Westerlund, 2007) methods. The Engle-Granger cointegration test results are reported in
Table 3. The null hypothesis of no cointegration is rejected only for Ecuador in the case of
the countries without Islamic banks (see Table 3, Panel A), and only for Iran at the 5%
significance level in the other group (see Table 3, Panel B). These results are consistent with
5 For further details on panel unit root tests, see Harris and Sollis (2003), Banerjee (1999), Christopoulos and
Tsionas (2004), and Breitung and Pesaran (2008) among others. 6 These tests are not reported but are available upon request.

9
those of Demetriades and Hussein (1996), who also failed to detect cointegration between
real GDP per capita and various financial indicators in 11 out of the 16 countries in their
sample. However, it is well known that the Engle-Granger cointegration tests have low power
in the case of a relatively short sample such as ours (see Kremers et al., 1992 and
Demetriades and Hussein, 1996).
Table 3. Results of the Engle-Granger cointegration test based on the residuals Country Variables in cointegration vector (RGDP and LCr)
Engle-Granger tau-statistic p-values^ N
Panel A: Countries without Islamic Banks.
Argentina -0.916 (4) 0.916 76
Brazil -2.843 (1) 0.172 44
Chile -2.954 (0) 0.136 61
Costa Rica -3.045 (3) 0.121 44
Ecuador -4.757 (1)*** 0.002 41
Guatemala -2.608 (9) 0.256 35
Peru -1.577 (2) 0.733 65
Panel B: Countries with Islamic Banks.
Indonesia -1.727 (8) 0.667 46
Turkey -2.309 (4) 0.381 44
Iran -3.757 (0)** 0.024 55
Singapore -2.210 (1) 0.429 39
Jordan -1.763 (11) 0.649 83
Tunisia -1.841 (10) 0.613 38
Malaysia -1.843 (0) 0.612 44
Note: */**/*** represent statistical significance at the 10%, the 5% and the 1% level, respectively. Null
hypothesis Ho: series are not cointegrated. The critical values of MacKinnon (1996) for ADF test statistic are -
3.04, -3.33 and -3.89 at the 10%, 5% and 1% respectively. ^ MacKinnon (1996) p-values. The optimal lag
length, representing in parentheses, is selected by the Akaike Info Criterion (AIC). N is the number of obs. RCr
is the real credit to private sectors and RGDP is the real GDP.
Therefore we also apply the multivariate tests of Johansen (1988, 1995). Because
these are very sensitive to the lag length (see Banerjee et al., 1993, Cheung and Lai, 1993,
and Chang and Caudill, 2005), we use the Schwarz information criterion (SC) to determine
the optimal lag length, but include extra lags when required to remove serial correlation (as in
Hunter and Menla Ali, 2014, where the Akaike information criterion (AIC) is used instead).
Furthermore, to achieve normality, the following dummies were included: Chile 2008Q1,
Argentina 2002Q2, and Tunisia 2011Q1, Jordan 2006Q1 and Singapore 2008Q4. We follow
Dimitraki and Menla Ali (2015) and control for outliers defined as such when the residual is
greater than |3.5𝜎|. 7
7 For a more detailed discussion about including a dummy variable when testing for cointegration, see
Juselius and MacDonald (2004).

10
The results from the diagnostic tests for the residuals are displayed in Table 4. The
LM tests provide no evidence of any remaining serial correlation (see both Panels A and B).
Further, the null hypothesis of both homoscedasticity and normality cannot be rejected in any
cases. Thus, we conclude that the VAR models are data congruent and carry out the Johansen
cointegration tests using the optimal lag length reported in Table 4.
Table 4. VAR lag length and diagnostic tests
Panel A: Countries without Islamic Banks.
Country Argentina
[k=5]
Brazil
[k=5]
Chile
[k=3]
Costa Rica
[k=3]
Ecuador
[k=7]
Guatemala
[k=4]
Peru
[k=3]
LM test
4.012
(0.404)
2.817
(0.588)
3.634
(0.457)
5.772
(0.216)
2.716
(0.606)
3.656
(0.454)
2.194
(0.700)
JB test 3.475
(0.481)
2.492
(0.646)
6.103
(0.191)
6.683
(0.153)
0.501
(0.973)
4.188
(0.381)
3.615
(0.461)
Hetro test
68.762
(0.288)
52.424
(0.745)
40.195
(0.417)
39.298
( 0.324)
78.701
(0.642)
55.797
(0.299)
36.136
(0.462)
Panel B: Countries with Islamic Banks.
Country Indonesia
[k=5]
Turkey
[k=5]
Iran
[k=6]
Singapore
[k=3]
Jordan
[k=4]
Tunisia
[k=5]
Malaysia
[k=5]
LM test
4.060
(0.398)
3.744
(0.441)
4.881
(0.299)
5.605
(0.230)
5.475
(0.241)
2.259
(0.688)
4.103
(0.392)
JB test 6.066
(0.194)
2.385
(0.665)
4.410
(0.353)
1.847
( 0.763)
1.235
(0.872)
3.403
(0.492)
0.135
(0.997)
Hetro test
83.776
(0.486)
70.221
(0.172)
57.549
(0.892)
33.152
(0.733)
162.643
(0.052)
97.741
(0.202)
62.764
(0.484)
Note: k denotes number of lags based on the Schwarz information criterion (SC) and subject to removal of serial
correlation. The null of LM test is no serial correlation. Breusch & Pagan (1979) test for heteroscedasticity with
the null hypothesis Ho: Constant variance. The LM test and tests Breusch & Pagan are based on F-statistics. JB
test is a chi-squared test for normality with Ho: residual are multivariate normal. P-values are in parentheses.
On the basis of the trace and eigenvalues statistics (see Table 5, Panel A), the null of
no cointegration cannot be rejected at the 5% level only in the case Guatemala among the
countries without Islamic banks; therefore it appears that there is a stable long-run
relationship between credit and GDP almost in every case. As for countries with Islamic
banks, both the trace and eigenvalue statistics reject the null hypothesis of no cointegration at
the 5% level for all but of one of them, namely Turkey, for which the results are
contradictory (see Panel B) – in this case we give more weight to the trace statistic that
suggests cointegration, because this test is known to provide more robust results than the
maximal eigenvalues one (see Luintel and Khan, 1999, and Lanne et al., 2002).

11
Table 5. Results of the Johansen cointegration tests
Notes: */**/*** represent statistical significance at the 10% and 5% and 1% level, respectively. the table reports
the Max-Eigen statistics and Johansen trace statistics (Johansen, 1995). r is the number of cointegration vectors.
^ is the respective p-values. K is the number of lag lengths based on Schwarz Information Criterion (SC),
subject to the removal of serial correlation (see Table 4). RCR is the real credit to private sectors and RGDP is
real GDP.
To summarise, the Johansen tests provide much stronger evidence of the existence of
a long-run relationship between credit and GDP. The only exception is Guatemala - this
might reflect the presence of nonlinearities, the need for a broader definition of credit8, or the
fact that credit did not have a significant role in financing economic activities during the
period under investigation: its average growth rate was small or negative in Guatemala, as
opposed to 12.4% in Latin America, during the period 2004-2011 (Hansen and Sulla, 2013).
Next, we carry out panel cointegration tests, specifically two residual-based tests
(Pedroni, 2004 and Kao, 1999) tests and an error correction-based panel cointegration test
(Westerlund, 2007). Pedroni (2004) suggested two groups of statistics. The first group,
including four of them, involves pooling the within-dimension residuals, while the second,
including three, is based on pooling the between-dimension residuals. There are several
8 For example, according to Basel III, the ideal definition of credit should “include all credit extended
to households and other non-financial private entities in an economy independent of its form and the identity of
the supplier of funds” (BCBS, 2010 p 10). In addition, the BIS database defines the total credit series as “all
sources of credit, independent of the country of origin or type of lender” Drehmann, (2013 p 42). However, BIS
definition of total credit is beyond the scope of this chapter and it is available only for 40 advanced and
emerging market economies (see Dembiermont et al., 2013).
Country Null Hypothesis: r=0; Alternative Null: r=1
Variables : RGDP and RCR
Maximum Eigenvalue Test Trace Test
(𝜆𝑚𝑎𝑥)
Max-Eigen
statistic
95%
Critical
Value
p-value^
(𝜆𝑡𝑟𝑎𝑐𝑒)
Trace
statistic
95%
Critical
Value
p-value^ K
Panel A. Countries without Islamic Banks.
Argentina 19.519 14.264 0.007*** 20.044 15.494 0.009*** 5
Brazil 10.897 15.892 0.259 20.324 20.261 0.049** 5
Chile 15.796 14.264 0.028** 15.929 15.494 0.043** 3
Costa Rica 17.175 14.264 0.016** 18.884 15.494 0.015** 3
Ecuador 26.813 14.264 0.000** 27.670 15.494 0.000*** 7
Guatemala 2.802 14.264 0.959 3.780 15.494 0.920 4
Peru 25.503 19.387 0.005*** 33.213 25.872 0.005*** 3
Panel B. Countries with Islamic Banks.
Indonesia 26.972 14.264 0.000*** 28.521 15.494 0.000*** 5
Turkey 12.271 14.264 0.101 16.376 15.494 0.036** 5
Iran 29.077 15.892 0.000*** 36.175 20.261 0.000*** 6
Singapore 14.066 14.264 0.054* 16.852 15.494 0.031** 3
Jordan 17.803 15.892 0.024** 26.603 20.261 0.006*** 4
Tunisia 33.687 15.892 0.000*** 41.805 20.261 0.000*** 5
Malaysia 39.738 14.264 0.000*** 48.656 15.494 0.000*** 5

12
possible estimators one could use, such as OLS, Fully Modified OLS (FMOLS) and Dynamic
OLS (DOLS). In their comprehensive study, Kao and Chiang (2000) found that both the
FMOLS and OLS estimators suffer from small sample bias, and concluded that the DOLS
method outperforms them. This is the estimator chosen here.
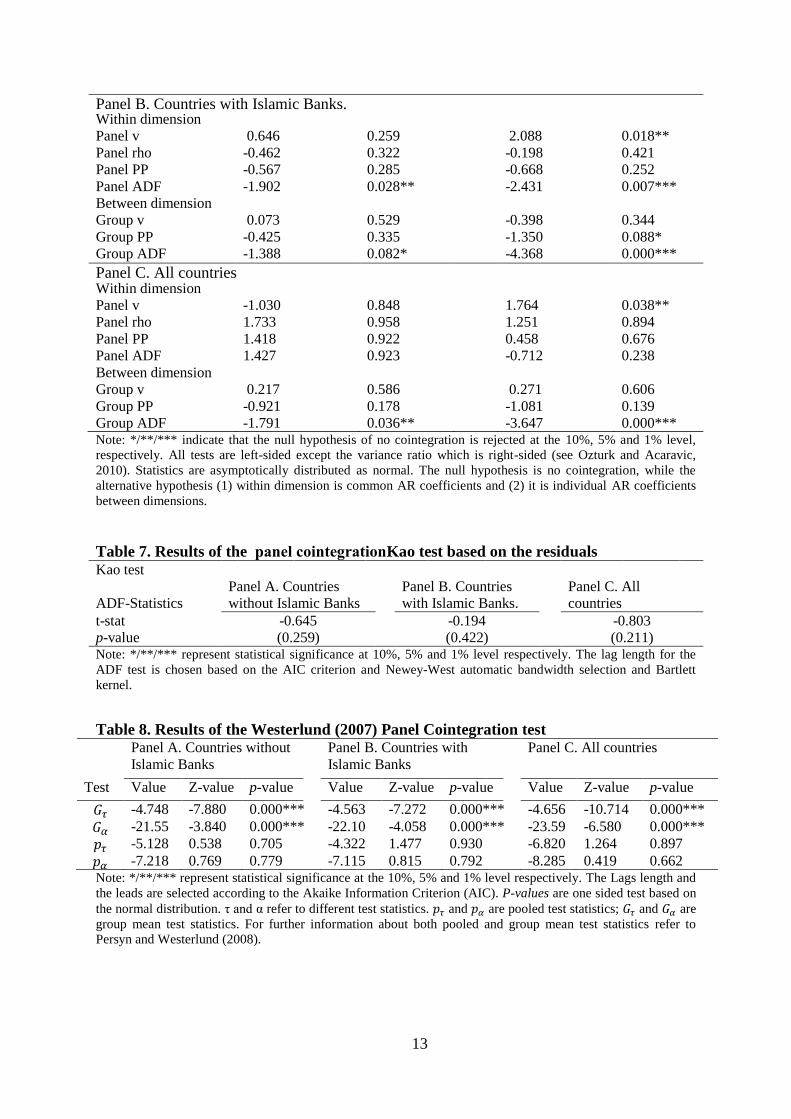
The results of the Pedroni (2004) and Kao (1999) tests are reported in Table 6 and 7
respectively. Both of them fail to reject the null hypothesis of no cointegration in the
countries without Islamic banks. By contrast, both the panel ADF-Statistics and Group ADF-
Statistics (without trend) indicate a long-run relationship at the 5% and 10% level
respectively between credit and GDP in the countries with Islamic banks. When a time trend
is included, four of the seven Pedroni statistics reject the null hypothesis of no cointegration
between real credit to the private sector and real GDP (see Table 6 Panel B), whilst the Kao
test does not suggest any long-run relationship for countries with Islamic banks (see Table 7).
Westerlund (2007) criticises the panel residual-based tests performed above (pointing
out in particular that the common factor restriction might be invalid), and proposes four more
advanced panel-cointegration tests with higher power. The first two, 𝐺𝜏 and 𝐺𝛼, are based on
group-mean test statistics, which test the alternative hypothesis that the panel as a whole is
cointegrated, whereas the other two, 𝑝𝜏 and 𝑝𝛼, are pooled test statistics, which are designed
to test the alternative that at least one of the individual cross-sectional units is cointegrated
(Persyn and Westerlund, 2008). The results for these tests are reported in Table 8. It can be
seen that both group-mean statistics reject the null hypothesis of no cointegration in all three
panels (comprising countries with and without Islamic banks and all countries in turn),
suggesting the existence of a long-run relationship between real credit to the private sector
and real GDP in each case. However, the other two panel statistics fail to reject the null
hypothesis of no cointegration between the two variables.
Table 6. Results of the Pedroni panel cointegration tests based on the residuals No time trend Time trend
Test statistics Statistic p-value Statistic p-value
Panel A. Countries without Islamic Banks. Within dimension
Panel v -1.333 0.909 0.595 0.275
Panel rho 1.572 0.942 1.414 0.921
Panel PP 1.371 0.914 0.734 0.770
Panel ADF 1.559 0.941 0.517 0.697
Between dimension
Group v 0.234 0.592 0.782 0.783
Group PP -0.876 0.190 -0.179 0.428
Group ADF -1.144 0.126 -0.790 0.214
13
Panel B. Countries with Islamic Banks. Within dimension
Panel v 0.646 0.259 2.088 0.018**
Panel rho -0.462 0.322 -0.198 0.421
Panel PP -0.567 0.285 -0.668 0.252
Panel ADF -1.902 0.028** -2.431 0.007***
Between dimension
Group v 0.073 0.529 -0.398 0.344
Group PP -0.425 0.335 -1.350 0.088*
Group ADF -1.388 0.082* -4.368 0.000***
Panel C. All countries Within dimension
Panel v -1.030 0.848 1.764 0.038**
Panel rho 1.733 0.958 1.251 0.894
Panel PP 1.418 0.922 0.458 0.676
Panel ADF 1.427 0.923 -0.712 0.238
Between dimension
Group v 0.217 0.586 0.271 0.606
Group PP -0.921 0.178 -1.081 0.139
Group ADF -1.791 0.036** -3.647 0.000*** Note: */**/*** indicate that the null hypothesis of no cointegration is rejected at the 10%, 5% and 1% level,
respectively. All tests are left-sided except the variance ratio which is right-sided (see Ozturk and Acaravic,
2010). Statistics are asymptotically distributed as normal. The null hypothesis is no cointegration, while the
alternative hypothesis (1) within dimension is common AR coefficients and (2) it is individual AR coefficients
between dimensions.
Table 7. Results of the nlpoaganpeoc lenap Kao test based on the residuals Kao test
ADF-Statistics
Panel A. Countries
without Islamic Banks
Panel B. Countries
with Islamic Banks.
Panel C. All
countries
t-stat -0.645 -0.194 -0.803
(0.211) p-value (0.259) (0.422) Note: */**/*** represent statistical significance at 10%, 5% and 1% level respectively. The lag length for the
ADF test is chosen based on the AIC criterion and Newey-West automatic bandwidth selection and Bartlett
kernel.
Table 8. Results of the Westerlund (2007) Panel Cointegration test Panel A. Countries without
Islamic Banks
Panel B. Countries with
Islamic Banks
Panel C. All countries
Test Value Z-value p-value Value Z-value p-value Value Z-value p-value
𝐺𝜏 -4.748 -7.880 0.000*** -4.563 -7.272 0.000*** -4.656 -10.714 0.000***
𝐺𝛼 -21.55 -3.840 0.000*** -22.10 -4.058 0.000*** -23.59 -6.580 0.000***
𝑝𝜏 -5.128 0.538 0.705 -4.322 1.477 0.930 -6.820 1.264 0.897
𝑝𝛼 -7.218 0.769 0.779 -7.115 0.815 0.792 -8.285 0.419 0.662 Note: */**/*** represent statistical significance at the 10%, 5% and 1% level respectively. The Lags length and
the leads are selected according to the Akaike Information Criterion (AIC). P-values are one sided test based on
the normal distribution. τ and α refer to different test statistics. 𝑝𝜏 and 𝑝𝛼 are pooled test statistics; 𝐺𝜏 and 𝐺𝛼 are
group mean test statistics. For further information about both pooled and group mean test statistics refer to
Persyn and Westerlund (2008).

14
5.3 Causality Tests
Next we apply both time series and panel approaches to test for three types of
causality (where the null hypothesis is that of no causality): short-run causality, using lags of
the explanatory variables; long-run causality (weak exogeneity), using the error correction
term; strong exogeneity, using both lags and the error correction term. As already mentioned,
we estimate a VECM or a VAR in first differences depending on whether or not cointegration
holds between real credit to the private sector and real GDP.
According to the Engle-Granger tests, there is a long-run equilibrium relationship
only in the case of Iran and Ecuador. For these two countries the ECM-based causality tests
suggest bidirectional long-run causality in Iran and unidirectional causality from real credit to
the private sector to real GDP in Ecuador, at the 10% and 5% level of significance
respectively (see Table 9, Panel A). The F-statistic fails to reject the null of no short-run
Granger causality from credit to GDP in Ecuador but not in Iran at the 10% significance level
(see Table 9, Panel B). The diagnostic tests (LM test, JB test, heteroscedasticity test, ARCH
test) suggest no serial correlation, deviations from normality, heteroscedasticity, or ARCH
effects in either case.9
Table 9. ECM test with Engle-Granger cointegrating vectors
Panel A: Ho: ∆Cr ↛ ∆GDP
SR Granger non-
causality test
(𝐻0: 𝑎𝑙𝑙 𝜑1𝑖 = 0)
LR Weak-exogeneity test (𝐻0:
𝛿1=0)
SR+LR Strong-exogeneity
test (𝐻0:𝑎𝑙𝑙 𝜑1𝑖 = 𝛿1 = 0)
K F-statistic p-values Coeff
𝐸𝐶𝑇𝑡−1
t-statistic p-values F-statisticª p-values
Iran 6 2.243 0.057* -0.387 -1.996 0.052* 2.773 0.018**
Ecuador 6 1.140 0.372 -0.467 -2.552 0.018** 1.807 0.1362
Panel B: Ho: ∆GDP↛ ∆Cr
SR Granger non-
causality test
(𝐻0: 𝑎𝑙𝑙 𝜑2𝑖 = 0)
LR Weak-exogeneity test (𝐻0:
𝛿2=0)
SR+LR Strong-exogeneity
test (𝐻0: 𝑎𝑙𝑙 𝜑2𝑖 = 𝛿1 = 0)
K F-statistic p-values Coeff
𝐸𝐶𝑇𝑡−1
t-statistic p-values F-statisticª p-values
Iran 6 2.080 0.077* -0.197 -2.923 0.005*** 2.260 0.049**
Ecuador 6 2.560 0.049** -0.063 -0.813 0.424 2.797 0.031**
Notes: */**/*** represent statistical significance at the 10%, 5% and 1% level, respectively. K is number of lags
in ECM. F-statistic is of the Wald statistics test for the significance of the null hypothesis 𝐻0: 𝑎𝑙𝑙 𝜑1𝑖 = 0, F-
statisticª is of the Wald statistics test for the significance of the null hypothesis 𝐻0: 𝑎𝑙𝑙 𝜑1𝑖 = 𝛿1 = 0, and t-
statistic is of the Wald statistics test for the significance of the null hypothesis 𝐻0: 𝛿1=0. Part A and Part B are
estimated using equations (3) and (4) respectively.
∆𝑅𝐺𝐷𝑃𝑡 = 𝛼1 + ∑ 𝛽1𝑖 𝑘𝑖=1 ∆𝑅𝐺𝐷𝑃𝑡−𝑖 + ∑ 𝜑1𝑖
𝑘𝑖=1 ∆𝑅𝐶𝑅 𝑡−𝑖 + 𝛿1𝐸𝐶𝑇𝑡−1 + 𝜖1𝑡 (3)
∆𝑅𝐶𝑅𝑡 = 𝛼2 + ∑ 𝜑2𝑖 𝑘𝑖=1 ∆𝑅𝐶𝑅𝑡−𝑖 + ∑ 𝛽2𝑖
𝑘𝑖=1 ∆𝑅𝐺𝐷𝑃𝑡−𝑖 + 𝛿2𝐸𝐶𝑇𝑡−1 + 𝜖2𝑡 (4)
9 These and all subsequent test results are not reported but are available upon request.

15
Next we test for causality within a VECM framework for the countries where
cointegration holds according to the Johansen tests. The results are reported in Tables 10 and
11 (t-statistic and F-statistics) respectively. Real credit to the private sector causes real GDP
in the short run in Argentina and Ecuador at the 1% level, and at the 10% level in Brazil.
Bidirectional short-run Granger causality is found in Ecuador. As for the long-run weak-
exogeneity tests, the null hypothesis of non-causality from real credit to the private sector to
real GDP is rejected in Chile and Ecuador at the 1% level, and in Costa Rica at the 10% level.
The error correction term has a negative sign in all countries except Argentina and Brazil. On
the other hand, long-run causality from real GDP to real credit to the private sector is found
in Argentina and Brazil at the 10% and 1% level respectively (see Table 10, Panel B).
Finally, the strong exogeneity tests suggest bidirectional causality in all countries except Peru
and Costa Rica (see Table 10).
Table 10. ECM test with Johansen cointegrating vectors for countries without Islamic
banks
Panel A: Ho: ∆Cr ↛ ∆GDP
SR Granger non-
causality test
(𝐻0: 𝑎𝑙𝑙 𝜑1𝑖 = 0)
LR Weak-exogeneity test
(𝐻0: 𝛿1=0)
SR+LR Strong-exogeneity
test(𝐻0:𝑎𝑙𝑙 𝜑1𝑖 = 𝛿1 = 0)
Country K F-statisticª p-values Coeff
𝐸𝐶𝑇𝑡−1
t-statisticᶜ p-values F-statisticᵇ p-values
Argentina 5 9.920 0.000*** 0.056 4.406 0.000*** 13.082 0.000***
Brazil 5 2.086 0.095* 0.116 3.031 0.005** 4.702 0.001***
Chile 3 0.422 0.737 -0.260 -2.720 0.009*** 3.587 0.012**
Costa Rica 3 1.091 0.366 -0.187 -1.910 0.064* 1.408 0.252
Ecuador 7 5.449 0.001*** -0.629 -3.830 0.001*** 7.991 0.000***
Peru 3 0.276 0.842 -0.021 -0.272 0.785 0.290 0.883
Panel B: Ho: ∆GDP↛ ∆Cr
SR Granger non-
causality test
(𝐻0: 𝑎𝑙𝑙 𝜑2𝑖 = 0)
LR Weak-exogeneity test
(𝐻0: 𝛿2=0)
SR+LR Strong-exogeneity
test(𝐻0:𝑎𝑙𝑙 𝜑2𝑖 = 𝛿1 = 0)
Country K F-statistic p-values Coeff
𝐸𝐶𝑇𝑡−1
t-statistic p-values F-statistic p-values
Argentina 5 1.133 0.352 -0.023 -2.298 0.024*** 2.561 0.027**
Brazil 5 3.802 0.009*** -0.038 -4.545 0.000*** 19.952 0.000***
Chile 3 1.363 0.264 -0.122 -2.108 0.040** 7.006 0.000***
Costa Rica 3 1.826 0.161 -0.120 -2.923 0.006*** 6.021 0.000***
Ecuador 7 2.928 0.029** -0.127 1.372 0.185 2.906 0.026**
Peru 3 1.039 0.381 -0.088 -5.407 0.000*** 12.110 0.000***
Notes: */**/*** represent statistical significance at the 10%, 5% and 1% level, respectively. K is number of lags
in ECM. In Panel A, F-statisticª is of the Wald statistics test for the significance of the null hypothesis
𝐻0: 𝑎𝑙𝑙 𝜑1𝑖 = 0, F-statisticᵇ is of the Wald statistics test for the significance of the null hypothesis 𝐻0: 𝑎𝑙𝑙 𝜑1𝑖 =
𝛿1 = 0, and t-statisticᶜ is of the Wald statistics test for the significance of the null hypothesis 𝐻0: 𝛿1=0. Panel A
and Panel B are estimated using equations (3) and (4) respectively.
∆𝑅𝐺𝐷𝑃𝑡 = 𝛼1 + ∑ 𝛽1𝑖 𝑘𝑖=1 ∆𝑅𝐺𝐷𝑃𝑡−𝑖 + ∑ 𝜑1𝑖
𝑘𝑖=1 ∆𝑅𝐶𝑅 𝑡−𝑖 + 𝛿1𝐸𝐶𝑇𝑡−1 + 𝜖1𝑡 (3)
∆𝑅𝐶𝑅𝑡 = 𝛼2 + ∑ 𝜑2𝑖 𝑘𝑖=1 ∆𝑅𝐶𝑅𝑡−𝑖 + ∑ 𝛽2𝑖
𝑘𝑖=1 ∆𝑅𝐺𝐷𝑃𝑡−𝑖 + 𝛿2𝐸𝐶𝑇𝑡−1 + 𝜖2𝑡 (4)

16
There is evidence of short-run bidirectional causality in three out of the seven
countries with Islamic banks (Iran, Singapore and Tunisia), and short-run unidirectional
causality from real credit to the private sector to real GDP in Malaysia (see Table 11, Panel
A). The weak exogeneity tests indicate that both variables are weakly exogenous at the 1%
level in all countries with Islamic banks (at the 10% level in Indonesia only). Long-run
causality from real GDP is found only in Jordan at the 5% level. The strong exogeneity tests
imply bidirectional causality except for Indonesia and Turkey (see Table 11). It is noteworthy
that in the long run real GDP causes real credit to the private sector in the countries without
Islamic banks, while causality runs in the opposite direction in the countries with Islamic
banks. In brief, our results provide strong evidence of long-run causality running from real
credit to real GDP and weak evidence of bidirectional short-run causality in countries with
Islamic banks. In contrast, for the countries without Islamic banks there is strong evidence of
long-run causality running from real GDP to real credit.
Table 11. ECM test with Johansen cointegrating vectors for countries with Islamic
banks
Panel A :Ho: ∆Cr ↛ ∆GDP
SR Granger non-
causality test
(𝐻0: 𝑎𝑙𝑙 𝜑1𝑖 = 0)
LR Weak-exogeneity test
(𝐻0: 𝛿1=0)
SR+LR Strong-exogeneity
test(𝐻0:𝑎𝑙𝑙 𝜑1𝑖 = 𝛿1 = 0)
Country K F-statisticª p-values Coeff
ECT(-1)
t-statistic p-values F-statisticᵇ p-values
Indonesia 5 1.753 0.148 -0.072 -1.952 0.063* 1.578 0.188
Turkey 5 0.966 0.455 -0.461 -2.847 0.008*** 1.970 0.105
Iran 6 2.620 0.029** -0.460 -2.876 0.006*** 3.237 0.000***
Singapore 3 3.433 0.030** -0.039 -4.350 0.000*** 7.459 0.000***
Jordan 4 0.331 0.856 -0.087 -3.392 0.001*** 3.756 0.004***
Malaysia 4 6.955 0.000*** -0.054 -4.906 0.000*** 6.074 0.000***
Tunisia 8 10.525 0.000*** -0.024 -8.585 0.000*** 17.717 0.004***
Panel B: Ho: ∆GDP↛ ∆Cr
SR Granger non-
causality test
(𝐻0: 𝑎𝑙𝑙 𝜑2𝑖 = 0)
LR Weak-exogeneity test
(𝐻0: 𝛿2=0)
SR+LR Strong-exogeneity
test(𝐻0:𝑎𝑙𝑙 𝜑2𝑖 = 𝛿1 = 0)
Country K F-statistic p-values Coeff
ECT(-1)
t-statistic p-values F-statisticª p-valuesª
Indonesia 5 0.899 0.5241 -0.078 -1.600 0.123 0.794 0.613
Turkey 5 1.124 0.370 -0.056 -1.327 0.195 1.259 0.307
Iran 6 3.496 0.004*** -0.152 -1.912 0.062* 4.305 0.000***
Singapore 3 2.948 0.049** -0.004 1.674 0.104 2.256 0.000***
Jordan 4 1.301 0. 278 -0.055 -2.457 0.016** 2.045 0.083*
Malaysia 4 1.526 0.219 -0.083 1.800 0.081* 5.352 0.001***
Tunisia 8 4.158 0.004*** -0.008 -1.794 0.085* 7.219 0.000***
17
Notes: */**/*** represent statistical significance at 10%, 5% and 1% level, respectively. K is number of lags in
ECM. In Panel A, F-statisticª is of the Wald statistics test for the significance of the null hypothesis
𝐻0: 𝑎𝑙𝑙 𝜑1𝑖 = 0, F-statisticᵇ is of the Wald statistics test for the significance of the null hypothesi 𝐻0: 𝑎𝑙𝑙 𝜑1𝑖 =
𝛿1 = 0, and t-statisticᶜ is of the Wald statistics test for the significance of the null hypothesis 𝐻0: 𝛿1=0. Part A
and Part B are estimated using equations (3) and (4) respectively.
∆𝑅𝐺𝐷𝑃𝑡 = 𝛼1 + ∑ 𝛽1𝑖 𝑘𝑖=1 ∆𝑅𝐺𝐷𝑃𝑡−𝑖 + ∑ 𝜑1𝑖
𝑘𝑖=1 ∆𝑅𝐶𝑅 𝑡−𝑖 + 𝛿1𝐸𝐶𝑇𝑡−1 + 𝜖1𝑡 (3)
∆𝑅𝐶𝑅𝑡 = 𝛼2 + ∑ 𝜑2𝑖 𝑘𝑖=1 ∆𝑅𝐶𝑅𝑡−𝑖 + ∑ 𝛽2𝑖
𝑘𝑖=1 ∆𝑅𝐺𝐷𝑃𝑡−𝑖 + 𝛿2𝐸𝐶𝑇𝑡−1 + 𝜖2𝑡 (4)
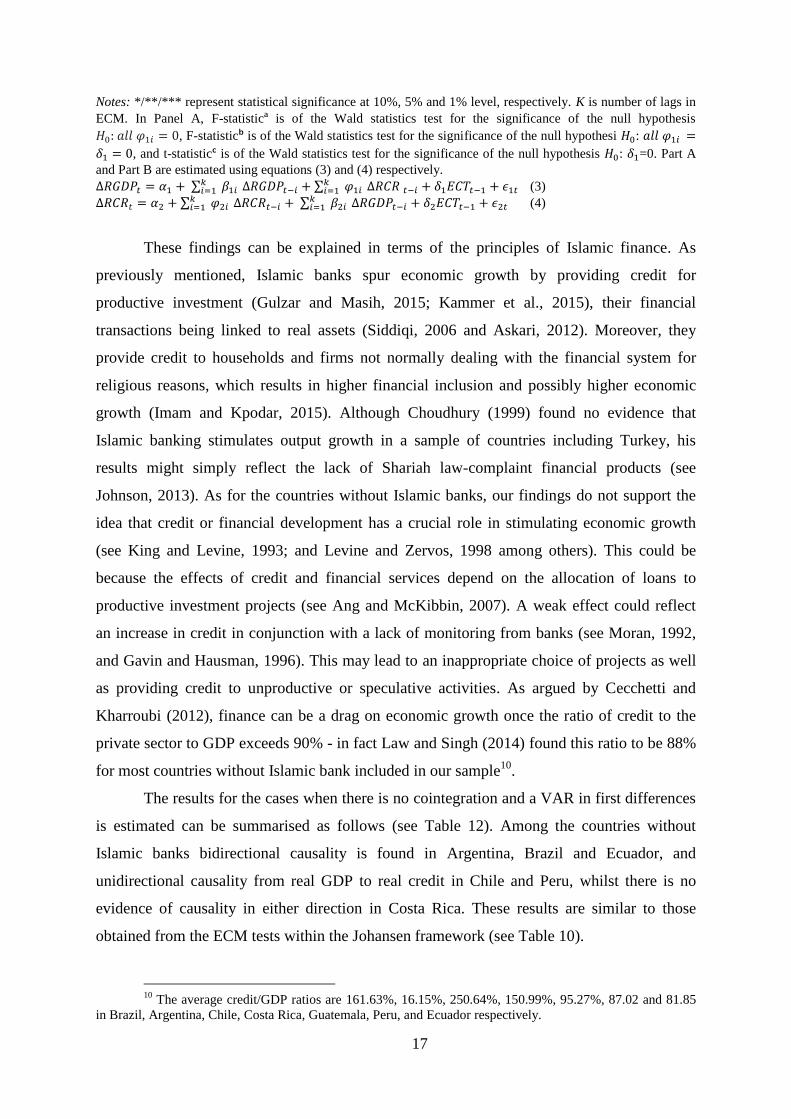
These findings can be explained in terms of the principles of Islamic finance. As
previously mentioned, Islamic banks spur economic growth by providing credit for
productive investment (Gulzar and Masih, 2015; Kammer et al., 2015), their financial
transactions being linked to real assets (Siddiqi, 2006 and Askari, 2012). Moreover, they
provide credit to households and firms not normally dealing with the financial system for
religious reasons, which results in higher financial inclusion and possibly higher economic
growth (Imam and Kpodar, 2015). Although Choudhury (1999) found no evidence that
Islamic banking stimulates output growth in a sample of countries including Turkey, his
results might simply reflect the lack of Shariah law-complaint financial products (see
Johnson, 2013). As for the countries without Islamic banks, our findings do not support the
idea that credit or financial development has a crucial role in stimulating economic growth
(see King and Levine, 1993; and Levine and Zervos, 1998 among others). This could be
because the effects of credit and financial services depend on the allocation of loans to
productive investment projects (see Ang and McKibbin, 2007). A weak effect could reflect
an increase in credit in conjunction with a lack of monitoring from banks (see Moran, 1992,
and Gavin and Hausman, 1996). This may lead to an inappropriate choice of projects as well
as providing credit to unproductive or speculative activities. As argued by Cecchetti and
Kharroubi (2012), finance can be a drag on economic growth once the ratio of credit to the
private sector to GDP exceeds 90% - in fact Law and Singh (2014) found this ratio to be 88%
for most countries without Islamic bank included in our sample10
.
The results for the cases when there is no cointegration and a VAR in first differences
is estimated can be summarised as follows (see Table 12). Among the countries without
Islamic banks bidirectional causality is found in Argentina, Brazil and Ecuador, and
unidirectional causality from real GDP to real credit in Chile and Peru, whilst there is no
evidence of causality in either direction in Costa Rica. These results are similar to those
obtained from the ECM tests within the Johansen framework (see Table 10).
10
The average credit/GDP ratios are 161.63%, 16.15%, 250.64%, 150.99%, 95.27%, 87.02 and 81.85
in Brazil, Argentina, Chile, Costa Rica, Guatemala, Peru, and Ecuador respectively.

18
As for countries with Islamic banks, causality runs from real credit to real GDP in
Singapore, and in the opposite direction in Malaysia; there is bidirectional causality in Iran
and Tunisia, and no causality in either directions in Indonesia, Turkey and Jordan. These
results are consistent with those from the ECM tests. There is no sign of misspecification
according to the diagnostic tests (not reported).
The panel causality test results are shown in Table 13. As already mentioned, the lag
length is selected according to the Schwarz Bayesian Criterion subject to the removal of the
serial correlation in the error term. In the countries with Islamic banks, long-run causality
from real credit to real GDP is found at the 5% level while the F-statistic fails to reject the
null hypothesis of no causality in the short run (see Table 13, Panel A2). By contrast, short-
run causality from real credit to GDP is found for countries without Islamic banks (see Table
13, Panel A1). There is strong evidence of long-run causality from real GDP to real credit in
both sets of countries, but no evidence of short-run causality (see Table 13, Panel B).
However, bidirectional causality in the long run is found in the countries with Islamic banks.
The diagnostic tests (not reported) suggest data congruence.
Table 12. Causality tests between real GDP and real Credit based on first differences
Panel A. Countries without Islamic Banks.
Part A: ∆Cr ↛ ∆GDP
(𝐻0: 𝑎𝑙𝑙 𝜑1𝑖 = 0)
Part B: ∆GDP↛ ∆Cr
(𝐻0: 𝑎𝑙𝑙 𝛽2𝑖 = 0)
Country K F-statisticª p-values F-statisticᵇ p-values
Argentina 5 7.461 0.000*** 4.161 0.002***
Brazil 5 2.094 0.094* 2.258 0.075*
Chile 3 1.145 0.339 7.226 0.000***
Costa Rica 3 0.445 0.721 1.715 0.182
Peru 3 0.384 0.764 3.996 0.011**
Guatemala 5 15.369 0.000*** 0.637 0.673
Ecuador 7 2.554 0.049** 2.389 0.059*
Panel B. Countries with Islamic Banks.
Part A: ∆Cr ↛ ∆GDP
(𝐻0: 𝑎𝑙𝑙 𝜑1𝑖 = 0)
Part B: ∆GDP↛ ∆Cr
(𝐻0: 𝑎𝑙𝑙 𝛽2𝑖 = 0)
Country K F-statisticª p-values F-statisticᵇ p-values
Indonesia 5 1.755 0.153 0.583 0.712
Turkey 5 0.592 0.705 1.378 0.262
Iran 6 2.418 0.042** 1.971 0.090*
Singapore 3 5.406 0.004*** 1.751 0.177
Jordan 4 0.800 0.529 0.976 0.426
Tunisia 7 5.803 0.000*** 4.497 0.002***
Malaysia 4 0.902 0.474 3.448 0.019** Notes: */**/*** represent statistical significance at the 10%, 5% and 1% level, respectively. K is number of
lags. In both Panels A and B, F-statisticª is of the Wald statistics test for the significance of the null hypothesis
𝐻0: 𝑎𝑙𝑙 𝜑1𝑖 = 0, and F-statisticᵇ is of the Wald statistics test for the significance of the null hypothesis 𝐻0:
𝑎𝑙𝑙 𝛽2𝑖 = 0. Part A and Part B are estimated using equations (1) and (2) respectively.
∆𝑅𝐺𝐷𝑃𝑡 = 𝛼1 + ∑ 𝛽1𝑖𝑘𝑖=1 ∆𝑅𝐺𝐷𝑃𝑡−𝑖 + ∑ 𝜑1𝑖
𝑘𝑖=1 ∆RCR 𝑡−𝑖 + 𝜖1𝑡 (1)
∆RCR𝑡 = 𝛼2 + ∑ 𝜑2𝑖∆𝑅𝐶𝑅𝑡−𝑖𝑘𝑖=1 + ∑ 𝛽2𝑖
𝑘𝑖=1 ∆RGDP 𝑡−𝑖 + 𝜖2𝑡 (2)

19
On the whole, the long-run results obtained from the two approaches are rather
similar: both suggest that real GDP causes real credit in the countries without Islamic banks
except for Ecuador, whereas there is causality in the opposite direction in the countries with
Islamic banks. Bidirectional long-run causality is found in two countries without Islamic
banks (Chile and Ecuador, at the 1% level) and one with Islamic banks (Jordan, at the 5%
level). However, there are differences between the two sets of short-run results: the panel
tests suggest that short-run causality runs from real credit to real GDP in countries without
Islamic banks (and that there is bidirectional causality in three of them, i.e. Iran, Singapore
and Tunisia), whilst the time-series ones do not detect any.
Table 13. Results of the Panel causality tests
Panel A :Ho: ∆Cr ↛ ∆GDP
SR Granger non-causality
test (𝐻0: 𝑎𝑙𝑙 𝜑1,𝑖,𝑘 = 0)
LR Weak-exogeneity
test (𝐻0: 𝛿1=0)
SR+LR Strong-exogeneity
test(𝐻0:𝑎𝑙𝑙 𝜑1,𝑖,𝑘 = 𝛿1,𝑖 = 0)
K F-statistic p-values t-statistic p-values F-statisticª p-values
Panel A1. Countries Without Islamic banks
5 5.315 0.000*** -0.495 0.620 5.240 0.000***
Panel A2. Countries With Islamic banks
5 0.875 0.453 -2.471 0.014** 2.119 0.078*
Panel A2. All Countries
6 3.83 0.009*** -0.367 0.713 3.433 0.004***
Panel B: Ho: ∆GDP↛ ∆Cr
SR Granger non-causality
test (𝐻0: 𝑎𝑙𝑙 𝛽2,𝑖,𝑘 = 0)
LR Weak-exogeneity
test (𝐻0: 𝛿2,𝑖=0)
SR+LR Strong-exogeneity
test(𝐻0:𝑎𝑙𝑙 𝛽2,𝑖,𝑘 = 𝛿2,𝑖 = 0)
K F-statistic p-values t-statistic p-values F-statisticª p-valuesª
Panel B1. Countries Without Islamic banks
5 1.247 0.290 -3.446 0.000*** 3.153 0.008***
Panel B2. Countries With Islamic banks
5 0.845 0.469 -2.109 0.035** 1.581 0.179
Panel B3. All Countries
6 1.015 0.398 -2.311 0.021** 1.840 0.102 Notes: */**/*** represent statistical significance at the 10%, 5% and 1% level, respectively. K is number of lags
in ECM. Total panel observations are 355, 338, and 677 for countries without Islamic banks, with Islamic banks
and all countries respectively. F-statistic is of the Wald statistics test for the significance of the null hypothesis
𝐻0: 𝑎𝑙𝑙 𝜑1,𝑖,𝑘 = 0, F-statisticª is of the Wald statistics test for the significance of the null hypothesis 𝐻0:
𝑎𝑙𝑙 𝜑1,𝑖,𝑘 = 𝛿1𝑖 = 0, and t-statistic is of the Wald statistics test for the significance of the null hypothesis 𝐻0:
𝛿1𝑖=0. Panel A and Panel B are estimated using equations (5) and (6) respectively
∆𝑅𝐺𝐷𝑃𝑖𝑡 = 𝛼1𝑖 + ∑ 𝛽1,𝑖,𝑘 𝑚𝐾=1 ∆𝑅𝐺𝐷𝑃𝑖,𝑡−𝑘 + ∑ 𝜑1,𝑖,𝑘
𝑚𝑘=1 ∆𝑅CR 𝑖,𝑡−𝑘 + 𝛿1𝑖𝐸𝐶𝑇𝑖,𝑡−1 + 𝜖1𝑖𝑡 (5)
∆𝑅𝐶𝑅𝑖𝑡 = 𝛼2𝑖 + ∑ 𝜑2,𝑖,𝑘 𝑚𝑘=1 ∆𝑅𝐶𝑅𝑖,𝑡−𝑘 + ∑ 𝛽2,𝑖,𝑘
𝑚𝑘=1 ∆𝑅𝐺𝐷𝑃 𝑖,𝑡−𝑘 + 𝛿2𝑖𝐸𝐶𝑇𝑖,𝑡−1 + 𝜖2𝑖𝑡 (6)

20
6. Conclusions
This paper has examined the relationship between real credit to the private sector and
real GDP in two sets of emerging countries, with and without Islamic banks, with the aim of
shedding light on the effects of Islamic banking on economic growth. Our extensive
cointegration and causality analysis provides strong evidence of long-run causality running
from real credit to real GDP and weak evidence of short-run causality in both directions in
the countries with Islamic banks. In contrast, long-run causality appears to run in the opposite
direction, i.e., from real GDP to real credit, in the countries without Islamic banks. These
differences between the two sets of countries can be plausibly attributed to the distinctive
features of Islamic banks, which provide loans to projects that are directly linked to real
economic activities and are not allowed to engage in speculative transactions, in this way
improving the allocation of resources in the economy and boosting long-run economic
growth.
Therefore one could argue that policy makers aiming to stimulate growth should
regulate commercial banks to increase the proportion of credit to productive investment and
impose limits on engaging in speculative transactions; this is clearly an important issue, given
the current debate on the causes of the global financial crisis, and the mounting evidence that
excessive credit growth to finance speculative, unproductive activities was one of its main
causes (see Bernanke, 2009 and Turner, 2009). In addition, they should favour a bigger
market share for Islamic banks in the countries where they are present.
Future research should also consider possible nonlinearities in the relationship
between credit and growth, and examine the robustness of the results by using other measures
of credit such as total credit, the credit-to-GDP gap, credit to non-financial sector etc. (see
Drehmann et al. 2011, and Drehmann and Tsatsaronis, 2014).11
11
Note, however, that the new data set constructed by the BIS (Total credit to the non-financial sector) is only
available for 40 advanced and emerging economies.

21
Appendix A
Islamic Financial models
Islamic Financial models Explanation
Musharaka (partnership) It is built on the idea of equity participation. Under
Musharaka contract, each participant pays a percentage of the
capital in the company. The profits or losses generated from
the business will be shared between the owners based on an
agreed profits and losses share called PLS (Ariff, 1988).
Mudharabah (profit-sharing) Mudharabah is a contract between two parties: one party
supplies the capital of the company, while the other party will
be considered as an entrepreneur. Therefore, the Islamic bank
becomes a shareholder on the bases that any profit or loss
occurring from the business is shared between the two parties
on a per-determined profit sharing percentage (Haron et al.,
1994).
Murabahah (cost plus) It is a financial contract for buying and selling a particular
product. A Murabahah contract should specify the price, the
cost of the item and the profit margin at the time of signing
the contract. The role of the bank in a Murabahah financial
instrument is to finance purchasing the good by buying it on
the behalf of the customer. The bank will resell it to the
customer after adding a mark-up to the cost price (Ariff,
1988; Haron et al., 1994).
Ijarah (leasing) The Ijarah refers to an agreement between the lessor and the
client to rent for example machinery, vehicles, a shop or any
other equipment. An Islamic bank using an Ijarah financial
instrument will buy the machinery or any other equipment
and lease it to its customers for an agreed rent. If the
customer requires the bank to buy the equipment as well, the
rent and a monthly instalment as a part of the purchase will
be incurred. (Zaher and Hassan, 2001).

22
References
Abduh, M. & Omar, M.A. (2012) "Islamic banking and economic growth: the Indonesian
experience", International Journal of Islamic and Middle Eastern Finance and
Management, 5(1), 35-47.
Ang, J.B. (2008) "A survey of recent developments in the literature of finance and growth",
Journal of Economic Surveys, 22(3), 536-576.
Ang, J.B. & McKibbin, W.J. (2007) "Financial liberalization, financial sector development
and growth: evidence from Malaysia", Journal of Development Economics, 84(1), 215-
233.
Ariff, M. (1988) "Islamic Banking", Asian-Pacific Economic Literature, 2(2), 48-64.
Askari, H. (2012) "Islamic finance, risk-sharing, and international financial stability", Yale
Journal of International Affair, 7(1), 1–8.
Asteriou, D. & Hall, S. (2015) Applied econometrics, 3nd edn, Palgrave Macmillan,
Basingstoke.
Banerjee, A. (1999) "Panel data unit roots and cointegration: an overview", Oxford Bulletin
of Economics and Statistics, 61(S1), 607-629.
Banerjee A, Dolado J.J., Galbraith JW. & Hendry DF. (1993), Co-integration, Error
Correction, and the Econometric Analysis of Non-Stationary Data. Oxford University
Press: Oxford.
Banerjee, A., Dolado, J.J., Hendry, D.F. & Smith, G.W. (1986) "Exploring equilibrium
relationships in econometrics through static models: some Monte Carlo evidence",
Oxford Bulletin of Economics and Statistics, 48(3), 253-277.
Basel Committee on Banking Supervision (BCBS) (2010) Guidance for national authorities
operating the countercyclical capital buffer Basel Committee, Switzerland, December.
Beck, T., Degryse, H. & Kneer, C. (2014) "Is more finance better? Disentangling
intermediation and size effects of financial systems", Journal of Financial Stability,
10(0), 50-64.
Berg, N. & Kim, J. (2014) "Prohibition of Riba and Gharar: A signaling and screening
explanation?", Journal of Economic Behavior & Organization, 103, S146-S159.
Bernanke, B.S. (2009)"The crisis and the policy response", Speech at the Stamp Lecture,
London School of Economics, London, 13 January.
Berthelemy, J. & Varoudakis, A. (1996) "Economic growth, convergence clubs, and the role
of financial development", Oxford Economic Papers, 48(2), 300-328.
23
Breitung, J. & Pesaran, M.H. (2008) Unit Roots and Cointegration in Panels, Springer Berlin
Heidelberg.
Breusch, T.S. & Pagan, A.R. (1979) "A simple test for heteroscedasticity and random
coefficient variation", Econometrica, 46, 1287-1294.
Cecchetti, S.G. & Kharroubi, E. (2012) "Reassessing the impact of finance on growth", BIS
Working Paper Series, No. 381.
Chang, T. & Caudill, S.B. (2005) "Financial development and economic growth: the case of
Taiwan", Applied Economics, 37(12), 1329-1335.
Chapra, M.U., (1992) Islam and the Economic Challenge. Islamic Economic Series, vol. 17.
Islamic Foundation, Leicester, UK.
Cheung, Y. & Lai, K.S. (1993) "Finite-sample sizes of Johansen’s likelihood ratio tests for
cointegration", Oxford Bulletin of Economics and Statistics, 55(3), 313-328.
Chong, B.S. & Liu, M. (2009) "Islamic banking: interest-free or interest-based?", Pacific-
Basin Finance Journal, 17(1), 125-144.
Choudhury, M. (1999) "Resource mobilization and development goals for Islamic banks",
Proceedings of the Second Harvard University Forum on Islamic Finance: Islamic
Finance into the 21st Century, 31-50
Christopoulos, D.K. & Tsionas, E.G. (2004) "Financial development and economic growth:
evidence from panel unit root and cointegration tests", Journal of Development
Economics, 73(1), 55-74.
Dembiermont, C., Drehmann, M. & Muksakunratana, S. (2013) "How much does the private
sector really borrow? a new database for total credit to the private non-financial sector",
BIS Quarterly Review, March, 65–81.
Demetriades, P.O. & Hussein, K.A. (1996) "Does financial development cause economic
growth? Time-series evidence from 16 countries", Journal of Development Economics,
51(2), 387-411.
Di Mauro, F., Caristi, P., Couderc, S., Di Maria, A., Ho, L., Kaur Grewal, B., Masciantonio,
S., Ongena, S. & Zaheer, S. (2013) "Islamic finance in Europe", Occasional Paper
Series No. 146. European Central Bank.
Dickey, D.A. & Fuller, W.A. (1981) "Likelihood ratio statistics for autoregressive time series
with a unit root", Econometrica, 49, 1057-1072.
Dimitraki, O. & Menla Ali, F. (2015) "The long-run causal relationship between military
expenditure and economic growth in china: revisited", Defence and Peace Economics,
26(3), 311-326.
Kremers, J.J., Ericsson, N.R. & Dolado, J.J. (1992) "The power of cointegration tests",
Oxford Bulletin of Economics and Statistics, 54(3), 325-348.
24
Drehmann, M. (2013) "Total credit as an early warning indicator for systemic banking
crises", BIS Quarterly Review, June, 41-45.
Drehmann, M., Borio, C. & Tsatsaronis, K. (2011) "Anchoring countercyclical capital
buffers: the role of credit aggregates", International Journal of Central Banking, 7(4),
189-240.
Drehmann, M. & Tsatsaronis, K. (2014) "The credit-to-GDP gap and countercyclical capital
buffers: questions and answers", BIS Quarterly Review, March, 55–73.
El-Gamal, M.A. (2006) Islamic finance: Law, economics, and practice, Cambridge
University Press, New York.
Engle, R.F. & Granger, C.W. (1987) "Co-integration and error correction: representation,
estimation, and testing", Econometrica, 55, 251-276.
Furqani, H. & Mulyany, R. (2009) "Islamic banking and economic growth: empirical
evidence from Malaysia", Journal of Economic Cooperation and Development, 30(2),
59-74.
Gavin, M. & Ricardo, H. (1996) “The roots of banking crises: the macroeconomic context,”
in Ricardo Hausmann and Liliana Rojas-Suarez (eds), Banking crises in Latin America,
Baltimore: Johns Hopkins University Press.
Gulzar, R. & Masih, A. (2015) “Islamic banking: 40 years later, still interest-based? Evidence
from Malaysia”, MPRA Paper, University Library of Munich, Germany. Available at
http://EconPapers.repec.org/RePEc:pra:mprapa:65840.
Hansen, N.J. & Sulla, O. (2013) “Credit growth in Latin America: financial development or
credit boom?” IMF Working Paper 13(106).
Haron, S., Ahmad, N. & Planisek, S.L. (1994) "Bank patronage factors of Muslim and non-
Muslim customers", International Journal of Bank Marketing, 12(1), 32-40.
Harris, R. & Sollis, R. (2003) Applied Time Series Modelling and Forecasting. Chichester,
UK: Wiley.
Hasan, M. & Dridi, J., (2010) "The effects of the global crisis on Islamic and conventional
banks: a comparative study "IMF Working Paper 10(201).
Hunter, J. & Menla Ali, F. (2014) "Money demand instability and real exchange rate
persistence in the monetary model of USD–JPY exchange rate", Economic Modelling,
40, 42-51.
Im, K.S., Pesaran, M.H. & Shin, Y. (2003) "Testing for unit roots in heterogeneous panels",
Journal of Econometrics, 115(1), 53-74.
Imam, P. & Kpodar, K. (2015) "Is Islamic banking good for growth?", IMF working paper,
15(81).

25
Johansen, S. (1988) "Statistical analysis of cointegration vectors", Journal of Economic
Dynamics and Control, 12(2), 231-254.
Johansen, S. (1995) Likelihood-based inference in cointegrated vector autoregressive models,
Oxford University Press, Oxford; New York.
Johnson, K. (2013) "The role of Islamic banking in economic growth", CMC Senior Theses.
Paper 642. Available at http://scholarship.claremont.edu/cmc_theses/642.
Juselius, K. & MacDonald, R. (2004) "International parity relationships between the USA
and Japan", Japan and the World economy, 16(1), 17-34.
Kammer, M.A., Norat, M.M., Pinon, M.M., Prasad, A., Towe, M.C.M. & Zeidane, M.Z.
(2015) "Islamic finance: opportunities, challenges, and policy options", IMF Staff
Papers 15(5), 1-38.
Kao, C. (1999) "Spurious regression and residual-based tests for cointegration in panel data",
Journal of Econometrics, 90(1), pp. 1-44.
Kao, C. & Chiang, M.-H. (2000) "On the estimation and inference of a cointegrated
regression in panel data", in Baltagi B. H. (ed.), Advances in Econometrics: Nonstationary
Panels, Panel Cointegration and Dynamic Panels, 15, 179–222.
Khan, F. (2010) "How ‘Islamic’ is Islamic banking?", Journal of Economic Behavior &
Organization, 76(3), 805-820.
King, R.G. & Levine, R. 1993, "Finance, entrepreneurship and growth", Journal of Monetary
Economics, 32(3), 513-542.
Lanne, M., Lütkepohl, H. & Saikkonen, P. (2002) "Comparison of unit root tests for time
series with level shifts", Journal of time series analysis, (23) 6, 667-685.
Law, S.H. & Singh, N. (2014) "Does too much finance harm economic growth?", Journal of
Banking & Finance, (41), 36-44.
Levin, A.T. & Lin, C. (1993) "Unit root tests in panel data: new results", University of
California at San Diego, Discussion Paper No. 93-56.
Levine, R. & Zervos, S. (1998) "Stock markets, banks, and economic growth", American
economic review, 88, 537-558.
Luintel, K.B. & Khan, M. (1999) "A quantitative reassessment of the finance–growth nexus:
evidence from a multivariate VAR", Journal of Development Economics, 60(2), 381-
405.
MacKinnon, J.G. (1996) "Numerical distribution functions for unit root and cointegration
tests", Journal of Applied Econometrics, (11) 6, 601-618.
Maddala, G.S. & Wu, S. (1999) "A comparative study of unit root tests with panel data and a
new simple test", Oxford Bulletin of Economics and Statistics, 61(S1), 631-652.
26
Majid, S.A. & Kassim, S. (2010) "Islamic finance and economic growth: The Malaysian
experience". Paper presented in Kuala Lumpur Islamic Finance Forum, Kuala Lumpur, 2-5
August 2010.
McKinnon, R.I. (1973) Money and capital in economic development, the Brookings
Institution, Washington, D. C.
Mills, P.S. & Presley, J.R. (1999) Islamic Finance: Theory and Practice. St. Martins Press,
New York.
Mohieldin, M. (2012) "Realising the potential of Islamic finance", World Economics, 13(3),
127-142.
Moran, M. (1992) V. sundararajan and T. baliño, eds. banking crises: Cases and issues,
washington, D.C.: International monetary fund, 1991.
Pedroni, P. (2004) "Panel cointegration: asymptotic and finite sample properties of pooled
time series tests with an application to the PPP hypothesis", Econometric theory, 20(03),
597-625.
Persyn, D. & Westerlund, J. (2008) "Error-correction-based cointegration tests for panel
data", Stata Journal, (8) 2, 232.
Phillips, P.C. & Perron, P. (1988) "Testing for a unit root in time series regression",
Biometrika, 75(2), 335-346.
Robinson, J. (1953) The rate of Interest and Other Essays, Magmillan, London.
Rousseau, P.L. & Wachtel, P. (2011) "What is happening to the impact of financial
deepening on economic growth?", Economic inquiry, 49(1), 276-288.
Schumpeter, J., (1911) The theory of economic development, Harvard University Press,
Cambridge, MA.
Shaw, E.S., (1973) Financial deepening in economic development, Oxford University Press,
New York.
Siddiqi, M.N. (1999) "Islamic finance and beyond: premises and promises of Islamic
economics", Proceedings of the Third Harvard University Forum on Islamic Finance:
Local Challenges, Global Opportunities.
Siddiqi, M.N. (2006) "Islamic banking and finance in theory and practice: A Survey of state
of the Art", Islamic Economic Studies, 13(2), 1-48.
Turner, A. (2009) "A regulatory response to the global banking crisis", Financial Services
Authority, London.
Westerlund, J. (2007) "Testing for error correction in panel data*", Oxford Bulletin of
Economics and Statistics, 69(6), 709-748.

27
Zaher, T.S. & Kabir Hassan, M. (2001) "A comparative literature survey of Islamic finance
and banking", Financial Markets, Institutions & Instruments, 10(4), 155-199.


![Islamic Letters of Credit Oracle FLEXCUBE Universal Banking · Islamic Letters of Credit Oracle FLEXCUBE Universal Banking Release 11.3.0 [May] [2011] Oracle Part Number E51535-01](https://static.fdocuments.net/doc/165x107/5f07fadc7e708231d41fb98d/islamic-letters-of-credit-oracle-flexcube-universal-banking-islamic-letters-of-credit.jpg)