fz.connectcharter.ca · Web viewAccountABilitY stAtEMEnt. AccountABilitY stAtEMEnt. foundAtion...
81
A nnuAl EducAtion REsults REpoRt 2017-2018 thREE YE A R EducAtion pl An 2018-2021 Connect Charter School it’s nEvER just An oRdinARY dAY
Transcript of fz.connectcharter.ca · Web viewAccountABilitY stAtEMEnt. AccountABilitY stAtEMEnt. foundAtion...
AnnuAl EducAtion REsults REpoRt2017-2018
thREE YEAR EducAtion plAn2018-2021
Connect Charter Schoolit’s nEvER just An oRdinARY dAY

c onn E c t c h A R t E R s c ho ol |
p1
chRis gilMouR,
MEssAgE fRoM thE BoARd chAiR, supERintEndEnt And pRincipAl
On behalf of the Board of Directors, administrative staff, teachers and school staff members, students and parents, it is our pleasure to present the Connect Charter School Annual Education Results Report for the 2017-2018 School Year and the Education Plan for 2018-2019 to 2020-2021.
We are proud to present the Annual Education Report and three-year Education Plan for Connect Charter School.Together, these documents outline the leadership and commitment Connect continues to demonstrate in fulfilling its mandate as we prepare our students to become extraordinary citizens. It builds on our accomplishments from the past school year and articulates a strong, focused vision for the future in keeping with our charter goals, mission, vision and guiding principles, and the ideals of the Alberta Education Ministerial Order on Student Learning. We have actively engaged students, staff members, and parentsin the process of sharing feedback and identifying action strategies through various surveys, interviews, and dialogue sessions.
As we reflect on the 2017-2018 school year a variety of indicators demonstrate the rigor of process implemented as we continued to be an innovative hub of learning. Our commitment to a disposition of inquiry is reflected in the growth of enhanced meaningful learning opportunities for our students at the school and off-site.
The Connect Charter School’s Descriptors of Exemplary Learning, Exemplary Teaching and Exemplary Instructional Leadership reflect the Government of Alberta’s updated Professional Practice Standards for the Teaching Profession, Leadership Quality Standards and the Superintendent Leadership Quality Standards. Together, the competencies and indicators contained in these documents guide leadership and teaching, and ensure an optimal learning environment that is diverse, inclusive, and safe for our students. Furthermore, our plan outlines initiatives we believe have become hallmarks of the Connect Charter School: embracing collaboration and building relationships within and beyond the walls of the school, sharing what we do, learning from others and encouraging others to learn from us, all of which reflect our commitment to Lead-Share- Transform. Our work establishing relationships to acquire
and apply foundational knowledge about First Nations, Metis, and Inuit will continue to grow and guide our path forward.Our document also outlines how we continue to demonstrate innovation in teaching to further engage our students and to bring positive change to our broader education system.
On behalf of our stakeholders, I present to you the summary analysis of our data and feedback and our three-year plan with strategies for improvement, because at Connect Charter School it’s never just an ordinary day!
Respectfully submitted,
dAvid RoBinson,Chair, Connect Charter School Society Board of Directors
Superintendent, Connect Charter School
c onn E c t c h A R t E R s c ho ol |
p2
dR. phil ButtERfiEld,Principal,Connect Charter School

AccountABilitY
c onn E c t c h A R t E R s c ho ol |
p3
The Annual Education Results Report for the 2017/18 school year and the Three-Year Education Plan commencing September 1, 2018 for Connect Charter School were prepared under the direction of the Board in accordance with itsresponsibilities under the School Act.This document was developed in the context of the provincial government’s business and fiscal plans. The Board has used the results reported in the document, to the best of its abilities, to develop the education plan and is committed to implementing the strategies contained within the plan to improve student learning and results.
The Board approved this combined Annual Education Results Report for the 2017/2018 school year and the Three-Year Education Plan for 2018/2021 on November 21, 2018.
RoBust inquiRY- BAsEd lEARning
foundAtion
We commit to bringing learning to lifeand life to learning.
We provide leadership in thetransformation of education to bring a positive benefit to our students and the educational community.
We foster the authentic engagementof students and teachers as learners.
We promote innovation withinan active, inquiry-based learning community. We embrace collaboration. We share what we do. We learn from others and others learn from us. We create broader relationships beyond the walls of our school to bring a positive benefit to our students and the broader educational community.
guiding pRinciplEs
We value our unique culture characterized by a strong sense of caring, teamwork and mutualrespect among our students, parents and staff members.
We strive to build on the sense in the Connect Charter School that, “this is a good place to be and we are all in this together” as a school community.
c onn E c t c h A R t E R s c ho ol |
p4
pREpARing ouR studEnts As ExtRAoRdinARY citizEns
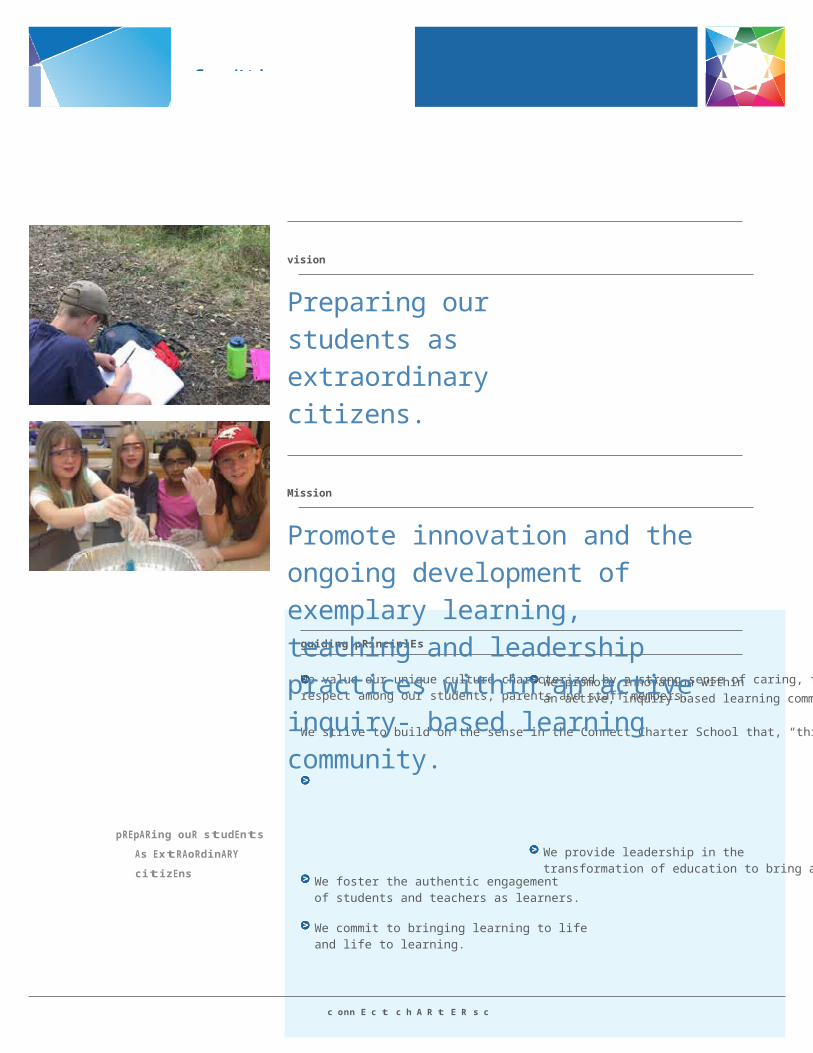
vision
Preparing our students as extraordinary citizens.Mission
Promote innovation and the ongoing development of exemplary learning, teaching and leadership practices within an active inquiry- based learning community.
tREnds And
c onn E c t c h A R t E R s c ho ol |
p5
At Connect we continue to place a great emphasis on meeting our obligation as a charter school for sharing our practice with other educators and for innovation.Teacher and school Twitter accounts combined with a variety of learning management systems facilitated regular correspondence with stakeholders and allowed our school to share with the world student publications and products. Our students had more, meaningful learning opportunities through a disposition of inquiry in authentic learning environments than ever before. We continually seek feedback from our parents, teachers and students to ensure our practices exceed expectations. As a result, ongoing changes to programming are implemented, as outlined in the ‘Future Directions’ section of this document.
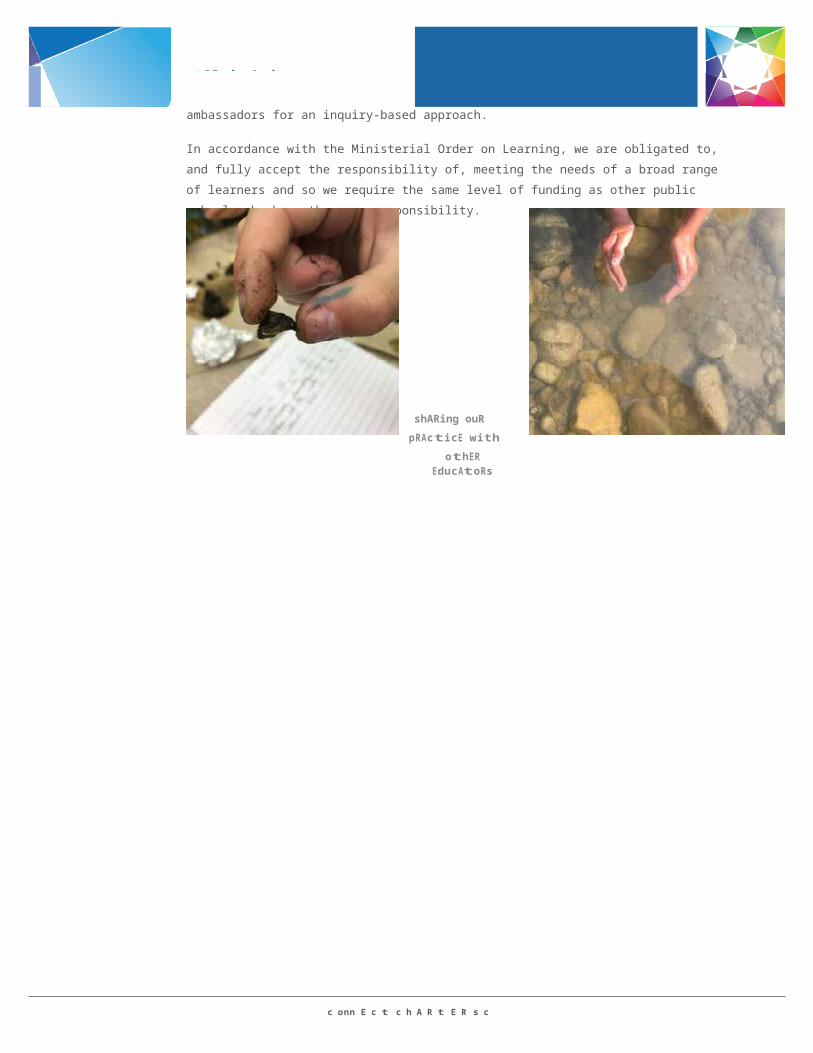
We continue to explore opportunities for opening a second campus. This would allow us to have a broader impact on teaching and learning in Alberta. With another school, we would be able to host a greater number of student teachers, it would provide for a greater infusion of creativity and expertise since more teachers will be part of the Connect family, it would allow us to reach more students who, when they transition into high school, will be advocating for a different means of learning and teaching, and it would provide for a larger parent community who are some of the best ambassadors for an inquiry-based approach.
In accordance with the Ministerial Order on Learning, we are obligated to, and fully accept the responsibility of, meeting the needs of a broad range of learners and so we require the same level of funding as other public schools who have the same responsibility.
shARing ouRpRActicE withothER EducAtoRs
MEAsuRE EvAluAtion
c onn E c t c h A R t E R s c ho ol |
p6
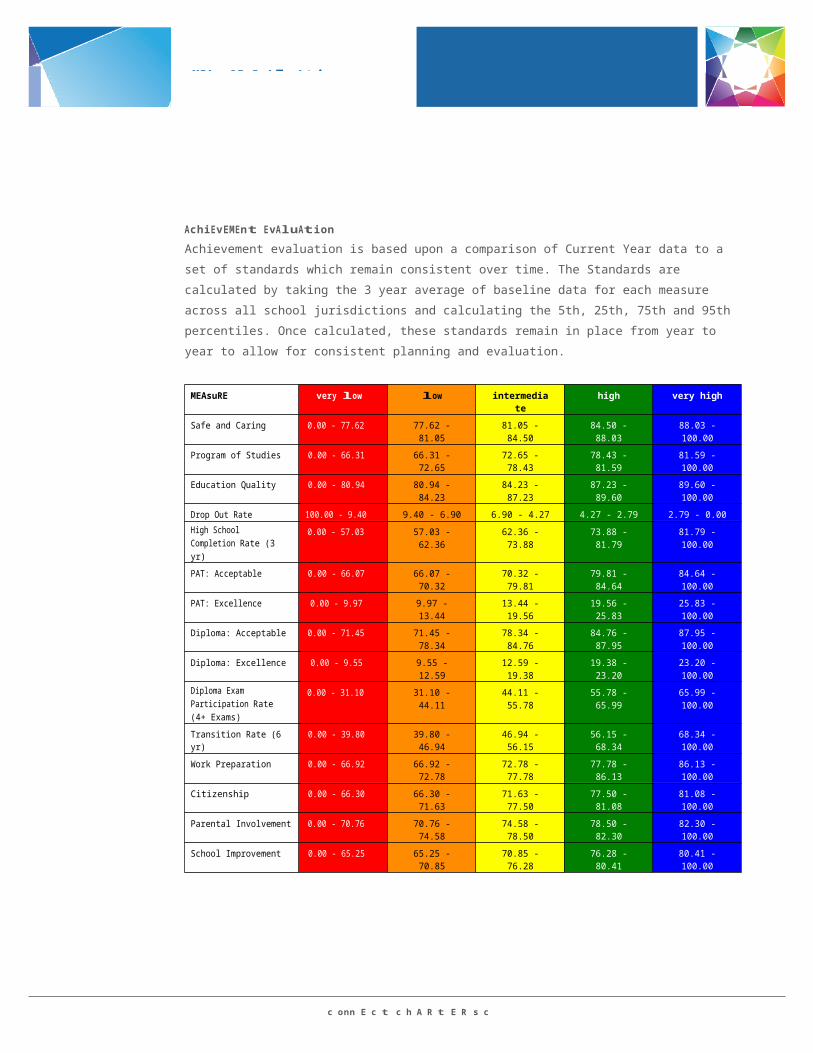
AchiEvEMEnt EvAluAtionAchievement evaluation is based upon a comparison of Current Year data to a set of standards which remain consistent over time. The Standards are calculated by taking the 3 year average of baseline data for each measure across all school jurisdictions and calculating the 5th, 25th, 75th and 95th percentiles. Once calculated, these standards remain in place from year to year to allow for consistent planning and evaluation.
MEAsuRE very low low intermediate high very high
Safe and Caring 0.00 - 77.62 77.62 - 81.05 81.05 - 84.50 84.50 - 88.03 88.03 - 100.00
Program of Studies 0.00 - 66.31 66.31 - 72.65 72.65 - 78.43 78.43 - 81.59 81.59 - 100.00
Education Quality 0.00 - 80.94 80.94 - 84.23 84.23 - 87.23 87.23 - 89.60 89.60 - 100.00
Drop Out Rate 100.00 - 9.40 9.40 - 6.90 6.90 - 4.27 4.27 - 2.79 2.79 - 0.00
High School Completion Rate (3 yr)
0.00 - 57.03 57.03 - 62.36 62.36 - 73.88 73.88 - 81.79 81.79 - 100.00
PAT: Acceptable 0.00 - 66.07 66.07 - 70.32 70.32 - 79.81 79.81 - 84.64 84.64 - 100.00
PAT: Excellence 0.00 - 9.97 9.97 - 13.44 13.44 - 19.56 19.56 - 25.83 25.83 - 100.00
Diploma: Acceptable 0.00 - 71.45 71.45 - 78.34 78.34 - 84.76 84.76 - 87.95 87.95 - 100.00
Diploma: Excellence 0.00 - 9.55 9.55 - 12.59 12.59 - 19.38 19.38 - 23.20 23.20 - 100.00
Diploma Exam Participation Rate (4+ Exams)
0.00 - 31.10 31.10 - 44.11 44.11 - 55.78 55.78 - 65.99 65.99 - 100.00
Transition Rate (6 yr) 0.00 - 39.80 39.80 - 46.94 46.94 - 56.15 56.15 - 68.34 68.34 - 100.00
Work Preparation 0.00 - 66.92 66.92 - 72.78 72.78 - 77.78 77.78 - 86.13 86.13 - 100.00
Citizenship 0.00 - 66.30 66.30 - 71.63 71.63 - 77.50 77.50 - 81.08 81.08 - 100.00
Parental Involvement 0.00 - 70.76 70.76 - 74.58 74.58 - 78.50 78.50 - 82.30 82.30 - 100.00
School Improvement 0.00 - 65.25 65.25 - 70.85 70.85 - 76.28 76.28 - 80.41 80.41 - 100.00
MEAsuRE EvAluAtion
c onn E c t c h A R t E R s c ho ol |
p7
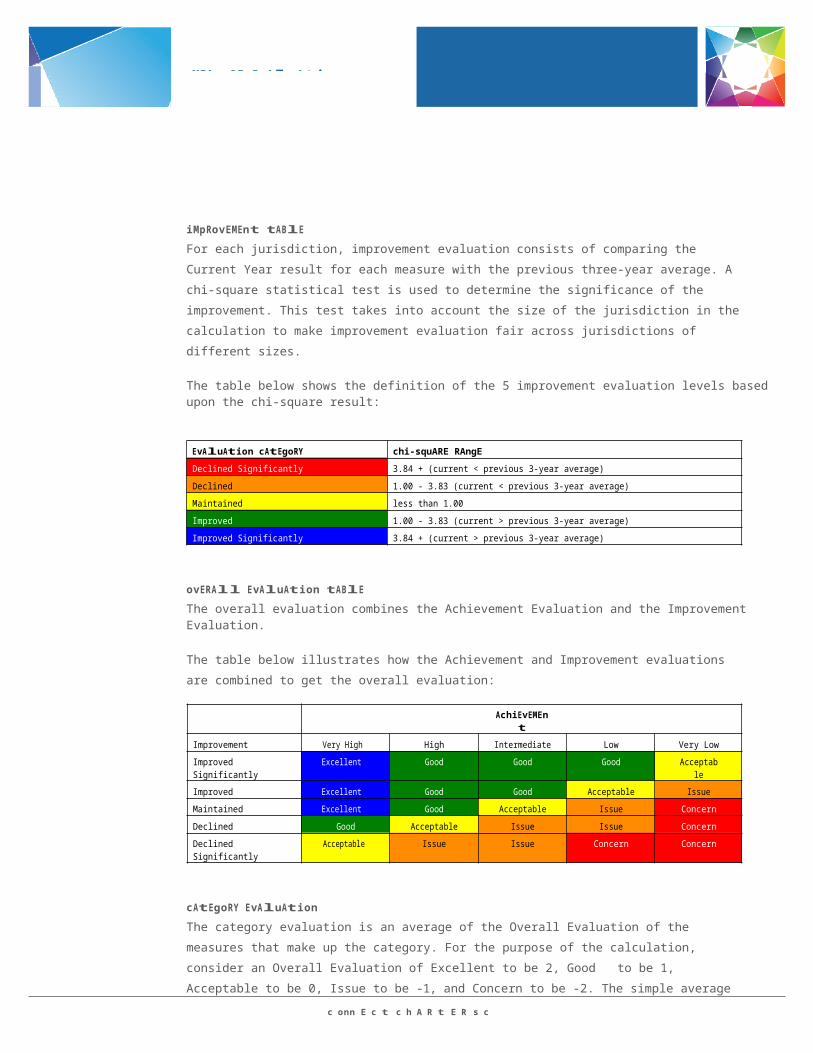
iMpRovEMEnt tABlEFor each jurisdiction, improvement evaluation consists of comparing the Current Year result for each measure with the previous three-year average. A chi-square statistical test is used to determine the significance of the improvement. This test takes into account the size of the jurisdiction in the calculation to make improvement evaluation fair across jurisdictions of different sizes.
The table below shows the definition of the 5 improvement evaluation levels based upon the chi-square result:
EvAluAtion cAtEgoRY chi-squARE RAngE
Declined Significantly 3.84 + (current < previous 3-year average)
Declined 1.00 - 3.83 (current < previous 3-year average)
Maintained less than 1.00
Improved 1.00 - 3.83 (current > previous 3-year average)
Improved Significantly 3.84 + (current > previous 3-year average)
ovERAll EvAluAtion tABlEThe overall evaluation combines the Achievement Evaluation and the Improvement Evaluation.
The table below illustrates how the Achievement and Improvement evaluations are combined to get the overall evaluation:
AchiEvEMEnt
Improvement Very High High Intermediate Low Very Low
Improved Significantly Excellent Good Good Good Acceptable
Improved Excellent Good Good Acceptable Issue
Maintained Excellent Good Acceptable Issue Concern
Declined Good Acceptable Issue Issue Concern
Declined Significantly Acceptable Issue Issue Concern Concern
cAtEgoRY EvAluAtionThe category evaluation is an average of the Overall Evaluation of the measures that make up the category. For the purpose of the calculation, consider an Overall Evaluation of Excellent to be 2, Good to be 1, Acceptable to be 0, Issue to be -1, and Concern to be -2. The simple average (mean) of these values rounded to the nearest integer produces the Category Evaluation value. This is converted back to a colour using the same scale above (e.g. 2=Excellent, 1=Good, 0=Intermediate, -1=Issue, -2=Concern)
Connect Summar
AERR suMMARY
c onn E c t c h A R t E R s c ho ol
Connect Charter School offers an enhanced, publicly-funded program that provides authentic, real-life learning opportunities to develop students as extraordinary citizens.Our collaborative teaching and learning practices benefit our students, teachers and other educators to improve Alberta’s education system.
fast facts
• Public Charter School• Inclusive• 624 students – over 1000 on the first come first serve wait list• Grades 4 to 9• Located in Southwest Calgary
vision
“Preparing students as extraordinary citizens” – A lofty vision that captures the significance we place on the key pillars of our program:
• Outdoor & environmental education• Collaboration• Inquiry-based learning• Research• Technology integration• Real-life learning experiences
Research & innovation Mandate
As a public charter school, Connect has the additional responsibility to engage in research and innovation to improve education. We share our work on our Connect! Blog, by hosting hundredsof visitors each year, by presenting at major conferences, and more.
2017/ 18 pRioRitiEs & AccoMplishMEnts
There were many highlights in the 2017-2018 school year…
Continued strong academic success of our students:
Worked collaboratively with Alberta Education, universities and other partners in education to serve as a crucible for change
Developed a sustainable partnership with Tsuut’ina Education through the Partners In Place (PIP) initiative, designed as a bridge to reconciliation. The PIP initiative will be continuing in the 2018-19 school year and beyond.
Meaningfully collaborated with many partners including teachers, administrators, pre-service teachers, university professors, kinesiology students, educational assistant practicum students, Bridges to Education students, and Alberta Education personnel
Hosted the Northwest Regional Conference of the Association for Experiential Education (May 17-20th, 2018).
Enhanced student competency and teachers’ and administrators’ professional capacity using the descriptors of exemplary learning, teaching and leadership as frameworks for action.
c onn E c t c h A R t E R s c ho ol
Connect Summar
AERR suMMARY
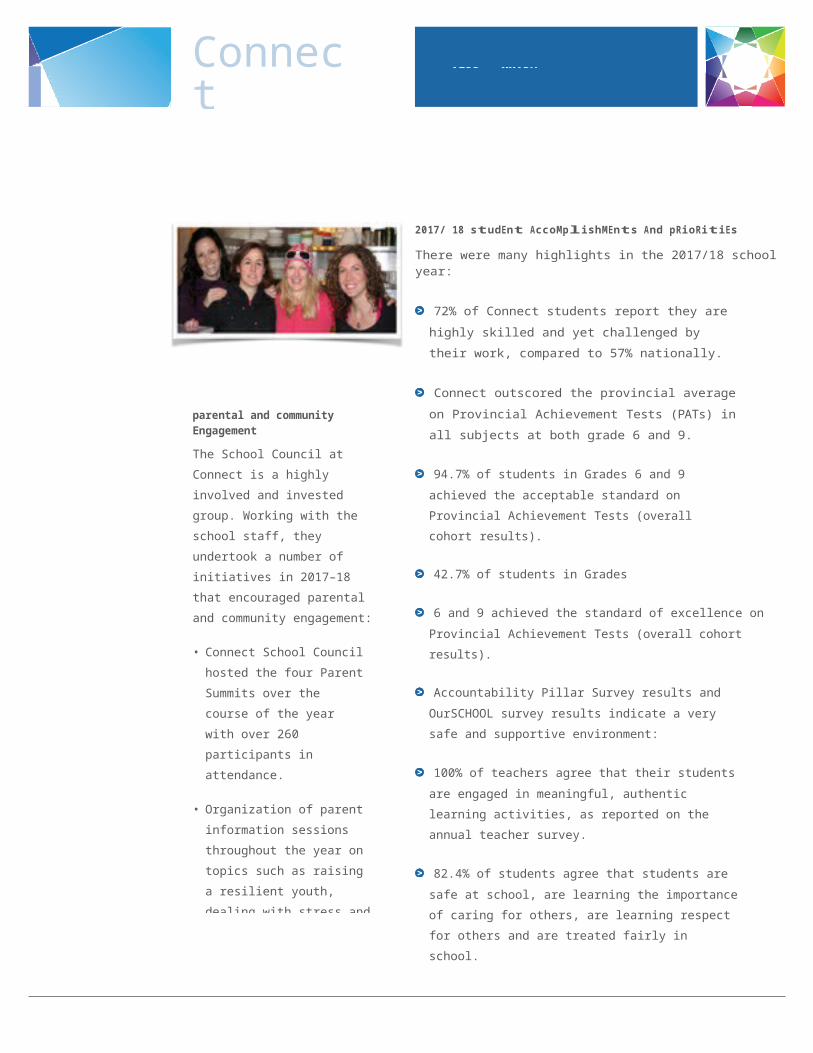
2017/ 18 studEnt AccoMplishMEnts And pRioRitiEs
There were many highlights in the 2017/18 school year:
72% of Connect students report they are highly skilled and yet challenged by their work, compared to 57% nationally.
Connect outscored the provincial average on Provincial Achievement Tests (PATs) in all subjects at both grade 6 and 9.
94.7% of students in Grades 6 and 9 achieved the acceptable standard on Provincial Achievement Tests (overall cohort results).
42.7% of students in Grades
6 and 9 achieved the standard of excellence on Provincial Achievement Tests (overall cohort results).
Accountability Pillar Survey results and OurSCHOOL survey results indicate a very safe and supportive environment:
100% of teachers agree that their students are engaged in meaningful, authentic learning activities, as reported on the annual teacher survey.
82.4% of students agree that students are safe at school, are learning the importance of caring for others, are learning respect for others and are treated fairly in school.
We are an inclusive charter school and do not discriminate in our entrance process – we are stronger for our diversity.
the summary and full Annual Education Results Report for connect charter school is available at: http://connectcharter.ca/publications/plans_and_reports.asp
Paper copies are available at the main office in at the school.
Student achievement remains very high, coupled with high levels of student engagement and challenge. A disposition of inquiry is a highly effective means by which we can address both the fundamentals of learning as well as deeper learning and knowledge creation. 100% of teachers strongly agree or agree that “I am an innovator and I take measured risks to push my practice forward and promote an entrepreneurial spirit in my students”.
Students, staff, and parents understand the significance of outdoor and environmental education.
parental and community Engagement
The School Council at Connect is a highly involved and invested group. Working with the school staff, they undertook a number of initiatives in 2017–18 that encouraged parental and community engagement:
• Connect School Council hosted the four Parent Summits over the course of the year with over 260 participants in attendance.
• Organization of parent information sessions throughout the year on topics such as raising a resilient youth, dealing with stress and anxiety, high school transition, and more
• Open forum, “Forum with Phil” sessions at each school council meeting
• Thousands of hours of parent volunteer time on field trips (including many overnight trips), supporting special events, fundraising, supporting learning in the
c onn E c t c h A R t E R s c ho ol
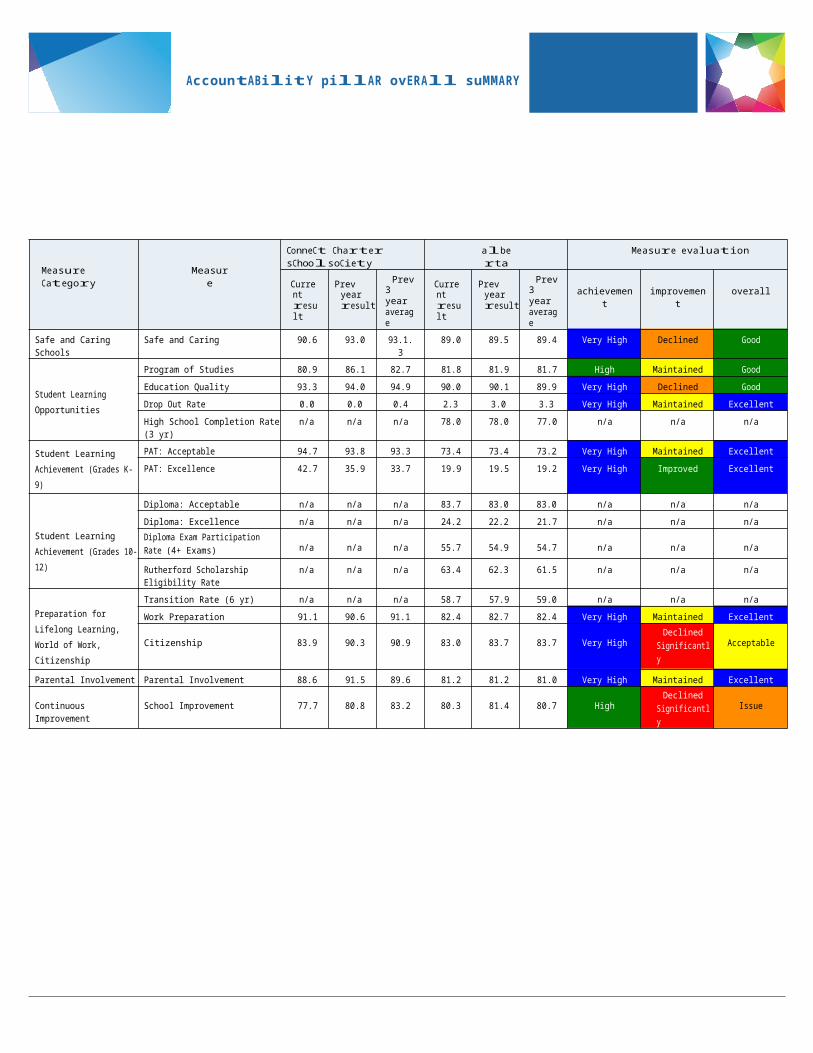
AccountABilitY pillAR ovERAll suMMARY
Measure Category Measure
ConneCt Charter sChoolsoCiety
alberta Measure evaluation
Current result
Prev year result
Prev 3 year average
Current result
Prev year result
Prev 3 year average
achievement improvement overall
Safe and Caring Schools Safe and Caring 90.6 93.0 93.1.3 89.0 89.5 89.4 Very High Declined Good
Student Learning Opportunities
Program of Studies 80.9 86.1 82.7 81.8 81.9 81.7 High Maintained Good
Education Quality 93.3 94.0 94.9 90.0 90.1 89.9 Very High Declined Good
Drop Out Rate 0.0 0.0 0.4 2.3 3.0 3.3 Very High Maintained Excellent
High School Completion Rate (3 yr) n/a n/a n/a 78.0 78.0 77.0 n/a n/a n/a
Student Learning Achievement (Grades K-9)
PAT: Acceptable 94.7 93.8 93.3 73.4 73.4 73.2 Very High Maintained Excellent
PAT: Excellence 42.7 35.9 33.7 19.9 19.5 19.2 Very High Improved Excellent
Student Learning Achievement (Grades 10-12)
Diploma: Acceptable n/a n/a n/a 83.7 83.0 83.0 n/a n/a n/a
Diploma: Excellence n/a n/a n/a 24.2 22.2 21.7 n/a n/a n/a
Diploma Exam Participation Rate (4+ Exams)
n/a n/a n/a 55.7 54.9 54.7 n/a n/a n/a
Rutherford Scholarship Eligibility Rate n/a n/a n/a 63.4 62.3 61.5 n/a n/a n/a
Preparation for Lifelong Learning, World of Work, Citizenship
Transition Rate (6 yr) n/a n/a n/a 58.7 57.9 59.0 n/a n/a n/a
Work Preparation 91.1 90.6 91.1 82.4 82.7 82.4 Very High Maintained Excellent
Citizenship 83.9 90.3 90.9 83.0 83.7 83.7 Very HighDeclined
SignificantlyAcceptable
Parental Involvement Parental Involvement 88.6 91.5 89.6 81.2 81.2 81.0 Very High Maintained Excellent
Continuous Improvement School Improvement 77.7 80.8 83.2 80.3 81.4 80.7 HighDeclined
SignificantlyIssue
c onn E c t c h A R t E R s c ho ol
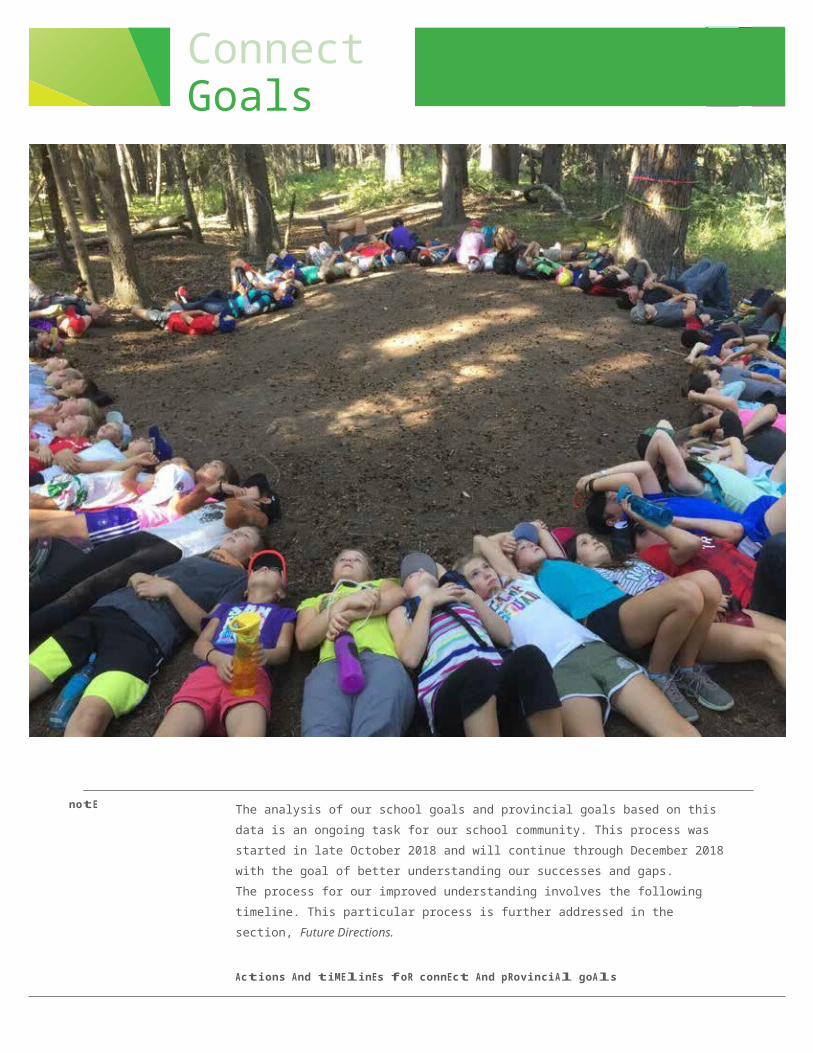
Connect Goals
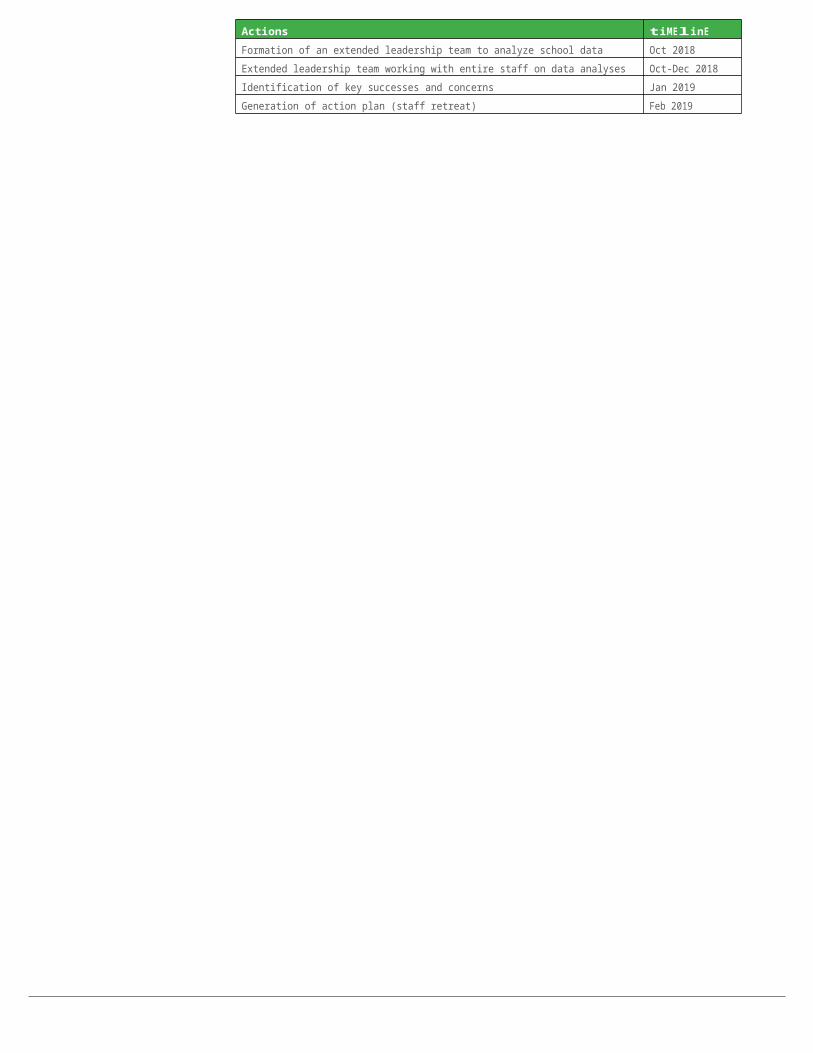
notE The analysis of our school goals and provincial goals based on this data is an ongoing task for our school community. This process was started in late October 2018 and will continue through December 2018 with the goal of better understanding our successes and gaps.The process for our improved understanding involves the following timeline. This particular process is further addressed in the section, Future Directions.
Actions And tiMElinEs foR connEct And pRovinciAl goAls
Actions tiMElinEFormation of an extended leadership team to analyze school data Oct 2018
Extended leadership team working with entire staff on data analyses Oct-Dec 2018
Identification of key successes and concerns Jan 2019
Generation of action plan (staff retreat) Feb 2019
c onn E c t c h A R t E R s c ho ol
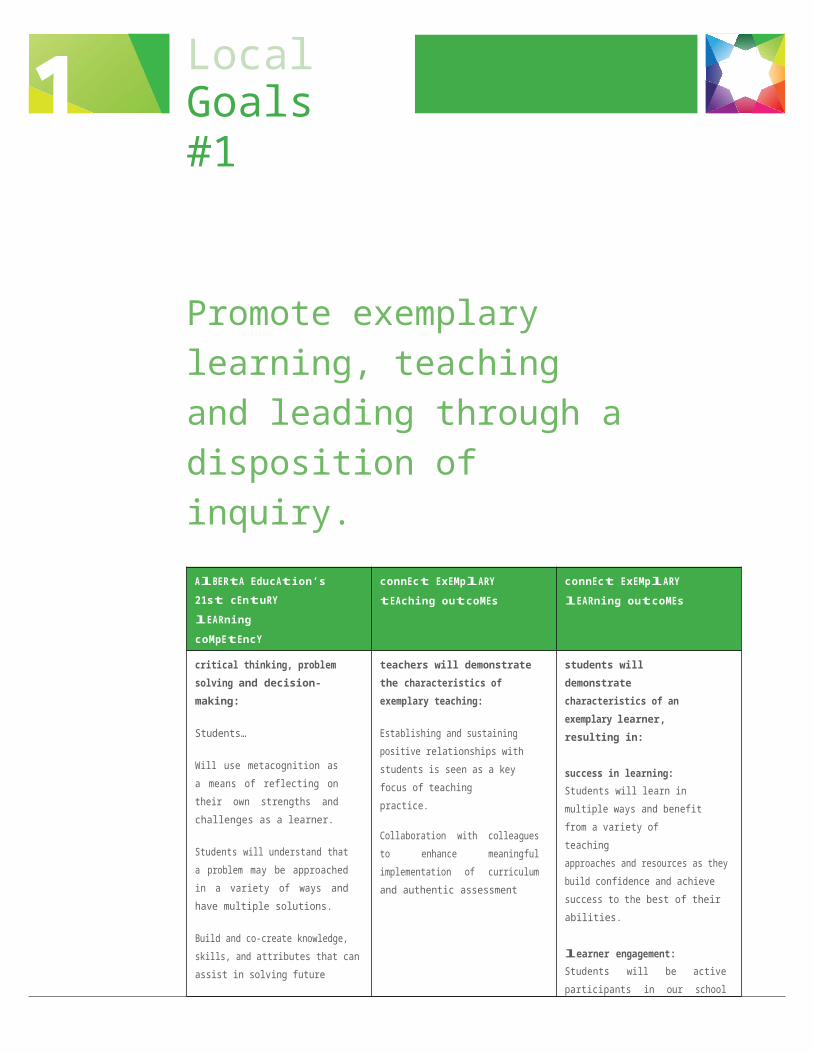
Local Goals #1
Promote exemplary learning, teaching and leading through a disposition of inquiry.
AlBERtA EducAtion’s21st cEntuRY lEARning coMpEtEncY
connEct ExEMplARY tEAching outcoMEs
connEct ExEMplARY lEARning outcoMEs
critical thinking, problem solving and decision-making:
Students…
Will use metacognition as a means of reflecting on their own strengths and challenges as a learner.
Students will understand that a problem may be approached in a variety of ways and have multiple solutions.
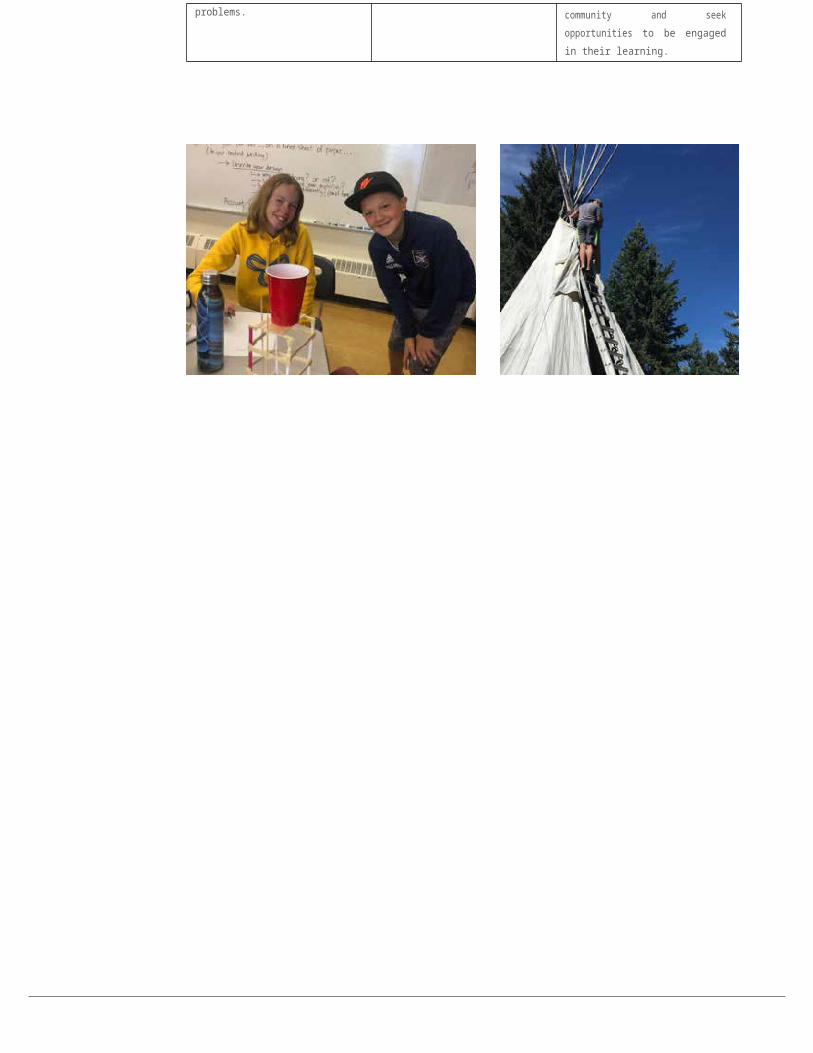
Build and co-create knowledge, skills, and attributes that can assist in solving future problems.
teachers will demonstrate the characteristics of exemplary teaching:
Establishing and sustaining positive relationships with students is seen as a key focus of teaching practice.
Collaboration with colleagues to enhance meaningful implementation of curriculum and authentic assessment
students will demonstrate characteristics of an exemplary learner, resulting in:
success in learning:Students will learn in multiple ways and benefit from a variety of teachingapproaches and resources as they build confidence and achieve success to the best of their abilities.
learner engagement:Students will be active participants in our school community and seek opportunities to be engaged in their learning.
1
c onn E c t c h A R t E R s c ho ol
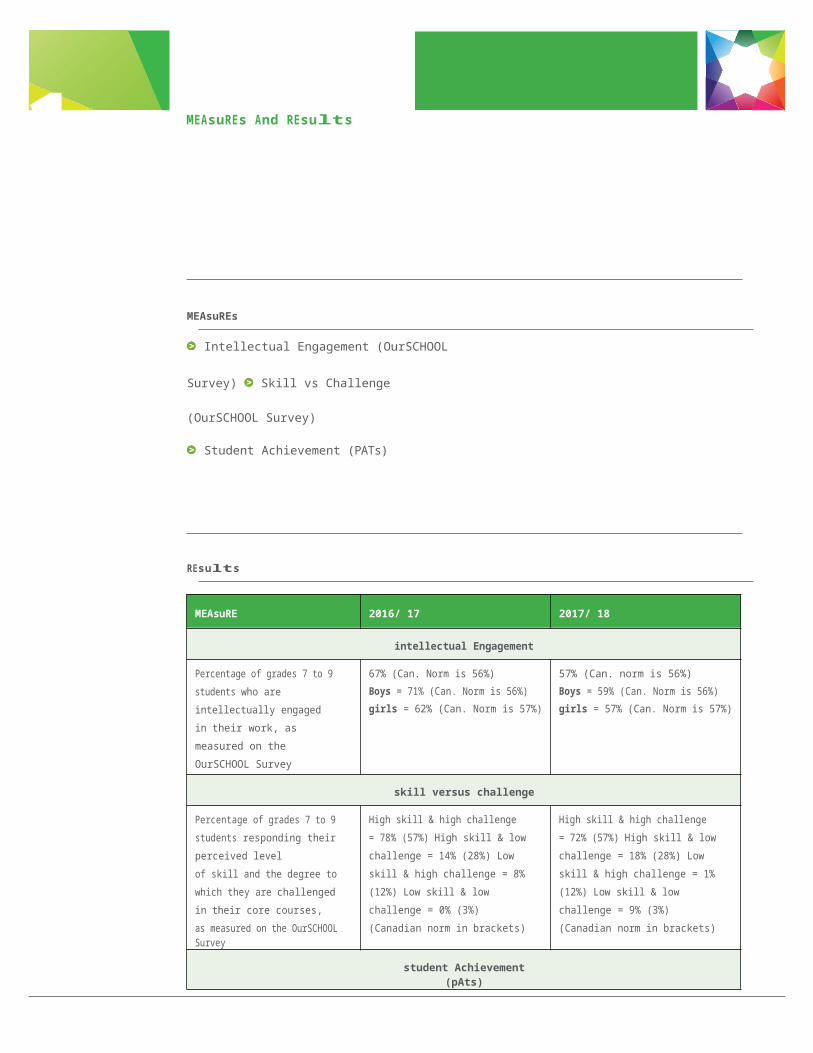
1 MEAsuREs And REsults
MEAsuREs
Intellectual Engagement (OurSCHOOL Survey)
Skill vs Challenge (OurSCHOOL Survey)
Student Achievement (PATs)
REsults
MEAsuRE 2016/ 17 2017/ 18
intellectual Engagement
Percentage of grades 7 to 9 students who are intellectually engaged in their work, as measured on the OurSCHOOL Survey
67% (Can. Norm is 56%)Boys = 71% (Can. Norm is 56%)girls = 62% (Can. Norm is 57%)
57% (Can. norm is 56%)Boys = 59% (Can. Norm is 56%)girls = 57% (Can. Norm is 57%)
skill versus challenge
Percentage of grades 7 to 9 students responding their perceived levelof skill and the degree to which they are challenged in their core courses,as measured on the OurSCHOOL Survey
High skill & high challenge = 78% (57%) High skill & low challenge = 14% (28%) Low skill & high challenge = 8% (12%) Low skill & low challenge = 0% (3%) (Canadian norm in brackets)
High skill & high challenge = 72% (57%) High skill & low challenge = 18% (28%) Low skill & high challenge = 1% (12%) Low skill & low challenge = 9% (3%) (Canadian norm in brackets)
student Achievement (pAts)
Standard of Excellence93.8%35.9%
94.7%42.7%
pRoMoting ExEMplARY tEAching
c onn E c t c h A R t E R s c ho ol
1 MEAsuREs And REsults CON’T
MEAsuREs
Exemplary Teaching
Level of Skill and Challenge
Superintendent Survey Results
REsults
MEAsuRE 2016/ 17 2017/ 18
Exemplary teaching
Characteristics of exemplary teaching with the % who strongly agree and agree in each area. The top three areas are included.
Relationships = 100% Engagement in Learning = 100% Student Success = 100%
Relationships = 96% Engagement in Learning = 100% Student Success = 96%
level of skill and challenge
% of students responding their perceived level of skill and the degree to which they are challenged in their core courses, as measured on the OurSCHOOL Survey
81% 78%
superintendent survey Results
The teachers are great. They have a huge drive to be able to engage every kid as much as they possibly can. They are open minded and easy to talk to. When you have a question, the teachers are very good at approaching the situation and they are honest. They are willing to try so many things which is amazing, and they were good with our child’s IPP and set goals at the beginning of the year, and now these areas are no longer a concern.
pRoMoting ExEMplARY lEARning
c onn E c t c h A R t E R s c ho ol
Local Goal #2
Enhance learning and teaching through the appropriate and effective use of technology and maintain an intentional, authentic and innovative perspective in the use of technology.
AlBERtA EducAtion’s21st cEntuRY lEARning coMpEtEncY
connEct ExEMplARY tEAching outcoMEs
connEct ExEMplARY lEARning outcoMEs
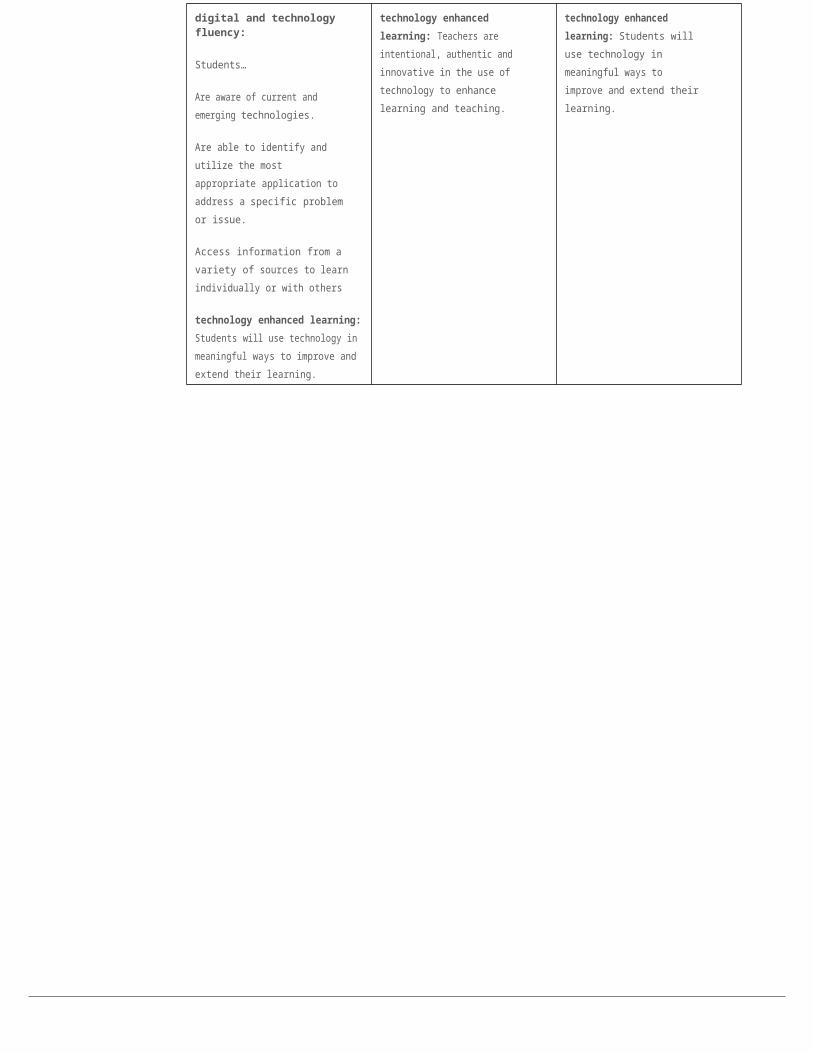
digital and technology fluency:
Students…
Are aware of current and emerging technologies.
Are able to identify and utilize the most appropriate application to address a specific problem or issue.
Access information from a variety of sources to learn individually or with others
technology enhanced learning: Students will use technology in meaningful ways to improve and extend their learning.
technology enhanced learning: Teachers are intentional, authentic and innovative in the use of technology to enhance learning and teaching.
technology enhanced learning: Students will use technology in meaningful ways to improve and extend their learning.
2
c onn E c t c h A R t E R s c ho ol
R
2 MEAsuREs And REsults
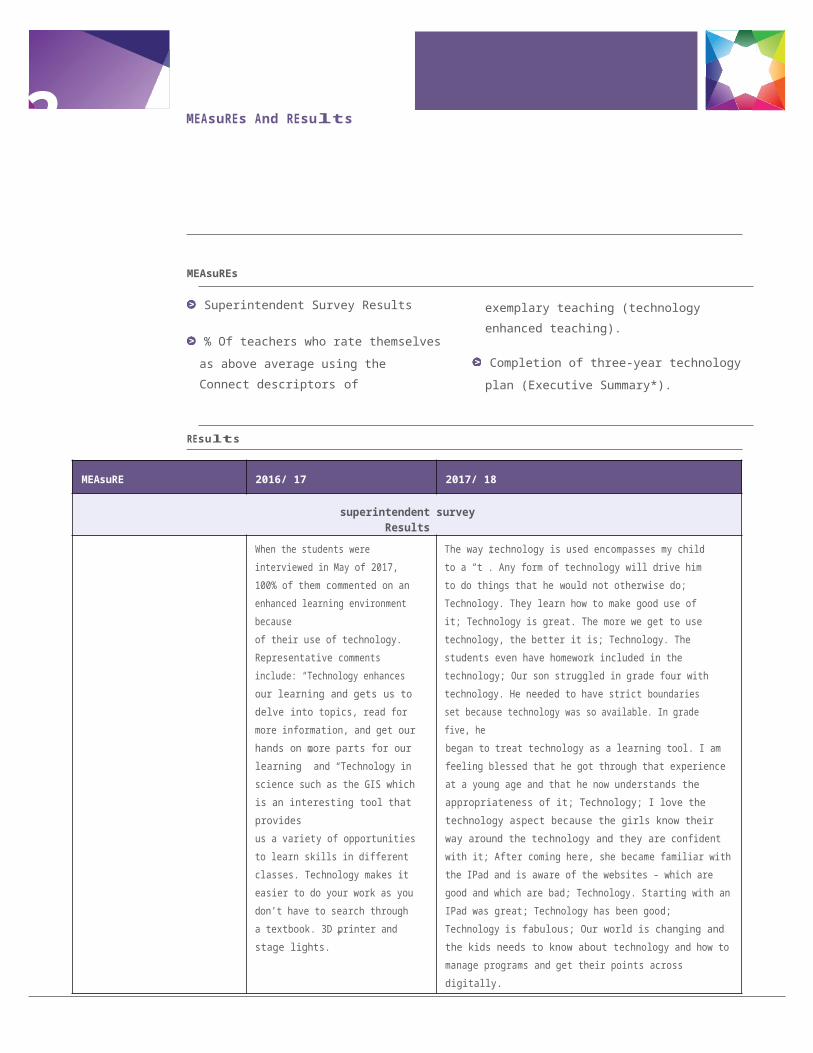
MEAsuREs
Superintendent Survey Results
% Of teachers who rate themselves as above average using the Connect descriptors of
exemplary teaching (technology enhanced teaching).
Completion of three-year technology plan (Executive Summary*).
REsults
MEAsuRE 2016/ 17 2017/ 18
superintendent survey Results
When the students were interviewed in May of 2017, 100% of them commented on an enhanced learning environment becauseof their use of technology. Representative comments include: “Technology enhances our learning and gets us to delve into topics, read for more information, and get our hands on more parts for our learning” and “Technology in science such as the GIS which is an interesting tool that providesus a variety of opportunities to learn skills in different classes. Technology makes it easier to do your work as you don’t have to search through a textbook. 3D printer and stage lights.”
The way technology is used encompasses my child to a “t”. Any form of technology will drive him to do things that he would not otherwise do; Technology. They learn how to make good use of it; Technology is great. The more we get to use technology, the better it is; Technology. The students even have homework included in the technology; Our son struggled in grade four with technology. He needed to have strict boundaries set because technology was so available. In grade five, hebegan to treat technology as a learning tool. I am feeling blessed that he got through that experience at a young age and that he now understands the appropriateness of it; Technology; I love the technology aspect because the girls know their way around the technology and they are confident with it; After coming here, she became familiar with the IPad and is aware of the websites – which are good and which are bad; Technology. Starting with an IPad was great; Technology has been good; Technology is fabulous; Our world is changing and the kids needs to know about technology and how to manage programs and get their points across digitally.
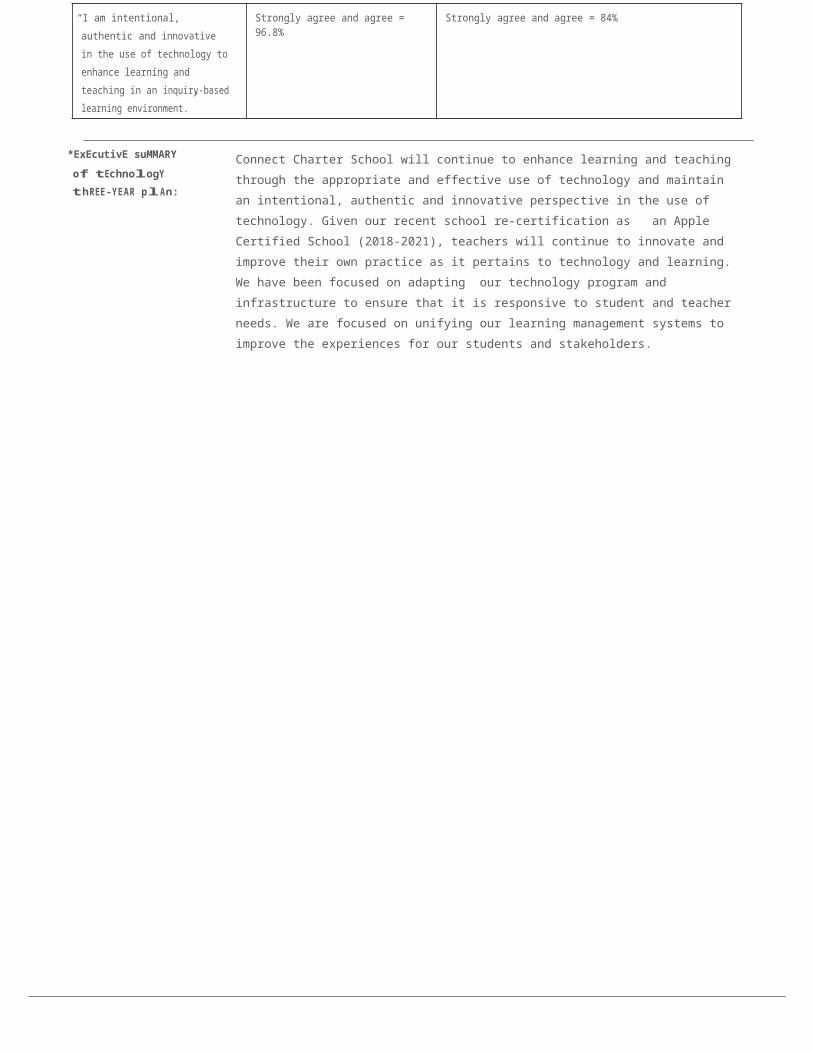
“I am intentional, authentic and innovative in the use of technology to enhance learning and teaching in an inquiry-based learning environment.”
Strongly agree and agree = 96.8% Strongly agree and agree = 84%
*ExEcutivE suMMARY of tEchnologYthREE-YEAR plAn:
Connect Charter School will continue to enhance learning and teaching through the appropriate and effective use of technology and maintain an intentional, authentic and innovative perspective in the use of technology. Given our recent school re-certification as an Apple Certified School (2018-2021), teachers will continue to innovate and improve their own practice as it pertains to technology and learning. We have been focused on adapting our technology program and infrastructure to ensure that it is responsive to student and teacher needs. We are focused on unifying our learning management systems to improve the experiences for our students and stakeholders.
c onn E c t c h A R t E R s c ho ol
R
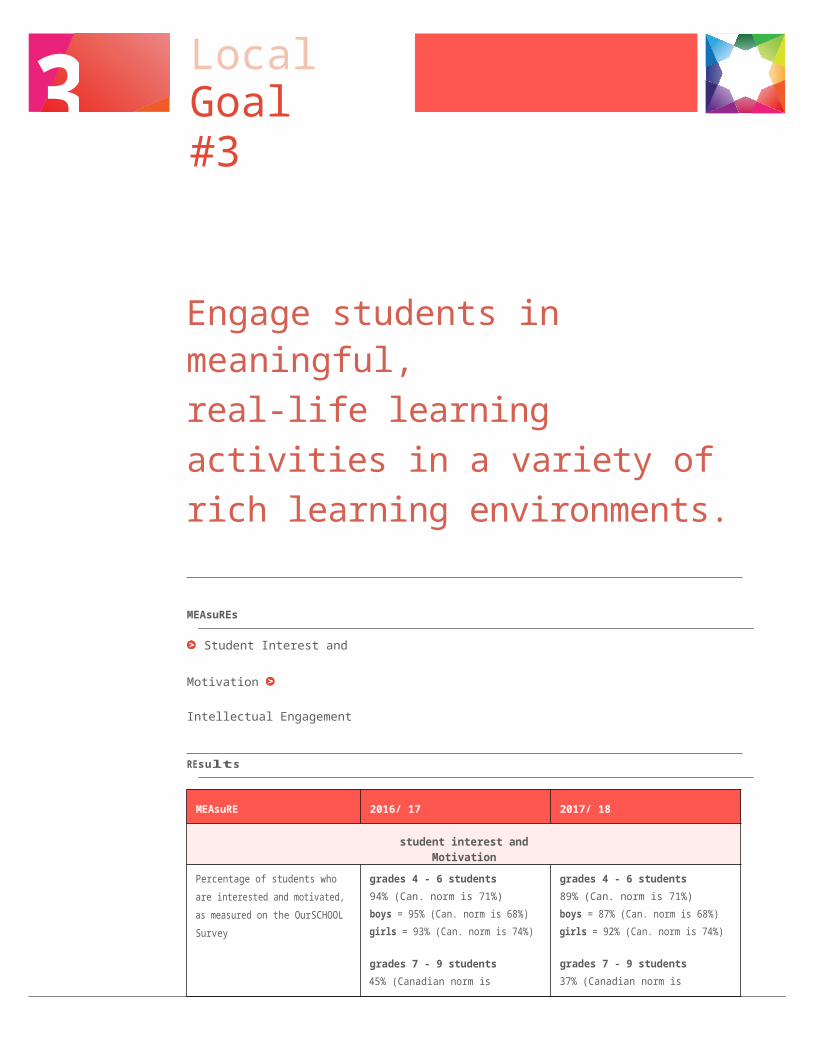
Local Goal #3
Engage students in meaningful,real-life learning activities in a variety of rich learning environments.
MEAsuREs
Student Interest and Motivation
Intellectual Engagement
REsults
MEAsuRE 2016/ 17 2017/ 18
student interest and Motivation
Percentage of students who are interested and motivated, as measured on the OurSCHOOL Survey
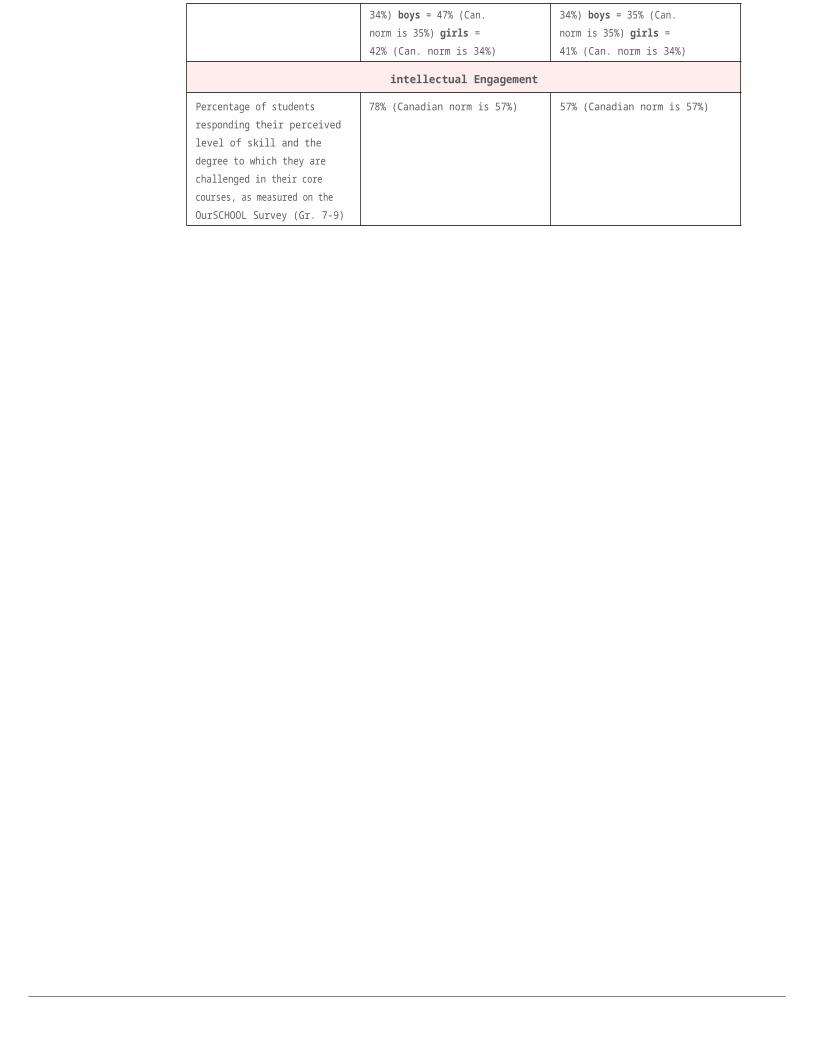
grades 4 - 6 students94% (Can. norm is 71%)boys = 95% (Can. norm is 68%)girls = 93% (Can. norm is 74%)
grades 7 - 9 students45% (Canadian norm is 34%) boys = 47% (Can. norm is 35%) girls = 42% (Can. norm is 34%)
grades 4 - 6 students89% (Can. norm is 71%)boys = 87% (Can. norm is 68%)girls = 92% (Can. norm is 74%)
grades 7 - 9 students37% (Canadian norm is 34%) boys = 35% (Can. norm is 35%) girls = 41% (Can. norm is 34%)
intellectual Engagement
Percentage of students responding their perceived level of skill and the degree to which they are challenged in their core courses, as measured on the OurSCHOOL Survey (Gr. 7-9)
78% (Canadian norm is 57%) 57% (Canadian norm is 57%)
3
c onn E c t c h A R t E R s c ho ol
3 MEAsuREs And REsults
MEAsuREs
Meaningful curriculum implementation
Percentage of teachers who agree that their students are engaged in meaningful, authentic learning activities, as reported on the annual teacher survey
Percentage of teachers who agree that they utilize a variety of teaching strategies to bring the curricula to life, as reported on the annual teacher survey
Percentage of teachers who agree that they promote learning through a disposition of
inquiry that connects learning to real-life experiences beyond the classroom, as reported on the annual teacher survey.
Effective Assessment
Percentage of teachers who agree that they foster excellence and promote success through the use of a variety of assessment strategies designed to provide meaningful, ongoing and timely feedback for “myself, for my students and their parents”
REsults
MEAsuRE 2016/ 17 2017/ 18
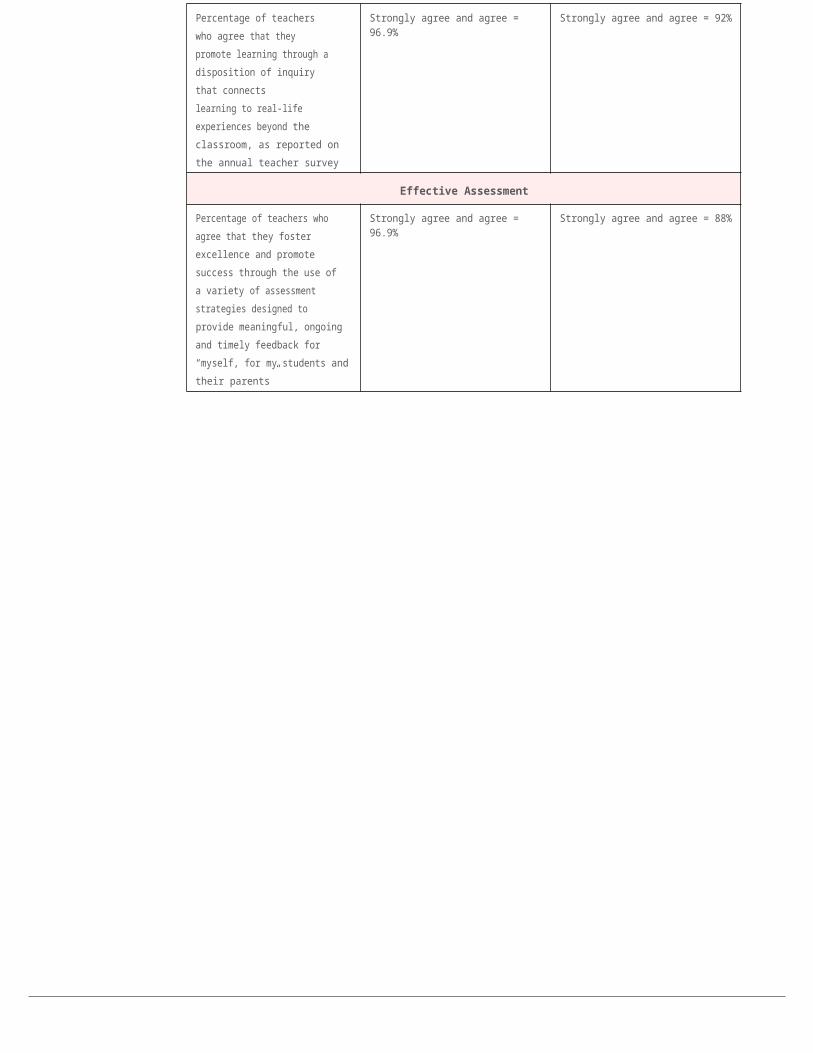
Meaningful curriculum implementation
Percentage of teachers who agree that their students are engaged inmeaningful, authentic learning activities, as reported on the annual teacher survey
Strongly agree and agree = 100% Strongly agree and agree = 100%
Percentage of teachers who agree that they utilize a variety of teaching strategies to bring the curricula to life, as reported on the annual teacher survey
Strongly agree and agree = 100% Strongly agree and agree = 96%
Percentage of teachers who agree that they promote learning through a disposition of inquiry that connectslearning to real-life experiences beyond the classroom, as reported on the annual teacher survey
Strongly agree and agree = 96.9% Strongly agree and agree = 92%
Effective Assessment
Percentage of teachers who agree that they foster excellence and promote success through the use of a variety of assessment strategies designed toprovide meaningful, ongoing and timely feedback for “myself, for my students and their parents”
Strongly agree and agree = 96.9% Strongly agree and agree = 88%
c onn E c t c h A R t E R s c ho ol
Local Goal #4
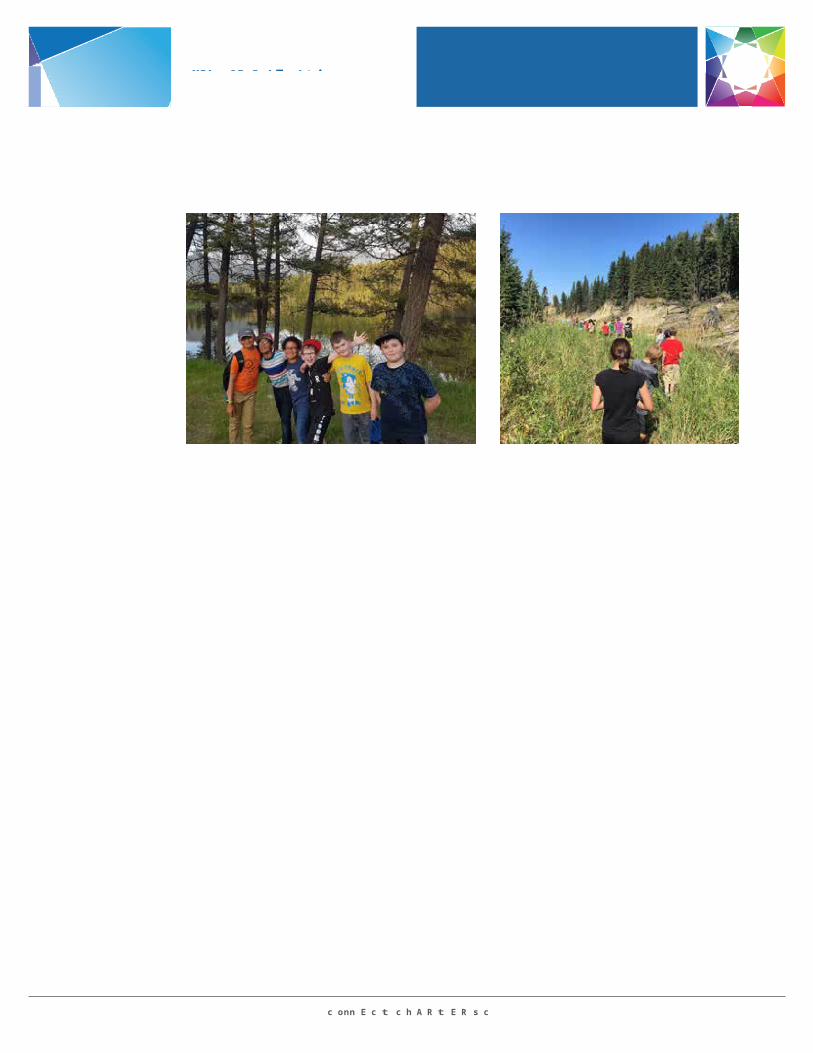
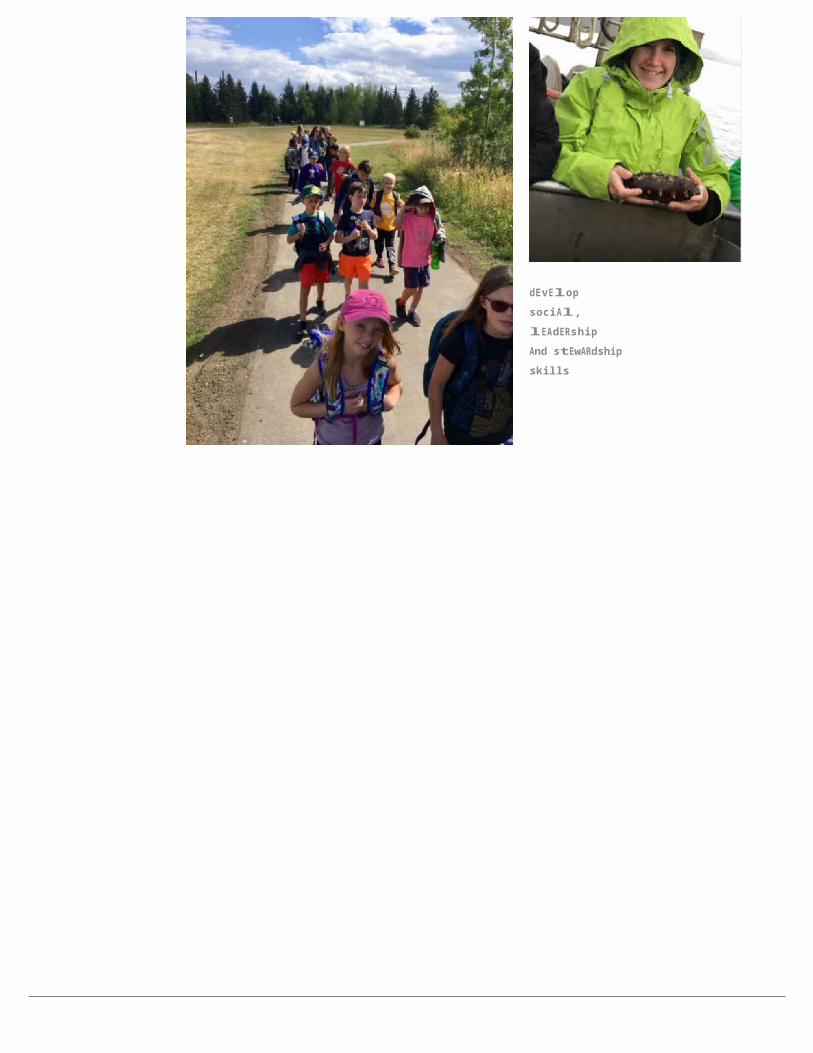
Provide environmental, outdoor, and global education learning opportunities for students to experience and appreciate the world outside of the classroom and to develop social, leadership and stewardship skills.
dEvElop sociAl, lEAdERshipAnd stEwARdship skills
4
c onn E c t c h A R t E R s c ho ol
4 MEAsuREs And REsults
MEAsuREs
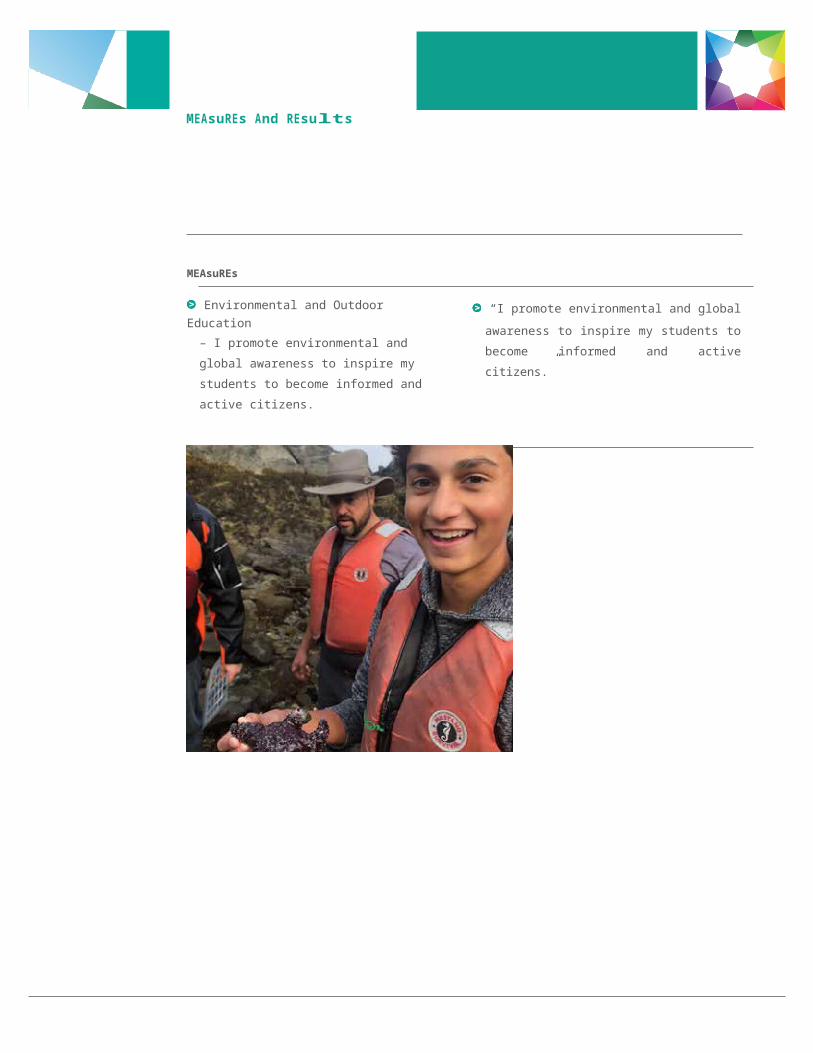
Environmental and Outdoor Education– I promote environmental and global awareness to inspire my students to become informed and active citizens.
“I promote environmental and global awareness to inspire my students to become informed and active citizens.”
thE woRld outsidE thE clAssRooM
c onn E c t c h A R t E R s c ho ol
REsults
c onn E c t c h A R t E R s c ho ol
MEAsuRE 2016/ 17 2017/ 18
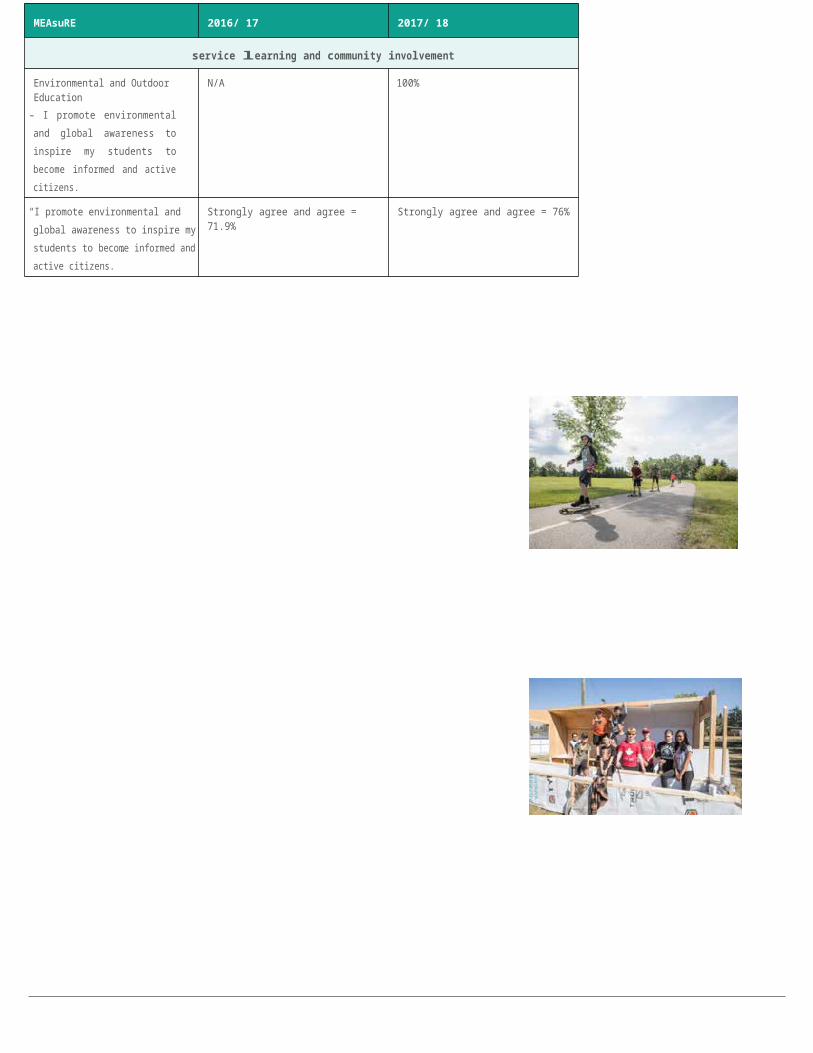
service learning and community involvement
Environmental and Outdoor Education– I promote environmental and global awareness to inspire my students to become informed and active citizens.
N/A 100%
“I promote environmental and global awareness to inspire my students to become informed and active citizens.”
Strongly agree and agree = 71.9% Strongly agree and agree = 76%
c onn E c t c h A R t E R s c ho ol
Local Goal #5
Foster a culture of collaboration and caring relationships of mutualrespect with students, staff members, and parents sharing a passion for learning together and from others,in the classroom, within the school and beyond.
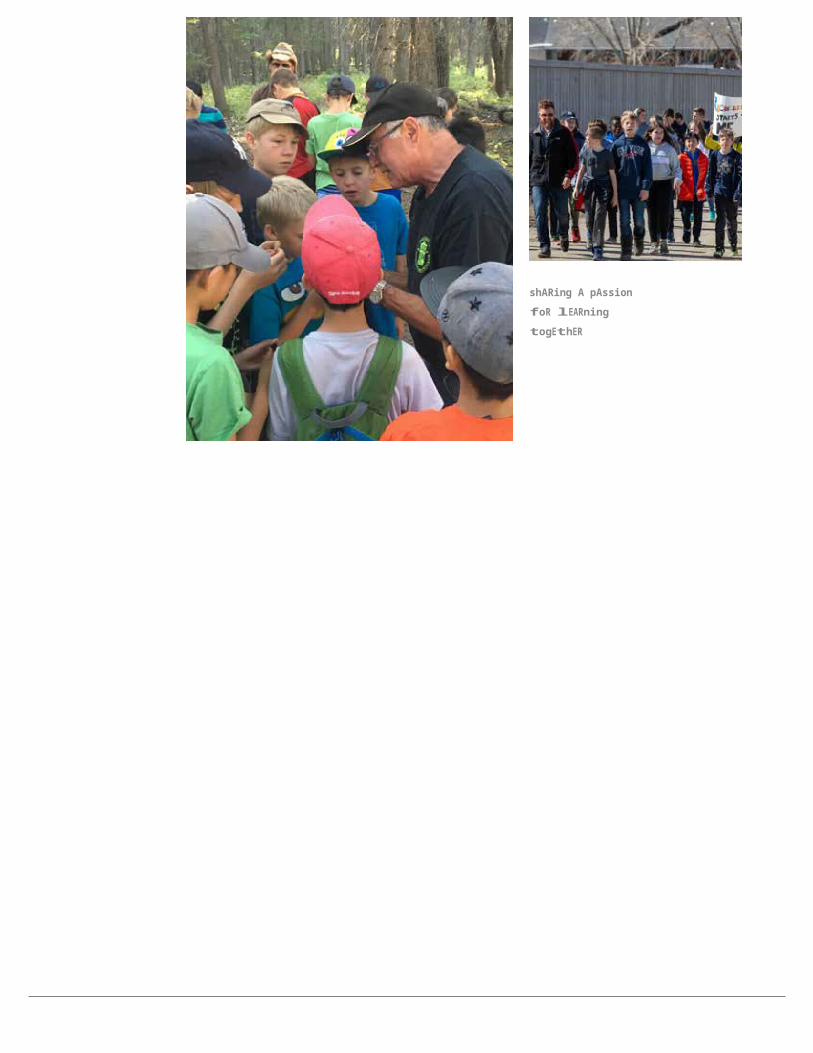
shARing A pAssion foR lEARning togEthER
5
5 MEAsuREs And
c onn E c t c h A R t E R s c ho ol
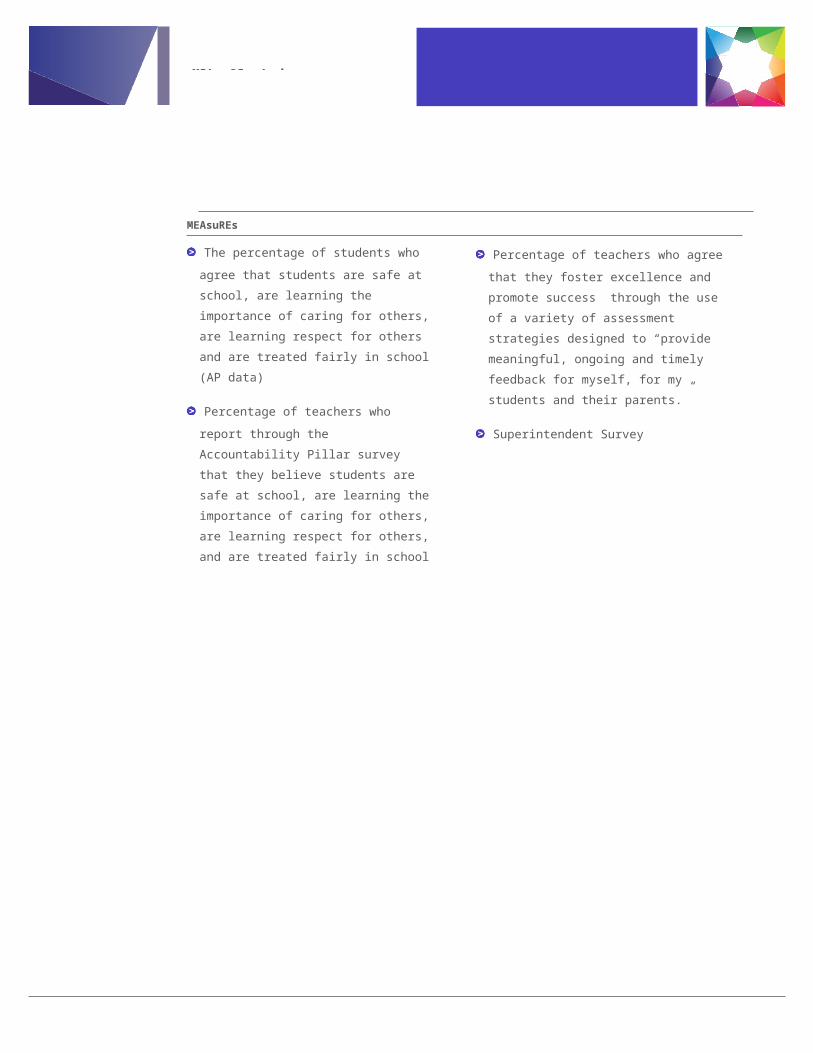
MEAsuREs
The percentage of students who agree that students are safe at school, are learning the importance of caring for others, are learning respect for others and are treated fairly in school (AP data)
Percentage of teachers who report through the Accountability Pillar survey that they believe students are safe at school, are learning the importance of caring for others, are learning respect for others, and are treated fairly in school
Percentage of teachers who agree that they foster excellence and promote success through the use of a variety of assessment strategies designed to “provide meaningful, ongoing and timely feedback for myself, for my students and their parents.”
Superintendent Survey
5 MEAsuREs And REsults
c onn E c t c h A R t E R s c ho ol
REsults
MEAsuRE 2016/ 17 2017/ 18
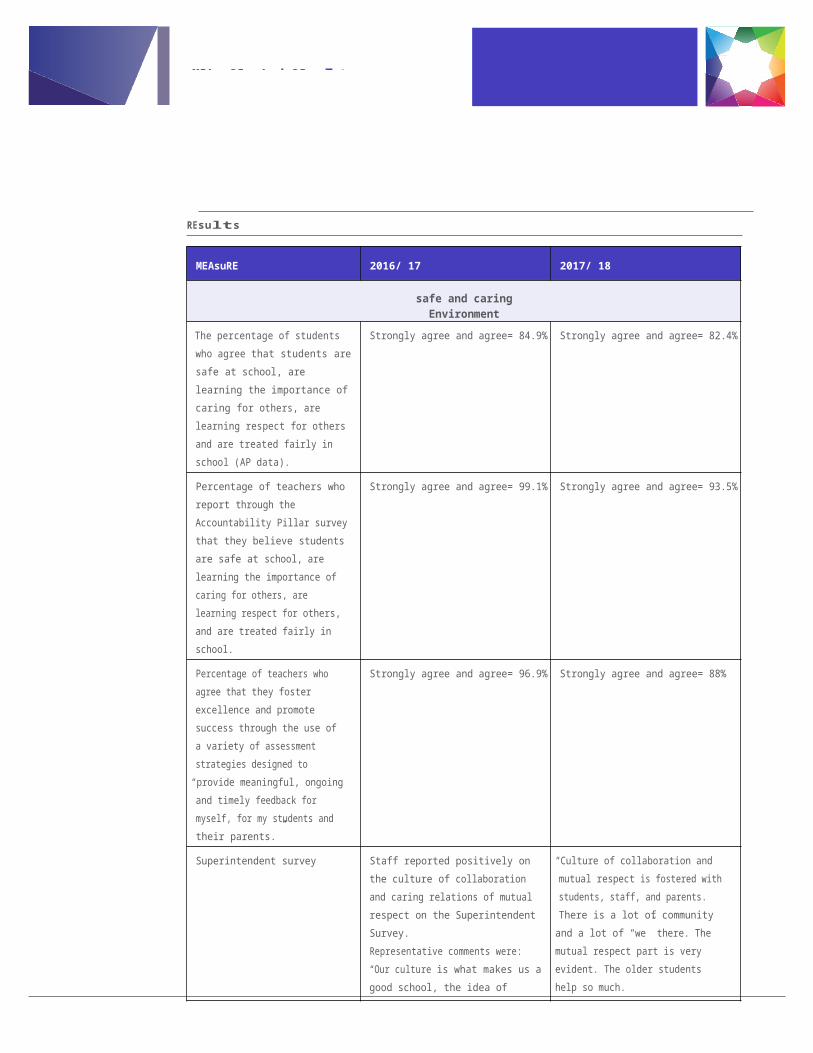
safe and caring Environment
The percentage of students who agree that students are safe at school, are learning the importance of caring for others, are learning respect for others and are treated fairly in school (AP data).
Strongly agree and agree= 84.9% Strongly agree and agree= 82.4%
Percentage of teachers who report through the Accountability Pillar survey that they believe students are safe at school, are learning the importance of caring for others, are learning respect for others, and are treated fairly in school.
Strongly agree and agree= 99.1% Strongly agree and agree= 93.5%
Percentage of teachers who agree that they foster excellence and promote success through the use of a variety of assessment strategies designed to
“provide meaningful, ongoing and timely feedback for myself, for my students and their parents.”
Strongly agree and agree= 96.9% Strongly agree and agree= 88%
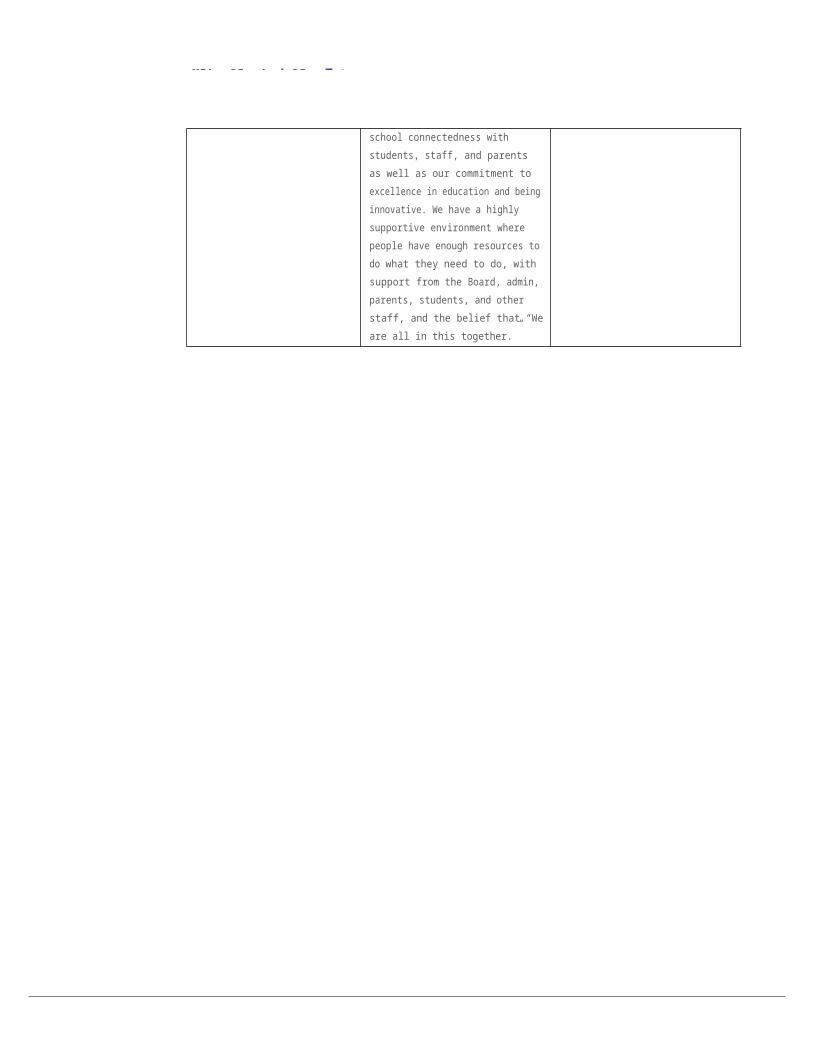
Superintendent survey Staff reported positively on the culture of collaboration and caring relations of mutual respect on the Superintendent Survey.Representative comments were: “Our culture is what makes us a good school, the idea of school connectedness with students, staff, and parents as well as our commitment to excellence in education and being innovative. We have a highly supportive environment where people have enough resources to do what they need to do, with support from the Board, admin, parents, students, and other staff, and the belief that “We are all in this together.”
“Culture of collaboration and mutual respect is fostered with students, staff, and parents.There is a lot of community and a lot of
“we” there. The mutual respect part is very evident. The older students help so much.
c onn E c t c h A R t E R s c ho ol
Local Goal #6
Nurture thriving classrooms and other learning environments where teachers are informed by research and where students and teachers explore and develop deep understanding as active researchers.
6
c onn E c t c h A R t E R s c ho ol
6 MEAsuREs And REsults
MEAsuREs
Innovation and research
Professional learning
REsults
MEAsuRE 2016/ 17 2017/ 18
innovation and Research
“My classroom is a thriving place of active research where my students and I learn together and from each other. My practice informs and is informed by current educational practiceand research”
Strongly agree, agree,or somewhat agree = 78.1%
Strongly agree, agree,or somewhat agree = 92%
“I am an innovator and I take measured risks to push my practice forward and promote an entrepreneurial spirit in my students”
Strongly agree, agree,or somewhat agree = 87.5%
Strongly agree, agree,or somewhat agree = 100%
professional learning
“My professional learning is fostered through the intentional allocationof time and resources, resulting in responsive, progressive, job-embedded and ongoing professional development”
Strongly agree and agree = 81.3% Strongly agree and agree = 72%
Superintendent Survey Staff appreciate the support for professional development and ongoing growth in the school as reported on the Superintendent Surveys. Representative comments include: There is a focus on PD and it is supported through resources. Really appreciate the professional development and how educational assistants are also included and valued. Professional development isso valuable and PD opportunities have a school wide focus.
The annual staff survey noted that face-face interactions are key to collaborative efforts and is a critical component to professional learning.
c onn E c t c h A R t E R s c ho ol
Provincial Outcome
c onn E c t c h A R t E R s c ho ol
pRovinciAl outcoME onEALBERTA’S STuDENTS ARE SuCCESSFuL
PerforManCe Measureresults (in PerCentages) evaluation targets
2013 2014 2015 2016 2017 2018 achievement improvement overall 2019 2020 2021
Overall percentage of students in Grades 6 and 9 who achieved the acceptable standard on Provincial Achievement Tests (overall cohort results).
93.8 95.2 93.0 93.0 93.8 94.7 VERy HIGH MAINTAINED ExCELLENT
Overall percentage of students in Grades 6 and 9 who achieved the standard ofexcellence on Provincial Achievement Tests(overall cohort results).
28.3 32.3 34.1 31.0 35.9 42.7 VERy HIGH IMPROVED ExCELLENT
stRAtEgiEs 1. Explore the ways inquiry-based learning within an outdoor education environment has increased PAT results.
2. Explore the ways inquiry-based learning is best paired with effective technology usage is related to increased PAT results.
3. Explore the ways a focus upon global education has contributed to increased PAT results.
PerforManCe Measureresults (in PerCentages) evaluation targets
2013 2014 2015 2016 2017 2018 achievement improvement overall 2019 2020 2021
Percentage of teacher and parent satisfaction
that students demonstrate the knowledge,
skills and attitudes necessary for lifelong learning.
65.6 63.3 65.6 71.8 66.1 66.7 N/A N/A N/A
stRAtEgiEs 1. Explore the ways Place-based education (PBE) has impacted teacher and parent views of lifelong learning.
2. Continue to reflect on how PBE is being integrated into experiential learning opportunities.
3. Explore how PBE deepens student learning.
PerforManCe Measureresults (in PerCentages) evaluation targets
2013 2014 2015 2016 2017 2018 achievement improvement overall 2019 2020 2021
Percentage of teachers, parents and students who are satisfied that students model the characteristics of active citizenship.
92.3 93.6 91.2 91.3 90.3 83.9 VERy HIGHDECLINED
SIGNIFICANTLyACCEPTABLE
Percentage of teachers and parents who agree that students are taught attitudes and behaviours that will make them successful at work when they finish school.
92.7 90.7 89.5 93.1 90.6 91.1 VERy HIGH MAINTAINED ExCELLENT
stRAtEgiEs (SMART GOAL) 1. In alignment with our vision, fostering the development of extraordinary citizens, we will explore student modeling of active citizenship characteristics.
1
c onn E c t c h A R t E R s c ho ol
pRovinciAl outcoME onE CON’T ALBERTA’S STuDENTS ARE SuCCESSFuL
sPeCifiC Explore how Connect can improve student modeling of active citizenship characteristics through focus groups among staff, parents, and students.
Measure APORI and qualitative methods (e.g. focus groups and consultations)
aCtion/strategy 1.Focus groups with students2.Explore Our School survey data with staff and students3.Explore other strategies for measuring citizenship4.Refine experiential, place-based, and outdoor education (ExPO) activities that foster the development
of extraordinary citizenship.
result (antiCiPated) 1.Identification of gaps in our school community related to active citizenship2.Development of initiatives to improve active citizenship
tiMeline 2018-19 School year +
1
c onn E c t c h A R t E R s c ho ol
pRovinciAl outcoME twoTHE SySTEMIC EDuCATION ACHIEVEMENT GAP BETWEEN FIRST NATIONS, MéTIS AND INuIT STuDENTS AND ALL OTHER STuDENTS IS ELIMINATED
At this point, there is no data available for overall FNMI results, as we do not have any self identified students.
In reference to the Teaching Quality Standard (Alberta Education, 2018) document, “Supporting the application of foundational knowledge about First Nations, Metis, and Inuit”, our school has taken important steps towards fulfilling the following competencies and indicators:
(a) understanding the historical, social, economic, and political implications of:
• treaties and agreements with First Nations;• legislation and agreements negotiated with Métis; and• residential schools and their legacy;
(b) aligning resources and building the capacity of the school community to support First Nations, Métis and Inuit student achievement;
(c) enabling all school staff and students to gain a knowledge and understanding of, and respect for, the histories, cultures, languages, contributions, perspectives, experiences and contemporary contexts of First Nations, Métis and Inuit; and
(d) pursuing opportunities and engaging in practices to facilitate reconciliation within the school community.
kEY AccoMplishMEnts:
Calgary Foundation Grant: Partners in Place (January-June, 2018)
• Artists in residence program• Professional development days (2)
- Professional learning to support technology usage at Tsuut’ina schools- Co-host the North-West chapter of the Association for Experiential Education (May 2018)
• Parent and educator symposia• Connect/Tsuut’ina Powwow at MRU• Partnership with Fort Calgary and Tsuut’ina to create a legacy mural
Research partnership with Mount Royal University (2017-to date)
• Focused upon Place-based education and pre-service teacher preparation
Indigenous guest speakers at our annual Peace Festival (week-long) events related to Indigenous learning (December, 2017)
• Evelyn Goodstriker• Cowboy Smith• Aubrey Hanson• Nicole Rabbit• Nathan Mequinis• Anthony Starlight
2
3pRovinciAl outcoME
c onn E c t c h A R t E R s c ho ol
PerforManCe Measureresults (in PerCentages) evaluation targets
2013 2014 2015 2016 2017 2018 achievement improvement overall 2019 2020 2021
Percentage of teacher, parent and student agreement that: students are safe at school, are learning the importance of caring for others, are learning respect for others and are treated fairly in school.
94.6 93.6 93.3 93.1 93.0 90.6 VERy HIGH DECLINED GOOD
stRAtEgiEs (SMART GOAL) Percentage of teacher, parent and student agreement that: students are safe at school, are learning the importance of caring for others, are learning respect for others and are treated fairly in school.
sPeCifiC Percentage of teacher, parent and student agreement that: students are safe at school, are learning the importance of caring for others, are learning respect for others and are treated fairly in school.
Measure APORI data, Qualitative school data (focus groups and surveys)
aCtion Plan 1.Explore the details of this APORI report as a leadership team.2.Explore feedback from focus groups with key stakeholders (parents, students, teachers).3.Continue to pursue service-learning and citizenship-focused learning opportunities.4.Continue to support successful practices and staff capacity through professional learning.
result (antiCiPated) 1.Improved understanding of this particular change through data analyses2.Crafted action plan(s) that address key gaps identified.
tiMeline 1.Improved understanding of this particular change through data analyses (Sep 2019).2.Crafted action plan(s) that address key gaps identified (Oct-Dec 2019).
4pRovinciAl outcoME
c onn E c t c h A R t E R s c ho ol
ALBERTA HAS ExCELLENT TEACHERS,SCHOOL AND SCHOOL AuTHORITy LEADERS
PerforManCe Measureresults (in PerCentages) evaluation targets
2013 2014 2015 2016 2017 2018 achievement improvement overall 2018 2019 2020
Percentage of teachers, parents and students satisfied with the opportunity for students to receive a broad program of studies including fine arts, career, technology, and health and physical education.
81.9 80.7 79.5 82.4 86.1 80.9 HIGH MAINTAINED GOOD
stRAtEgiEs Continue to refine ways that enhance experiential learning opportunities inside and outside of our school campus. Thus far, we are focusing upon the following existing structures to address this particular provincial outcome:
1. Camps (two per grade)2. EXPO field experiences (10-15 per grade per year)3. Outdoor education electives classes (4)4. Electives (22)5. Guest speakers6. Partners in Place Grant: Phase II7. Band camp (1)8. Fine arts field experiences (4-6 per year)
5pRovinciAl outcoME
c onn E c t c h A R t E R s c ho ol
THE EDuCATION SySTEMIS WELL GOVERNED AND MANAGED
PerforManCe Measureresults (in PerCentages) evaluation targets
2013 2014 2015 2016 2017 2018 achievement improvement overall 2019 2020 2021
Percentage of teachers, parents and students indicating that their school and schools in their jurisdiction have improved or stayed the same the last three years.
90.5 87.0 84.8 83.8 80.8 77.7 HIGHDECLINED
SIGNIFICANTLyISSuE 81 82 83
Percentage of teachers and parents satisfied with parental involvement in decisions about their child’s education.
91.6 91.7 87.2 89.9 91.5 88.6 VERy HIGH MAINTAINED ExCELLENT
Percentage of teachers, parents and students satisfied with the overall quality of basic education.
96.7 96.3 95.2 95.6 94.0 93.3 VERy HIGH DECLINED GOOD
stRAtEgY (SMART GOAL) Percentage of teachers, parents and students indicating that their school and schools in their jurisdiction have improved or stayed the same the last three years.
sPeCifiC Percentage of teachers, parents and students indicating that their school and schools in their jurisdiction have improved or stayed the same the last three years.
Measure APORI data, Qualitative school data (focus groups and surveys)
aCtion Plan 1.Explore the details of our school data as a leadership team2.Consultation with key stakeholders (parents, students, teachers)
result (antiCiPated)
tiMeline1.Improved understanding of this particular change through data analyses (Sep 2019)2.Crafted action plan(s) that address key gaps identified (Oct-Dec 2019)
pAREnt involvEMEnt And coMMunicAtion
c onn E c t c h A R t E R s c ho ol
The Connect School Board is committed to demonstrating accountability through clear communication with stakeholders. Student achievement information is presented to parents and shared in our newsletter The Spectrum. Our school website helps facilitate effective communication with stakeholders. We encourage feedback from our school community about accountability measures, charter outcomes and school plans in a variety of ways:
School Council was provided an opportunity to have input into the planning and framework of our goals. The AERR/Education Plan is posted on our website.
The summary of the Annual Education Results Report is available in both digital and paper formats and located on our website
Throughout the year, school administration shares information and collects feedback from parents. At each school council meeting there are structured opportunities for feedback on specific issues and school results as well as a section for open dialogue on any issues parents wish to raise.
During the annual Superintendent Surveys, parents are asked for their feedback on the school.
The 2017-18 school year was characterized by some significant changes based upon two new initiatives: (a) the Experiential Place-based Outdoor Education (EXPO) program and (b) Partners in Place (Tsuut’ina Education partnership). In the spirit of innovation and research, we understood that these changes were ambitious and were prepared to be nimble enough to make any in-process adjustments necessary. As innovation and improvement can be taxing for any staff, we had put in place some structures to mitigate some anticipated challenges. These structures involved, frequent check-ins with staff, students, and parents. These check-ins included:
1. Parent meetings2. Staff meetings3. Staff focus groups4. Staff survey (June and October 2018)5. AP survey data review6. Extended leadership team data review task force7. Superintendent survey8. PAT data
pAREnt involvEMEnt And coMMunicAtion
Connect Charter School in committed to effectively communicating with its internal and external
c onn E c t c h A R t E R s c ho ol
coMMunicAtion plAn oBjEctivEs:
Share information about Connect Charter School openly and easily and make it available to the public Share our success stories on innovative and effective practices with our stakeholders Communicate our mission and vision with a clear and consistent voice
coMMunicAtion plAn AudiEncEs:
School Staff Connect Charter School Board of Directors Current Parents Current Students Alberta Education Political Leaders Post-secondary educational institutions External partners
coMMunicAtion plAn kEY MEssAgEs And Action plAn:
Update communication at http://connectcharter.ca
Publish as weekly parent update that is emailed to all parents and guardians
Publish as monthly newsletter
Monthly presentations are made at the Board meetings from our students and teachers related to school developments and professional development
Publish our school handbook, three-year education plan, annual education results report and policy manual on our website http://connectcharter.ca
Organize parent information evenings at the school
Organize prospective parent tours and information evenings
Actively participate in The Alberta Association of Public Charter Schools
Demonstrate how we have shared our successful innovative practices with Albertans and other school districts at provincial and national conferences
Empower students to be ambassadors for the school
pAREnt involvEMEnt And coMMunicAtion
Connect Charter School in committed to effectively communicating with its internal and external
c onn E c t c h A R t E R s c ho ol
coMMunicAtion plAn tiMElinEs And coMMunicAtion:
this report is posted at:http://connectcharter.ca/downloadfiles/plans_reports/2018-19_AERR_Plan.pdf with our Three Year Education Plan.
the Annual class size Report is posted at:http://connectcharter.ca/downloadfiles/plans_reports/2018-19_AERR_Plan.pdf
timelines and communicationThis report is posted at http://connectcharter.ca/publications/plans_and_reports.asp.
futuRE
c onn E c t c h A R t E R s c ho ol
The 2017-18 school year was characterized by some significant changes based upon two new initiatives: (a) the Experiential Place-based Outdoor Education (EXPO) program and (b) Partners in Place (Tsuut’ina Education partnership). In the spirit of innovation and research, we understood that these changes were ambitious and were prepared to be nimble enough to make any in-process adjustments necessary. As innovation and improvement can be taxing for any staff, we had put in place some structures to mitigate some anticipated challenges. These structures involved, frequent check-ins with staff, students, and parents. These check-ins included:
1. Parent meetings
2. Staff meetings
3. Staff focus groups
4. Staff survey (June and October 2018)
5. AP survey data review
6. Extended leadership team data review task force
7. Superintendent survey
8. PAT data
These data sources provided rich insights into our successes and challenges. In particular, the data obtained from the 2017-18 Accountability Survey Data indicated one “issue”, Continuous Improvement. There were some other declines in Safe and Caring Schools, Citizenship, and Quality of Education.Our Extended leadership team reviewed this data in detail and are currently in the process of better understanding this particular feedback. Thus far, we have implemented the following processes to more deeply understand these declines:
dAtE tAsk outcoME19-Oct-2018 Extended Leadership Team Retreat Focus upon collaboration and relationships
through an inquiry lens
26-Oct-2018 PD day workshop on AP data In process
07-Dec-2018 PD day workshop on AP data
Jan 2018 Develop an action plan Improvement in respect among students (Oct 2019)
Prior to receiving the AP data, the feedback from staff between January and June 2018 led towards some programming changes for the 2018-19 school year. These changes included: (a) Improved communication (staff grade reps) for our PE and PVA teams, (b) shared curricular planning time, (c) physical education field trip substitute teachers, and (d) more collaborative face-to-face interactions. In fact, our August staff retreat generated two themes for the 2018-19 school year: A strong commitment to (a) collaboration and (b) positive relationships through an inquiry lens for both staff and students. A recent staff survey and focus group (October 26th, 2018) indicated a significant positive change in our staff and considerable optimism regarding our students.
c onn E c t c h A R t E R s c ho ol
Similar to our efforts in better understanding our AP data, we have been placing energy into better understanding our improved PAT results in both grade 6 and 9 tests in all disciplines. Our staff was pleased with these results and eager to assess their own practices in regards to inquiry, as it translated to higher achievement. A group of teachers will access the drill-down analyses of the PATs in their respective disciplines as a starting point.
We are pleased with our progress thus far and can speak, in detail, about our AP data in addition to our experiences within the 2018-19 school year.
c onn E c t c h A R t E R s c ho ol
Financial Results
suMMARY of finAnciAl REsults 2017-
4%6%
8%
5%4%7%
66%
c onn E c t c h A R t E R s c ho ol
The figures below represent a summary of revenues for the 2017-2018 school year. Government grants account for approximately 82% of total revenues, with school fees and various other fees comprising the other 18%.The surplus of $2,365 was on budget. More information can be found in our audited financial statements, available on our website at http://www.connectcharter.ca/publications/plans/ or by contacting our Secretary Treasurer at 403 282-2890 ext.121.
Alberta Education - Instruction
Alberta Education - PO&M
Alberta Education - Transportation
Alberta Education - Board & System Admin
School fee revenue - Enrichment & Outdoor Ed.
School fee revenue - Transportation
Other revenue
REvEnuE vAluE % of totAl
Alberta Education- Instruction 4,548,211 66.0%
Alberta Education -PO&M 473,488 7.0%
Alberta Education - Transportation 248,148 4.0%
Alberta Education - Board & System Admin 344,376 5.0%
School fee revenue - Enrichment & Outdoor Education 556,937 8.0%
School fee revenue - Transportation 309,741 4.0%
Other Revenue 406,192 6.0%
Total Revenue 6,887,093 100.0%
2017-18 REvEnuEs
suMMARY of finAnciAl REsults 2017-
c onn E c t c h A R t E R s c ho ol
ExpEnsEs vAluE % of totAl
Certificated salaries and benefits Inst 3,927,176 58.0%
uncertificated salaries and benefits Inst 845,919 12.0%
Facilities PO & M 169,493 2.0%
Services, Contracts, Supplies - Inst 1,105,368 16.0%
Transportation (not including salaries / benefits) 553,969 8.0%
Amortization (All)’ 204,689 3.0%
Board and system administration 78,114 1.0%
Total expenses 6,884,728 100.0%
Net Revenue (Deficit) 2,365
*Certificated refers to positions which require a teaching certificate
2017 - 18 ExpEnsEs
16%
2%12%
3% 1%
8%
58%
Certificated salaries and benefits
uncertificated salaries and benefits
Facilities PO & M
Services, Contracts, Supplies - Inst
Transportation (not including salaries / benefits)
Amortization (All)
Board and system administration
BudgEt suMMARY 2018-
c onn E c t c h A R t E R s c ho ol
4%5%
8%3%
3%
7%
70%
The development of the budget is a collaborative process including teachers, administration, senior administration and the Board of Directors. The projected budget will be strived for and monitored throughout the year. For more information on School Generated Funds, please see our Audited Financial Statements or contact our Secretary Treasurer at (403)-282-2890.
REvEnuE vAluE % of totAl
Alberta Education - Instruction 4,794,320 70.0%
Alberta Education - PO&M 482,502 7.0%
Alberta Education - Transportation 237,000 3.0%
Alberta Education - Board & System Admin 205,000 3.0%
School fee revenue - Enrichment & Outdoor Ed. 549,049 8.0%
School fee revenue - Transportation 285,125 4.0%
Other revenue 343,100 5.0%
Total Revenue 6,896,096 100.0%
2018-19 REvEnuEs
Alberta Education - Instruction
Alberta Education - PO&M
Alberta Education - Transportation
Alberta Education - Board & System Admin
School fee revenue - Enrichment & Outdoor Ed.
School fee revenue - Transportation
Other revenue
BudgEt suMMARY foR 2018-
7%3%
16%
3% 58%
12%
c onn E c t c h A R t E R s c ho ol
ExpEnsEs vAluE % of totAl
Certificated salaries and benefits * - Inst 4,001,949 58.0%
uncertificated salaries and benefits - Inst 831,758 12.0%
Facilities - PO&M 177,701 3.0%
Services, Contracts, Supplies - Inst 1,091,128 16.0%
Transportation (not including salaries & benefits) 510,100 7.0%
Amortization (All) 219,700 3.0%
Board and system administration 82,700 1.0%
Total Expenses 6,915,036 100.0%
Net Revenue (Deficit) -18,940
*Certificated refers to positions which require a teaching certificate
2018 - 19 ExpEnsEs
1%Certificated salaries and benefits * -
Inst uncertificated salaries and benefits
- Inst Facilities - PO&M
Services, Contracts, Supplies - Inst
Transportation (not including salaries &
benefits) Amortization (All)
Board and system administration
BudgEt suMMARY foR 2018-
c onn E c t c h A R t E R s c ho ol
our budget summary for 2018/2019 is available at:http://connectcharter.ca/downloadfiles/plans_reports/2019_Budget.pdf
our Audited financial statements are available at:https://open.alberta.ca/dataset/f4106e5e-77eb-4a85-997a-bb794e5be390/resource/ab624fe0-85ba- 40ed-aba3-9d0e0d590f59/download/connect-charter-school-society.pdf
the provincial rollup of connect charter school’s Audited financial statements can be seen at:https://www.alberta.ca/k-12-education-financial-statements.aspx?utm_source=redirector
our summary of facility and capital plans projects can be seen at:http://connectcharter.ca/downloadfiles/plans_reports/2018-19_Capital_Plan.pdf
our whistleblower protection policy can be seen at:http://connectcharter.ca/downloadfiles/policy_manual/4.09-Disclosure-Policy.pdfConnect Charter School did not receive any requests for disclosures pursuant to Section 32 of the Public Interest Disclosure Act (2013) during the 2017-2018 school year.
c onn E c t c h A R t E R s c ho ol
clAss sizE infoRMAtion sYstEMJurisdiction Summary All Subjects
Jurisdiction Connect Charter School Society (A.0045) Number of Schools Reported:
1Total Number of Schools 1Total Number of FTE Teacher Assistants 5Number of FTE Teacher Assistants assigned to students with special needs:
k to 3 4 to 6 7 to 9 10 to 12
2016/17 2017/18 2018/19 2016/17 2017/18 2018/19 2016/17 2017/18 2018/19 2016/17 2017/18 2018/19
Average class size 23.4 23.5 22.8 22.4 22.6 22.7
Number of Students with Severe Disabilities per class
0.3 0.2 0.4 0.5 0.1 0.3
Number of Mild/Moderate Students per class
2.3 1.9 2.5 1.6 2.1 2.6
Number of Gifted/Talented Students per class
1.3 1.1 1 1 1 1.1
Number of ESL Students per class
2.1 2.1 2.1 1.7 0.9 0.6
Smallest Class 18 18 18 18 18 18
Largest Class 26 26 26 26 26 26
distribution of class sizes- %16 to 20 32.1 31.3 40 40 40 40
21 to 25 40 20 1526 to 30 67.9 68.8 60 20 40 45
distribution of class sizes- #16 to 20 9 35 48 12 48 48
21 to 25 12 24 1826 to 30 19 77 72 6 48 54
Average by subject categoryLanguage Arts English/French 26 26 26 25.3 25.7 25.8
Mathematics 26 26 26 25.3 25.7 25.8
Science 26 26 26 25.3 25.7 25.8
Social Studies 26 26 26 25.3 25.7 25.8
Health 26 26 26 25.3 25.7 25.8
Physical Education 26 26 26 25.3 25.7 25.8
Art 18 18 26 18 18 18
Music 20.7 20.7 18 18 18 18
Drama 18 18 18 18 18 18
Local Developed Course 18 18.7 18 18 18 18
notE: 3/4 combined classes are included in the Gr. 4 to 6 avg
6/7 combined classes are included in the Gr 7 too 9 average
9/10 combined classes are included in the Gr. 10 to 12
avg Special Education classes are included
Team taught classes are reflected as an instructional PTR size (ie. A class of 50 with two teachers would be reported as two classes of 25).
Colony/Hutterite schools have been excluded
Outreach/alternative schools have been excluded
Core Classes: Math, Language Arts, Sciences, Social Studies, Special Education
2019-02-28 11:17
This information has not been verified by Alberta Education and is subject to change
AppEndix