ICAP – Supporting Russia and the Ruble ACI Russia General Assembly Moscow.

LEXUS LS500
Toyota Motor CorporationNovember 7, 2017
FY2018 Second QuarterFinancial Results
LEXUS LS500h

2
Cautionary Statement with Respect to Forward-Looking StatementsThis presentation contains forward-looking statements that reflect Toyota’s plans and expectations. These forward-looking statements are not guarantees of future performance and involve known and unknown risks, uncertainties and other factors that may cause Toyota’s actual results, performance, achievements or financial position to be materially different from any future results, performance, achievements or financial position expressed or implied by these forward-looking statements. These factors include, but are not limited to: (i) changes in economic conditions, market demand, and the competitive environment affecting the automotive markets in Japan, North America, Europe, Asia and other markets inwhich Toyota operates; (ii) fluctuations in currency exchange rates, particularly with respect to the value of the Japanese yen, the U.S. dollar, the euro, the Australian dollar, the Russian ruble, the Canadian dollar and the British pound, and interest rates fluctuations; (iii) changes in funding environment in financial markets and increased competition in the financial services industry; (iv) Toyota’s ability to market and distribute effectively; (v) Toyota’s ability to realize production efficiencies and to implement capital expenditures at the levels and times planned by management; (vi) changes in the laws, regulations and government policies in the markets in which Toyota operates that affect Toyota’s automotive operations, particularly laws, regulations and government policies relating to vehicle safety including remedial measures such as recalls, trade, environmental protection, vehicle emissions and vehicle fuel economy, as well as changes in laws, regulations and government policies that affect Toyota’s other operations, including the outcome of current and future litigation and other legal proceedings, government proceedings and investigations; (vii) political and economic instability in the markets in which Toyota operates; (viii) Toyota’s ability to timely develop and achieve market acceptance of new products that meet customer demand; (ix) any damage to Toyota’s brand image; (x) Toyota’s reliance on various suppliers for the provision of supplies; (xi) increases in prices of raw materials; (xii) Toyota’s reliance on various digital and information technologies; (xiii) fuel shortages or interruptions in electricity, transportation systems, labor strikes, work stoppages or other interruptions to, or difficulties in, the employment of labor in the major markets where Toyota purchases materials, components and supplies for the production of its products or where its products are produced, distributed orsold; and (xiv) the impact of natural calamities including the negative effect on Toyota’s vehicle production and sales.A discussion of these and other factors which may affect Toyota’s actual results, performance, achievements or financial position is contained in Toyota’s annual report on Form 20-F, which is on file with the United States Securities and Exchange Commission.

3
Caution concerning Insider TradingUnder Japanese securities laws and regulations (the "Regulations"), subject to certain exceptions, any person who receives certain material information relating to the business, etc. of Toyota which may be contained in this document is prohibited from trading in Toyota's shares or certain other transactions related to such shares (as set forth in the Regulations) until such material information is deemed to be made public. Under the Regulations, material information is deemed to be made public when (i) such material information is notified to a stock exchange and is disclosed by ways of electromagnetic means as prescribed by the ordinance of the Cabinet Office (posting on the TDnet (Timely Disclosure Network) information service ) or (ii) twelve (12) hours have elapsed since a listed company, such as Toyota, disclosed such material information to at least two (2) media sources as prescribed by the Regulations.

4
FY2018 Second QuarterFinancial Results
FY2018 Second Quarter Financial Performance(FY2018 First Half)
FY2018 Financial Forecasts
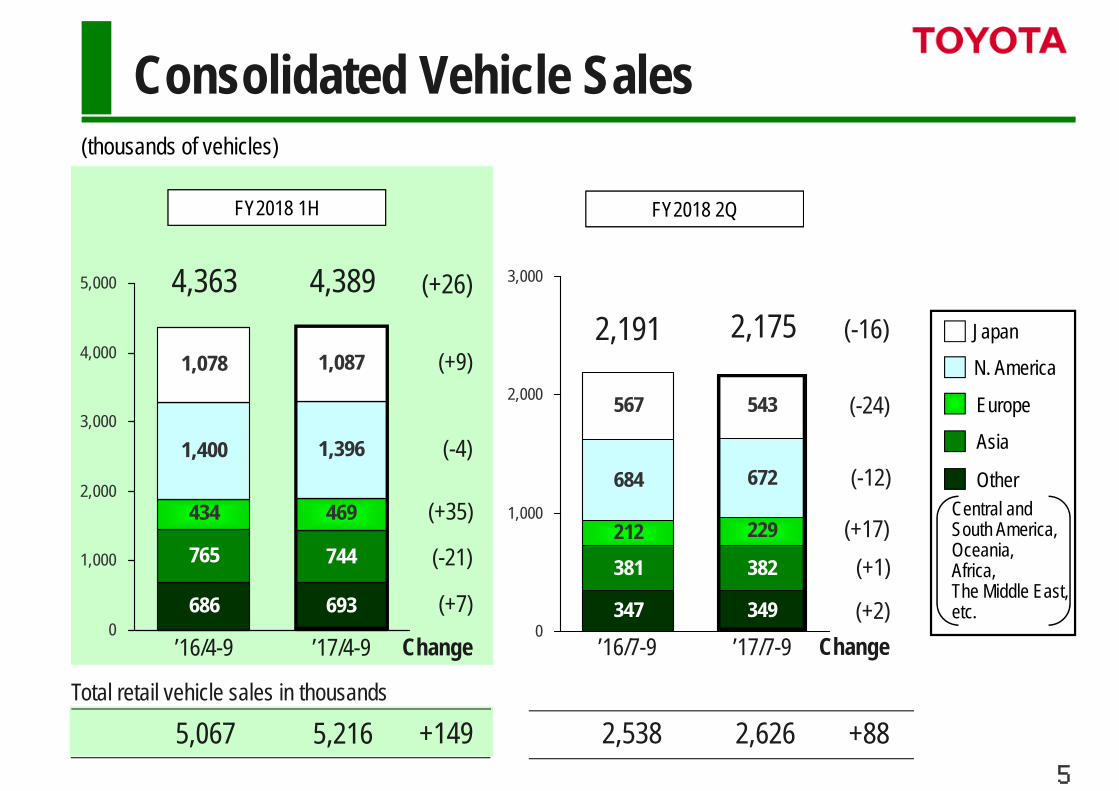
347 349
381 382212 229
684
567 543
672
0
1,000
2,000
3,000
686 693
765 744
434 469
1,400 1,396
1,078 1,087
0
1,000
2,000
3,000
4,000
5,000
2,1754,363 4,389
2,191
’16/4-9 Change’17/4-9 ’16/7-9 Change’17/7-9
Japan
Asia
Europe
N. America
Other
(+26)
(+9)
(-4)
(+35)
(-21)
(+7)
(-16)
(-24)
(-12)
(+17)(+1)
(+2)
5,067 5,216 +149 2,538 2,626 +885
Consolidated Vehicle Sales(thousands of vehicles)
FY2018 1H FY2018 2Q
Total retail vehicle sales in thousands
Central and South America,Oceania,Africa,The Middle East, etc.

-+48.08 yen307.84 yen355.92 yen+6 yen105 yen111 yen+8 yen118 yen126 yen
-+13.2%
+6.4%
-
+8.6%
-7.2%7.5%+125.1946.11,071.3
-8.5%7.7%
+75.61,176.51,252.1
-20.31,116.81,096.5+1,120.613,070.514,191.2
-1.8%
--
FY2018 1H(’17/4-9) Change
Consolidated Financial Summary (FY2018 First Half)(billions of yen)
Net RevenuesOperating IncomeOperating marginIncome before income taxes and equity in earnings of affiliated companies
Net Income*Net margin*
Net income per share*(diluted)FOREX Rates
US$€
*1 Net Income attributable to Toyota Motor Corporation*2 Net Income attributable to common shareholders
FY2017 1H(’16/4-9)
1
1
2
6

+100.0
+100.0
-160.0
-10.3-50.0
’16/4-9
1,096.5
’17/4-9
1,116.8
7
*1. Details ※Transactional (Imports & Exports) +180.0 Volume, Model Mix -65.0 Labor Costs -25.0 US$ +120.0 Financial Services ±0 Depreciation -20.0 € +25.0 Other -105.0 Other -95.0 R&D Expenses -10.0 Other +35.0 Expenses, etc. +5.0
※From FY2017 financial results, "Effects of FOREX Rates" includes translational FOREX impact concerning operating income of overseas subsidiaries and fiscal year-end balance of provisions in foreign currencies, etc.
*4. Details*3. Details
+25.0
*2. DetailsTranslational FOREX impactconcerning overseassubsidiaries
Valuation Gains/Lossesfrom Swaps, etc. -10.3
Analysis of Consolidated Operating Income (FY2018 First Half)(billions of yen) -110.0
Excluding the overall impact of foreign exchange rates and swap valuation gains/losses, etc.
Operating Income (-20.3)
Effects of FOREX Rates *1
Cost Reduction Efforts Effects of
Marketing Activities *2
Increase in Expenses, etc. *3
Other *4
(Translational FOREX impact of fiscal year-end balance of provisions in foreign currencies, etc.)

8.3%
485.7641.7
1,0871,078
’16/4-9 ’17/4-9
7.0% 8.5%
●
(+9)
195.6321.8
543567
’16/7-9 ’17/7-9
5.4%
(-24)
+156.0 +126.2
484.7 640.5 194.3 321.3
FY2017 1H Operating Income*641.7 billion yen(+156.0 billion yen year on year)
Increased mainly as a result of favourable foreign exchange rates and cost reduction efforts.
VOXY
NOAH
ESQUIRE 8
Geographic Operating Income:JapanOperating Income (billions of yen) *Consolidated Vehicle Sales (thousands of vehicles)
* Excluding Valuation Gains/Losses from Interest Rate Swaps, etc.
FY2018 1H FY2018 2Q
OperatingIncome Margin
Operating Income including Valuation Gains/Lossesfrom Interest Rate Swaps, etc. (billions of yen)

2.0%
296.8
141.1
1,3961,400
6.1% 2.7%
●
(-4)
131.4
52.3
684 672
5.6%
(-12)
-155.6 -79.0
311.2 144.6 139.8 55.3
’16/4-9 ’17/4-9 ’16/7-9 ’17/7-9
FY2017 1H Operating Income*141.1 billion yen(-155.6 billion yen year on year)
Declined largely due to increased marketing expenses and decreased vehicle production.
9
CAMRY
Geographic Operating Income:North AmericaOperating Income (billions of yen) *Consolidated Vehicle Sales (thousands of vehicles)
* Excluding Valuation Gains/Losses from Interest Rate Swaps, etc.
FY2018 1H FY2018 2Q
OperatingIncome Margin
Operating Income including Valuation Gains/Lossesfrom Interest Rate Swaps, etc. (billions of yen)
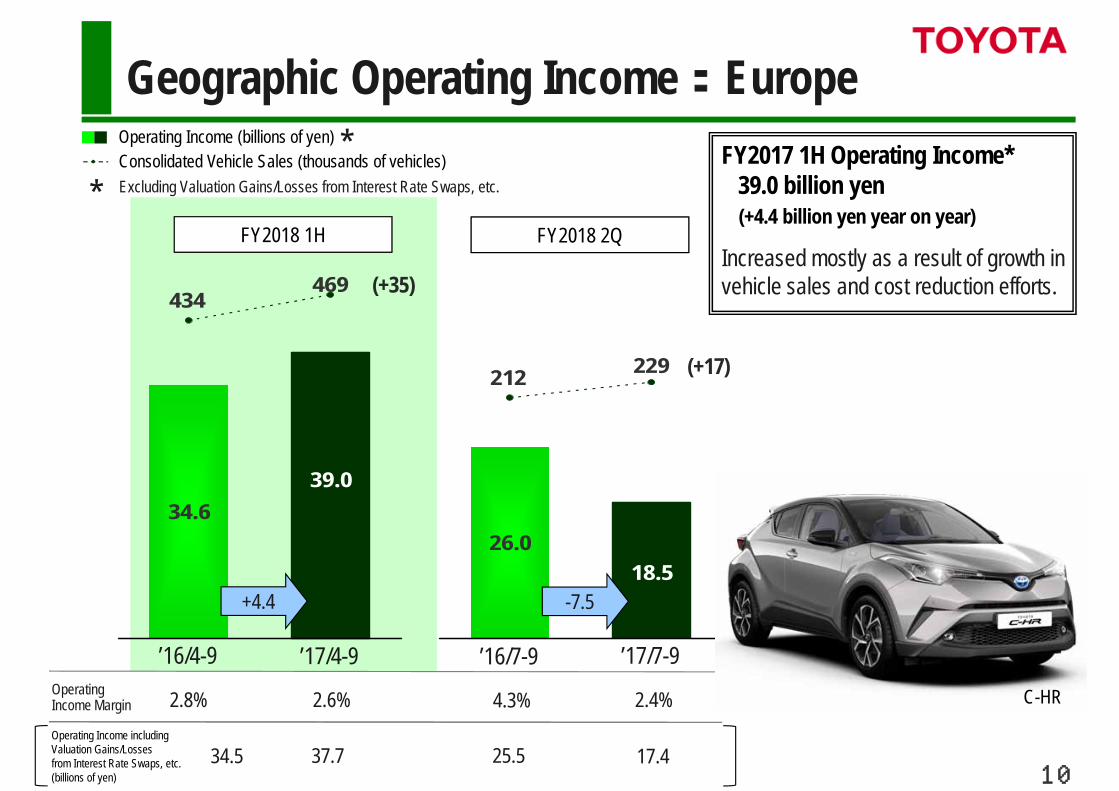
34.639.0
469434
2.8% 2.6%
●
(+35)
26.018.5
229212
4.3% 2.4%
(+17)
+4.4 -7.5
34.5 37.7 25.5 17.4
’16/4-9 ’17/4-9 ’16/7-9 ’17/7-9C-HR
10
Geographic Operating Income:EuropeOperating Income (billions of yen) *Consolidated Vehicle Sales (thousands of vehicles)
* Excluding Valuation Gains/Losses from Interest Rate Swaps, etc.
FY2018 1H FY2018 2Q
OperatingIncome Margin
Operating Income including Valuation Gains/Lossesfrom Interest Rate Swaps, etc. (billions of yen)
FY2017 1H Operating Income*39.0 billion yen(+4.4 billion yen year on year)
Increased mostly as a result of growth in vehicle sales and cost reduction efforts.

8.6%
219.6 212.9
744765
9.5% 8.6%
●
(-21)
95.0 110.1
382381
8.5%
(+1)
-6.7 +15.0
222.7 214.2 95.3 109.8
’16/4-9 ’17/4-9 ’16/7-9 ’17/7-9YARIS
11
Geographic Operating Income:AsiaOperating Income (billions of yen) *Consolidated Vehicle Sales (thousands of vehicles)
* Excluding Valuation Gains/Losses from Interest Rate Swaps, etc.
FY2018 1H FY2018 2Q
OperatingIncome Margin
Operating Income including Valuation Gains/Lossesfrom Interest Rate Swaps, etc. (billions of yen)
FY2017 1H Operating Income*212.9 billion yen(-6.7 billion yen year on year)
Decreased mainly due to effects of foreign exchange rates.

55.271.8
693686
5.3% 5.8%
●
(+7)
27.0 32.3
349347
5.1% 5.2%
(+2)
+16.6 +5.2
52.8 70.3 25.5 31.612
ETIOS’16/4-9 ’17/4-9 ’16/7-9 ’17/7-9
Geographic Operating Income : Central & South America, Oceania, Africa and The Middle East
Operating Income (billions of yen) *Consolidated Vehicle Sales (thousands of vehicles)
* Excluding Valuation Gains/Losses from Interest Rate Swaps, etc.
FY2018 1H FY2018 2Q
OperatingIncome MarginOperating Income including Valuation Gains/Lossesfrom Interest Rate Swaps, etc. (billions of yen)
FY2017 1H Operating Income*71.8 billion yen(+16.6 billion yen year on year)
Increased largely as a result of favourable foreign exchange rates and marketing efforts.

+7.4
-4.8
-7.4
-13.314.0
138.1 144.0 +5.8
0.6
152.1 144.7
138.1
Increased mainly due to growth in the lending balance.
5.3
56.5 68.8 +12.3
0.5
61.9 69.4
+5.8 +12.3
144.0
68.856.5
13
’16/4-9 ’17/4-9 ’16/7-9 ’17/7-9
Financial Services Operating IncomeOperating Income (billions of yen)*Excluding Valuation Gains/Losses from Interest Rate Swaps, etc.
* FY2018 1H FY2018 2Q
Operating IncomeValuation Gains/Lossesfrom Interest Rate Swaps, etc.
Operating Income ExcludingValuation Gains/Losses fromInterest Rate Swaps, etc.
Change Change

14
100125
1007565
100 100
110 110
0
50
100
150
200
250
0
500
1,000
1,500
2,000
2,500
’17/3’15/3’14/3Dividends on Common
Shares (billions of yen) 522.9 631.3 645.5 627.5 293.4 *3
Payout Ratio *2 28.7% 29.0% 28.3% 34.6% 27.8% *3
’16/3 ’18/3
Dividends on Model AA Class Shares (billions of yen) - - 2.4 4.9 3.7 *3
Total Amount of Dividends 522,9 631.3 647.9 632.4 297.1 *3
Shareholder Return*Interim Dividend : 100 yen per common share(Total Amount of Payment:293.4 billion yen, Payout Ratio*:27.8%)
Dividend per Share(yen)
Dividend per Share and Net IncomeNet Income (Right axis)Interim Dividend Year-end Dividend
Net Income(billions of yen)
*1 Dividends on common shares.*2 Payout Ratio = (dividend per common share)÷(net income attributable to Toyota Motor Corporation per common share)*3 Figures are for the interim period.
1
2
2,500
1,500
1,000
500
0
2,000
Ref.)

1515
0
1,000
2,000
3,000
4,000
5,000
6,000
7,000
8,000
9,000
10,000
39 M shares/293.3 B yen
87 M shares/499.9 B yen
23 M shares/139.3 B yen
45 M shares/250.0 B yen
(max)
27 M shares/180.0 B yen
47 M shars/349.9 B yen
27 M shares/180.0 B yen
ShareRepurchase*
27 million shares/180.0 billion yen
39 million shares/293.3 billion yen
110 million shares/639.3 billion yen
69 million shares/449.9 billion yen
45 million shares/250.0 billion yen (max)
Together with the 297.1 billion yen in total amount of dividends, total shareholder return for the interim period will be up to 547.1 billion yen, and total return ratio will be up to 51.0%.
29 M shares/199.9 B yen
40 M shares/249.9 B yen
Shareholder ReturnShare Repurchase (max) : 250.0 billion yen/45 million shares(Repurchase Program to be implemented from November 14, 2017 to March 30, 2018)Share Repurchase (max) : 250.0 billion yen/45 million shares(Repurchase Program to be implemented from November 14, 2017 to March 30, 2018)
For Shareholder Return(Interim)For Shareholder Return(Year-end)For Avoidance of Dilution of common shares
’14/3 ’15/3 ’16/3 ’18/3(Interim period)’17/3
(billions of yen)
* Excluding share repurchase made to avoid dilution of common shares.
1,000
900
800
700
600
500
400
300
200
100

FY2018 Second QuarterFinancial Results
16
FY2018 Second Quarter Financial Performance(FY2018 First Half)
FY2018 Financial Forecasts

17
1,347
1,588
925
2,837
2,274 JapanN. AmericaEuropeAsiaOther
1,370 1,380
1,560 1,550
940 970
2,780 2,790
2,250 2,260
0
2,000
4,000
6,000
8,000
10,000 8,900 8,950 (+50)
(+10)
(+10)
(+30)
(-10)
(+10)
8,971
10,250 10,250 10,251
(’17/4-’18/3) (’17/4-’18/3) (’16/4-’17/3)
FY2018 Forecasts: Consolidated Vehicle Sales(thousands of vehicles)
Total retail vehicle sales in thousands
Previous Forecasts New Forecasts Change FY2017 Results
±0
Central and South America, Oceania, Africa, The Middle East, etc.

18
6.6%
+1 yen110 yen+4 yen124 yen
6.1%6.8%+200.01,750.01,950.0
-6.5%7.0%
+200.02,050.02,250.0
+150.01,850.02,000.0±028,500.028,500.0
Change
+30.0380.0410.0
(’16/4-’17/3)FY2017 Results
108 yen119 yen
1,831.1
7.2%
2,193.8
1,994.327,597.1
362.0
-
New Forecasts(’17/4-’18/3)
111 yen128 yen
FY2018 Forecasts: Consolidated Financial Summary(billions of yen)
Net RevenuesOperating IncomeOperating margin
Equity in earnings of affiliated companies
Net IncomeNet margin
FOREX Rates
US$€
*1 Net Income attributable to Toyota Motor Corporation*2 FOREX Rate assumptions from October 2017 to March 2018: 110 yen against the U.S. dollar and 130 yen against the euro
Previous Forecasts(’17/4-’18/3)
Income before income taxes and equity in earnings of affiliated companies
*1
*2*2
*1
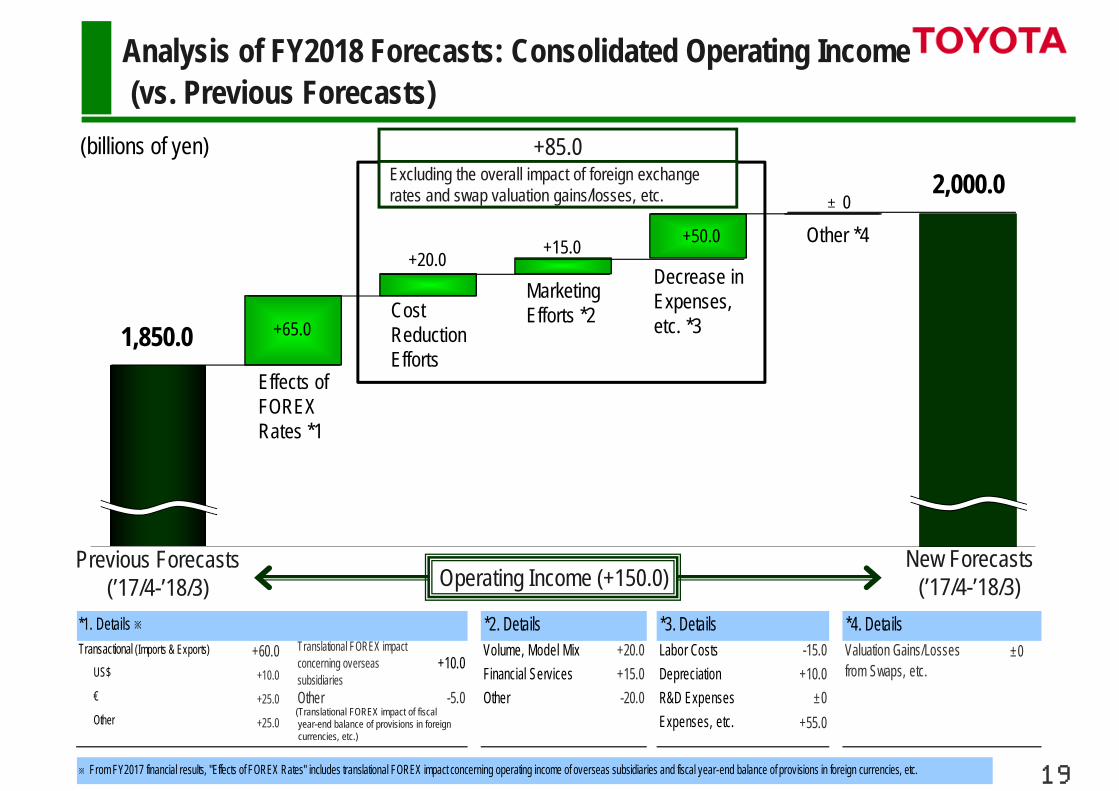
+65.0
+20.0 +15.0 +50.0
±0
1,850.0
2,000.0
Transactional (Imports & Exports) +60.0 Volume, Model Mix +20.0 Labor Costs -15.0 ±0 US$ +10.0 Financial Services +15.0 Depreciation +10.0 € +25.0 Other -5.0 Other -20.0 R&D Expenses ±0 Other +25.0 Expenses, etc. +55.0
※From FY2017 financial results, "Effects of FOREX Rates" includes translational FOREX impact concerning operating income of overseas subsidiaries and fiscal year-end balance of provisions in foreign currencies, etc.
*1. Details ※ *4. Details*3. Details
+10.0
*2. DetailsTranslational FOREX impactconcerning overseassubsidiaries
Valuation Gains/Lossesfrom Swaps, etc.
19
Analysis of FY2018 Forecasts: Consolidated Operating Income(vs. Previous Forecasts)
(billions of yen) +85.0Excluding the overall impact of foreign exchange rates and swap valuation gains/losses, etc.
Effects of FOREX Rates *1
Cost Reduction Efforts
Marketing Efforts *2
Decrease in Expenses, etc. *3
Other *4
Previous Forecasts(’17/4-’18/3)
New Forecasts(’17/4-’18/3)Operating Income (+150.0)
(Translational FOREX impact of fiscal year-end balance of provisions in foreign currencies, etc.)

+175.0
+1,200 △2,100
-95.0+15.71,994.3 2,000.0
Transactional (Imports & Exports) +155.0 Volume, Model Mix -60.0 Labor Costs -60.0 US$ +85.0 Financial Services ±0 Depreciation -45.0 € +55.0 Other ±0 Other -150.0 R&D Expenses -20.0 Other +15.0 Expenses, etc. +30.0
※From FY2017 financial results, "Effects of FOREX Rates" includes translational FOREX impact concerning operating income of overseas subsidiaries and fiscal year-end balance of provisions in foreign currencies, etc.
*1. Details ※ *4. Details*3. Details
+20.0
*2. DetailsTranslational FOREX impactconcerning overseassubsidiaries
Valuation Gains/Lossesfrom Swaps, etc. +15.7
20
Cost Reduction Efforts
Effects of Marketing Activities
Increase in Expenses, etc. Total
+90.0 -245.0 -145.0 -300.0
Analysis of FY2018 Forecasts: Consolidated Operating Income(vs. FY2017 Results)
(billions of yen) -185.0Excluding the overall impact of foreign exchange rates and swap valuation gains/losses, etc.
+120.0 -210.0
+115.0 Improvement<Initial Forecasts>
Effects of FOREX Rates *1
Cost Reduction Efforts
Effects of Marketing Activities *2
Increase in Expenses, etc. *3
Other *4
FY2017 Results New Forecasts(’16/4-’17/3) (’17/4-’18/3)Operating Income (+5.7)
(Translational FOREX impact of fiscal year-end balance of provisions in foreign currencies, etc.)

21
“Offense”Competitiveness
in the Future
- Mazda, Denso and Toyota have decided to establish a new company in order to jointly develop basic structural technologies for EVs.
- Promote projects for commercial use of FC.(studies with Seven-Eleven Japan to promote hydrogen utilization, development of FC bus which will be launched ahead of the 2020 Tokyo Olympic and Paralympic games.)
- Make additional investment to Preferred Networks, Inc.(accelerate joint research and development of AI technologies in the area of mobility)
- Launched all-new “LS” (employ the latest in active safety technologies aiming for the best safety performance in the world).
- Launched a new taxi vehicle “JPN Taxi”.(people-friendly universal design, high environmental performance and a wide lineup of active safety systems)
“Defense”Challengesfor Today
- Promptly address regional needs by using in-house companies system.- Continuous cost reduction efforts in cooperation with suppliers.- Reduce capital expenditures.
WorkInnovation - Launch a new working hour system.
Activities for Enhancement of Competitiveness

22
Toyota Investor SummitOn September 28, the summit was held in Plano, Texas,
*The full presentation video is available on our official website, “Toyota Global Newsroom”.https://newsroom.toyota.co.jp/en/detail/19030556/
at Toyota Motor North America’s new headquarters.

23
Manufacturing
With TNGA (Toyota New Global Architecture), we pursue a fundamental change in vehicle performance and cost effectiveness as well as in design which appeals to people’s heart and head, which is FUN to drive.
- LC500 realized a concept car design in an active production model.
- Launched new Camry which was a car with all new powertrain, platform and electric devices under the TNGA.

24
Next-generation Powertrains(Electrification)
Create a wide portfolio of powertrains and work to make each one “best in class” to cope with various energy mixes and regulations in each country and region.
- With Mazda and Denso, establish a new company which develops basic structuraltechnologies for EVs.
- Advance the practical application of solid-state batteries which directly impacts to the competitiveness of electrification business.
- Launch a number of projects topursue commercial use of fuel cells.
25
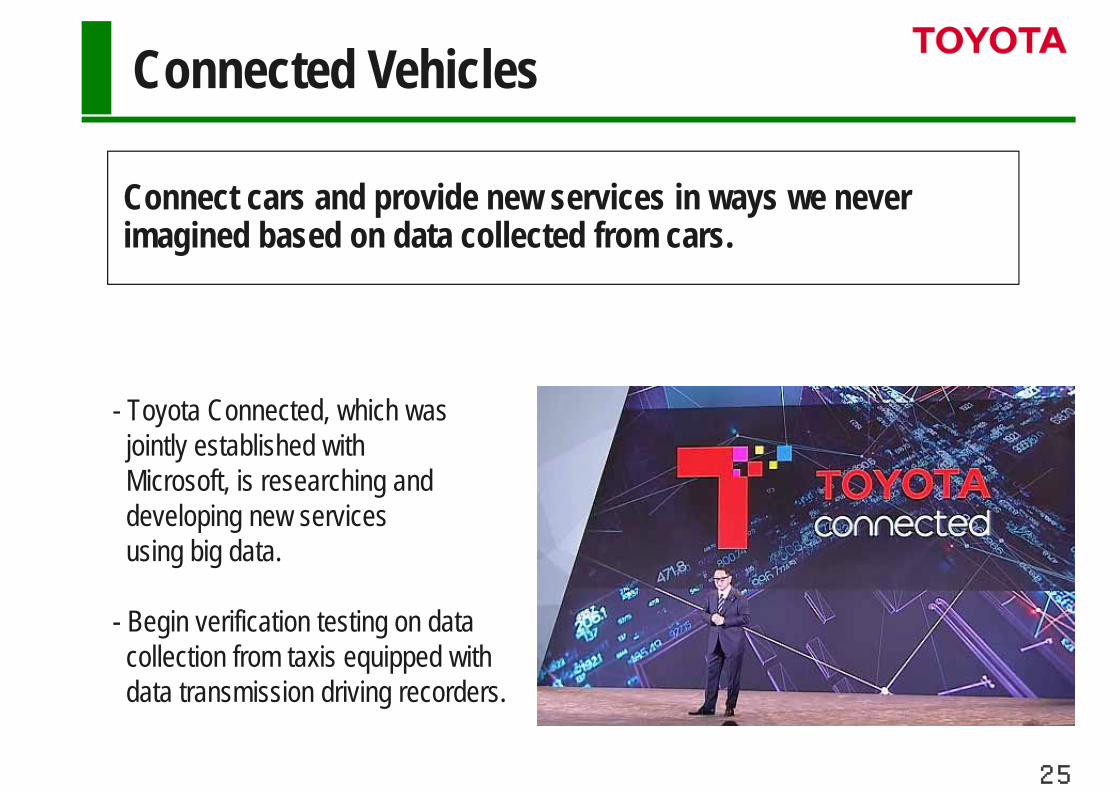
Connected Vehicles
Connect cars and provide new services in ways we never imagined based on data collected from cars.
- Toyota Connected, which was jointly established with Microsoft, is researching and developing new servicesusing big data.
- Begin verification testing on datacollection from taxis equipped withdata transmission driving recorders.

26
Autonomous Driving / Artificial Intelligence (AI)
- TRI*, by using artificial intelligence technologies, plays a key role in- working on a vast amount of research on autonomous cars, robotics - and new battery materials.- Based on the idea that data is the new “resource” and “wealth”, - take advantage of the data volume to enhance performance of our AI.
- Develop reliable AI with higher perception and prediction ability by combining physical testing and simulations.
- Toyota AI Ventures (corporate venture fund) makes early stage startup investments in hope of identifyingnew technologies in autonomous cars and robotics, etc.
*Toyota Research Institute

27
Toyota Investor SummitOn September 28, the summit was held in Plano,Texas, at Toyota Motor North America’s new headquarters.
*The full presentation video is available on our official website, “Toyota Global Newsroom”.https://newsroom.toyota.co.jp/en/detail/19030556/

レビンハイブリッド
FY2018 Second QuarterFinancial Results
Toyota Motor CorporationNovember 7, 2017
CAMRY Hybrid

29
< FY 2018 First Half Financial Performance>- Consolidated vehicle sales were 4 million 389 thousand units. (+ 26 thousand units year on year)- Operating income was 1,096.5 billion yen. (- 20.3 billion yen year on year)- Decreased mainly due to the effects of marketing activities and increase in expenses.- Operating income excluding the overall impact of foreign exchange rates and swap valuation gains and
losses declined 110.0 billion yen year on year.
- Consolidated vehicle sales are expected to be 8.95 million units. (- 21 thousand units year on year)Up 50 thousand units from the previous forecasts.
- Operating income is expected to be 2 trillion yen. (+ 5.7 billion yen year on year)Revised upward by 150.0 billion yen from the previous forecasts.(Changed the FOREX rate assumptions for the fiscal year to 111 yen per US dollar and 128 yen per euro)
- Operating income excluding the overall impact of foreign exchange rates and swap valuation gains and losses is expected to be down 185.0 billion yen year on year, despite an improvement of 115.0 billion yen compared to the initial forecasts.
- Work to further build up profit improvement measures under the challenging business environment affected by rising raw material prices.
(Reference)Summaries of FY2018 Second Quarter Financial Results
< FY 2018 Financial Forecasts>
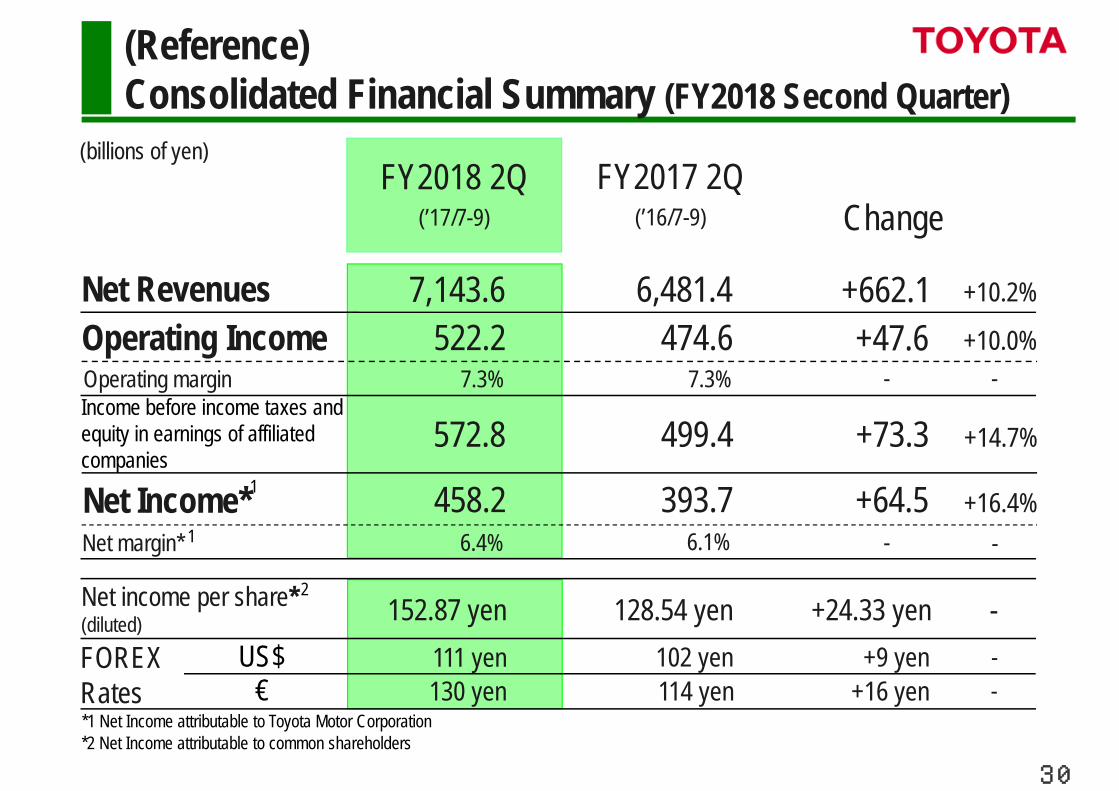
-+24.33 yen128.54 yen152.87 yen+9 yen102 yen111 yen
+16 yen114 yen130 yen
-+16.4%
+14.7%
-
+10.2%
-6.1%6.4%+64.5393.7458.2
-7.3%7.3%
+73.3499.4572.8
+47.6474.6522.2+662.16,481.47,143.6
+10.0%
--
FY2018 2Q(’17/7-9) Change
(billions of yen)
Net RevenuesOperating IncomeOperating marginIncome before income taxes and equity in earnings of affiliated companies
Net Income*Net margin*
Net income per share*(diluted)
FOREX Rates
US$€
*1 Net Income attributable to Toyota Motor Corporation*2 Net Income attributable to common shareholders
FY2017 2Q(’16/7-9)
1
1
2
(Reference)Consolidated Financial Summary (FY2018 Second Quarter)
30

-5.0 -2.4
-130.0
+135.0
+50.0
’16/7-9
522.2
’17/7-9
474.6
Transactional (Imports & Exports) +145.0 Volume, Model Mix -75.0 Labor Costs -10.0 US$ +90.0 Financial Services +10.0 Depreciation -10.0 € +25.0 Other -30.0 Other -65.0 R&D Expenses -5.0 Other +30.0 Expenses, etc. +20.0
※From FY2017 financial results, "Effects of FOREX Rates" includes translational FOREX impact concerning operating income of overseas subsidiaries and fiscal year-end balance of provisions in foreign currencies, etc.
*1. Details ※ *4. Details*3. Details
+20.0
*2. DetailsTranslational FOREX impactconcerning overseassubsidiaries
Valuation Gains/Lossesfrom Swaps, etc. -2.4
31
(Reference)Analysis of Consolidated Operating Income (FY2018 Second Quarter)
(billions of yen) -85.0Excluding the overall impact of foreign exchange rates and swap valuation gains/losses, etc.
Effects of FOREX Rates *1
Cost Reduction Efforts Effects of
Marketing Activities *2
Increase in Expenses, etc. *3
Other *4
Operating Income (+47.6)
(Translational FOREX impact of fiscal year-end balance of provisions in foreign currencies, etc.)

32
11.39.5
23.326.8
62.541.9
0
500
1,000
20.116.8
53.954.5
161.0
97.0
0
500
1,000
1,500
2,000
2,500
’17/4-9 ’16/7-9 ’17/7-9Change Change
China
Japan
Other
’16/4-9
592 624 +32 301 328 +27’16/1-6 ’17/1-6 ’16/4-6 ’17/4-6
97.2168.3
235.0
78.3
(-0.6)
(+3.2)
(+18.8)
(-3.5)
(+63.9)
(+66.6)
(+20.5)
(+1.8)
(Reference)Equity in Earnings of Affiliated Companies
(billions of yen)
FY2018 1H FY2018 2Q
Retail Sales Results in China (thousands of vehicles)
250
150
100
50
200 100
50
0

7,893.4
9,306.7
1,413.3
7,763.0 〔-23.1〕+967.5
+448.8 -484.8-579.6 -221.6
+130.3
33
(Reference)Liquid Assets (Excluding Financial Services)
Net Liquid Assets as of September 30, 2017 : 7,893.4 billion yen(+130.3 billion yen compared to March 31, 2017)
(billions of yen)Free Cash Flow (total) : +931.5
〔Compared to March 31, 2017〕
〔+107.2〕
Net Liquid Assets
Net Liquid Assets
Total LiquidAssets*
As of March 31, 2017(Actual)
As of September 30, 2017
As of September 30, 2017
*Total Liquid Assets consist primarily of cash and cash equivalents, time deposits, marketable securities and security investments (excluding equity securities), excluding in each case those relating to financial services.
(Actual) (Actual)
Net Income
DepreciationExpenses
CAPEXShareholder
Return WorkingCapital, etc.
Interest-Bearing
Debt

34
(Reference) Shareholder ReturnFY2018 FY2017 (Actual)
Interimperiod
Dividends on Common Shares 293.4 billion yen(100 yen per share)
300.3 billion yen(100 yen per share)
Dividends on First Series Model AA Class Shares
3.7 billion yen(79 yen per share)
2.4 billion yen(52.5 yen per share)
Total Amount of Dividends 297.1 billion yen 302.8 billion yen
Share Repurchase 250.0 billion yen (max) 199.9 billion yen
Total Shareholder Return 547.1 billion yen (max) 502.7 billion yen
Net Income 1,071.3 billion yen 946.1 billion yenTotal Return Ratio* 51.0% (max) 53.1%
Full-yearTotal Shareholder Return
Not yet determined1,082.4 billion yen
Total Return Ratio* 59.1%* Total Return Ratio = {(dividends on both common shares and the first series Model AA class shares) + (share repurchase for shareholder return)}÷
(net income attributable to Toyota Motor Corporation)

1,000
1,060.01,004.5
910.5
1,055.6 1,037.5
1,280.01,177.4
1,000.7
1,292.51,211.8
R&D Expenses
885.1
775.9806.2
950.0
FY2014 FY2015 FY2016 FY2017 FY2018 FY2014 FY2015 FY2016 FY2017 FY2018
800
900
700
0
●
1,100
1,200
1,300
893.2
35
(Reference)FY2018 Consolidated Forecasts: R&D, CAPEX, Depreciation
(billions of yen)
Capital Expenditures
Depreciation Expenses
Forecast Forecast
Change from Previous Forecasts:R&D Expenses ±0 billion yen Capital Expenditures -40.0 billion yen Depreciation Expenses -10.0 billion yen

36
5,720
10,250
1,800
9,300
7,720
1,580
8,900
3,180
Previous Forecasts(’17/4-’18/3)
±010,250Total Retail Vehicle Sales(Including Daihatsu- & Hino- brand)
±01,800 Exports
±09,300Total
±07,720Overseas
±01,580Japan
+508,950 Total
+505,770Overseas
±03,180JapanToyota&Lexus
ChangeNew Forecasts(’17/4-’18/3)
(Reference) FY2018 Forecasts: Vehicle Production and Retail Sales
(thousands of vehicles)
Vehicle Production
Retail Vehicle Sales
*
*2
1
2*
*1 Including vehicle production by Toyota’s affiliates outside consolidation*2 Including vehicle sales by Toyota’s affiliates outside consolidation

37
(Reference)Definitions of Consolidated and Retail Vehicle Sales
Daihatsu- and Hino- brand vehicles
Toyota- and Lexus- brand vehicles
Number of vehicles produced for wholesale by Toyota Motor Corporation and its consolidated subsidiaries
Number of vehicles produced for wholesale by Toyota’s affiliates outside consolidation (e.g. JV affiliates in China, etc)
Distributors or Dealers outside consolidation
Customers
Total Retail Vehicle Sales
Toyota and Lexus Vehicle Sales
*There are a limited number of exceptional cases where sales are made other than in accordance with the flowchart above.
P36
P5, P17, P36(in bottom part)
P5,P17
Consolidated Vehicle Sales